Embed Size (px)
Citation preview

Mapping Isolation and Loneliness Amongst Older People in BelfastReport Commissioned by the Belfast Strategic Partnership
Ferguson, S., & Ellis, G. (2016). Mapping Isolation and Loneliness Amongst Older People in Belfast ReportCommissioned by the Belfast Strategic Partnership.
Document Version:Publisher's PDF, also known as Version of record
Queen's University Belfast - Research Portal:Link to publication record in Queen's University Belfast Research Portal
General rightsCopyright for the publications made accessible via the Queen's University Belfast Research Portal is retained by the author(s) and / or othercopyright owners and it is a condition of accessing these publications that users recognise and abide by the legal requirements associatedwith these rights.
Take down policyThe Research Portal is Queen's institutional repository that provides access to Queen's research output. Every effort has been made toensure that content in the Research Portal does not infringe any person's rights, or applicable UK laws. If you discover content in theResearch Portal that you believe breaches copyright or violates any law, please contact [email protected].
Download date:18. Dec. 2021

1
Mapping Isolation and Loneliness Amongst Older People in Belfast

2
Contacts: Elma Greer Healthy Ageing Co-ordinator Belfast Health Development Unit 5th Floor, 9 Lanyon Place Belfast BT1 3LP Tel 028 9050 2073 [email protected] Sara Ferguson Geraint Ellis School of Natural and Built Environment Queen’s University Belfast David Keir Building Stranmillis Rd Belfast BT9 5AG Tel: 028 9097 4370 [email protected] [email protected]
November 2016

3
Contents
Foreword .................................................................................................................................................. 4
Executive Summary .................................................................................................................................. 6
Introduction ............................................................................................................................................. 8
1. Risk-factors linked to Social Isolation and Loneliness ................................................................. 8
2. Generating Isolation Indices ........................................................................................................ 9
3. SOA-level Isolation Index Results (Acorn Data) ........................................................................... 9
4. Household-Level Isolation and Loneliness Index Results (Acorn Data) ..................................... 13
5. Social Isolation and Loneliness Profiles ..................................................................................... 18
6. SOA-level Index of Additional Risk Factors of Isolation and Loneliness .................................... 24
Conclusion .............................................................................................................................................. 27
Appendix: Supplementary Maps ........................................................................................................... 29

4
Foreword
Belfast Strategic Partnership (BSP) and the Healthy Ageing Strategic Partnership (HASP) are committed to supporting a wide range of organisations that can effectively make a contribution to delivering on the key priorities of reducing health inequalities and promoting the long term health and social well-being of the population. The central priority of the Belfast Strategic Partnership is to strengthen the emotional wellbeing and
resilience of individuals and communities in Belfast. We achieve this by jointly harnessing the
enthusiasm, efficiency and experience of our stakeholders to seek health and wellbeing gains in ways
we cannot do by working alone.
Emotional Resilience refers to an individual’s ability to adapt to stressful situations or crises that may
have occurred in the past, present or into the future. The ability of some of our citizens to deal with
stressful situations or crises is more challenging and compounded by the impact of loneliness and
isolation.
The collaboration of organisations and agencies as demonstrated in this document provides the
opportunity to identify localities of need and also provides a platform to continue to address the
issues associated with isolation and loneliness in older people across our city.
In 2012 Belfast started the process of working towards becoming an age-friendly city, led by BSP and HASP. Through consultation with over 700 older people, and several workshops with key stakeholders the following vision and themes have been identified: ‘Belfast will be an age-friendly city where older people live life to the full’
Age-friendly Image – creating a positive view of ageing
Age-friendly Lives - reducing inequalities and isolation
Age-friendly Neighbourhoods - creating friendly places to live in The Age-friendly Belfast Plan 2014-2017 found that older people in Belfast are a diverse group involved in a wide range of activities including; seeking employment, caring for family members, volunteering, taking part in lifelong learning, getting married, participating in local groups and taking part in a range of leisure programmes1. However, the plan also acknowledged the need to give priority to the inclusion of isolated older people and stated that if the levels of loneliness and isolation are similar to studies in England then approximately 10,000 older people could be feeling lonely or isolated in Belfast. The terms loneliness and isolation are often used together. While social isolation is an objective state – defined in terms of the quantity of social relationships and contacts – loneliness is a subjective experience. Loneliness is a negative emotion associated with a perceived gap between the quality
1 Belfast Strategic Partnership (2014) Age-friendly Belfast-a city where older people live life to the full. summary plan 2014-2017

5
and quantity of relationships that we have and those we want.2 This means that people can be isolated without feeling lonely and they can also feel lonely without being isolated. However, there is a strong correlation between the two concepts. Evidence reviews and policy frameworks often combine findings and recommendations on both terms.3 Implications for the mental and physical health of older people include the following:
The effect of loneliness and isolation can be as harmful to health as smoking 15 cigarettes a day, and is more damaging than obesity
Lonely individuals are at higher risk of the onset of disability
There is an increased risk of the development of cardiovascular disease, cognitive decline and depression
There is an increased risk of malnutrition. Valtorta and Hanratty (2012) conclude that a drive to address loneliness and isolation could prove to be one of the most cost effective strategies that a health system could adopt and a counter to rising costs of caring for an ageing population.4 Several reviews have looked at services/approaches that are effective in alleviating isolation and loneliness. ‘Promising Approaches to Reducing Isolation and Loneliness in Later Life’ (Campaign to End Loneliness and Age UK, 2015) emphasized a complex picture, with no ‘one size fits all’ solution and proposed a model, which we have adopted in Belfast to tackle this important issue with older people. A key element of this model is to reach older people by using data to target actions, for example the creation of loneliness maps. Gloucestershire and Essex local authorities worked with the University of Kent to develop maps, which identified geographical areas where pockets of older people are at risk of loneliness and then targeted resources to those areas. This report is an initial attempt to map loneliness and isolation amongst older people in Belfast and we are indebted to Sara Ferguson and Professor Geraint Ellis from the School of Natural and Built Environment, Queen’s University Belfast for their professionalism and analytical work in developing this important report.
2 Perlman, D, Peplau L. (1981) Toward a Social Psychology of Loneliness. Personal Relationships 3: Personal Relationships
in Disorder, Pp. 31–43. 3 Age UK and the Campaign to End Loneliness (2015) Promising approaches to reducing isolation and loneliness in later life 4 Valtorta, N and Hanratty, B (2012) Loneliness, isolation and health of older adults; do we need a new research agenda? Journal of the Royal Society of Medicine, December 2012 vol 105,no12 518-522

6
Executive Summary
Belfast, like many other cities, has an ageing population with almost one fifth (19%) of its population
aged 60 or above. As part of the World Health Organisation’s (WHO) Global Network of Age-Friendly
Cities, Belfast is committed to addressing the needs of its older citizens. Belfast’s Healthy Ageing
Strategic Partnership (HASP) has acknowledged that older people are particularly at risk of becoming
socially isolated and lonely, which has substantial implications for their health, well-being and ability
to access a wide range of services. However, it can be very difficult to identify and engage with this
group of people. This report attempts to identify individual-level and area-level characteristics which
increase vulnerability to social isolation and loneliness; and spatially locate areas across Belfast
where the risk of older people becoming lonely and isolated maybe particularly concentrated.
In order to do this a series of isolation indices have been developed for Belfast, using data derived
from the CACI Acorn Customer Segmentation Dataset. These indices have been mapped in order to:
Identify neighbourhoods where social isolation may be particularly problematic;
Highlight that while social isolation is a city-wide problem, ‘pockets of isolation’ exist
throughout the city; and
Provide a detailed picture of additional risk factors which may contribute to social isolation
and loneliness.
Previous work has suggested that an individual’s vulnerability to social isolation and loneliness may
be associated with the following socio-demographic characteristics:
Being aged 75 or older;
Living in single person households;
Being poorly educated;
Having a low household annual income;
Not having access to a car; and
Living in areas of higher social deprivation.
When these factors were compiled into an isolation index and mapped for Belfast, it appears that
older adults living within some of the most socially deprived neighbourhoods in inner city Belfast are
at the greatest risk of becoming socially isolated.
However, social isolation and loneliness are not just found in deprived, inner city neighbourhoods. As
shown in the map overleaf there are vulnerable households located across the city, including those
areas that have higher average household incomes and car-ownership levels.

7
This report also explores the additional risk factors which heighten an individual’s vulnerability by
developing detailed ‘profiles’ of older adults with higher isolation index scores. This identifies: poor
health status; limited participation in social and leisure activities; and disengagement with digital
technology, as particularly contributing to social isolation and loneliness. The report presents a
secondary isolation index which accounts for some of these additional risk factors. When spatially
mapped, it further confirms that social isolation is a complex city-wide phenomenon, with risk-
factors that do not simply follow obvious demographic and socio-economic profiles.
This analysis of the distribution and contributing factors to social isolation and loneliness can be used
to:
Develop targeted neighbourhood initiatives to enhance levels of social inclusion and
participation within communities; and
Devise city-wide initiatives which will facilitate all older adults at risk of social isolation and
loneliness to become more integrated within society.

8
Introduction This report and accompanying maps have been produced for the Belfast Strategic Partnership as part
of its Healthy Ageing/ Age-friendly Belfast cross-cutting theme. It is a first attempt to identify those
individuals and spatial communities in Belfast who may be considered to be at high-risk of becoming
either socially isolated or lonely. The report adopts a methodological approach followed by a number
of County Councils across England5. This has included the development and spatial mapping of
isolation indices, which serve to identify both people and places which appear to be becoming
increasingly vulnerable to isolation and loneliness.
These indices have been derived from the CACI Acorn Customer Segmentation Tool and associated
dataset and then integrated into Geographical Information Systems (GIS) to facilitate a spatial analysis
across the city. Acorn has been defined as ‘a powerful targeting tool that combines geography with
demographics and lifestyle information, and the places where people live with their underlying
characteristics and behaviour, to create a tool for understanding the different types of people in
different areas throughout the country’ (CACI 2015: 3). It is anticipated that the identification of
specific household groups, profiles and clusters that can be considered as vulnerable to isolation and
loneliness can be used to further target initiatives to help overcome social isolation.
1. Risk-factors linked to Social Isolation and Loneliness
Numerous individual and/or community characteristics have been associated with vulnerability to
social isolation and loneliness. Although these are predominantly of a socio-demographic nature,
there are also a wide range of other factors that may increase the risk of isolation and loneliness, which
can be very difficult to identify and understand the causal links. This is particularly challenging when
attempting to identify individual households or wider areas where risk-factors may have a cumulative
or compounding effect, and therefore further amplify vulnerabilities.
Following the methodology followed by Gloucester County Council1, a number of potentially
important risk-factor variables were identified and cumulative indices developed from these to
provide an estimation of ‘risk of social isolation’. Risk factors included within the analysis presented
this report are shown in Table 1: Core Variables and Additional Risk Factors to Isolation and Loneliness
Table 1: Core Variables and Additional Risk Factors to Isolation and Loneliness
Core Variables (Acorn Segmentation Index) Variables Indicative of Increased Risk
Head of household aged between 65-74 in socially deprived areas
Mental health illness (long term emotional, psychological or mental health condition)
Head of household aged 75+ in any area Sensory impairment (sight/hearing)
Single person households (single/widowed/divorced)
Physical mobility restrictions (requires assistance with bin collection)
Low levels of education (no formal qualifications) Having caring responsibilities when aged 65+
No access to motorised transport
Low household annual income (£0-£20,000)
5 For example, Gloucestershire: http://www.cotswold.gov.uk/media/777436/Appendix-1-Social-Isolation-in-Gloucestershire.PDF

9
2. Generating Isolation Indices The CACI Acorn knowledge tool contains individual index values for each of the core variables identified in Table 1, which were extracted and aggregated to produce households and area-level isolation indices. Household indices represent the vulnerability of postcode areas (composed of around 15 households per postcode). Area-level indices represent the vulnerability of a Super Output Area (SOA) in Northern Ireland. SOAs contain approximately 2000 individuals, on average having about 400 who are aged ≥60. As noted above, the methodology to produce the indices is the same as that used by Gloucestershire County Council1. This methodology suggests that variables can be weighted when devising both household and area-level indices. Variable weightings were applied when generating the household-level isolation index, assigned according to the index value presented for each variable within the Acorn knowledge tool. The final index then produces a household cumulative ‘risk-rating’ of becoming socially isolated or lonely (see footnote 1). As CACI Acorn data was not available for the additional variables indicative of risk of isolation and loneliness (column 2, table 1), it was not considered appropriate to incorporate these variables within the indices generated. In order to explore how these additional risk-factors impact upon the degree of isolation and loneliness evident within geographical areas, SOA-level data was acquired and a simple average aggregate index6 developed and mapped.
3. SOA-level Isolation Index Results (Acorn Data)
The isolation indices aggregated to the SOA-level using postcode level data, were divided into deciles and spatially mapped using GIS techniques. This facilitated the identification of particular areas within Belfast which may be particularly vulnerable to isolation and loneliness. SOAs most vulnerable to social isolation are depicted by the darker shades of red; whereas SOAs with low levels of vulnerability are highlighted by the paler shades of red (Figure 1). Figure 2 indicates that SOAs most vulnerable to social isolation (top 25%) are predominantly clustered across inner city Belfast (see table 2 for SOAs ranked in order of ascending vulnerability). However, there also appears to be clusters extending both North-Eastwards and westwards; in addition to another cluster located in the South West of the City. This indicates that isolation and loneliness are not solely an inner city phenomenon. Nevertheless, the map does indicate that outer city SOAs, particularly those across South and East Belfast are less likely to be affected by issues associated with isolation and loneliness. This is further highlighted in the Appendix (see Figures 14-17), showing the distribution of the isolation index according to local Assembly Areas.
6 The simple aggregate index was developed by ranking each additional variable into deciles, with a score of 1 being assigned to the least vulnerable SOA, and a score of 10 assigned to the most vulnerable SOA. The final additional-risk factor index score for each SOA was determined by totalling the scores assigned for each additional risk factor variable.

10
Table 2: Belfast Super Output Areas with Greatest Vulnerability to Isolation and Loneliness (Isolation Index)
SOAs in Belfast Most Vulnerable to Social Isolation or Loneliness
SOA Isolation Index
New Lodge 2 137.040
Crumlin 1 135.651
Shankill 2 131.055
New Lodge 1 130.639
Woodvale 3 129.786
Crumlin 2 128.628
Shankill 1 128.408
Ballymacarrett 3 126.046
The Mount 1 124.432
Ardoyne 3 123.900
Falls 3 123.823
Shaftesbury 3 120.262
Whiterock 2 119.334
Water Works 2 119.194
New Lodge 3 119.126
Duncairn 1 118.366
Falls 1 117.833
Ballymacarrett 2 117.403
Water Works 1 117.220
Highfield 3 116.232
Upper Springfield 3 116.222
Clonard 1 115.686
Falls 2 115.394
Clonard 2 114.189
Ardoyne 2 114.065
Glencolin 4 114.023
Ballymacarrett 1 112.521
Whiterock 3 111.498
Ardoyne 1 111.110
Island 1 109.957
Shaftesbury 2 109.211
Castleview 1 107.847
Sydenham 1 107.132
Bloomfield 1 105.255
Upper Springfield 104.534
Blackstaff 2 103.945
Incr
easi
ng
risk
of
iso
lati
on
or
lon
elin
ess

11
Figure 1: Map Showing Vulnerability of Belfast SOA's to Isolation and Loneliness

12
Figure 2: Map Showing Belfast SOAs with Greatest Vulnerability to Isolation and Loneliness based on Aggregate Isolation Index

13
4. Household-Level Isolation and Loneliness Index Results (Acorn
Data) Similar to the SOA-level index, the household-level index of isolation and loneliness, aggregated to postcode level was divided into deciles and ranked accordingly, with 1 representing the least vulnerable households, and 10 representing those most vulnerable to isolation and loneliness. Postcodes were subsequently spatially mapped in GIS according to this household-level isolation index. To avoid inundating the base-map of Belfast, only households considered to be most vulnerable to isolation and loneliness were mapped. This equated to postcodes with an index value within the top 25%). Households with the greatest vulnerability (n = 1663) were those with an isolation index of ≥34. This equated to 33.6% of the total number of households sampled (n=4947) (see Figure 3).
Figure 4 highlights the spatial distribution of the most vulnerable households in Belfast, notwithstanding age. The results are spatially similar to figure 2, with vulnerable households being predominantly located within clusters across or close to inner-city Belfast. Interestingly however, this map also highlights evidence of multiple smaller clusters of vulnerability elsewhere across the City; including within areas previously identified in figure 1 as having relatively low vulnerability to social isolation, including parts of East and South Belfast. This is further highlighted in figure 5, which displays the spatial location of all vulnerable households in relation to the area-level isolation index. This highlights the importance of investigating the issue of isolation and loneliness at various spatial scales. Considering that only approximately 15% of Belfast’s population are aged 65 or older (n=59,303), this large sample (n=1663) indicates that there are other ‘vulnerable’ facets within the population asides from older adults whom are the primary focus of this current report. To account for this possibility, it was decided to isolate households distinguishable by their older age demographic, according to the Acorn Classification. This resulted in a total of 474 households, or 9.6% of the total sample. The spatial distribution of all older households, including those most vulnerable to isolation and loneliness (n=132) is highlighted in Figure 6.
0
100
200
300
400
500
600
700
800
900
12
14
16
18
20
21
.67
22
23
.33
24
25
26
26
.67
28
28
.33
30
31
.67
32
33
.33
34
35
36
38
38
.33
40
41
.67
43
.33
44
46
50
Nu
mb
er
of
Ho
use
ho
lds
Isolation Index
Figure 3: Bar Chart Showing Number of Sampled Households Vulnerable to Isolation and Loneliness

14
When addressing the issue of isolation and loneliness specifically within the older demographic population, it is evident from Figure 6 that the phenomenon becomes much less widespread. Nevertheless, this map suggests that whilst a large majority of older adults reside in the outer ring of the city, it is those whom reside within the city centre who remain at greatest risk of becoming socially isolated or lonely. This is an important point in that it is often assumed that individuals living in the inner city are more likely to have better access to a range of services and with higher population densities, have more opportunities for social interaction, compared to those living further from the city centre. This issue is further explored in the next section.

15
Figure 4: Map showing Belfast Households most vulnerable to Isolation and Loneliness

16
Figure 5: Households and SOA Vulnerability to Isolation and Loneliness

17
Figure 6: Map Showing Spatial Location of Older Households Vulnerable to Isolation and Loneliness

18
5. Social Isolation and Loneliness Profiles An additional advantage of the CACI Acorn Customer Segmentation Tool is its ability to profile multiple characteristics of the households identified as being most vulnerable to isolation and loneliness. The Acorn classifications of vulnerable households identified within this analysis are presented in Figure 7; and their associated spatial locations are highlighted in Figure 8 (see Appendix, Figures 26-29 _ for more detailed mapping at Assembly Area Level). Figures 7-8 also confirm the earlier suggestion that there are other factors other than age that influence vulnerability to isolation and loneliness. Similar to the analysis undertaken by Gloucestershire County Council, the individual profiles suggest a correlation between isolation and; (i) age, (ii) housing occupancy and tenure; and (iii) level of income. Increased age, living in single occupancy social housing, and having lower levels of income are all common characteristics which appear to be associated with more isolated and lonely individuals.
Although these are important findings, the focus of this report is on older adults. On this basis, the spatial location and characterisation of more vulnerable older households are specifically addressed in Figures 9-11 and Table 3. These show that older adults from lower income backgrounds and living in social housing across the city, and more specifically purpose-built accommodation in the eastern and southern parts of the city, are the most vulnerable to isolation and loneliness. The Acorn dataset provides supplementary information to provide further insights into other potential factors which may be causing these older individuals to become socially isolated (see Table 3). This suggests that poorer health, digital isolation and lower participation in non-home based leisure activities result in higher risks of isolation and loneliness. From an analysis of these profiles, it is suggested that there are additional risk factors beyond demographics and socio-economic attributes which result in isolation and loneliness.
0 100 200 300 400 500 600
Singles and young families, some receiving…
Young people in small, low cost terraces
Poorer families, many children, terraced housing
Post-war estates, limited means
Pensioners and singles in social rented flats
Young families in low cost private flats
Upmarket downsizers
Elderly people in social rented flats
Low income large families in social rented semis
Older people, neat and tidy neighbourhoods
Deprived areas and high-rise flats
Low income older people in smaller semis
Pensioners in social housing, semis and terraces
Social rented flats, families and single parents
Elderly singles in purpose-built accommodation
Number of Households
Aco
rn C
lass
ific
atio
n D
esc
rip
tio
n
Figure 7: Bar Chart Showing Distribution of Acorn Groups Vulnerable to Isolation and Loneliness

19
Figure 8: Map Showing Spatial Location of Acorn Groups Vulnerable to Isolation and Loneliness

20
0 50 100 150 200 250
Settled suburbia, older people
Established suburbs, older families
Pensioners and singles in social rented flats
Elderly people in social rented flats
Older people, neat and tidy neighbourhoods
Low income older people in smaller semis
Pensioners in social housing, semis and terraces
Elderly singles in purpose-built accommodation
Retired and empty nesters
Number of Households
Aco
rn C
lass
ific
atio
n D
esc
rip
tio
n
0 10 20 30 40 50 60
Elderly people in social rented flats
Elderly singles in purpose-built accommodation
Pensioners and singles in social rented flats
Pensioners in social housing, semis and terraces
Number of Households
Aco
rn C
lass
ific
atio
n D
esc
rip
tio
nFigure 9: Bar Chart showing Distribution of Older Household Acorn Profile Groups
Figure 10: Bar Chart showing Distribution of Older Acorn Groups Most Vulnerable to Isolation and Loneliness

21
Figure 11: Map Showing Spatial Location of Most Vulnerable Older Acorn Groups

22
Table 3: Acorn Consumer Classifications of Older People living in Belfast
Acorn Category
Acorn Group Acorn Profile Individual Characteristics
Financially
Stretched
Poorer
Pensioners
Elderly people in
social rented flats
Social rented accommodation lived in by pensioners; housing areas characterised by
design features/services to meet the needs of older generations (retirement
developments); high proportion of single households (single/widowed/divorced); high
levels of disability living allowance claimants; low levels of education; digitally isolated.
Financially
Stretched
Poorer
Pensioners
Low income older
people in smaller
semis
Mix of housing tenures; older population; low-skilled occupations and lower incomes;
state pension reliance; lower levels of community cohesion and greater fear of
community crime; higher incidences of health problem, particularly long-term illnesses.
Financially
Stretched
Poorer
Pensioners
Pensioners and
singles in social
rented flats
Older population, predominantly pensioners; single person households
(single/widowed/divorced); purpose built flats and terraces; social renting and some
ownership; low income; state pension dependent; low-skilled employment; no leisure
activity participation; high levels of sedentary behaviour; digitally isolated; poorer
health.
Financially
Stretched
Poorer
Pensioners
Pensioners in
social housing,
semis and
terraces
Social rented accommodation for pensioners; housing areas characterised by design
features/services to meet the needs of older generation (retirement developments);
Many residents are single/widowed/divorced and have no educational qualifications;
they are reliant upon state pensions and have low/no incomes. They are also digitally
isolated; in poorer health and have a greater proportion of the population with sensory
impairments
Comfortable
Communities
Comfortable
Seniors
Elderly singles in
purpose-built
accommodation
Older population (large number 75+); retirees; owners of purpose built flats restricted
to older residents; widowed or single person household; savings and investments;
financially stable with few outgoings; sedentary leisure activities, but not necessarily
home-based; health problems and sensory impediments.

23
Comfortable
Communities
Comfortable
Seniors
Older people,
neat and tidy
neighbourhoods
Settled, established neighbourhoods; semi-detached and bungalows; older population
and high proportion of retirees; skilled/semi-skilled employment; average income;
savings and investments; higher spending power; home-based leisure activities; digital
isolation.
Comfortable
Communities
Steady
Neighbourhoods
Established
Suburbs, Older
Families
Suburban empty nester couples or larger older families living in large semi-detached
housing at lower than average prices (for the area). Slightly above average incomes,
with pension provisions in place and some savings, but working in mid-management,
clerical or admin jobs. Secondary school qualified. More socially active and
technologically advanced.
Affluent
Achievers Mature Money
Settled Suburbia,
Older People
Home-owning pensioners or those near-retirement living in predominantly semi-
detached houses. Residents have a high level of education and work(ed) in professional
or managerial occupations. Higher than average incomes, savings, and in a satisfactory
or comfortable financial position. In satisfactory or good health, with healthy diets and
lifestyles.

24
6. SOA-level Index of Additional Risk Factors of Isolation and
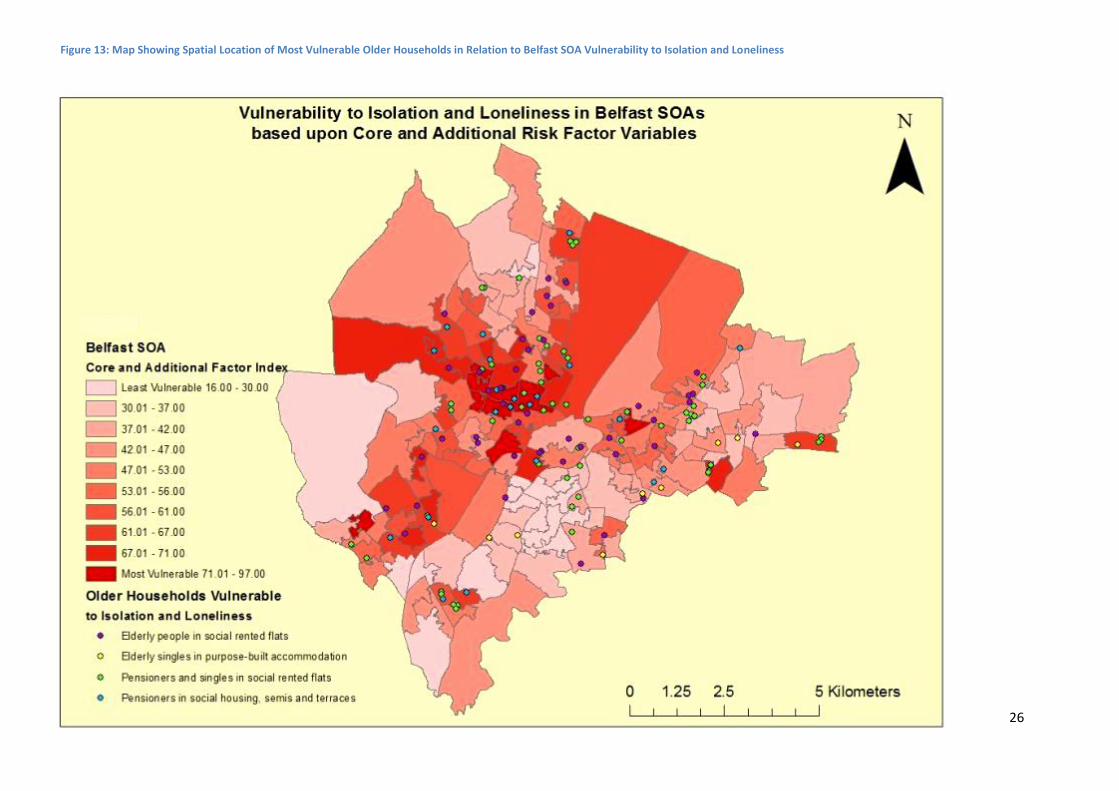
Loneliness The previous analysis helps in identifying both area-level clusters, and household-level pockets of vulnerability to isolation and loneliness. However, these indices are limited by their reliance upon socio-demographic and socio-economic based variables. As highlighted by the Acorn profile summaries, social isolation and loneliness may be caused by additional factors, such as health status, participation in social and leisure activities, and engagement with digital technology. These additional variables were subject to further analysis of the factors that may influence risk of social isolation and loneliness. These risk factors, in addition to the core variables (sourced from Census 2011 data) were integrated into a third SOA-level additional-risk factor isolation index. SOA-level data was acquired from the Northern Ireland Statistics Research Agency (NISRA) and Belfast City Council. Values for each variable were divided into deciles, in order to assign each SOA a risk rating index of between one and ten (in ascending order of isolation and loneliness vulnerability). To obtain a final additional-risk factor isolation index value, all scores were summed to provide a cumulative index. Ten variables were included within the index (see Table 4), resulting in a maximum index score of 100. Figures 12-13 depict the spatial location of areas vulnerable to social isolation based upon this final cumulative index. Figures 18-21 in the Appendix shows this information according to local Assembly Areas, whereas maps depicting the spatial distribution of each of the additional risk factors are presented in figures 22-25 in the appendix. Table 4: Variables included within Additional Risk Factor Isolation Index
Selected Variables (Core Groups and Additional Risk Factors)
Percentage of SOA population aged 65-74 in socially deprived areas
Percentage of SOA population aged 75+ in any area
Percentage of SOA population living in One Person Households
SOA Income Deprivation Rank
Percentage of SOA population with no formal qualifications
Percentage of SOA population with no access to motorised transport
Percentage of SOA population with a sensory impediment (sight/hearing)
Percentage of SOA population with long-term mental health condition
Percentage of SOA population whom are carers and aged 65+
Number of households in SOA requiring assistance with bin collection
As highlighted by Figures 12-13 and Table 5, isolation and loneliness are clearly not a predominantly inner-city phenomena related only to the demographic and socio-economic profile of neighbourhoods and households. Evidently, these problems are both complex and city-wide, and need to be addressed accordingly.

25
Figure 12: Map Showing Vulnerability of Belfast SOAs to Isolation and Loneliness Based Upon Additional Risk Factor Index
26
Map 9
Figure 13: Map Showing Spatial Location of Most Vulnerable Older Households in Relation to Belfast SOA Vulnerability to Isolation and Loneliness

27
Table 5: Belfast Super Output Areas with Greatest Vulnerability to Isolation and Loneliness (Additional Risk Factor Isolation Index)
Conclusion
Although this is a brief exploratory analysis into social isolation and loneliness in Belfast, the findings
successfully identify particular household characteristics which may increase vulnerability to isolation and
loneliness; in addition to specific areas where the problem may occur on a wider scale. Moreover, the
variations in vulnerability highlighted by the final analysis (introducing additional risk-factor variables)
suggests that it may prove beneficial to conduct further research through carrying out a household-level
‘loneliness’ survey across the City. This would enable a broader range of risk-factor variables to be
incorporated into individual-level isolation indices; and therefore introduce the potential of identifying
further pockets of increased vulnerability which have not been identified to date. Given that isolation and
loneliness can have negative implications upon both physical and mental health, the introduction of
measures to integrate these higher risk individuals and areas into their local communities is of vital
importance.
Belfast SOA Core and Additional Risk
Index Belfast SOA
Core and Additional Risk Index
Crumlin 1 97
Shaftesbury 3 Glencairn 1
Upper Springfield 3 Knock 1
70 70 69 69
Shankill 2 Woodvale 3
93 92
Water Works 2 Falls Park 2 Ardoyne 2
68 68 68
Woodvale 2 Shankill 1
New Lodge 2
79 79 79
Upper Malone 2 Legoniel 2 Duncairn 2
Castleview 3 Ardoyne 1
Andersonstown 1
67 67 67 67 67 67
Falls 1
77
Cherryvalley 3 Andersonstown 3
66 66
Woodvale 1 76
Ballymacarrett 3
74
New Lodge 3 Glen Road 1 Duncairn 1 Ardoyne 3
63 63 63 63
Glencolin 4 73
Legoniel 3 Highfield 3
Falls 2
62 62 62
New Lodge 1 71 Musgrave 1 Fortwilliam 1
Ballymacarrett 2
61 61 61
Glencairn 2 71 Crumlin 2 71
Andersonstown 2 71

28
List of Tables Table 1: Core Variables and Additional Risk Factors to Isolation and Loneliness ............................................................. 8
Table 2: Belfast Super Output Areas with Greatest Vulnerability to Isolation and Loneliness (Isolation Index) .......... 10
Table 3: Acorn Consumer Classifications of Older People living in Belfast ..................................................................... 22
Table 4: Variables included within Additional Risk Factor Isolation Index ..................................................................... 24
Table 5: Belfast Super Output Areas with Greatest Vulnerability to Isolation and Loneliness (Additional Risk Factor
Isolation Index)................................................................................................................................................................ 27
List of Figures
Figure 1: Map Showing Vulnerability of Belfast SOA's to Isolation and Loneliness ........................................................ 11
Figure 2: Map Showing Belfast SOAs with Greatest Vulnerability to Isolation and Loneliness based on Aggregate
Isolation Index ................................................................................................................................................................. 12
Figure 3: Bar Chart Showing Number of Sampled Households Vulnerable to Isolation and Loneliness ........................ 13
Figure 4: Map showing Belfast Households most vulnerable to Isolation and Loneliness ............................................. 15
Figure 5: Households and SOA Vulnerability to Isolation and Loneliness ...................................................................... 16
Figure 6: Map Showing Spatial Location of Older Households Vulnerable to Isolation and Loneliness ........................ 17
Figure 7: Bar Chart Showing Distribution of Acorn Groups Vulnerable to Isolation and Loneliness .............................. 18
Figure 8: Map Showing Spatial Location of Acorn Groups Vulnerable to Isolation and Loneliness ............................... 19
Figure 9: Bar Chart showing Distribution of Older Household Acorn Profile Groups ..................................................... 20
Figure 10: Bar Chart showing Distribution of Older Acorn Groups Most Vulnerable to Isolation and Loneliness ......... 20
Figure 11: Map Showing Spatial Location of Most Vulnerable Older Acorn Groups ...................................................... 21
Figure 12: Map Showing Vulnerability of Belfast SOAs to Isolation and Loneliness Based Upon Additional Risk Factor
Index ................................................................................................................................................................................ 25
Figure 13: Map Showing Spatial Location of Most Vulnerable Older Households in Relation to Belfast SOA
Vulnerability to Isolation and Loneliness ........................................................................................................................ 26
Figure 14: Map Showing Vulnerability of East Belfast SOAs to Isolation and Loneliness (Aggregate Isolation Index) .. 30
Figure 15: Map Showing Vulnerability of North Belfast SOAs to Isolation and Loneliness (Aggregate Isolation Index) 30
Figure 16: Map showing vulnerability of West Belfast SOAs to Isolation and Loneliness (Aggregate Isolation Index) . 32
Figure 17: Map Showing Vulnerability of West Belfast SOAs to Isolation and Loneliness (Additional Risk Index) ........ 30
Figure 18: Map Showing Vulnerability of East Belfast SOAs to Isolation and Loneliness (Additional Risk Index) .......... 30
Figure 19: Map Showing Vulnerability of West Belfast SOAs to Isolation and Loneliness (Additional Risk Index) ........ 30
Figure 20: Map Showing Vulnerability of North Belfast SOAs to Isolation and Loneliness (Additional Risk Index) ....... 30
Figure 21: Map Showing Vulnerability of South Belfast SOAs to Isolation and Loneliness (Additional Risk Index) ....... 30
Figure 22: Map Showing Belfast SOA Vulnerability to Isolation and Loneliness Based Upon Sensory Impairments ..... 30
Figure 23: Map Showing Belfast SOA Vulnerability to Isolation and Loneliness Based Upon Long-term Mental Health
........................................................................................................................................................................................ 30
Figure 24: Map Showing Belfast SOA vulnerability to Isolation and Loneliness Based Upon Requirement for Bin
Collection Assistance....................................................................................................................................................... 30
Figure 25: Map Showing Belfast SOA Vulnerability to Isolation and Loneliness Based Upon Caring Responsibilities
aged 65+ .......................................................................................................................................................................... 30
Figure 26: Characterisation of Households Vulnerable to Isolation and Loneliness in North Belfast ............................ 30
Figure 27: Characterisation of Households Vulnerable to Isolation and Loneliness in South Belfast ............................ 30
Figure 28: Characterisation of Households Vulnerable to Isolation and Loneliness in East Belfast ............................... 30
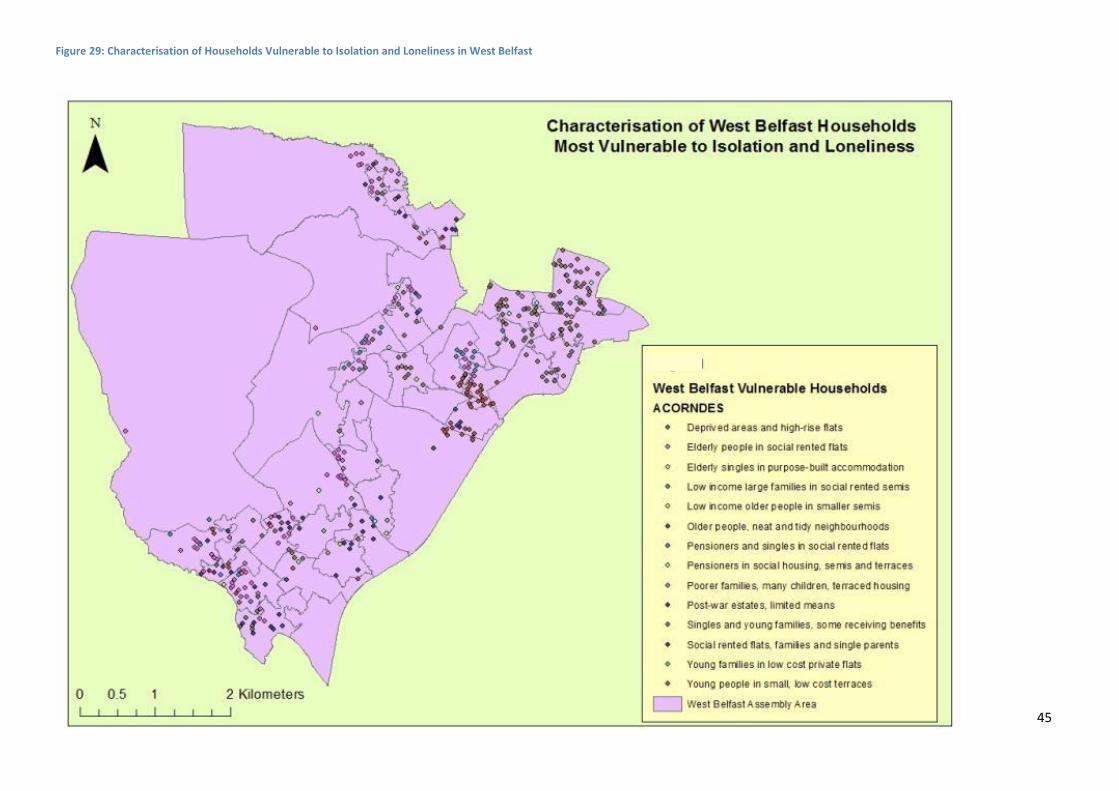
Figure 29: Characterisation of Households Vulnerable to Isolation and Loneliness in West Belfast ............................. 30

29
Appendix: Supplementary Maps

30
Figure 14: Map Showing Vulnerability of East Belfast SOAs to Isolation and Loneliness (Aggregate Isolation Index)

31
Figure 16: Map showing vulnerability of West Belfast SOAs to Isolation and Loneliness (Aggregate Isolation Index)
Figure 15: Map Showing Vulnerability of North Belfast SOAs to Isolation and Loneliness (Aggregate Isolation Index)

32
Figure 16: Map Showing Vulnerability of South Belfast SOAs to Isolation and Loneliness (Aggregate Isolation Index)

33
Figure 17: Map Showing Vulnerability of West Belfast SOAs to Isolation and Loneliness (Additional Risk Index)

34
Figure 18: Map Showing Vulnerability of East Belfast SOAs to Isolation and Loneliness (Additional Risk Index)

35
Figure 19: Map Showing Vulnerability of West Belfast SOAs to Isolation and Loneliness (Additional Risk Index)

36
Figure 20: Map Showing Vulnerability of North Belfast SOAs to Isolation and Loneliness (Additional Risk Index)

37
Figure 21: Map Showing Vulnerability of South Belfast SOAs to Isolation and Loneliness (Additional Risk Index)

38
Figure 22: Map Showing Belfast SOA Vulnerability to Isolation and Loneliness Based Upon Sensory Impairments

39
Figure 23: Map Showing Belfast SOA Vulnerability to Isolation and Loneliness Based Upon Long-term Mental Health

40
Figure 24: Map Showing Belfast SOA vulnerability to Isolation and Loneliness Based Upon Requirement for Bin Collection Assistance

41
Figure 25: Map Showing Belfast SOA Vulnerability to Isolation and Loneliness Based Upon Caring Responsibilities aged 65+

42
Figure 26: Characterisation of Households Vulnerable to Isolation and Loneliness in North Belfast

43
Figure 27: Characterisation of Households Vulnerable to Isolation and Loneliness in South Belfast

44
Figure 28: Characterisation of Households Vulnerable to Isolation and Loneliness in East Belfast
45
Figure 29: Characterisation of Households Vulnerable to Isolation and Loneliness in West Belfast


![Belfast confetti[1]](https://img.pdfslide.net/doc/110x75/5558ed6ad8b42ab8168b529a/belfast-confetti1.jpg)