Embed Size (px)
Citation preview

SocialNetworkAnalysisforLawEnforcement
Standards, Methods, & Technology Committee White Paper 2018‐02
February 2018
IACA SMT Committee Methods: Rebecca Paynich, Professor, Curry College John Ng, Special Constable, Saskatoon Police Service Sandra George O’Neil, Associate Professor and Chair of Sociology & Criminal Justice, Curry College Subject Matter Experts: Renee Richardson, Crime Analyst Supervisor, Richmond Police Department Jennifer A. Johnson, Associate Professor and Chair of Sociology, Virginia Commonwealth University Editor: Daniel S. Polans, Crime Analyst, Milwaukee Police Department Suggested Citation: International Association of Crime Analysts. (2018). Social Network Analysis for Law Enforcement (White Paper 2018‐02). Overland Park, KS: Author.

Social Network Analysis for Law Enforcement
Rev: January 2018
Page 2 of 19
Contents
About the IACA Standards, Methods, and Technology Committee ............................................... 3
Overview ......................................................................................................................................... 3
Social Network Analysis .................................................................................................................. 4
SNA and Crime Analysis .................................................................................................................. 7
Data Limitations ........................................................................................................................... 9
Relevant Research on Criminal Networks ...................................................................................... 9
Co‐offending .............................................................................................................................. 10
Strength of Connections/Ties .................................................................................................... 10
Criminal Networks ..................................................................................................................... 12
Case Examples of SNA in Law Enforcement ................................................................................. 14
Summary ....................................................................................................................................... 15
Suggested SNA Tools for Further Consideration .......................................................................... 16
References .................................................................................................................................... 16

Social Network Analysis for Law Enforcement
Rev: January 2018
Page 3 of 19
AbouttheIACAStandards,Methods,andTechnologyCommittee
The International Association of Crime Analysts (IACA) is committed to a continuing process of professionalization through standards and knowledge development. In 2011, the IACA chartered the Standards, Methods, and Technology Committee (SMT) for the purpose of defining “analytical methodologies, technologies, and core concepts relevant to the profession of crime analysis.”1 This document is part of a series of white papers produced by the SMT Committee that executes this purpose. The methodology for formulating the positions reflected in the white paper series includes 1) development of a draft paper through in‐depth meetings and discussions of Subject Matter Experts2, 2) review and feedback by the IACA Executive Board, 3) review and feedback from an independent editor with knowledge of crime analysis, and 4) review and feedback by IACA members facilitated through the IACA website (www.iaca.net). Any questions about this process can be directed to the chair of the SMT Committee at [email protected].
Overview
Social Network Analysis (SNA) is a way of understanding human behavior (including crime) through people’s relations and interactions. In addition, SNA provides analysts with an important set of analytic tools to study this behavior (McGloin & Kirk, 2010, p. 169). For the purposes of this paper, the Committee will focus on SNA’s contribution to helping us understand criminal networks, co‐offending patterns, and victimization. Primarily, the usefulness of SNA to law enforcement hinges on the fact that knowing who a person associates with (whether s/he be a suspect, victim, or potential witness) can aid in predicting that person’s future movements. It is well documented that crime and victimization are not randomly distributed across people or space. In addition, victims and offenders are often connected in multiple ways and play varying roles in criminal events (such as a victim, offender, co‐offender, or witness—often swapping in different events) and in daily social life (such as an acquaintance, family member, spouse/partner, etc.). Furthermore, these criminal networks are situated in larger communities: …criminal networks are not isolated; they are nested within the community, drawing
support from members of the community at large as well as extracting significant costs from host neighborhoods (Kadushin, 2005). As a policing matter, the existence of social networks necessarily means that department strategies are heavily contingent upon the ability to grasp and respond to the social networks within which criminal behavior is embedded. (Johnson & Reitzel, 2011, p. 3)
1This quote comes from the mission statement as written in the initial Standards, Methods, and Technology
Strategic Plan completed April 2011.
2 Subject Matter Experts are identified by the Standards, Methods, and Technology Committee based on special
knowledge obtained through publications, presentations, and practical experience and their willingness to
participate.

Social Network Analysis for Law Enforcement
Rev: January 2018
Page 4 of 19
That said, given that crime and victimization are both embedded within larger social networks, SNA has widespread applications for the field of crime analysis. It can aid in helping analysts better understand crime problems, as well as provide insight into the development of law enforcement strategies to prevent, disrupt, and reduce crime. McGloin & Kirk (2010) note: Several scholars have suggested that network analysis can be a powerful tool for law enforcement investigations that seek to understand crime problems (Coady 1985; Davis 1981; Howlett 1980; McGloin 2005b), as well as for the development of interventions and suppression tactics” (Braga, Kennedy, Waring, & Piehl 2001; McGloin 2005b). Thus, one could rightly argue that being familiar with methods that can appropriately capture and describe social networks is essential for criminological scholars as well as practitioners (McGloin & Kirk, 2010, p. 170). This paper contains a review of the relevant academic and practitioner literature on the uses of SNA in law enforcement. There are three basic categories of SNA: descriptive graphs, network measures, and advanced network modeling techniques (McGloin & Kirk, 2010). This paper will review the types of SNA that hold the most utility to crime analysis. However, the reader should note that this paper is not a comprehensive examination of all existing SNA methods. In addition, social media analysis, an important and related strategy, will not be addressed in this paper. Where possible, recommendations for further reading will be provided on specific SNA methods and available tools.
SocialNetworkAnalysis
SNA is a relatively recent approach to understanding how individuals are connected in society, and more specifically, how criminals themselves are connected to one another. “Social network analysis is both theory and method” (Johnson & Reitzel, 2011, p. 6). Stanley Milgram is often cited as the originator of SNA with his 1967 experiment, “The Small World Problem.” In this experiment, Milgram was interested in how two randomly selected persons might know one another. In a nutshell, Milgram sent packages to randomly selected persons in specific cities and asked the respondents if they knew a named person (also randomly selected) in Boston, Massachusetts. If they knew the person, they were instructed to forward the package to him/her and if not, to forward the package to someone they knew who was most likely to be connected to the person in Boston. One of Milgram’s primary findings was that two randomly chosen people were connected by an average of six connections (or people). Milgram’s experiment is not without its flaws, including a high nonresponse problem, but it set the stage for future SNA research. Granovetter (1973) furthered Milgram’s work by looking at the nature of the connection, or “tie” from one person to the next. In his work, Granovetter identified weak and strong ties and argued that weak ties (acquaintances) were more important in understanding certain behaviors and strong ties (family, close friends) were more important in understanding other behaviors. This is

Social Network Analysis for Law Enforcement
Rev: January 2018
Page 5 of 19
an important revelation for understanding criminal behavior. Granovetter also looked at the structure of the networks themselves and argued that networks that had greater access to information and power were larger, more disperse, more open and less interconnected. SNA is an important set of analytical tools that diagram and measure relationships. People (nodes or vertices) are connected to one another (edges or paths) in a variety of ways. Relationships can be directional (such as parent to child, offender to victim) or non‐directional and can vary in strength. A component consists of all nodes (and their edges) that are connected to one another—all actors are embedded in the same structure. In Figure 1 below, four individual actors are identified as well as their connections to one another. In this component, all actors have some relationship with one another (although this is typically not the case).
Granovetter (1973) also introduced the notion of the “Forbidden Triad”, (Figure 2 below), which asserts that if two people (A and B) know one another and A is also connected to C and both of these are strong ties, there is a high probability that B and C have at least an awareness of one another. This can have important implications for crime analysis and law enforcement efforts to address criminal networks. Fox example, if John (A) is a suspect in a crime, it may be that while Bob (B) may have more information to share about John, Tim (C) might be more willing to share the limited (but potentially very useful) information he has with detectives assigned to the case.

Social Network Analysis for Law Enforcement
Rev: January 2018
Page 6 of 19
Two outputs are produced by SNA: one visual and one that is mathematical. The visual output displays the connections (links or edges) between individual nodes (typically individual persons but nodes could represent groups or larger entities in macro‐level research). Figure 3 is an example of the visual output of SNA. Upon quick examination, one can easily identify the central role of nodes C , E, G, & H. In addition, one can also easily identify the roles E & G play in controlling the flow and access of information within the network (Johnson & Reitzel, 2011, p. 6‐7). Another output is mathematical. This output is similar to that produced in typical statistical analyses and contain computed figures for key items such as the number of vertices, edges, and components, as well as network measures including density, in‐degree, and betweenness centrality among other measures.
(Source Figure 3: Recreated from Johnson & Reitzel, 2011, p. 7)

Social Network Analysis for Law Enforcement
Rev: January 2018
Page 7 of 19
Given the connectedness of offenders in criminal networks and within their larger community, the question of interest centers on whether understanding a criminal’s social network can help us better understand, and perhaps even, predict criminal activity.
SNAandCrimeAnalysis
As stated earlier, McGloin and Kirk (2010) identify three categories of social network analysis: descriptive graphs, network measures, and advanced network modeling. Descriptive graphs, often termed “sociograms,” are simple visualizations of social networks and the connections that exist among the individual actors. Sociograms operate much like a map, providing a picture of relationships between individuals. Link analysis is a simple sociogram that allows analysts to identify relationships within an individual’s social network (both criminal and otherwise). Link analysis is useful to law enforcement for investigative and courtroom purposes. One major shortcoming with link analysis is that it “simply communicates the results” (Sparrow, 1991, p. 254). Figure 4 depicts an example of link analysis.
(Source for Figure 4: Hill & Paynich, 2013)
Several tools exist on the market for completing link analysis. An analyst can use specific software designed for link analysis (website information can be found at the end of this paper), use simple photograph insertion and labeling features in a GIS platform (combining both social and spatial connections as seen in Figure 4) or in any word processing or presentation software. Link analysis is typically not a complex endeavor; however, it can be time intensive, especially when collecting data and information on the individual connections and relationships that exist. A second category of SNA relative to crime analysis involves network measures. Network measures are central to understanding the overall structure of a criminal network (which as discussed earlier, can aid in the development of law enforcement strategies), as well as identifying key players within a network. The most common measures used for these purposes

Social Network Analysis for Law Enforcement
Rev: January 2018
Page 8 of 19
include density, in‐degree, and betweenness centrality (McGloin & Kirk, 2010, p. 15). Density measures the “cohesion” of a network. In‐degree measures the popularity of an individual within the network. Betweenness centrality measures to “what degree communication in a network must “go through” certain individuals” (McGloin & Kirk, 2010, p. 174). Thus, within a criminal network, these measures help us identify how tightly connected a group is, which members have the most influence based on the number of connections they have, and where they sit inside lines of communication. Another use of network measures in crime analysis lies in the identification of “key players.” “Three of the most common network strategies to detect key players have been measures of network centrality: closeness centrality, degree centrality, and betweenness centrality” (Hashimi, 2013, p. 14). Individuals with the highest closeness centrality scores will have the shortest path lengths to others within the network, and degree centrality measures the number of direct connections an individual has inside the network. Betweenness centrality (as noted above) refers to the position and ability of an individual to connect others, and thus be a go‐between for communication purposes. Morselli (2010) analyzed the Hells Angels’ network located in Quebec, Canada. Of the 174 offenders involved in drug distribution, Degree centrality keeps one in the thick of things. Betweenness centrality keeps one
active, but from a more discreet position. These network positions are not mutually exclusive, and any given criminal network participant is continuously balancing the visibility of degree centrality with the strategic benefits of betweenness centrality. The visibility that comes with high degree centrality was indeed a sign of vulnerability in the network under analysis in that the two groups of participants with high degree centrality were also the most likely to be affected by arrests—more than half the participants in each group were arrested in the final crackdown (p. 390).
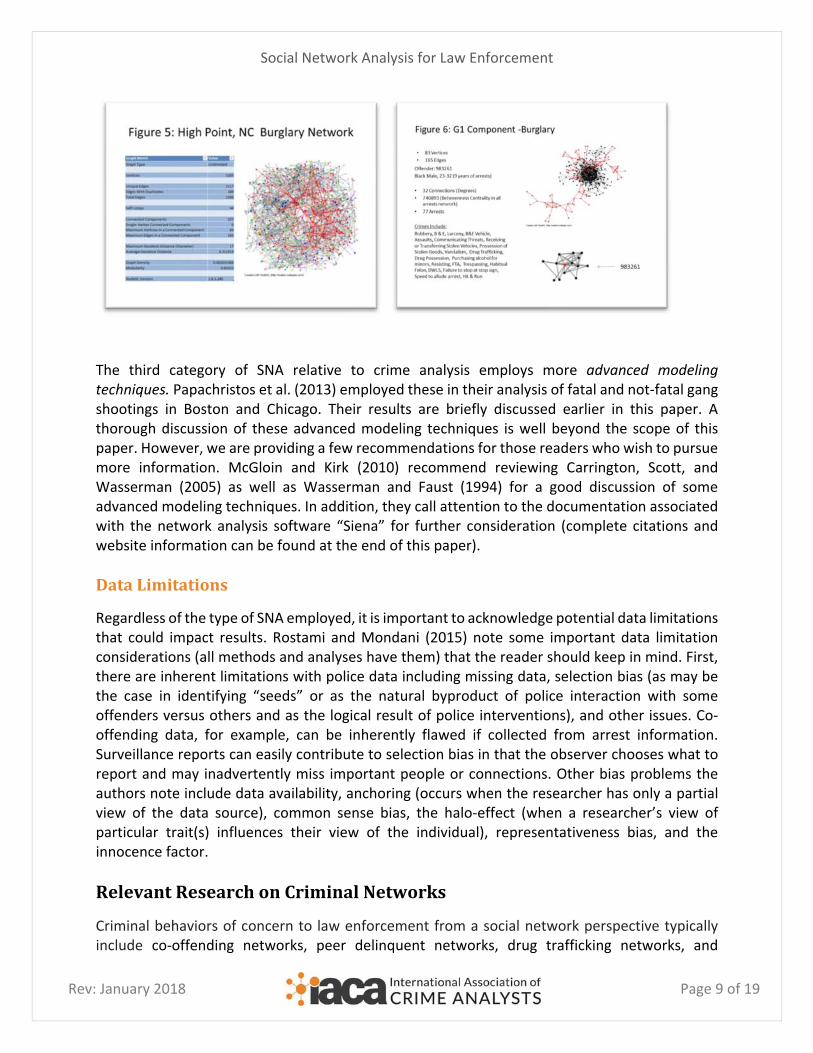
Hashimi (2013) sought to examine how understanding the criminal networks of identified, prioritized targets might better inform law enforcement strategies in reducing crime. Hashimi took two “seed” names of prioritized targets and extensively analyzed their criminal networks based on police intelligence. These targets were identified by law enforcement based on their threat levels. Hashimi found that certain network measures, network capital (connectivity and severity), and structural equivalence (holds a position in both networks) might be very useful in identifying which associates of prioritized targets should also be on police radar. Figures 5 and 6 provide examples of group and individual networks.
Social Network Analysis for Law Enforcement
Rev: January 2018
Page 9 of 19
The third category of SNA relative to crime analysis employs more advanced modeling techniques. Papachristos et al. (2013) employed these in their analysis of fatal and not‐fatal gang shootings in Boston and Chicago. Their results are briefly discussed earlier in this paper. A thorough discussion of these advanced modeling techniques is well beyond the scope of this paper. However, we are providing a few recommendations for those readers who wish to pursue more information. McGloin and Kirk (2010) recommend reviewing Carrington, Scott, and Wasserman (2005) as well as Wasserman and Faust (1994) for a good discussion of some advanced modeling techniques. In addition, they call attention to the documentation associated with the network analysis software “Siena” for further consideration (complete citations and website information can be found at the end of this paper).
DataLimitations
Regardless of the type of SNA employed, it is important to acknowledge potential data limitations that could impact results. Rostami and Mondani (2015) note some important data limitation considerations (all methods and analyses have them) that the reader should keep in mind. First, there are inherent limitations with police data including missing data, selection bias (as may be the case in identifying “seeds” or as the natural byproduct of police interaction with some offenders versus others and as the logical result of police interventions), and other issues. Co‐offending data, for example, can be inherently flawed if collected from arrest information. Surveillance reports can easily contribute to selection bias in that the observer chooses what to report and may inadvertently miss important people or connections. Other bias problems the authors note include data availability, anchoring (occurs when the researcher has only a partial view of the data source), common sense bias, the halo‐effect (when a researcher’s view of particular trait(s) influences their view of the individual), representativeness bias, and the innocence factor.
RelevantResearchonCriminalNetworks
Criminal behaviors of concern to law enforcement from a social network perspective typically include co‐offending networks, peer delinquent networks, drug trafficking networks, and
Social Network Analysis for Law Enforcement
Rev: January 2018
Page 10 of 19
criminal organizations (gangs and organized crime groups). At the heart of each of these networks is co‐offending behavior. In efforts to understand co‐offending behavior, numerous theories have been generated at the individual, group, and macro levels. Examining co‐offending patterns, through the lens of social networks, allows for the integration of several crime theories for a more comprehensive understanding.
Co‐offending
According to Pourheidari and Croisdale (2010), criminal activity involving co‐offenders is influenced by more than just one single theory and encompasses such concepts as “opportunities, motivation, and activity spaces” (p. 16). In their examination of co‐offending patterns, they found that co‐offenders commit more crime, especially burglaries and robberies than solo offenders. Pourheidari and Croisdale stress the importance of variables such as age, gender, and social class when analyzing crime pattern statistics. According to the authors, age appears to play a major role in co‐offending criminal involvement, with teenagers and young adults co‐offending more frequently than older adults. Solo criminal activity tends to appear later in an offender’s life. Thus, SNA models of offending may provide insight regarding differences in addressing juvenile crime. While Pourheidari and Croisdale do not empirically analyze co‐offending, they do provide suggestions about the various theories that could assist in understanding why co‐offending is becoming more prevalent in social networks, especially in diverse communities. These (co‐offending) networks differ most significantly from organized crime and gang affiliation in that there are no designated or entrenched leaders or formal hierarchy. Therefore, understanding the critical role of these social networks as well as the crime patterns involving them could greatly benefit today’s law enforcement agencies. As Pourheidari and Croisdale (2010) noted, “fully understanding the process of co‐offending can be a crucial detail in not only understanding and analyzing crime patterns accurately but for crime prevention as well” (p. 4). Van Mastrigt and Farrington (2009) found that co‐offending occurred more with female offenders. McGloin and Nguyen (2012), in their research on co‐offending and crime instigation, found that females often co‐offended with other females and were less likely to instigate crime when the “accomplices are of the opposite sex” (p. 486). However, McGloin and Nguyen (2012) note that their findings “certainly lend caution to the notion that males are universally more likely to instigate co‐offending” (p. 486). Both research studies suggest that age, gender, and crime type, independently and together, predicted co‐offending and that the relational aspects of co‐offending need to be further studied.
StrengthofConnections/Ties
In his research, Smangs (2010) presents a social network theory that relies on how loosely or tightly connected co‐offenders are to one another. Smangs utilizes Granovetter’s theory to explain co‐offending, asserting that in networks of delinquents, there can be local “bridges” of “strong ties” where “the stronger the tie between two delinquents, the more contacts they have in common” (p.614). Granovetter described strong ties between co‐offending individuals as

Social Network Analysis for Law Enforcement
Rev: January 2018
Page 11 of 19
involving “frequency of time spent together, mutual confiding or trust, emotional intensity, and reciprocity of services to each other” (as cited in Smangs, 2010, p. 617). In co‐offending, Smangs supports Granovetter’s reasoning that the co‐offenders enjoy together the thrill received from vandalizing or joyriding rather than just committing a crime on their own. Moreover, in conducting longitudinal analyses, Granovetter also concluded that young people formed strong ties within their local neighborhoods, youth centers, and other type of hang outs “where they formed relationships and decided to commit crimes together” (Smangs, 2010, p. 626). Co‐offending then, appears to also be influenced by external foci such as the workplace, school, or local neighborhood center. This suggests combining SNA and spatial analyses will provide even more understanding of group crimes. Papachristos, Hureau, and Braga (2013), for example, found that both proximity of gang turf locations and prior conflicts were strong predictors of gang violence for gangs in both Chicago and Boston. In supporting the relatively loose ties involving co‐offending, Heber (2009) conducted a research project in Stockholm, Sweden, involving drug offenders. Heber’s research questions ask:
What do drug offenders’ networks look like as regards to size, geographical distribution, and suspected co‐offenders?
In what ways do the networks change over time?
Which individuals occupy central positions within the networks and to what extent do the individuals specialize in drug offences? (Heber, 2009, p. 3).
The results of her research suggest that individuals form co‐offending relationships “on a temporary basis for criminal services” (2009, p. 2). Moreover, while the networks of drug offenders seem extensive and widely geographical, they encompass “relatively transient links between the individuals concerned” (p. 19). While the drug offenders did specialize in certain drugs and knew drug smugglers, their networks were relatively loosely formed and short‐lived. The drug offenders were young, male, and had previously co‐offended with other males from their social network. McGloin and Kirk (2010) noted in their review of the literature that the structure of the network itself (size, density, cohesiveness, etc.) impacts offending behavior. “The general conclusion of this literature is that we should expect relatively greater homogeneity in behavior (e.g. delinquency) within cohesive groups, largely because of the overwhelming connectedness of individuals in a dense network” (p. 175). According to McGloin and Stickle (2011), peer influence does not play as significant a role that others claim. Peer influence is not the same as group delinquency. As McGloin and Stickle acknowledge, chronic offenders may not be influenced to offend because of peer influence and that “chronic offenders were less likely to report the motivation for their criminal behavior stemmed from peer influence” (McGloin & Stickle, 2011, p. 435). In their study, the authors found that co‐offending presented more openings to commit more crimes and distribute responsibilities during criminal offenses. The researchers comment that “if group offending actually makes offending easier or broadens opportunities, then curtailing it could potentially limit the amount of offending overall” (p. 437).

Social Network Analysis for Law Enforcement
Rev: January 2018
Page 12 of 19
In another study, McGloin and Piquero (2010) explored co‐offending from the perspective of redundant and non‐redundant networks. In explaining the concept of “network redundancy or overlap among contacts in one social network,” the researchers note that the individual in the redundant network has access to the same knowledge, information, and opportunities as the others in the network so their criminal activities together will be limited. On the other hand, individuals in non‐redundant networks are loosely tied to the network which allows them to gain “a large diversity of skills, knowledge, and opportunities” (McGloin & Piquero, 2010, p. 66). In their research with a sampling of young offenders from Philadelphia, the researchers observe that “there is a relationship between the levels of redundancy in a delinquent’s co‐offending network and offending versatility. In co‐offending networks that were less redundant, there seemed to more diversity in the types of crimes committed. In contrast, more redundant co‐offending networks committed the same types of crimes, usually robberies or burglaries” (McGloin &Piquero, 2010).
CriminalNetworks
Understanding the overall structure of a criminal network, such as in a gang, may be important in predicting future crimes. For example, Papachristos, Hureau, and Braga (2013), in examining gang fatal and non‐fatal shooting network structures in both Chicago and Boston, found the sociograms to be quite revealing of important similarities and differences relative to gang behavior. With regard to connectivity—the extent to which any gang can reach any other gang— both networks were dominated by a single large component. The Chicago network, however, was more connected than the Boston network: 98 percent of all gangs were in the large component in Chicago compared to 66 percent in Boston. Both networks exhibit clustering along racial lines: approximately 95 percent of all homicides in Chicago and 97 percent of all shootings in Boston were intra‐racial. Furthermore network density among black gangs in Chicago (approximately 30 percent) was more than six times higher than Latino network density (4.5 percent). Compared to the Chicago network, the Boston network displayed a higher level of racial clustering and featured greater variation in gangs’ racial composition (p.426). In addition to gang characteristics identified in the sociograms, the authors hypothesized that several key network measures may be useful in predicting future gang related shootings. Using Exponential Random Graph Models (ERGMs), (which would be included in the third category of SNA relative to law enforcement, advanced network modeling techniques addressed briefly above) Papachristos et al. examined the predictive value of key network values to identify the probability that a member from one gang would attempt to shoot/kill a member of another gang. Spatial proximity and prior violence and reciprocity were found to be the most important variables in their models, however and very interestingly, the authors’ findings “suggest that network processes play an important and under‐examined role in how we understand the mechanisms behind violence vis‐à‐vis race and ethnicity” (p. 439).
Social Network Analysis for Law Enforcement
Rev: January 2018
Page 13 of 19
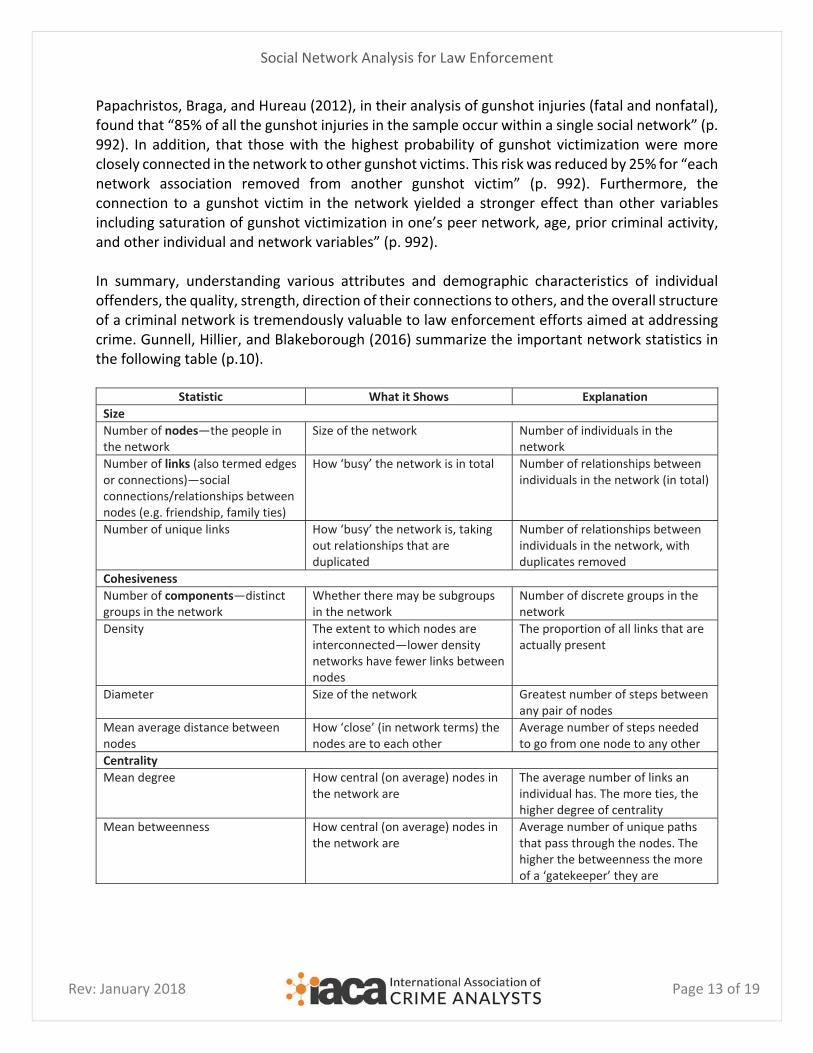
Papachristos, Braga, and Hureau (2012), in their analysis of gunshot injuries (fatal and nonfatal), found that “85% of all the gunshot injuries in the sample occur within a single social network” (p. 992). In addition, that those with the highest probability of gunshot victimization were more closely connected in the network to other gunshot victims. This risk was reduced by 25% for “each network association removed from another gunshot victim” (p. 992). Furthermore, the connection to a gunshot victim in the network yielded a stronger effect than other variables including saturation of gunshot victimization in one’s peer network, age, prior criminal activity, and other individual and network variables” (p. 992). In summary, understanding various attributes and demographic characteristics of individual offenders, the quality, strength, direction of their connections to others, and the overall structure of a criminal network is tremendously valuable to law enforcement efforts aimed at addressing crime. Gunnell, Hillier, and Blakeborough (2016) summarize the important network statistics in the following table (p.10).
Statistic What it Shows Explanation
Size
Number of nodes—the people in the network
Size of the network Number of individuals in the network
Number of links (also termed edges or connections)—social connections/relationships between nodes (e.g. friendship, family ties)
How ‘busy’ the network is in total Number of relationships between individuals in the network (in total)
Number of unique links How ‘busy’ the network is, taking out relationships that are duplicated
Number of relationships between individuals in the network, with duplicates removed
Cohesiveness
Number of components—distinct groups in the network
Whether there may be subgroups in the network
Number of discrete groups in the network
Density The extent to which nodes are interconnected—lower density networks have fewer links between nodes
The proportion of all links that are actually present
Diameter Size of the network Greatest number of steps between any pair of nodes
Mean average distance between nodes
How ‘close’ (in network terms) the nodes are to each other
Average number of steps needed to go from one node to any other
Centrality
Mean degree How central (on average) nodes in the network are
The average number of links an individual has. The more ties, the higher degree of centrality
Mean betweenness How central (on average) nodes in the network are
Average number of unique paths that pass through the nodes. The higher the betweenness the more of a ‘gatekeeper’ they are

Social Network Analysis for Law Enforcement
Rev: January 2018
Page 14 of 19
CaseExamplesofSNAinLawEnforcement
Two examples of using SNA in law enforcement come from the Richmond, Virginia Police Department (RPD). In the first example, Richmond PD had been searching for a homicide suspect for approximately one month when their crime analysis department decided to construct a network analysis of the suspect’s social network. The suspect’s family and friends were identified as key nodes in the analysis and officers quickly got to work in contacting these key persons. Each of the central members of the network was notified that the suspect was wanted by police and they were asked to contact the police should they be in contact with him. Because of these police contacts, the suspect turned himself in within just a few hours. (Bachner, 2013) In this case, the SNA sociogram was used to effectively narrow down key people (beyond immediate family and friends) to contact and isolate the suspect. SNA assisted the police in moving beyond solely immediate family and friends. In the second example, a cooperative pilot project between Richmond PD, academics, and a software designer sought to identify why two gangs, who had previously been friendly, were initiating acts of violence against each other. Using information from RPD’s record management system, the research team identified 24 persons of interest (seeds) to complete a social network that was four layers deep, consisting of 434 individuals and 1,711 connections (see Figure 7 for visualization). The analysis, through visualization and the measure of betweenness (See Johnson & Reitzel, 2011), revealed an interesting and unexpected finding. “Two powerful male gang members reportedly had a positive relationship in October 2007; however, in April 2008, one victimized a female friend of the other. During the same incident, this male also victimized the female friend of another male. Throughout the episode, a pattern emerged involving situations where a dominant male engaged with a female associate of another strong male. In other words, boys were fighting over girls.” (Johnson et al., 2013, para. 16). Although the timelines of the pilot project delayed the recommendations and results too late to be actionable, officers confirmed that indeed, the cause of the conflict was “boys fighting over girls” (para. 18). It is important to note that the research team was able to 'solve' the question of why two gangs suddenly started 'beefing' without any other knowledge beyond the SNA sociogram and metrics. The SNA data revealed the 'triad' which destabilized both gangs. Figure 7 illustrates the “tension spots in the network characterized by a high number of overlapping positive and negative ties surrounding triads” across the two fighting gangs in Richmond (p. 10). The females noted above in the victimizations “were at the core of the tensions inside the network” (p. 11). These triads are important in understanding network dynamics. Recall Granovetter’s work with the “forbidden triangle.” Balanced triads {all ties are positive (friendly) or if two are negative (enemies) and one is positive} indicate stability; unbalanced triads {all ties are negative (enemies) or two are positive and one is negative) indicate tension and instability.

Social Network Analysis for Law Enforcement
Rev: January 2018
Page 15 of 19
(Source: Johnson and Reitzel, 2011)
In another example of using SNA in law enforcement, The Kansas City Police Department (KCPD), looking to better understand and address gang related homicide and the retaliatory violence that comes along with these events, partnered with Dr. Andrew Fox from the University of Missouri—Kansas City to construct a social network analysis (McHale, 2015). Pulling data and information on one gang (including from paper documents) to create an extensive social network analysis involving 360 persons, two relational steps out. Two days after the completion of the SNA, KCPD was able to “connect the dots” following a homicide involving four key members in the network. This analysis later informed prioritized targets in a multi‐agency operation, entitled “Clean Sweep.” KCPD now has the ability to map the social network of any known gang member as well as the network structure of known gangs in just a few hours. Furthermore, “SNA has been utilized by KCPD to drive homicide responses, violence prevention measures, and proactive enforcement operations. SNA is also the core intelligence model for the implementation of focused deterrence in Kansas City” (para. 6).
Summary
The purpose of this paper was to provide an overview of social network analysis for law enforcement with a brief discussion of core components and theoretical approaches, a review of the relevant literature regarding criminal networks, co‐offending, and the utility of SNA in crime analysis. In addition, a discussion of case examples where SNA has been successfully utilized in law enforcement was provided. This paper is far from a comprehensive treatise on the subject analysis, however, it provides an introductory overview on the basic tools and approaches of SNA that are of interest to crime analysis. McHale (2015) sums it best, noting that “the ability of police administrators to understand and utilize SNA to drive their policing strategies is the future of Law Enforcement. The 21st century of policing is upon us, and the ability to compile, conceptualize and utilize SNA will be the most defining tool we have seen since the patrol car or the walkie‐talkie” (para. 8).

Social Network Analysis for Law Enforcement
Rev: January 2018
Page 16 of 19
SuggestedSNAToolsforFurtherConsideration
Analyst’s Notebook: http://www‐03.ibm.com/software/products/en/analysts‐notebook ArcGIS Network Analyst: http://www.esri.com/software/arcgis/extensions/networkanalyst/ BLUE SPIDER http://blue‐spider.software.informer.com/ NODEXL: http://nodexl.codeplex.com/ R: http://cran.us.r‐project.org/web/packages/sna/index.html Siena (Works with R): https://www.stats.ox.ac.uk/~snijders/siena/ SPSS Modeler: http://www‐01.ibm.com/software/analytics/spss/products/modeler/
References
Andresen, M., & M. Felson. (2010). The impact of co‐offending. British Journal of Criminology, 50, 66‐81.
Bachner, J. (2013). Predictive Policing: Preventing crime with data and analytics. IBM Center for the Business of Government, Improving Performance Series. http://www.businessofgovernment.org/report/predictive‐policing‐preventing‐crime‐ data‐and‐analytics Belledin, S., & K . Paletta. (2008). Finding out What You Don’t Know: Tips on Using Crime Analysis. The Police Chief, 75. Braga, A. A., D. M. Kennedy, E. J. Waring, and A. M. Piehl. (2001). Problem‐oriented policing,
deterrence, and youth violence: An evaluation of Boston’s operation ceasefire. Journal of Research in Crime and Delinquency 38: 195–225. Bruce, C. W. (2008). Closing the Gap Between Analysis and Response. The Police Chief, 75. Carrington, P.J. (2009). Co‐offending and the development of the delinquent career. Criminology, 47, 1295‐1329. Carrington, P., J. Scott, and S. Wasserman. (2005). Models and methods in social network analysis. New York: Cambridge University Press. Coady, W. F. (1985). Automated link analysis: Artificial intelligence‐based tool for investigators. Police Chief 52: 22–23. Cope, N. (2004). Intelligence Led Policing or Policing Led Intelligence? British Journal of Criminology, 44, 188‐203. Davis, R. H. 1981. Social network analysis: An aid in conspiracy investigations. FBI Law Enforcement Bulletin 50: 11–19. Felson, M. (2009). The natural history of extended co‐offending. Trends in Organized Crime, 12(2), 159‐165. Granovetter, M. (1973). The strength of weak ties. American Journal of Sociology 78(6):
Social Network Analysis for Law Enforcement
Rev: January 2018
Page 17 of 19
1360‐80.
Greene, J. & K. Pranis. (2007). Gang wars: The failure of enforcement tactics and the need for effective public safety strategies. Justice Policy Institute Report. Gunnell, D., J. Hillier, & L. Blakeborough. (2016). Social Network Analysis of an Urban
Street Gang using Police Intelligence Data. Research Report 89. ISBN: 978‐1‐78655‐065‐1.https://www.gov.uk/government/uploads/system/uploads/attachment_data/file/491578/horr89.pdf
Hashimi, S. (2015). On to the next one: Using social network data to inform police target prioritization. Master’s Thesis. Simon Fraser University, 2015. Haynie, D. L. (2001). Delinquent Peers Revisited: Does network structure matter? American Journal of Sociology, 106(4), 1013‐1057, doi: 10.1086/320298. Heber A. ( 2009). The networks of drug offenders. Trends in Organized Crime, 12(1), 1‐
20. Howlett, J. B. (1980). Analytical investigative techniques: Tools for complex criminal investigations. Police Chief 47: 42–45. Johnson, J.A. (2010). To catch a curious clicker: A social network analysis of the online commercial pornography network. Everyday Pornographies. Routledge Press. Johnson, J.A., and J.D. Reitzel. (2011). Social Network Analysis in an Operational Environment: Defining the utility of a network approach for crime analysis using the Richmond City Police Department as a case study. Working Paper No. 39, International Police Executive Symposium. Geneva Centre for the Democratic Control of Armed Forces. Cognita‐For Police Reforms and Community Safety. Johnson, J.A., Reitzel, J.D., Norwood, B,. McCoy, D., Cummings, B., & R. Tate. (2013). Social Network Analysis: A systematic approach for investigating. FBI Law Enforcement Bulletin, March 2013. Krebs, V. (2004). Mapping Networks of Terrorist Cells. Connections, 24(3), 43‐ 52. Kadushin, C. (2005). Who benefits from network analysis: ethics of social network research? Social Networks, 27(2), 139‐153, doi:10.1016/j.socnet.2005.01.005. Konkol, M. & F. Main. (2012, July 7). Chicago under fire: Murders rising despite decline in overall crime. Chicago Sun‐Times, 1. McGloin, J. M. (2007). The organizational structure of street gangs in Newark, New Jersey: A network analysis methodology. Journal of Gang Research, 15(1), 1‐34. ‐‐‐‐‐. 2005a. "Policy Intervention Considerations of a Network Analysis of Street Gangs." Criminology and Public Policy 4:607.
‐‐‐‐‐. 2005b. Street gangs and interventions: Innovative problem solving with network analysis. Washington, DC: US Department of Justice, Office of Community
Oriented Policing. McGloin, J.M., & D. Kirk. (2010). An overview of social network analysis. Journal of Criminal Justice Education. 21(2): 169‐181. McGloin, J. & H. Nguyen. (2012). It was my idea: Considering the instigation of co‐offending. Criminology, 50 (2), 463‐494.

Social Network Analysis for Law Enforcement
Rev: January 2018
Page 18 of 19
McGloin, J. &, A. Piquero. (2010). On the relationship between co‐offending network redundancy and offending versatility. Journal of Research in Crime & Delinquency, 47(1), 63‐90. McGloin, J. & W.P. Stickle. (2011). Influence or convenience? Disentangling peer influence and co‐offending for chronic offenders. Journal of Research in Crime & Delinquency, 48(3), 419‐447. McHale, J. (2015). Reducing Homicides using Social Network Analysis. Office of Justice
Programs, Data‐Driven Justice Solutions. Accessed December 24, 2015 https://www.ojpdiagnosticcenter.org/blog/reducing‐homicides‐using‐social‐network‐analysis
McNally, D. & J . Allston. (2006). The Use of Social Network Analysis in the examination of an outlaw motorcycle gang. Journal of Gang Research, 13(3). Milgrim, S. (1967). The small world problem. Psychology Today. Morselli, C. (2010). Assessing Vulnerable and Strategic Positions in a Criminal Network. Journal of Contemporary Criminal Justice. 26(4): 382‐392. Murji, K. (2007). Hierarchies, markets, and networks: Ethnicity/race and drug distribution. Journal of Drug Issues, doi: 0022‐0426/07/04 781‐804. Ouellet, F., Boivin, R., LecLerc, C., & C. Morselli. (2013). Friends with(out) benefits: Co‐ offending and rearrest. Global Crime Vol. 14, Nos. 2–3, 141–154. Papachristos, A.V. & A.A. Braga. (2012). Social networks and the risk of gunshot injury. Journal of Urban Health: Bulletin of the New York Academy of Medicine. Vol. 89, No. 6: 992‐1002. Papachristos, A.V., D.M. Hureau, & A.A. Braga. (2013) Conflict and the Corner: The impact of intergroup conflict and geographic turf on gang violence. American Sociological Review. 78(3): 417‐447. Patacchini , E. & Y. Zenou. (2008). The strength of weak ties in crime. European Economic Review, 52(2), doi:10.1016/j.euroecorev.2007.09.002. Pourheidari, A. & T. Croisdale. (2010). Understanding criminal co‐offending: A historiography of research literature. Working Paper No. 27, International Police Executive Symposium. Geneva Centre for the Democratic Control of Armed Forces. Cognita‐For Police Reforms and Community Safety. Rostami A, & H. Mondani. (2015). The Complexity of Crime Network Data: A Case Study of its Consequences for Crime Control and the Study of Networks. PLoS ONE 10(3): e0119309. doi:10.1371/journal.pone.0119309. Schaefer, D. (2012). Youth co‐offending networks: An investigation of social and spatial effects. Social Networks 34 (2012) 141– 149. Scott, J. (2013). Social Network Analysis, 3rd Edition. Sage Publications. Smangs M. (2010). Delinquency, social skills and the structure of peer relations: Assessing Sparrow, M. (1991). The application of network analysis to criminal intelligence: An assessment
of the prospects. Social Networks, 13(3), 251‐274. doi: 10.1016/0378‐8733(91)90008‐h Stolzenberg, L. & S. D’Alessio. (2008). Co‐offending and the age‐crime curve. Journal of
Research in Crime and Delinquency, 45 (1), 65‐86. Van Mastrigt, S. & D. Farrington.( 2009). Co‐offending, age, gender, and crime type;
Implications for criminal justice policy. British Journal of Criminology, 49(4), 552‐573.

Social Network Analysis for Law Enforcement
Rev: January 2018
Page 19 of 19
Wasserman, S., and K. Faust. 1994. Social network analysis: Methods and applications. Cambridge: Cambridge University Press. Weerman, F. & W. Smeenk. (2005). Peer similarity in delinquency for different types of friends:
A comparison using two measurement methods. Criminology, 43 (2) 499‐523.