Embed Size (px)
Citation preview

Social Network Analysis
Thanks to Prof. Dr. Daning Hu (Original Author)Department of InformaticsUniversity of Zurich
CS 185 Lecture 14May 16th 2018

2
Outlinen Node Level Analysis
n Link and Group Level Analysis
n Network Level Analysis
n Network Topological Analysis
n Ref Book: Social Network Analysis: Methods and Applications (Structural Analysis in the Social Sciences)¨ http://www.amazon.com/Social-Network-Analysis-Applications-
Structural/dp/0521387078

What is a Network?
Tie/Link: Relationship or interactionbetween two nodes.
Node: Any entity in a network
(person, system, group, organization)

Network Topological Analysis Vs. Dynamic Network Analysisn Topology (from the Greek τόπος, “ place ” , and λόγος,“study”) is a major area of mathematics concerned with themost basic properties of space, such as connectedness.¨ as a field of study out of geometry and set theory, through analysis of
such concepts as space, dimension, and transformation.
n Network topology is the arrangement of the various elements(links, nodes, etc). Essentially, it is the topological structure ofa network.¨ Physical topology refers to the placement of the network's various
components, including device location and cable installation;¨ while logical topology shows how data flows within a network,
regardless of its physical design.

Node Level Analysis: Node Centralityn Node Centrality can be viewed as a measure of influence or
importance of nodes in a network.
n Degree¨ the number of links that a node possesses in a network. In a directed
network, one must differentiate between in-links and out-links bycalculating in-degree and out-degree.
n Betweeness¨ the number of shortest paths in a network that traverse through that
node.
n Closeness¨ the average distance that each node is from all other nodes in the
network
Node Level Analysis: Degree Centrality
From Steve Borgatti

Node Level Analysis: Betweenness Centrality
From Steve Borgatti
8
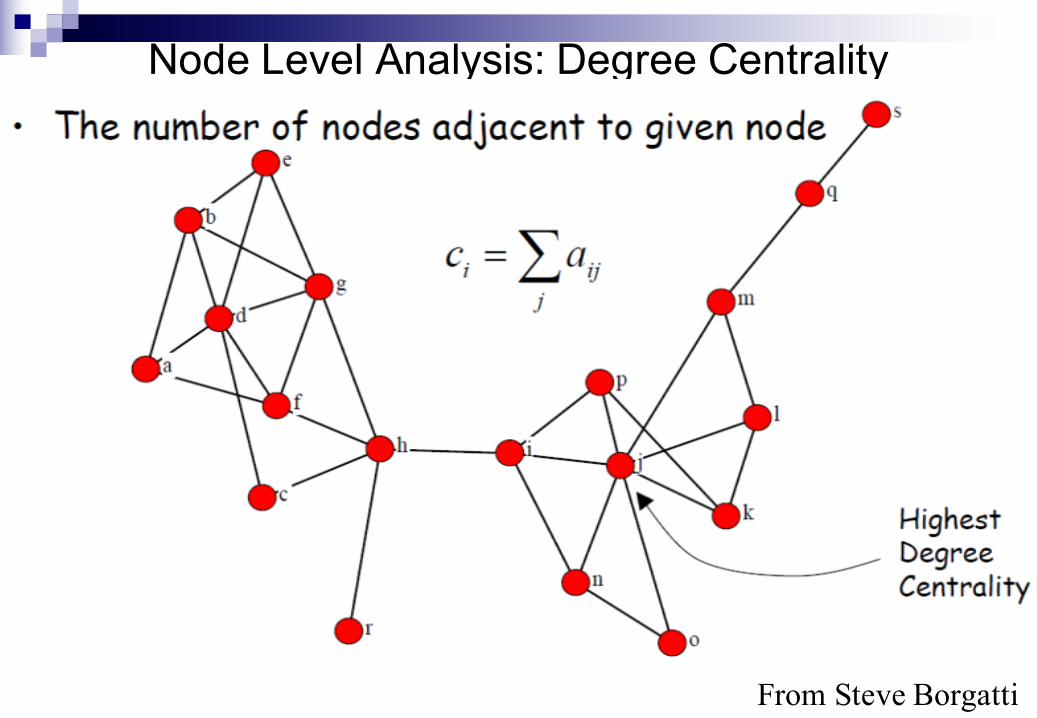
Link Level Analysis: Length and Distance
n Length of a path is the number of the links
n Distance between two nodes is the length of shortest path (i.e., geodesic)
From Steve Borgatti
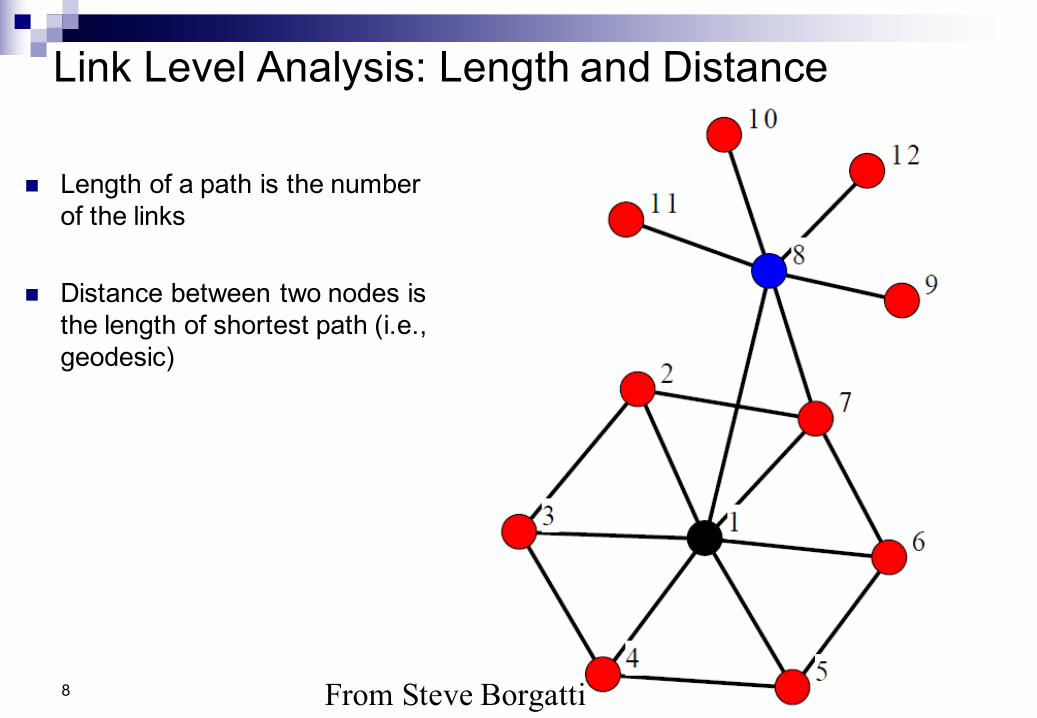
Group Level Analysis: Cutpoints and Bridge
From Steve Borgatti

The Strength of Weak Tie (Granovetter 1973)n Strong ties create transitivity
¨ Two nodes linked by a strong tie will have mutual acquaitances
n Ties that are part of transitive triples cannot be bridges
n Therefore, only weak ties can be bridges¨ the value of weak ties!!
n Strong ties embeded in tight homophilous clusters, whileweak ties connect to diversity¨ Weak ties is a major source of novel information

11
Network Level Analysis: Cohesionn Network Topology Analysis takes a macro perspective to study
the physical properties of network structures. Network topologicalmeasures include:¨ Size, i.e., number of nodes and links¨ Network Cohesion¨ Average Degree, Distance¨ Average Path Length: on average, the number of steps it takes to get
from one member of the network to another.¨ Diameter¨ Clustering Coefficient: a measure of an "all-my-friends-know-each-
other" property; small-world feature
12
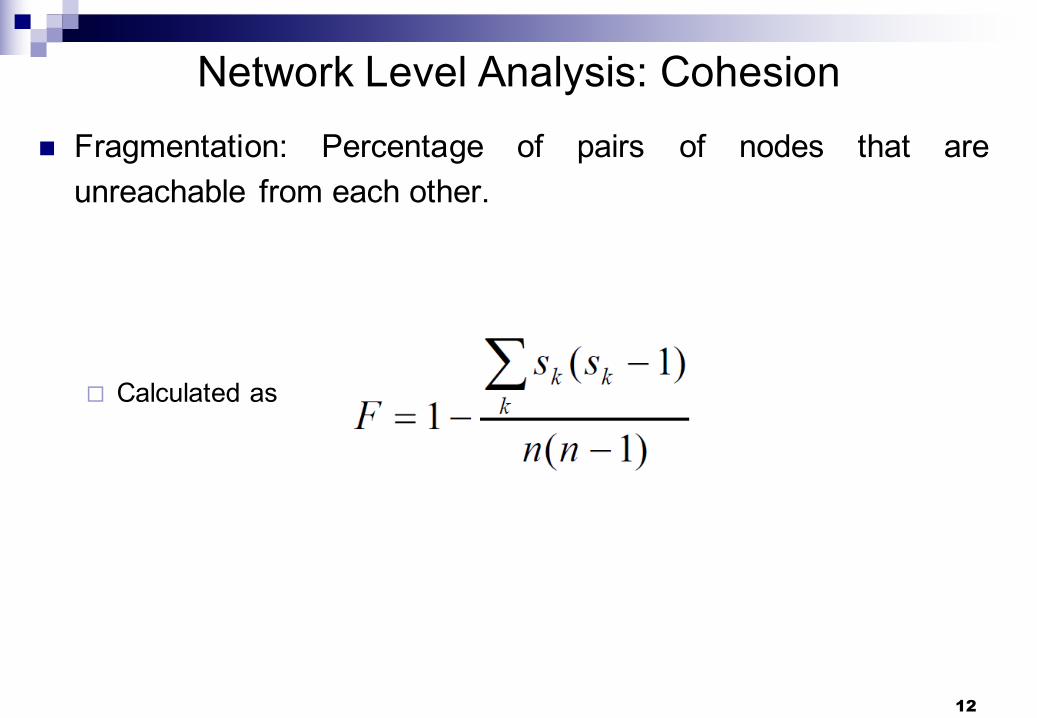
Network Level Analysis: Cohesionn Fragmentation: Percentage of pairs of nodes that are
unreachable from each other.
¨ Calculated as

13
Network Level Analysis: Cohesionn Density: the percentage of the number of links over all possible
pairs of links.
From Steve Borgatti

14
Network Level Analysis: Cohesionn Average distance: average distance between all pairs of nodes.
From Steve Borgatti

15
Network Level Analysis: Structural Holes

16
Network Level Analysis: Structural Holes

Network Topological Analysisn Network topology is the arrangement of the various elements
(links, nodes, etc). Essentially, it is the topological structure ofa network.
n How to model the topology of large-scale networks?
n What are the organizing principles underlying their topology?
n How does the topology of a network affect its robustnessagainst errors and attacks?
18
Network Models
n Random graph model (Erdős & Rényi, 1959)
n Small-world model (Watts & Strogatz, 1998)
n Scale-free model (Barabasi & Alert, 1999)

19
Random Networks
n Erdős–Rényi Random Graph model is used for generatingrandom networks in which links are set between nodes withequal probabilities¨ Starting with n isolated nodes and connecting each pair of nodes with
probability p¨ As a result, all nodes have roughly
the same number of links(i.e., average degree, <k>).

20
Random Networksn In a random network, each pair of nodes i, j has a connecting
link with an independent probability of p
n This graph has 16 nodes, 120 possible connections, and 19 actual connections—about a 1/7 probability than any two nodes will be connected to each other.
n In a random graph, the presence of a connection between A and B as well as a connection between B and C will not influence the probability of a connection between A and C.

21
Random Graphs (Cont’d)
n Average path length:
n Clustering coefficient:
n Degree distribution¨ Binomial distribution for small n and
Poisson distribution for large n¨ Probability mass function (PMF)
)ln()ln(~knL
nk
pC ==
!)(
kk
ekpk
k−=
However, real networks are not random!

22
Small-World Networkn Social networks usually are small world networks in which a
group of people are closely related, while a few people have far-reaching connections with people out side of the group
n Starting with a ring lattice of n nodes, each connected to its neighbors out to form a ring <k>. Shortcut links are added between random pairs of nodes, with probability ф (Watts & Strogatz, 1998)
n Watts-Strogatz Small World model¨ large clustering coefficient¨ high average path length

23
Small-World Networksn A small-world network is defined to be a network where the typical
distance L between two randomly chosen nodes (the number of steps required) grows proportionally to the logarithm of the number of nodes N in the network, that is:
n and Lsw £Lrand
n Clustering coefficient:¨ Csw >> Crandom
n Degree distribution¨ Similar to that of random networks
Thus, small-world networks are characterized by large clustering coefficient, small path length relative to n.

24
Scale-Free (SF) Networks: Barabási–Albert (BA) Model
n “Scale free” means there is no single characterizing degree in the network
n Growth: ¨ starting with a small number (n0) of nodes,
at every time step, we add a new node with m(<=n0) links that connect the new node to m different nodes already present in the system
n Preferential attachment: ¨ When choosing the nodes to which the
new node will be connected to node i depends on its degree ki

25
Scale-Free Networks (Cont’d)
n The degree of scale-free networks follows power-law distribution with a flat tail for large k
n Truncated power-law distribution deviates at the tail
γ−kkp ~)(0
0 .02
0 .04
0 .06
0 .08
0 .1
0 .12
0 5 10 15 20 25 30
k
Pow er-law
Truncated
-14
-12
-10
-8
-6
-4
-2
0
0 0.5 1 1.5 2 2.5 3 3.5
ln(k)
Power-lawTruncated
κγk
ekkp−−~)(

26
Evolution of SF Networksn The emergence of scale-free network is
due to¨ Growth effect: new nodes are added to the
network ¨ Preferential attachment effect (Rich-get-
richer effect): new nodes prefer to attach to “popular” nodes
n The emergence of truncated SF network is caused by some constraints on the maximum number of links a node can have such as (Amaral, Scala et al. 2000)¨ Aging effect: some old nodes may stop
receiving links over time¨ Cost effect: as maintaining links induces
costs, nodes cannot receive an unlimited number of links

27
Network Analysis: Topology Analysis
Topology Average Path Length (L)
Clustering Coefficient (CC)
Degree Distribution (P(k))
Random Graph Poisson Dist.:
Small World(Watts & Strogatz, 1998)
Lsw £Lrand CCsw >>CCrand Similar to random graph
Scale-Free network LSF £Lrand Power-law Distribution:P(k) ~ k-g
〉〈kNLrand ln
ln~NkCCrand〉〈
=!
)(kkekPk
k 〉〈≈ 〉〈−
〉〈k : Average degree