Embed Size (px)
Citation preview

SOCIAL NETWORK AND TEMPORAL DISCOUNTING
(pre-print, to appear in Network Science)
April, 2017 © Ronald S. Burt, University of Chicago Booth School of Business, Chicago, IL 60637
Tel: 312-953-4089, [email protected] ACKNOWLEDGEMENT: I am grateful to the University of Chicago Booth School of Business, Bocconi University, and the MaxPo research Center in Paris for financial support during the work reported here. I am grateful for early discussion with Don Ronchi and Ezra Zuckerman, editorial comments from Hagay Volvovsky, and incorporated comments from presentations at the University of Arizona, Washington University in St. Louis, the SciencesPo Center for the Sociology of Organizations, Andrew Shipilov’s biennial “network evolution” conference at Insead, and the annual meetings of the Academy of Management. I am especially grateful for productive comments from three anonymous reviewers for this journal. Manuscript download: http://faculty.chicagobooth.edu/ronald.burt/research/.

Social Network and Temporal Discounting, 2017-04-26 DRAFT, Page 2
SOCIAL NETWORK AND TEMPORAL DISCOUNTING For reasons of social influence and social logistics, people in closed networks are expected to experience time compression: The more closed a person’s network, the steeper the person’s discount function, and the more narrow the expected time horizon within which the person deliberates events and behavior. Consistent with the hypothesis, data on managers at the top of three organizations show network closure associated with a social life compressed into daily contact with colleagues. Further, language in closed networks is predominantly about current activities, ignoring the future. Further still, discount functions employed by executive MBA students show more severe discounting by students in more closed networks. Inattention to the future can be argued to impair achievement, however, I find no evidence across the managers of daily contact diminishing the achievement associated with network advantage. I close with comments on replication and extrapolation to language more generally, within-person variation, and select cognitive patterns (closure bias, end of history, and felt status loss). KEYWORDS: time discounting, brokerage, closure, network advantage
I speculate that managing the interlocked demands of colleagues in a closed network
limits a person’s freedom to think about the future such that attention becomes
compressed into a myopic focus on the present. Time compression and discounting the
future is discussed in economics, psychology, and sociology under various labels such
as present bias, telescoping, and discounting. The phenomenon is usually attributed to
the frailty of human judgment in general, or the frailty of judgment by immature,
impatient, impulsive individuals. I do not have authoritative evidence to support my
hypothesized connection between network closure and time, but I have from earlier
studies diverse bits of evidence consistent with the hypothesis. My goal is to show that
the hypothesis is likely true, such that it warrants research to provide authoritative
evidence. In the next section, I describe time compression, discounting, and horizons.
In the subsequent section, I argue that compression and discounting should be more
severe in closed networks. I then present empirical evidence to support the argument,
and discuss implications.
TIME COMPRESSION AND DISCOUNTING Temporal discount functions are illustrated in Figure 1. The displayed data were elicited
by presenting an individual with a choice between receiving $1,000 at a certain time in
Social Network and Temporal Discounting, 2017-04-26 DRAFT, Page 3
the future or receiving some lesser amount V right now, an amount the individual feels
is about equal to the delayed $1,000. The horizontal axis in Figure 1 shows delay (D).
The vertical axis shows the median value (V) right now that individuals would accept as
equivalent to the delayed $1,000. Three lines in Figure 1 describe choices by a dozen
adults (bold line), a dozen college students (thin line), and a dozen children in sixth
grade (dashed line). The results are adapted from a graph in Green, Fry, and Myerson
(1994). Each person made a choice at eight lengths of delay, which are the data points
in Figure 1: 25 years (300 months), 10 years (120 months), and so on down to one
week. The broken-line results in Figure 1 for substance-abusing pathological gamblers
are adapted from a graph in Petry (2001).1
Temporal Discounting Exists
Two characteristics of discount functions are illustrated in Figure 1. The first is that all
the lines are decreasing: people discount delayed rewards. Referring to the bold line in
Figure 1, adults want almost full payment, $990, in exchange for a $1,000 bond that
matures next month. The same $1,000, delayed for 10 years, would be exchanged for
$450 today. And $1,000 delayed for 25 years, would be exchanged for only $125
today. The tendency for people to discount delayed rewards has long been recognized,
and discussed under various labels such as consideration of future consequences,
future time perspective, present bias, time discounting, time preference, and various
derogatory personality characteristics implying a lack of self control (Ainslie, 1975, and
Frederick, Loewenstein, and O’Donoghue, 2002, are reviews often cited in the temporal
discount literature).2
1Delayed value, V, is measured similarly in the two studies. Values on the vertical axis in
Figure 1 are eyeball estimates from Figure 2 in Green et al. (1994) and from Figure 1 in Petry (2001). The positions of data points on the delay axis are defined by study design.
2One step further, Zimbardo and Boyd (1999) use factor analyses of how people perceive time to distinguish two ways people can be focused on the present: present hedonists (focused on immediate gratification) versus present fatalists (no use in worrying about the future if you cannot affect it). It could be useful to distinguish the two variants in future network research, since hedonists correspond to impatience views of discounting and fatalists correspond more to the social logistics discussed in the next section — but the simple fact of temporal discounting is sufficient to motivate this note.

Social Network and Temporal Discounting, 2017-04-26 DRAFT, Page 4
Especially for Less Mature Individuals
The second characteristic illustrated in Figure 1 is the different functions used by more
and less mature individuals. The regression line through the adult data in Figure 1 is an
exponential discount function (V = ae-bD). The exponential is a good fit to the adult
choices in Figure 1 (.99 R2 for the data in the graph), and is the “discount utility” model
often assumed in economics (see Frederick, Loewenstein, and O’Donoghue, 2002, for
history back to the early 1800s).
——— Figure 1 About Here ———
Empirical research reveals discount functions more like the others in Figure 1. For
short time delays, discounting is more-than-expected from the exponential. For time
intervals far away, discounting is less-than-expected from the exponential. The
children’s discount function in Figure 1 drops very quickly for short delays, then flattens
out for long delays. The children viewed $1,000 delayed for a month as worth about
$450, then about $300 if the delay was for three years, and any delay five years or
longer was all the same to them. The choices by children and college students are well
described by the hyperbolic discount function displayed in Figure 1: V = A / (1+kD)s,
where V and D are value and delay as before, A is the reward amount (here $1,000),
and k and s are discount parameters more positive for steeper discounts.3 The
hyperbolic discount function generates squared multiple correlations of .99 for the
children’s choices and .99 for choices by the college students (reported by Green et al.,
1994:34, which is better than the respective R2 values of .62 and .88 for an exponential
function fit to the data in Figure 1). Hyperbolic discount functions are widely supported
in empirical research (but it is worth noting that most of the research is based on
choices by young people).4 Of course, maturity is more than age. The steepest
3The exponent s is usually not used, but Green et al. (1994) show significant differences
in the exponent between the three age groups in Figure 1, so I include it here. For more detail on hyperbolic discount functions, see the Wikipedia entry, which is clear and thorough.
4All of the articles cited in this section that contain original data on human discounting take their data from children and college students, except Bickel et al. (1999), who describe smokers and non-smokers in their early 30s, Petry (2001), who describes a small convenience sample of
Social Network and Temporal Discounting, 2017-04-26 DRAFT, Page 5
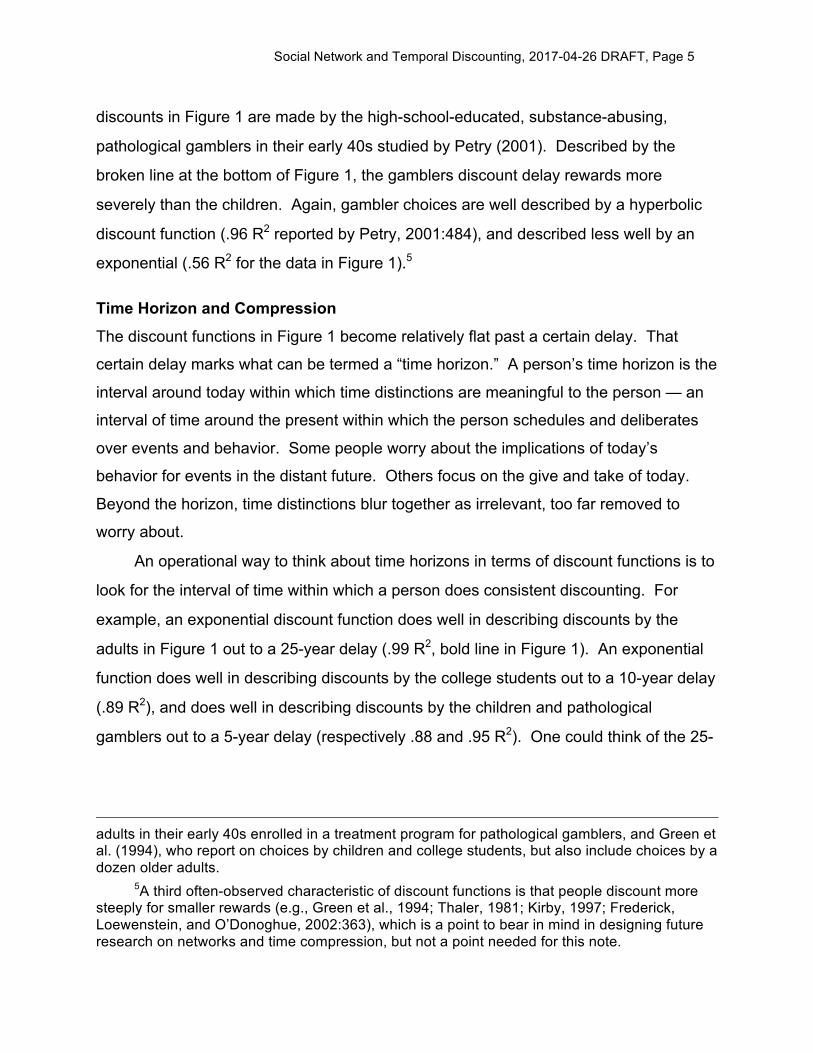
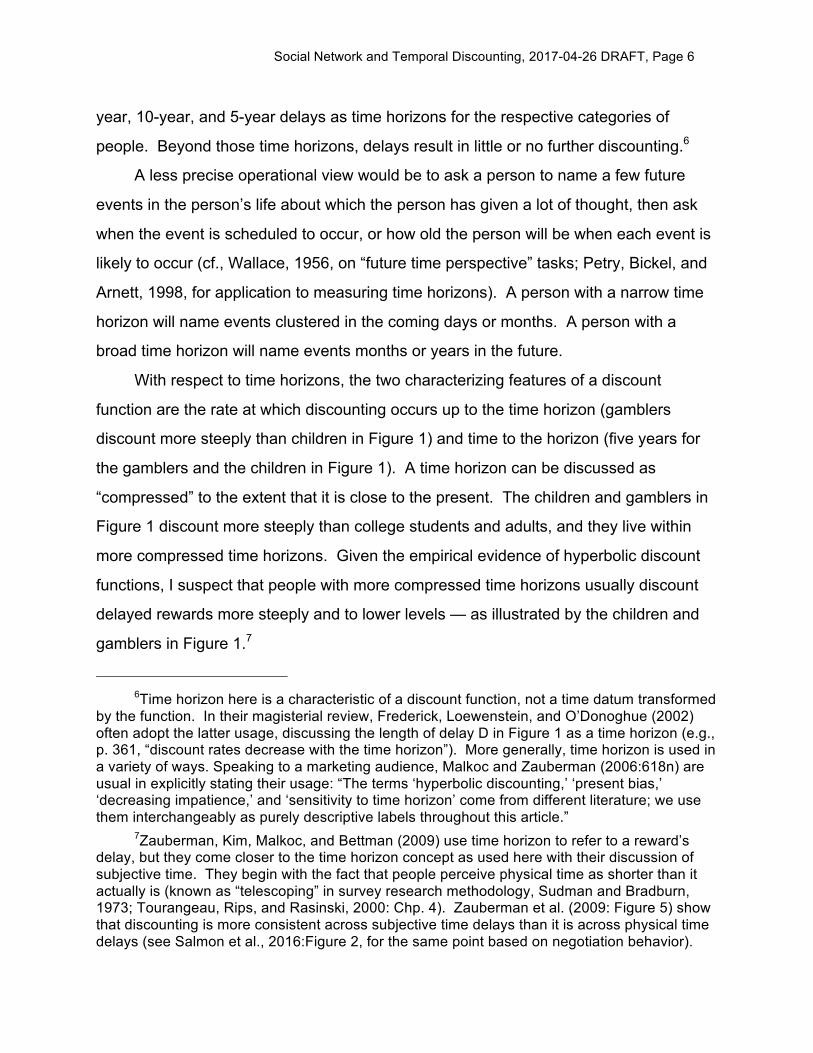
discounts in Figure 1 are made by the high-school-educated, substance-abusing,
pathological gamblers in their early 40s studied by Petry (2001). Described by the
broken line at the bottom of Figure 1, the gamblers discount delay rewards more
severely than the children. Again, gambler choices are well described by a hyperbolic
discount function (.96 R2 reported by Petry, 2001:484), and described less well by an
exponential (.56 R2 for the data in Figure 1).5
Time Horizon and Compression
The discount functions in Figure 1 become relatively flat past a certain delay. That
certain delay marks what can be termed a “time horizon.” A person’s time horizon is the
interval around today within which time distinctions are meaningful to the person — an
interval of time around the present within which the person schedules and deliberates
over events and behavior. Some people worry about the implications of today’s
behavior for events in the distant future. Others focus on the give and take of today.
Beyond the horizon, time distinctions blur together as irrelevant, too far removed to
worry about.
An operational way to think about time horizons in terms of discount functions is to
look for the interval of time within which a person does consistent discounting. For
example, an exponential discount function does well in describing discounts by the
adults in Figure 1 out to a 25-year delay (.99 R2, bold line in Figure 1). An exponential
function does well in describing discounts by the college students out to a 10-year delay
(.89 R2), and does well in describing discounts by the children and pathological
gamblers out to a 5-year delay (respectively .88 and .95 R2). One could think of the 25-
adults in their early 40s enrolled in a treatment program for pathological gamblers, and Green et al. (1994), who report on choices by children and college students, but also include choices by a dozen older adults.
5A third often-observed characteristic of discount functions is that people discount more steeply for smaller rewards (e.g., Green et al., 1994; Thaler, 1981; Kirby, 1997; Frederick, Loewenstein, and O’Donoghue, 2002:363), which is a point to bear in mind in designing future research on networks and time compression, but not a point needed for this note.
Social Network and Temporal Discounting, 2017-04-26 DRAFT, Page 6
year, 10-year, and 5-year delays as time horizons for the respective categories of
people. Beyond those time horizons, delays result in little or no further discounting.6
A less precise operational view would be to ask a person to name a few future
events in the person’s life about which the person has given a lot of thought, then ask
when the event is scheduled to occur, or how old the person will be when each event is
likely to occur (cf., Wallace, 1956, on “future time perspective” tasks; Petry, Bickel, and
Arnett, 1998, for application to measuring time horizons). A person with a narrow time
horizon will name events clustered in the coming days or months. A person with a
broad time horizon will name events months or years in the future.
With respect to time horizons, the two characterizing features of a discount
function are the rate at which discounting occurs up to the time horizon (gamblers
discount more steeply than children in Figure 1) and time to the horizon (five years for
the gamblers and the children in Figure 1). A time horizon can be discussed as
“compressed” to the extent that it is close to the present. The children and gamblers in
Figure 1 discount more steeply than college students and adults, and they live within
more compressed time horizons. Given the empirical evidence of hyperbolic discount
functions, I suspect that people with more compressed time horizons usually discount
delayed rewards more steeply and to lower levels — as illustrated by the children and
gamblers in Figure 1.7
6Time horizon here is a characteristic of a discount function, not a time datum transformed
by the function. In their magisterial review, Frederick, Loewenstein, and O’Donoghue (2002) often adopt the latter usage, discussing the length of delay D in Figure 1 as a time horizon (e.g., p. 361, “discount rates decrease with the time horizon”). More generally, time horizon is used in a variety of ways. Speaking to a marketing audience, Malkoc and Zauberman (2006:618n) are usual in explicitly stating their usage: “The terms ‘hyperbolic discounting,’ ‘present bias,’ ‘decreasing impatience,’ and ‘sensitivity to time horizon’ come from different literature; we use them interchangeably as purely descriptive labels throughout this article.”
7Zauberman, Kim, Malkoc, and Bettman (2009) use time horizon to refer to a reward’s delay, but they come closer to the time horizon concept as used here with their discussion of subjective time. They begin with the fact that people perceive physical time as shorter than it actually is (known as “telescoping” in survey research methodology, Sudman and Bradburn, 1973; Tourangeau, Rips, and Rasinski, 2000: Chp. 4). Zauberman et al. (2009: Figure 5) show that discounting is more consistent across subjective time delays than it is across physical time delays (see Salmon et al., 2016:Figure 2, for the same point based on negotiation behavior).
Social Network and Temporal Discounting, 2017-04-26 DRAFT, Page 7
TIME COMPRESSION AND SOCIAL NETWORK I believe that closed networks compress a person’s time horizon, predisposing them to
steeper discounting. The results in Figure 1 immediately lend face validity to the belief:
Less mature people tend to have more closed networks and in Figure 1 less mature
people have steeper discount functions. Face validity notwithstanding, I come to my
belief by thinking about social logistics and social influence.8
Social logistics concern where people spend time. The more often two colleagues
spend time together, the more likely you will get to know one if you already know the
other. If John and Tim are together all the time, then anyone John meets also meets
Tim. If John and Tim are together once every hour, the odds are still high, but lower,
that John and Tim will meet and build relations with the same third parties. Together
once a day decreases the odds of meeting both John and Tim. Together once a month
decreases the odds still further, and so on. Aggregating across your relationships, the
more connected the colleagues, so as to form a closed network, the more likely you will
meet any one while meeting with another. When I meet with Tim, he has often just
spoken with John, or John is present when I meet with Tim. John always seems to be
explicitly or implicitly present in my meetings with Tim.
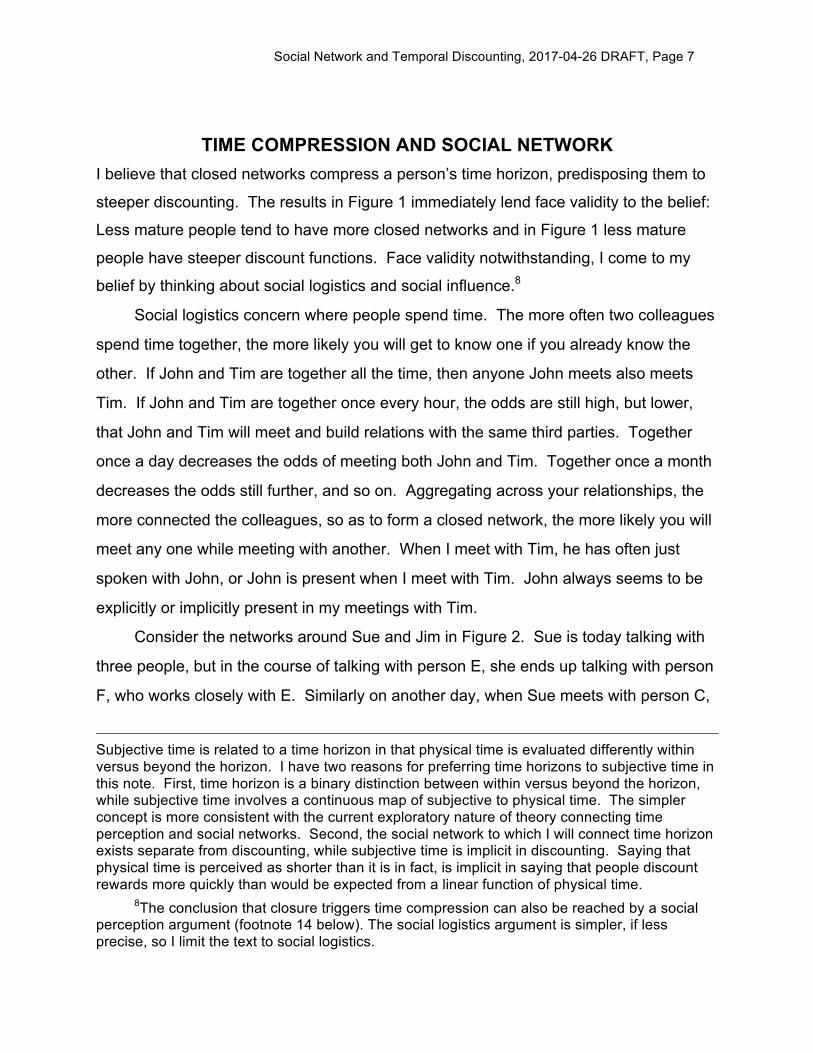
Consider the networks around Sue and Jim in Figure 2. Sue is today talking with
three people, but in the course of talking with person E, she ends up talking with person
F, who works closely with E. Similarly on another day, when Sue meets with person C,
Subjective time is related to a time horizon in that physical time is evaluated differently within versus beyond the horizon. I have two reasons for preferring time horizons to subjective time in this note. First, time horizon is a binary distinction between within versus beyond the horizon, while subjective time involves a continuous map of subjective to physical time. The simpler concept is more consistent with the current exploratory nature of theory connecting time perception and social networks. Second, the social network to which I will connect time horizon exists separate from discounting, while subjective time is implicit in discounting. Saying that physical time is perceived as shorter than it is in fact, is implicit in saying that people discount rewards more quickly than would be expected from a linear function of physical time.
8The conclusion that closure triggers time compression can also be reached by a social perception argument (footnote 14 below). The social logistics argument is simpler, if less precise, so I limit the text to social logistics.
Social Network and Temporal Discounting, 2017-04-26 DRAFT, Page 8
she ends up talking with person D, who works closely with C. Jim has a closed
network. His colleagues are all connected with one another. When Jim meets with any
one of his colleagues, he is likely to hear about, or encounter the others.
——— Figure 2 About Here ———
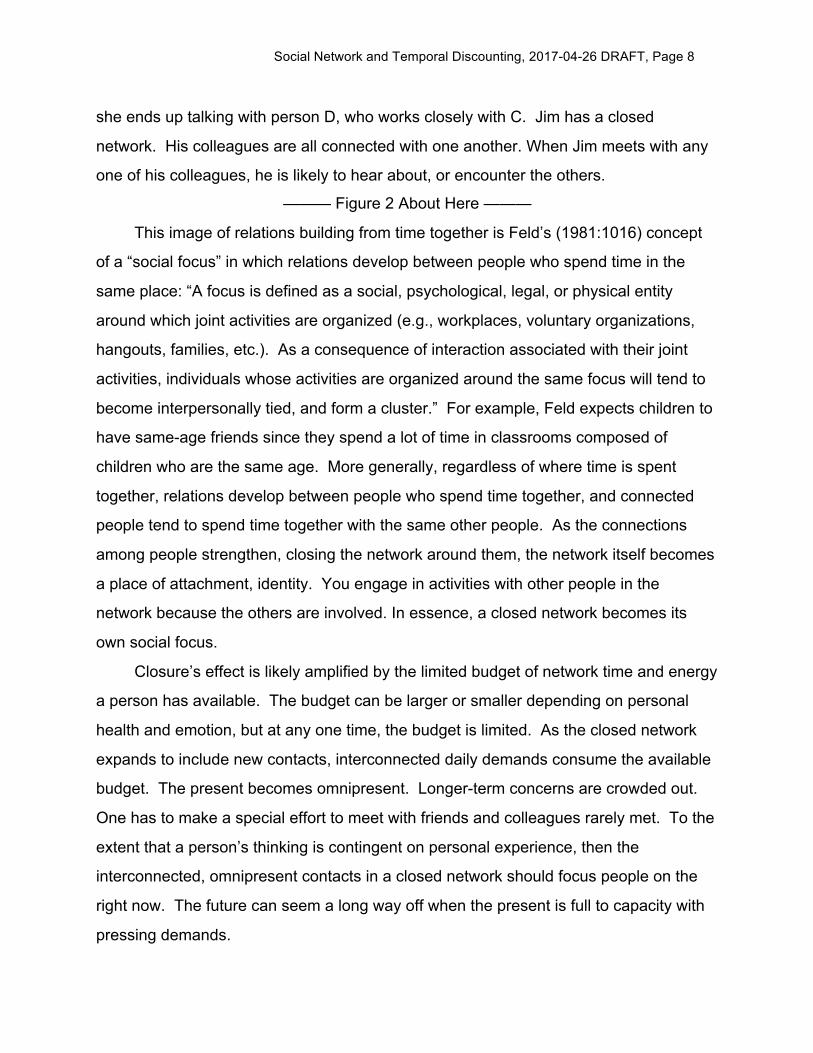
This image of relations building from time together is Feld’s (1981:1016) concept
of a “social focus” in which relations develop between people who spend time in the
same place: “A focus is defined as a social, psychological, legal, or physical entity
around which joint activities are organized (e.g., workplaces, voluntary organizations,
hangouts, families, etc.). As a consequence of interaction associated with their joint
activities, individuals whose activities are organized around the same focus will tend to
become interpersonally tied, and form a cluster.” For example, Feld expects children to
have same-age friends since they spend a lot of time in classrooms composed of
children who are the same age. More generally, regardless of where time is spent
together, relations develop between people who spend time together, and connected
people tend to spend time together with the same other people. As the connections
among people strengthen, closing the network around them, the network itself becomes
a place of attachment, identity. You engage in activities with other people in the
network because the others are involved. In essence, a closed network becomes its
own social focus.
Closure’s effect is likely amplified by the limited budget of network time and energy
a person has available. The budget can be larger or smaller depending on personal
health and emotion, but at any one time, the budget is limited. As the closed network
expands to include new contacts, interconnected daily demands consume the available
budget. The present becomes omnipresent. Longer-term concerns are crowded out.
One has to make a special effort to meet with friends and colleagues rarely met. To the
extent that a person’s thinking is contingent on personal experience, then the
interconnected, omnipresent contacts in a closed network should focus people on the
right now. The future can seem a long way off when the present is full to capacity with
pressing demands.
Social Network and Temporal Discounting, 2017-04-26 DRAFT, Page 9
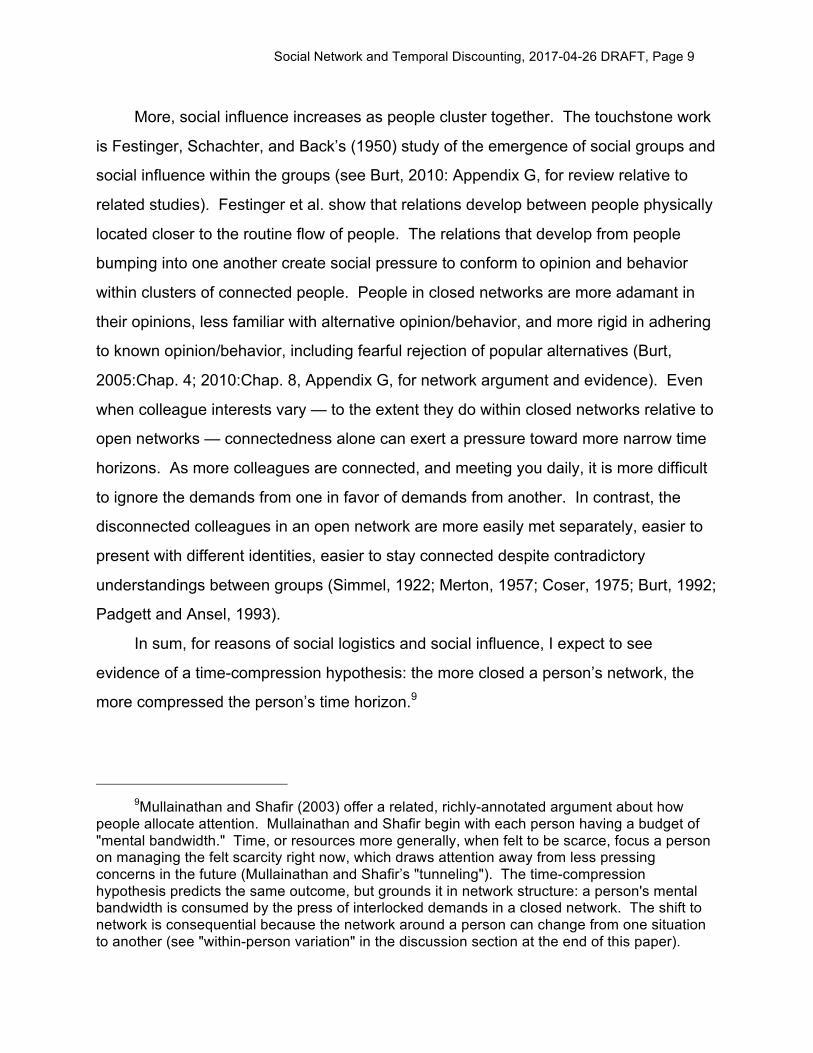
More, social influence increases as people cluster together. The touchstone work
is Festinger, Schachter, and Back’s (1950) study of the emergence of social groups and
social influence within the groups (see Burt, 2010: Appendix G, for review relative to
related studies). Festinger et al. show that relations develop between people physically
located closer to the routine flow of people. The relations that develop from people
bumping into one another create social pressure to conform to opinion and behavior
within clusters of connected people. People in closed networks are more adamant in
their opinions, less familiar with alternative opinion/behavior, and more rigid in adhering
to known opinion/behavior, including fearful rejection of popular alternatives (Burt,
2005:Chap. 4; 2010:Chap. 8, Appendix G, for network argument and evidence). Even
when colleague interests vary — to the extent they do within closed networks relative to
open networks — connectedness alone can exert a pressure toward more narrow time
horizons. As more colleagues are connected, and meeting you daily, it is more difficult
to ignore the demands from one in favor of demands from another. In contrast, the
disconnected colleagues in an open network are more easily met separately, easier to
present with different identities, easier to stay connected despite contradictory
understandings between groups (Simmel, 1922; Merton, 1957; Coser, 1975; Burt, 1992;
Padgett and Ansel, 1993).
In sum, for reasons of social logistics and social influence, I expect to see
evidence of a time-compression hypothesis: the more closed a person’s network, the
more compressed the person’s time horizon.9
9Mullainathan and Shafir (2003) offer a related, richly-annotated argument about how
people allocate attention. Mullainathan and Shafir begin with each person having a budget of "mental bandwidth." Time, or resources more generally, when felt to be scarce, focus a person on managing the felt scarcity right now, which draws attention away from less pressing concerns in the future (Mullainathan and Shafir’s "tunneling"). The time-compression hypothesis predicts the same outcome, but grounds it in network structure: a person's mental bandwidth is consumed by the press of interlocked demands in a closed network. The shift to network is consequential because the network around a person can change from one situation to another (see "within-person variation" in the discussion section at the end of this paper).

Social Network and Temporal Discounting, 2017-04-26 DRAFT, Page 10
DATA I report on the networks around 852 people in three organizations: a computer
manufacturing firm, a financial services firm, and a commercial bank. The constituent
people hold senior positions in their organizations, varying from job ranks just below
direct reports to CEO, down into middle management. I study multiple populations
using multiple methods to protect against idiosyncratic findings. In the financial services
organization, people completed an online survey asking for the names of their
supervisor and up to eight colleagues with whom the respondent had “frequent and
substantive contact” during the previous six months. In the other two organizations,
people completed a printed network booklet that asked for the names of colleagues with
whom the respondent had any of several relations (advice, support, socializing, job
options, etc.; the online and printed name generators are listed in Burt, 2010: 284-286).
Employee records provide some background characteristics on each manager, and a
measure of each manager’s performance in terms of early promotion (in the computer
manufacturer) or compensation (in the other two organizations). The network data are
used to determine the number of mutual friends between manager and cited colleague,
and compute network constraint on each manager, measuring the extent to which a
manager’s network is concentrated in a small, densely-connected group of colleagues
(Burt, 2010:293ff; Burt, Kilduff, and Taselli, 2013). ——— Figure 3 About Here ———
In each population, respondents were asked to indicate the average frequency
with which they met each colleague they named: daily, weekly, monthly or less often.
Figure 3 shows the temporal rhythm of the elicited relationships. In all three
organizations, most cited colleagues were met daily, with a substantial minority of cited
colleagues met monthly or less often. The financial services respondents, responding
to a single name generator, cited the fewest colleagues met monthly or less, but those
few turn out to be sufficient to generate results similar to the results in the other two
organizations.

Social Network and Temporal Discounting, 2017-04-26 DRAFT, Page 11
CLOSURE AND TIME-COMPRESSED ACTIVITY The results in Figure 4 support the time-compression hypothesis at the level of
individual relationships in all three organizations. The horizontal axes in the graphs
distinguish relations by level of closure. The more mutual friends shared by respondent
and cited colleague, the more closed the network around respondent and colleague
(“structural embedding,” Granovetter, 1992:44). A mutual friend is created when
respondent and colleague cite, or are cited by, the same third person. The vertical axis
to the left is the probability that colleagues at each level of closure are met daily. In all
three organizations, the probability of daily contact increases with the number of mutual
friends. The graph to the right in Figure 4 shows the same compression measured by
the number of days between meetings. The vertical axis is the average number of days
that pass between meeting a cited colleague at each level of closure (1 for daily, 7 for
weekly, 30 for monthly or less). Colleagues who share no mutual friends met once a
week, on average, in the computer manufacturer (5.1 days) and financial-services
organization (10.9 days). Between colleagues in those organizations who were
embedded in a network of ten or more mutual friends, frequency increases to every
other day (respectively 1.9 and 1.0 days between contact). In the HR organization,
colleagues with one or no mutual friends met once a month (20.4 days), which
decreases to a couple times a week for colleagues who share more than seven mutual
friends (3.4 days).
——— Figure 4 About Here ———
The strong test statistics in Figure 4 are estimated with fixed-effect controls for
differences between respondents and the three study organizations (to adjust for each
respondent in each organization having his or her own perspective on contact frequency
with colleagues; “clogit” and “areg” routines in STATA). Contact frequency differs in the
three organizations, with days between contact significantly fewer in the financial
services organization (-2.77 t-test, P < .01), but the slopes for increasing frequency with
increasing closure are not significantly different in the three organizations (1.57 and

Social Network and Temporal Discounting, 2017-04-26 DRAFT, Page 12
0.23 t-tests respectively for relations in the computer manufacturer and financial
services organizations, .12 < P < .33).
Closure around a Relationship versus within the Network
Aggregating across a manager’s relationships, Figure 5 shows time compression at the
ego-network level in all three organizations. The graph to the left in Figure 5 shows that
managers in closed networks are more likely to meet their cited colleagues daily. The
fixed effects for managers in Figure 4 can be removed to test for the compression
association with closure around a relationship versus within a manager’s network. The
first and third models in Table 1 contain the results for Figure 4. The second and fourth
models give the results when three manager characteristics replace the fixed effects for
managers: network constraint, manager job rank, and manager age.
Age is included as a crude indicator of how much future remains, or past exists, for
a manager. Older managers have less future to their careers, so they might focus on
the present, creating a positive correlation between age and daily contact with key
colleagues. Or, since older managers have more history, they are more likely to have
long-standing relationships, creating a negative correlation between age and daily
contact with key colleagues. The negligible associations with age in Table 1 offer no
encouragement for either possibility.
Holding constant the number of mutual friends to manager and cited colleague,
managers with more closed networks (higher constraint) are more likely to meet their
colleagues daily (2.83 z-score test statistic, P ~ .01), and pass fewer days without
meeting their colleagues (-3.60 t-test, P < .001). However, the compression into daily
activity is more about closure around a relationship than it is about closure on average
across a manager’s relationships. Frequent contact with a colleague is more closely
associated with having mutual friends than it is with closure overall (respective test
statistics of 8.98 versus 2.83 for probability of daily contact, -9.49 versus -3.60 for
number of days between contacts with the colleague).
——— Figure 5 and Table 1 About Here ———

Social Network and Temporal Discounting, 2017-04-26 DRAFT, Page 13
Closure and Compression in Kinds of Networks
For the graph to the right in Figure 5, closure is measured in terms of kinds of networks.
Large, open networks around network brokers are distinguished from open networks
disproportionately concentrated in one colleague (partner networks) versus closed
networks constituting a single group (clique networks). The three kinds of networks are
often distinguished because they provide distinct advantages. Large, open networks
are associated with achievement while cliques provide trust, but at a cost of low or
average achievement (Burt, Kilduff, and Tasselli, 2013). Partner networks are a
disadvantage to people accepted as insiders, but a significant advantage to outsiders
trying to be accepted by insiders (Burt, 2010: Chap. 7). The kinds of networks are
distinguished by dividing network constraint at its median value within each
organization. High-constraint managers are in cliques. Low-constraint managers are
brokers. Managers in partner networks are then distinguished as anyone
disproportionately constrained by one colleague (hierarchy score higher than the
median within their organization, Burt, 1992: 143).
The time-compression argument contrasts large, open broker networks with small,
closed clique networks. Partner networks — which are in some ways open and in some
ways closed — are not distinguished in the argument. With respect to contact
frequency, Figure 5 shows that partner networks resemble broker networks more than
cliques. Managers in broker and partner networks are equally likely to meet cited
colleagues daily (0.11 t-test, P ~ .91) — controlling for differences between the
organizations (F2,826 = 12.22, P < .001), and less-prevalent daily contacts around
managers in more senior job ranks (-5.64 t-test, P < .001). Managers in cliques are the
managers most likely to meet their cited colleagues daily (2.82 t-test, P < .01), and least
likely to meet them monthly or less (-4.59 t-test, P < .001).
Closure and Time Compression Independent of Job Rank
The controls for job rank warrant emphasis. This note is about the extent to which
social situations make demands of people that shape their thinking about time. In a
large organization, job rank defines much of a person’s situational rights and
obligations, and has a predictable association with time horizon. The central tenet in
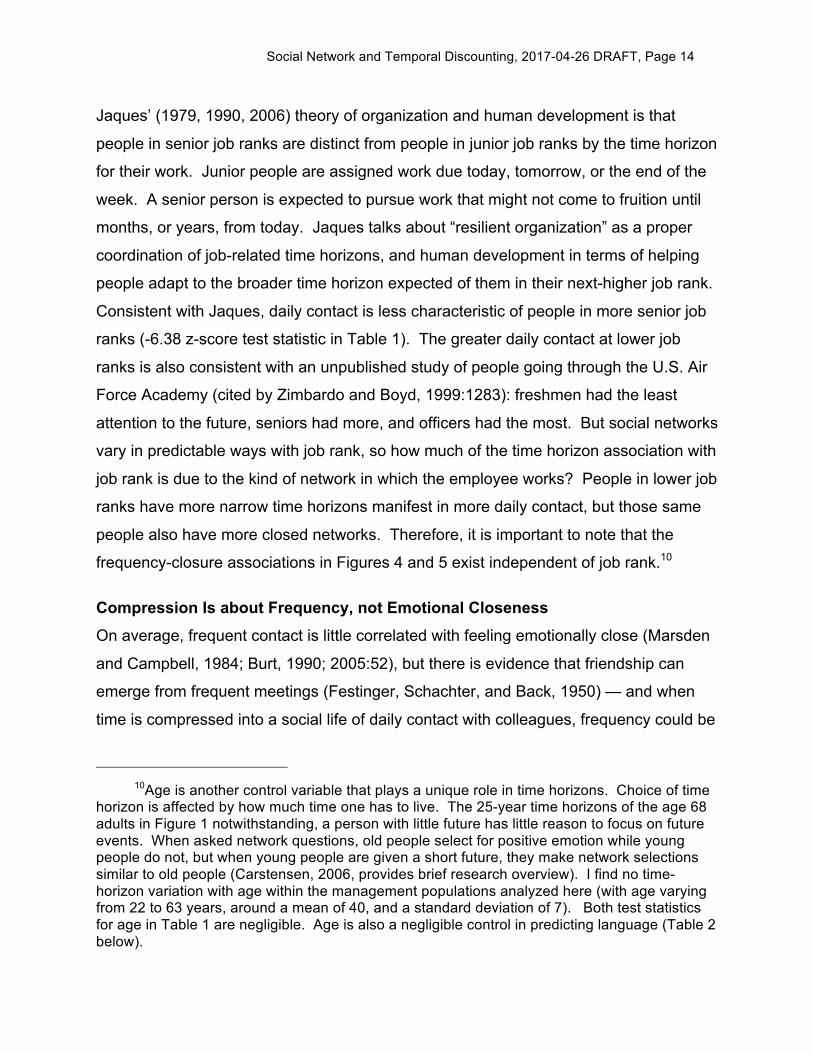
Social Network and Temporal Discounting, 2017-04-26 DRAFT, Page 14
Jaques’ (1979, 1990, 2006) theory of organization and human development is that
people in senior job ranks are distinct from people in junior job ranks by the time horizon
for their work. Junior people are assigned work due today, tomorrow, or the end of the
week. A senior person is expected to pursue work that might not come to fruition until
months, or years, from today. Jaques talks about “resilient organization” as a proper
coordination of job-related time horizons, and human development in terms of helping
people adapt to the broader time horizon expected of them in their next-higher job rank.
Consistent with Jaques, daily contact is less characteristic of people in more senior job
ranks (-6.38 z-score test statistic in Table 1). The greater daily contact at lower job
ranks is also consistent with an unpublished study of people going through the U.S. Air
Force Academy (cited by Zimbardo and Boyd, 1999:1283): freshmen had the least
attention to the future, seniors had more, and officers had the most. But social networks
vary in predictable ways with job rank, so how much of the time horizon association with
job rank is due to the kind of network in which the employee works? People in lower job
ranks have more narrow time horizons manifest in more daily contact, but those same
people also have more closed networks. Therefore, it is important to note that the
frequency-closure associations in Figures 4 and 5 exist independent of job rank.10
Compression Is about Frequency, not Emotional Closeness On average, frequent contact is little correlated with feeling emotionally close (Marsden
and Campbell, 1984; Burt, 1990; 2005:52), but there is evidence that friendship can
emerge from frequent meetings (Festinger, Schachter, and Back, 1950) — and when
time is compressed into a social life of daily contact with colleagues, frequency could be
10Age is another control variable that plays a unique role in time horizons. Choice of time
horizon is affected by how much time one has to live. The 25-year time horizons of the age 68 adults in Figure 1 notwithstanding, a person with little future has little reason to focus on future events. When asked network questions, old people select for positive emotion while young people do not, but when young people are given a short future, they make network selections similar to old people (Carstensen, 2006, provides brief research overview). I find no time-horizon variation with age within the management populations analyzed here (with age varying from 22 to 63 years, around a mean of 40, and a standard deviation of 7). Both test statistics for age in Table 1 are negligible. Age is also a negligible control in predicting language (Table 2 below).

Social Network and Temporal Discounting, 2017-04-26 DRAFT, Page 15
an indicator of who is in and who is out. I looked for evidence of frequency and
closeness more strongly correlated in closed networks than in open networks. The
correlation between emotional closeness and contact frequency is not consistent across
companies, and within a company, the correlation is similar for relations in open and
closed networks. In short, social life compressed into daily activity does not mean
emotion is compressed.
CLOSURE AND TIME-COMPRESSED LANGUAGE To the extent that language follows activity, time compressed into daily activities can be
expected to manifest in language focused on the present. When right now is the focus
of attention, language describes current activity more than it describes activity in the
distant future, a future seeming “distant” in the context of a narrowed time horizon. To
the extent that social events in closed networks are more compressed into daily activity,
I expect the language used by people in closed networks to be more focused on the
present. I expect the closure-language association not only because a larger proportion
of social events occur daily for people in closed networks, but also because the present
is the lens through which future and past are viewed in closed networks.11
I have text data from the 351 managers in the financial services organization. In
the online network survey, a respondent received one of two questions asking for a brief
text. Question assignment was random. The people sponsoring the survey were
interested in creativity and innovation, so about three quarters of the managers (73%)
were asked for an idea to improve the organization: “What is the most significant thing
11Using language to measure future discounting is not a new idea, but prior work, to my
knowledge, has involved only rudimentary use of text. Ainslie’s (1975) review cites two prior studies of language and discounting, both of which focus on the time spanned by a text, rather than the text content (Barndt and Johnson, 1955; Davids, Kidder, and Reich, 1962). Frederick, Loewenstein, and O’Donoghue (2002) make no mention of language. The most sophisticated language analysis, again to my knowledge, is by Chen (2013) who uses weather forecasts to confirm a linguistics distinction between languages that integrate the future with the present (e.g., German) versus languages in which the future is sharply distinguished from the present (“strong future-time reference,” e.g., English), then uses the linguistic distinction to show that behavioral correlates of future discounting are higher in countries in which the native language sharply distinguishes future from present.
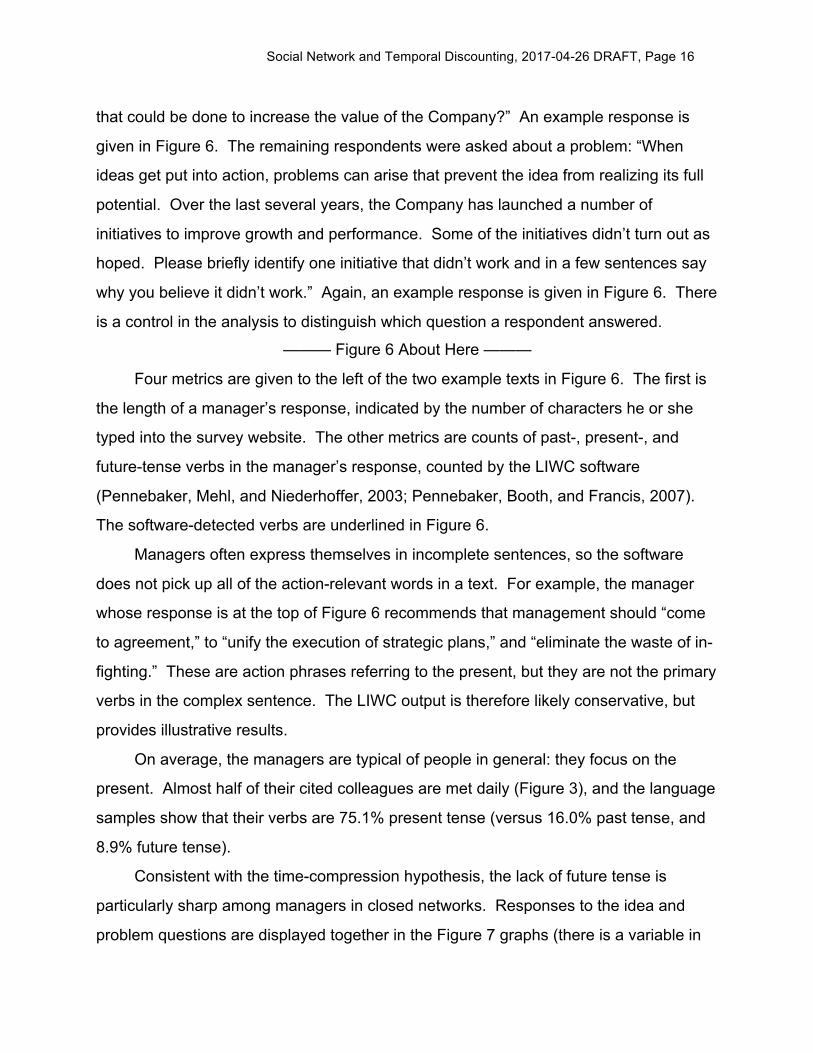
Social Network and Temporal Discounting, 2017-04-26 DRAFT, Page 16
that could be done to increase the value of the Company?” An example response is
given in Figure 6. The remaining respondents were asked about a problem: “When
ideas get put into action, problems can arise that prevent the idea from realizing its full
potential. Over the last several years, the Company has launched a number of
initiatives to improve growth and performance. Some of the initiatives didn’t turn out as
hoped. Please briefly identify one initiative that didn’t work and in a few sentences say
why you believe it didn’t work.” Again, an example response is given in Figure 6. There
is a control in the analysis to distinguish which question a respondent answered.
——— Figure 6 About Here ———
Four metrics are given to the left of the two example texts in Figure 6. The first is
the length of a manager’s response, indicated by the number of characters he or she
typed into the survey website. The other metrics are counts of past-, present-, and
future-tense verbs in the manager’s response, counted by the LIWC software
(Pennebaker, Mehl, and Niederhoffer, 2003; Pennebaker, Booth, and Francis, 2007).
The software-detected verbs are underlined in Figure 6.
Managers often express themselves in incomplete sentences, so the software
does not pick up all of the action-relevant words in a text. For example, the manager
whose response is at the top of Figure 6 recommends that management should “come
to agreement,” to “unify the execution of strategic plans,” and “eliminate the waste of in-
fighting.” These are action phrases referring to the present, but they are not the primary
verbs in the complex sentence. The LIWC output is therefore likely conservative, but
provides illustrative results.
On average, the managers are typical of people in general: they focus on the
present. Almost half of their cited colleagues are met daily (Figure 3), and the language
samples show that their verbs are 75.1% present tense (versus 16.0% past tense, and
8.9% future tense).
Consistent with the time-compression hypothesis, the lack of future tense is
particularly sharp among managers in closed networks. Responses to the idea and
problem questions are displayed together in the Figure 7 graphs (there is a variable in
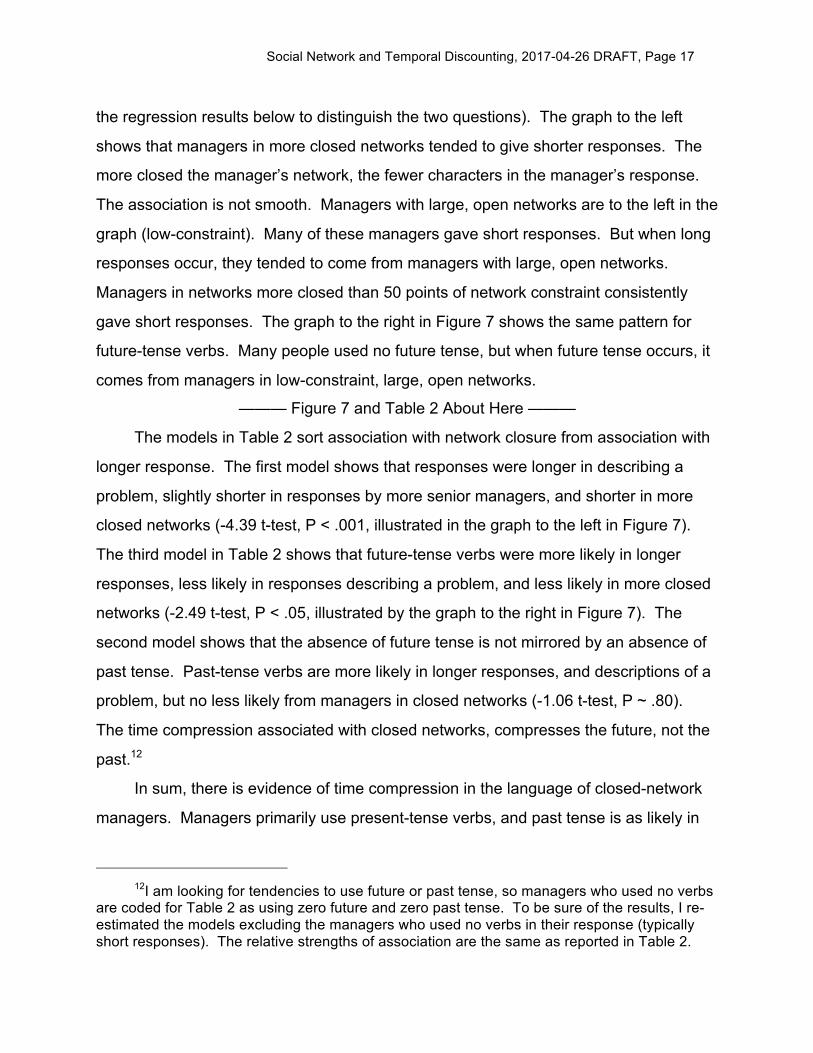
Social Network and Temporal Discounting, 2017-04-26 DRAFT, Page 17
the regression results below to distinguish the two questions). The graph to the left
shows that managers in more closed networks tended to give shorter responses. The
more closed the manager’s network, the fewer characters in the manager’s response.
The association is not smooth. Managers with large, open networks are to the left in the
graph (low-constraint). Many of these managers gave short responses. But when long
responses occur, they tended to come from managers with large, open networks.
Managers in networks more closed than 50 points of network constraint consistently
gave short responses. The graph to the right in Figure 7 shows the same pattern for
future-tense verbs. Many people used no future tense, but when future tense occurs, it
comes from managers in low-constraint, large, open networks.
——— Figure 7 and Table 2 About Here ———
The models in Table 2 sort association with network closure from association with
longer response. The first model shows that responses were longer in describing a
problem, slightly shorter in responses by more senior managers, and shorter in more
closed networks (-4.39 t-test, P < .001, illustrated in the graph to the left in Figure 7).
The third model in Table 2 shows that future-tense verbs were more likely in longer
responses, less likely in responses describing a problem, and less likely in more closed
networks (-2.49 t-test, P < .05, illustrated by the graph to the right in Figure 7). The
second model shows that the absence of future tense is not mirrored by an absence of
past tense. Past-tense verbs are more likely in longer responses, and descriptions of a
problem, but no less likely from managers in closed networks (-1.06 t-test, P ~ .80).
The time compression associated with closed networks, compresses the future, not the
past.12
In sum, there is evidence of time compression in the language of closed-network
managers. Managers primarily use present-tense verbs, and past tense is as likely in
12I am looking for tendencies to use future or past tense, so managers who used no verbs
are coded for Table 2 as using zero future and zero past tense. To be sure of the results, I re-estimated the models excluding the managers who used no verbs in their response (typically short responses). The relative strengths of association are the same as reported in Table 2.
Social Network and Temporal Discounting, 2017-04-26 DRAFT, Page 18
closed networks as in open networks. But future tense, which is not often used by
managers, is especially absent in the language of managers in closed networks.
WHAT ABOUT DISCOUNT FUNCTIONS? I have no data on discount functions in the above organizations. The results presented
above are consistent with people in closed networks experiencing time compression,
but the direct evidence would be a graph of discount functions, like Figure 1, comparing
people in closed versus open networks. Closed-network people should make steeper
discounts within a more narrow time horizon.
Pending authoritative research, I have illustrative evidence consistent with the
time-compression hypothesis. Executive M.B.A. students (EMBAs) in a leadership
class were given an opportunity to receive a report on their social network. Fifty took
the opportunity, and were sent to Martin Gargiulo’s social capital website
(https://executive-tools.insead.edu/socialcapital). Each person’s network is constructed
from multiple name generators (similar to the ones in Burt, 1992:123), and a matrix
name interpreter item similar to the one used in the General Social Survey elicits data
on connections between cited colleagues. With each relationship measured from 1.0
for “very close” across levels down to 0.0 for “distant,” closure in a person’s network is
measured by the average strength of connection between cited colleagues (“ncoh” in
Professor Gargiulo’s website output). Scores multiplied by 100 can vary from zero, for a
network of disconnected colleagues, up to 100 for a network of colleagues all very close
with one another. The 50 EMBA students were in a class on management networks, so
they were primed to think about network brokers, which is reflected in low network
density scores (8 to 40, around a mean of 18). The students were diverse: varying
across their thirties and forties (39 mean), two thirds men, from a variety of countries
with a concentration from the US (38%) and another from Russia (20%). Some worked
in small firms (42%, with less than 1,000 employees a natural break in the data). Some
worked in large firms (26%, with more than 50,000 a natural break in the data).
The 50 students were directed to a second website, displayed to the left in Figure
8, to measure discount functions. A bond worth $10,000 at maturity could be sold today

Social Network and Temporal Discounting, 2017-04-26 DRAFT, Page 19
for cash. For each of ten time delays to bond maturity, students moved the slider at the
bottom of the screen to indicate how much cash they would want today in exchange for
the bond. The ten delays were 1 month, 6, 12, 18, 36, 60, 108, 120, 180, and 300
months, the same broad frame of reference used by Green et al. (1994) to define the
discount functions in Figure 1.
——— Figure 8 and Table 3 About Here ———
Median values are plotted in the graph to the right in Figure 8, showing that
students in more closed networks were steeper and deeper with their discounts.
Regression equations in Table 3 show that closure acts as a multiplier, amplifying a
person’s exponential discount function.
The first two models in Table 3 use closure measured by the low-moderate-high
distinction in Figure 8 — with high equal to 1 and low equal to -1, so the coefficient for
delay describes discounting by students in networks with the middle level of closure.
The low and high categories are respectively students in the bottom third of the density
distribution and the top third of the distribution. The coefficients in the first column of the
table show a substantial discount by students in the middle category, and a statistically
significant increase in the discount as the network of colleagues around a student
becomes more closed. The second column in the table includes controls for some
student differences. Level of closure is a negligible effect in the second column
because the effect is measured at a delay of zero, when people differ little in their
discounting. Student age, gender, nationality, and size of employer organization are
irrelevant. The primary predictors continue to be time delay and network closure. The
third and fourth columns in Table 3 use the continuous measure of closure as a
deviation score from its mean level, so the coefficient for delay describes discounting at
the average level of closure. Results in the third and fourth columns are consistent with
the results in the first and second columns.
The evidence in Figure 8 is only illustrative. The students are a convenience
sample of people enrolled in a business school that emphasizes accounting and
finance. More, the students are in the middle of a two-year program. They are still
Social Network and Temporal Discounting, 2017-04-26 DRAFT, Page 20
optimistic about their careers after graduation. These same students are likely to feel
more uncertain next year, when they are on the job market. The social situation in
which students did their discounting might account for the fact that the discounts in
Figure 8 are all well described by exponential discount functions, and none of the
students showed discount functions as steep as the ones in Figure 1 below senior
adults. Regardless, the students differ as predicted in their discounting: The more
interconnected the colleagues, the steeper and deeper the discount function.13
13An alternative specification yielding similar results is to model closure’s association with
discounting as a social perception (rather than a consequence of social logistics). Closure makes social comparisons within the group more obvious and more likely to be enforced, so people in a closed network are more likely to be afraid of feeling foolish, or of being in some way less than their peers (see Burt, 2010:Chp. 8, on “bent preferences” and the fear hypothesis). A person in an open network, is structurally distinct from his colleagues, and is therefore less exposed to detrimental social comparison since peers are less obvious. A scalar weight, W, varies from zero to one measuring the extent to which a person is structurally unique (see Burt, 2010:247ff.). A person’s structural uniqueness is high to the extent that the person’s pattern of relations is unique. Sue in Figure 2 has a unique pattern of relations; none of her colleagues have a pattern of relations like Sue’s. For Sue, W is listed in Figure 2 as equal to one. A person’s structural uniqueness is low to the extent that the person’s pattern of relations is similar to others. Jim in Figure 2 has a pattern of relations identical to the patterns in which his colleagues are involved. For Jim, W equals zero.
Suppose people generally use an exponential discount function, but make more severe discounts when making evaluations from within a closed network. The exponential function introduced in Figure 1, V = ae-bD, could be modified to include W as a multiplier to adjust for network closure around the person making an evaluation: V = ae-bDecW, where coefficient c will be positive to describe less discounting by a person in a less closed network, which is to say less discounting by a person who is more structurally unique.
Let one minus the closure measure in Table 3 be an indicator of W; high values of closure indicate low structural uniqueness. When I regress the natural log of value in Table 3 across time (in months) and structural uniqueness (W), discounting is more severe for longer delays (b = -.005, t = 11.10, P < .001) and less severe for more structurally unique individuals (c = 1.52, t = 3.46, P < .001). Test statistics for the estimates are adjusted for autocorrelation between evaluations by the same person. The squared multiple correlation is .58, which is only slightly lower than the R2 values in Table 3. This W specification is attractive for its simplicity, but I put the speculation in a footnote, rather than the text, because all three of the discount functions for the EMBA students are exponential. I suspect that the W multiplier will not work as well in a population with less than EMBA finance training. Still, there is merit to the speculation. The hyperbolic discount functions in Figure 1 are very similar in shape to the relative deprivation curves predicted by bent preferences (Figure 1 versus Burt, 2010:235). I suspect there will be rewards to studying discount functions in terms of social perception (which follows in the steps of Zauberman et al., 2009, who measure delay, D, in perceived, subjective, time rather than physical time).

Social Network and Temporal Discounting, 2017-04-26 DRAFT, Page 21
TIME COMPRESSION AND NETWORK ADVANTAGE There is reason to suspect time compression weakens manager performance. Most
obviously, managers are hired to look to the future, not bury their heads in the present.
One can imagine the difficulty created by time horizons inconsistent between managers
trying to coordinate informally in creating strategy (Orlikowski and Yates, 2002; Gavetti
and Rivkin, 2007; Kaplan, 2008; Kaplan and Orlikowski, 2013; Pentland, Recker, and
Wyner, 2017), but available empirical work is richly descriptive, directing scholarly
attention to time management more than providing hypotheses about time horizon and
performance (for something of an exception, see Briscoe, 2007, on operations improved
by physicians handing off patients to one another within more narrow time horizons).
Fortunately, there is empirical evidence on non-managers from which inference
about manager performance can be drawn. Discounting is sometimes discussed as a
performance-enhancing adaptive response to a risky environment (Kagel, Green, and
Caraco, 1986), or a function of multiple selves — who I am now is separate from who I
will be later (Parfit, 1984; Gould, 2003; Bartels and Rips, 2010; Bartels and Urminsky,
2011; cf., Chen, 2013). But most often, people who steeply discount the future are
discussed as flawed: immature, impatient, impulsive, lacking self-control and the ability
to delay gratification. Economist Strotz (1955-56:177) opines: “My own supposition is
that most of us are ‘born’ with discount functions of the sort considered here . . .
Children are known to discount the future most precipitously and the ‘virtue’ of frugality
is something to be instilled when building ‘character.’” Psychologist Ainslie’s (1975)
review, which is often cited in work on discounting, is a discussion of impulsiveness, in
which Ainslie finds discounting a useful operational lens for studying impulsive choices.
The character flaws inferred from discounting have unattractive performance
correlates. Students less focused on the future are less likely to have high grade point
averages or study persistence in high school (Teahan, 1958; De Volder and Lens,
1982) and in college (O’Rand and Ellis, 1974; Kirby, Winston, and Santiesteban, 2005).
Steep discounters are more likely to be problem drinkers (Vuchinich and Simpson,
1998), with high percentages of body fat (Rasmussen, Lawyer, and Reilly, 2010), who
Social Network and Temporal Discounting, 2017-04-26 DRAFT, Page 22
smoke (Bickel, Odum, and Madden, 1999), have a pathological interest in gambling
(Petry, 2001), and do less well in negotiations (Salmon et al., 2016). The Stanford
Marshmallow Experiment is a well-known illustration of the returns to being able to
delay gratification (Mischel and Ebbesen, 1970; Shoda, Mischel, and Peake, 1990).
Pre-school children are brought into a laboratory and presented with two treats (cake,
marshmallow, pretzel), one the child preferred to the other. The experimenter is called
away briefly. The children are told that they can eat the less-preferred treat now, or wait
until the experimenter returns, whereupon the child can eat both the less-preferred and
the preferred treat. Some children eat the less-preferred treat as soon as the
experimenter left the room. Some wait, delaying immediate gratification to obtain future
reward. Years later, those children who waited had higher verbal and quantitative
Scholastic Aptitude Test (SAT) scores for their college applications, along with higher
adult evaluations of their ability to manage frustration and resist temptation.
Given a negative association between time compression and performance, and a
positive association between time compression and network closure, it is reasonable to
ask how much time compression contributes to the well-known negative association
between closure and performance. To answer the question, I have a score measuring
achievement by each of the 832 managers relative to peers in their organization. In the
financial services organization, I predicted a respondent’s annual compensation from
variables in the company personnel records that predicted compensation (respondent
age, gender, job rank, job function, business unit, and office location). The studentized
residual from the regression is a measure of achievement relative to peers. It measures
the extent to which a particular manager was paid more than peer managers in the
same organization, at the same job rank, doing the same work, in the same business
unit, etc. Similar z-scores were obtained for people in the other two organizations, as
reported elsewhere (Burt, 1992:Chap. 4, on managers in the computer manufacturer;
Burt, 2010:Chap. 4, on the HR managers).
Achievement by these managers has the usual association with network measures
of advantage: achievement in larger, more open networks is higher on average than
Social Network and Temporal Discounting, 2017-04-26 DRAFT, Page 23
achievement by mangers in smaller, more closed networks (for review, see Burt, Kilduff,
and Taselli, 2013). The performance scores are correlated -.42 with log network
constraint, which measures the extent to which a manager’s network is concentrated in
one group (-13.07 t-test, P < .001), .44 with effective size, which is the number of a
manager’s non-redundant contacts (14.04 t-test, P < .001), and .45 with ego-network
betweenness, which is a count of the structural holes to which the manager has
exclusive access within his or her ego network (14.16 t-test, P < .001).
And now the question answered: Time compression has no mediating effect on
the association between achievement and network advantage. I distinguished
managers subject to the most and the least time compression. Within each of the three
organizations, I found managers in the top quartile of daily contact with colleagues
(vertical axis of graph to the left in Figure 5). These top quartile managers are the most
exposed to time compression. At the other extreme, I located the managers in the
bottom quartile of daily contact with colleagues to distinguish people least exposed to
time compression. Across the 832 managers, with firm fixed-effects, relative
achievement decreases with increasing network constraint (-5.11 t-test, P < .001), a
slightly weaker association is negligibly different for the top quartile of managers with
the least daily contact (dashed line, 0.49 t-test, P ~ .62), and a slightly stronger
association is negligibly different for the top quartile of managers who most often report
daily contact with key colleagues (-1.16 t-test, P ~ .25).14
CONCLUSION AND DISCUSSION For reasons of social influence and social logistics, people in closed networks are
expected to experience time compression: The more closed a person’s network, the
14The information advantages provided by large, open networks are distinct from the trust
advantages provided by closed networks. The trust and stability provided by closed networks spill over between adjacent networks, while the advantages of brokerage do not (Burt, 2010). Accordingly, time compression in closed networks could be consequential for trust and collaboration in ways not apparent from the results presented here showing no mediation effect on the association between achievement and large, open networks.
Social Network and Temporal Discounting, 2017-04-26 DRAFT, Page 24
steeper the person’s discount function and the more narrow the expected time horizon
within which the person deliberates events and behavior. Consistent with the
hypothesis, data on managers in three organizations show network closure associated
with a social life compressed into daily contact with colleagues. Further, language in
closed networks is predominantly about current activities, ignoring the future. Further
still, discount functions employed by executive MBA students show more severe
discounting by students in more closed networks. Inattention to the future can be
argued to impair achievement, however, I find no evidence across the managers of daily
contact diminishing the achievement associated with network advantage. I close with
comments on replication and extensions in future research.
Compression in Activity
The association between closure and daily contact is an obvious and easy result to
replicate given the many data sets in which both measures are available. Social life
compressed into daily activities seems a likely characteristic of closed networks, given
the strong results in Figures 3 and 4. More, closure and daily contact likely enhance
one another. Daily contact with colleagues is more likely in closed networks, but if you
meet daily with colleagues, the colleagues are likely to bump into one another when
they’re meeting with you. Their encounters with one another increase the likelihood of
friendships between the colleagues, which further closes the network around you.
There should be evidence of contagion in interpersonal activity. The more strongly two
colleagues are connected, the more likely that activity with one co-occurs with activity
with the other (Figure 2). In contrast, when a network broker engages a project, social
activity will be high in project-relevant relations, but low in relations irrelevant to the
project. Beyond the usual sociometric data, do more accurate data on location show
people in closed networks more often adjacent in time and space? (See Pentland, 2008,
on the “sociometer.”)
Compression in Language
I have limited text for this analysis. Does the lack of future tense replicate in richer
samples of text? In Table 2, a manager’s use of future tense is predicted by response
Social Network and Temporal Discounting, 2017-04-26 DRAFT, Page 25
length more than by closure in the manager’s network (t-tests of 4.29 versus -2.40
respectively). Future-tense verbs are a smaller proportion of the verbs in a shorter
response, and people in closed networks make shorter responses. If the prediction in
Table 2 is limited to responses longer than average, future-tense verbs are still
significantly missing in closed networks (-1.98 t-test for network constraint across the
174 managers who gave responses longer than the median response), but the long-
response managers are less likely to be in closed networks and freely chose to give
longer responses. It remains to be seen whether future tense is significantly absent in
longer text samples drawn from a representative sample of closed-network managers.
Does the lack of future tense in closed networks correlate with other aspects of
language that could be used to study time compression? Using the LIWC software
output analyzed here, for example, Ireland et al. (2011) measure the extent to which two
people have similar “language styles” where style is indicated by a person’s use of
language elements generally used in a non-conscious fashion. Ireland et al. report that
similar language style increases the odds of two college students developing a romantic
relationship. Controlling for a person’s baseline style, Danescu-Niculescu-Mizel et al.
(2012) report from LIWC output that lawyers arguing a case before a Supreme Court
Justice known to be predisposed against the lawyer’s case change their language style
to coordinate with the Justice’s style, and Justices predisposed toward a lawyer’s case
adjust their language style to coordinate with the lawyer’s style. Using the same LIWC
dimensions of language style, Romero et al. (2015) analyze the transcripts of U.S.
presidential debates to show that standing in the polls increased for the candidate who
best matched the average language style of other participants in the debate.
To explore the possibility of such a language style in closed networks, I generated
scores from LIWC for each manager text on the nine dimensions of language style in
Ireland et al. (2011:Table 1). Table 4 contains mean scores on each dimension for
closed-network managers versus other managers. Closed-network managers for this
illustration are managers with 60 or more points of network constraint (Figure 7 shows a
sharp difference in text length and use of future tense for managers with more than 60
points of constraint). Closed-network managers are distinct in Table 4 for their
Social Network and Temporal Discounting, 2017-04-26 DRAFT, Page 26
infrequent use of pronouns. The distinction is visible in their use of personal and
impersonal pronouns, but the combination is more obvious: closed-network managers
use about a third of the pronouns used by other managers.
——— Table 4 About Here ———
The idea that few pronouns and little future tense are similarly associated with
closed networks raises the question of how pronouns might be symptomatic of time
compression, or some other quality of life in closed networks. For example, do closed-
network managers more often name individuals in their arguments, thereby lowering
their need for pronouns? Given the value put on coordinating language style, especially
when trying to convert a skeptic to one’s view, are closed-network managers
disadvantaged by an inability to adapt their language style to a target person? Text
length again matters for the language evidence. The proportion of a manager’s words
that are stylistic increases with the length of a manager’s text (response length in terms
of characters is held constant for the Table 4 statistical results). Might the results in
Table 4 be stronger with richer text from the managers? Also, I do not have a
language-style baseline for each manager. A strength in Danescu-Niculescu-Mizel et
al.’s (2012) analysis of language styles is their use of a baseline. A speaker’s typical
language style is a baseline for studying the speaker’s language style with a target
person. Suppose John uses an average amount of future tense in his Table 2 text.
Average is a lot if John in the past used no future tense. Average is little if John in the
past used a lot of future tense. Establishing a baseline for each manager requires text
across time and context, which is more than was available for the analysis here.
Within-Person Variation An exciting implication of the link between time compression and network closure is that
variation in discounting could be due to differences in the social situations in which
individuals find themselves, rather than differences between individuals. A person
should exhibit time compression when in a closed network, but less time compression
when in an open network. A person could have an open network in their profession that
encourages thinking about long-term work issues, but a closed network in their personal

Social Network and Temporal Discounting, 2017-04-26 DRAFT, Page 27
life that compresses time to the exclusion of the future. Or, a person with a closed
network in the office that results in a focus on daily responsibilities could have long-term
relations in their kinship network so the person attends to family events over a broad
time horizon. Beyond replicating the steeper discounts associated with closed
networks, especially telling support for the time-compression hypothesis would be
evidence of within-person variation in discount functions when choices are evaluated in
more and less closed networks. This isn’t to say that people move instantly in and out
of time compression — there must be habits built up if a person is in the same kind of
situations again and again, but people who shift from a closed to open network, or vice
versa, should show predictable change in time-compressed activities and language.
I infer from Table 1 that within-person variation will be substantial since contact
frequency increases with closure around relationships despite fixed-effects controls for
closure differences between respondents. However, the table describes cross-sectional
data. More compelling within-person evidence would come from seeing change over
time in an individual’s tendency toward daily contact and away from future tense as the
individual moved in and out of closed networks.15 On the same time theme, how strong
is the language association with closure using bits of text obtained closer to the moment
of interaction within the closed network, versus beyond the network? (See Mehl, 2012,
for a text analogue to Pentland’s sociometer.)
15Sameer Srivastava offered tantalizing evidence consistent with the inference. Professor
Strivastava generously shared the evidence after hearing the time compression argument presented, and gave permission to cite the evidence here (personal communication, October 30, 2016). Using email messages among employees in a high-technology company to measure monthly a person’s network constraint and the proportion of verbs that are future tense in the person’s messages (data described in Srivastava et al., Forthcoming), Professor Srivastava finds the expected within-person covariation: In the month after an employee’s network becomes more constrained, his or her use of future tense verbs decreases, or conversely, in the month after an employee’s network becomes less constrained, his or her use of future tense verbs increases.
Social Network and Temporal Discounting, 2017-04-26 DRAFT, Page 28
Compression and Cognition
For more general extrapolation — since time compression is a felt rather than a physical
phenomenon — I look to research on the correlates of how people think about time and
their social network.
Closure Bias
Beginning with networks, research on the cognitive images of networks describes how
people understand the networks around them (Brands, 2013, for review). For example,
there is a cognitive bias toward closure indicated by the difficulty people have in
recognizing the structural holes in a network (Freeman, 1992). Given time compression
in closed networks, a bias toward closure is consistent with the bias people have on
average toward the present. The bias toward seeing closure is more pronounced for
people who work in more closed networks (Janicik and Larrick, 2005) and the analysis
here showed more time compression among managers who work in more closed
networks. Given a link between time compression and perceived closure, does time
compression vary with induced perceptions of closure? For example, people stimulated
to think about a threat to their job report more closed networks (Smith, Menon, and
Thompson, 2012). Does a threat-induced desire for closure trigger cognitive images of
life in a closed network such that people feeling a threat narrow their time horizon?
People who feel like an outsider to a situation perceive the situation network to be more
dense than it is (O’Connor and Gladstone, 2015). Does the perception of density trigger
cognitive images of closure such that people made to feel like an outsider operate with
more compressed time horizons? Then there are the correlates of closed networks.
The breadth, timing, and arbitrage advantages of connecting across groups give
brokers an advantage as innovators (Burt, 2004; 2005: Chp. 2), but Carnabuci and
Dioszegi (2015) argue that employee cognitive style affects the network association with
innovation. Carnabuci and Dioszegi show that employees in closed networks who
describe themselves as innovative are especially likely to be described as innovative by
their boss. Could time compression be responsible for the correlated boss and
employee evaluations? Does time compression in closed networks result in evaluative

Social Network and Temporal Discounting, 2017-04-26 DRAFT, Page 29
distortions such that employee and boss see minor improvements in today’s operations
as more significant than they actually are?
End of History
Analyzing opinions expressed by thousands of fans of a popular television show,
Quoidbach, Gilbert, and Wilson (2013) report that people perceive substantial change in
their opinions over the last decade, but believe their current opinions will be relatively
stable into the future. Quoidbach et al. (2013:96) term the phenomenon an “end of
history illusion” in which people “regard the present as a watershed moment at which
they have finally become the person they will be for the rest of their lives.” The
phenomenon is consistent with the familiar “present bias” in which people on average
privilege the present over the future, but as time compression is expected to make the
present bias more pronounced for people in closed networks, how much of the “end of
history” is an illusion created by time compression? Are people in closed networks
more likely to see substantial change from their past opinions and expect little change in
the future? And if the “end of history” illusion is more pronounced for people in closed
networks, is that a reason for the difficulty closed-network managers have in dealing
with change? Before they can deal with change, they have to deal with the fact that
change is going to happen. With the contemporary emphasis on speed and continuous
change, it can be difficult to remember that for much of human history a premium was
placed on the existence of enduring balance. Are the managers embedded in closed
networks more likely to be the source of statements that bemoan a timeless quality to
current events such as “that’s something we learned to live with,” or “that’s just the way
it is”?
Turning to how people think about specific roles in an organization, empirical use
of Jaques’ aforementioned time-horizon theory of organization reveals managers who
have difficulty strategizing in the longer time horizon expected of them. Are the troubled
individuals held back by time compression in a closed network? There are techniques
for helping people break into longer time horizons by having them discuss what they
plan to do in a specific upcoming future situation — five years from now when your
youngest child leaves home for college, two years from now when the current
Social Network and Temporal Discounting, 2017-04-26 DRAFT, Page 30
administration changes, next year after your two leading competitors have completed
their merger, and so on (Gilmore and Shea, 1997). Are the people resistant to such
clinical help embedded in closed networks such that the network has to be considered
in the clinical intervention?
Felt Status Loss
Extrapolating in another direction, consider Gould’s (2003: Chp. 6) analysis of
interpersonal violence as a result of threats to social standing, contingent on how
people think about themselves in time. Gould proposes an image of people as a
sequence of selves ordered from past to future. Some people react to threats against
the social standing of past selves. Some people react to threats against the social
standing of future selves. Either way, the selves that matter are the ones celebrated in
the network around us. Gould (2003:173) explains: “…obsession with the righting of
past wrongs signifies a strong devotion to past selves. Those of us who cannot remain
incensed about something done to us more than a few days ago are likely to say that it
is important to be forward-looking and to let bygones be bygones. ... Turning the other
cheek means turning one’s back on the right that one’s predecessor selves have to be
avenged — much as a young Corsican man’s failure to avenge his father or brother
constituted, in the eyes of other family members and of the community at large, a
renunciation of his social tie to the deceased.” (cf., Hall, 1959: 36-38, on the felt burden
for Truk Islanders of historical wrongs not yet made right, or arguments that discounting
is less severe for people who connect their present self with their future self, Bartels and
Urminsky, 2011; Chen, 2013). As illustrated by the lack of future-tense in the language
of closed-network managers, time compression focuses a person on the past and
present, to the detriment of the future. By Gould’s argument, managers in closed
networks, focused on the present and past, should react with more anger against
difficult colleagues — which they do (Burt, 2005:188-196). It follows that managers in
closed networks should take affront more easily from disparaging statements about their
past behavior, or react more violently against statements calling into question the vitality
or propriety of the job, profession, or organization with which the closed-network
manager has been affiliated.
Social Network and Temporal Discounting, 2017-04-26 DRAFT, Page 31
REFERENCES Ainslie, G. (1975). Specious reward: a behavioral theory of impulsiveness and impulse
control. Psychological Bulletin, 82(4), 463-496. Barndt, R. J. & Johnson, D. M. (1955). Time orientation in delinquents. Journal of
Abnormal Psychology, 51, 343-345. Bartels, D. M. & Rips, L. J. (2010). Psychological connectedness and intertemporal
choice. Journal of Experimental Psychology, 139(1), 49-69. Bartels, D. M. & Urminsky, O. (2011). On intertemporal selfishness: how the perceived
instability of identity underlies impatient consumption. Journal of Consumer Research, 38(June), 182-198.
Bickel, W. K., Odum, A. L. & Madden G. J. (1999). Impulsivity and cigarette smoking: delay discounting in current, never, and ex-smokers. Psychopharmacology, 146, 447-454.
Briscoe, F. (2007). From iron cage to iron shield? How bureaucracy enables temporal flexibility for professional service workers. Organization Science, 18(2), 297-314.
Brands, R. A. (2013). Cognitive social structures in social network research: a review. Journal of Organizational Behavior, 34(S1), S82-S103.
Burt, R. S. (1990). Kinds of relations in American discussion networks. In C. Calhoun, M. W. Marshall & W. R. Scott (Eds.), Structures of Power and Constraint (pp. 411-451). New York: Cambridge University Press.
Burt, R. S. (1992). Structural Holes. Cambridge, MA: Harvard University Press. Burt, R. S. (2004). Structural holes and good ideas. American Journal of Sociology,
110(2), 349-399. Burt, R. S. (2005). Brokerage and Closure. Oxford: Oxford University Press. Burt, R. S. (2010). Neighbor Networks. Oxford: Oxford University Press. Burt, R. S., Kilduff, M. & Tasselli, S. (2013). Social network analysis, through a focus on
network advantage. Annual Review of Psychology, 64, 527-547. Carnabuci, G. & Dioszegi, B. (2015). Social networks, cognitive style, and innovative
performance: a contingency perspective. Academy of Management Journal, 58(3), 881-905.
Carstensen, L. L. (2006). The influence of a sense of time on human development. Science, 312(5782), 1913-1915.
Chen, M. K. (2013). The effect of language on economic behavior: evidence from savings rates, health behaviors, and retirement assets. American Economic Review, 103(2), 690-731.
Social Network and Temporal Discounting, 2017-04-26 DRAFT, Page 32
Coser, R. L. (1975). The complexity of roles as a seedbed of individual autonomy. Pp. 237-263 in The Idea of Social Structure, edited by Louis A. Coser. New York: Harcourt, Brace, Jovanovich.
Danescu-Niculescu-Mizil, C., Lee, L., Pang, B. & Kleinberg, J. (2012). Echoes of power: language effects and power differences in social interaction. Proc. 21st International World Wide Web Conference.
Davids, A., Kidder, C. & Reich, M. (1962). Time orientation in male and female juvenile delinquents. Journal of Abnormal and Social Psychology, 64(3), 239-240.
De Volder, M. L. & Lens, W. (1982). Academic achievement and future time perspective as a cognitive-motivational concept. Journal of Personality and Social Psychology, 42(3), 566-571.
Feld, S. L. (1981). The focused organization of social ties. American Journal of Sociology, 86(5), 1015–1035.
Festinger, L., Schachter, S. & Back, K. W. (1950). Social Pressures in Informal Groups. Stanford, CA: Stanford University Press.
Frederick, S., Loewenstein, G. & O’Donoghue, T. (2002). Time discounting and time preference: a critical review. Journal of Economic Literature, 40(June), 351-401.
Freeman, L. C. (1992). Filling in the blanks: a theory of cognitive categories and the structure of social affiliation. Social Psychology Quarterly, 55(2),118-127.
Gavetti, G. & Rivkin, J. W. (2007). On the origin of strategy: action and cognition over time. Organization Science, 18(3), 420-439.
Gilmore, T. N. & Shea, G. P. (1997). Organizational learning and the leadership skill of time travel. Journal of Management Development, 16(4), 302-311.
Gould, R. V. (2003). Collision of Wills. Chicago: University of Chicago Press. Granovetter, M. (1992). ‘‘Problems of explanation in economic sociology.’’ In N. Nohria
& R. G. Eccles (Eds.), Networks and Organizations, (pp. 29-56). Boston, MA: Harvard Business School Press.
Green, L., Fry, A. F. & Myerson, J. (1994). Discounting of delayed rewards: a life-span comparison. Psychological Science, 5(1), 33-36.
Hall, E. T. (1959). The Silent Dimension. New York: Doubleday. Ireland, M. E., Slatcher, R. B., Eastwick, P. W., Scissors, L. W., Finkel, E. J. &
Pennebaker, J. W. (2011). Language style matching predicts relationship initiation and stability. Psychological Science, 22(1), 39–44.
Janicik, G. A. & Larrick, R. P. (2005). Social network schemas and the learning of incomplete networks. Journal of Personality and Social Psychology, 88(2), 348-364.
Jaques, E. (1979). Taking time seriously in evaluating jobs. Harvard Business Review, 57(4), 124-132.
Jaques, E. (1990). In praise of hierarchy. Harvard Business Review, 68(1), 127-133.
Social Network and Temporal Discounting, 2017-04-26 DRAFT, Page 33
Jaques, E. ([1989] 2006). Requisite Organization. Revised memorial edition. Jacksonville, FL: Cason Hall.
Kagal, J. H., Green, L. & Caraco, T. (1986). When foragers discount the future: constraint or adaptation? Animal Behavior, 34, 271-283.
Kaplan, S. (2008). Framing contests: strategy making under uncertainty. Organization Science, 19(5),729-752.
Kaplan, S. & Orlikowski, W. J. (2013). Temporal work in strategy making. Organization Science, 24(4), 965-995.
Kirby, K. N. (1997). Bidding on the future: evidence against normative discounting of delayed rewards. Journal of Experimental Psychology, 126(1), 54-70.
Kirby, K. N., Winston, G. C. & Santiesteban, S. (2005). Impatience and grades: delay-discount rates correlate negatively with college GPA. Learning and Individual Differences, 15, 213-222.
Malkoc, S. A. & Zauberman, G. (2006). Deferring versus expediting consumption: the effect of outcome concreteness on sensitivity to time horizon. Journal of Marketing Research, 43(4), 618-627.
Marsden, P. V. & Campbell, K. E. (1984). Measuring tie strength. Social Forces, 63(2), 482-501.
Mehl, M. R. (2012). Naturalistic observation sampling: the electronically activated recorder (EAR). In M. R. Mehl & T. S. Conner (Eds.), Handbook of Research Methods for Studying Daily Life (pp. 176-192). New York: Guilford.
Merton, R. K. ([1957] 1968). Continuities in the theory of reference group behavior. In R. K. Merton (Ed.), Social Theory and Social Structure (pp. 335-440). New York: Free Press.
Mischel, W. & Ebbesen, E. B. (1970). Attention in delay of gratification. Journal of Personality and Social Psychology, 16(2), 329-337.
Mullainathan, S. & Shafir, E. (2003). Scarcity. New York: Times Books. O’Connor, K. M. & Gladstone, E. (2015). How social exclusion distorts social network
perceptions. Social Networks, 40, 123-128. O’Rand, A. & Ellis, R. A. (1974). Social class and social time perspective. Social Forces,
53(1), 53-62. Orlikowski, W. J. & Yates, J. (2002). It’s about time: temporal structuring in
organizations. Organization Science, 13(6), 684-700. Padgett, J. F. &. Ansell, C. K. (1993). Robust action and the rise of the Medici, 1400-
1434. American Journal of Sociology, 98(6), 1259-1319. Parfit, D. (1984. Reasons and Persons. New York: Oxford University Press. Pennebaker, J. W., Booth, R J. & Francis, M. E. (2007). Linguistic Inquiry and Word
Count (LIWC). http://www.liwc.net
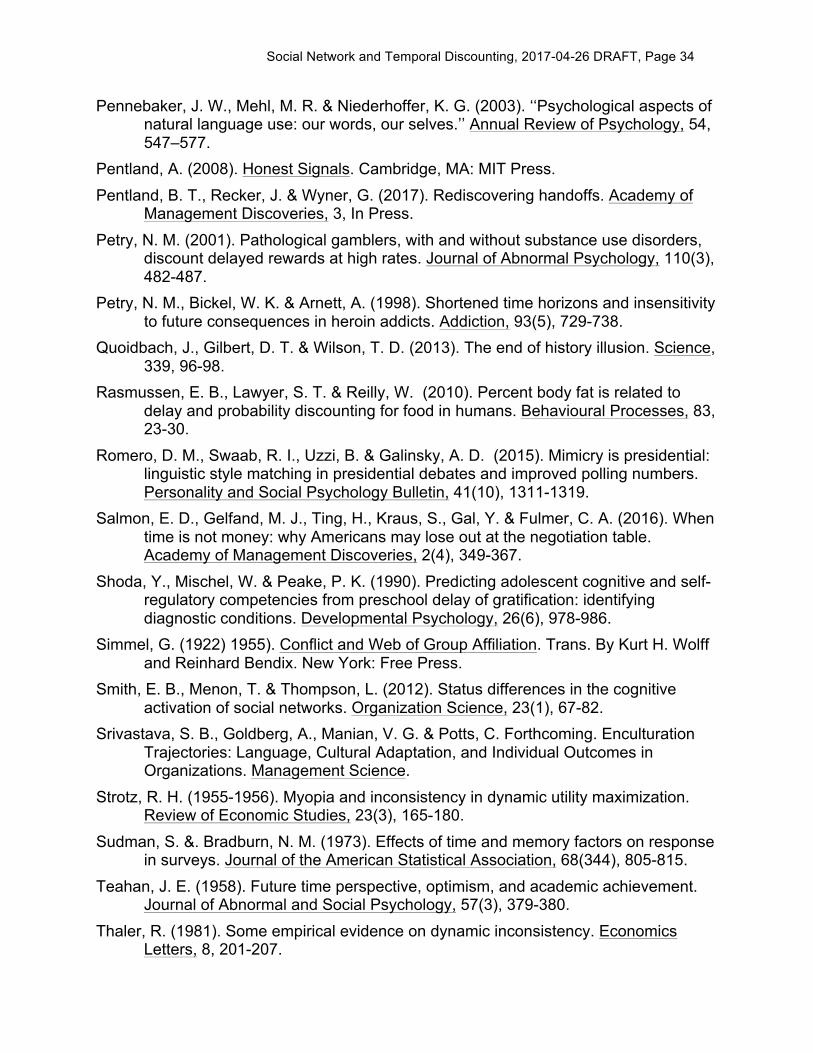
Social Network and Temporal Discounting, 2017-04-26 DRAFT, Page 34
Pennebaker, J. W., Mehl, M. R. & Niederhoffer, K. G. (2003). ‘‘Psychological aspects of natural language use: our words, our selves.’’ Annual Review of Psychology, 54, 547–577.
Pentland, A. (2008). Honest Signals. Cambridge, MA: MIT Press. Pentland, B. T., Recker, J. & Wyner, G. (2017). Rediscovering handoffs. Academy of
Management Discoveries, 3, In Press. Petry, N. M. (2001). Pathological gamblers, with and without substance use disorders,
discount delayed rewards at high rates. Journal of Abnormal Psychology, 110(3), 482-487.
Petry, N. M., Bickel, W. K. & Arnett, A. (1998). Shortened time horizons and insensitivity to future consequences in heroin addicts. Addiction, 93(5), 729-738.
Quoidbach, J., Gilbert, D. T. & Wilson, T. D. (2013). The end of history illusion. Science, 339, 96-98.
Rasmussen, E. B., Lawyer, S. T. & Reilly, W. (2010). Percent body fat is related to delay and probability discounting for food in humans. Behavioural Processes, 83, 23-30.
Romero, D. M., Swaab, R. I., Uzzi, B. & Galinsky, A. D. (2015). Mimicry is presidential: linguistic style matching in presidential debates and improved polling numbers. Personality and Social Psychology Bulletin, 41(10), 1311-1319.
Salmon, E. D., Gelfand, M. J., Ting, H., Kraus, S., Gal, Y. & Fulmer, C. A. (2016). When time is not money: why Americans may lose out at the negotiation table. Academy of Management Discoveries, 2(4), 349-367.
Shoda, Y., Mischel, W. & Peake, P. K. (1990). Predicting adolescent cognitive and self-regulatory competencies from preschool delay of gratification: identifying diagnostic conditions. Developmental Psychology, 26(6), 978-986.
Simmel, G. (1922) 1955). Conflict and Web of Group Affiliation. Trans. By Kurt H. Wolff and Reinhard Bendix. New York: Free Press.
Smith, E. B., Menon, T. & Thompson, L. (2012). Status differences in the cognitive activation of social networks. Organization Science, 23(1), 67-82.
Srivastava, S. B., Goldberg, A., Manian, V. G. & Potts, C. Forthcoming. Enculturation Trajectories: Language, Cultural Adaptation, and Individual Outcomes in Organizations. Management Science.
Strotz, R. H. (1955-1956). Myopia and inconsistency in dynamic utility maximization. Review of Economic Studies, 23(3), 165-180.
Sudman, S. &. Bradburn, N. M. (1973). Effects of time and memory factors on response in surveys. Journal of the American Statistical Association, 68(344), 805-815.
Teahan, J. E. (1958). Future time perspective, optimism, and academic achievement. Journal of Abnormal and Social Psychology, 57(3), 379-380.
Thaler, R. (1981). Some empirical evidence on dynamic inconsistency. Economics Letters, 8, 201-207.
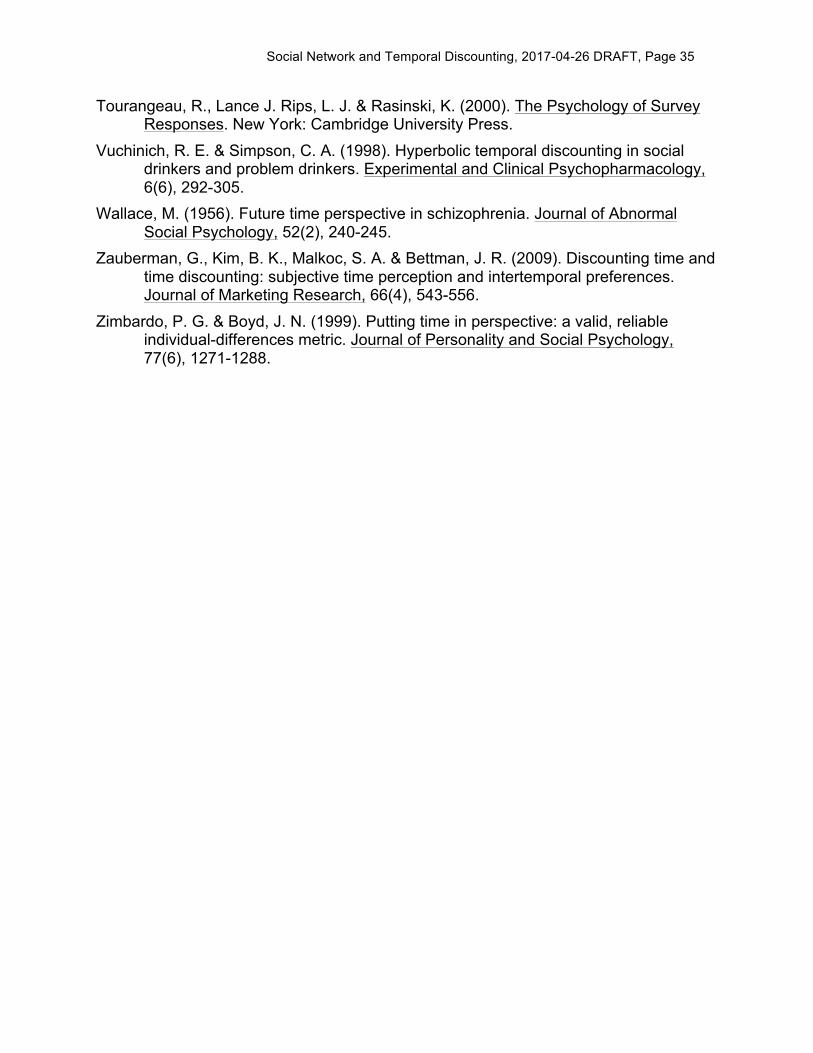
Social Network and Temporal Discounting, 2017-04-26 DRAFT, Page 35
Tourangeau, R., Lance J. Rips, L. J. & Rasinski, K. (2000). The Psychology of Survey Responses. New York: Cambridge University Press.
Vuchinich, R. E. & Simpson, C. A. (1998). Hyperbolic temporal discounting in social drinkers and problem drinkers. Experimental and Clinical Psychopharmacology, 6(6), 292-305.
Wallace, M. (1956). Future time perspective in schizophrenia. Journal of Abnormal Social Psychology, 52(2), 240-245.
Zauberman, G., Kim, B. K., Malkoc, S. A. & Bettman, J. R. (2009). Discounting time and time discounting: subjective time perception and intertemporal preferences. Journal of Marketing Research, 66(4), 543-556.
Zimbardo, P. G. & Boyd, J. N. (1999). Putting time in perspective: a valid, reliable individual-differences metric. Journal of Personality and Social Psychology, 77(6), 1271-1288.

Odds of Daily Contact with Colleague
Number of Days between Contacts with Colleague
Figure 4 Figures 4 & 5 Figure 4 Figures 4 & 5
Mutual Friends .243 (12.01)*** .202 (8.98)*** -1.041 (-11.72)*** -1.174 (-9.49)***
Network Constraint — — .275 (2.83)** — — -1.979 (-3.60)***
Job Rank — — -.181 (-6.38)*** — — .718 (4.39)***
Age — — .007 (1.22) — — -.050 (-1.59)
Fixed Effects Organization Respondent
Yes Yes
Yes No
Yes Yes
Yes No
Table 1. Contact Frequency and Network Closure
NOTE — The daily frequency variable is 1 if the respondent said he or she had daily contact with the colleague, 0 otherwise. The days between contacts variable is 1 for daily contact, 7 for weekly contact, and 30 for contact monthly or less often. Network constraint is log network constraint. Job Rank is an integer variable equal to 1 for the highest rank in a population, and one integer less for each lower rank. Age is the manager’s age in years. Test statistics are routine z-score for the logit and t-test for the regression equations with fixed effects as indicated.
* P < .05 ** P < .01 *** P < .001

Response Length (in characters)
Past-Tense Verbs (percent of verbs)
Future-Tense Verbs (percent of verbs)
Response Length — — .006 (2.10)* .009 (4.29)***
Problem (vs. Idea) 150.06 (3.91)*** 21.09 (9.14)*** -4.78 (-3.27)**
Network Constraint -297.93 (-4.39)*** -1.06 (-0.26) -6.48 (-2.49)*
Job Rank -46.16 (-2.48)* -0.23 (-0.20) -.30 (-0.42)
Age -2.96 (-0.83) -0.13 (0.89) 0.05 (0.52)
Intercept R2
1523.43.11
1.05.23
25.93 .10
Table 2. The Future Is Noticeably Absent in Closed Networks,
But There Is No Lack of Attention To the Past.
NOTE — These are ordinary least squares estimates for models predicting the column response variables for the 351 managers in the financial services organization. Managers were asked to describe a good idea or a difficult problem. Response length is the number of characters in a manager’s response. Past-Tense Verbs is the percentage of verbs in a response that are past tense. Future-Tense Verbs is the percentage of verbs that are future tense. Problem is a dummy variable indicating whether the manager was asked the problem question (versus the good-idea question, Figure 6). Network Constraint is the log of network constraint. Job Rank is an integer variable distinguishing the four job ranks in the population. Age is the manager’s age in years. Routine t-tests are given in parentheses.
* P < .05 ** P < .01 *** P < .001

Table 3. Predicting EMBA Evaluations of Delayed Value
NOTE — Each of 50 volunteer EMBA students provided the value to them of a $10,000 bond at ten time delays (1 month, 6, 12, 18, 36, 60, 108, 120, 180, and 300 months). To estimate an exponential discount function, natural log of value is regressed across the above variables. Closure is measured by the density of emotional closeness between work contacts. The first two models use closure measured by a low-moderate-high distinction in Figure 8, with high equal to 1 and low equal to -1, so the coefficient for delay describes discounting at the middle level of closure. The third and fourth models use the continuous measure of closure as a deviation score from its mean level, so the coefficient for delay describes discounting at the average level of closure. Small firms are here organizations with fewer than 1,000 employees. Large firms have more than 50,000 employees. OLS estimation with standard errors (in parentheses) adjusted for correlation between the 10 evaluations by each respondent using the “cluster” option in Stata. * P < .05 ** P < .01 *** P < .001
Three Categories of Closure
Three Categories of Closure
Continuous Measure of Closure
Continuous Measure of Closure
Delay (in months) -.005 (-12.28)*** -.005 (-12.20)*** -.005 (-12.07)*** -.005 (-11.99)***
Delay x Closure -.002 (-3.24)** -.002 (-2.95)** -.0002 (-3.33)** -.0001 (-2.89)**
Closure — — -.017 (-0.50) — — -.003 (-0.97)
Age (in years) — — -.009 (-0.74) — — -.010 (-0.84)
Female — — .013 (.018) — — -.003 (-0.04)
US — — -.022 (-0.29) — — -.029 (-0.37)
Russian — — -.094 (-1.04) — — -.143 (-1.66)
Small Firm — — -.084 (-1.06) — — -.099 (-1.27)
Large Firm — — .030 (0.34) — — .049 (0.56)
Intercept R2
9.18 .62
9.56 .64
9.18 .61
9.63 .64
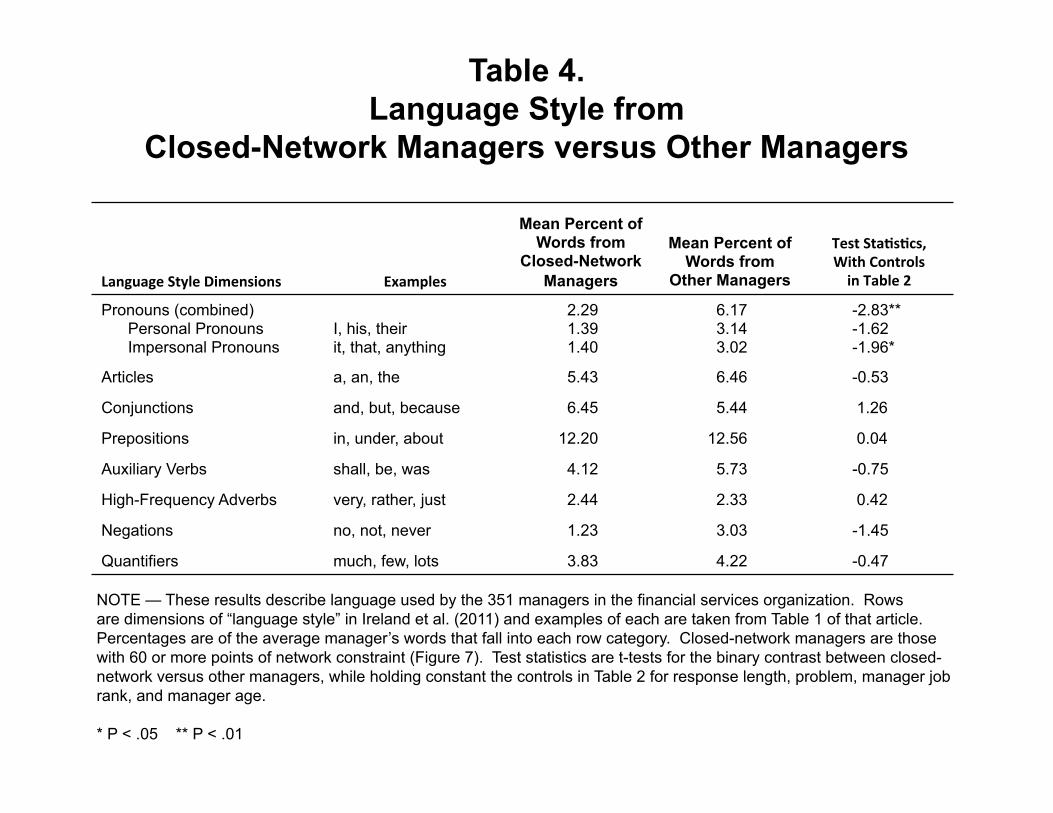
Table 4. Language Style from
Closed-Network Managers versus Other Managers
NOTE — These results describe language used by the 351 managers in the financial services organization. Rows are dimensions of “language style” in Ireland et al. (2011) and examples of each are taken from Table 1 of that article. Percentages are of the average manager’s words that fall into each row category. Closed-network managers are those with 60 or more points of network constraint (Figure 7). Test statistics are t-tests for the binary contrast between closed-network versus other managers, while holding constant the controls in Table 2 for response length, problem, manager job rank, and manager age.
* P < .05 ** P < .01
Language Style Dimensions Examples
Mean Percent of Words from
Closed-Network Managers
Mean Percent of Words from
Other Managers
Test Sta5s5cs, With Controls in Table 2
Pronouns (combined) Personal Pronouns Impersonal Pronouns
I, his, their it, that, anything
2.29 1.39 1.40
6.17 3.14 3.02
-2.83** -1.62 -1.96*
Articles a, an, the 5.43 6.46 -0.53
Conjunctions and, but, because 6.45 5.44 1.26
Prepositions in, under, about 12.20 12.56 0.04
Auxiliary Verbs shall, be, was 4.12 5.73 -0.75
High-Frequency Adverbs very, rather, just 2.44 2.33 0.42
Negations no, not, never 1.23 3.03 -1.45
Quantifiers much, few, lots 3.83 4.22 -0.47
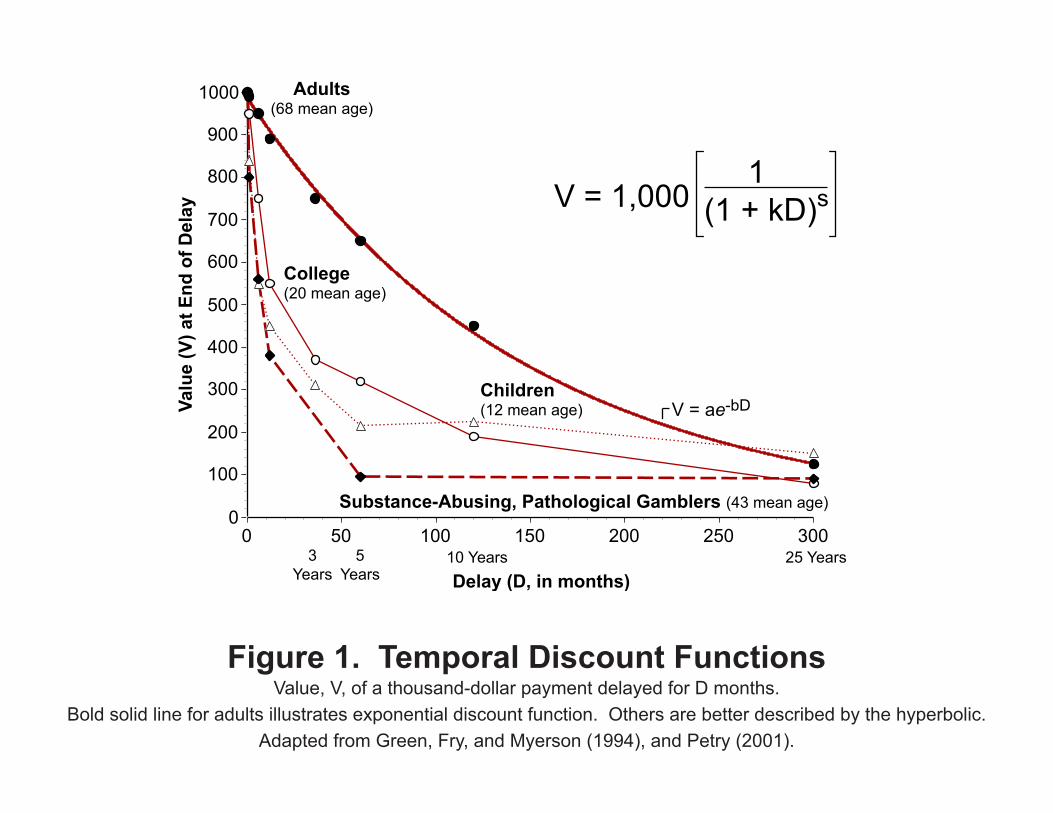
Figure 1. Temporal Discount FunctionsValue, V, of a thousand-dollar payment delayed for D months.
Bold solid line for adults illustrates exponential discount function. Others are better described by the hyperbolic.Adapted from Green, Fry, and Myerson (1994), and Petry (2001).
3Years
5Years
10 Years 25 Years
Adults(68 mean age)
College(20 mean age)
Children(12 mean age)
V = 1,000
Substance-Abusing, Pathological Gamblers (43 mean age)
1(1 + kD)s
V = ae-bD
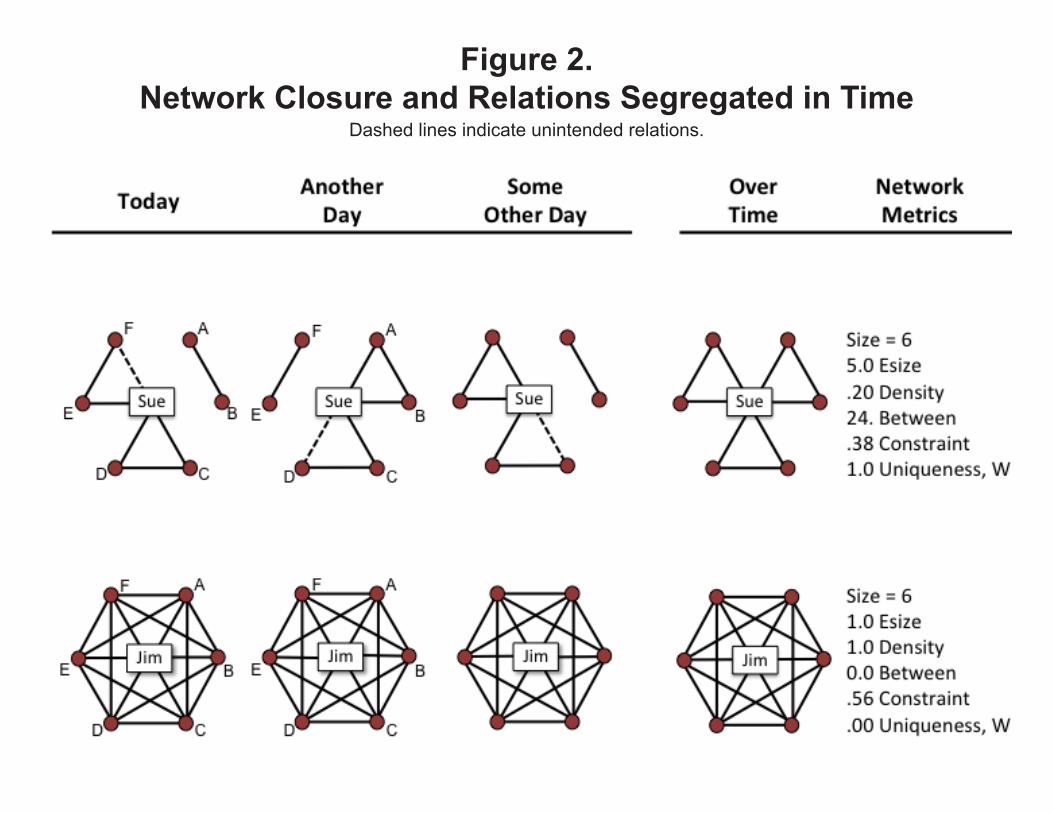
Figure 2.Network Closure and Relations Segregated in Time
Dashed lines indicate unintended relations.

Figure 3. Contact Frequency with ColleaguesNumber of survey respondents is given in parentheses, with their total number of sociometric citations. Managers in the computer manufacturer meet cited colleagues about as often as the HR managers (0.26 t-test predicting days between meetings, adjusted down for autocorrelation between colleagues cited by same respondent using “cluster” option in Stata, P ~ .79). Bankers and managers in the financial services organization meet their cited colleagues more frequently (-8.57 t-test in same prediction).
FinancialServices
(351 senior bankers and back-office managers, 2674
colleagues cited, 1 generator: frequent
and substantive work discussion)
Perc
ent o
f Rel
atio
nshi
ps
ComputerManufacturer
(284 senior managers, 3015
colleagues cited, 9 name generators regarding work;
Burt, 1992:115ff., 2010:195ff.)
HR in aCommercial Bank
(217 senior HR mangers, 1534
colleagues cited, 11 name generators
regarding work; Burt, 2010:80-85)

Figure 4. Embedded Relations Involve More Frequent Contact These results describe the Figure 3 colleague relationships in three management populations. Horizontal axes distinguish relations by number of mutual friends. A respondent and cited colleague have a mutual friend each time respondent and colleague are close to the same third person. Test statistics are estimated with fixed effects for respondent and organization. The graph to the left shows the probabilty of daily contact increasing with number of mutual friends. The right graph shows the average number of days that pass between respondent and cited colleague contacting one another; the more mutual friends, the fewer days between two people meeting one another.
Probability Colleague Met Dailyat Each Number of Mutual Friends
Days between Contactat Each Number of Mutual Friends
Computer Manufacturer
HR in a Commercial Bank
FinancialServices
10+ 10+
12.01 logit z -11.72 t-test

Figure 5. Time Is Compressed in Closed NetworksThese results describe the Figure 3 manager networks. Horizontal axis to the left distinguishes managers in closed networks, more constraint indicating more closure. Symbols in the graphs are scores averaged within five-point intervals on the horizontal axis. Strong correlation, computed from the plotted data, shows that cited colleagues are more likely to be met daily by managers in more closed networks. The graph to the right shows average contact frequencies within three categories of network structures (broker-partner-clique partition explained in the text). Controlling for differences between the organizations (F2,826 = 12.22, P < .001), and the lower percent-daily contacts around managers in more senior job ranks (-5.64 t-test), managers in broker and partner networks are equally likely to meet their cited colleagues daily (0.11 t-test, P ~ .91). Managers in clique networks are most likely to meet their cited colleagues daily (2.82 t-test, P < .01), and least likely to cite colleagues met monthly or less (-4.59 t-test).
Network Constraintmany ——— Structural Holes ——— few
Perc
ent o
f Cite
d C
olle
ages
Met
Dai
ly
Aver
age
Num
ber o
f Cite
d C
onta
cts
BrokerNetworks
PartnerNetworks
CliqueNetworks
MetDaily
MetWeekly
Met Monthlyor Less Often
4.09
3.38
2.91
1.85
1.52
0.96
.90 correlation in graph3.76 t-test across 832 managers

362 Characters Unify the execution of strategic plans, and eliminate the waste of in-fighting by coming to agreement at a senior management level of how work will be divided and shared between organizations. Organizational bureaucracy should be replaced by streamlining processes, and we should provide training on specific implementation strategies for the different business areas.
1 Past-tense
0 Present-tense
3 Future-tense
355 Characters Over the last several years, we have attempted to create a licensing program to complement our intellectual property protection program. So far, these efforts have been ineffective, primarily, in my opinion, because we have not maintained the proper level of staffing to allow a continuous sustained effort to see these initiatives through to fruition.
1 Past-tense
4 Present-tense
0 Future-tense
“When ideas get put into action, problems can arise that prevent the idea from realizing its full potential. Over the last several years, the Company has launched a number of initiatives to improve growth and performance. Some of the initiatives didn’t turn out as hoped. Please briefly identify one initiative that didn’t work and in a few sentences say why you believe it didn’t work.”
“What is the most significant thing that could be done to increase the value of the Company?”
Figure 6. Example Texts
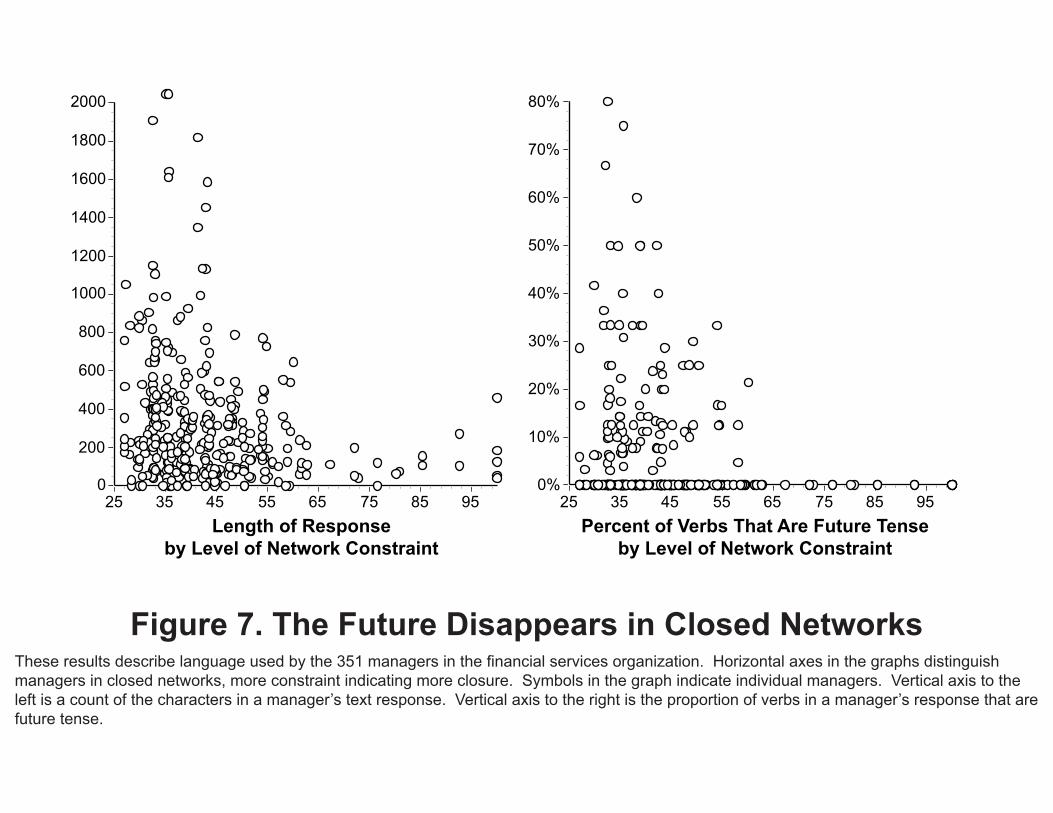
Figure 7. The Future Disappears in Closed Networks
Length of Responseby Level of Network Constraint
Percent of Verbs That Are Future Tenseby Level of Network Constraint
These results describe language used by the 351 managers in the financial services organization. Horizontal axes in the graphs distinguish managers in closed networks, more constraint indicating more closure. Symbols in the graph indicate individual managers. Vertical axis to the left is a count of the characters in a manager’s text response. Vertical axis to the right is the proportion of verbs in a manager’s response that are future tense.
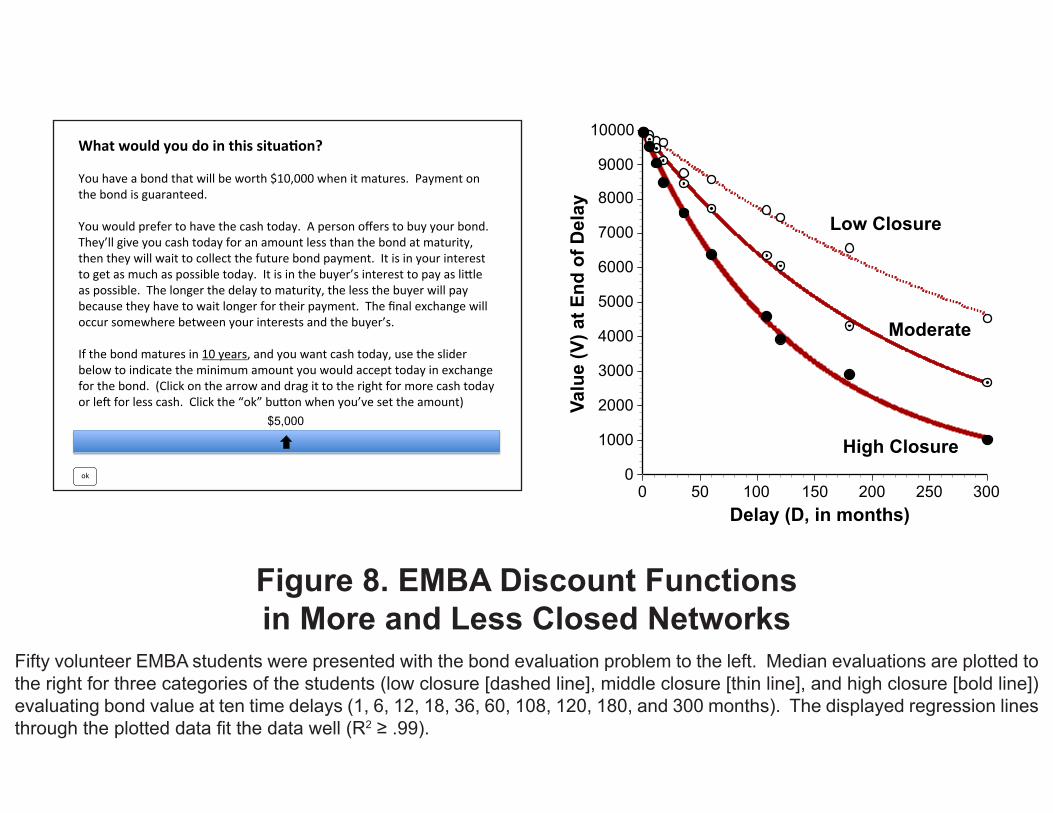
Figure 8. EMBA Discount Functionsin More and Less Closed Networks
Fifty volunteer EMBA students were presented with the bond evaluation problem to the left. Median evaluations are plotted to the right for three categories of the students (low closure [dashed line], middle closure [thin line], and high closure [bold line]) evaluating bond value at ten time delays (1, 6, 12, 18, 36, 60, 108, 120, 180, and 300 months). The displayed regression lines through the plotted data fit the data well (R2 ≥ .99).
Whatwouldyoudointhissitua/on?Youhaveabondthatwillbeworth$10,000whenitmatures.Paymentonthebondisguaranteed.Youwouldprefertohavethecashtoday.Apersonofferstobuyyourbond.They’llgiveyoucashtodayforanamountlessthanthebondatmaturity,thentheywillwaittocollectthefuturebondpayment.Itisinyourinteresttogetasmuchaspossibletoday.Itisinthebuyer’sinteresttopayasliCleaspossible.Thelongerthedelaytomaturity,thelessthebuyerwillpaybecausetheyhavetowaitlongerfortheirpayment.Thefinalexchangewilloccursomewherebetweenyourinterestsandthebuyer’s.Ifthebondmaturesin10years,andyouwantcashtoday,usethesliderbelowtoindicatetheminimumamountyouwouldaccepttodayinexchangeforthebond.(ClickonthearrowanddragittotherightformorecashtodayorleIforlesscash.Clickthe“ok”buConwhenyou’vesettheamount)
ok
$5,000
Low Closure
Delay (D, in months)
Valu
e (V
) at E
nd o
f Del
ay
Moderate
High Closure