Embed Size (px)
Citation preview
r Academy of Management Journal2015, Vol. 58, No. 3, 881–905.http://dx.doi.org/10.5465/amj.2013.1042
SOCIAL NETWORKS, COGNITIVE STYLE, AND INNOVATIVEPERFORMANCE: A CONTINGENCY PERSPECTIVE
GIANLUCA CARNABUCIUniversita della Svizzera italiana (University of Lugano)
BALINT DIOSZEGIETH Zurich
Integrating insights from cognitive psychology into current network theory on the socialcapital of brokering and closed networks, we argue that cognitive style is a criticalcontingency explaining the relation between social network position and innovativeperformance. Based on a “complementary fit” argument, we posit that a social networkrich in structural holes enhances the innovative performance of employees with anadaptive cognitive style; however, individuals with an innovative cognitive style aremost innovative when embedded within a closed network of densely interconnectedcontacts. Using data on the individual cognitive styles and complete workplace socialnetworks of all employees within a design and manufacturing firm, we show that ourtheorized contingency mechanism accounts for a large share of empirical variationin employee innovative performance over and above existing social networkexplanations.
Extant research has shown that the workplacesocial network within which an employee is embed-ded deeply affects his or her ability to produce usefulorganizational innovations (Brass, Galaskiewicz,Greve, & Tsai, 2004; Sparrowe, Liden, & Wayne,2001). One well-established line of inquiry in partic-ular argues that occupying a brokering network po-sition that spans structural holes expands theinventiveness of individuals (Burt, 2000). By tappinginformation from mutually unconnected colleagues(Aral & Van Alstyne, 2011; Burt, 2004), employeesin such positions are more likely to come across andcombine diverse and apparently unrelated information,which is critical to conceiving novel approaches andcreative solutions (Amabile, 1996b; Burt, 2005). Sup-porting this argument, prior research found thatemployees with a workplace network rich in structuralholes generate more numerous and more original ideas
than do comparable individuals embedded within aclosed web of interconnected contacts (Burt, 2004).
While research into the benefits of structuralholes has significantly advanced our understandingof how workplace social networks affect employeeinnovation, recent discussions have highlighted anunresolved theoretical tension in this line of argu-ment. As innovation scholars have pointed out,successful innovation requires both creating andimplementing novel ideas; however, the same con-ditions favoring the creation of novel ideas oftenimpede the idea-implementation process (Hargadon& Douglas, 2001; Laureiro-Martınez, Brusoni, Canessa,& Zollo, 2015), leading to an “innovation paradox”(Miron-Spektor, Erez, & Naveh, 2011). Recent net-work studies have noted a similar paradox, arguingthat although having a network rich in structuralholes helps employees to come up with novel ideas,it is an impediment during idea implementation be-cause converting a creative idea into an actual in-novation requires internal support, alignment, andcoordinated action (Kijkuit & Van Den Ende, 2007).Thus, as Obstfeld (2005: 101) eloquently put it, socialnetworks rich in structural holes “present both anopportunity structure for generating new ideas andan action problem ... because the dispersed, un-connected people found around structural holes areinherently more difficult to mobilize or coordinate,especially around novel ideas.”
We would like to thank Brandy Aven, Stefano Brusoni,Ron Burt, Lars Frederiksen, Martin Goossen, Gudela Grote,Eric Quintane, and participants in the First Workshop onthe Microfoundations of Social Networks (CBS, Denmark)for their comments and suggestions. We are grateful toValentina Iannuzziello, who provided research assistanceduring the data collection and initial phases of this projectas part of her final MA thesis. Finally, we thank the editorand three anonymous reviewers for their thorough andconstructive feedback.
881
Copyright of the Academy of Management, all rights reserved. Contents may not be copied, emailed, posted to a listserv, or otherwise transmitted without the copyright holder’s expresswritten permission. Users may print, download, or email articles for individual use only.
One way in which recent network scholarship hasaddressed this “innovation paradox” is by pointingout that brokering and closed social networks conferdifferent kinds of social capital, each of which isuseful at different stages in the innovation process.During the initial phase, when coming up witha wide range of creative, out-of-the box ideas is of crit-ical importance, employees embedded in a brokeringnetwork have an advantage (Rodan & Galunic, 2004).When it comes to championing a novel idea and in-tegrating it into the existing technologies, processes,and structures of an organization, however, employ-ees who can leverage a closed web of contacts may bein a better position (Flap & Volker, 2001). This line ofargument has clarified how the social capital of bro-kering versus closed social networks facilitates theinnovation process at different points in the “organi-zational life of an idea” (Kijkuit & Van Den Ende,2007). However, since each employee is structurallyembedded within a single network position, he orshe will generally be able to mobilize only one kindof social capital, irrespective of the phase of theinnovation process with which he or she is dealing.Recognizing that brokering networks are beneficialduring early phases of the innovation process, whileclosed networks become critical during idea imple-mentation, is therefore not enough to produce a con-clusive answer to a question of both practical andtheoretical relevance: Which network structure ismost conducive to innovative performance at thelevel of the individual employee?
In an attempt to address this question, the presentstudy develops a “complementary fit” argument(Cable & Edwards, 2004; Ostroff, 2012) that inte-grates an individual-level, cognitive perspectiveinto the current network theory of social capital.Departing from the widespread assumption thatworkplace social networks affect all employees inthe same way, we draw insights from adaption–innovation theory (Kirton, 1976, 1989) to argue thatwhether a brokering or a closed network will enhancean employee’s innovative performance is contingenton that employee’s idiosyncratic cognitive style. Weput our argument to an empirical test using unusuallyrich data on the cognitive styles and complete intra-organizational networks of all employees withina design and manufacturing company. Our empiricalanalyses lend support to our theoretical claim,showing that our theorized mechanism accounts fora substantial share of empirical variation in employeeinnovative performance that is not captured byexisting network theory. By demonstrating that in-dividual cognitive style is a key factor influencing
whether closed or brokering social networks enhanceemployees’ innovative performance, this studymakesthree main contributions to the extant literature.
First, we address the innovation paradox at the levelof the individual employee. Responding to recent callsfor micro-founded, psychologically informed con-ceptualizations of social networks (Barsade, Casciaro,Edmondson, Gibson, Krackhardt, & Labianca, 2012;Kilduff & Krackhardt, 2008), we illuminate the con-ditions under which a brokering or a closed networkstructure is most conducive to individual innovation.
Second, our study advances the stream of litera-ture that considers social networks from a contin-gency perspective (Anderson, 2008; Burt, 1997).This line of inquiry argues that network effects varydepending on the contextual characteristics of thenetwork (Kijkuit & Van Den Ende, 2007), of the in-formation flowing through the network (Aral & VanAlstyne, 2011; Hansen, 1999), or of the actorsthemselves (Kilduff & Krackhardt, 2008). We con-tribute to this emerging research field by showingthat cognitive style is a key contingency variable inexplaining the link between social networks andemployee innovation.
Third, we develop a novel theoretical argumentthat accounts for both the closure and brokerageviews of social capital within a unitary explanation.Incorporating the role of cognitive style into existingnetwork-structural models of social capital is straight-forward because the latter explains which kind of in-formation accrues to individuals, while the formerexplains which kind of information individuals needmost. Despite its underlying simplicity, our theoreticalintegration reconciles apparent discrepancies betweenthe closure and brokerage views within a more generaltheory of social capital, and yields consequentialimplications for both scholars and managers.
NETWORK BROKERAGE AND INDIVIDUALINNOVATION
The extant literaturewidely concurs that developinga workplace network spanning structural holesenhances individuals’ innovative performance bymaking them more likely to come up with new andoriginal ideas (Burt, 2000). Sincemuch organizationalinformation flows through networks of interpersonalrelations (Cross & Cummings, 2004), tapping in-formation from mutually unconnected contactsexposes individuals to a diverse range of views,opinions, and ideas that are hardly accessible toemployees embedded within closely connectednetworks (Granovetter, 1973). This heterogeneous
882 Academy of Management Journal June
information environment is key to the social capitalinherent in brokering networks because, by stimu-lating individuals to envision novel combinationsof seemingly unrelated ideas, it fosters the idea-generation process (Aral & Van Alstyne, 2011; Burt,2004; Hemphala & Magnusson, 2012; Kijkuit & VanDen Ende, 2007; Rodan & Galunic, 2004). Althoughclosed social networks are more conducive to ideaimplementation than brokering ones (Obstfeld, 2005),there is broad consensus in the literature that oc-cupying a brokering network position has an overallpositive effect on an individual’s innovative per-formance (Burt, 2005). The reason is that althoughboth idea creation and idea implementation playa role in innovation dynamics, implementation can-not occur unless creative ideas have been generated(Baer, 2012: 1104). Conversely, the ability to comeup with original, out-of-the-box ideas representsa salient and intrinsically valuable aspect of anemployee’s innovative performance because suchideas are the buds from which organizational inno-vations can develop (Baer, Oldham, & Cummings,2003). Extant research from a variety of empiricalsettings supports the view that individuals embed-ded in brokering networks tend to be more in-novative than equally skilled colleagues occupyingclosed network positions. For example, Burt (2004)studied a large sample of managers running thesupply chain of a multinational electronics com-pany, and found that those embedded in brokeringworkplace networks systematically come up withmore numerous and more valuable ideas than thosein closed network positions. Similarly, Fleming (2002)examined innovative dynamics within Hewlett-Packard and found that brokering social networksthat cut across projects help engineers to developinnovative technologies. Lastly, Rodan and Galunic(2004) showed that having a workplace networkrich in structural holes improved the innovativeperformance of senior managers in a Scandinaviantelecommunications company. In line with priorliterature, we therefore advance the following base-line hypothesis:
Hypothesis 1. The more brokering (closed)an employee’s workplace social network, thehigher (lower) his or her innovative performance.
Hypothesis 1 is “structuralist” in the sense that itfocuses solely on the characteristics of the networkwithin which employees are embedded, not oncharacteristics inherent to the employees them-selves (Emirbayer & Goodwin, 1994). Interestingly,though, a long-established line of research in the
psychology of problem solving literature offersevidence that individuals with different cognitivestyles use information differently, suggesting thatemployees might differ in the extent to which theyprofit from the social capital inherent in closedversus brokering networks. Before we can explic-itly integrate the structuralist and psychologicalperspectives into a unified theoretical argument,a discussion of existing literature on cognitivestyles is in order.
ADAPTIVE–INNOVATIVE COGNITIVE STYLE
“Cognitive style” refers to “consistent individualdifferences in the ways people organize and processinformation” (Martinsen, Kaufmann, & Furnham,2011: 214), which influence how individuals con-ceive of and deal with problems. Theories of cognitivestyle have become increasingly relevant in organiza-tional research, because evidence shows that cogni-tive styles are “a fundamental factor determining bothindividual and organizational behavior” (Kozhevnikov,2007: 464). One prominent example is the adaption–innovation theory of Kirton (1976, 1989), which hasreceived much attention as an approach to bothconceptualizing and measuring cognitive style(Shalley, Zhou, & Oldham, 2004), and has influ-enced research in a broad range of fields includingentrepreneurship, leadership, and team dynamics(Stum, 2009). Adaption–innovation theory posits thatindividuals differ starkly in terms of how they makedecisions, solve problems, and construe change(Tullett & Davies, 1997). Such differences in cognitivestyle develop early in life and determine how the in-dividual deals with all stages of the problem-solvingprocess, including the view of the nature of problem,the scope of possible solutions, and the implementa-tion of chosen solutions (Chan, 1996; Kirton, 1989).
Adaption and innovation are two ends of a contin-uum, having a normal distribution around the theo-retical mean (Goldsmith & Kerr, 1991). Descriptionsof individuals on the two extremes of the continuumare in stark opposition. Adaptors use the informationavailable to them to find solutions that fit withinestablished frameworks (Kaufmann, 2004). As such,they are more adept at “doing things better” thanthey are at “doing things differently” (Kirton, 1976:622). While they are meticulous and thorough intheir approach to problem solving, their focus onestablished frameworks inhibits them from ventur-ing far from current ways of thinking, winnowingthe range of ideas and information they consider(Talbot, 1997). Adaptors’ solutions generally fit well
2015 883Carnabuci and Dioszegi
with those of others and with the commonly ac-cepted way of doing things. However, it is oftendifficult for them to recognize when existing sol-utions are no longer effective (Pounds & Bailey,2001). In addition, adaptors tend to analyze prob-lems logically and methodically instead of turningto free idea generation (Basadur, 1995). While thisapproach helps them solve “problems by pro-ceeding at a disciplined pace in a predictable di-rection” (Kirton, 1994: 13), it also makes divergentthinking unlikely, reducing their likelihood of gen-erating truly novel and creative ideas. Innovatorsprocess information in a very different fashion, theircognitive focus being on finding new ways in whichto conceptualize and frame the problem (Kirton,1976), and not on immediate solutions. Being lessinclined to adjust their ideas to the expectationsof others, innovators typically approach problemsfrom original and unusual perspectives (Singer,1990), “breaking the customary starting point” fortheir solution (Kirton & De Ciantis, 1986: 141).Furthermore, they solve problems by systematicallyturning around the information accruing to themthrough repeated cognitive reframings, allowing themto see new ways of linking apparently unrelated ideas(Hayes & Allinson, 1998). This approach helps themcome up with creative ideas and initiatives that oftenbreak away from established practice, facilitating theidea-generation process (Kirton, 1976).
In sum, innovators find it relatively easy to gen-erate original ideas by recombining seemingly un-related perspectives and information, although it isquite difficult for them to convert creative ideas intoimplemented innovations. Conversely, adaptorscome up with fewer and less original ideas, but theirfocus on finding solutions that fit well within theorganization’s established way of doing things aidsthem during the idea-implementation process. Suchdifferences in cognitive style describe an individual’spreferred way of processing and organizing in-formation, and are thus conceptually different fromcognitive level or ability (Goldsmith, 1985). Never-theless, extant research suggests that innovators arelikely to achieve higher performance in tasks inwhich the relative importance of idea creation isgreater than that of idea implementation, while theopposite is true for adaptors (Pounds & Bailey, 2001).
We mentioned earlier that although both ideacreation and idea implementation constitute im-portant facets of innovation, the former representsa highly salient aspect of an employee’s innovativeperformance that most contemporary workplacesregard as intrinsically valuable (Baer et al., 2003). In
line with this view, prior literature indicates that thetendency to shift mental models and to combineseemingly unrelated information, which is charac-teristic of innovators, but not of adaptors, is a criticalantecedent of individual innovative performance(Holyoak & Thagard, 1995; Simonton, 1999). Forexample, Rostan (1994) showed that the most in-novative scientists and artists spend significantlymore time framing problems from alternative per-spectives than their less innovative peers. Further-more, research found that combining concepts inunconventional ways is a main driver of employees’innovative performance in such diverse areas as en-gineering and advertising (Mumford, Baughman,Maher, Costanza, & Supinski, 1997; Owens, 1969).Building on this prior literature, we advance a sec-ond baseline hypothesis:
Hypothesis 2. The more innovative (adaptive)an employee’s cognitive style, the higher (lower)his or her innovative performance.
SOCIAL NETWORK POSITION AND COGNITIVESTYLE: A CONTINGENCY PERSPECTIVE
The two baseline hypotheses presented so far de-scend from the well-established premise that, withinthe contemporary workplace, the ability to generateoriginal, out-of-the-box ideas is a defining aspect ofindividual creativity that has a direct positive impacton the innovative performance of employees (Baeret al., 2003). While being innovative undoubtedlyrequires an individual to come up with creative ideas,extant research also suggests that the extent to whichthe process of idea creation converts into an employ-ee’s overall innovative performance depends on his orher efficacy in turning novel ideas into implementedinnovations (Amabile, 1996a; Baer, 2012). In the pres-ent section, we elaborate on this insight, which is at thecore of the innovation paradox, to advance extant the-ory on the network structures most conducive to anemployee’s innovative performance. Specifically, weargue that the effect of social network position on in-dividual innovative performance varies dependingon employees’ cognitive style. The logical principleunderpinning our hypothesis is that of “comple-mentary fit” (Ostroff, 2012), which suggests that anindividual’s performance will be highest when “theweaknesses or needs of the environment are offsetby the strength of the individual, and vice versa”(Muchinsky & Monahan, 1987: 271). Following thislogic, we posit that a closed network of densely con-nected contacts will effectively complement the
884 Academy of Management Journal June
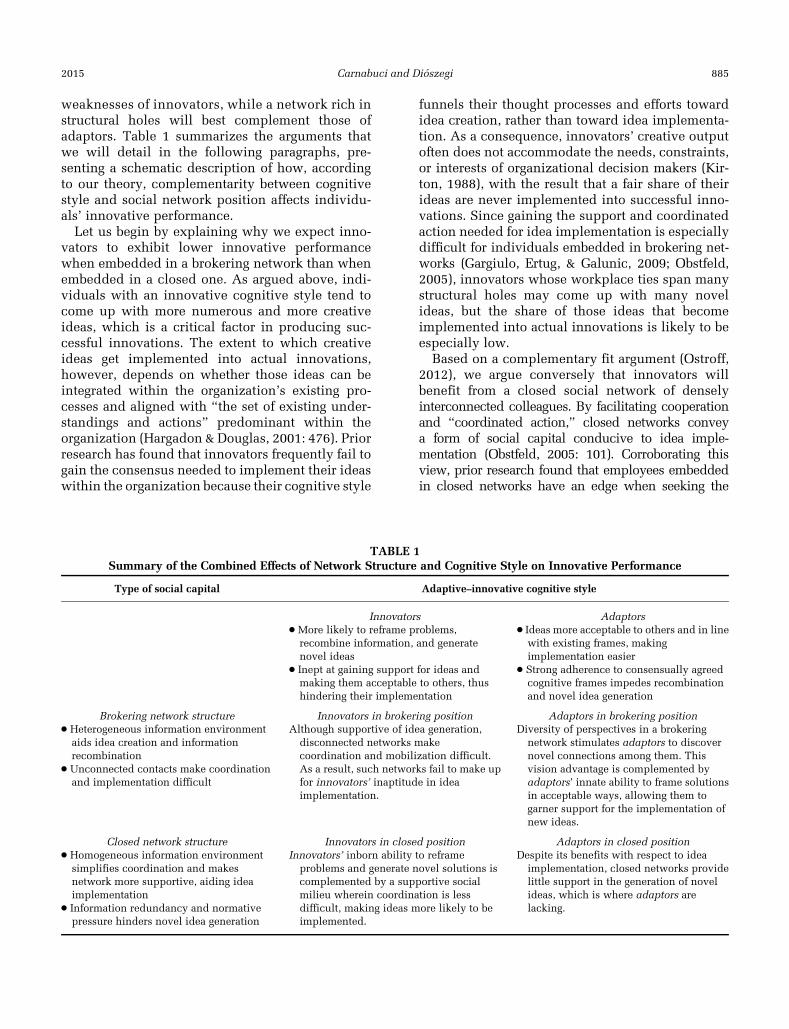
weaknesses of innovators, while a network rich instructural holes will best complement those ofadaptors. Table 1 summarizes the arguments thatwe will detail in the following paragraphs, pre-senting a schematic description of how, accordingto our theory, complementarity between cognitivestyle and social network position affects individu-als’ innovative performance.
Let us begin by explaining why we expect inno-vators to exhibit lower innovative performancewhen embedded in a brokering network than whenembedded in a closed one. As argued above, indi-viduals with an innovative cognitive style tend tocome up with more numerous and more creativeideas, which is a critical factor in producing suc-cessful innovations. The extent to which creativeideas get implemented into actual innovations,however, depends on whether those ideas can beintegrated within the organization’s existing pro-cesses and aligned with “the set of existing under-standings and actions” predominant within theorganization (Hargadon & Douglas, 2001: 476). Priorresearch has found that innovators frequently fail togain the consensus needed to implement their ideaswithin the organization because their cognitive style
funnels their thought processes and efforts towardidea creation, rather than toward idea implementa-tion. As a consequence, innovators’ creative outputoften does not accommodate the needs, constraints,or interests of organizational decision makers (Kir-ton, 1988), with the result that a fair share of theirideas are never implemented into successful inno-vations. Since gaining the support and coordinatedaction needed for idea implementation is especiallydifficult for individuals embedded in brokering net-works (Gargiulo, Ertug, & Galunic, 2009; Obstfeld,2005), innovators whose workplace ties span manystructural holes may come up with many novelideas, but the share of those ideas that becomeimplemented into actual innovations is likely to beespecially low.
Based on a complementary fit argument (Ostroff,2012), we argue conversely that innovators willbenefit from a closed social network of denselyinterconnected colleagues. By facilitating cooperationand “coordinated action,” closed networks conveya form of social capital conducive to idea imple-mentation (Obstfeld, 2005: 101). Corroborating thisview, prior research found that employees embeddedin closed networks have an edge when seeking the
TABLE 1Summary of the Combined Effects of Network Structure and Cognitive Style on Innovative Performance
Type of social capital Adaptive–innovative cognitive style
Innovators Adaptorsc More likely to reframe problems,recombine information, and generatenovel ideas
c Ideas more acceptable to others and in linewith existing frames, makingimplementation easier
c Inept at gaining support for ideas andmaking them acceptable to others, thushindering their implementation
c Strong adherence to consensually agreedcognitive frames impedes recombinationand novel idea generation
Brokering network structure Innovators in brokering position Adaptors in brokering positionc Heterogeneous information environment
aids idea creation and informationrecombination
Although supportive of idea generation,disconnected networks makecoordination and mobilization difficult.As a result, such networks fail to make upfor innovators’ inaptitude in ideaimplementation.
Diversity of perspectives in a brokeringnetwork stimulates adaptors to discovernovel connections among them. Thisvision advantage is complemented byadaptors’ innate ability to frame solutionsin acceptable ways, allowing them togarner support for the implementation ofnew ideas.
c Unconnected contacts make coordinationand implementation difficult
Closed network structure Innovators in closed position Adaptors in closed positionc Homogeneous information environment
simplifies coordination and makesnetwork more supportive, aiding ideaimplementation
Innovators’ inborn ability to reframeproblems and generate novel solutions iscomplemented by a supportive socialmilieu wherein coordination is lessdifficult, making ideas more likely to beimplemented.
Despite its benefits with respect to ideaimplementation, closed networks providelittle support in the generation of novelideas, which is where adaptors arelacking.c Information redundancy and normative
pressure hinders novel idea generation
2015 885Carnabuci and Dioszegi
sponsorship and resources needed to realize their ini-tiatives (Flap &Volker, 2001), and that this is especiallytrue when such initiatives are based on uncon-ventional, creative ideas (Baer, 2012). Furthermore,closed networks facilitate consensus formation (Lott& Lott, 1961), which is critical when trying to putnovel ideas into effect within the organizationalcontext (Baer, 2012; Kijkuit & Van Den Ende, 2007).Because innovators frequently come upwith creativeideas, but often fail to implement them, they shouldbenefit most from a social milieu that supports themthroughout the process of idea implementation.Consistent with the notion of complementarity fit,these arguments suggest that a closed workplacenetwork will confer the kind of social capital nec-essary to take full stock of innovators’ characteristicinclination to focus on idea creation, while con-currently compensating for their main weakness:their limited focus on idea implementation.
The complementary fit argument also suggeststhat the innovative performance of adaptors will belower when they are embedded within a closednetwork than when they are embedded in a broker-ing one. The social capital generated by closedworkplace networks is valuable insofar as it facili-tates the idea-implementation process, but offerslittle support in generating creative ideas, which isprecisely where adaptors are lacking. Therefore,although closed networks may aid adaptors in imple-menting their ideas, these ideas will most likely not benovel. Extant research found that closed networks of-ten cut individuals off from novel ideas flowing out-side of their immediate social environment (Uzzi,1997), which may amplify adaptors’ inherent prefer-ence forwell-established ideas over novel ones, aswellas their reluctance to consider solutions that breakaway from current practice. Similarly, adaptors’ in-clination to address problems through commonly ac-cepted frameworks is likely to intensify, sinceclosed networks often present a “well-defined andconsistent normative framework” that disciplinessocial action (Gargiulo et al., 2009) and curtailsindividual creativity (Gargiulo & Benassi, 1999:305). As a result, adaptors embedded within aclosed workplace network can be expected to ex-hibit a very low innovative performance.
Adaptors’ innovative performance should insteadbenefit from the kind of social capital generatedby brokering social networks. Because adaptors’information-processing style discourages cognitivereframing, adaptors generally find it hard to envi-sion creative idea combinations, which reducesboth the number and the novelty of the ideas they
generate (Basadur, 1995; Talbot, 1997). A workplacenetwork spanning structural holes would providethe kind of social capital needed to offset this weak-ness. By broadening the diversity of views and opin-ions that individuals must discuss and try to reconcilewhile carrying out their tasks, a brokering networkwould make it necessary for adaptors to frame andreframe problems from multiple, and possibly dis-crepant, perspectives, stimulating them to envisionconnections between previously unrelated ideas.Furthermore, by embedding employees within a het-erogeneous information environment, brokering so-cial networks would serve to counteract adaptors’tendency to focus on well-established and commonlyaccepted solutions, pushing them to process novelinformation and to combine ideas in unusual ways. Atthe same time, the close attention that adaptors pay toconverting creative ideas into implemented solutionswould allow them to take full stock of the idea-generation benefits inherent in brokering networkpositions. As a result, we expect that a workplacenetwork rich in structural holes will confer the kind ofsocial capital necessary to compensate for adaptors’main weakness—their tendency to generate few cre-ative ideas—while concurrently helping them to fullyprofit from their strength in implementing creativeideas. These arguments lead to our central hypothesis:
Hypothesis 3. Themore innovative (adaptive) anindividual’s cognitive style, the more a closed(brokering) workplace social network will en-hance his or her innovative performance.
SETTING, DATA, AND MEASURES
We drew the empirical data to test our theoryfrom a small Italian design and manufacturing firm,which we dub “ItalianSofa” to preserve anonymity.ItalianSofa has been a leading designer and pro-ducer of sofas for more than 40 years, with a pres-ence both in Italy and abroad. This empirical settingis strategic to test the theoretical integration postu-lated in this study for multiple reasons. Interviewswith the chief executive officer (CEO) and uppermanagement suggest that both idea creation andidea implementation are of utmost importance tothe organization. While some combination of ideacreation and idea implementation is essential in allorganizations and jobs (Amabile, 1996a), findingevidence of complementarity effects is not neces-sarily easy in many empirical settings. Creativityis certainly pivotal in a fashion-driven marketin which design is a key element of success;
886 Academy of Management Journal June
nevertheless, ItalianSofa is also a manufacturingfirm, and as such it values operational and organi-zational efficiency. Furthermore, most of our inter-viewees stressed that ItalianSofa has a collaborativeculture that emphasizes the role of informal, in-terpersonal relations within the workplace, both asa value in itself and as a means of increasing em-ployee performance. Such emphasis on cooperationand social networks may partly reflect the fact thatItalianSofa is a family-owned business, as well asthe broader national culture within which thecompany is embedded (Hofstede, 1976), and con-firms us in our opinion that ItalianSofa is a suitablesite in which to test how workplace social networksaffect employees’ innovative performance.
The sample that we use comprises the entire or-ganization, including first-line managers and theCEO, amounting to 68 persons in total. A sample ofthis size is appropriate for complete-network stud-ies using survey data. Smaller samples may be toolow on statistical power, while larger ones maygenerate poor-quality network data owing to thecognitive effort required by complete-network sur-veys. For that reason, prior survey-based researchusing complete-network data has used samples ofcomparable size (Hayton, Carnabuci, & Eisenberger,2012; Mehra, Kilduff, & Brass, 2001). We collectedthe data through personal distribution of two ques-tionnaires: one to all members of the organization, andone only to managers. Because the organization islocated in Italy, we administered the questionnaires inItalian. Participation was voluntary, and we assuredparticipants that we would use the results only forresearch purposes and would not reveal their identi-ties. The first questionnaire consisted of two parts: thefirst collecting demographic information and ques-tions related to cognitive style, the second collectingrelational data. We obtained a 100% response rate,which is of key importance because incomplete datacreate serious methodological problems in socialnetwork analysis (Wasserman & Faust, 1994). Westress that we collected network data through a “rostermethod”—that is, we did not ask employees to freelyrecall their contacts; rather, we presented them witha complete list of all other employees and asked themto tick their contacts. The roster method is superiorto the less time-consuming “free recall” approachfor two reasons: First, free recalls tend to provideless accurate information (Hammer, 1984); andsecond, research has shown that respondents havesystematic biases when asked to recall their con-tacts’ contacts (Kumbasar, Romney, & Batchelder,1994). This is a problem for studies of brokerage,
since individuals tend to recall fewer structuralholes than there actually are, and such recall errorsvary systematically with individuals’ previous ex-perience and personality traits (Casciaro, 1998;Janicik & Larrick, 2005). Because the roster approachreconstructs the complete network by consolidatinginformation from respondents’ direct contacts, iteliminates this problem. The second questionnaireasked questions related to employee performanceand we distributed this only to those in a supervisoryposition (25 people).
We collected relational data about intraorganiza-tional advice relations. These relations are keyconduits of information within organizations (Lomi,Lusher, Pattison, & Robins, 2013), and have beenfound to influence performance (Sparrowe et al.,2001). Following a consolidated practice (Sparroweet al., 2001), we phrased the network question asfollows: “Which of your colleagues do you turn tofor advice in professional, technical, or work-relatedmatters?” We accompanied this question with a listcontaining (in alphabetical order) the names of allemployees. We asked respondents to tick next to thenames of their colleagues, indicating their sourcesof advice. We also asked them how often they turnto each colleague for advice. Possible answers were“at least once a week,” “at least once a month,” and“less than once a month” (Burt, 1984). We did notlimit the number of nominated contacts, in order toreducemeasurement error (Holland & Leinhardt, 1973).We recoded answers to indicate tie strengths, resultingin a directed, weighted network of interpersonaladvice ties. We entered the data in a 68 3 68 squarematrix and used UCINET 6.381 (Borgatti, Everett, &Freeman, 2002) to compute all network measures.
Respondents reported an average of 10.2 col-leagues as contacts whom they consult for advice.Of these advice relations, 14.3% represent strongties (“at least once a week”), 37% represent mod-erately strong ties (“at least once a month”), and theremaining 48.7% represent weak ties (“less thanonce a month”). The distribution of network tiessuggests that lateral relations are of key importance.For example, 65% of advice relations by lowerranked employees are directed at their own hierar-chical level, and interdepartmental ties abound,with as many as 69% of advice relations amonglower ranked employees cutting across depart-mental borders. These statistics align well withthe company descriptions that emerged duringthe interviews, which emphasized the role of in-terpersonal ties and collaboration as a key part ofItalianSofa’s culture.
2015 887Carnabuci and Dioszegi
Measures
Cognitive style. We measured cognitive style us-ing Kirton’s (1976) Adaption–Innovation Inventory(KAI).1 Kirton developed the KAI to measure hisadaption–innovation construct (Kirton, 1976, 1989). Itis a measure of cognitive style and not of level, mean-ing that it is independent of cognitive ability, cognitivecomplexity, and creative capability (Goldsmith, 1985;Kirton, 1978, 1987). Several studies found thescale’s internal consistency to be high (Foxall &Haskins, 1986; Goldsmith & Kerr, 1991). Significantcorrelations between adaptive-innovative cognitivestyle and sensation seeking (Goldsmith, 1984),openness to change (Kwang, Ang, Ooi, Shin, Oei, &Leng, 2005), and other theoretically relevant per-sonality dimensions (e.g., Basadur, 1995; Houtz,Selby, Esquivel, Okoye, Peters, & Treffinger, 2003)provide evidence of convergent validity. Discrimi-nant validity is evidenced by statistical indepen-dence between cognitive style and measures ofcognitive ability (Chan, 1996; Kirton, 1978, 1992).Cognitive style has been found to be stable over time(Taylor, 1994). Evidence for the scale’s reliability isprovided by a large number of studies conductedwith different populations and in different countries(e.g., Bagozzi & Foxall, 1995; Shiomi & Loo, 1999).The instrument comprises 32 questions. Each ques-tion asks respondents how difficult it would be forthem to behave in the way described—that is, topresent a certain image of themselves for an extendedperiod of time. Example items include “Never actswithout proper authority” and “Likes to vary setroutines at a moment’s notice.” Respondents selecttheir answers from a scale of 1 to 5 (15 very hard, 55very easy). Answers are coded in such a way thatinnovators score high, while adaptors score low. Be-cause we use absolute scores (Pounds & Bailey, 2001),theoretical values range from 32 to 160, while theobserved range in our sample is between 68 and 108.Consistent with theory and prior research (e.g., Kirton1976, 1992), the observed distribution is normalaccording to both the Shapiro–Wilk test (Shapiro &Wilk, 1965) and the Skewness–Kurtosis test (Jarque &Bera, 1987), with a mean of 87.40 and a standard de-viation of 7.72. The Cronbach’s a for our sample isacceptable, but rather low (0.64)—an issue that wewill address in the additional analysis section. Fi-nally, we observed interdepartmental differences inaverage KAI scores, in accordance with prior research
(Kirton & McCarthy, 1988). We found “marketing andcommunication” and “research and development” tobe the most innovator-oriented departments (withaverage KAI scores of, respectively, 101.2 and 92.8),while “production” (85.3), “quality, safety and envi-ronment” (84.8), and “administration, finance, andcontrolling” (82.5) are geared more toward adaptors.
Network brokerage. We calculated network bro-kerage using the “structural holes” routine in UCINET6.381 (Borgatti, Everett, & Freeman, 2002), which wespecified as (the additive inverse of) Burt’s originalconstraint measure (Burt, 1992: 55). This specificationallowsus tomeasure brokerage and closure as twopolaropposites—that is, a high level of brokerage impliesa low level of closure, and vice versa. This is consistentwith our theory, with Burt’s original formulation, andwith extant literature on the brokerage–closure debate(Adler &Kwon, 2000; Burt, 1992, 2005). Themeasure ofnetwork brokerage pertains to the weighted, directedadvice network, and ranges within the [0, 1] interval(0 5 maximal closure, 1 5 maximal brokerage).
Innovator–brokerage interaction. To test our in-teraction hypothesis (Hypothesis 3), we first mean-centered, and then multiplied, innovator and networkbrokerage to create a new variable, labeled innovator–brokerage interaction.
Innovative performance. We measured employ-ees’ innovative performance using the Role-BasedPerformance Scale (RBPS), a theory-based and widelyvalidated measure of role performance (Welbourne,Johnson, & Erez, 1998).2 The RBPS is a generalizable(that is, not context-specific) measure of employeeperformance, consisting of the following five compo-nents: job, career, team, organization, and innovation.For the purposes of this study, we used only the “in-novation” subsection, because it directly captures theexplanandum of our theory. The “innovation” sub-section measures both idea creation and idea imple-mentation, and comprises the following four items:“Coming up with new ideas,” “Working to implementnew ideas,” “Finding improved ways to do things,”and “Creating better processes and routines.” Theresponse format was a five-point Likert scale (1 5needs much improvement, 5 5 excellent). Follow-ing Welbourne and colleagues (1998), our de-pendent variable was created using the sum of allresponses, ranging from a theoretical minimum of4 to a theoretical maximum of 20. We relied onsupervisory ratings, asking supervisors to compilethe “innovation” subscale of the RBPS for each
1 The instrument is protected by copyright and wasused with permission from the copyright owner.
2 The instrument was used with written permissionfrom Theresa M. Welbourne.
888 Academy of Management Journal June
employee reporting directly to them, resulting ina single performance value for each employee basedsolely on the evaluations provided by his or hersupervisor without discussing the evaluations withothers. Supervisory ratings are the most commonlyused proxy for measuring performance in organ-izations (Arvey & Murphy, 1998). The employeeinnovative performance data pertain to 67 employ-ees rather than 68, because the CEO reports to nosupervisor and hence was not evaluated.
Control variables. We controlled for a numberof demographic, organizational, and psychologicalvariables that might unduly affect our estimatesof interest. Demographic variables include gender(female = 1), age, and level of education. Controllingfor gender is important because it may affect employeecognitive style (Sim & Wright, 2002) and because su-pervisory biases may lead to differential performanceevaluations based on subordinates’ gender (Shore &Thornton, 1986). Age was included because olderindividuals tend to have a more adaptive cognitivestyle (Kirton, 1976) and may receive lower perfor-mance ratings than their younger peers (Ferris, Yates,Gilmore, & Rowland, 1985). Education was includedmainly because of its theorized connection with in-novative behavior (Scott & Bruce, 1994). Reflecting theItalian higher education system, the level of educationvariable was measured on a four-point scale (15 highschool diploma, 2 5 bachelor’s degree (three years),3 5 laurea (four-year, post-secondary, academic de-gree), 4 5 bachelor’s plus master’s degree).
We included a control for job tenure, measured asthe number of years in the job, because tenure mayaffect both employees’ performance (Sturman,2003) and ability to occupy brokering positions(Mehra et al., 2001). We also controlled for hierar-chical position on a three-point scale (1 5 lowestlevel, 3 5 highest level), with a fourth level (4) asa reference category including only the CEO. Weincluded this variable because prior work found it torelate to both advice network brokerage and in-novative performance (Ibarra & Andrews, 1993).
We also added two variables characterizing in-dividual traits that might confound our effects ofinterest. We controlled for employees’ level of self-monitoring, using a revised version of the Self-Monitoring Scale (O’Cass, 2000). Prior researchfound high self-monitors to be more likely to occupybrokering network positions and to be better able toreap the benefits inherent in these positions (Mehraet al., 2001). Furthermore, high self-monitors aremore likely to have an innovative cognitive style(Hutchinson & Skinner, 2007). We also measured
employees’ individualistic–collectivistic value ori-entation (collectivism) by using the Individualism–
Collectivism Scale (Wagner &Moch, 1986). Evidenceexists that individuals engaging in brokering behaviorsmay come across as being oriented toward in-dividualistic values, which may hamper their per-formance in contexts in which collectivistic valuesare predominant (Xiao & Tsui, 2007). In addition,the connection between individualism and creativity(Goncalo & Staw, 2006) might suggest thatindividualistic–collectivistic value orientations mayrelate to cognitive style and innovative performance.
Extant research suggests that an employee’s webof friendship relations within the workplace is animportant source of both instrumental and emo-tional support that may enhance employees’ per-formance (Brass, 1984; Hayton et al., 2012). Toaccount for this, we collected data on eachemployee’s friendship ties using a roster methodand constructed a variable identified as number offriends. Because people’s perceptions of who seesthem as a friend are not always accurate (Crockett,1982), we followed past research and considereda friendship tie to exist between two actors only ifboth actors reported it (Balkundi, Kilduff, Barsness,& Michael, 2007). We phrased the question for thefriendship network as follows: “Please indicate thecolleagues you regard as your friends.” We alsoasked employees to indicate the strengths of theirfriendship relations, which we recoded to indicatetie strengths (15 weak, 25 strong, 35 very strong).Because supervisors’ ratings might be affected bytheir relations with the employees whom they arerating (Lefkowitz, 2000), we introduced two furthercontrol variables to account for this possibility.Friendship from supervisor controls for whether ornot the supervisor rating the focal employee in-dicated a friendship relation to the employee, and ifso, the strength of this tie (1 5 weak, 25 strong, 35very strong), with a tie strength of zero (0) indicatingthe absence of a tie. Collaboration from supervisoraccounts for whether the supervisor indicateda collaborative relation with the focal employee; tiestrengths were based on indications of collaborationfrequency, phrased as “a few times over the wholeyear” (weak tie), “a few times a month” (mediumtie), and “daily or almost daily” (strong tie).
EMPIRICAL ANALYSIS AND RESULTS
Because we estimated our model through ordi-nary least squares (OLS), we ran an extensive setof diagnostic tests to ensure that all assumptions
2015 889Carnabuci and Dioszegi
underpinning linear regression models were met inthe context of our data. Both graphical and formalanalyses showed that the residuals are normallydistributed (Shapiro–Wilk W test for normality, p 5.14), which is important for hypothesis testing. Wefound no evidence of influential observations. Stu-dentized residuals were all below 2.5, and below 2in all but four cases. These four cases were employeeswho had all been hired recently. Removing or keepingthese observations left unaltered the direction andsignificance of our estimates of interest. The datashow no sign of heteroskedasticity, as is confirmed byCameron and Trivedi’s (1990) decomposition test(p 5 .44) and appear to be linear in the parameters.
Table 2 presents means, standard deviations, andpairwise correlations among the variables. We no-tice that zero-order correlations provide prima facieevidence for two of our three hypotheses, indicatinga positive relation between brokerage and innovativeperformance (r 5 .36, p , .01), as well as a positiverelation between innovator and innovative per-formance (r 5 .24, p , .05). Pairwise correlationsamong our independent variables are relatively low.The triad of variables age, job tenure, and hierar-chical position represents a mild exception, show-ing moderately high correlation coefficients andindividual variance inflation factors ranging from3.03 to 3.75. We are not concerned about multi-collinearity, though, because the mean varianceinflation factor (VIF) for our model is 1.85 and thehighest value is 3.75. Furthermore, removing thetriad of variables from our regression equation doesnot have any noteworthy effect on the significanceand effect size of our variables of interest. It may alsobe interesting to note the significant positive correla-tion between the dependent variable and several of thecontrol variables—namely, job tenure and hierarchicallevel (p , .01), as well as age, self-monitoring, collec-tivism, and collaboration from supervisor (p, .05). Ofthe organizational control variables, job tenure is themost strongly correlated with innovative performance(r 5 .41, p , .01), which suggests that accumulatedwork-related experience also plays a role in innovationsuccess. Further, the fact that brokerage is positivelycorrelated to hierarchical position (r 5 .27, p , .05)underscores the importance of controlling for hierar-chy in our analysis.
Table 3 presents the results of our OLS estima-tions. Models 1–3 are nested: Model 1 estimatesa specification including only control variables;Model 2 adds the effects of innovator and brokerage;Model 3 adds the interaction term—our core variableof interest. In all models, we mean-centered self-
monitoring, collectivism, brokerage, and innovator tofacilitate interpretation. Model 1 shows that, of all thecontrol variables, only collectivism has an effect onour dependent variable. However, the effect is barelysignificant (p 5 .097) and loses significance com-pletely with the addition of innovator. Model 2 intro-duces the innovator and brokerage variables. Theirinclusion significantly improves the overall fit of themodel, as the difference in F-tests between Models 2and 1 is significant at the 0.01 level (F(2, 54) 5 5.17).While collectivism is no longer significant, we do ob-serve a weak positive effect of self-monitoring (p, .1),a result that might reflect the importance of in-terpersonal dynamics within ItalianSofa. In line withprior studies (Burt, 1992; Mehra et al., 2001), we findthat being embedded in a brokering network positivelyinfluences employees’ performance (p , .05), pro-viding support for Hypothesis 1. With regard to cog-nitive style, we observe that innovators in our samplereach significantly higher performance levels thanadaptors (p, .05), in line with Hypothesis 2. Model 3introduces our core variable of interest, innovator–brokerage interaction. The coefficient for this variableis negative and statistically significant (p , .01). Im-portantly, introducing innovator–brokerage interac-tion substantially improves model fit, as indicated bythe fact that the difference in F-tests between Models3 and 2 is significant at the 0.01 level (F(1, 53)5 13.46).These results corroborate Hypothesis 3.
Owing to the nested nature of our data, we addeda model to account for possible unobserved differ-ences in performance ratings across departments. Ifnot accounted for, these differences might generateclusters in the error structure, potentially affectingstandard errors and significance statistics. We there-fore augmented Model 3 by specifying cluster-robuststandard errors at the department level (White, 1984)(see Model 4). Our three hypothesized effects becamesomewhat weaker, but continued to hold (innovator:b 5 .17, p , .05; brokerage: b 5 5.67, p 5 .05;innovator–brokerage interaction: b 5 –1.78, p 5 .02).The highest VIF value in thismodel was 3.75, and theaverage value was 1.85. Furthermore, since our de-pendent variable is based on supervisory ratings andsupervisors may systematically differ in their ratingof employees, we added an additional model to ac-count for this possibility. In Model 5, we augmentedModel 3 by specifying cluster-robust standard errorsat the supervisor level. The significance of our mainestimates of interest remained unchanged (innovator:b 5 .17, p , .05; brokerage: b 5 5.67, p 5 .06;innovator–brokerage interaction: b 5 –1.78, p , .01)(highest VIF 5 3.75, mean VIF 5 1.85).
890 Academy of Management Journal June
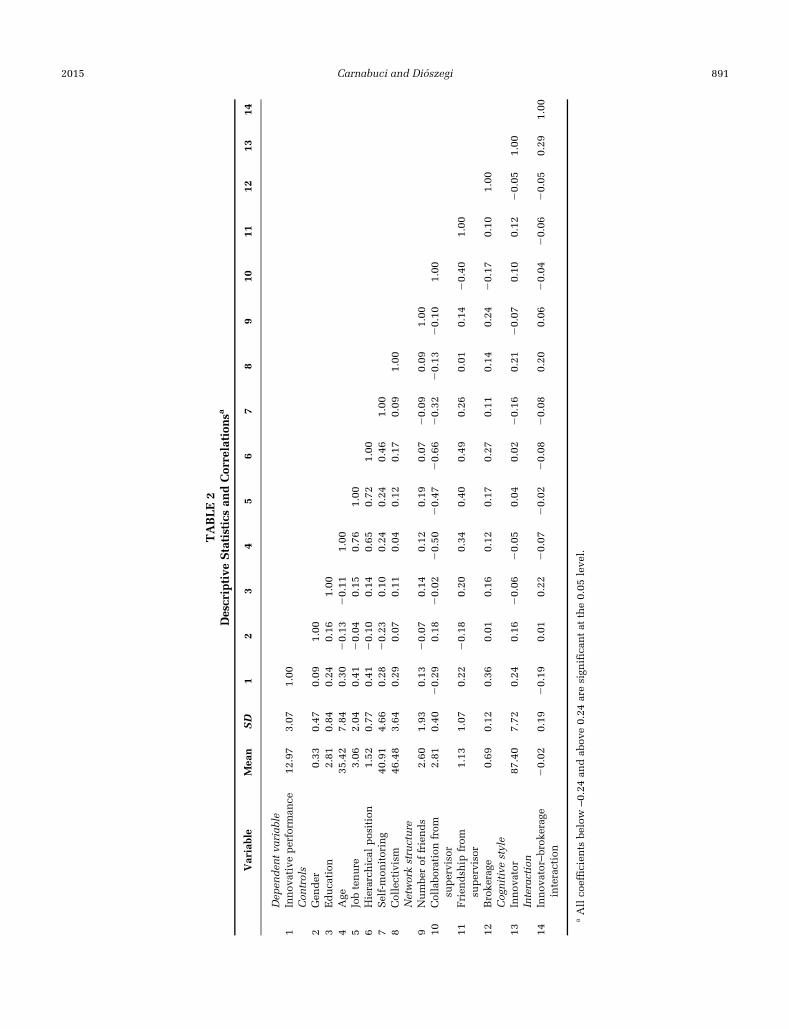
TABLE2
Descriptive
Statisticsan
dCorrelation
sa
Variable
Mea
nSD
12
34
56
78
910
1112
1314
Dep
enden
tva
riab
le1
Innov
ativeperform
ance
12.97
3.07
1.00
Con
trols
2Gen
der
0.33
0.47
0.09
1.00
3Education
2.81
0.84
0.24
0.16
1.00
4Age
35.42
7.84
0.30
20.13
20.11
1.00
5Jobtenure
3.06
2.04
0.41
20.04
0.15
0.76
1.00
6Hierarchical
position
1.52
0.77
0.41
20.10
0.14
0.65
0.72
1.00
7Self-mon
itoring
40.91
4.66
0.28
20.23
0.10
0.24
0.24
0.46
1.00
8Collectivism
46.48
3.64
0.29
0.07
0.11
0.04
0.12
0.17
0.09
1.00
Networkstructure
9Numbe
rof
friends
2.60
1.93
0.13
20.07
0.14
0.12
0.19
0.07
20.09
0.09
1.00
10Collabo
ration
from
supervisor
2.81
0.40
20.29
0.18
20.02
20.50
20.47
20.66
20.32
20.13
20.10
1.00
11Frien
dsh
ipfrom
supervisor
1.13
1.07
0.22
20.18
0.20
0.34
0.40
0.49
0.26
0.01
0.14
20.40
1.00
12Broke
rage
0.69
0.12
0.36
0.01
0.16
0.12
0.17
0.27
0.11
0.14
0.24
20.17
0.10
1.00
Cog
nitivestyle
13Innov
ator
87.40
7.72
0.24
0.16
20.06
20.05
0.04
0.02
20.16
0.21
20.07
0.10
0.12
20.05
1.00
Interaction
14Innov
ator–brok
erag
einteraction
20.02
0.19
20.19
0.01
0.22
20.07
20.02
20.08
20.08
0.20
0.06
20.04
20.06
20.05
0.29
1.00
aAllco
efficien
tsbe
low
–0.24
andab
ove0.24
aresign
ifican
tat
the0.05
leve
l.
2015 891Carnabuci and Dioszegi
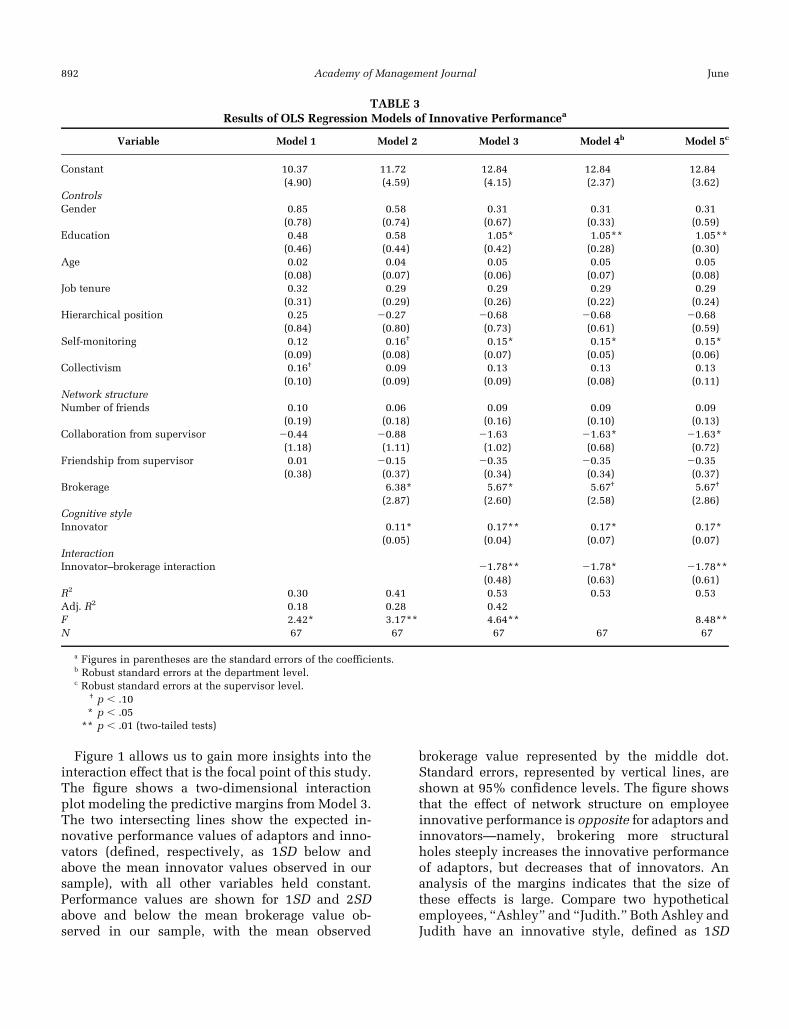
Figure 1 allows us to gain more insights into theinteraction effect that is the focal point of this study.The figure shows a two-dimensional interactionplot modeling the predictive margins from Model 3.The two intersecting lines show the expected in-novative performance values of adaptors and inno-vators (defined, respectively, as 1SD below andabove the mean innovator values observed in oursample), with all other variables held constant.Performance values are shown for 1SD and 2SDabove and below the mean brokerage value ob-served in our sample, with the mean observed
brokerage value represented by the middle dot.Standard errors, represented by vertical lines, areshown at 95% confidence levels. The figure showsthat the effect of network structure on employeeinnovative performance is opposite for adaptors andinnovators—namely, brokering more structuralholes steeply increases the innovative performanceof adaptors, but decreases that of innovators. Ananalysis of the margins indicates that the size ofthese effects is large. Compare two hypotheticalemployees, “Ashley” and “Judith.” Both Ashley andJudith have an innovative style, defined as 1SD
TABLE 3Results of OLS Regression Models of Innovative Performancea
Variable Model 1 Model 2 Model 3 Model 4b Model 5c
Constant 10.37 11.72 12.84 12.84 12.84(4.90) (4.59) (4.15) (2.37) (3.62)
ControlsGender 0.85 0.58 0.31 0.31 0.31
(0.78) (0.74) (0.67) (0.33) (0.59)Education 0.48 0.58 1.05* 1.05** 1.05**
(0.46) (0.44) (0.42) (0.28) (0.30)Age 0.02 0.04 0.05 0.05 0.05
(0.08) (0.07) (0.06) (0.07) (0.08)Job tenure 0.32 0.29 0.29 0.29 0.29
(0.31) (0.29) (0.26) (0.22) (0.24)Hierarchical position 0.25 20.27 20.68 20.68 20.68
(0.84) (0.80) (0.73) (0.61) (0.59)Self-monitoring 0.12 0.16† 0.15* 0.15* 0.15*
(0.09) (0.08) (0.07) (0.05) (0.06)Collectivism 0.16† 0.09 0.13 0.13 0.13
(0.10) (0.09) (0.09) (0.08) (0.11)Network structureNumber of friends 0.10 0.06 0.09 0.09 0.09
(0.19) (0.18) (0.16) (0.10) (0.13)Collaboration from supervisor 20.44 20.88 21.63 21.63* 21.63*
(1.18) (1.11) (1.02) (0.68) (0.72)Friendship from supervisor 0.01 20.15 20.35 20.35 20.35
(0.38) (0.37) (0.34) (0.34) (0.37)Brokerage 6.38* 5.67* 5.67† 5.67†
(2.87) (2.60) (2.58) (2.86)Cognitive styleInnovator 0.11* 0.17** 0.17* 0.17*
(0.05) (0.04) (0.07) (0.07)InteractionInnovator–brokerage interaction 21.78** 21.78* 21.78**
(0.48) (0.63) (0.61)R2 0.30 0.41 0.53 0.53 0.53Adj. R2 0.18 0.28 0.42F 2.42* 3.17** 4.64** 8.48**N 67 67 67 67 67
a Figures in parentheses are the standard errors of the coefficients.b Robust standard errors at the department level.c Robust standard errors at the supervisor level.
† p , .10* p , .05
** p , .01 (two-tailed tests)
892 Academy of Management Journal June
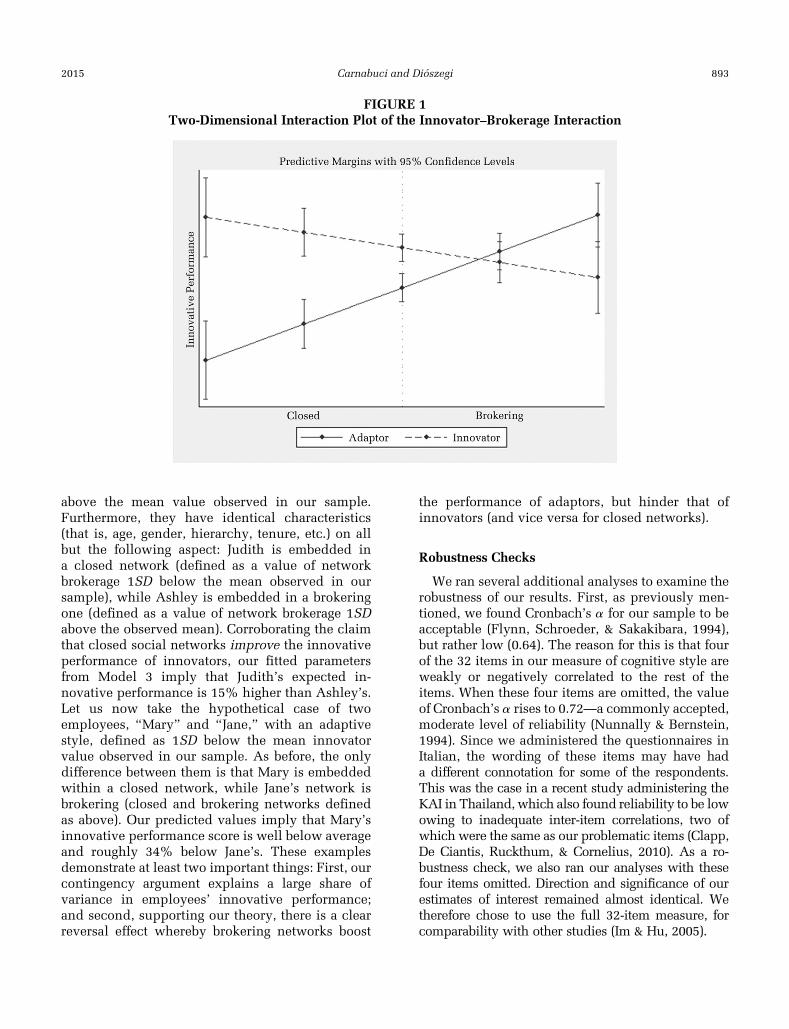
above the mean value observed in our sample.Furthermore, they have identical characteristics(that is, age, gender, hierarchy, tenure, etc.) on allbut the following aspect: Judith is embedded ina closed network (defined as a value of networkbrokerage 1SD below the mean observed in oursample), while Ashley is embedded in a brokeringone (defined as a value of network brokerage 1SDabove the observed mean). Corroborating the claimthat closed social networks improve the innovativeperformance of innovators, our fitted parametersfrom Model 3 imply that Judith’s expected in-novative performance is 15% higher than Ashley’s.Let us now take the hypothetical case of twoemployees, “Mary” and “Jane,” with an adaptivestyle, defined as 1SD below the mean innovatorvalue observed in our sample. As before, the onlydifference between them is that Mary is embeddedwithin a closed network, while Jane’s network isbrokering (closed and brokering networks definedas above). Our predicted values imply that Mary’sinnovative performance score is well below averageand roughly 34% below Jane’s. These examplesdemonstrate at least two important things: First, ourcontingency argument explains a large share ofvariance in employees’ innovative performance;and second, supporting our theory, there is a clearreversal effect whereby brokering networks boost
the performance of adaptors, but hinder that ofinnovators (and vice versa for closed networks).
Robustness Checks
We ran several additional analyses to examine therobustness of our results. First, as previously men-tioned, we found Cronbach’s a for our sample to beacceptable (Flynn, Schroeder, & Sakakibara, 1994),but rather low (0.64). The reason for this is that fourof the 32 items in our measure of cognitive style areweakly or negatively correlated to the rest of theitems. When these four items are omitted, the valueof Cronbach’s a rises to 0.72—a commonly accepted,moderate level of reliability (Nunnally & Bernstein,1994). Since we administered the questionnaires inItalian, the wording of these items may have hada different connotation for some of the respondents.This was the case in a recent study administering theKAI in Thailand, which also found reliability to be lowowing to inadequate inter-item correlations, two ofwhich were the same as our problematic items (Clapp,De Ciantis, Ruckthum, & Cornelius, 2010). As a ro-bustness check, we also ran our analyses with thesefour items omitted. Direction and significance of ourestimates of interest remained almost identical. Wetherefore chose to use the full 32-item measure, forcomparability with other studies (Im & Hu, 2005).
FIGURE 1Two-Dimensional Interaction Plot of the Innovator–Brokerage Interaction
2015 893Carnabuci and Dioszegi
Second, in addition to the analysis presented inModel 4, we conducted further analyses to accountfor possible unobserved differences across depart-ments. We began by modeling departments’ fixedeffects, including a set of dummy variables. Becausethere are 11 departments within ItalianSofa and oursample size was 67, including 10 (cross-correlated)dummies in our regression model exceedingly re-duced the model’s degrees of freedom, while si-multaneously generating huge multicollinearity(highest VIF 5 18.52, mean VIF 5 6.83). We there-fore chose to run further analyses to pinpoint whichdepartments systematically affected our results. Wefound consistently higher performance ratings in“marketing and communication” and “informationsystems,” and consistently lower performance rat-ings in “logistics.” We then ran our regression testsaugmenting Model 3 with dummies for thesedepartments (see Model 3 in Table A1). The maineffect of innovator lost significance (b5 .01, p5 .77),while that of brokerage remained largely unchanged(b 5 4.30, p , .05), as did the innovator–brokerageinteraction (b 5 –1.30, p , .01). Additional analysesrevealed that the effect of innovator tends to bewashed away by that of “marketing and communica-tion.” As it turns out, this department has both a highaverage innovative performance and a strong con-centration of innovators. As we discuss later, theseresults may suggest that the main effect of cognitivestyle on innovation may in part depend on how cre-ative the context is within which employees operate.
Third, although network constraint is a widelyused measure of network brokerage (Gargiulo &Benassi, 1999; Xiao & Tsui, 2007), we also ran ouranalysis using the alternative measure of ego net-work density. We found all three hypotheses tohold. The effect of innovator weakened slightly, butremained significant (b5 .15, p, .01), while that ofbrokerage became stronger and more significant(b 5 .08, p , .01). The interaction of cognitive styleand network structure was slightly weakened, butremained significant (b 5 –.01, p , .05).
We also ran additional analyses to ensure that ourresults held when including further control varia-bles. We began by investigating the role of formalhierarchy. We created three dummy variables tomodel each hierarchical level separately, as op-posed to estimating a single parameter, as in ourmain model. None of these dummies had a signifi-cant effect and including them did not affect ourvariables of interest. In an attempt to control forsupervisors’ span of control, we also constructeda variable called number of subordinates, capturing
the number of direct reports of each supervisor(people in nonsupervisory roles were assigneda value of 0). This variable did not have a significanteffect on innovative performance, nor did its in-clusion change our results. Finally, we addeda variable for status, since a sizeable body of workhas shown that employees’ informal status positionwithin the workplace is an important predictor ofperformance (Brass et al., 2004; Sparrowe et al.,2001). We constructed this variable from data on ad-vice relations. Asking for advice is a signal of defer-ence from the advice seeker to the source of advice,and the extent to which such signals confer statusdepends on the status of the advice seeker (Ibarra &Andrews, 1993). Bonacich (1987) formalized this ar-gument and proposed a network index, known as theBonacich Centrality Index, which has become a stan-dard measure of status among organizational networkscholars (Friedkin, 1991). We therefore constructedour status variable using this measure. We set the bparameter to slightly less than the reciprocal of theeigenvalue (b 5 .017), as suggested by Bonacich(1987). Including this variable left our variables ofinterest unaffected (innovator: b 5 .17, p , .01; bro-kerage: b 5 6.29, p 5 .07; innovator–brokerage in-teraction: b5 –1.76, p, .01). The effect of status itselfwas not significant (b 5 –.42, p 5 .77).
We present additional analyses with robust stan-dard errors, random intercepts, and random coef-ficients at the department and supervisor levels inthe Appendix.
DISCUSSION
Although idea creation and idea implementationare both critical aspects of the innovation process,several previous studies have pointed out that theconditions favoring idea creation are often in contrastwith those favoring idea implementation, resultingin what has been termed an “innovation paradox”(Miron-Spektor et al., 2011). Reflecting this paradox,research into the role of workplace social networksfound that employees embedded in brokering posi-tions have an advantage during the idea-creationphase, while closed networks of mutually tied con-tacts favor idea implementation. Since producingsuccessful innovations requires both the creation andthe implementation of novel ideas, this research didnot offer conclusive answers to a question of boththeoretical and practical relevance: Which type ofnetwork structure is most conducive to employeeinnovation? We offered one answer to this questionby developing a “complementary fit” argument that
894 Academy of Management Journal June
integrates an individual-level, cognitive perspectiveinto existing network theory. Since workplace socialnetworks influence the innovation process by shap-ing the information accruing to employees (Burt,2004, 2005), we argued that understanding whichkind of network position is more likely to heighten anemployee’s innovative performance requires exami-nation of that employee’s idiosyncratic information-processing style. Drawing from adaption–innovationtheory (Kirton, 1976, 1989) in particular, we arguedthat workplace networks rich in structural holesmaximize the innovative performance of employeeswith an adaptive cognitive style; conversely, closednetworks boost the innovative performance of indi-viduals with an innovative cognitive style. Using dataon the individual cognitive styles and completeworkplace social networks of all employees withina design and manufacturing firm, we found that ourtheorized complementary fit argument accounted fora large share of empirical variation in employeeinnovative performance over and above currentlyexisting social network explanations.
By demonstrating that cognitive style moderatesthe effect of social networks on innovative perfor-mance, the present study contributes to the contin-gency view of social networks (Anderson, 2008;Burt, 1997). This line of inquiry significantly ad-vanced our understanding of workplace social net-works by unraveling how network effects varydepending on various critical contingencies, in-cluding the complexity of the information circulat-ing through the network (Hansen, 1999), the speedat which such information changes (Aral & VanAlstyne, 2011), and the competence area of theactors receiving it (Carnabuci & Operti, 2013). Re-cently, multiple studies adopting a contingencyperspective have focused on the role of individualcognition, showing that the same network structuremay lead to very different outcomes depending onindividuals’ need for cognition (Anderson, 2008),level of self-monitoring (Mehra et al., 2001), andcognitive activation strategies (Smith, Menon, &Thompson, 2012). The present study contributes tothis growing area of research by showing that in-dividual cognitive style is a key contingency explain-ing how social networks affect employee innovation.Specifically, we posit that because adaptors andinnovators have opposite strengths and weaknesses,they are likely to benefit from different networkpositions. Consistent with the notion of “comple-mentary fit,” we argued that a network rich instructural holes would supplement adaptors’shortcomings in the creation of original ideas, while
at the same time providing them with more oppor-tunities to exploit their distinctive strength inimplementing such ideas. Conversely, a closed so-cial network of mutually interconnected colleagueswould help innovators to compensate for their mainweakness—a difficulty in implementing ideas—while helping them to fully profit from their dis-tinctive strength in coming up with novel and cre-ative ideas.
Perhaps the most counterintuitive insight of ourcontingency argument is that being entrenchedwithin a clique of densely interconnected col-leagues may boost, rather than dampen, innovativeperformance for a nonnegligible portion of anorganization’s workforce. While this finding chal-lenges the widely established tenet that individualinnovation requires networks rich in structuralholes, it is important to emphasize that the theo-retical argument that explains this finding builds onand extends current social network theory. In linewith extant network literature, we theorized andshowed that employees with a brokering socialnetwork generally exhibit a higher innovative per-formance relative to comparable individuals occu-pying a closed network position. This findingcorroborates the structuralist claim that networksaffect employees’ performance by shaping the in-formation environment around them. Respondingto recent calls for psychologically informed con-ceptualizations of social networks (Barsade et al.,2012; Kilduff & Krackhardt, 2008), our contingencyargument advanced a straightforward, yet conse-quential, extension of the structuralist argument.While retaining the assumption that social networksaffect the kind of information accruing to individ-uals, we drew from research on cognitive style toargue that individuals differ systematically in howthey process the information accruing to themthrough the network. Allowing for such individual-level differences suggests that not all individualsbenefit equally from the same network position.Consistent with this view, we combined insights frompsychological and network research to argue that theheterogeneous information environment characteris-tic of brokering social networks is especially benefi-cial for individuals with an adaptive cognitive style.Departing from previous studies that found structuralholes to benefit innovation in general, however,we argued further that a closed network of inter-connected contacts boosts the innovative perfor-mance of employees with an innovative cognitivestyle. Thus our theorized mechanism enriches exist-ing network-structural explanations by articulating
2015 895Carnabuci and Dioszegi
how cognitive style generates a reversal effect in therelationship between social networks and innovativeperformance.
In addition to contributing to the contingencyview of social networks, the present study adds tothe extant literature by explicitly integrating boththe brokerage and the closure views of social capitalwithin a unitary explanation.While the brokerage viewbuilds on the premise that being innovative requiresemployees to generate creative ideas (Hemphala &Magnusson, 2012), the extent to which this abilityconverts into an employee’s overall innovativeperformance may vary depending on his or her ef-ficacy in implementing those ideas. Building on thisinsight, the closure view of social capital posits thatbecause closed social networks facilitate ideaimplementation, while the presence of structuralholes hinders it, under some conditions networkclosure may enhance innovation. Multiple scholarshave pointed out that reconciling the brokerage andclosure views of social capital is essential to deep-ening our understanding of how workplace net-works affect performance (e.g., Adler & Kwon, 2002;Lin, Cook, & Burt, 2001). Toward this end, Burt(2005) proposed that one way in which to resolvethe discrepancies separating the closure and bro-kerage views is to apply the two arguments to dif-ferent levels of analysis. Accordingly, he suggestedthat the most innovative organizations are thosewhose employees build brokering connections out-side their teams, but network closure within them.Other attempts at integrating the closure and bro-kerage views have built on the notion that in-novation is a two-stage process, involving thecreation of ideas and their subsequent imple-mentation (Anderson, Potocnik, & Zhou, 2014). Inthis vein, for example, Obstfeld (2005) suggestedthat while brokering networks facilitate the genera-tion of good ideas, as required by the first stage ofinnovation, success in the implementation stagenecessitates the mobilization of closed networks.
Contributing to these integrative attempts, wereconciled the brokerage and closure views by in-corporating the role of cognitive style within existingnetwork-structural models of social capital. In linewith the notion that social capital resides in therelations connecting individuals, received socialcapital research examined in detail the networkswithin which individuals are embedded (Brass et al.,2004), while it typically treated individual-level dif-ferences as nuisances that may be safely assumedaway (Kilduff & Tsai, 2003). Departing from this ap-proach, we proposed that individual cognition is an
integral part of how social networks confer socialcapital to individuals. Accordingly, accounting forheterogeneity in individual cognitive style is criticalto push further current theories of social capital.Augmenting existing network-structural models ofsocial capital with insights from adaptive–innovativetheory (Kirton, 1976, 1989), we illuminated theconditions under which brokering and closed net-works enhance individual innovative performance,thereby explicitly incorporating both views withina unitary explanation.
Limitations and Future Research
This study has several limitations, which in turnpoint to opportunities for future research. While theresearch site chosen for our analyses allowed us tocapture unusually rich information on employees’workplace social networks, a key limitation is thatour data are cross-sectional. This makes it difficultto exclude the possibility of endogeneity, as well asto rule out possible alternative explanations for ourfindings. Because sizeable research has demon-strated that cognitive styles are stable individualtraits that do not change over time (Taylor, 1994),endogeneity is unlikely to represent an issue withregard to this variable. Nevertheless, it is possiblethat cognitive style and innovative performance willconcurrently affect which kind of social networkindividuals develop within the workplace. Whileconclusively ruling out endogeneity concerns isimpossible in the absence of appropriate data, wecarried out a set of additional analyses to ensure thatthe risk of endogeneity is limited. We begin by no-ticing that network position is uncorrelated withcognitive style (r5 –.05, p5 n.s.). Further, in a set ofanalyses not reported here, we used exponentialrandom graph models (ERGMs) to examine furtherthe relation between the aforementioned variables.A key strength of these models is that they enabledirect parameterizing of the network structure at thedyadic and extradyadic levels, as opposed to ag-gregating network information at the individuallevel. This allows for estimating the probability thatindividuals with a higher innovative performance,or with a more innovative cognitive style, forma brokering tie. The ERGMs analyses suggest thatneither individuals’ cognitive styles nor their in-novative performance affect the probability of de-veloping a brokering network.
While these analyses alleviate our concerns ofendogeneity, future research should put our theo-rized causal mechanisms to a more conclusive test.
896 Academy of Management Journal June
Ideally, this would require a research designleveraging panel data within a quasi-experimentalsetting. While collecting complete social networkdata about various aspects of people’s workplacenetwork, as we have done, would probably makethis task too daunting, a more realistic possibilitywould be to use archival network data in a way akinto Rider (2014). In order to tease out the causal effectof U.S. lawyers’ social (professional) networks ontheir ability to find a prestigious job, Rider usedarchival data on each lawyer’s history of prior or-ganizational affiliations to trace his or her networkcontacts. Further, he exploited a quasi-experimentalsetting generated by the sudden and unexpecteddissolution of six U.S. law firms. Treating thesedissolution events as an exogenous shock causingmobility, the author was able to identify and gaugethe causal effect of individuals’ networks on struc-turing job opportunities net of possible endogenousfactors. To provide more conclusive evidence insupport of our arguments, as well as to rule out pos-sible alternative explanations of our findings, futureresearch could use a similar quasi-experimental de-sign and test our theorized causal effects within a set-ting in which the workplace social network is shakenup by an exogenous shock.
A straightforward extension of our study would beto expand consideration to the interpersonal ties thatemployees create across organizations. While we fo-cused exclusively on intraorganizational networks,prior research has shown that ties reaching out toother organizations are often an important conduit ofinformation that may affect innovation (Mors, 2010).Indeed, one of the earliest studies on the relation be-tween social networks and innovation identified the“gatekeeper”—an individual who draws informationfrom the organization’s external environment andspreads it internally through his or her workplacesocial network—as an especially critical figure withininnovative organizations (Tushman & Katz, 1980).While many studies exist that examine the role ofgatekeepers from a social network perspective, thetheory developed in this paper suggests that it may beimportant to consider their cognitive styles, too. Ourtheory suggests that adaptors are likely to be moreeffective gatekeepers than innovators, for two reasons.First, the role of the gatekeepers is not to generate newideas, but to draw ideas from the external informationand to “translate” them, so that they become usefuland usable within the organization (Tushman & Katz,1980). Second, a distinguishing characteristic ofa gatekeeper is that his or her internal and externalnetworks are both rich in structural holes, because this
is essential for the gatekeeper to be able to both tapand disseminate information efficiently (Allen &Cohen, 1969; Tushman, 1977). While testing thispresumption empirically should be relatively straight-forward, we believe that the results of such a testmight shed new light on an important line of inquiryfor scholars of networks and innovation.
The central hypothesis advanced and tested in thepresent study emphasizes the importance of com-plementary fit. Future research should extend ourarguments by addressing a related question that wehave left unanswered: What is the role of “similarityfit” in the link between cognitive style and socialnetworks? Our conjecture is that, while comple-mentary fit is important to understanding how cogni-tive style and social networks combine to affectindividual performance, similarity fit may playa role in explaining with whom individuals prefer toform a tie. As Cable and Edwards (2004: 823) put it,similarity fit occurs when individuals experiencevalue congruence, and as such it “should affectemployees’ attitudes and behaviors because peopleare more attracted to and trusting of others who aresimilar to them.” In line with the concept of “net-work homophily” (McPherson, Smith-Lovin, &Cook, 2001), therefore, the notion of similarity fitsuggests that employees should generally prefer toform a tie with contacts who are similar to them onsome relevant dimension. Because people find iteasier to trust and understand those similar to them,the similarity fit logic suggests further that similarity-based ties are also more likely to survive over timethan ties between dissimilar persons. Taken together,these arguments lead to the conjecture that employ-ees’ social networks will generally comprise contactswith a similar cognitive style to that of the focal em-ployee. By shifting the focus of analysis to the com-position of social networks, rather than its structure,this line of argument highlights an interesting tensionbetween the complementary fit and the similarity fitlogics. On the one hand, people may preferentiallyform interpersonal ties with colleagues whose cogni-tive style is similar to theirs; on the other hand, thecomplementarity logic suggests that forming ties withcontacts whose cognitive style is similar to their ownmight stifle individuals’ innovative performance.
We began to explore this pair of conjectures usingour study population. To examine whether employ-ees are more likely to have ties with colleagues witha similar cognitive style, we ran a Geary (1954) au-tocorrelation test. The results of the test suggest thatpeople do tend to havemore tieswith contacts whosecognitive style is similar to their own (pseudo p, .05).
2015 897Carnabuci and Dioszegi
To investigate whether this tendency depressesindividuals’ innovative performance, we first con-structed a variable called cognitive misfit. Thisvariable captures the extent to which an individu-al’s contacts have a cognitive style that differs fromhis or her own. Specifically, it measures the (abso-lute value of the) difference between the focalindividual’s KAI score and that of each of his or hercontacts, weighted by the strength of each tie. Wethen included this variable as an additional cova-riate to our main statistical model. The results showa positive and significant result of cognitive misfiton individuals’ innovative performance (b 5 .12,p , .05). Taken together, our analyses provide ini-tial evidence that people tend to form ties withothers whose cognitive style is similar to theirs(reflecting a similarity fit logic), but that doing sohampers their innovative performance (in line withthe complementary fit logic). While we regard thisevidence as merely suggestive, we are hopeful thatfuture studies will further explore these interestingresults empirically, as well as theoretically.3
Future research could extend the arguments pre-sented in this paper in several directions. One di-rection that seems especially promising links ourresults to the recent stream of research on socialnetwork activation. For example, Smith and col-leagues (2012) found that high-status persons re-spond to job threats by seeking support froma relatively large share of their contacts and that thecontacts they activate are often separated by struc-tural holes. Conversely, low-status individuals re-spond to the same kind of threat by activatinga smaller and more densely connected portion oftheir network. As mentioned above, we found thatcognitive style does not influence individuals’ so-cial network position within our empirical setting.However, it is possible that adaptors and innovatorsdiffer in how they use their social networks. Sinceadaptors and innovators differ systematically inhow they seek information when trying to solvea problem, they might also differ in how they navi-gate their network when seeking information. Whilewe think that delving into these questions wouldhelp us to gain a better understanding of the linkbetween cognitive style and social networks, thescope and research design of our study did not allowus to explore them. Similarly, we used a single or-ganization for our empirical analyses. Testing ourhypotheses across multiple organizations and
sectors would be important in order to understandthe scope conditions of our arguments. Most nota-bly, the setting of our study places a premium oncreativity. While this trait is typical of most in-novation and brokerage studies, it would be im-portant to examine whether our results hold in lesscreative settings. Interestingly, the theoretical argu-ments that we developed suggest that while themain effect of social networks and cognitive stylemay vary depending on how much emphasis thecontext places on creativity, the contingent effectthat is at the core of our theory should not. Thereason is that we predicted brokerage and innovatorto have a main effect on innovative performance,because they increase the likelihood that employeeswill come up with new ideas. Since idea creation(unlike idea implementation) is a defining aspect ofinnovative performance in most contemporaryorganizations, one might speculate that the smallerthe premium placed on creativity within a givencontext, the smaller the main effect of brokerageand innovator will be. Alternatively, one mightsuppose that contexts that place a premium oncreativity may attract innovators, while repellingadaptors (Kirton & McCarthy, 1988), thereby gen-erating a differential selection process. In line withthis conjecture, we found a remarkable concentra-tion of innovators within ItalianSofa’s marketingand communication department, and additionalanalyses (see Appendix) provide initial evidencethat a selection process may be at work. Whateverthe specific mechanism, it seems likely that theeffects of brokerage and innovator vary in intensitydepending on context. Conversely, the comple-mentarity benefit derived from combining ideacreation with idea implementation, which is at thebasis of our contingency hypothesis, should berobust across creative and noncreative sectors. Wehope that future research will test the veridicalityof these arguments.
Managerial Implications
This study also bears straightforward implica-tions for managers and practitioners. The advancesmade over the past years in our understanding ofworkplace social networks have not only deeplyinfluenced current management scholarship, butalso changed the curriculum of management cour-ses in executive education, as well the services of-fered by consulting firms in human resources andorganization-related areas (Burt & Ronchi, 2007;Cross & Parker, 2004). Similarly, we think that the
3 We thank an anonymous reviewer for pointing us inthis fruitful direction.
898 Academy of Management Journal June
insights generated by our study have direct and ac-tionable implications that might enhance currentmanagerial practice. On a general level, our findingsdemonstrate that if managers want to enhance theinnovative performance of their employees, theyneed to develop a keen understanding not only oftheir employees’ social networks, but also of theircognitive styles. Collecting social network data hasbecome a well-established practice among manymanagers trying to increase the social capital oftheir employees (Cross & Parker, 2004). Our findingssuggest that collecting data on employees’ in-dividual cognitive styles would provide managerswith the additional information needed to un-derstand which type of social capital their employ-ees need. Recognizing that employees have differentcognitive styles would also help managers to escapeeasy solutions that may have unexpectedly negativeconsequences. Let us imagine, for example, thata manager needs to foster out-of-the-box thinking torefresh the company’s existing product line andtherefore hires a highly innovative person. Thismanager may have learned from executive educa-tion, or through managerial books, that fosteringnovelty and creative thinking requires embeddingthe newly hired person within a brokering socialnetwork that spans structural holes. Our resultssuggest that, by nurturing such a network aroundthe newly hired employee, the manager would in-advertently, but severely, hamper the new employ-ee’s performance. Knowing that innovators performbest within closed networks, while structural holesbenefit adaptors, will allow the manager to avoidthese kinds of misjudgments and help him or her tomaximize the firm’s innovativeness.
Similarly, the theory and findings presented inthis paper provide guidance to employees seekingto boost their own innovative performance. Becausedifferent cognitive styles benefit from different kindsof social networks, gaining awareness of his or heridiosyncratic cognitive style is a necessary first stepif an employee is seeking to develop an effectivenetworking strategy. Our study suggests that employ-ees should aim at developing a brokering or a closedsocial network depending on whether they have anadaptive or an innovative cognitive style, respectively.While the results we documented show that doing sowould enhance employees’ innovativeness, theyalso suggest that it may be a difficult goal to ach-ieve. Within the research site analyzed by thepresent paper, for example, people’s cognitivestyle had no discernible influence on the structureof their social networks. This might reflect
different causes: People may not be aware of theirown cognitive style, they may not be aware of thebenefits deriving from developing a social networkmatching their cognitive style, or they may not beable to map and manipulate the structure of theirnetwork. Countering these causes likely requiresspecialized training. While research found thatpeople often fail to identify structural holes amongtheir contacts (Janicik & Larrick, 2005), for exam-ple, Burt and Ronchi (2007) showed that trainingemployees about the advantages of structural holesleads them to develop a more brokering social net-work. In addition to training, building a social net-work that matches one’s own cognitive style likelyrequires different socializing strategies. For exam-ple, company party mixers have become an estab-lished way by which individuals try to developbridging connections with colleagues who are farfrom their own existing network (Ingram & Morris,2007). Our results suggest that these kinds of eventsare likely to be especially beneficial for adaptors,because they may aid them in expanding the rangeof structural holes that they broker. Conversely,innovators should benefit from investing in team-building activities and tertius iungens (“third whojoins”) tactics aimed at creating cohesion betweentheir contacts (Obstfeld, 2005), because these mayhelp them to build closure within their socialnetworks.
REFERENCES
Adler, P. S., & Kwon, S. W. 2000. Social capital: The good,the bad, and the ugly. In E. R. Lesser (Ed.), Knowledgeand social capital: Foundations and applications:89‒115. Woburn, MA: Butterworth-Heinemann.
Adler, P. S., & Kwon, S. W. 2002. Social capital: Prospectsfor a new concept. Academy of Management Re-view, 27: 17–40.
Allen, T. J., & Cohen, S. I. 1969. Information flow in re-search and development laboratories. Administra-tive Science Quarterly, 14: 12–19.
Amabile, T. M. 1996a. Creativity and innovation inorganizations. Boston, MA: Harvard Business School.
Amabile, T. M. 1996b. Creativity in context. Boulder, CO:Westview Press.
Anderson, M. H. 2008. Social networks and the cognitivemotivation to realize network opportunities: A studyof managers’ information gathering behaviors. Jour-nal of Organizational Behavior, 29: 51–78.
Anderson, N., Potocnik, K., & Zhou, J. 2014. Innovationand creativity in organizations: A state-of-the-science
2015 899Carnabuci and Dioszegi
review, prospective commentary, and guiding frame-work. Journal of Management, 20: 1–37.
Aral, S., & Van Alstyne, M. 2011. The diversity–bandwidthtrade-off.American Journal of Sociology, 117: 90–171.
Arvey, R. D., & Murphy, K. R. 1998. Performance evalua-tion in work settings. Annual Review of Psychology,49: 141–168.
Baer, M. 2012. Putting creativity to work: The imple-mentation of creative ideas in organizations.Academyof Management Journal, 55: 1102–1119.
Baer, M., Oldham, G. R., & Cummings, A. 2003. Re-warding creativity: When does it really matter? TheLeadership Quarterly, 14: 569–586.
Bagozzi, R. P., & Foxall, G. R. 1995. Construct-validity andgeneralizability of the Kirton Adaption–Innovation In-ventory. European Journal of Personality, 9: 185–206.
Balkundi, P., Kilduff, M., Barsness, Z. I., & Michael, J. H.2007. Demographic antecedents and performanceconsequences of structural holes in work teams.Journal of Organizational Behavior, 28: 241–260.
Barsade, S., Casciaro, T., Edmondson, A., Gibson, C.,Krackhardt, D., & Labianca, G. J. 2012. Call for papers fora special issue of organization science: The psychologyof organizational networks. Organization Science, 23:596.
Basadur, M. 1995. Optimal ideation evaluation ratios.Creativity Research Journal, 8: 63–75.
Bonacich, P. 1987. Power and centrality: A family of meas-ures. American Journal of Sociology, 92: 1170–1182.
Borgatti, S. P., Everett, M. G., & Freeman, L. C. 2002.UCINET for windows: Software for social networkanalysis. Harvard, MA: Analytic Technologies.
Brass, D. J. 1984. Being in the right place: A structuralanalysis of individual influence in an organization.Administrative Science Quarterly, 29: 518–539.
Brass, D. J., Galaskiewicz, J., Greve, H. R., & Tsai, W. 2004.Taking stock of networks and organizations: A mul-tilevel perspective. Academy of Management Jour-nal, 47: 795–817.
Burt, R. S. 1984. Network items and the General SocialSurvey. Social Networks, 6: 293–339.
Burt, R. S. 1992. Structural holes: The social structure ofcompetition. Cambridge,MA: HarvardUniversity Press.
Burt, R. S. 1997. The contingent value of social capital.Administrative Science Quarterly, 42: 339–365.
Burt, R. S. 2000. The network structure of social capital.Research in Organizational Behavior, 22: 345–423.
Burt, R. S. 2004. Structural holes and good ideas. Amer-ican Journal of Sociology, 110: 349–399.
Burt, R. S. 2005. Brokerage and closure: An introductionto social capital. Oxford: Oxford University Press.
Burt, R. S., & Ronchi, D. 2007. Teaching executives to seesocial capital: Results from a field experiment. SocialScience Research, 36: 1156–1183.
Cable, D. M., & Edwards, J. R. 2004. Complementary andsupplementary fit: A theoretical and empirical integration.The Journal of Applied Psychology, 89: 822–834.
Cameron, A. C., & Trivedi, P. K. 1990. The informationmatrix test and its applied alternative hypothesis.Working Paper 372. Institute of Governmental Affairs,University of California, Davis, Davis, CA.
Carnabuci, G., & Operti, E. 2013. Where do firms’recombinant capabilities come from? Intraorganiza-tional networks, knowledge, and firms’ ability to in-novate through technological recombination. StrategicManagement Journal, 34: 1591–1613.
Casciaro, T. 1998. Seeing things clearly: Social structure,personality, and accuracy in social network percep-tion. Social Networks, 20: 331–351.
Chan, D. 1996. Cognitive misfit of problem-solving style atwork: A facet of person-organization fit. Organiza-tional Behavior and Human Decision Processes, 68:194–207.
Clapp, R. G., De Ciantis, S. M., Ruckthum, V., & Cornelius,N. 2010. The use of the Kirton Adaption–InnovationInventory in Thailand: An exploratory study.e-Journal of the Graduate School of Business,Assumption University of Thailand, 3: 3–24.
Crockett, W. H. 1982. Balance, agreement, and positivityin the cognition of small social structures. Advancesin Experimental Social Psychology, 15: 1–57.
Cross, R., & Cummings, J. N. 2004. Tie and network cor-relates of individual performance in knowledge-intensive work. Academy of Management Journal,47: 928–937.
Cross, R., & Parker, A. 2004. The hidden power of socialnetworks: Understanding how work really getsdone in organization. Cambridge, MA: HarvardBusiness School.
Emirbayer, M., & Goodwin, J. 1994. Network analysis,culture, and the problem of agency. American Jour-nal of Sociology, 99: 1411–1454.
Ferris, G. R., Yates, V. L., Gilmore, D. C., & Rowland, K. M.1985. The influence of subordinate age on perfor-mance ratings and causal attributions. PersonnelPsychology, 38: 545–557.
Flap, H., & Volker, B. 2001. Goal-specific social capitaland job satisfaction: Effects of different types of net-works on instrumental and social aspects of work.Social Networks, 23: 297–320.
Fleming, L. 2002. Finding the organizational sources oftechnological breakthroughs: The story of Hewlett‐Packard’s thermal ink‐jet. Industrial and CorporateChange, 11: 1059–1084.
900 Academy of Management Journal June
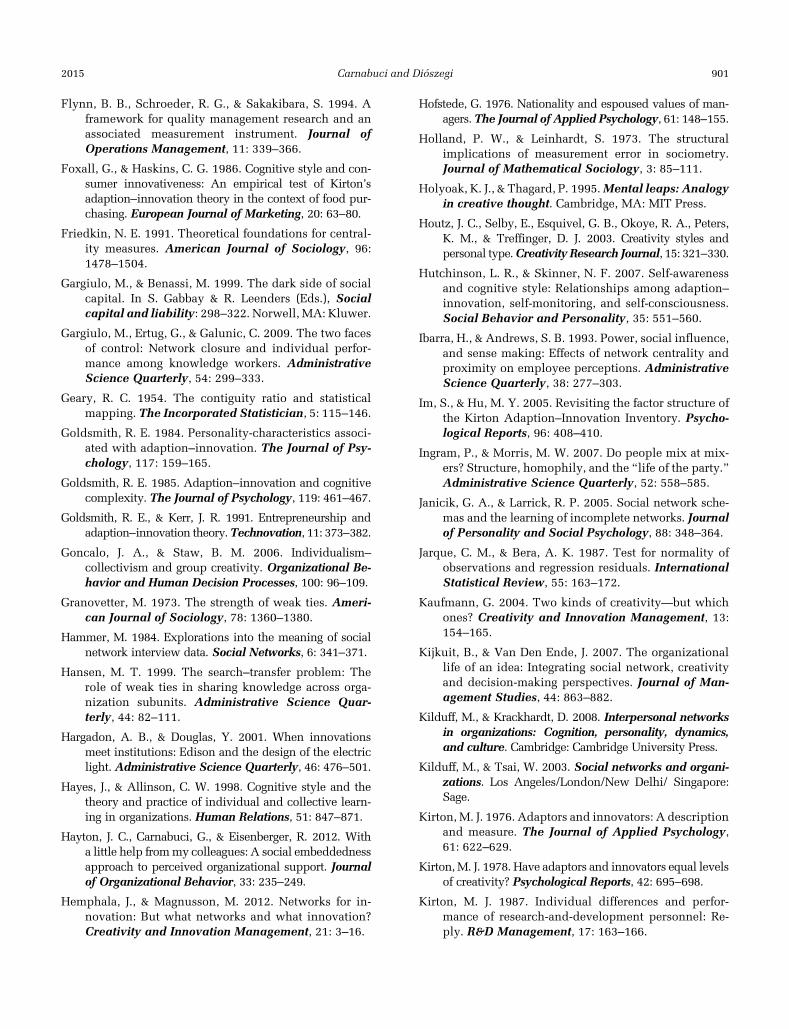
Flynn, B. B., Schroeder, R. G., & Sakakibara, S. 1994. Aframework for quality management research and anassociated measurement instrument. Journal ofOperations Management, 11: 339–366.
Foxall, G., & Haskins, C. G. 1986. Cognitive style and con-sumer innovativeness: An empirical test of Kirton’sadaption–innovation theory in the context of food pur-chasing. European Journal of Marketing, 20: 63–80.
Friedkin, N. E. 1991. Theoretical foundations for central-ity measures. American Journal of Sociology, 96:1478–1504.
Gargiulo, M., & Benassi, M. 1999. The dark side of socialcapital. In S. Gabbay & R. Leenders (Eds.), Socialcapital and liability: 298–322. Norwell, MA: Kluwer.
Gargiulo, M., Ertug, G., & Galunic, C. 2009. The two facesof control: Network closure and individual perfor-mance among knowledge workers. AdministrativeScience Quarterly, 54: 299–333.
Geary, R. C. 1954. The contiguity ratio and statisticalmapping. The Incorporated Statistician, 5: 115–146.
Goldsmith, R. E. 1984. Personality-characteristics associ-ated with adaption–innovation. The Journal of Psy-chology, 117: 159–165.
Goldsmith, R. E. 1985. Adaption–innovation and cognitivecomplexity. The Journal of Psychology, 119: 461–467.
Goldsmith, R. E., & Kerr, J. R. 1991. Entrepreneurship andadaption–innovation theory.Technovation, 11: 373–382.
Goncalo, J. A., & Staw, B. M. 2006. Individualism–
collectivism and group creativity. Organizational Be-havior and Human Decision Processes, 100: 96–109.
Granovetter, M. 1973. The strength of weak ties. Ameri-can Journal of Sociology, 78: 1360–1380.
Hammer, M. 1984. Explorations into the meaning of socialnetwork interview data. Social Networks, 6: 341–371.
Hansen, M. T. 1999. The search–transfer problem: Therole of weak ties in sharing knowledge across orga-nization subunits. Administrative Science Quar-terly, 44: 82–111.
Hargadon, A. B., & Douglas, Y. 2001. When innovationsmeet institutions: Edison and the design of the electriclight. Administrative Science Quarterly, 46: 476–501.
Hayes, J., & Allinson, C. W. 1998. Cognitive style and thetheory and practice of individual and collective learn-ing in organizations. Human Relations, 51: 847–871.
Hayton, J. C., Carnabuci, G., & Eisenberger, R. 2012. Witha little help frommy colleagues: A social embeddednessapproach to perceived organizational support. Journalof Organizational Behavior, 33: 235–249.
Hemphala, J., & Magnusson, M. 2012. Networks for in-novation: But what networks and what innovation?Creativity and Innovation Management, 21: 3–16.
Hofstede, G. 1976. Nationality and espoused values of man-agers. The Journal of Applied Psychology, 61: 148–155.
Holland, P. W., & Leinhardt, S. 1973. The structuralimplications of measurement error in sociometry.Journal of Mathematical Sociology, 3: 85–111.
Holyoak, K. J., & Thagard, P. 1995.Mental leaps: Analogyin creative thought. Cambridge, MA: MIT Press.
Houtz, J. C., Selby, E., Esquivel, G. B., Okoye, R. A., Peters,K. M., & Treffinger, D. J. 2003. Creativity styles andpersonal type.Creativity Research Journal, 15: 321–330.
Hutchinson, L. R., & Skinner, N. F. 2007. Self-awarenessand cognitive style: Relationships among adaption–innovation, self-monitoring, and self-consciousness.Social Behavior and Personality, 35: 551–560.
Ibarra, H., & Andrews, S. B. 1993. Power, social influence,and sense making: Effects of network centrality andproximity on employee perceptions. AdministrativeScience Quarterly, 38: 277–303.
Im, S., & Hu, M. Y. 2005. Revisiting the factor structure ofthe Kirton Adaption–Innovation Inventory. Psycho-logical Reports, 96: 408–410.
Ingram, P., & Morris, M. W. 2007. Do people mix at mix-ers? Structure, homophily, and the “life of the party.”Administrative Science Quarterly, 52: 558–585.
Janicik, G. A., & Larrick, R. P. 2005. Social network sche-mas and the learning of incomplete networks. Journalof Personality and Social Psychology, 88: 348–364.
Jarque, C. M., & Bera, A. K. 1987. Test for normality ofobservations and regression residuals. InternationalStatistical Review, 55: 163–172.
Kaufmann, G. 2004. Two kinds of creativity—but whichones? Creativity and Innovation Management, 13:154–165.
Kijkuit, B., & Van Den Ende, J. 2007. The organizationallife of an idea: Integrating social network, creativityand decision-making perspectives. Journal of Man-agement Studies, 44: 863–882.
Kilduff, M., & Krackhardt, D. 2008. Interpersonal networksin organizations: Cognition, personality, dynamics,and culture. Cambridge: Cambridge University Press.
Kilduff, M., & Tsai, W. 2003. Social networks and organi-zations. Los Angeles/London/New Delhi/ Singapore:Sage.
Kirton, M. J. 1976. Adaptors and innovators: A descriptionand measure. The Journal of Applied Psychology,61: 622–629.
Kirton,M. J. 1978. Have adaptors and innovators equal levelsof creativity? Psychological Reports, 42: 695–698.
Kirton, M. J. 1987. Individual differences and perfor-mance of research-and-development personnel: Re-ply. R&D Management, 17: 163–166.
2015 901Carnabuci and Dioszegi
Kirton, M. J. 1988. Adaptors and innovators: Problemsolvers in organisations. In K. Gronhaug & G. Kaufmann(Eds.), Innovation: A cross-disciplinary perspective:45‒67. Oslo: Norwegian University Press.
Kirton, M. J. 1989. A theory of cognitive style. In M. Kirton(Ed.), Adaptors and innovators: 7‒27. London:Routledge.
Kirton, M. J. 1992. Adaptors and innovators: Problemsolvers in organisations. In S. S. Gryskiewicz &D. A. Hills (Eds.), Readings in innovation: 45‒66.Greensboro, NC: Centre for Creative Leadership.
Kirton, M. J. 1994. A theory of cognitive style. In M. J. Kirton(Ed.), Adaptors and innovators: Styles of creativityand problem solving: 1‒33. New York: Routledge.
Kirton, M. J., & De Ciantis, S. M. 1986. Cognitive style andpersonality: The Kirton adaption–innovation andCattell’s sixteen personality factor inventories. Per-sonality and Individual Differences, 7: 141–146.
Kirton, M. J., & McCarthy, R. M. 1988. Cognitive climateand organizations. Journal of Occupational Psy-chology, 61: 175–184.
Kozhevnikov, M. 2007. Cognitive styles in the context ofmodern psychology: Toward an integrated frameworkof cognitive style.Psychological Bulletin, 133: 464–481.
Kumbasar, E., Romney, A. K., & Batchelder, W. H. 1994.Systematic biases in social perception. AmericanJournal of Sociology, 100: 477–505.
Kwang, N. A., Ang, R. P., Ooi, L. B., Shin, W. S., Oei, T. P.,& Leng, V. 2005. Do adaptors and innovators sub-scribe to opposing values? Creativity ResearchJournal, 17: 273–281.
Laureiro-Martınez, D., Brusoni, S., Canessa, N., & Zollo,M. 2015. Understanding the exploration–exploitationdilemma: An fMRI study of attention control anddecision-making performance. Strategic ManagementJournal, 36: 319–338.
Lefkowitz, J. 2000. The role of interpersonal affectiveregard in supervisory performance ratings: A literaturereview and proposed causal model. Journal of Occu-pational and Organizational Psychology, 73: 67–85.
Lin, N., Cook, K. S., & Burt, R. S. 2001.Social capital: Theoryand research. Hawthorn, NY: Aldine de Gruyter.
Lomi, A., Lusher, D., Pattison, P. E., & Robins, G. 2013. Thefocused organization of advice relations: A study inboundary crossing.Organization Science, 25: 438–457.
Lott, A. J., & Lott, B. E. 1961. Group cohesiveness, com-munication level, and conformity. Journal of Ab-normal and Social Psychology, 62: 408–412.
Maas, C. J., & Hox, J. J. 2005. Sufficient sample sizes formultilevel modeling. Methodology: European Jour-nal of Research Methods for the Behavioral andSocial Sciences, 1: 86–92.
Martinsen, Ø. L., Kaufmann, G., & Furnham, A. 2011.Cognitive style and creativity. In M. A. Runco &S. R. Pritzker (Eds.), Encyclopedia of creativity:214‒221. New York: Academic Press.
McPherson, M., Smith-Lovin, L., & Cook, J. M. 2001. Birdsof a feather: Homophily in social networks. AnnualReview of Sociology, 27: 415–444.
Mehra, A., Kilduff, M., & Brass, D. J. 2001. The socialnetworks of high and low self-monitors: Implicationsfor workplace performance. Administrative ScienceQuarterly, 46: 121–146.
Miron-Spektor, E., Erez, M., & Naveh, E. 2011. The effect ofconformist and attentive-to-detail members on teaminnovation: Reconciling the innovation paradox.Academy of Management Journal, 54: 740–760.
Mors, M. L. 2010. Innovation in a global consulting firm:When the problem is too much diversity. StrategicManagement Journal, 31: 841–872.
Muchinsky, P. M., & Monahan, C. J. 1987. What isperson–environment congruence? Supplementary ver-sus complementary models of fit. Journal of Voca-tional Behavior, 31: 268–277.
Mumford, M. D., Baughman, W. A., Maher, M. A., Costanza,D. P., & Supinski, E. P. 1997. Process-basedmeasures ofcreative problem-solving skills, IV: Category combina-tion. Creativity Research Journal, 10: 59–71.
Nunnally, J. C., & Bernstein, I. H. 1994. Psychometrictheory (3rd ed.). New York: McGraw-Hill.
Obstfeld, D. 2005. Social networks, the tertius iungensorientation, and involvement in innovation. Admin-istrative Science Quarterly, 50: 100–130.
O’Cass, A. 2000. A psychometric evaluation of a revisedversion of the Lennox andWolfeRevisedSelf-MonitoringScale. Psychology and Marketing, 17: 397–419.
Ostroff, C. 2012. Person–environment fit in organizations. InS. W. J. Kozlowski (Ed.), Handbook of organizationalpsychology: 373‒408. Oxford: Oxford University Press.
Owens, W. 1969. Cognitive, noncognitive, and environ-mental correlates of mechanical ingenuity. TheJournal of Applied Psychology, 53: 199–208.
Pounds, J., & Bailey, L. L. 2001. Cognitive style andlearning: Performance of adaptors and innovators ina novel dynamic task. Applied Cognitive Psychol-ogy, 15: 547–563.
Rider, C. I. 2014. Educational credentials, hiring, andintra-occupational inequality: Evidence from lawfirm dissolutions. Working paper, November 3.Georgetown University, McDonough School of Busi-ness, Washington, DC. Available online at http://ssrn.com/abstract51881028
Rodan, S., & Galunic, C. 2004. More than network struc-ture: How knowledge heterogeneity influences
902 Academy of Management Journal June
managerial performance and innovativeness. Strate-gic Management Journal, 25: 541–562.
Rostan, S. M. 1994. Problem finding, problem solving, andcognitive controls: An empirical investigation of crit-ically acclaimed productivity. Creativity ResearchJournal, 7: 97–110.
Scott, S. G., & Bruce, R. A. 1994. Determinants of in-novative behavior: A path model of individual in-novation in the workplace.Academy of ManagementJournal, 37: 580–607.
Shalley, C. E., Zhou, J., & Oldham, G. R. 2004. The effectsof personal and contextual characteristics on crea-tivity: Where should we go from here? Journal ofManagement, 30: 933–958.
Shapiro, S. S., & Wilk, M. B. 1965. An analysis of variancetest for normality (complete samples). Biometrika,52: 591–611.
Shiomi, K., & Loo, R. 1999. Cross-cultural response styleson the Kirton Adaption–Innovation Inventory. SocialBehavior and Personality, 27: 413–419.
Shore, L. M., & Thornton, G. C. 1986. Effects of gender onself and supervisory ratings. Academy of Manage-ment Journal, 29: 115–129.
Sim, E. R., & Wright, G. 2002. A comparison ofadaption–innovation styles between information sys-tems majors and computer science majors. Journal ofInformation Systems Education, 13: 29–35.
Simonton, D. K. 1999. Creativity as blind variation andselective retention: Is the creative process Darwinian?Psychological Inquiry, 10: 309–328.
Singer, M. 1990. Individual differences in adaption–innovation and the escalation of commitment para-digm.The Journal of Social Psychology, 130: 561–563.
Smith, E. B., Menon, T., & Thompson, L. 2012. Statusdifferences in the cognitive activation of social net-works. Organization Science, 23: 67–82.
Sparrowe, R. T., Liden, R. C., & Wayne, S. J. 2001. Socialnetworks and the performance of individuals and groups.Academy of Management Journal, 44: 316–325.
Stum, J. 2009. Kirton’s adaption–innovation theory: Man-aging cognitive styles in times of diversity and change.Emerging Leadership Journeys, 2: 66–78.
Sturman, M. C. 2003. Searching for the inverted U-shapedrelationship between time and performance: Meta-analyses of the experience/performance, tenure/performance, and age/performance relationships.Journal of Management, 29: 609–640.
Talbot, R. 1997. Taking style on board (or how to get used tothe idea of creative adaptors and uncreative innovators).Creativity and Innovation Management, 6: 177–184.
Taylor, J. A. 1994. Stability of schoolchildren cognitive-style: A longitudinal-study of the Kirton Adaption–
Innovation Inventory. Psychological Reports, 74:1008–1010.
Tullett, A. D., & Davies, G. B. 1997. Cognitive style and af-fect: A comparison of the Kirton adaption–innovationand Schutz’s fundamental interpersonal relationsorientation–behaviour inventories (KAI and FIRO-B).Personality and Individual Differences, 23: 479–485.
Tushman, M. L. 1977. Special boundary roles in the in-novation process. Administrative Science Quar-terly, 22: 587–605.
Tushman, M. L., & Katz, R. 1980. External communicationand project performance: An investigation into the roleof gatekeepers. Management Science, 26: 1071–1085.
Uzzi, B. 1997. Social structure and competition in in-terfirm networks: The paradox of embeddedness.Administrative Science Quarterly, 42: 35–67.
Wagner, J. A., & Moch, M. K. 1986. Individualism–
collectivism: Concept and measure. Group & Orga-nization Management, 11: 280–304.
Wasserman, S., & Faust, K. 1994. Social network analy-sis: Methods and applications. Cambridge: Cam-bridge University Press.
Welbourne, T. M., Johnson, D. E., & Erez, A. 1998. Therole-based performance scale: Validity analysis ofa theory-based measure. Academy of ManagementJournal, 41: 540–555.
White, H. 1984. Asymptotic theory for econometricians.San Diego, CA: Academic Press.
Xiao, Z., & Tsui, A. S. 2007. When brokers may not work:The cultural contingency of social capital in Chinesehigh-tech firms. Administrative Science Quarterly,52: 1–31.
Gianluca Carnabuci ([email protected]) is an as-sociate professor of organization and management at theUniversita della Svizzera italiana (University of Lugano). Hereceived his PhD in social and behavioral sciences from theUniversity of Amsterdam. His research focuses on the roleand dynamics of social networks in innovative processes.
Balint Dioszegi ([email protected]) is a PhD candidateat the Department of Management, Technology andInnovation, ETH Zurich. His research focuses on theinterplay between social networks and cognition.
APPENDIX
We conducted several analyses to account for possibleunobserved differences across departments, as well asacross supervisors. The results of these analyses are
2015 903Carnabuci and Dioszegi
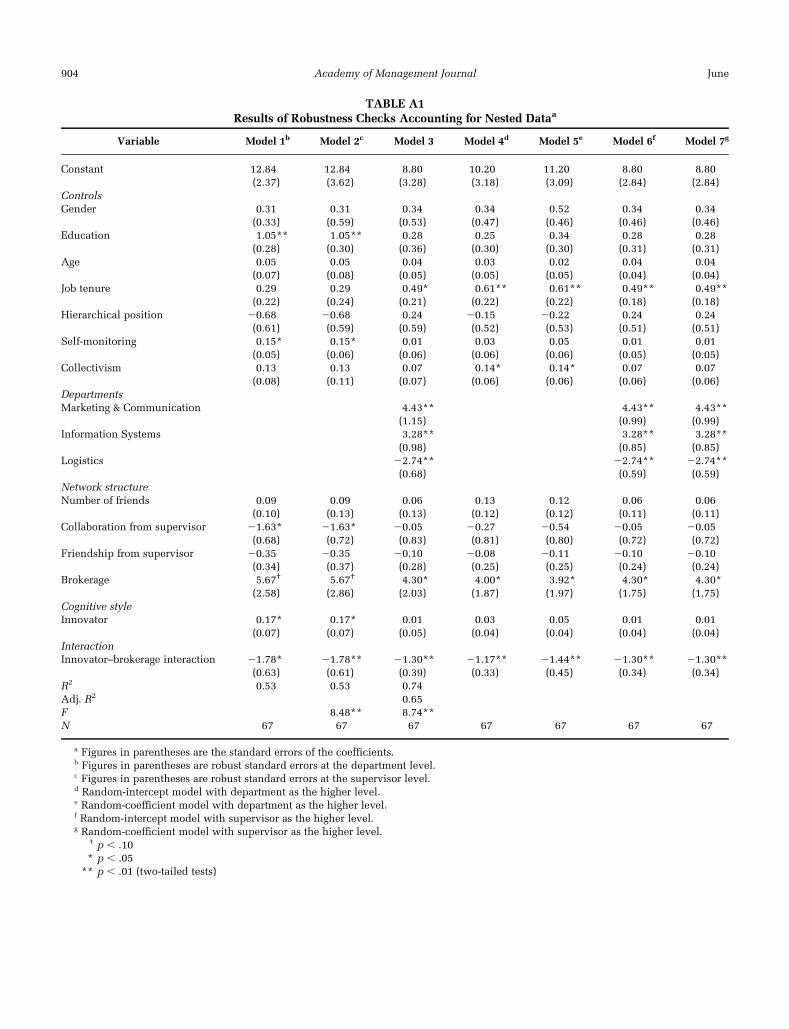
TABLE A1Results of Robustness Checks Accounting for Nested Dataa
Variable Model 1b Model 2c Model 3 Model 4d Model 5e Model 6f Model 7g
Constant 12.84 12.84 8.80 10.20 11.20 8.80 8.80(2.37) (3.62) (3.28) (3.18) (3.09) (2.84) (2.84)
ControlsGender 0.31 0.31 0.34 0.34 0.52 0.34 0.34
(0.33) (0.59) (0.53) (0.47) (0.46) (0.46) (0.46)Education 1.05** 1.05** 0.28 0.25 0.34 0.28 0.28
(0.28) (0.30) (0.36) (0.30) (0.30) (0.31) (0.31)Age 0.05 0.05 0.04 0.03 0.02 0.04 0.04
(0.07) (0.08) (0.05) (0.05) (0.05) (0.04) (0.04)Job tenure 0.29 0.29 0.49* 0.61** 0.61** 0.49** 0.49**
(0.22) (0.24) (0.21) (0.22) (0.22) (0.18) (0.18)Hierarchical position 20.68 20.68 0.24 20.15 20.22 0.24 0.24
(0.61) (0.59) (0.59) (0.52) (0.53) (0.51) (0.51)Self-monitoring 0.15* 0.15* 0.01 0.03 0.05 0.01 0.01
(0.05) (0.06) (0.06) (0.06) (0.06) (0.05) (0.05)Collectivism 0.13 0.13 0.07 0.14* 0.14* 0.07 0.07
(0.08) (0.11) (0.07) (0.06) (0.06) (0.06) (0.06)DepartmentsMarketing & Communication 4.43** 4.43** 4.43**
(1.15) (0.99) (0.99)Information Systems 3.28** 3.28** 3.28**
(0.98) (0.85) (0.85)Logistics 22.74** 22.74** 22.74**
(0.68) (0.59) (0.59)Network structureNumber of friends 0.09 0.09 0.06 0.13 0.12 0.06 0.06
(0.10) (0.13) (0.13) (0.12) (0.12) (0.11) (0.11)Collaboration from supervisor 21.63* 21.63* 20.05 20.27 20.54 20.05 20.05
(0.68) (0.72) (0.83) (0.81) (0.80) (0.72) (0.72)Friendship from supervisor 20.35 20.35 20.10 20.08 20.11 20.10 20.10
(0.34) (0.37) (0.28) (0.25) (0.25) (0.24) (0.24)Brokerage 5.67† 5.67† 4.30* 4.00* 3.92* 4.30* 4.30*
(2.58) (2.86) (2.03) (1.87) (1.97) (1.75) (1.75)Cognitive styleInnovator 0.17* 0.17* 0.01 0.03 0.05 0.01 0.01
(0.07) (0.07) (0.05) (0.04) (0.04) (0.04) (0.04)InteractionInnovator–brokerage interaction 21.78* 21.78** 21.30** 21.17** 21.44** 21.30** 21.30**
(0.63) (0.61) (0.39) (0.33) (0.45) (0.34) (0.34)R2 0.53 0.53 0.74Adj. R2 0.65F 8.48** 8.74**N 67 67 67 67 67 67 67
a Figures in parentheses are the standard errors of the coefficients.b Figures in parentheses are robust standard errors at the department level.c Figures in parentheses are robust standard errors at the supervisor level.d Random-intercept model with department as the higher level.e Random-coefficient model with department as the higher level.f Random-intercept model with supervisor as the higher level.g Random-coefficient model with supervisor as the higher level.
† p , .10* p , .05
** p , .01 (two-tailed tests)
904 Academy of Management Journal June
reported in Table A1. First, we ran models with robuststandard errors using the Huber–White Sandwich esti-mator, assuming error clustering at (a) the departmentlevel (Model 1), and (b) the supervisor level (Model 2).Second, we constructed three dummy variables for thethree departments with significantly different perfor-mance ratings (Model 3). Third, we examined random-intercept and random-coefficient models with departmentas the higher level (Models 4 and 5). Fourth, we fitted bothrandom-intercept (Model 6) and random-coefficients(Model 7) models at the supervisor level in addition tointroducing the three department-level dummies.
We note that the results of these analyses should betreated with caution, because multiple scholars warnagainst running multilevel analyses when the number ofhigher level groups and/or the size of these groups isrelatively small (e.g., Maas & Hox, 2005). This is certainlythe case with our data: the number of groups is small (with
a total of 25 supervisors and 11 departments), as is the sizeof these groups (on average, there are only 2.7 sub-ordinates per supervisor and 6.1 employees per de-partment). With this caveat in mind, the results indicatethat both our central hypothesis (Hypothesis 3) and Hy-pothesis 1 are supported in all models, while there is weakor no support for Hypothesis 2. These results align withthe premise that certain departments may attract and se-lect individuals with a specific cognitive style, leading toa differential selection process. This appears to be the casewithin ItalianSofa’s marketing and communication de-partment, in which we observed a concentration of indi-viduals with an innovative cognitive style (average KAIscore: 101.2). Insofar as controlling for the effect of“marketing and communication” washes away the maineffect of innovator, these results suggest that the benefitsof an innovative cognitive style are limited in contexts inwhich most peers have that same cognitive style.
2015 905Carnabuci and Dioszegi