Embed Size (px)
Citation preview

Social Origins of Adverse Reproductive Health Outcomes
Panel Presentation & Discussion
AGOS Annual Meeting
September 19-21, 2013

Panel • Christos Coutifaris, MD, PhD
– Nancy & Richard Wolfson Professor of OB/GYN – Chief of Reproductive Endocrinology & Infertility – University of Pennsylvania
• Zsakeba Henderson, MD – Medical Officer, Maternal & Infant Health – Division of Reproductive Health – Centers for Disease Control & Prevention
• Jeffrey F. Peipert, MD, PhD – Robert J. Terry Professor of OB/GYN – Vice Chair of Clinical Research – Washington University in St. Louis
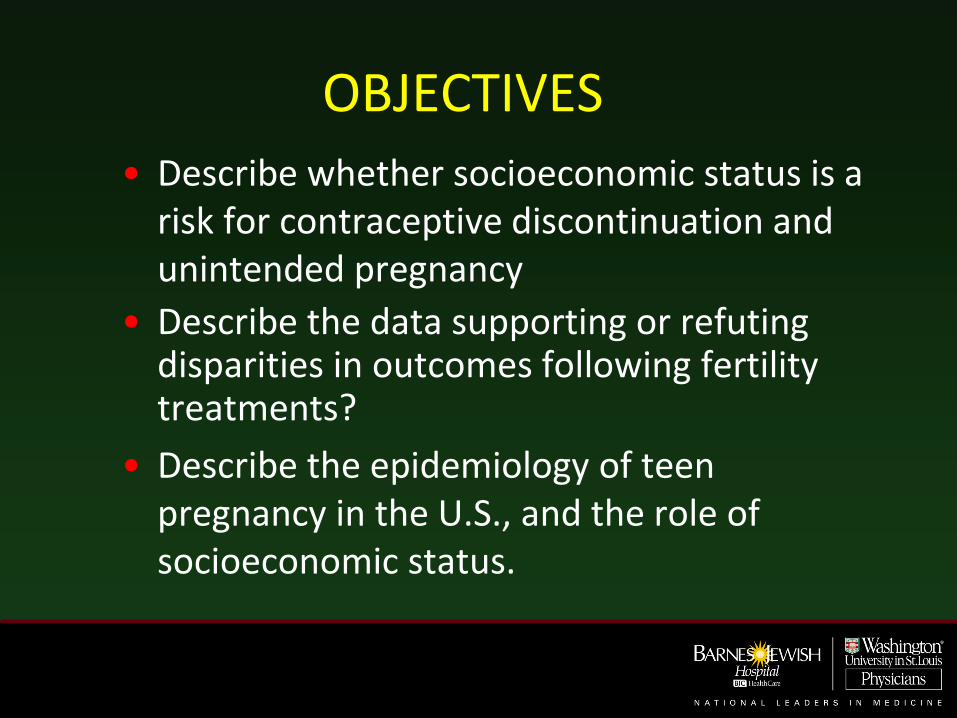
OBJECTIVES
• Describe whether socioeconomic status is a risk for contraceptive discontinuation and unintended pregnancy
• Describe the data supporting or refuting disparities in outcomes following fertility treatments?
• Describe the epidemiology of teen pregnancy in the U.S., and the role of socioeconomic status.
Contraceptive Continuation and Method Failure in Poverty Areas
Jeffrey F. Peipert, MD, PhD; Ariel Star Thomas, MS2;
Jenifer Allsworth, PhD; Gina Secura, PhD
Division of Clinical Research
Department of Obstetrics & Gynecology Washington University School of Medicine

Women and Poverty
• Federal poverty level (FPL)
– 2012: $23,050 annual income for a family of 4
• 16% of all US women live in poverty
– Under 18: 22.2%
– Between 18 and 64: 15.5%
– Over 64: 10.7%

Facts About Unintended Pregnancy
The most commonly used contraceptive methods have high failure rates and low continuation rates.
Guttmacher Institute:
Facts on Unintended Pregnancy in the United States

Women, Poverty, and Unintended Pregnancy
• Higher income
– Declined
• Poor and low income:
– Increased dramatically
• 1994: rate is 2.6X higher for poor women
• 2006: rate is 5.5X higher for poor women
Guttmacher Institute: Facts on Unintended
Pregnancy in the United States

Women, Poverty, and Contraception
• Contraceptive failure for women of low SES:
– 54% increased compared to higher income women
• Contraceptive discontinuation:
– 39% increased among low income women than those with higher incomes
The National Survey of Family Growth

CHOICE Research Questions
• Do women living in federally designated poverty areas have higher rates of contraceptive discontinuation?
– Does this disparity exist among LARC users and non-LARC users?
• Is socioeconomic status (SES) a risk factor for method failure?

Contraceptive CHOICE Project
• Cohort study:
– 9,256 women
• Aims of the study 1) Provide no cost contraception
2) Promote the use of LARC
3) Reduce the unintended pregnancy rate in St. Louis
Inclusion Criteria 1) Ages 14-45
2) Speak English or Spanish
3) Sexually active with a male
partner
4) Willing to use a new method
5) St. Louis region
Exclusion Criteria History of tubal ligation,
sterilization, or hysterectomy

Abortion & Unintended Pregnancy Rates in CHOICE
• Abortion Rate (women ages 15-44)
– 4.4 – 7.5 per 1000 women-years
– Compared to the national rate of 19.6 per 1000
• Unintended pregnancy rate
– 35.0 per 1,000 women (95% CI: 32.7-38.2)
– Compared to 52.0 per 1,000 nationally
Obstet Gynecol 2012; 120(6):1291-7.

Abortion in CHOICE vs. STL City/County
Year
CHOICE Rate
STL City & County
P-Value ABs Prevented
NNT
2008 4.4 17.0 < 0.001 3124 79
2009 7.5 14.8 < 0.001 1810 136
2010 5.9 13.4 < 0.001 1860 133

Annual Rates of Pregnancy, Birth, and Abortion among CHOICE Teens (14 – 19 years)
• Pregnancy 158.5 29.6 81%
• Birth 94.0 16.3 83%
• Abortion 41.5 9.1 78%
NSFG, 2008 CHOICE % Reduction
CHOICE, 2013

12-Month Continuation Method Starting
Total Using at 12
Months Continuation Rate (%)
LNG-IUS 1,890 1654 87.5
Cu-IUD 434 365 84.1
Implant 522 435 83.3
DMPA 313 176 56.2
Pills 478 263 55.0
Patch 99 49 49.5
Ring 431 234 54.2
Any LARC 2,846 2453 86.2
Non-LARC 1321 723 54.7
Obstet Gynecol 2011; 117:1105-13.

Geocoding: Methods
Geocode
• Geocode as many participants as possible
• Assign to census tract in Saint Louis region
Group
• Designate as living in: FPA, extreme FPA, neither
Analyze Continuation
• Compare discontinuation rates
• Look for confounders/predictors of continuation
Analyze Method Failure
• Compare method failure rates
• Look for confounders/predictors of method failure

Primary and Secondary Syphilis—Rates by County, United States, 2011
NOTE: In 2011, 2,154 (68.5%) of 3,142 counties in the United States reported no cases of primary
and secondary syphilis.
2011-Fig 41. SR http://www.cdc.gov/std/stats11/slides.htm

Geocoding: Where Did The Choice Participants Live? Successful: 8,478 of 9,256 (91.5%)

Federal Poverty Areas
• Federal Poverty Area –
– a tract/block where ≥ 20% of the residents live below the FPL
• Extreme Federal Poverty Area:
– ≥ 40% of residents live below the FPL

Contraceptive Discontinuation by Socioeconomic Status: Non-LARC users

Non-LARC Discontinuation
24-Month Discontinuation
Not Poverty Extreme P
All
Non-LARC 56.4% 62.5% 61.9% 0.12
OCPs 53.8% 65.0% 69.5% 0.004

Discontinuation of IUDs and Implants (LARC) by Socioeconomic Status

LARC Discontinuation
24-Month Discontinuation
Not Poverty Extreme P
All LARC
23.8% 23.6% 26.7% 0.52
LNG-IUS 21.2% 20.8% 29.8% 0.04

Risk Factors for Unintended Pregnancy
HRadj 95% Confidence Limits
Education:
<= HS 2.2 1.6, 3.3
Some college 1.6 1.2, 2.1
College 1.0 referent
Trouble paying 1.3 1.1, 1.6
for necessities
Cox Proportional Hazards Model controlling for age, race, parity,
parity, contraception, previous unintended pregnancy, hx of STI

Strengths and Limitations
Strengths: 1. Large prospective cohort
2. High follow-up rate
3. Universal access to contraception and contraceptive counseling
Limitations: 1. Defining socioeconomic status using area-based
measures
2. Small N for certain subgroups (e.g. less common contraceptive methods) limited precision

CONCLUSIONS
• Discontinuation
– Area-based poverty measure can predict discontinuation
• Women in the extreme poverty group had faster discontinuation of LNG-IUS and OCPs
• Method failure
– Lower SES & lower educational level are risk factors for contraceptive failure

Future Directions
• Examine association between poverty area and incident unintended pregnancies
• Attempt to determine WHY education and SES are associated with increased discontinuation and unintended pregnancy
– Education
– Access

Unintended Pregnancy & the Status Syndrome
“Efforts to help women and couples plan their pregnancies, such as increasing access to effective contraceptives, should focus on groups at greatest risk for unintended pregnancy, particularly poor and cohabiting women.”
Finer LB. Unintended pregnancy in the United States.
Contraception 2011; 84: 478–485.

Thank You


Health Disparities in St. Louis Region (2 zip codes less than 10 miles apart)
Source: Regional Health Commission “Building a Healthier St. Louis Data
Book, 2009
Health Status Indicator
63105 -
Clayton,
MO
63113 -
North STL
City
Live Births without 1st Trimester Prenatal Care 2.2% 27.1%
Percent of Newborns Weighing less than 5.5 Lbs 5.3% 14.1%
Lead Poisoning Prevalence Rates 6.6% 25.8%
Preventable Hospitalization Rates per 1,000
Hospitalizations 6.4 28.6
Heart Disease Mortality Rates per 100K Population 198 445
Diabetes Mortality Rates per 100K Population 4 78
HIV Cases per 100K Population 4.6 37.7
Years Life Expectancy at Birth 82.7 years 65.9 years