Embed Size (px)
Citation preview

INDONESIA
REINFORCING DOMESTIC DEMAND IN TIMES OF CRISIS
STUDIES ON GROWTH WITH EQUITY

STUDIES ON GROWTH WITH EQUITY INDONESIA REINFORCING DOMESTIC DEMAND IN TIMES OF CRISIS


STUDIES ON GROWTH WITH EQUITY INDONESIA REINFORCING DOMESTIC DEMAND IN TIMES OF CRISIS
INTERNATIONAL LABOUR ORGANIZATION
INTERNATIONAL INSTITUTE FOR LABOUR STUDIES
The International Institute for Labour Studies (IILS) was established in 1960 as an autonomous facility of the International Labour Organization (ILO) to further policy research, public debate and the sharing of knowledge on emerging labour and social issues of concern to the ILO and its constituents — labour, business and government.
Copyright © International Labour Organization (International Institute for Labour Studies) 2011.
Short excerpts from this publication may be reproduced without authorization, on condition that the source is indicated. For rights of reproduction or translation, application should be made to the Director, International Institute for Labour Studies, P.O. Box 6, CH-1211 Geneva 22, Switzerland.
ISBN: 978-92-9014-966-8 (print)ISBN 978-92-9014-967-5 (web pdf )
First published 2011
The responsibility for opinions expressed in this publication rests solely with its authors, and its publication does not constitute an endorsement by the International Institute for Labour Studies of the opinions expressed.
Copies can be ordered from: ILO Publications, International Labour Office, CH-1211 Geneva 22, Switzerland. For on-line orders, see www.ilo.org/publns
Graphic design in Switzerland ALIPrinted in Switzerland SRO
V
FOREWORD
The ILO Declaration on Social Justice for a Fair Globalization provides scope for assisting Members in strengthening their research capacity, empirical knowledge and understanding of how the strategic objectives of employment, social protection, social dialogue and rights at work interact with each other and contribute to social progress, sustainable enterpris-es, sustainable development and the eradication of poverty in the global economy.
In accordance with this plan of action, the 304th Session of the Governing Body set in motion a plan to strengthen the ILO’s knowledge base through a series of pilot country studies conducted under the aegis of the International Institute for Labour Studies. The purpose of these studies is to (i) document examples where employment and social policies have suc-cessfully contributed toward mitigating the impact of the global financial crisis; (ii) extract policy lessons which could be useful to other countries; and (iii) examine country-specific challenges in the context of the crisis and moving forward.
This report on Indonesia has been prepared by Byung-jin Ha, Sameer Khatiwada, Naren Prasad and Steven Tobin of the International Institute for Labour Studies. The report has benefited from a background paper prepared by Djoni Hartono of the University of Indonesia, and valuable inputs from Emma Allen and Kazutoshi Chatani of the ILO Country Office for Indonesia and Timor-Leste and Marva Corley-Coulibaly of the International Institute for Labour Studies. The study has been coordinated by Steven Tobin under the supervision of the Director of the Institute, Raymond Torres. A draft summary of the report on Indonesia was pre-sented at a seminar organized by the ILO Country Office for Indonesia and Timor-Leste on 28 November 2010. The final report takes into considera-tion many of the comments received from national authorities, the social partners and other stakeholders during the seminar.

VI
INDONESIA : REINFORCING DOMESTIC DEMAND IN TIMES OF CRISIS
TABLE OF CONTENTS
Page
Foreword V
Table of Contents VI
List of abbreviations X
Executive summary and policy recommendations 1
Chapter 1: Economic and labour market performance 15
Introduction 15
A. Macroeconomic developments and crisis transmission mechanisms 16
B. Labour market impacts of the crisis 20
C. Concluding remarks 27
References 28
Chapter 2 : Indonesia’s response to the crisis 31 Introduction 31
A. Financial and monetary policy 32
B. Fiscal stimulus measures 37
C. Concluding remarks 48
References 49
Chapter 3 : An analytical assessment of fiscal stimulus policies 51
Introduction 51
A. Overall effectiveness of stimulus efforts 52
B. Economic performance and stimulus initiatives 56
C. Impacts on employment 59
D. Policy considerations and challenges 63
References 70

VII
Page
Chapter 4 : Social protection measures in Indonesia 73
Introduction 73
A. Social protection in Indonesia 74
B. Responding to the crisis: Supporting income and consumption 78
C. Policy considerations and challenges 84
References 85
Chapter 5 : Post-crisis policy challenges 87
Introduction 87
A. Lessons learned: The importance of initial conditions 88
B. Reinforcing social protection: Reducing informality and income inequality 91
C. Skills development and youth unemployment 101
D. Role of job-centred macroeconomic policies 107
References 112

VIII
INDONESIA : REINFORCING DOMESTIC DEMAND IN TIMES OF CRISIS
LIST OF FIGURES
Page
Figure 1.1 Real GDP growth, 2007–2010 (percentage change from one year earlier) 16
Figure 1.2 Exports as a percentage of GDP, selected Asian and Pacific countries, 2008 18
Figure 1.3 Sectoral GDP growth and GDP contribution, 2008–2010 19
Figure 1.4 GDP and unemployment, G20 and selected Asian countries, 2008 and 2009 20
Figure 1.5 Labour force participation rate and unemployment rate, 2008–2010 21
Figure 1.6 Change in employment and employment rate, selected countries, 22
Figure 1.7 Informal employment, 2008–2010 24
Figure 1.8 Trends in poverty and inequality, 2006–2009 26
Figure 2.1 Reduction in the Bank of Indonesia rate, 2008–2009 36
Figure 2.2 Fiscal stimulus in G20 and selected Asian economies, 2008 37
Figure 2.3 Tax cuts as a percentage of total stimulus spending, selected G20 and Asian economies 40
Figure 2.4 Composition of tax cuts 41
Figure 2.5 Infrastructure spending in Indonesia compared to other Asian countries 43
Figure 3.1 Impact of each fiscal instrument on total production 56
Figure 3.2 Impact of the fiscal stimulus on production by sector 57
Figure 3.3 Employment growth and impact of the fiscal stimulus, 2008–10 59
Figure 3.4 Impact of each fiscal instrument on employment 60
Figure 3.5 Duration of employment by type of infrastructure spending 61
Figure 3.6 Impact of each fiscal stimulus instrument on employment, by gender 62
Figure 4.1 Social spending in Indonesia compared to selected countries 75
Figure 4.2 National Programme for Community Empowerment 81
Figure 5.1 Health-care coverage, percentages of total population, 2010 94
Figure 5.2 Informality and output variation from steady state with an economic shock 100
Figure 5.3 Youth and total unemployment developments during the crisis,
selected countries and regions, 2008–2009 102
Figure 5.4 Government gross debt in Indonesia, 2000–2009, and in selected countries, 2009 108
Figure 5.5 Lending interest rate and annual inflation rate in Indonesia, 2000–2009,
and in selected countries, 2009 109

IX
LIST OF TABLES
Page
Table 1.1 Unemployment by age and gender, 2008–2009 (percentages) 25
Table 2.1 Composition of stimulus spending by country groupings (weighted averages by GDP) 39
Table 2.2 Changes in individual tax rates and tax brackets, 2008–2009 40
Table 3.1 Realization rates by spending category and programme, end of 2009 53
Table 3.2 Effectiveness of Indonesia’s stimulus efforts according to the literature, 2009–2010 53
Table 4.1 Government expenditure on social assistance (IDR trillion) 78
Table 4.2 The Raskin Programme: Numbers of households, rice ceilings and budgets, 2005–2009 83
Table 5.1 Existing social security related programmes in Indonesia 97
LIST OF BOXES
Page
Box 1.1 Indonesia’s experience in the Asian financial crisis, 1997–98 17
Box 2.1 Public works in Indonesia before the crisis 45
Box 4.1 Social programmes in response to the 1997 Asian financial crisis 77
Box 4.2 Indonesia: Programmes to support low-income households 79
Box 5.1 India: Targeting in the Rural Employment Guarantee Scheme 93
Box 5.2 Unemployment insurance in emerging economies 96
Box 5.3 Brazil: Reduction of informal employment 99
Box 5.4 Global Economic Linkages Model: Informality and resilience 100
Box 5.5 Incentives for hiring youth: China and the Republic of Korea 104

X
INDONESIA : REINFORCING DOMESTIC DEMAND IN TIMES OF CRISIS
LIST OF ABBREVIATIONS
AMU asset management unit
ASEAN Association of Southeast Asian Nations
BI Bank of Indonesia
BLM-KIP financial assistance for agriculture
BLT Bantuan Langsung Tunai (unconditional cash transfer = UCT)
BNSP Indonesian standard-setting institution
BOS School Operational Assistance Programme
BPS Badan Pusat Statistik (Statistics Indonesia)
BTC bank-supported training centres
CCT conditional cash transfer programme
CDS credit default swap
DySAM dynamic social accounting matrix model
FCGE financial computable general equilibrium model
FDI foreign direct investment
GEL Global Economic Linkages Model
IBRA Indonesian Bank Restructuring Agency
IDR Indonesian rupiah
IILS International Institute for Labour Studies
JPS Jaring Pengaman Sosial
JPSK Jaring Pengaman Sistem Keuangan
KUK Kredit Usaha Kecit (Small Business Loans)
KUR Kredit Usaha Rakyat (People’s Business Credit/ Credit for the People)
MSMEs micro-, small and medium-sized enterprises
OPK Special Market Operation
P2DTK Development Acceleration Programme for Disadvantaged and Special Regions
P2KP Programme for Prevention of Urban Poverty
PES public employment service
PISEW Programme for Regional Infrastructure for Social and Economic Development
PKH conditional cash transfer programme
PNPM National Programme for Community Empowerment
PPIP Rural Infrastructure Development Programme
PPK Rural Development Programme
XI
PUAP Development for Rural Agribusiness
RASKIN Beras Untuk Keluarga Miskin (subsidized rice program for the poor)
RPJM Indonesia’s mid-term development plan, 2010–14
SJSN Sistem Jaminan Sosial Nasional
SMEs small and medium-sized enterprises
SOEs state-owned enterprises
SPP Women’s Savings and Loans
UCT unconditional cash transfer
VAT value-added tax


1
EXECUTIVE SUMMARY AND POLICY RECOMMENDATIONS
!e global crisis had a relatively limited impact on the Indonesian economy and labour market…
In the two years preceding the onset of the crisis, GDP growth in Indonesia averaged approximately 6 per cent per annum – 6.3 per cent in 2007, the highest growth rate in a decade. This was driven by robust domestic demand, increased private consumption, and high investment rates due to infrastructure and business climate improvements. In addition, unlike the period preceding the Asian financial crisis in 1997, the financial sector was also on a relatively sound footing; prudential control of banks was tight, exposure to international capital flows was limited and the incidence of non-performing loans was declining.
Nevertheless, as the crisis spread and world aggregate demand and trade activity declined, exports from Indonesia also declined, by as much as 18 per cent in the first quarter of 2009. As a result, the rate of growth in Indonesia began to decelerate, falling to just above 5 per cent in the fourth quarter of 2008 and remaining around 4 per cent for the first three quarters of 2009. Growth, however, rebounded quickly and started to recover in late 2009 and by the first quarter of 2010, had reattained pre-crisis rates.
Employment growth also remained robust over the short-lived crisis period with jobs lost only in a few sectors between February 2008 and 2009, most notably construction, transport, storage and communications. However, these sectors combined represent less than 12 per cent of total employment. Moreover, the unemployment rate declined steadily – falling from 8.4 per cent in February 2008, to 8.1 per cent in February 2009 and 7.1 per cent in August 2010. In 2009 – during the height of the crisis – Indonesia was the only G20 or Asian country (with available information) in which economic growth was positive and the unemployment rate had fallen from its 2008 level.

Executive summary 2
INDONESIA : REINFORCING DOMESTIC DEMAND IN TIMES OF CRISIS
…due to Indonesia’s favourable initial conditions… For many developing countries the transmission mechanisms of the crisis were external channels, notably falling exports. Indeed, in many emerging countries, growth in the pre-crisis era hinged on exports. This was the prin-cipal means by which Indonesia too was affected by the crisis. But exports as a percentage of GDP in Indonesia, at approximately 30 per cent in 2008, were lower than many other countries in the region, e.g. more than 75 per cent in Thailand and Viet Nam and more than 35 per cent in China.
In addition, unlike some of its counterparts in the region, Indonesia entered the crisis in a relatively sound fiscal position and could thus carry out counter-cyclical policies without damaging medium-term public finances. In particular, in 2008, the fiscal balance as a percentage of GDP was close to zero (-0.1 per cent) compared to nearly -1.0 per cent in South-East Asia. Moreover, Indonesia benefited from a rather healthy financial sector which had been regulated in the aftermath of the Asian crisis at the end of the 1990s. Notable reforms included stricter financial market supervision and regulation (the so-called Badan Pengawas Pasar Modal) and the introduction of a deposit insurance system (Lembaga Penjamin Simpanan).
…and because of early implementation of counter-cyclical monetary and "scal measures which reinforced domestic demand...
The Government put in place some immediate measures to stabilize the financial system. When the stock market fell dramatically in October 2008, the Government temporarily suspended operations to avoid further damag-ing the stability of financial markets. In addition, with a view to boosting aggregate demand and preventing exchange rate depreciations, the Bank of Indonesia (BI) lowered its benchmark interest rate by 375 basis points, from 9.25 per cent in December 2008 to 6.5 per cent in September 2009. Finally, unlike other Asian economies which tried to devalue their currency in order to increase exports, Indonesia’s monetary strategy was to keep

3
the rupiah (IDR) proportional to the United States dollar (USD). This was partly to ensure the continuation of foreign investment in Indonesian enterprises, but also due to the fact that most of Indonesia’s foreign debt is measured in USD, and thus devaluing the IDR would effectively increase the deficit.
The Government also announced in January 2009 fiscal stimulus measures amounting to 1.4 per cent of GDP (IDR 73.3 trillion or USD 7.1 bil-lion) – the smallest stimulus package in Asia, where the average was just above 7 per cent of GDP. The primary fiscal instrument used was tax cuts, most of which were already planned before the onset of the crisis; these comprised over 75 per cent of the stimulus spending, the vast majority of which consisted of a series of amendments to the personal income tax system (IDR 24.5 trillion or USD 2.4 billion) and lower corporate taxes (IDR 19.3 trillion or USD 1.9 billion). The Government also allocated an additional IDR 12 trillion (USD 1.2 billion) towards infrastructure-related investments which were intended to support an already robust infrastructure programme. The stimulus was quite successful in delivering support quickly: the tax cuts were effective immediately and by the end of 2009, nearly all of the stimulus related to investments in infrastructure had been spent.
The move was a considerable departure from efforts undertaken in other countries. For example, among Indonesia’s Asian counterparts the major-ity of stimulus measures were targeted towards infrastructure investments with less than one-fifth dedicated to tax reductions. Even among advanced economies, less than half of stimulus spending was on tax-related measures. But this departure compared to other countries underscores the unique-ness of the macroeconomic situation in Indonesia. While the country had ample fiscal space to carry out expansionary fiscal policies, it opted for tax measures, which were already in the offing, mainly to continue its efforts to modernize the tax system and improve the tax code to make it more conducive to enhancing business competitiveness and boosting incomes.

Executive summary 4
INDONESIA : REINFORCING DOMESTIC DEMAND IN TIMES OF CRISIS
…"rst, through tax exemptions for lower-income households and cuts in income taxes…
There were considerable changes in the personal income tax system with a number of modifications for lower-income earners. In the first instance, the minimum threshold for tax exemption was raised from IDR 13.2 mil-lion (USD 1,271) to IDR 15.8 million (USD 1,521) for single individuals, and for married persons it rose from IDR 14.4 million (USD 1,386) to IDR 17.2 million (USD 1,655). Additional tax exemptions were also made available depending on family circumstances, i.e. the number of children. There were also reductions in the effective tax rates at the lower end: those earnings between IDR 25 million (USD 2,400) and IDR 50 million (USD 4,800), the tax rate was cut in half from 10 per cent to 5 per cent and for incomes between IDR 100 million and IDR 200 million (between USD 9,600 and 19,200) the marginal tax rate is now 15 per cent instead of 25 per cent. Changes to the upper income tax brackets and rates were also made.
The motivations underlying the focus on personal tax cuts were multi-ple. First, the Indonesian Government had already planned on revamping its tax system, and when the crisis hit, there was a renewed urgency to complete the process. Second, the impact of the tax cuts could take effect immediately, thus giving weight to the importance of reacting quickly in time of crisis. And finally, the cuts were critical in boosting incomes of poorer households which – when combined with other policy interven-tions – could have important multiplier effects.
…and second, by boosting existing social protection programmes developed in response to the Asian crisis…
In many countries, a crisis represents an opportunity to strengthen its social protection schemes. Indeed, this is what happened in Indonesia following the 1997 Asian financial crisis. The country introduced a series of measures, most notably (i) food subsidies programme; (ii) conditional

5
cash transfers; (iii) regional empowerment; and (iv) health services for the poor. This was complemented by new programmes in the years that followed the Asian crisis and efforts to establish a basic framework for the development of universal social security and social assistance (Law No. 40/2004). In this respect, the Government was in a good position to allocate additional support to the existing array of social assistance pro-grammes. In particular, in 2009, although not considered part of stimu-lus efforts, spending on the existing range of programmes – through the regular budget process – increased by more than 34 per cent or IDR 20 trillion (USD 1.9 billion).
Part of this response included extending the unconditional cash trans-fer programme (BLT). The programme was reactiviated in 2008 to help address challenges associated with the food crisis. In 2009, the programme was extended for an additional 2 months and allocated an extra IDR 2.3 trillion (USD 0.2 billion). The BLT provides short-term income assistance and is targeted to the poorest 30 per cent of households (roughly 18.5 million households). Similarly, the Government expanded on two occa-sions a conditional cash transfer programme (PKH) which had been in pilot testing at the onset of the crisis. The programme provides financial support to pregnant women or families with children up to the age of 15, on the condition that the children fulfil certain health-care and education requirements. In 2009, nearly one-quarter of a million households were covered, with – at least initially – generally positive results: beneficiaries used the funds for children’s school and health needs, food purchases and other basic necessities.
In addition, as part of the stimulus, Indonesia allocated close to 7 per cent (IDR 5.1 trillion or USD 0.5 billion) of the total stimulus (similar to other countries in the region) to provide additional support to low-income households. Most of this funding (IDR 4.5 trillion or USD 0.4 billion) went towards subsidies that led to a reduction in cooking oil prices, a large portion of low-income households’ annual expenditure.

Executive summary 6
INDONESIA : REINFORCING DOMESTIC DEMAND IN TIMES OF CRISIS
…and third, by recognizing the employment e#ects of mutually-supportive de-mand- and supply-side policies…
In light of the tax cuts and reinforced social protection measures, incomes of Indonesians received an important boost during the crisis. Preliminary estimates indicate that total household incomes rose as a result of the stimu-lus package which helped to reinforce domestic demand: domestic con-sumption grew by 14.5 per cent in the first quarter of 2009 and 9.7 per cent in the second quarter of 2009.
As a complement to these measures, the Government ensured that the business climate remained robust and was in a position to respond to increased demand. In particular, the reduced lending rates established by the BI helped lower the costs of credit but more importantly, the Government established a loan guarantee facility within the People Business Credit (KUR) for firms facing financing difficulties during the crisis. The KUR was established in 2007 to provide increased credit access to small and medium-sized enterprises (SMEs). In addition, as part of the stimulus efforts, corporate tax rates were reduced by 5 per-centage points from 30 to 25 per cent. Moreover, small enterprises, i.e. corporate taxpayers with an annual turnover of not more than IDR 50 billion (USD 4.8 million), are entitled to a tax discount of 50 per cent off the standard rate.
In this way, policies supported the interaction of supply and demand — which had important employment effects. In fact, between February 2009 and August 2010, the Indonesian economy generated 3.7 million jobs — of which an estimated 1.2 million were a result of stimulus measures. The impact was particularly strong in the case in sectors related to domestic consumption such as retail trade and agriculture
in the community, social, and personal services sector, and 255,000 jobs in the financial, insurance, real estate, and business services sector.
7
650,000 jobs.
…which fourth, were complemented by e#orts to strengthen the employment-intensity of infrastructure investments, including in rural areas.The additional investments in infrastructure in the case of Indonesia were comparably low – less than 11 per cent of the stimulus package compared to more than 37 per cent in other developing and emerging economies. However, infrastructure in Indonesia is – as was the case prior to the cri-sis – a key strategy for improving Indonesia’s investment climate. Indeed, leading up to the crisis, investment contributed close to one third of the growth in GDP. Hence, in this respect, the response in 2009 was intended simply to build upon this broader strategy while placing emphasis on employment-oriented activities. Even though there was a time lag in the disbursement of the funds for infrastructure, more than 97 per cent of the allocation was spent by the end of 2009.
Moreover, the labour-intensive public works infrastructure investments – which were well-targeted – had good multiplier effects and provided a much-needed boost to jobs creation (an estimated 450,000 full-time equiva-lent jobs as a result of stimulus). Moreover, according to a survey conducted by the ILO Country Office for Indonesia and Timor-Leste, disadvantaged groups were the main beneficiaries of the public works spending.
In particular, the National Programme for Community Empowerment (PNPM) – a collection of community development programmes that serve as the primary instrument for poverty reduction in Indonesia – received additional support. In 2009, the budget was increased significantly from IDR 4.2 trillion to 7.6 trillion (from USD 0.4 billion to 0.7 billion). The programme has been shown to be successful in stimulating economic devel-opment through improvement in the quality of local physical infrastructure and in generating local employment opportunities.

Executive summary 8
INDONESIA : REINFORCING DOMESTIC DEMAND IN TIMES OF CRISIS
Moving forward, Indonesia could take advantage of the signi"cant achievements by strengthening social protection...
Despite the recent policies adopted in the wake of the crisis, the coverage of social protection in Indonesia remains more limited than in other Asian countries. Social spending in Indonesia – at 1.9 per cent of GDP in 2008 – is lower than in other emerging Asian economies – roughly one-third compared with Malaysia and Thailand. Moreover, the programmes suffer from a number of weaknesses, including:
Inefficient allocation: A number of the social assistance programmes, such as the Raskin (Rice for the Poor), while targeted on the poor, have weak distribution channels. They also suffer from large deadweight losses, as some households typically not eligible also benefit from the programme, which reduces scope for supporting the most needy. For example, the aggregate number of the poor in a particular province is defined by the Central Bureau of Statistics, but the details of those eligible for the pro-gramme are determined by the district or municipal government, leading in many cases to selection bias. As a result, given the limited supplies, poor households are at times excluded from the rice distribution.
Limited awareness compounded by lack of coherence and coordination: Many households eligible for social assistance are unaware of the various pro-grammes that exist – exacerbating the challenges of ensuring that the programmes reach the targeted group and have the intended outcome. There are currently some 117 programmes related to poverty reduction, executed by 32 different agencies.
Poor programme oversight with few evaluation mechanisms in place: In some cases, programmes remain incomplete. For instance, within the infrastruc-ture development projects of the National Programme for Community Empowerment, nearly 30 per cent of projects remain incomplete each year. These delays are mainly the result of the lengthy administrative processes for proposals, the selection of projects, and so on. In addition, except in some instances (usually donor-funded schemes), many of the programmes do not have any evaluation mechanisms in place.

9
One way to address these systemic issues could be by creating a central coordinating authority, coupled with stronger supervision and monitoring at local levels. This could help improve awareness and delivery and thus improve the overall effectiveness of social protection. For example, in Brazil all the poverty reduction schemes – of which there are only 14 social welfare and poverty reduction programmes – are coordinated by the office of the President. Moreover, any rationalization of schemes in Indonesia should be accompanied by a system of evaluation; the ability of policy-makers to improve the effectiveness of existing (and new) labour market programmes very much depends on a proper evaluation framework.
... addressing high employment informality and promoting the creation of quality jobs…
Approximately two-thirds of the total working population are employed in the informal economy. This is a major social problem but high informal-ity also hinders economic development and, as the report finds, makes the economy more vulnerable to shocks. A number of measures could be introduced in Indonesia that could have the double dividend of improv-ing the overall coverage of social protection and promoting the creation of higher quality jobs, notably:
Harmonize contribution rates between informal and formal workforces. Currently, within the social security scheme formal workers pay a per-centage of their salary whereas informal workers pay a fixed flat rate, making it more attractive, from a tax perspective, to work in the informal economy. However, if all workers were to pay a progressive tax based on income – even though this might lead to under-reporting of income in general – it would at least remove tax as an incentive to gravitate towards the informal economy.
Promote flexible health-care coverage for informal economy workers: Indonesia has already mandated universal health coverage, but many of the poor do not have access. Such a scheme could benefit from the experi-ence of countries such as Ghana, which switched from a ‘cash and carry’

Executive summary 10
INDONESIA : REINFORCING DOMESTIC DEMAND IN TIMES OF CRISIS
system to a compulsory National Health Insurance Scheme in 2005. The scheme, funded by the implementation of a 2.5 percent VAT and individual contributions based on income (with exemptions for the eld-erly and indigent) offers portable, flexible coverage to informal workers through mutual and private health insurance schemes. The initial results are impressive as registrants increased from 7 per cent of the population in 2005 to 45 per cent in 2008, with the majority of workers coming from the informal economy.
Simplify the tax regime for SMEs: A sizeable share of employment-rich SMEs are working in the informal economy – often as a result of the tax system. Providing tax (and credit) incentives to firms to “formalize” could help spur formal job creation. Several developing and emerging countries, particularly in Latin America and Eastern Europe have done this quite suc-cessfully. For example, Hungary decreased taxes for those employing under-privileged workers, and gave tax concessions to those sectors with informal workers (domestic workers, construction). In Latin America where tax systems are particularly complex, simplifying the tax structure has encour-aged businesses to formally register by making compliance less costly and burdensome for SMEs. Countries such as Argentina, Bolivia, Brazil and Peru have introduced simplified tax regimes for SMEs by e.g. replacing the various taxes (such as income and sales tax) with one single tax.
Support unemployed workers: There is currently no unemployment insur-ance scheme in place to aid jobseekers, which results in many unem-ployed workers often resorting to employment in the informal economy. It is important to give consideration to the development of an unemploy-ment benefit scheme which if properly designed could serve both labour market and social objectives. In particular, such a scheme would provide adequate income replacement while keeping workers in contact with the formal labour market through job-search assistance and skills train-ing. Although launching such a programme would require some initial investments, the case of the Republic of Korea illustrates how this can be achieved in a cost-effective manner. In 1995, the Ministry of Labour in the Republic of Korea used existing facilities and staff to administer and initiate the unemployment insurance scheme in its first year, helping to reduce significantly overall implementation costs.

11
Comprehensive skills development policy: A well-functioning labour market requires that labour market information contributes to an over-arching skills development strategy. In the case of Indonesia, however, the cur-rent skills development system is rather fragmented. Most skills train-ings are not competency-based and certificates are often not recognized. The current proposal to develop a national qualification system is a step in the right direction. Success will depend on a number of key design parameters, notably improved labour market information, establishment of a cost-effective certification system across the country, and a better mapping of skills development delivery channels.
…and promoting employment prospects of youth – who have not shared equally in the bene"ts of the recovery.
Already before the crisis, in February 2008 unemployment rates for youth aged 15–24, at 21.1 per cent, were much higher than the average in South-East Asia and the Pacific where youth unemployment rates in 2008 were around 15 per cent. During the crisis, youth in Indonesia experienced a mod-est increase in their unemployment rate – rising to over 23 per cent in August 2008. The situation has since improved somewhat with the unemployment rate falling to just under 20 per cent in February 2010. However, in com-parison to their adult counterparts (aged 25–54), youth unemployment rates in Indonesia are more than four times higher – in fact, the gap of more than 15 percentage points is among the highest among countries with available information and remains unchanged since the onset of the crisis. A number of reform options could bolster the employment outcomes of youth:
Strengthen school-to-work transition: Many of the problems appear to stem from skills mismatches. Efforts are needed to strengthen the ties between educational institutions and the private sector. As a first step, the Government could work to improve the existing apprenticeship pro-gramme, for instance by increasing the number of available places and pro-viding greater access to skills training. This could be achieved by developing skills training partnerships with businesses. In the medium term, however, more efforts are needed to ensure improved educational outcomes which are complemented by job growth in productive, high-skilled sectors.
Executive summary 12
INDONESIA : REINFORCING DOMESTIC DEMAND IN TIMES OF CRISIS
Encourage the hiring of youth: In the absence of suitable employment opportunities, many youth find themselves seeking jobs in the infor-mal sector. A number of measures could be envisioned to encourage the direct hiring of unemployed youth, such as through targeted subsidies. For example, in China, financial incentives were introduced for private companies to recruit more graduates. Similarly, the Republic of Korea introduced new wage subsidies for SMEs to hire interns on regular con-tracts at the conclusion of their internship.
Success in addressing these challenges lies in fostering coherence between decent work goals and macroeconomic policies.
Following the 1997 Asian financial crisis, monetary and fiscal policies were focused on inflation and debt reduction. As such, the decade leading up to the crisis was characterized by overall prudence – which was the right strat-egy, at least initially. However, it has led to reductions in fixed investment, stagnant growth in social protection spending and narrowly focused mon-etary policy. With growth in 2010 and 2011 set to surpass 6 per cent per annum, the timing could not be more appropriate to reinforce social pro-tection measures and to make macroeconomic policies more job-centred:
1. Leverage existing fiscal space: In Indonesia there remains considerable fis-cal space – debt to GDP is less than one-third and household debt to GDP is below 10 per cent – all well below their Asian counterparts. Some of this fiscal space can be allocated to, for instance, improving effectiveness and coverage of social protection schemes, improving skills provision or expand-ing existing apprenticeship programmes. Spending of this nature should not be seen as a one-off cost – it is an investment in long-term sustain-able growth and will bring returns in the future in terms of improvements in the well-being of workers, productivity, incomes and overall economic growth.

13
2. Make monetary policy conducive to economic growth and job creation: It is important to balance the twin goals of keeping prices stable and spurring economic growth. The experiences of other countries demonstrate that inflation targeting does not need to come at the expense of growth and job creation.
3. Increase access to credit for domestic firms, especially small ones: Evidence shows that firms in Indonesia are performing 30 to 35 per cent below capac-ity, and one of the primary constraints facing them is exorbitant borrowing costs (lending rates remain two times higher than the average in ASEAN countries). In this respect, the Government has a role to play in creating a conducive environment for private business investment. The Government should consider expanding the People’s Business Credit (KUR) to fur-ther strengthen the ability of micro-, small and medium-sized enterprises (MSMEs) to secure financial support. It could also envision giving prefer-ential rates to MSMEs, as was the case recently in Viet Nam. Indonesia has fared relatively well during the current crisis. And despite the emerging challenges, the country is well-positioned to undertake the necessary reforms. Moving forward, continued recognition of the comple-mentarities among economic, labour and social objectives – especially if achieved through social dialogue – will ensure that the future successes are sustainable and equitable.

15
CHAPTER 1 ECONOMIC AND LABOUR MARKET PERFORMANCE
INTRODUCTION
The crisis that erupted in 2008 developed rapidly, spreading into a global economic shock that resulted in a number of bank failures, stock market collapses, significant job losses and large declines in income and wealth. At first, advanced economies were hit hardest, given that the origins of the crisis were very much rooted in the United States financial system. Spillover to other countries and regions was initially small, but eventually the crisis deepened and spread to large and small emerging and developing economies alike. Any assumptions about a decoupling of these economies soon proved wrong.
As of early 2011 – several years after the onset of the crisis – global GDP growth has returned to positive territory with emerging and developing economies leading the recovery. Nevertheless, many – including Indonesia – continue to face significant labour market and social challenges stem-ming from the crisis. In the case of Indonesia, however, the impact of the current crisis has been much less severe; in fact, economic and labour market performance has been remarkable even in comparison with other Asian countries that have also fared well. The purpose of this chapter is to examine in more detail the macroeconomic developments over the course of the crisis (section A), with particular emphasis on reviewing how the labour market has coped over this period (section B).
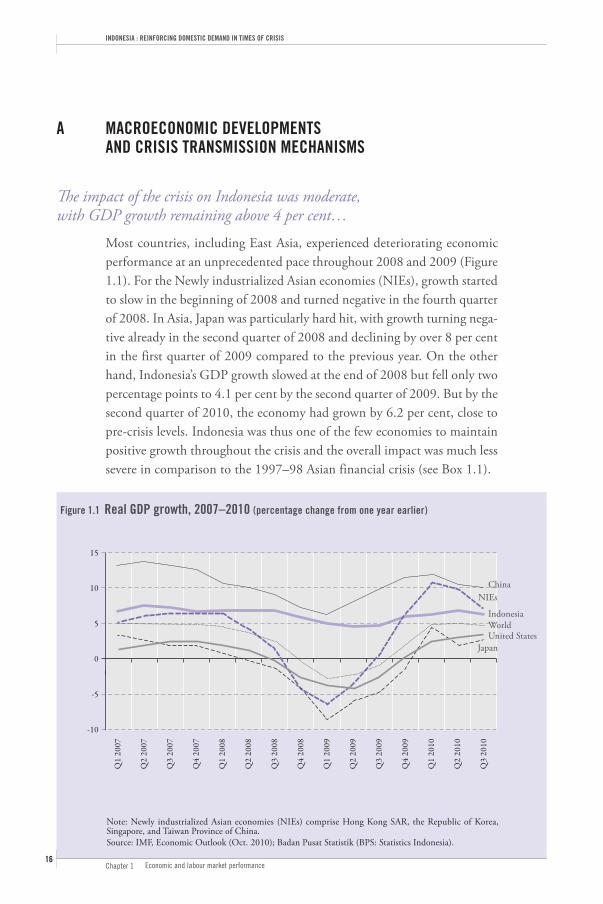
Figure 1.1 Real GDP growth, 2007–2010 (percentage change from one year earlier)
15
10
5
0
-5
-10
Q1
2007
Q2
2007
Q3
2007
Q4
2007
Q1
2008
Q2
2008
Q3
2008
Q4
2008
Q1
2009
Q2
2009
Q3
2009
Q4
2009
Q1
2010
Q2
2010
Q3
2010
United States
NIEs
World
Japan
Note: Newly industrialized Asian economies (NIEs) comprise Hong Kong SAR, the Republic of Korea, Singapore, and Taiwan Province of China.Source: IMF, Economic Outlook (Oct. 2010); Badan Pusat Statistik (BPS: Statistics Indonesia).
Indonesia
China
Chapter 1 Economic and labour market performance
INDONESIA : REINFORCING DOMESTIC DEMAND IN TIMES OF CRISIS
16
A MACROECONOMIC DEVELOPMENTS AND CRISIS TRANSMISSION MECHANISMS
!e impact of the crisis on Indonesia was moderate, with GDP growth remaining above 4 per cent…
Most countries, including East Asia, experienced deteriorating economic performance at an unprecedented pace throughout 2008 and 2009 (Figure 1.1). For the Newly industrialized Asian economies (NIEs), growth started to slow in the beginning of 2008 and turned negative in the fourth quarter of 2008. In Asia, Japan was particularly hard hit, with growth turning nega-tive already in the second quarter of 2008 and declining by over 8 per cent in the first quarter of 2009 compared to the previous year. On the other hand, Indonesia’s GDP growth slowed at the end of 2008 but fell only two percentage points to 4.1 per cent by the second quarter of 2009. But by the second quarter of 2010, the economy had grown by 6.2 per cent, close to pre-crisis levels. Indonesia was thus one of the few economies to maintain positive growth throughout the crisis and the overall impact was much less severe in comparison to the 1997–98 Asian financial crisis (see Box 1.1).

Box 1.1 Indonesia’s experience in the Asian financial crisis, 1997–98
Cause of the crisis: Unlike the current crisis, which originated in advanced economies, the Asian financial crisis of 1997–98 had much to do with policies within the region, notably, rushed financial liberalization, rigid exchange rates, opaque financial systems and relatively weak governance. Indonesia made a series of inconsistent policy announce-ments that greatly diminished the confidence of foreign investors and led to a sharp drop in the value of the Indonesian rupiah.
Impact on the Indonesian economy: The drop in economic output caused by the cur-rent crisis has been very modest compared to what ensued between 1997 and 1999. For most of the 1990s, the economy grew at an average rate of 7 to 9 per cent but in the fourth quarter of 1997 it shrank by 0.9 per cent. This downturn continued and even accelerated – in the fourth quarter of 1998 the Indonesian economy shrank by nearly 18 per cent. Almost all sectors of the economy, except the agricultural sector, experienced negative growth. For example, the banking sector shrank by 43.5 per cent and construc-tion fell by nearly 40 per cent in the fourth quarter of 1998.
Impact on the labour market: In comparison to the impact on economic output, the impact on the labour market was modest. Nevertheless, the unemployment rate increased by 1.7 percentage points from 1997 to 1999. Moreover, formal job creation suffered during the post-crisis period and job quality was reduced – the number of wor-kers employed in the formal sector fell by 3.3 million. In addition, real median wages fell by 31 per cent between 1997 and 1999 (40 per cent among youth). The crisis also reversed early gains in poverty reduction – for example, the percentage of the population living in poverty increased by 5.7 percentage points, from 11 per cent in 1997 to 16.7 per cent in 1998.
17
…due in part to low dependency on exports…The impact of the crisis in Asia was principally felt through the trade chan-nel: a sharp drop in US import demand adversely affected exports from developing countries and particularly in East Asia, given the strong export content of growth (Figure 1.2). In the case of Indonesia, exports started to slow towards the end of 2008, falling more than 18 per cent in the first quarter of 2009. Commodity exports such as oil, gas, iron and steel were hardest hit, falling by more than 55 per cent in the first half of 2009 due to weaker world demand and declines in the prices of these key com-modities.1 However, for Indonesia the impact on GDP was lessened, given
1 See for example Tambunan (2010); Basri and Rahardja (2010).
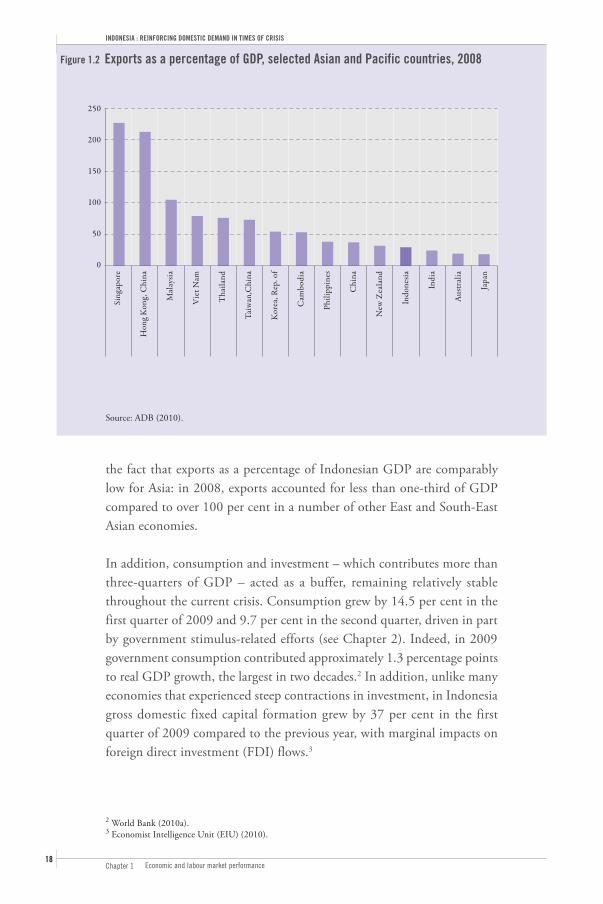
Figure 1.2 Exports as a percentage of GDP, selected Asian and Pacific countries, 2008
Source: ADB (2010).
250
200
150
100
50
0
Sing
apor
e
Hon
g Kon
g, C
hina
Mal
aysia
Vie
t Nam
Tha
iland
Taiw
an,C
hina
Kor
ea, R
ep. o
f
Cam
bodi
a
Phili
ppin
es
Chi
na
New
Zea
land
Indo
nesia
Indi
a
Aus
tral
ia
Japa
n
Chapter 1 Economic and labour market performance
INDONESIA : REINFORCING DOMESTIC DEMAND IN TIMES OF CRISIS
18
the fact that exports as a percentage of Indonesian GDP are comparably low for Asia: in 2008, exports accounted for less than one-third of GDP compared to over 100 per cent in a number of other East and South-East Asian economies.
In addition, consumption and investment – which contributes more than three-quarters of GDP – acted as a buffer, remaining relatively stable throughout the current crisis. Consumption grew by 14.5 per cent in the first quarter of 2009 and 9.7 per cent in the second quarter, driven in part by government stimulus-related efforts (see Chapter 2). Indeed, in 2009 government consumption contributed approximately 1.3 percentage points to real GDP growth, the largest in two decades.2 In addition, unlike many economies that experienced steep contractions in investment, in Indonesia gross domestic fixed capital formation grew by 37 per cent in the first quarter of 2009 compared to the previous year, with marginal impacts on foreign direct investment (FDI) flows.3
2 World Bank (2010a).3 Economist Intelligence Unit (EIU) (2010).
9
8
7
6
5
4
3
2
1
Q1
2008
Q2
2008
Q3
2008
Q4
2008
Q1
2009
Q2
2009
Q3
2009
Q4
2009
Q1
2010
Q2
2010
Q3
2010
Services (36.3%)
Construction (6.3%)
Manufacturing and mining (35.1%) Agriculture (13.7%)
Figure 1.3 Sectoral GDP growth and GDP contribution, 2008–2010 (growth rates from one year earlier, percentages)
Note: GDP contribution rates are based on the 2nd quarter of 2010. Services include trade, accommodation and restaurants; finance, real estate and business; and other services. Agriculture refers to agriculture, livestock, forestry and fisheries.Source: Badan Pusat Statistik (BPS: Statistics Indonesia).
19
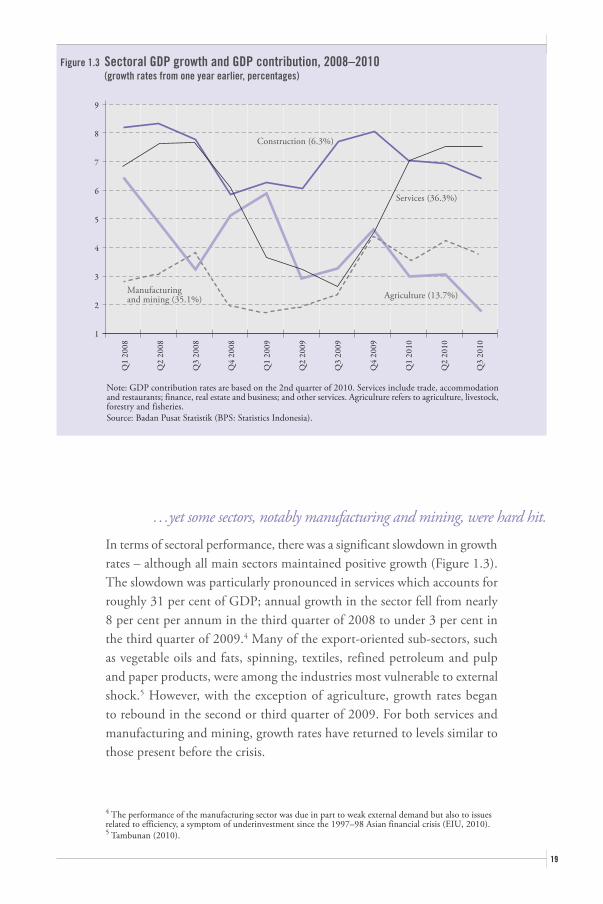
…yet some sectors, notably manufacturing and mining, were hard hit.In terms of sectoral performance, there was a significant slowdown in growth rates – although all main sectors maintained positive growth (Figure 1.3). The slowdown was particularly pronounced in services which accounts for roughly 31 per cent of GDP; annual growth in the sector fell from nearly 8 per cent per annum in the third quarter of 2008 to under 3 per cent in the third quarter of 2009.4 Many of the export-oriented sub-sectors, such as vegetable oils and fats, spinning, textiles, refined petroleum and pulp and paper products, were among the industries most vulnerable to external shock.5 However, with the exception of agriculture, growth rates began to rebound in the second or third quarter of 2009. For both services and manufacturing and mining, growth rates have returned to levels similar to those present before the crisis.
4 The performance of the manufacturing sector was due in part to weak external demand but also to issues related to efficiency, a symptom of underinvestment since the 1997–98 Asian financial crisis (EIU, 2010).5 Tambunan (2010).
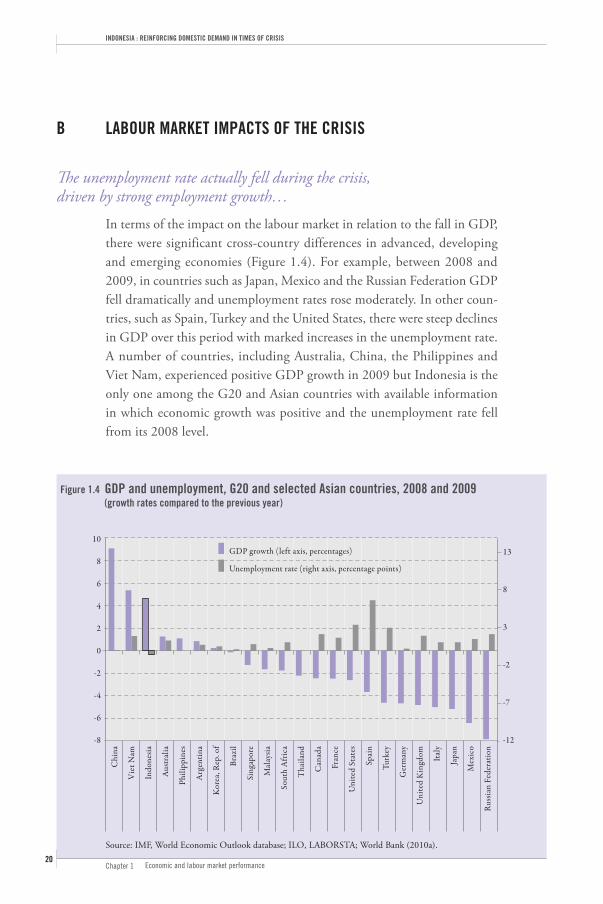
Figure 1.4 GDP and unemployment, G20 and selected Asian countries, 2008 and 2009 (growth rates compared to the previous year)
Source: IMF, World Economic Outlook database; ILO, LABORSTA; World Bank (2010a).
10
8
6
4
2
0
-2
-4
-6
-8
13
8
3
-2
-7
-12
Chi
na
Vie
t Nam
Indo
nesia
Aus
tral
ia
Phili
ppin
es
Arg
entin
a
Kor
ea, R
ep. o
f
Braz
il
Sing
apor
e
Mal
aysia
Sout
h A
fric
a
Tha
iland
Can
ada
Fran
ce
Uni
ted
Stat
es
Spai
n
Turk
ey
Ger
man
y
Uni
ted
Kin
gdom Ita
ly
Japa
n
Mex
ico
Russ
ian
Fede
ratio
n
Unemployment rate (right axis, percentage points)
GDP growth (left axis, percentages)
Chapter 1 Economic and labour market performance
INDONESIA : REINFORCING DOMESTIC DEMAND IN TIMES OF CRISIS
20
B LABOUR MARKET IMPACTS OF THE CRISIS
!e unemployment rate actually fell during the crisis, driven by strong employment growth…
In terms of the impact on the labour market in relation to the fall in GDP, there were significant cross-country differences in advanced, developing and emerging economies (Figure 1.4). For example, between 2008 and 2009, in countries such as Japan, Mexico and the Russian Federation GDP fell dramatically and unemployment rates rose moderately. In other coun-tries, such as Spain, Turkey and the United States, there were steep declines in GDP over this period with marked increases in the unemployment rate. A number of countries, including Australia, China, the Philippines and Viet Nam, experienced positive GDP growth in 2009 but Indonesia is the only one among the G20 and Asian countries with available information in which economic growth was positive and the unemployment rate fell from its 2008 level.

Feb-07 Aug-07 Feb-08 Aug-08 Feb-09 Aug-09 Feb-10 Aug-10
68.0
67.5
67.0
66.5
66.0
10.5
10.0
9.5
9.0
8.5
8.0
7.5
7.0
6.5
Figure 1.5 Labour force participation rate and unemployment rate, 2008–2010 (changes from previous year, percentages)
Note: Indonesia’s labour force survey is conducted each February and August.Source: Badan Pusat Statistik (BPS: Statistics Indonesia).
Unemployment rate (right axis)Labour force participation rate (left axis)
21
The unemployment rate in Indonesia continued to decline steadily through-out the crisis period: between February 2008 and February 2010 it dropped by over a full percentage point to just below 7.5 per cent and continuing its pre-crisis downward trend (Figure 1.5). This occurred despite the fact that more people (roughly 4.5 million) entered the labour force in search of employment – the labour force participation rate increased from 67.3 per cent in February 2008 to 67.8 per cent in February 2010.
The robustness of the labour market is due to strong employment crea-tion – among South-East Asian countries, Indonesia is second only to the Philippines in terms of job growth (Figure 1.6, panel A). Between the sec-ond quarter of 2008 and second quarter of 2010, employment grew over 5 per cent in Indonesia.6 Employment growth has also been strong in other economies within the region but in some instances such as Australia, the Republic of Korea, Sri Lanka and Taiwan (China), it has not been enough to absorb the growth in the working-age population (Figure 1.6, panel B). In Indonesia, however, the employment rate has risen more than a full percentage point since the onset of the crisis.
6 Figures for Indonesia refer to February 2008 and February 2010 respectively.
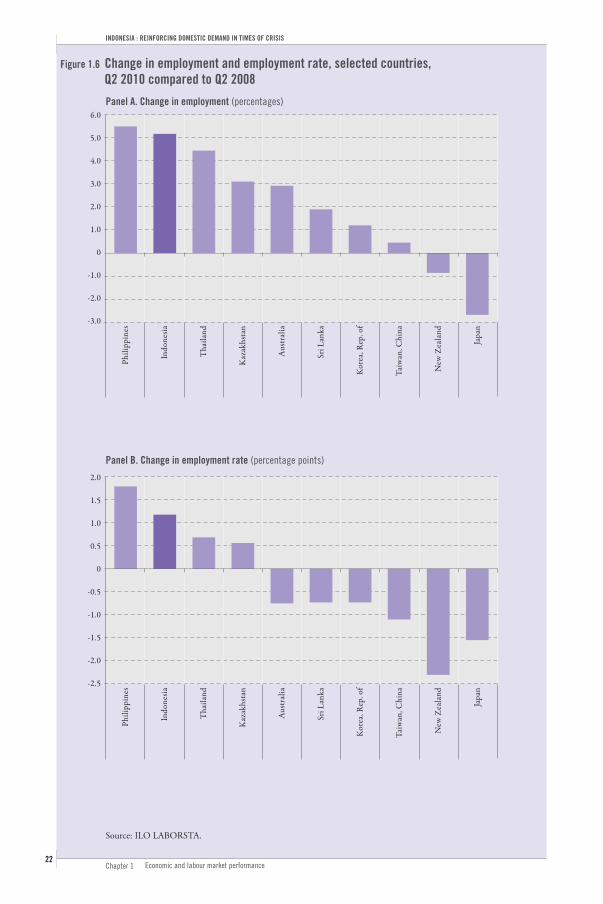
Figure 1.6 Change in employment and employment rate, selected countries, Q2 2010 compared to Q2 2008
Source: ILO LABORSTA.
2.0
1.5
1.0
0.5
0
-0.5
-1.0
-1.5
-2.0
-2.5
6.0
5.0
4.0
3.0
2.0
1.0
0
-1.0
-2.0
-3.0
Panel A. Change in employment (percentages)
Panel B. Change in employment rate (percentage points)
Phili
ppin
es
Indo
nesia
Tha
iland
Kaz
akhs
tan
Aus
tral
ia
Sri L
anka
Kor
ea, R
ep. o
f
Taiw
an, C
hina
New
Zea
land
Japa
n
Phili
ppin
es
Indo
nesia
Tha
iland
Kaz
akhs
tan
Aus
tral
ia
Sri L
anka
Kor
ea, R
ep. o
f
Taiw
an, C
hina
New
Zea
land
Japa
n
Chapter 1 Economic and labour market performance
INDONESIA : REINFORCING DOMESTIC DEMAND IN TIMES OF CRISIS
22
23
…but there were a number of employment adjustments – both in terms of sectors and job quality…
Despite the aggregate improvements, there were still a number of sectors that incurred job losses, notably construction and transportation:
Construction: Employment in construction declined by 2.6 per cent in February 2009 (compared to the previous year).
Transportation, storage, and communications: Within this sector, overall employment decreased by 1.1 per cent over the same period; this repre-sented 66,000 jobs.
In addition, in many developing and emerging economies there is often a shift from formal to informal job creation in times of crisis. In the absence of adequate social protection schemes, notably unemployment insurance, workers who lose their job in the formal sector need to compensate the income reduction by taking up informal jobs (see also Chapters 4 and 5). And in Indonesia, informal employment (including among the self-employed, casual employees and unpaid workers) accounts for close to 70 per cent of total employment (Figure 1.7, panel A). According to Badan Pusat Statistik (Statistics Indonesia, BPS) the share of informal employees rose between August 2008 and August 2009 from 69.1 to 69.5 per cent – in other words, the number of informal workers rose by approximately 1.4 million. Much of the increase was due to a rise in the number of casual and unpaid workers (Figure 1.7, panel B). In this respect, informal employ-ment acted as a buffer, compensating for losses in other areas. In many instances such trends are difficult to reverse, but as of February 2010 the share of informal employees in total employment returned to pre-crisis levels, although of course it remains high.

Figure 1.7 Informal employment, 2008–2010
Note: Informal employment includes self-employment, casual workers in agriculture and in non-agriculture and unpaid workers. Formal employment includes employers and employees. Indonesia’s labour force survey is conducted each February and August.Source: Badan Pusat Statistik (BPS: Statistics Indonesia).
25
20
15
10
5
0
-5
-10
-15
120
100
80
60
40
20
0
Panel A. Informal employment as a share of total employment (levels in millions and as percentage distribution)
Panel B. Change of informal employment by employment status (year-to-year change, percentages)
Feb-08
Feb-08
Aug-08
Aug-08
Feb-09
Feb-09
Aug-09
Aug-09
Feb-10
Feb-10
Aug-10
Aug-10
Casual workers in non-agricultureCasual workers in agricultureSelf-employmentUnpaid workers
Informal employment Formal employment
69.1 69.6 69.5 69.3 68.6 66.9
30.9 30.4 30.5 30.7 31.4 33.1
Chapter 1 Economic and labour market performance
INDONESIA : REINFORCING DOMESTIC DEMAND IN TIMES OF CRISIS
24

Total (15+) Men WomenYouth (15–24) Men WomenAdult (25+) Men Women
Table 1.1 Unemployment by age and gender, 2008–2009 (percentages)
Source: Badan Pusat Statistik (BPS:Statistics Indonesia).
February 2010August 2009February 2009August 2008February 2008
7.46.98.2
19.919.121.34.64.15.3
7.97.58.5
22.221.623.04.54.34.9
8.17.78.8
22.421.224.34.94.65.3
8.47.69.7
23.321.825.54.84.35.6
8.57.89.3
21.120.222.65.34.86.1
25
… and youth face di$culties in "nding employment…The aggregate trends also mask a number of other important compositional effects. Women were hit harder than men and as a result their unemploy-ment rate actually rose between February and August 2008 – probably due to their concentration in export-oriented sectors (Table 1.1). However, since August 2008 unemployment rates among women have fallen faster than those for men, so that the gap between the two has narrowed in com-parison to before the crisis. Youth also experienced a modest increase in their unemployment rates which, unlike those for women, remain at lofty levels: as of February 2010 the youth unemployment rate – at nearly 20 per cent – was more than four times the rate of their adult counterparts aged 25 and over.7
7 Inexperienced young workers are often likely to be among the first to be let go by firms and among the last to be recruited (ILO, 2009).

2006 2007 2008 2009
19
18
17
16
15
14
13
12
11
10
0.39
0.38
0.37
0.36
0.35
0.34
0.33
0.32
0.31
0.30
Figure 1.8 Trends in poverty and inequality, 2006–2009 (national poverty line, percentages)
Source: Badan Pusat Statistik (BPS: Statistics Indonesia).
Gini index (left axis)Poverty rate (right axis)
Chapter 1 Economic and labour market performance
INDONESIA : REINFORCING DOMESTIC DEMAND IN TIMES OF CRISIS
26
… and while poverty is declining, income inequality continues to rise.Following the 1997–98 financial crisis, poverty in Indonesia rose dramati-cally, but then started to decline from its peak of 24 per cent in 1998 – a trend which has continued throughout the current global crisis (Figure 1.8). As of 2009, the share of the population living below the national poverty line stood at just over 14 per cent, down from over 16 per cent in 2007. Conversely, recent trends in the Gini coefficient – a measure of income inequality – suggest that the global crisis has raised income inequality in Indonesia. The Gini index rose from 0.33 in 2006 to 0.37 in 2009.

27
C CONCLUDING REMARKS
Although Indonesia was hit by the global financial and economic crisis, the magnitude of the impact was not as severe in comparison to its counterparts and was a dramatic departure from the previous crisis of 1997–98. In fact, Indonesia was one of the few economies to have demonstrated resilience to the global crisis in terms of both growth and employment. With respect to the former, while GDP in most economies shrank during the global crisis, growth in Indonesia in 2009 was a robust 4.6 per cent. In terms of the lat-ter, Indonesia’s labour market performance was impressive during the global crisis period: the unemployment rate declined steadily, falling by over one percentage point between February 2008 and February 2010.
There were, however, a number of important distributional impacts masked by the aggregate performance. Youth were hard hit by the crisis and unem-ployment rates for this group remain high at over four times those of adults. In addition, income inequality also widened and informality rose – albeit briefly.
In light of this overall success, Chapter 2 presents a brief overview and broad assessment of Indonesia’s response to the global financial and eco-nomic crisis, while the subsequent chapters examine in more depth the role that each of the various labour market, social and economic policies have played in promoting recovery.

Chapter 1 Economic and labour market performance
INDONESIA : REINFORCING DOMESTIC DEMAND IN TIMES OF CRISIS
28
REFERENCES
Asian Development Bank (ADB). 2010. Key Indicators for Asia and the Pacific 2010, August (Manila).
—; International Labour Office (ILO); Islamic Development Bank (IDB). 2010. Indonesia: Critical development constraints, Country Diagnostics Studies (Manila, ADB; Geneva, ILO; Jeddah, IDB).
Badan Pusat Statistik – Statistics Indonesia (BPS). 2010. BPS strategic data (Jakarta).
Basri, M. C.; Rahardja, S. 2010. “The Indonesian economy amidst the global crisis: Good policy and good luck”, in ASEAN Economic Bulletin, Vol. 27, No. 1, pp. 77–97.
Bhaskaran, M.; Ghosh, R. 2010. Impact and policy responses: Indonesia, Philippines and Thailand, paper presented at the Asian Development Bank Regional Forum on the Impact of Global Economic and Financial Crisis, Manila, 14–15 Jan.
Cuevas, S.; Mina, C.; Barcenas, M; Rosario, A. 2009. Informal employment in Indonesia, ADB Economics Working Paper Series, No. 156, April (Manila, ADB).
Economist Intelligence Unit (EIU). 2010. Country report: Indonesia, July (London).
Ha, B.; McInerney, C.; Tobin, S.; Torres, R. 2010. Youth employment in crisis, Discussion paper No. 201, International Institute for Labour Studies (Geneva, ILO).
International Labour Organization (ILO). 2010a. Global Jobs Pact country scan: Indonesia (Geneva).
—. 2010b. Social security for informal economy workers in Indonesia: Looking for flexible and highly targeted programmes (Jakarta).
—. 2009. Labour and social trends in Indonesia 2009: Recovery and beyond through decent work (Jakarta).
International Monetary Fund (IMF). 2010. World Economic Outlook: Renouncing growth, April (Washington, DC).
Tambunan, T. 2010. The 2008–2009 global financial crisis and the impact on Indonesia’s economy, Policy Discussion Paper Series No. 21/2/2010, Center for Industry, SME and Business Competition Studies (Jakarta, Trisakti University).
29
World Bank. 2010a. Emerging stronger from the crisis, East Asia and Pacific economic update 2010, Vol. 1 (Washington, DC).
—. 2010b. Indonesia jobs report: Towards better jobs and security for all (Washington, DC).
—. 2010c. “Robust recovery, rising risks”, in East Asia and Pacific Economic Update, Vol. 2, Oct. (Washington, DC).
—. 2009. Indonesia Economic Quarterly: Weathering the storm, Jun. (Washington, DC).

31
CHAPTER 2 INDONESIA’S RESPONSE TO THE CRISIS
INTRODUCTION
To mitigate the fallout in employment in certain key sectors and to cush-ion the impact on growth, the Government announced a series of crisis response measures in January 2009. Furthermore, faced with the threat of a credit squeeze, the Bank of Indonesia – with help from the Government – stepped up efforts to stabilize the banking system and to facilitate access to credit for firms, especially small and medium-sized enterprises (SMEs).
The purpose of this chapter is thus to provide a comprehensive overview and evaluation of these initiatives. In particular, section A looks at the financial and monetary policies put in place by Indonesia, while section B provides a detailed look at the fiscal stimulus efforts. This section also includes an international comparison of Indonesia’s efforts vis-à-vis the size of the fiscal stimulus and its decomposition, and spending on infrastruc-ture, labour market, and social measures. This should set the scene for a more detailed analysis of the labour market and social responses and related impacts – the purpose of Chapters 3 and 4, respectively.

Chapter 2 Indonesia’s response to the crisis 32
INDONESIA : REINFORCING DOMESTIC DEMAND IN TIMES OF CRISIS
A FINANCIAL AND MONETARY POLICY
As a result of the global financial crisis, Indonesia’s stock market fell more than 50 per cent by the end of 2008. After a three-day severe drop in share prices between 6 and 8 October 2008, the Bank of Indonesia (BI) closed down the stock market to avoid further damaging the stability of finan-cial markets. Subsequently, the Government of Indonesia took a number of steps to support the financial system and enacted measures to address the challenge of increased corporate reliance on foreign financing. It also reduced the benchmark interest rate in an effort to support the exchange rate from devaluation.
1 CREDIT AND FINANCIAL POLICY
Due to the relatively closed nature of Indonesia’s economy, the collapse of foreign banking institutions had a minor effect on the primarily bank-based financial system. According to the Government, about 70 per cent of commercial financing comes from bank lending. Indonesian banks had not invested in subprime mortgage instruments or other toxic investments, nor were they particularly reliant on international investment for subsistence.8 Only a few Indonesian banks, mostly small institutions, underwent any particular liquidity problems, and those that did were put under the control of the Federal Indonesia Deposit Insurance Corporation to prevent any system-wide problems. For example, Century Bank received over US$677 million in November 2008.
The main risks facing Indonesia in terms of contagion were two-fold: (i) small and medium-sized enterprises faced credit constraints; and (ii) the reliance of corporations on foreign financing sources heightened the overall financial stress in the country — for example, credit growth dropped from 36.6 per cent in the third quarter of 2008 to 26 per cent in the fourth quarter.
8 Ziegenhein (2010).

33
Apprehension among banking establishments was the major cause of liquidity concerns, which were realized in the reduction of financial trans-actions in the credit default swap (CDS) markets, from US$50–75 million daily transactions prior to the crisis to US$20–30 million during late 2008 and early 2009.9 Consequently, the Bank of Indonesia injected additional liquidity into the banking sector to relieve the credit crunch confronted by smaller banks, with the Asian Development Bank (ADB) approving a US$1 billion loan to Indonesia in the case of a severe credit crunch. In spring of 2009, the World Bank also approved a US$2 billion fund for Indonesia to access if the Government proved unable to deal with the liquidity issue.10
Other avenues for international assistance existed through currency swap agreements with China (US$14.6 billion, A$16.3 billion), Japan (US$12 billion, A$13.4 billion) and the Republic of Korea (US$2 billion, A$2.2 billion) under the Chiang Mai Initiative (an initiative under the ASEAN+3 framework to create a network of bilateral swap agreements among ASEAN+3 countries). Importantly, Indonesia did not have to draw on these loans – in fact, over the course of 2009 conditions more or less reverted back to normal. Credit has expanded and liquidity rates improved dramatically.11
2 EXCHANGE RATE POLICY AND COUNTERING INFLATIONARY PRESSURES
One of the main risks facing the private sector — as was the case in 1997 — was the possibility of the devaluation of the Indonesian rupiah (IDR). But unlike other Asian economies which tried to devalue their currency in order to increase exports, Indonesia’s monetary strategy was to keep the rupiah proportional to the United States dollar.12 This was partly to ensure the continuation of foreign investment in Indonesian enterprises, but also due to the fact that most of Indonesia’s foreign debt is measured in US dollars, and thus devaluing the rupiah would effectively increase the deficit.
9 Baldacci et al. (2009). 10 Ziegenhein (2010). 11 Bank of Indonesia (2010a, 2010b). 12 Ziegenhein (2010).

Chapter 2 Indonesia’s response to the crisis 34
INDONESIA : REINFORCING DOMESTIC DEMAND IN TIMES OF CRISIS
Exchange rates were highly volatile, especially in the early months of the crisis. The head of the Economic Research Bureau at the Bank of Indonesia explains:
During 2008, the exchange rate saw considerably higher volatility compared to the previous year, while maintaining a depreciation trend. Averaged over the year, the rupiah weakened 5.4 per cent from IDR 9,140 per US dollar in 2007 to IDR 9,666 per US dollar in 2008. At end of year, the rupiah was trading at IDR 10,900 per US dollar, having lost 13.8 per cent (point to point) from the previous year-end close at IDR 9.393 per US dollar. Accompanying this was a sharp rise in volatility from 1.44 per cent in 2007 to 4.67 per cent in 2008.13
In order to regulate the foreign exchange market and avoid depreciation of the rupiah, the Bank limited the purchasing of foreign currency val-ued at more than US$100,000 by requiring special documents proving the existence of underlying agreements, and thus minimizing speculation. Furthermore, the Bank sold currency reserves, also aiming to reduce specu-lation and depreciation of the national currency. These measures were effec-tive in stabilizing the rupiah, so that by the end of 2009 it had risen by more than 15 per cent against the US dollar compared to the previous year and has since returned to pre-crisis levels.14 And while higher commodity prices, particularly in food and oil, characterized the first few months of the crisis and spurred concern over inflation as the slowdown in the world economy took hold, global commodity prices fell, reducing inflationary pressures.15
13 Simorankir and Adamanti (2010). 14 ibid.; see also World Bank (2010).15 Simorangkir and Adamanti (2010).

35
3 INTEREST RATE POLICY
With a view to boosting aggregate demand and preventing exchange rate depreciations, the Bank of Indonesia lowered its benchmark interest rate by 375 basis points, from 9.25 per cent in December 2008 to 6.5 per cent in September 2009 (Figure 2.1). Also, loan criteria were relaxed – especially for SMEs, which often rely on credit to sustain operations. The BI rate is currently (December 2010) at 6.5 per cent, which the Board of Governors believes to be “consistent with achievement of the inflation target and remains conducive to safeguarding financial stability and promoting the necessary banking intermediation for adequate supply-side response to accelerating demand amid heavy inflows of foreign capital and consider-able levels of excess liquidity”.16 Due to favourable economic predictions, inflation is now forecast to decrease even further, with a target of 4 per cent ± 1 per cent in the coming years (see Chapter 5 for more information regarding monetary policy in the post-crisis era).
4 EFFECTIVENESS OF FINANCIAL AND MONETARY MEASURES
It is important to understand that the financial and monetary response to the current crisis stemmed in many respects from Indonesia’s experience during the Asian financial crisis. Following 1997, Indonesia made several institutional changes within the financial sector, notably (i) stricter financial market supervision and regulation (Badan Pengawas Pasar Modal); (ii) an independent and stronger Bank of Indonesia (the central bank); (iii) crea-tion of a deposit insurance system (Lembaga Penjamin Simpanan); and (iv) transparency with regard to financial and monetary policies. As a result of these reforms, Indonesia’s financial sector was in remarkably good shape leading up to the current crisis. In particular:
16 Bank of Indonesia (2010a).

Dec 08 Jan 09 Feb 09 Mar 09 Apr 09 May 09 Jun 09 Jul 09 Aug 09 Sep 09
9.5
9.0
8.5
8.0
7.5
7.0
6.5
6.0
Figure 2.1 Reduction in the Bank of Indonesia rate, 2008–2009
Source: Bank of Indonesia.
Chapter 2 Indonesia’s response to the crisis 36
INDONESIA : REINFORCING DOMESTIC DEMAND IN TIMES OF CRISIS
2008, the lowest rate since 1997.
double the threshold of 8 per cent stipulated by the Bank of Indonesia.
This relatively robust financial health preceding the current crisis increased the resiliency of the financial sector, and hence it suffered relatively minor stress during the 2008–09 crisis — at least in comparison to 1997. In 2009, the Government passed a law establishing a financial safety net called Jaring Pengaman Sistem Keuangan (JPSK) which includes a number of provisions to strengthen further the financial sector.

Figure 2.2 Fiscal stimulus in G20 and selected Asian economies, 2008 (percentage of GDP)
Source: IILS estimates based on national sources.
18
16
14
12
10
8
6
4
2
0
Tha
iland
Chi
na
Saud
i Ara
bia
Vie
t Nam
Kor
ea, R
ep. o
f
Mal
aysia
Sing
apor
e
Turk
ey
Uni
ted
Stat
es
Italy
Phili
ppin
es
Indi
a
Aus
tral
ia
Sout
h A
fric
a
Ger
man
y
Can
ada
Arg
entin
a
Taiw
an, C
hina
Japa
n
Fran
ce
Mex
ico
Indo
nesia
Uni
ted
Kin
gdom
Braz
il
Russ
ian
Fed.
7.1Weighted average for Asia
37
B FISCAL STIMULUS MEASURES
In January 2009, the Indonesian Government announced a fiscal stimulus package worth IDR 73.3 trillion, or approximately USD7.1 billion.17 This amounted to 1.4 per cent of GDP, making it the smallest stimulus package across Asia and one of the smallest in G20 economies – only Brazil, Russian Federation and the United Kingdom spent less (Figure 2.2). In comparison, the weighted average for Asia was roughly 7 per cent of GDP — driven in part by the large stimulus effort of China (13 per cent of its GDP). Still other economies in the region, such as Malaysia, Singapore, Thailand and Viet Nam, spent considerably more in stimulating economic activity. Part of the explanation behind the comparably low fiscal response is – as dis-cussed in Chapter 1 and above – Indonesia was less affected by some of the main transmission mechanisms of the crisis, i.e. trade and finance.
17 In 2009, IDR 1 trillion was worth roughly 96.2 million.

Chapter 2 Indonesia’s response to the crisis 38
INDONESIA : REINFORCING DOMESTIC DEMAND IN TIMES OF CRISIS
The stimulus package was financed through mainly two sources: (i) unused funds from the 2008 budget, amounting to as much as IDR 50 trillion; and (ii) raising capital in the international bond market. Furthermore, as per Article 23 of the Constitution, the budget for the stimulus package was part of the overall budget for 2009. Article 23 allows the Government a supplementary expansion of the annual budget when faced with a difficult macroeconomic situation. Indonesia’s fiscal stimulus focused on three primary objectives: (i) maintain and improve peoples’ purchasing power; (ii) prevent layoffs and improve product competitiveness; and (iii) increase investment in labour-intensive infrastructure. To achieve this, a number of fiscal policy instruments were introduced as well as expanding pre-existing programmes. The following section takes an international approach to comparing the composition of fiscal stimulus spending, and provides a detailed discussion of each spend-ing category for Indonesia.
1 COMPOSITION OF SPENDING
Given that countries were affected differently (and to varying degrees), and the number of policy levers at their disposal also varied considerably, it is not surprising that the composition and focus of fiscal stimulus efforts also differed. Table 2.1 decomposes the fiscal stimulus into the following five categories: (i) labour market measures; (ii) transfers to low-income individuals and households; (iii) infrastructure spending; (iv) tax cuts; and (v) additional measures to boost the aggregate demand.
For advanced economies, the largest spending category was tax cuts – on average 27 per cent of the total stimulus was directed towards tax incentives. In contrast, the largest category of spending for developing and emerging economies was infrastructure, which comprised close to 40 per cent of total stimulus.

Advanced economiesDeveloping and emerging economies
AsiaIndonesia
Table 2.1 Composition of stimulus spending by country groupings (weighted averages by GDP)
Note: Includes 24 advanced economies, 29 developing & emerging economies, and 12 Asian economies. Components of the stimulus spending are shares of the total stimulus. Source: IILS based on national sources.
Additional measures to
boost aggrega-tea demand
Tax cuts Infrastructure spending
Transfers to low-income
individuals & households
Labour market
measures
Stimulus as a %
of GDP
30.036.131.56.2
26.815.418.975.6
20.837.232.910.8
10.66.18.16.9
11.75.18.6
0.40
3.97.37.11.4
39
On the other hand, the second largest spending category for advanced economies was infrastructure – one-fifth of the total stimulus on average, while for developing and emerging economies it was tax cuts. In terms of labour market measures and transfers to low-income individuals and households, advanced economies on average spent 11.7 and 10.6 per cent respectively; in these categories the spending for developing and emerging economies was 5.1 and 6.1 respectively.
Among the Asian economies the averages for labour market measures and transfers to low-income individuals and households was larger – both above 8 per cent of the total stimulus. In Indonesia, however, the largest fraction of spending, with 75.6 per cent of the stimulus, was tax cuts — compared to one-fifth or less in other Asian economies (Figure 2.3). The second largest component was infrastructure at 10.8 per cent, considerably lower than the weighted averages for developing and emerging and other Asian economies. Even among the advanced G20 economies, where tax cuts took on greater emphasis, the share of stimulus in tax reductions was still below 50 per cent, as in Germany, the United Kingdom and the United States.

Figure 2.3 Tax cuts as a percentage of total stimulus spending, selected G20 and Asian economies
Source: IILS based on national sources.
80
70
60
50
40
30
20
10
0
Indo
nesia
Ger
man
y
Uni
ted
Kin
gdom
Uni
ted
Stat
es
Kor
ea, R
ep. o
f
Japa
n
Braz
il
Aus
tral
ia
Turk
ey
Taiw
an, C
hina
Arg
entin
a
Can
ada
Vie
t Nam Ita
ly
Sout
h A
fric
a
Chi
na
Phili
ppin
es
Mex
ico
Bang
lade
sh
Mal
aysia
Fran
ce
Tha
iland
Indi
a
18.8Weighted average for Asia
Initial income up to IDR 13 millionAdditional income IDR 13-25 millionAdditional income IDR 25–50 millionAdditional income IDR 50–100 millionAdditional income IDR 100–200 millionAdditional income above IDR 200 million
Initial income up to IDR 16 millionAdditional income IDR 16-50 millionAdditional income between IDR 50–250 millionAdditional income IDR 250–500 millionAdditional income above IDR 500 million
Table 2.2 Changes in individual tax rates and tax brackets, 2008–2009
Source: ILO Country Office for Indonesia and Timor-Leste.
Marginal tax rate (%)
Marginal tax rate (%)Income group Income group
05
152530
05
10152535
Until 31 December, 2008 As of 1 January, 2009
Chapter 2 Indonesia’s response to the crisis 40
INDONESIA : REINFORCING DOMESTIC DEMAND IN TIMES OF CRISIS

Figure 2.4 Composition of tax cuts (percentages)
VAT reduction
Corporate tax cut Income tax cut
Import tariff reduction
Source: IILS based on national sources.
41
2 TAX CUTS
The principal objectives of tax-related incentives introduced in Indonesia were two-fold: (i) to stimulate private consumption and maintain purchas-ing power; and (ii) to lower corporate expenditure and make business more competitive. Hence, the tax incentives comprised the following (see also Figure 2.4):
Reduction in personal income tax: Fifty-five per cent of the tax cuts (IDR 24.5 trillion) went to modifications in the personal income tax structure (Table 2.2). In particular:
Change in tax brackets and rates: For example, for incomes between IDR 100 and 200 million the marginal tax rate is now 15 per cent instead of 25 per cent. The threshold for the lowest tax rate of 5 per cent was increased from IDR 25 million to IDR 50 million, which essentially merged the first two tax brackets in the old system. This also means that while before the crisis individuals were paying 10 per cent income tax on additional income over IDR 25 million, under the new system they pay 5 per cent.
Chapter 2 Indonesia’s response to the crisis 42
INDONESIA : REINFORCING DOMESTIC DEMAND IN TIMES OF CRISIS
Increased lower bound: The tax-free band, up to which no taxes are pay-able, was raised from IDR 13.2 million to IDR 15.8 million for single individuals. For married people it went up from IDR 14.4 million to IDR 17.1 million.18
Reduction in corporate income tax: The principal aim in lowering cor-porate taxes (34 per cent of the total cuts or IDR 19.3 trillion) was to retain business competitiveness. As of 2010, corporate income tax rate is a flat rate of 25 per cent. Public companies that satisfy a minimum listing requirement of 40 per cent are entitled to a tax discount of 5 per cent off the standard rate, giving them an effective tax rate of 20 per cent.19 Small enterprises, i.e. corporate taxpayers with an annual turnover of not more than IDR 50 billion, are entitled to a tax discount of 50 per cent off the standard rate, imposed proportionally on taxable income of the part of gross turnover up to IDR 4.8 billion. The tax incentives for publicly listed firms, especially for SMEs, are designed to increase the competitiveness of the private sector and boost the domestic environment for investment.
Reduction in indirect tax (VAT) and Import tariff cut: Of the total tax cuts, only 6.2 and 4.4 per cent respectively went towards VAT exemption and import tariff cuts. VAT exemption applied for a total of 17 industries (mostly food and commodities such as oil and gas), while the import tar-iff cut applied for nine industries (heavy equipment, electronic products, medical supplies, and others).
18 There were additional tax exemptions for individuals depending on family circumstances.19 PricewaterhouseCoopers Indonesia (2010).

Figure 2.5 Infrastructure spending in Indonesia compared to other Asian countries (percentages)
70
60
50
40
30
20
10
0
Taiw
an, C
hina
Tha
iland
Chi
na
Phili
ppin
es
Mal
aysia
Vie
t Nam
Sing
apor
e
Kor
ea, R
ep. o
f
Japa
n
Indo
nesia
Source: IILS based on national sources.
43
3 INFRASTRUCTURE SPENDING Unlike many other Asian economies, Indonesia spent very little on infra-structure – in fact the lowest (10.8 per cent, see Figure 2.5). In contrast, other countries such as China, Taiwan (China) and Thailand spent close to half or more on infrastructure. However, it is important to note that prior to the crisis, the modernization of infrastructure in Indonesia was a key strategy to improving Indonesia’s investment climate. In this respect, the response in 2009 was intended simply to build upon this broader strategy while placing emphasis on employment-oriented activities (Box 2.1).

Box 2.1 Public works in Indonesia before the crisis
During the current global crisis Indonesia spent a relatively smaller fraction of its fiscal stimulus package on infrastructure. However, this masks the fact that leading up to the crisis Indonesia had been spending a large portion of its national income on public works programmes. In 2007, for example, 17 per cent of government expenditure went to spending on public works and transportation, up from 14 per cent in 2005. According to preliminary allocations for 2011, this will rise further to 19 per cent.
Meanwhile, Indonesia has ongoing programmes with the World Bank and the Asian Development Bank to improve its infrastructure and public institutions. Improving production and economic capacity has been the main concern for the Indonesian Government.
Chapter 2 Indonesia’s response to the crisis 44
INDONESIA : REINFORCING DOMESTIC DEMAND IN TIMES OF CRISIS
The highest share of infrastructure expenditure was allocated through the Ministry of Public Works – IDR 6.6 trillion, out of which 3.6 trillion was centrally disbursed while 3.0 trillion was allocated regionally and locally. A large share of the public works spending went to water resource develop-ment, roads, and sanitation systems. According to a survey conducted by the ILO Jakarta Office, disadvantaged groups were the main beneficiaries of the public works spending.20 For example, more than 60 per cent of people who got jobs through public works schemes had been unemployed before.21 Other infrastructure-related investments included projects in public housing, road, rural development and health-care facilities. Even though there were was a significant time lag in disbursing the funds allo-cated for infrastructure, once the spending started in October 2009 most of it was gone (above 90 per cent) by the end of 2009. The Government expedited the administrative process by providing stimulus funding to the existing public works schemes. New programmes adopted the pre-existing procedures, and the local and regional stakeholders were leveraged to get the funds out quicker.22
20 Allen (2010).21 The survey showed, however, that women did not benefit as much from the public works spending as men did; they had limited access to job opportunities.22 ILO (2010).23 ibid.

45
One of the main emphases with respect to infrastructure spending was job creation – spending efforts focused on projects with high employment content. Indeed, the Coordinating Ministry of Economic Affairs worked with the ILO in trying to better understand the impact of infrastructure spending on employment.23
4 SOCIAL SPENDING
Indonesia’s social spending during the crisis was mostly comprised of enhancements to previously existing programmes. However, it did allo-cate close to 7 per cent of the total stimulus (similar to other countries in the region) towards subsidies and national programmes for community empowerment, which mostly benefit low-income households. Most of this funding went towards subsidies (IDR 4.5 trillion out of a total of IDR 5.1 trillion for social spending) that led to a reduction in cooking oil prices, a large portion of low-income households’ annual expenditure. The subsidies also incentivized low-income households to buy generic medicines, which tend to be cheaper than branded ones. And some portions of the subsidies supported pre-existing items. Meanwhile, the Government increased its allocation to address poverty by funding some of the pre-existing social programmes – from IDR 58 trillion in 2008 to IDR 78 trillion in 2009. The money was mainly chan-nelled into the following programmes: (i) PNPM – National Programme for Community Empowerment to cover 6,408 sub-districts and 78,000 villages; (ii) the Raskin programme (Beras Untuk Keluarga Miskin, subsidized rice program for the poor); and (iii) the BOS – School Operational Assistance Programme.
Chapter 2 Indonesia’s response to the crisis 46
INDONESIA : REINFORCING DOMESTIC DEMAND IN TIMES OF CRISIS
Other programmes, notably, the SPP (Women’s Savings and Loans), Jamkesmas (public health care) and direct cash transfers played an impor-tant role in stabilizing income (see Chapter 4 for further details):
SSP provides loans to women at low interest rates, usually around 18 per cent for one year. The money is usually invested in businesses, specifically those that are already in operation or are about to be started.
Jamesmas: a programme – started in 1997 – that introduced health cards to the Indonesian public, and free public health insurance that includes treatment and medications to those who show their mandated health and family cards.
Direct cash transfers: There exists a series of social assistance and cash transfers to individuals to support daily consumption expenditures such as medical, education and subsistence costs, as well as investment towards business capital.
5 SKILLS TRAINING AND OTHER LABOUR MARKET MEASURES
Among the labour market measures introduced, Indonesia allocated IDR 300 billion to the Ministry of Manpower and Transmigration to improve vocational training in labour-intensive sectors. The programme however, represents approximately only 0.4 per cent of the total package – the small-est among Asian and G20 economies. In the area of worker skills and employability, IDR 110 billion went to labour-intensive training, and IDR 30 billion to improve labour networking.24 In 2009 the Government built additional vocational schools throughout the year, which focused on IT programmes. It also strengthened its ties with a wide array of industries, from banking to airlines, in order to improve programme effectiveness and enhance employee skills.25
24 Chatani and Kim (2009). 25 ibid.

47
Indonesia also allocated resources to developing its pre-existing BOS gen-eral education programme. This programme was originally enacted in 1998 as one of many initiated in response to the Asian financial crisis.26 It originally started out as a scholarship programme for students from poor families. In 2005 the Government included subsidies and funding to pub-lic primary and junior secondary schools as part of the programme. This funding by federal and local government for the primary and junior high school levels has continued to this day and, as mentioned above, saw its allocation increased in 2009.
26 Hastuti et al, (2010).
Chapter 2 Indonesia’s response to the crisis 48
INDONESIA : REINFORCING DOMESTIC DEMAND IN TIMES OF CRISIS
C CONCLUDING REMARKS
In many respects, Indonesia’s fiscal stimulus was quite atypical for the region, in terms of both size and composition. First, with respect to the former, total spending amounted to 1.4 per cent of GDP – one of the lowest among Asian and G20 economies. Second, unlike many emerging economies that focused efforts on infrastructure investments, tax cuts (per-sonal, corporate, VAT and import tariff ) accounted for three-quarters of the stimulus package in Indonesia. In this respect – and against the backdrop of an economy less dependent on exports – the principal aim of the fiscal stimulus efforts was to maintain individual purchasing power, stimulate domestic demand and ensure the viability of the private sector. After tax reductions, the next largest spending item for Indonesia was infrastructure (close to 11 per cent of total spending). This was aimed at complementing efforts to boost private income, stimulating employ-ment by investing in labour-intensive sectors such as irrigation and road construction. Although some amendments were made to existing social programmes, the Government principally relied on programmes already in place – many of which had been introduced following the 1997–98 Asian financial crisis – to address social challenges such as poverty stemming from the current crisis.
Indonesia has weathered the crisis rather favourably in comparison to its South-East Asian neighbours, in terms of both growth and the labour mar-ket, as Chapter 1 demonstrated. The purpose of the following chapters is to assess in more detail the impact of the various policy levers on employment, income and growth.

49
REFERENCES
Allen, E. Forthcoming. Recovery through increasing investments in social and economic assets: Infrastructure, job creation, and fiscal stimulus, (Jakarta, ILO).
Baldacci, E.; Goyal, R.; Ruiz-Arranz, M. 2009. Indonesia: Selected issues, IMF Country Report No. 09/231 (Washington, DC, IMF).
Bank of Indonesia (Central Bank of the Republic of Indonesia). 2010a. Monetary Policy Review, Nov. (Jakarta).
—. 2010b. 2009 Economic Report on Indonesia, Directorate of Economic Research and Social Policy (Jakarta).
Brömmelhörster, J.; Priasto, A. 2010. “Indonesia”, in Asian Development Outlook (Jakarta, ADB), pp. 202–205.
Brondolo, J. et al. 2008. Tax administration reform and fiscal adjustment: The case of Indonesia (2001–07), Working Paper WP/08/129 (Washington, DC, IMF).
Chatani, K.; Kim, K. B. Labour and social trends in Indonesia 2009 : Recovery and beyond through decent work (Geneva, ILO).
Executive Office of the President of the United States. 2010. The impact of the American recovery and reinvestment Act of 2009, Fourth Quarterly Report, Jul., Council of Economic Advisors (Washington, DC).
Hartono, D. 2010. A research study to assess the effectiveness of policies designed to mitigate the impact of the global financial crisis in Indonesia, Discussion Paper Series No. 208 (Geneva, International Institute for Labour Studies).
—. Irawan, T.; Irawan, F. 2010. Infrastructure improvement and its impact on Indonesian economic performance (Bandung, Padjadjaran University).
Hastuti et al. 2010. The role of social protection programs in reducing the impact of the glo-bal financial crisis 2008/2009, Research report (Jakarta, SMERU Research Institute).
International Labour Organization (ILO). 2010. Global Jobs Pact country scan: Indonesia (Geneva).

Chapter 2 Indonesia’s response to the crisis 50
INDONESIA : REINFORCING DOMESTIC DEMAND IN TIMES OF CRISIS
—. 2009. Labour and social trends in Indonesia 2009: Recovery and beyond through decent work (Jakarta).
Islam, I.; Chowdhury, A. 2009. Growth, employment, and poverty reduction in Indonesia (Geneva, ILO).
PricewaterhouseCoopers Indonesia. 2010. Indonesian Pocket Tax Book 2010 (Jakarta).
Saxton, J. 2006. Investment tax incentives boost economic growth, Joint Economic Committee Research Report No. 109-35 (Washington, DC, United States Congress).
Simorangkir, I.; Adamanti, J. 2010. The role of fiscal stimuli and monetary easing in Indonesian economy during global financial crisis: Financial computable general equilibrium approach, paper presented at the EcoMod2010 conference, Istanbul, 7–10 Jul.
World Bank. 2010. Emerging stronger from the crisis, East Asia and Pacific economic update 2010, Vol. 1 (Washington, DC).
World Economic Forum. 2010. The Global Competitiveness Report 2010–2011 (Geneva).
Ziegenhein, P. 2010. “Indonesia country report”, in Bertelsmann Stiftung (ed.): Managing the crisis: A comparative assessment of economic governance in 14 economies (Gütersloh, Bertelsmann).

51
CHAPTER 3 AN ANALYTICAL ASSESSMENT OF FISCAL STIMULUS POLICIES
INTRODUCTION
The purpose of this chapter is to examine the effectiveness of the measures put in place in terms of their economic and employment impact. The evaluation is principally based on a social accounting matrix model which assesses various policy scenarios, notably: (i) reduction in personal income tax; (ii) reduction in corporate income tax; (iii) reduction in indirect tax (on commodities); (iv) import tariff cut; (v) subsidy (for activities); (vi) government transfers to firms; and (vii) spending on infrastructure and government services.27 The simulations are intended to replicate in both size and composition Indonesia’s actual stimulus efforts.
With that in mind, section A provides a snapshot of general effectiveness by looking at implementation rates and examining the recent literature with respect to early evaluations of measures adopted, while sections B and C estimate the impact of the policy responses on growth and employment, respectively. The final section will conclude by summarizing a number of policy considerations and challenges.
27 See the Appendix for a detailed discussion of the SAM and Dynamic SAM methodology.

Chapter 3 An analytical assessment of fiscal stimulus policies 52
INDONESIA : REINFORCING DOMESTIC DEMAND IN TIMES OF CRISIS
A OVERALL EFFECTIVENESS OF STIMULUS EFFORTS
!e bulk of announced "scal stimulus spending was in e#ect within the year…
By the end of 2009, more than 80 per cent of spending announced had been realized (Table 3.1). Among the main objectives of stimulus spend-ing, all had realization rates (share of funding spent) above 78 per cent. Interestingly, while infrastructure spending can often be subject to some lag due to administrative burdens, in Indonesia the highest realization rate was in the objective of increasing investment in labour-intensive infra-structure. Almost all the policy instruments in this category posted a near 100-per-cent realization rate, the exceptions being government spending for employment programmes and spending for agriculture infrastructure. Similarly, the cuts in corporate income tax and government capital expendi-ture to State-owned enterprises (SOEs) also had realization rates of 100 per cent. On the other hand, the realization rates were notably low in terms of the other tax-related measures, notably the reduction in VAT (less than 50 per cent) and the tariff import tax cut (less than half of one per cent). It is likely that the latter is due to declines in overall aggregate demand (thus imports) as well the lag in the actual implementation of the tariff cut. The instrument was effective by the second quarter of 2009; in the meantime a firm usually signed a purchase contract for raw materials and other inputs at the beginning of the year.
..with early indications that the impact was generally positive. Although the crisis is still very recent there are a few studies, including one carried out by the ILO Jakarta Office, that show that fiscal efforts in general have had a positive impact on the economy (Table 3.2). However, one of the studies (Hastuti et al., 2010) concluded that social programmes and the extension of previously existing programmes were less successful.

I. Maintain and improve people’s purchasing power
II. Prevent employees’ contract termination and improve product competitiveness
III. Increase investment in labour-intensive infrastructure
Total
Chatani and Kim (2009)
Hartono, Irawan and Irawan (2010)
Hastuti et al. (2010)
Simorangkir and Adamanti (2010)
a. Personal income tax cutb. Value-added tax cut
a. Employee income tax cutb. Corporate income tax cutc. VAT tax cutd. Tariff import tax cute. Subsidyf. Government capital expenditure to SOEs
Government spending on:a. Public works infrastructureb. Transportation infrastructurec. Energy and mineral resourcesd. Public housinge. Trade infrastructuref. Agriculture infrastructureg. Employmenth. Public healthi. People empowerment programmej. Revitalization of primary commodity warehouses
General, positive
Infrastructure, positive
Social spending, negative
Overall, positive
Table 3.1 Realization rates by spending category and programme, end of 2009
Table 3.2 Effectiveness of Indonesia’s stimulus efforts according to the literature, 2009–2010
Source: Coordinating Ministry of Economic Affairs (2010).
% of budgetRealizationStimulus
Outcomes of policy levers
Objectives of stimulus spending
Authors & date
Fiscal stimulus instrument
Focus of the study & overall assessment
79.7061.35
79.70100.0040.270.29
99.64100.00
97.5094.5898.4798.7991.810.00
84.4399.86
100.00100.00
83.84
19 526.7828.2
5 180.619 300.01 006.7
7.24 157.8500.0
6 433.42 079.7492.4493.9289.0
0.0253.3149.8601.5120.0
61 420.2
24 500.01 350.0
6 500.019 300.02 500.02 500.04 172.8500.0
6 601.22 198.8500.0500.0315.0650.0300.0150.0601.5120.0
73 259.3
boosted and impact of the crisis cushioned
and limited engagement of social partners
benefits in productivity
impact
varied across regions
previous programmes was sufficient
53

Chapter 3 An analytical assessment of fiscal stimulus policies 54
INDONESIA : REINFORCING DOMESTIC DEMAND IN TIMES OF CRISIS
According to Simorangkir and Adamanti (2010), the overall success is largely attributable to strong domestic demand and increased consump-tion spurred by the stimulus; the declines in growth would have been much worse without the implementation of the Government’s countercyclical policies. In particular, the studies and simulations have also attempted to estimate the impact of a number of particular instruments:
Tax cuts: the reduction in corporate taxes, indirect tax, and personal income taxes of 7.7 per cent, and 14 per cent in the direct mining tax were estimated to increase GDP by 1 percentage point. The improve-ment in GDP was estimated to be driven by an increase in consump-tion of 1.3 per cent, investments by 0.95 per cent, exports by 2.2 per cent and imports by 2.9 per cent. The scenario assumed that 50 per cent of Indonesia’s initial fiscal stimulus was spent by the end of 2009 (Simorangkir and Adamanti, 2010).28 As tax incentives are the largest components of the stimulus spending, the Government expects that the indirect job creation resulting from these measures could be greater than for any other area of spending.29
Infrastructure: In terms of output, improvements to irrigation infrastruc-ture may yield the greatest benefits – an additional 5 per cent investment produces a 0.7 per cent increase in output. Moreover, improvements to irrigation infrastructure, land transportation and telecommunications are likely to have the highest multiplier effects in terms of output in other sectors and income generation among workers, given their capacity to increase productivity, lower cost margins, and increase capital invest-ment.30 In terms of employment, investments in road construction have higher employment effects and returns on investment than other expenditures.31 Infrastructure development has the additional benefit of
28 The authors utilized a financial computable general equilibrium model (FCGE) to determine the long-term impact of Indonesia’s fiscal policies, mainly its long list of tax reductions.29 Chatani and Kim (2009).30 Hartono, Irawan and Irawan (2010). The authors undertook simulations of the effect of spending on the following sectors: (i) electricity, gas and drinking water; (ii) construction; (iii) land transportation; and (iv) water, air transportation, and communications.31 Based upon the use of a dynamic social accounting matrix (DySAM) model which analyses the direct, indirect and induced employment impact of government spending (ILO Jakarta Office, 2010).
55
increasing worker incomes.32 This effect holds true even for those work-ers who do not directly participate in the sector affected. For example, improvements in irrigation infrastructure will raise the wages of agricul-tural workers, but also those of non-agricultural workers as well.
Social spending: The overall effectiveness of the social programmes varied across different regions (see also Chapter 4).33 Among the various pro-grammes, the direct cash transfer programme provided much-needed support in terms of basic needs and public goods (food, education, infra-structure, and so on) that would not have been made available otherwise. On the other hand, the effects of both the SPP and the Raskin pro-grammes were limited due to inefficiencies, notably as regards delivery. For example, most recipients of rice have not been receiving it routinely or in the mandated amount. The impact of the Jamkesmas health-care programme – which continued operating through the crisis – was limited due to its lack of visibility.
32 Hartono, Irawan and Irawan (2010).33 Hastuti et al (2010).
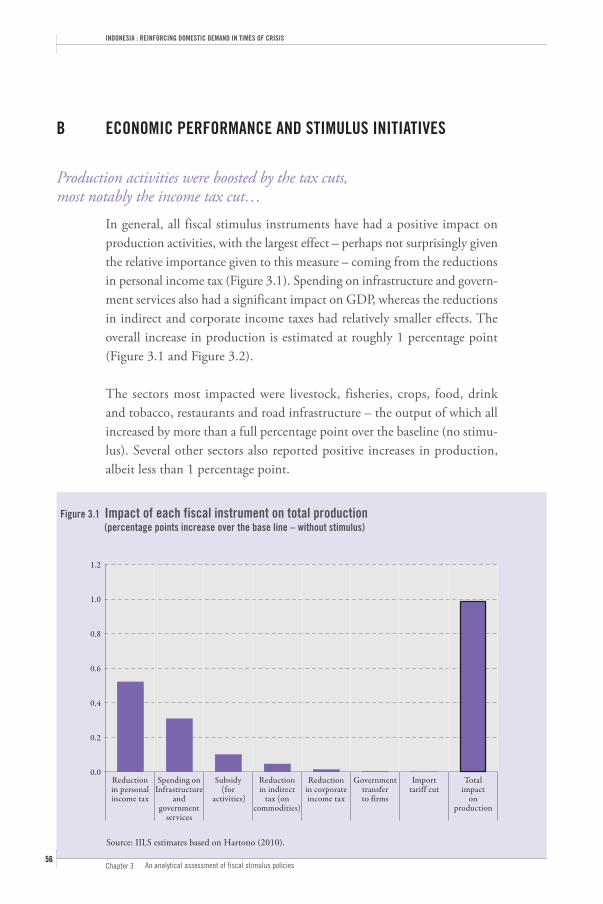
Figure 3.1 Impact of each fiscal instrument on total production (percentage points increase over the base line – without stimulus)
1.2
1.0
0.8
0.6
0.4
0.2
0.0
Reduction in personal income tax
Spending on Infrastructure
and government
services
Subsidy (for
activities)
Reduction in indirect
tax (on commodities)
Reduction in corporate income tax
Government transfer to firms
Import tariff cut
Total impact
on production
Source: IILS estimates based on Hartono (2010).
Chapter 3 An analytical assessment of fiscal stimulus policies 56
INDONESIA : REINFORCING DOMESTIC DEMAND IN TIMES OF CRISIS
B ECONOMIC PERFORMANCE AND STIMULUS INITIATIVES
Production activities were boosted by the tax cuts, most notably the income tax cut…
In general, all fiscal stimulus instruments have had a positive impact on production activities, with the largest effect – perhaps not surprisingly given the relative importance given to this measure – coming from the reductions in personal income tax (Figure 3.1). Spending on infrastructure and govern-ment services also had a significant impact on GDP, whereas the reductions in indirect and corporate income taxes had relatively smaller effects. The overall increase in production is estimated at roughly 1 percentage point (Figure 3.1 and Figure 3.2).
The sectors most impacted were livestock, fisheries, crops, food, drink and tobacco, restaurants and road infrastructure – the output of which all increased by more than a full percentage point over the baseline (no stimu-lus). Several other sectors also reported positive increases in production, albeit less than 1 percentage point.

Figure 3.2 Impact of the fiscal stimulus on production by sector (percentage points over the baseline – without stimulus)
1.6
1.4
1.2
1.0
0.8
0.6
0.4
0.2
0.0
Livestock Fisheries Crops Food, drink and
tobacco
Restaurants Road infrastructure
Total impact on all
production
Note: Only sectors with over 1 per cent impact are included. Source: IILS based on Hartono (2010).
57
In terms of the effects and transmission mechanisms within each policy lever, the simulations reveal the following:
Personal income tax reduction: The largest impact of the tax reduction was on sectors related to basic commodities, including food, drink and tobacco as well as trade services and other similar sectors. For example, through the personal income tax reduction, production increased in live-stock by 1.04 per cent, in fisheries by 1.0 per cent, in food, drink and tobacco by 0.91 per cent, and in the restaurant sector by 0.92 per cent. These are all increases over the baseline of “production with no stimulus”. It is likely that these sectors benefited from the increase in the purchasing power of individuals, given that individuals spend a large share of their income on basic needs such as food items.
Corporate tax reduction: The construction sector benefited most from the cuts in corporate taxes. For example, through this tax reduction, total production in construction increased by 1.3 per cent over the baseline.
Chapter 3 An analytical assessment of fiscal stimulus policies 58
INDONESIA : REINFORCING DOMESTIC DEMAND IN TIMES OF CRISIS
Value-added tax (VAT) reduction: The simulations illustrate that VAT reductions had a relatively smaller impact on production than the per-sonal income tax and corporate tax cuts. For example, the reduction in VAT increased production in coal, metal, petroleum and mining by 0.18 per cent, and food, drink and tobacco by 0.12 per cent.
Infrastructure spending: Not surprisingly, spending in this category increased production in the road, irrigation, and construction sectors by 1 per cent each over the baseline. Several other sectors also benefited, in particular: mining by 0.9 per cent; forestry and hunting by 0.5 per cent; paper, print, transport, and metal by 0.21 per cent; chemicals fertilizers, clay and cement by 0.24 per cent; and real estate and business services by 0.3 per cent.
The remaining policy instruments, such as the import tariff cut, subsidies and transfers to firms, had relatively smaller impacts on production.

Figure 3.3 Employment growth and impact of the fiscal stimulus, 2008-10 (out of the total jobs created between August 2008 and 2010)
4 000 000
3 500 000
3 000 000
2 500 000
2 000 000
1 500 000
1 000 000
500 000
0
Total job creation
Community, social, and
personal services
Wholesale trade, retail trade,
restaurants and hotels
Manufacturing industry
Construction Financing, insurance, real estate
and business services
Source: IILS based on Hartono (2010).
Job creation due to stimulus
59
C IMPACTS ON EMPLOYMENT
Preliminary estimates show that more than 30 per cent of the jobs created between February 2009 and August 2010 were due to the stimulus package – 1.2 million out of 3.7 million jobs (Figure 3.3). For instance:
created in the wholesale trade, retail trade, restaurant and hotel sector were due to the stimulus.
For example, only 5 per cent of the jobs created in the community, social and personal services sector can be attributed to the stimulus, while in the manufacturing sector 8.6 per cent of jobs created are estimated to have resulted from stimulus efforts.

Figure 3.4 Impact of each fiscal instrument on employment
500 000
450 000
400 000
350 000
300 000
250 000
200 000
150 000
100 000
50 000
0
Reduction in personal income tax
Spending on Infrastructure
and government
services
Subsidy (for activities)
Reduction in indirect tax (on commo-
dities)
Reduction in corporate income tax
Government transfer to firms
Import tariff cut
Source: IILS estimates based on Hartono (2010).
Urban
Rural
Chapter 3 An analytical assessment of fiscal stimulus policies 60
INDONESIA : REINFORCING DOMESTIC DEMAND IN TIMES OF CRISIS
!e reduction in personal income tax and spending on infrastructure were the two most e#ective policy levers…
Most of the jobs created through the stimulus spending came from the reduction in personal income taxes and spending on infrastructure. The reduction in personal income tax created close to 750,000 jobs, most of which were created in the rural areas (Figure 3.4). Spending on infrastruc-ture created close to 300,000 jobs, which were roughly distributed between urban and rural areas. The reductions in corporate tax and VAT, along with subsidies, added roughly another 150,000 jobs.
It is important to note that from the simulations, those sectors that experi-ence a relatively large impact on production activities do not always experi-ence a higher employment impact, due to the capital-intensive nature of these sectors. For example, electricity, gas and water and transportation experienced notable increases in output, but the impact on employment was comparably low due to the fact that these sectors are more capital- rather than labour-oriented.

Figure 3.5 Duration of employment by type of infrastructure spending (average number of days)
51
50
49
48
47
46
45
44
Road and
bridge works
Water and
sanitation development
Irrigation and
water resource management
Source: Country Office for Indonesia and Timor-Leste, 2010.
61
In some cases the job has a set or limited duration – especially with regard to infrastructure (probably due to the fact that it is linked to a specific project). In the case of Indonesia, the jobs lasted on average 46-50 days (Figure 3.5).34 However, some job durations were extremely short: for road and bridge works the lowest duration of employment was less than one day. Likewise, for water development and sanitation, and irrigation and water resource management, the lowest duration of employment was six days, while public works jobs, such as those implemented through the PNPM, averaged only seven days.35
34 Allen (2010). 35 ibid; Papanek (2007).
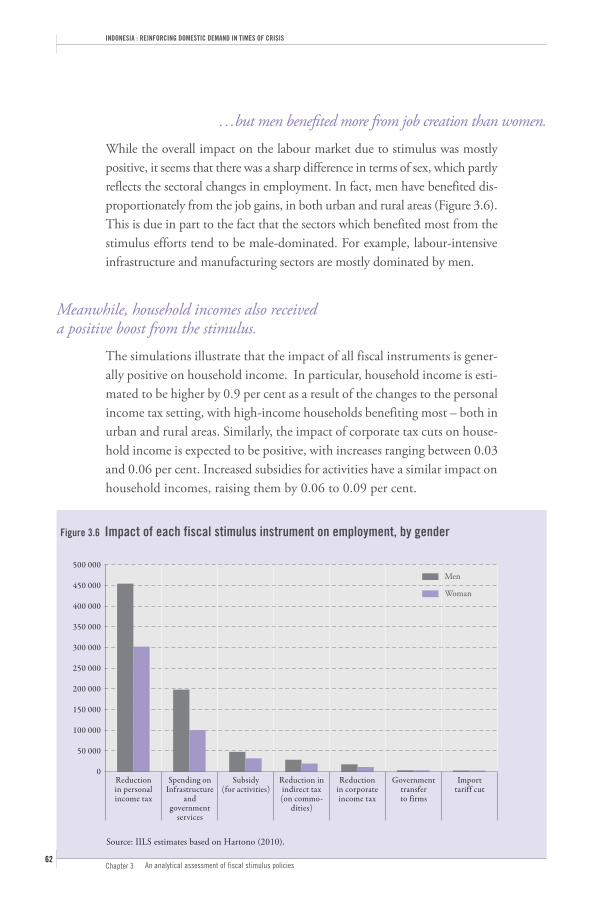
Figure 3.6 Impact of each fiscal stimulus instrument on employment, by gender
500 000
450 000
400 000
350 000
300 000
250 000
200 000
150 000
100 000
50 000
0Reduction in personal income tax
Spending on Infrastructure
and government
services
Subsidy (for activities)
Reduction in indirect tax (on commo-
dities)
Reduction in corporate income tax
Government transfer to firms
Import tariff cut
Source: IILS estimates based on Hartono (2010).
Men
Woman
Chapter 3 An analytical assessment of fiscal stimulus policies 62
INDONESIA : REINFORCING DOMESTIC DEMAND IN TIMES OF CRISIS
…but men bene"ted more from job creation than women. While the overall impact on the labour market due to stimulus was mostly positive, it seems that there was a sharp difference in terms of sex, which partly reflects the sectoral changes in employment. In fact, men have benefited dis-proportionately from the job gains, in both urban and rural areas (Figure 3.6). This is due in part to the fact that the sectors which benefited most from the stimulus efforts tend to be male-dominated. For example, labour-intensive infrastructure and manufacturing sectors are mostly dominated by men.
Meanwhile, household incomes also received a positive boost from the stimulus.
The simulations illustrate that the impact of all fiscal instruments is gener-ally positive on household income. In particular, household income is esti-mated to be higher by 0.9 per cent as a result of the changes to the personal income tax setting, with high-income households benefiting most – both in urban and rural areas. Similarly, the impact of corporate tax cuts on house-hold income is expected to be positive, with increases ranging between 0.03 and 0.06 per cent. Increased subsidies for activities have a similar impact on household incomes, raising them by 0.06 to 0.09 per cent.
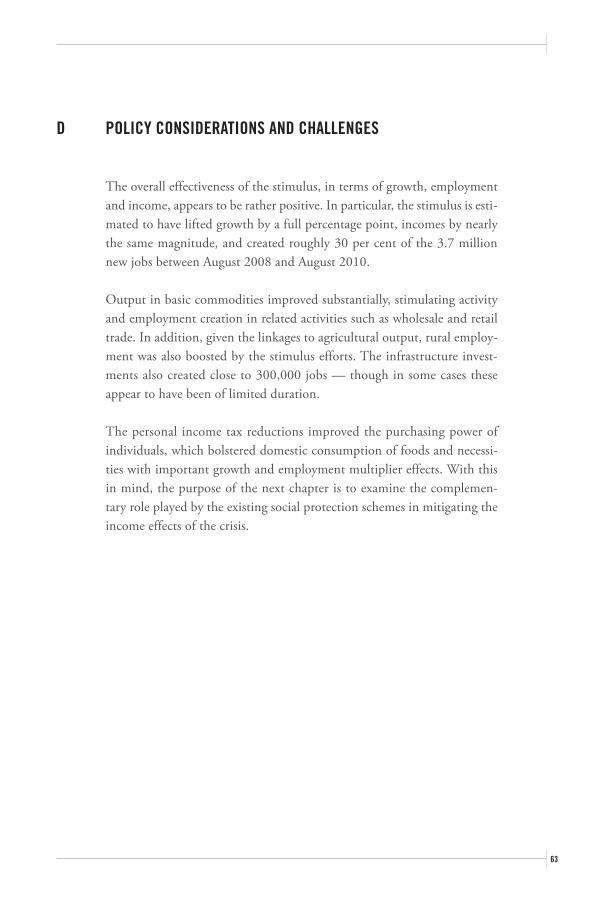
63
D POLICY CONSIDERATIONS AND CHALLENGES
The overall effectiveness of the stimulus, in terms of growth, employment and income, appears to be rather positive. In particular, the stimulus is esti-mated to have lifted growth by a full percentage point, incomes by nearly the same magnitude, and created roughly 30 per cent of the 3.7 million new jobs between August 2008 and August 2010.
Output in basic commodities improved substantially, stimulating activity and employment creation in related activities such as wholesale and retail trade. In addition, given the linkages to agricultural output, rural employ-ment was also boosted by the stimulus efforts. The infrastructure invest-ments also created close to 300,000 jobs — though in some cases these appear to have been of limited duration.
The personal income tax reductions improved the purchasing power of individuals, which bolstered domestic consumption of foods and necessi-ties with important growth and employment multiplier effects. With this in mind, the purpose of the next chapter is to examine the complemen-tary role played by the existing social protection schemes in mitigating the income effects of the crisis.

Table 3A.1 Basic set-up of Social Accounting Matrix (SAM)
Source: Hartono (2010).
TotalExogenousaccount
Production activitiesInstitutionsProduction
factors
y1
y2
y3
z
Z1
Z2
Z3
Z4
z’
T13
0
T33
T43
y’3
0
T22
T32
T42
y’2
0
T21
0
T41
y’1
Production factors
Institutions
Production activities
Endogenous accounts
Endogenous accounts
E X P E N D I T U R E
R E
C E
I P
T S
Exogenous accounts
Total
Chapter 3 An analytical assessment of fiscal stimulus policies 64
INDONESIA : REINFORCING DOMESTIC DEMAND IN TIMES OF CRISIS
APPENDIX A BASIC METHODOLOGY OF A SOCIAL ACCOUNTING MATRIX (SAM)
A INTRODUCTION TO SAM
SAM is a double-entry traditional economic accounting that takes the form of a partitioned matrix (or a block matrix). It records all economic transac-tions among agents, particularly those in the areas of production factors, institutions, and production activities.36 As a comprehensive data collec-tion system, SAM has many benefits. First, it summarizes all transaction activities in an economy within a period of time (usually a year) such that it provides a general overview of the socioeconomic structure and the income distribution of an economy. Second, it works as an important analytical tool because: (i) it shows the impact of an economic policy on household income and income distribution through the use of multipliers; and (ii) it is relatively simple to use and apply.
36 Pyatt and Round (1979); Sadoulet and de Janvry (1995); Hartono and Resosudarmo (1998).

65
As shown in Table 3A.1, SAM is a partitioned matrix with 4x4 dimensions. In general, accounts in SAM are grouped into endogenous and exogenous accounts. Endogenous accounts in SAM are the main accounts consist-ing of three blocks including production factors, institutions, and produc-tion activities. The row shows income and the column shows expenditure. Sub- matrix Tij shows the income of the account located in row i and column j. Vector yi shows the total income of the account in row I, and vector y’j shows the total expenditure of the account in column j. SAM requires that the vector yi is the same as vector y’j, which means that y’j is the transpose of yi for every i = j. The relationship found in Table 3A.1 can be written in a matrix form as follows:37
!1" y = Ay + x
where:
y is the vector of total income
x is the vector whose components are expressed by
Xm = n Zmn where Zmn Z
A is the matrix whose components are expressed by amn = tmn yn where tmn T ij and yn y’j
The accounting multiplier matrix within SAM captures the full impact of one sector’s change on other sectors of the economy, as well as the impact of any change in exogenous accounts on endogenous accounts. It is a mul-tiplier matrix both commonly and frequently used for an economic analy-sis. Furthermore, the accounting multiplier matrix is basically a standard form of the inverse matrix of (I – A), and it can be derived from the basic framework of SAM to be expressed as below:38
37 Defourny and Thorbecke (1984).38 ibid.

Chapter 3 An analytical assessment of fiscal stimulus policies 66
INDONESIA : REINFORCING DOMESTIC DEMAND IN TIMES OF CRISIS
!2" y = Ay + x y – Ay = x y= (I – A)-1x Y = Max
Here, Ma is a matrix that shows the overall impact of changes given to a particular sector and how such impact transmits to other sectors after going through the entire system in SAM. It is used to simulate the effect of a stimulus on household incomes and production activities.
In addition to the accounting multiplier matrix, the employment multiplier matrix can be useful in order to see the impact of a stimulus on labour. It is derived from the following equation:
!3" L = By where:
B is the diagonal matrix whose components represent the ratio between labour and output (employment-output share matrix)
L is the vector whose components reflect sectoral employment
If equations [1] and [2] are substituted into equation [3], equation [3] can also be written as:
!4" L = By L = B(Ay + x) L= B(I – A)-1x = L = BMax
where:
BMa is the employment multiplier matrix
The employment multiplier matrix or BMa is a matrix that shows the overall impact of changes in employment within and across production activities.
67
B. DYNAMIC SOCIAL ACCOUNTING MATRIX (DYSAM)
Dynamic SAM (DySAM) is a tool that has been developed based on the existing ‘static’ SAM for an economy by employing time-series national accounts data. DySAM gives a different accounting multiplier matrix for each time period and thus makes it possible to analyse and compare the economic performance in two or more periods. Furthermore, DySAM can be used to make: (i) counterfactual simulation analysis; and (ii) short-run policy simulations from the terminal year. Moreover, DySAM deals with the four main problems of a static SAM:
In short, the static SAM gives a snapshot of the economy while a dynamic SAM shows the consistent evolution of the economic structure over time. The dynamic SAM can be updated as new data are released or when a more current System of National Accounts (SNA) data become available. Complementary data sets, such as those included in the employment sat-ellite account, can be coupled with the dynamic SAM. Furthermore, the dynamic SAM may be used for a counterfactual simulation analysis for any year for which it is computed.
The DySAM for Indonesia includes nine years of data from 2000 to 2008. The model includes disaggregated information for the infrastructure sector, namely: labour-intensive road construction, capital-intensive road construc-tion, irrigation, and other construction. Also, it includes an employment satellite account to analyse the impact of exogenous injections on employ-ment.

Chapter 3 An analytical assessment of fiscal stimulus policies 68
INDONESIA : REINFORCING DOMESTIC DEMAND IN TIMES OF CRISIS
Meanwhile, overall, the DySAM consists of the following: 24 categories of commodities, 27 categories of production activities, 16 classifications of workers, a single classification of production factors of capital, 10 clas-sifications of household groups, two other institutions, namely the govern-ment and corporation, and four other accounts including capital account, indirect tax, subsidies, and foreign transaction accounts. Table 3A.2 shows the basic framework of DySAM. In general, this framework is divided into two parts, namely updating SAM and simulation. The four stages of work for updating SAM are as follows:
1. Update the macro and sectoral data so that it ranges from t0 (initial year) to tT (terminal year).
2. Prepare the SAM data to be used as a baseline static SAM (for the period t0).
3. Establish initial DySAM using information derived from macro and sectoral data, and information contained in the baseline static SAM.
4. Obtain a balanced SAM for the available time series (SAM period t0 to tT).
The following steps are then taken in conducting simulations using DySAM: (i) define the instrument by selecting the appropriate exogenous variables for the purpose of research; (ii) use the accounting multiplier matrix and exogenous variables that have been selected and apply equation [2] to see the economic impact of a policy on the economy, particularly with regard to factor incomes, household incomes, and on production activities; and (iii) apply equation [4] to see the policy’s economic impact on labour. In this study, five exogenous accounts are used to make the injections, which reflect the fiscal stimulus package announced by the Indonesian Government as outlined in Chapter 2. In particular, those accounts are capital account, indirect tax account, subsidy account, rest of the world account, and government expenditure account.

Macro Data
UpdateMacro Data
Static SAM Year to
UpdateSAM Data
Source: Hartono (2010)
Table 3A.2 Basic framework of DySAM
Initial DySAM(Unbalanced)
BalancingProcess
DySAM
Simulation UsingStatic SAM year t T
Impact to Production Activities
Impact to Housholds Income
Impact to Employment
69
Chapter 3 An analytical assessment of fiscal stimulus policies 70
INDONESIA : REINFORCING DOMESTIC DEMAND IN TIMES OF CRISIS
REFERENCES
Allen, E. Forthcoming. Recovery through increasing investments in social and economic assets: Infrastructure, job creation, and fiscal stimulus (Jakarta, ILO).
Barro, R. J.; Redlick, C. J. 2009. Macroeconomic effects from government purchases and taxes, NBER Working Paper No. 15369 (Cambridge, MA, National Bureau of Economic Research).
Blanchard, O; Perotti, R. 2002. “An empirical characterization of the dynamic effects of changes in government spending and taxes on output”, in The Quarterly Journal of Economics, Vol. 117, No. 4, pp. 1329–1368.
Brondolo, J. et al. 2008. Tax administration reform and fiscal adjustment: The case of Indonesia (2001–07), IMF Working Paper No. WP/08/129 (Washington, DC, IMF).
Cottarelli, C. 2010. From stimulus to consolidation: Revenue and expenditure policies in advanced and emerging economies, Fiscal Affairs Department (Washington, DC, IMF).
Defourny, J. ;Thorbecke, E., 1984. “Structural path analysis and multiplier decompo-sition within a social accounting matrix framework”, in Economic Journal, No. 94, pp. 111–136.
Gravelle, J. G. 2002a. Tax cuts and economic stimulus: How effective are the alternatives?, Congressional Research Service (Washington, DC, The Library of Congress).
—. 2002b. Using business tax cuts to stimulate the economy, Congressional Research Service (Washington, DC, The Library of Congress).
Hartono, D. 2010. A research study to assess the effectiveness of policies designed to mitigate the impact of the global financial crisis in Indonesia, Discussion Paper Series No. 208 (Geneva, IILS).
—.; Irawan, T.; Irawan, F. 2010. Infrastructure improvement and its impact on Indonesian economic performance (Bandung, Padjadjaran University).
—.; Resosudarmo, B. P. 1998. “Eksistensi matriks pengganda dan dekomposisi matriks pengganda Pyatt dan Round dari sistem neraca sosial ekonomi [Existence of the Multiplier Matrix and the Pyatt and Round Decomposition Matrix for a Social Accounting Matrix]”, in Ekonomi dan Keuangan Indonesia, Vol. 46, No. 4, pp. 473–496.

71
Hastuti et al. 2010. The role of social protection programs in reducing the impact of the glo-bal financial crisis 2008/2009, Research report (Jakarta, SMERU Research Institute).
International Institute for Labour Studies (IILS). 2010. World of Work Report 2010: From one crisis to the next? (Geneva, ILO).
International Labour Office (ILO). 2010. Global jobs pact country scan: Indonesia (Geneva).
Islam, I.; Chowdhury A. 2009. Growth, employment, and poverty reduction in Indonesia (Geneva, ILO).
Papanek, G. F. 2007. The Employment and Poverty Impact of PNPM (Program Nasional Pemberdayaan Masyarakat), Boston Institute for Developing Economies Ltd., World Bank.
Pyatt, G.; Round, J. 1979. “Accounting and fixed price multipliers in a social accounting matrix framework”, in Economic Journal, No. 89, pp. 850–873.
Sadoulet, E. ; de Janvry, A. 1995. Quantitative development policy analysis (Baltimore, Johns Hopkins University Press).
Romer, C. D.; Romer, D. H. 2010. “The macroeconomic effects of tax changes: Estimates based on a new measure of fiscal shocks”, in American Economic Review, Vol. 100, No. 3, Jun. pp. 763–801.
Simorangkir, I.; Adamanti, J. 2010. The role of fiscal stimuli and monetary easing in Indonesian economy during global financial crisis: Financial computable general equilibrium approach, paper presented at the EcoMod2010 conference, Istanbul, 7–10 Jul.


73
CHAPTER 4 SOCIAL PROTECTION MEASURES IN INDONESIA39
INTRODUCTION
Social protection programmes are important during times of crisis, as they not only address the needs of individuals and families but also act as auto-matic stabilizers, which can in turn help support aggregate demand. In the case of Indonesia, many new social protection programmes, including cash transfers, health insurance, and the new social security system were intro-duced in the aftermath of the 1997 Asian financial crisis. A number of these programmes were reinforced in the context of the 2006–2008 food crisis, and with the onset of the 2008 global financial crisis, the Government continued to provide much-needed support to these programmes. First, it announced additional subsidies on commodities and support to commu-nity empowerment programmes as part of the fiscal stimulus – amounting to 7 per cent of the total stimulus package (IDR 5.1 trillion). Second, it boosted its annual allocation for social assistance programmes by 35 per cent – in 2009, it was IDR 77.8 trillion, up from 57.7 trillion in 2008.
The purpose of this chapter is to examine social policies in Indonesia in the context of the global financial and economic crisis. In particular, sec-tion A provides an overview of social protection in Indonesia, including an international comparison. Section B examines in more detail key social protection measures and the role they played in mitigating the effects of the crisis and section C concludes with a number of policy lessons and considerations moving forward.
39 The authors would like to acknowledge the excellent research assistance of Yelena Reznikova.

Chapter 4 Social protection measures in Indonesia 74
INDONESIA : REINFORCING DOMESTIC DEMAND IN TIMES OF CRISIS
A SOCIAL PROTECTION IN INDONESIA
Spending on social protection is low compared to other Asian economies but has been on the rise in recent years…
Although the components of social protection differ across countries, it is generally defined as “guarantees against reduction or loss of income in cases of illness, old age, unemployment or other hardship, which can include any combination of private or public insurance schemes, social security, mutual benefit societies and community protections.”40 Indonesia’s social protection system is principally comprised of two main schemes – a public welfare system that is tax-financed (referred to as social assistance), and a contributory social insurance and mandatory savings system. The former provides social support to the poor in the form of cash transfer schemes, while the latter system is mainly for formal-sector employees and public-sector workers (consisting essentially of old-age pensions and health-care coverage).
Compared to other countries, Indonesia’s total social spending (including social protection, education, health and housing but excluding subsidies) is quite low, comprising roughly 1.9 per cent of GDP in 2008 (Figure 4.1, panel A). This is considerably less than other emerging Asian economies, e.g. China, India or Malaysia, where social spending represented 10, 9.3, and 9.4 per cent of GDP respectively. The bulk of this spending, however, is geared towards social protection or social assistance measures – roughly 1.3 per cent of GDP. This is more in line with some of its Asian neighbours, namely Thailand and Malaysia. Moreover, following the introduction of the new social security bill in 2004 (Undang-Undang Sistem Jaminan Sosial Nasional or Law on the National Social Security System), social protection spending steadily increased from below IDR 30 trillion (or 0.9 per cent of GDP) to over IDR 77 trillion (or 1.3 per cent of GDP) in 2009 (Figure 4.1, panel B).
40 ILO definition, see: http://www.socialsecurityextension.org/gimi/gess/ShowTheme.do?tid=1985.
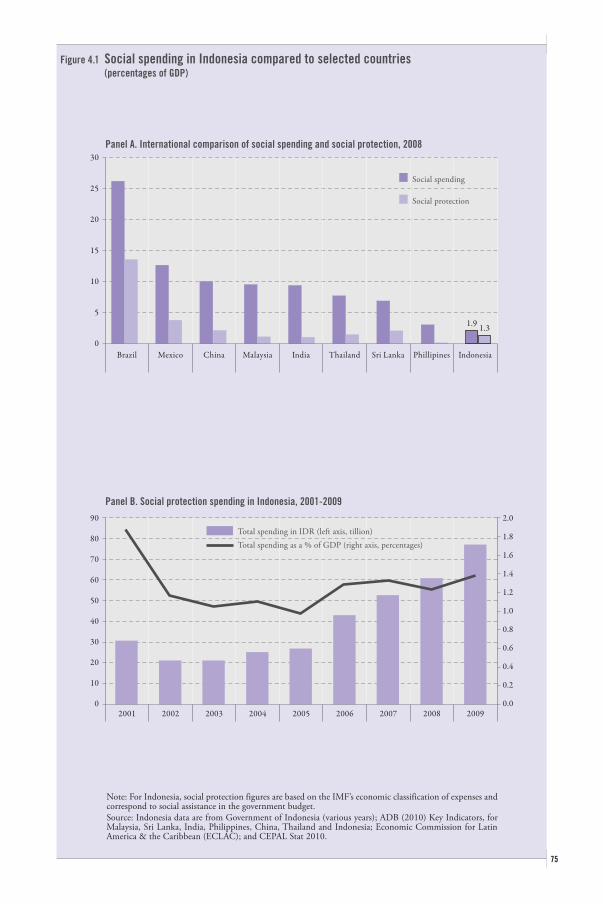
30
25
20
15
10
5
0Brazil Mexico China Malaysia India Thailand Sri Lanka Phillipines Indonesia
Figure 4.1 Social spending in Indonesia compared to selected countries (percentages of GDP)
Social spending
Social protection
1.9 1.3
2001 2002 2003 2004 2005 2006 2007 2008 2009
90
80
70
60
50
40
30
20
10
0
2.0
1.8
1.6
1.4
1.2
1.0
0.8
0.6
0.4
0.2
0.0
Note: For Indonesia, social protection figures are based on the IMF’s economic classification of expenses and correspond to social assistance in the government budget. Source: Indonesia data are from Government of Indonesia (various years); ADB (2010) Key Indicators, for Malaysia, Sri Lanka, India, Philippines, China, Thailand and Indonesia; Economic Commission for Latin America & the Caribbean (ECLAC); and CEPAL Stat 2010.
Total spending as a % of GDP (right axis, percentages)Total spending in IDR (left axis, tillion)
Panel A. International comparison of social spending and social protection, 2008
Panel B. Social protection spending in Indonesia, 2001-2009
75
Chapter 4 Social protection measures in Indonesia 76
INDONESIA : REINFORCING DOMESTIC DEMAND IN TIMES OF CRISIS
…with a vast array of social assistance programmes in place – many of which were introduced in the past decade…
In total, some 33 social assistance programmes existed in 2009.41 The vast array of programmes is intended to address different needs and challenges facing individuals and communities, including education, hunger, pov-erty and rural development. The foundation for the existing range of pro-grammes is partly a function of the reform efforts undertaken following the 1997 Asian crisis (Box 4.1).
… as well as a range of subsidy programmes.Subsidies for goods are also an important lever with which Indonesia pro-vides support to households. Although there is considerable debate regard-ing their efficiency (especially regarding energy-related subsidies), the Government currently offers subsidies on oil, electricity, food (the Raskin rice programme), fertilizer, seed, credit, soybean, and cooking oil, to name a few.42 In fact, in 2008 energy and non-energy subsidies amounted to IDR 281 trillion, roughly 6 per cent of GDP or 40 per cent of total government spending.43 However, with the fall in global fuel prices in 2009, Indonesia actually lowered the fuel subsidy in favour of expanding food subsidies. As a result, total spending on subsidies declined in 2009 to IDR 166 trillion or 3.1 per cent of GDP but still represents a sizeable amount of govern-ment expenditures.
41 ADB, Ministry of Finance (2010).42 According to Annabelle (2010), energy subsidies (e.g. oil subsidy) have the negative effects of pressuring the public budget and helping mostly wealthy households as opposed to poor households.43 Subsidies amounted to some 40 per cent of government total spending in 2008 (6.0 per cent of GDP) and 22 per cent in 2009 (3.1 per cent of GDP) (Government of Indonesia, Ministry of Finance, Budget Statistics 2008–2009).
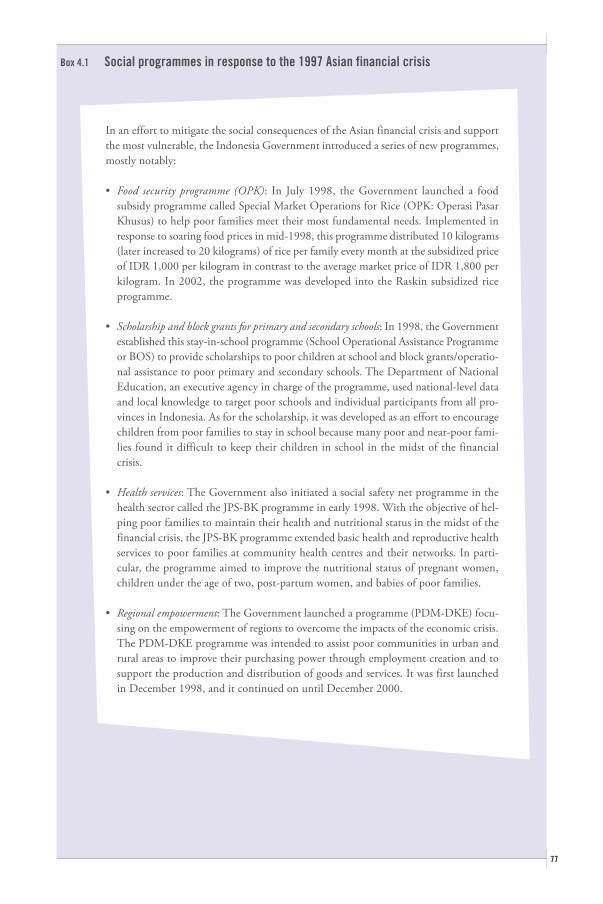
Box 4.1 Social programmes in response to the 1997 Asian financial crisis
In an effort to mitigate the social consequences of the Asian financial crisis and support the most vulnerable, the Indonesia Government introduced a series of new programmes, mostly notably:
Food security programme (OPK): In July 1998, the Government launched a food subsidy programme called Special Market Operations for Rice (OPK: Operasi Pasar Khusus) to help poor families meet their most fundamental needs. Implemented in response to soaring food prices in mid-1998, this programme distributed 10 kilograms (later increased to 20 kilograms) of rice per family every month at the subsidized price of IDR 1,000 per kilogram in contrast to the average market price of IDR 1,800 per kilogram. In 2002, the programme was developed into the Raskin subsidized rice programme.
Scholarship and block grants for primary and secondary schools: In 1998, the Government established this stay-in-school programme (School Operational Assistance Programme or BOS) to provide scholarships to poor children at school and block grants/operatio-nal assistance to poor primary and secondary schools. The Department of National Education, an executive agency in charge of the programme, used national-level data and local knowledge to target poor schools and individual participants from all pro-vinces in Indonesia. As for the scholarship, it was developed as an effort to encourage children from poor families to stay in school because many poor and near-poor fami-lies found it difficult to keep their children in school in the midst of the financial crisis.
Health services: The Government also initiated a social safety net programme in the health sector called the JPS-BK programme in early 1998. With the objective of hel-ping poor families to maintain their health and nutritional status in the midst of the financial crisis, the JPS-BK programme extended basic health and reproductive health services to poor families at community health centres and their networks. In parti-cular, the programme aimed to improve the nutritional status of pregnant women, children under the age of two, post-partum women, and babies of poor families.
Regional empowerment: The Government launched a programme (PDM-DKE) focu-sing on the empowerment of regions to overcome the impacts of the economic crisis. The PDM-DKE programme was intended to assist poor communities in urban and rural areas to improve their purchasing power through employment creation and to support the production and distribution of goods and services. It was first launched in December 1998, and it continued on until December 2000.
77

Education
Direct cash transfers (BLT)
Social programmesHealth insurance for the poor (HIP)/Public health insuranceCommunity empowerment in rural areas (PNPM rural)Urban poverty reduction programme(PNPM urban)Family Hope Programme (PKH)Others
Total
Table 4.1 Government expenditure on social assistance (IDR trillion)
Source: Government of Indonesia, Ministry of Finance (2010).
Percentage change from 2008 to 2009
20092008
55.5
60.8
-8.612.866.7
100.010.0-64.7
34.7
54.5
6.2
17.05.36.01.61.13.0
77.8
35.1
3.9
18.64.73.60.81.08.5
57.7
Chapter 4 Social protection measures in Indonesia 78
INDONESIA : REINFORCING DOMESTIC DEMAND IN TIMES OF CRISIS
B RESPONDING TO THE CRISIS: SUPPORTING INCOME AND CONSUMPTION
E#orts to support low-income households focused onadditional allocations to existing programmes…
As part of the stimulus efforts, 7 per cent of the package was targeted directly to low-income households – the major portion went towards sub-sidies (nearly IDR 4.5 of the IDR 5.1 trillion). The remainder – IDR 0.6 trillion – was allocated to the National Community Empowerment Programme (see also Box 4.2 below). The amount was in line with efforts undertaken in other emerging economies (see Chapter 2). However, the bulk of Indonesia’s efforts to support and boost the consumption of low-income households was channelled through increases in government expen-ditures on existing programmes. In fact, in 2009 spending on the existing range of programmes – through the regular budget process – increased by more than 34 per cent or IDR 20 trillion (Table 4.1 and Box 4.2).
…and in some cases programmes were reinstated and extended temporarily.In some instances – as was the case with the unconditional cash trans-fer programme (BLT) – previously existing programmes were temporarily

Box 4.2 Indonesia: Programmes to support low-income households
Source: Government of Indonesia, Ministry of Finance (2010).
Budget allocation Targeted beneficiaries, 2009
Description Year initiated
Programme
Total budget in2008: IDR 3.9 trillion2009: IDR 6.2 trillion
2009: IDR 1.1 trillion
Total budget:2008: IDR 12.5 trillion2009: IDR 19.1 trillion
Total budget:2008: IDR 3.6 trillion2009: IDR 6.0 trillion(Additional stimulus of 0.6 IDR trillion)
Total budget:2008: IDR 11.9 trillion2009: IDR 12.9 trillion
Total budget:2008: IDR 4.7 trillion2009: IDR 5.3 trillion
18.5 million households covered
CCT is pilot tested among 720,000 families in 13 provinces
Virtually all elementary schools nationwide targeted under the programme
Community -based investments
Provides 3.3 million tons of rice to 18.5 million poor households., distributed monthly
Targeting 74.5 million persons nationwide
UCT provides income support of IDR 100,000 per month to recipient poor families
CCT provides income support with attached conditions related to children’s attendance at primary school, regular check-ups of children under the age of 5 years, and pregnant mothers at the health clinic
Provides block grants to cover opera-tional costs and capital expenditures. Scholarships are provided to school students under the programme
Provides block grants to communities for community-based development projects, health programmes, and others
Provides subsidized low-quality rice to poor families
Provides payment of social health insurance premiums for poor families
2005
2007
1998
2007
2002 (continuation of OPK from 1998)
2008(continuation of Askeskin launched in 2005)
Unconditional cash transfer (UCT) or the BLT
Conditional cash transfer programme (CCT) or the PKH
School Operational Assistance Programme(BOS)
National Community Empowerment Programme(PNPM)
Rice subsidyProgramme(Raskin)
People’s health insurance (Jamkesmas)
79
reactivated. The programme – which had been discontinued in 2006 due to favourable economic conditions – was revived in 2008 as part of measures to address the food crisis.44 The BLT provides short-term income assistance and is targeted to the poorest 30 per cent of households (by consump-tion) or roughly 18.5 million households. The programme provides IDR 100,000 (US$11) per month. With the onset of the financial and economic crisis, the programme was extended for an additional two months – and allocated an extra IDR 2.3 trillion.
44 The programme ran from 2005 to 2006. When economic conditions improved in 2006, it was discon-tinued.
Chapter 4 Social protection measures in Indonesia 80
INDONESIA : REINFORCING DOMESTIC DEMAND IN TIMES OF CRISIS
In 2007, Indonesia also piloted a conditional cash transfer programme which was expanded twice during the "nancial crisis…
Another social assistance programme in Indonesia is the conditional cash transfer programme (PKH). This programme, which started in 2007, was still in pilot testing when the current crisis hit. It provides financial support to pregnant women or families with children up to the age of 15. A cash transfer of between IDR 0.6 million (US$60) to 2.2 million (US$220) per year, depending on the family size and composition, is provided based on the guarantee that the children fulfil 12 minimum health-care and educa-tion requirements. The programme has already proved to be successful in enabling targeted groups of households to improve their quality of life through investment in their human capital. The number of households covered increased from 392,813 in 2007 to 498,095 in 2009 (although well short of the initial target of 4 million in 2009). It was expected to cost the Government IDR 1.1 trillion in 2009. It was still in pilot testing throughout the duration of the crisis, but having met widespread success, was expanded to cover 580,000 poor households in 2008, and again in 2009 to cover 720,000 households.
The impact of PKH on the poor (usually farm labourers) was generally positive during the financial crisis.45 The beneficiaries used the funds for children’s school and health needs, food purchases and other basic neces-sities. Moreover, since only adult females of the family can receive the payment, it has the added benefit of targeting a particularly vulnerable group. However, several case studies revealed that there were significant issues involving implementation, particularly with regards to selection and unsystematic payment schemes. Nevertheless, since the programme is still in its infancy, further adjustments prior to the start-up could address many of these concerns. Since the number of recipients is very small, it follows that the overall impact of the programme on the community is small as well, but results have been encouraging, with increases in immunization rates and school enrolment, as compared to control groups.46
45 ibid.46 Handayani and Burkley (2009).

2007 2008 2009
0.20
0.18
0.16
0.14
0.12
0.10
0.08
0.06
0.04
0.02
0.00
7 000
6 000
5 000
4 000
3 000
2 000
1 000
0
Figure 4.2 National Programme for Community Empowerment (PNPM): Budget and coverage, 2007–2009
Source: Hastuti et al (2010).
Budget as a percentage of GDP (left axis)
Districts (right axis)
81
… while existing rural programmes assisted poor communities…The National Programme for Community Empowerment (PNPM) or the Mandiri Perdesaan47 is a collection of community development programmes that serve as the primary instrument for poverty reduction in Indonesia. The PNPM is composed of the core element known as the PNPM-Inti48 and a support element known as PNPM-Penguatan.49 Programmes under the PNPM umbrella serve to generate local employment opportunities and give out grants for infrastructure, social or economic activities. The most substantive components of the PNPM are rural development infrastructure projects and grants that are used to fund women’s groups, crisis-response preparation, and various pilot programmes, among others.50 Over the past few years, the Government increased coverage in sub-districts, starting at under 3,000 in 2007 and doubling to over 6,000 in 2010 (Figure 4.2). The budget has also increased significantly from IDR 4.2 trillion in 2008 to 7.6 trillion in 2009.
47 This programme is an offspring of the community-based development programme in rural areas (Kecamatan Development Programme) and in urban areas (Urban Poverty Project), which started during the 1997 Asian financial crisis. 48 Incorporating the Regional Community Empowerment Programme (PPK for rural areas, P2KP for urban areas); Rural Infrastructure Development Programme (PPIP); Programme for Regional Infrastructure for Social and Economic Development (PISEW); and the Development Acceleration Programme for Disadvantaged and Special Regions (P2DTK). 49 PNPM-Penguatuan is a community empowerment programme with specific poverty-reduction objectives. These include the Healthy and Intelligent Generation (Generasi), Green (Hijau), Development for Rural Agribusiness (PUAP), Community-based Sanitation and Water Supply (Pamsimas) and Financial Assistance for Agriculture (BLM-KIP)50 The World Bank project “Third National Program for Community Empowerment in Rural Areas (PNPM-Rural areas)”; see http://web.worldbank.org/external/projects/main?Projectid=P115052&theSitePK=40941&piPK=64290415&pagePK=64283627&menuPK=64282134&Type=Overview

Chapter 4 Social protection measures in Indonesia 82
INDONESIA : REINFORCING DOMESTIC DEMAND IN TIMES OF CRISIS
… and have been successful in creating employment opportunities…PNPM’s projects are rather successful in generating employment opportuni-ties. The number of “person-days” required on any community project can range anywhere from 10 to 900, based on the level of community involve-ment. Also, because they involve local hires and suppliers of construction materials they create important forwards and backwards multiplier effects in the local economy.51 Additionally, in spite of their temporary nature, the projects are successful in stimulating future economic development through improvement in the quality of local physical infrastructure (roads, bridges, marketplace, health and education facilities and water supply), decreased transport time and improved productivity, as well as accessibility to health services and clean water.52
The programme has however suffered from lack of funding, and in some cases, programmes remain incomplete. For instance, within the infrastruc-ture development projects of the PNPM, nearly 30 per cent of activities are not completed within the same year of the budget or not completed during the past years in some communities.53 These delays are mainly linked to the long bureaucratic process for proposals, the selection of projects, dis-bursements of funds and supply of raw materials. Nor is the programme well-targeted, as many workers who benefit from it are not necessarily from poor households.54
…while rice subsidies, despite su#ering from ine$ciencies, have proved important during the crisis.
Raskin is given to the poorest two categories of households in order to reduce the burden of food expenditures, notably as regards rice. Under this programme the Government provides poor households with 10 kilograms of rice at a reduced price (IDR 1,000 per kilogram vs. the full market price of IDR 2,500). During the crisis, Raskin received additional budget-ary allocations, i.e. the quantity of rice allotted was expanded temporarily in 2008 to 15 kilograms per month (reduced to 13 kilograms in 2010).
51 Hastuti et al, (2010). 52 ibid. 53 ibid.54 A similar problem occurs with the Women’s Savings and Loans (SPP), which despite having significantly positive impacts on household assets and welfare, have benefited many women who were not necessarily poor.

Poor households (in millions)Target households (in millions)Recipient households (in millions)Rice ceiling (in millions of tons)Budget (IDR trillions)
Table 4.2 The Raskin Programme: Numbers of households, rice ceilings and budgets, 2005–2009
Sources: Hastuti et al, 2010
20092008200720062005
18.518.5
3.313.0
19.119.119.13.3
11.7
19.115.816.71.76.5
15.510.813.91.65.3
15.88.3
11.12.05.0
83
Consequently, the programme budget, which was IDR 5 trillion in 2005, more than doubled to 13 trillion in 2009 (Table 4.2). The largest increase in funding came about in 2008, when an additional 5.2 trillion rupiah was allotted to the budget over the previous year to account for the increase in the quantity of rice given to each family. In spite of a relatively con-stant disbursement of rice in 2009, the budget was further increased by an additional 1.3 trillion rupiah to reach the 13 trillion mark, reflecting a marginal increase in the price of rice.55 In terms of coverage, the programme benefited some 8.3 million households in 2005 and reached 18.5 million in 2009, an increase of more than double.
The programme has had positive effects on reducing the cost of living, especially during food shortages or price hikes. However, there are problems related to rice allocations, since many non-poor households also benefit from the scheme, representing a large deadweight loss. A common issue is that of biased allocation at the local level. For example, the aggregate number of the poor in a particular province is defined by the Central Bureau of Statistics, but the details of those eligible for the programme are determined by the district or municipal government. As such, rice is often distributed regardless of income level.56 Moreover, studies show that the programme is very poorly advertised, with many of the targeted beneficiaries completely unaware of the allocation schedule or that the programme even exists.57
55 The amount of rice distributed actually decreased between 2008 and 2009, from 3,342,500 tons to 3,329,514 tons, respectively (Hastuti et al, 2010).56 Hastuti et al. (2010).57 ibid.

Chapter 4 Social protection measures in Indonesia 84
INDONESIA : REINFORCING DOMESTIC DEMAND IN TIMES OF CRISIS
C POLICY CONSIDERATIONS AND CHALLENGES
In the decade preceding the 2008 financial crisis, Indonesia made concerted efforts to reinforce its social protection system. A number of social assistance programmes were put in place in 1998 following the Asian financial crisis – many of which have served as the basis for existing programmes. More recently, in 2007 and 2008, some previous programmes were reactivated and new programmes were introduced, including a pilot project on conditional cash transfers. Indonesia thus entered this crisis on much better footing with respect to its ability to counter the social impacts of an external shock.
The emphasis of Indonesia’s social response to the crisis was centred on channelling additional support to its existing array of programmes through the normal budgetary process. In fact, in 2009 more than IDR 77 trillion was spent on social assistance programmes. This represented an increase of more than 34 per cent over 2008. In addition, some additional resources (IDR 5.1 trillion) were allocated to support low-income households in the form of subsidies and rural development within the National Programme for Community Empowerment (PNPM).
Early indications are that the support and relevant programmes were suc-cessful in helping to mitigate the effects of the crisis. At the aggregate level, poverty in Indonesia has continued to decline throughout the crisis, a trend that has been continuing more or less since 1998. In addition, the pilot programme on conditional cash transfers (PKH) has proven to be quite successful even though it is in the early stages of development: beneficiar-ies used the funds for school and health needs, food purchases and other basic necessities.
There were nevertheless a number of issues with respect to the efficiency and coverage of a number of programmes. In this respect, moving forward the Government can do more to improve the overall delivery of social assist-ance. These issues will be taken up in more detail in Chapter 5.

85
REFERENCES
Annabelle, M. 2010. Phasing out energy subsidies in Indonesia, OECD Economics Department Working Papers, No. 808 (Paris, OECD). Available at: http://www.oecd.org/dataoecd/59/54/46273660.pdf.
Arif, S. et al. 2010. Gendered risks, poverty and vulnerability: Case study of the Raskin food subsidy programme in Indonesia, Gendered Risks and Social Protection Series (Jakarta, SMERU Research Institute and London, Overseas Development Institute (ODI)).
Asian Development Bank (ADB). 2010. Key indicators for Asia and the Pacific 2010 (Manila).
—. 2009. Proposed loan Republic of Indonesia: Countercyclical support, Report and Recommendations of the President to the Board of Directors (Manila).
—. 2007. “Preparatory studies on national social security system in Indonesia”, in Assessment of Fiscal Cost of Social-Security-Related Programs in Indonesia (Manila).
Febriany, V. 2010. 1. Institutional setting of poverty reduction/social protection programmes in Indonesia; 2. Insititutional issues in CCT program, Powerpoint presentation (Jakarta, SMERU Research Institute), available at www.smeru.or.id.
Government of Indonesia. 2011. Budget Statistics 2005–2011, Ministry of Finance. Available at: http://www.anggaran.depkeu.go.id/Content/10-08-18,%20Data%20Pokok%20RAPBN%202011_Inggris_rev1.pdf
—. 2010. Anggaran Belanja Pemerintah Pusat 2010 [Government Budget 2010], Ministry of Finance Available at: http://www.fiskal.depkeu.go.id/webbkf/apbn/default.asp?x=IAccLap0..
—. 2009. Budget Statistics 2005–2009, Ministry of Finance, Available at: http://www.bi.go.id/NR/rdonlyres/273199E5-AAB0-41E7-930D-8ABA90D8ACD8/15407/DataPokokAPBN08dan09Eng.pdf.
Handayani, Sri W.; Burkley, C. (eds). 2009. Social assistance and conditional cash trans-fers: The Proceedings of the Regional Workshop, July 2009 (Manila, ADB).
Hastuti et al. 2010. The role of social protection programmes in reducing the impact of the global financial crisis 2008/2009. Research report (Jakarta, SMERU Research Institute).
International Labour Organization (ILO). 2010a. Global Jobs Pact country scan: Indonesia (Geneva).

Chapter 4 Social protection measures in Indonesia 86
INDONESIA : REINFORCING DOMESTIC DEMAND IN TIMES OF CRISIS
—. 2010b. Social security for informal economy workers in Indonesia: Looking for flexible and highly targeted programmes (Jakarta).
—. 2006. Indonesia: Conditional cash transfer to the poor, Social Security Extension Initiatives in South-East Asia Series (Bangkok).
International Monetary Fund (IMF). 2010. Indonesia: 2010 article IV consultation–staff report; Staff statement; Public information notice on the executive board discussion; and Statement by the executive director for Indonesia, IMF Country Report No. 10/284 (Washington, DC).
World Bank. 2010. Indonesia jobs report: Towards better jobs and security for all (Washington, DC).
87
CHAPTER 5 POST-CRISIS POLICY CHALLENGES
INTRODUCTION
Looking ahead, the economic outlook for Indonesia is forecast to remain rather robust. GDP growth is expected to be more than 6 per cent in 2010 and 2011, which is in line with pre-crisis growth rates. This comes on the heels – as the previous chapters have illustrated – of a relatively strong per-formance during the global financial and economic crisis. In fact, during 2008 and 2009 growth only slowed to 4 per cent per annum and the labour market performed exceptionally well. In particular, in spite of a moderate (albeit temporary) increase in informal employment, unemployment rates continued to decline during the past 3 years.
The first part of this chapter (section A) will provide a brief overview of the key features of the Indonesian case that help explain this success. The remainder of this chapter will explore a number of challenges that have emerged from the crisis as well as examining several longstanding issues. In particular, section B will examine the importance of addressing a number of gaps in the existing social protection system. Section C will take a closer look at labour market developments and challenges facing youth. Finally, section D will discuss how macroeconomic policies can better support employment and social objectives.
Chapter 5 Post-crisis policy challenges 88
INDONESIA : REINFORCING DOMESTIC DEMAND IN TIMES OF CRISIS
A LESSONS LEARNED: THE IMPORTANCE OF INITIAL CONDITIONS
Indonesia’s success in handling and mitigating the crisis stems from a series of factors. Importantly, in a number of critical areas, following the Asian crisis of 1997, Indonesia positioned themselves well to address future exter-nal shocks. In this respect, their pre-crisis experience and starting condi-tions were an important factor. In addition, while fiscal rescue efforts were limited in comparison to other G20 and emerging economies, they focused on measures that (i) could be implemented quickly and thus have an imme-diate effect and (ii) focused on stimulating domestic demand in areas with high-employment multipliers. On the demand side, the Government also provided support to enterprises to ensure their continued viability through-out the crisis.
Indonesia was able to draw on a range of social protection measures that were introduced in the wake of the 1997 crisis…
Leading up to the Asian financial crisis of 1997, economic growth in Indonesia was rather robust averaging between 7 and 9 per cent for much of the 1990s. However, the crisis hit the Indonesian economy hard in 1997: GDP growth first fell into negative territory in the fourth quarter of 1997 and the decline accelerated through 2008 (falling by nearly 18 per cent in the fourth quarter of 2008). As a result, informal employment rose dramati-cally and earlier reductions in poverty were erased. In an effort to mitigate the social consequences of the crisis and support the most vulnerable, the Government – as outlined in Chapter 4 introduced a series of new pro-grammes notably: (i) food security programme; (ii) scholarship and block grants for primary and secondary schools; (iii) health services; (iv) regional empowerment; and (v) cash transfers.

89
..,and e#orts to stabilize the "nancial system in the past decade limited the contagion e#ects.
Indonesia was little affected by the turmoil in international financial mar-kets stemming from the fall of Lehman Brothers. In fact, according to the joint IMF–World Bank Financial Sector Assessment Program (FSAP), in 2010 the banking sector in Indonesia – representing 80 per cent of the overall financial sector assets – is in relatively healthy shape (IMF 2010a). Much of the success lies in the country’s financial sector reforms that took place in the aftermath of the Asian financial crisis
Restructuring of the banking system: Following the Asian financial crisis in 1997, Indonesia immediately tackled the problem of bank insolvency by restructuring its banking system. First, the Government closed 16 financially distressed banks in November 1997. In February 1998, the Government established the Indonesian Bank Restructuring Agency (IBRA) and its asset management unit (AMU) as an agency authorized to restructure banks through mergers, acquisitions, and, if necessary, liq-uidation. As a result, 54 banks (36.4 per cent of banking sector) had been brought under the control of IBRA by the end of 1998 as part of its efforts to restructure those banking institutions where more than 200 per cent of the bank’s capital was borrowed from the Bank of Indonesia (BI).58 Between 1997 and 2007, the total number of banks was reduced from 237 to 130: state-owned banks from 7 to 5, domestic private banks from 160 to 71, foreign and joint venture banks from 43 to 28.
Strengthening legal and regulatory framework: A number of measures were adopted over the last decade to strengthen governance and prudential supervision for the banking system with a view to bringing regulatory standards in line with the international standards including the Basel Core Principles. These measures included enforcement of prudential regulations by making the BI more independent, more frequent onsite inspections of commercial banks, and mandatory action by the BI for failure to comply with regulations.
58 Pangestu (2003).

Chapter 5 Post-crisis policy challenges 90
INDONESIA : REINFORCING DOMESTIC DEMAND IN TIMES OF CRISIS
Improving capital and liquidity levels to restore the lending capacity in the banking system: In contrast to its sharp decline in the aftermath of the 1997 Asian crisis, Indonesia’s annual loan growth has averaged 21 per cent since 2003.59 During this time, banks reduced their holdings of gov-ernment securities, including so-called “recap government bonds” to free up liquidity for lending. The additional liquidity was channelled increas-ingly to SMEs and retail sectors. The result has been a diversification of credit risk and improved earnings capacity among Indonesian banks.
!is was complemented by new measures to reinforce domestic demand.In light of the financial reforms, Indonesia was affected principally through the trade channel. However, at the onset of the crisis exports accounted for less than one-fifth of GDP and thus domestic consumption lay at the heart of growth in the country. As such, stimulus efforts – principally income tax cuts – were designed to stimulate domestic demand to counter the effects of declining exports. In fact, the tax cuts boosted consumption of basic goods – sectors which are characteristically labour-intensive. These tax cuts were complemented by employment-intensive infrastructure-related investments. Both measures were in effect with little delay, which aided in their ability to mitigate the effects of the crisis in short order. The Government also introduced measures in the form of corporate tax reduc-tions to retain business competitiveness, most importantly to help small enterprises remain viable in the face of stiff competition in the region. For example, small enterprises, i.e. corporate taxpayers with an annual turnover of not more than IDR 50 billion, are entitled to a tax discount of 50 per cent off the standard rate. Furthermore, incentives were put in place for firms to list publicly in an attempt to help medium-sized enterprises gain access to direct finance.
Despite the relative success in addressing the challenges related to the cur-rent crisis, a number of challenges remain. The purpose of the following sections is to highlight some of these issues, with a few suggestions for potential ways forward.
59 IMF (2010a).
91
B REINFORCING SOCIAL PROTECTION: REDUCING INFORMALITY AND INCOME INEQUALITY
As discussed previously, Indonesia relied principally on a range of pre-exist-ing social assistance programmes to provide support to the most vulnerable. Yet many of these programmes suffer from a number of inadequacies and inefficiencies and overall coverage is still low by most standards. Indeed, informal employment is persistently high – indeed, some 65 million work-ers are in informal employment, the vast majority of whom receive no form of social protection coverage whatsoever (including, pension, old-age security or health insurance). The country is also without an unemploy-ment insurance scheme to help those workers who lose their job. Instead, the unemployed tend to rely on family support or unpredictable severance payments and thus often turn to informal employment, as was the case during the current crisis. Building upon the current system, a number of potential reform options exist to address these challenges.
Improve the targeting of social assistance programmes by rationalizing existing schemes…
One of the major concerns regarding the array of social assistance pro-grammes in Indonesia is their lack of efficacy with respect to delivery and execution. In a number of cases, the target is generally not met by these programmes in terms of reaching vulnerable groups such as poor house-holds and communities. In addition, many non-poor households are able to benefit from such schemes, such that the resources that reach the poor households are reduced:
-teria for qualification in the programme prevented 47 per cent of the targeted beneficiaries from receiving their proper benefits. One particular issue is that the aggregate number of the poor in a particular province is defined by the Central Bureau of Statistics, but the details of those

Chapter 5 Post-crisis policy challenges 92
INDONESIA : REINFORCING DOMESTIC DEMAND IN TIMES OF CRISIS
eligible for the programme are determined by the district or munici-pal government. In some instances, subsidized rice is sold to individuals without regard to the selection criteria. Consequently, given the limited supplies, poor households are at times excluded from the rice distribu-tion. As a way forward, improved guidelines for determining eligibil-ity along with stricter compliance with the regulations are necessary to reduce deadweight loss and improve distribution channels.
poor households from the rural areas were targeted but in most cases major infrastructure construction and upgrading were carried out by con-tractors or by workers from outside the community.60 Thus, a require-ment that projects should employ a certain percentage of local labour, along with stricter enforcement, would help address this issue.
At the macro level, one way to avoid such problems related to targeting and efficiency is to adopt a more universal approach to policies for social assistance or employment guarantees. Programmes can be set up in such a way as to discourage the non-poor from taking advantage of services, and quotas can be set aside for local hires and vulnerable groups, such as women and youth – as is the cases for India’s Rural Employment Guarantee Scheme (see Box 5.1). In this regard, the Government of Indonesia has already made considerable progress in legislating the Law on the National Social Security System (Undang-Undang Sistem Jaminan Sosial Nasional or SJSN, Law No. 40/2004), which aims at providing universal social pro-tection coverage.61
The SJSN provides a basic framework for the development of universal social security and social assistance by stating that it is mandatory for employers to enrol their employees into the social security schemes and that the Government will subsidize the contributions concerning social assist-ance for the poor and the economically disabled. As a result, an estimated 400,000 informal-sector workers are already covered under the Jamsostek, the social security system.62 However, compliance with the SJSN is still
60 ibid.61 Social security is defined in the Law as “an institutional scheme to ensure that all citizens are able to provide for their minimum basic needs of life” (Chapter 1, Article 1, Para. 11).62 ILO (2010a).

Box 5.1 India: Targeting in the Rural Employment Guarantee Scheme
The Indian Government established the Mahatma Gandhi National Rural Employment Guarantee Scheme (MGNREGS) (formerly known as the Rural Employment Guarantee Scheme) in February of 2006, for the purpose of providing income security to the rural poor. The Act guarantees at least one hundred days of paid employment, through rural infrastructure projects, to one adult member of every household each year. With a dual focus on labour intensiveness and sustainable development, projects include water pre-servation, road-building, and other types of construction. Some 45 million households participate in the scheme and workers are paid the equivalent of the minimum wages for the particular region or about IDR 60 (US$1.33) per day.
The programme contributes towards the alleviation of rural poverty, as earned income from this programme can account for up to 40 per cent of total household income among poor families.63 Additionally, there are spillover effects as the programme helps to increase the prevailing agricultural wage by improving productivity through infrastruc-ture enhancements, and by raising individuals’ reservation wages through the provision of an alternative guaranteed employment option.64 Much of its success can be attributed to the programme design, which limits many of the targeting issues that often plague similarly targeted programmes:
receipt of benefits (assuming that wealthier individuals would be less inclined to volunteer for manual labour projects).
out of necessity, and not as a way to avoid looking for or finding work. -
ticipants. Evaluations have shown that in fact nearly half of programme participants are women.65
There are a few structural difficulties with the programme, mainly due to geographi-cal constraints, cumbersome registration procedures, physical requirements for manual labour participation, and low allowances for meals and commutes.66 Building on these lessons and challenges, the programme in India could serve as a model for poverty alle-viation in Indonesia – even unemployment – through infrastructure development and public works programmes.
93
63 ODI (2006). 64 Shah (2010). 65 National Rural Employment Guarantee Act, available at http://india.gov.in/sectors/rural/national_rural.php.66 ODI (2006).

Figure 5.1 Health-care coverage, percentages of total population, 2010
Private commercial schemes 3%
Jamkesmas 33% Not covered 54%
Civil servants and retired 7%
Source: National Social Security Council, cited in ILO 2010a
Others 1%
Private employees ( Jamsostek) 2%
Chapter 5 Post-crisis policy challenges 94
INDONESIA : REINFORCING DOMESTIC DEMAND IN TIMES OF CRISIS
poor and law enforcement is weak. It is estimated that only 50 per cent (20 out of 40 million) of formal-sector workers contribute to one of the funds: Jamsostek, Taspen and Asabri. This implies that social protection coverage through the formal existing programmes is very low in Indonesia, covering only around 20 per cent of the total population (only 12 per cent of the population are covered for an old-age pension).
.. extend outreach of health services…Similarly, the Government has taken important steps to extend social health protection. For example, a new health insurance programme for the poor was introduced in 2004 (Asuransi Kesehatan Masyarakat Miskin or Askeskin) which in 2008 was changed to Jaminan Kesehatan Masyarakat or Jamkesmas. More recently, in an effort to promote inclusion, the coverage was extended in 2006 to informal workers. As a result, 27 per cent of poor informal-sector workers (and some 36.4 per cent of informal non-poor workers) are now covered. However, together with private schemes and programmes for civil servants and retirees, overall coverage remains low (Figure 5.1). In fact, 54 per cent of the population is still not covered under any health-care insurance.

95
.. and provide greater assistance to jobseekers…Unemployment insurance schemes not only provide income support to workers in the case of job loss, they also keep workers tied to the formal job market and provide a window for new job search and can serve as counter-cyclical measures in times of economic crisis. Several developing countries in Asia and Latin America have adopted such schemes as a key mechanism for reducing poverty and unemployment.
Indonesia, however, does not currently have an unemployment insurance scheme; instead it relies on labour market regulation and severance packages to compensate workers when they lose their job. Yet it is reported that 66 per cent of terminated workers – eligible for severance packages – receive no payment, and those that do receive only a fraction of the amount for which they are eligible.67 This implies that the current system of protecting employment is not working. The 2008 crisis has triggered debates in the country about the process of implementing an unemployment insurance scheme. Having a system in place would mean that during a crisis it could work as an automatic stabilizer and provide additional support through extension (such as extending benefit duration) and expansion (expanding coverage to groups not covered).
Over the medium term, Indonesia should envision enacting unemploy-ment insurance policies that could become part of the national social secu-rity system. Both workers and employers could contribute equally to the unemployment fund within the system, and it could be managed by the Government. Such a system would cover first the formal-sector workers and eventually lead to coverage in the informal sector. Although the cost of such a system is often raised as a point of concern, it is interesting to note that a number of developing economies started their unemployment schemes at levels of development similar to Indonesia’s current situation. Also, emerging economies such as Brazil and Thailand already have such schemes in place. Variations in the composition and coverage of schemes in developing and emerging economies, and an overview of some guiding principles, are shown in Box 5.2.
67 World Bank (2010).
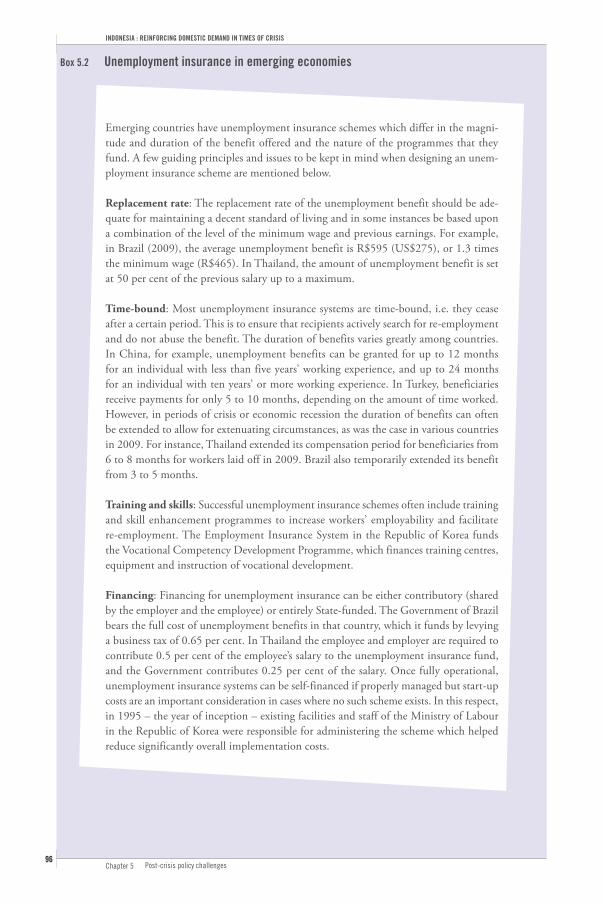
Box 5.2 Unemployment insurance in emerging economies
Emerging countries have unemployment insurance schemes which differ in the magni-tude and duration of the benefit offered and the nature of the programmes that they fund. A few guiding principles and issues to be kept in mind when designing an unem-ployment insurance scheme are mentioned below.
Replacement rate: The replacement rate of the unemployment benefit should be ade-quate for maintaining a decent standard of living and in some instances be based upon a combination of the level of the minimum wage and previous earnings. For example, in Brazil (2009), the average unemployment benefit is R$595 (US$275), or 1.3 times the minimum wage (R$465). In Thailand, the amount of unemployment benefit is set at 50 per cent of the previous salary up to a maximum.
Time-bound: Most unemployment insurance systems are time-bound, i.e. they cease after a certain period. This is to ensure that recipients actively search for re-employment and do not abuse the benefit. The duration of benefits varies greatly among countries. In China, for example, unemployment benefits can be granted for up to 12 months for an individual with less than five years’ working experience, and up to 24 months for an individual with ten years’ or more working experience. In Turkey, beneficiaries receive payments for only 5 to 10 months, depending on the amount of time worked. However, in periods of crisis or economic recession the duration of benefits can often be extended to allow for extenuating circumstances, as was the case in various countries in 2009. For instance, Thailand extended its compensation period for beneficiaries from 6 to 8 months for workers laid off in 2009. Brazil also temporarily extended its benefit from 3 to 5 months.
Training and skills: Successful unemployment insurance schemes often include training and skill enhancement programmes to increase workers’ employability and facilitate re-employment. The Employment Insurance System in the Republic of Korea funds the Vocational Competency Development Programme, which finances training centres, equipment and instruction of vocational development.
Financing: Financing for unemployment insurance can be either contributory (shared by the employer and the employee) or entirely State-funded. The Government of Brazil bears the full cost of unemployment benefits in that country, which it funds by levying a business tax of 0.65 per cent. In Thailand the employee and employer are required to contribute 0.5 per cent of the employee’s salary to the unemployment insurance fund, and the Government contributes 0.25 per cent of the salary. Once fully operational, unemployment insurance systems can be self-financed if properly managed but start-up costs are an important consideration in cases where no such scheme exists. In this respect, in 1995 – the year of inception – existing facilities and staff of the Ministry of Labour in the Republic of Korea were responsible for administering the scheme which helped reduce significantly overall implementation costs.
Chapter 5 Post-crisis policy challenges 96
INDONESIA : REINFORCING DOMESTIC DEMAND IN TIMES OF CRISIS

HealthPensions (monthly)Old age (lump sum)Labour law (severance)Other programmes
Table 5.1 Existing social security related programmes in Indonesia
Source: ILO Country Office for Indonesia and Timor-Leste.
Poor and near-poorNon-poorPrivate sectorPublic sector
X X
XXX
XXX
X
For wage employment Informal wage employment
X = these programmes are covered under the pension programme.
97
Given that introducing such a scheme would take time, the Government in cooperation with the social partners could envision introducing an employ-ment guarantee scheme as a stop-gap measure to provide support to the recently unemployed. Such a scheme could provide guaranteed work (e.g. up to six weeks) for those workers who have been unemployed for a certain duration (e.g. four weeks). In some respects, the recent public-works infra-structure investments have provided such support and could be leveraged further in this regard until a well-functioning unemployment insurance scheme is up and running.
…with renewed emphasis on reducing the incidence of informal employment…
The majority of Indonesians (close to two-thirds), including the self-employed, are in informal employment and without access to any for-mal social protection or social protection benefits. As in many other Asian economies, Indonesians rely on family and community connections for support during old age, illness or unemployment. Indeed, as seen in Table 5.1, there is a wide discrepancy between access to benefits in the formal and informal sector. There is no programme that covers informal sector workers, except the aforementioned health insurance programme Jamkesmas, which targets the poor.

Chapter 5 Post-crisis policy challenges 98
INDONESIA : REINFORCING DOMESTIC DEMAND IN TIMES OF CRISIS
One issue with respect to the contributory social security scheme is that formal workers must pay a percentage deduction of their salary, while infor-mal workers pay only a fixed flat-rate amount. As such, so long as contribu-tion rates for formal employees are significantly higher than for informal employees, there is some incentive for people to switch over to informal employment. Of course, the rate of informal employment is determined by many economic and social factors. For example, certain policy variables and labour market regulations can weigh heavily on determining the infor-mality rates.68 As such, policies to address informal employment must be comprehensive in nature.
…through reducing the cost and improving the bene"ts of the formalization process.
One way to decrease informality is by helping formal firms compete success-fully with informal firms, especially SMEs. For instance, the Government could simplify the tax regime for SMEs to encourage them to stay in the formal sector. Providing tax (and credit) incentives to firms to “formal-ize” could help spur formal job creation. Several developing and emerging countries, particularly in Latin America and Eastern Europe, have done this quite successfully. This is particularly the case in Brazil where informal employment has been declining for some time and may offer a number of potential lessons going forward (Box 5.3). Other countries, for example Hungary, decreased taxes for those employing underprivileged workers, and gave tax concessions to those sectors with informal workers (domestic workers, construction). Simplifying the tax structure can also encourage businesses to formally register by making compliance less costly and bur-densome for SMEs. Countries such as Argentina, Bolivia and Peru have introduced simplified tax regimes for SMEs by e.g. replacing the various taxes (such as income and sales tax) with one single tax.
68 Bacchetta, Ernst and Bustamante (2009).
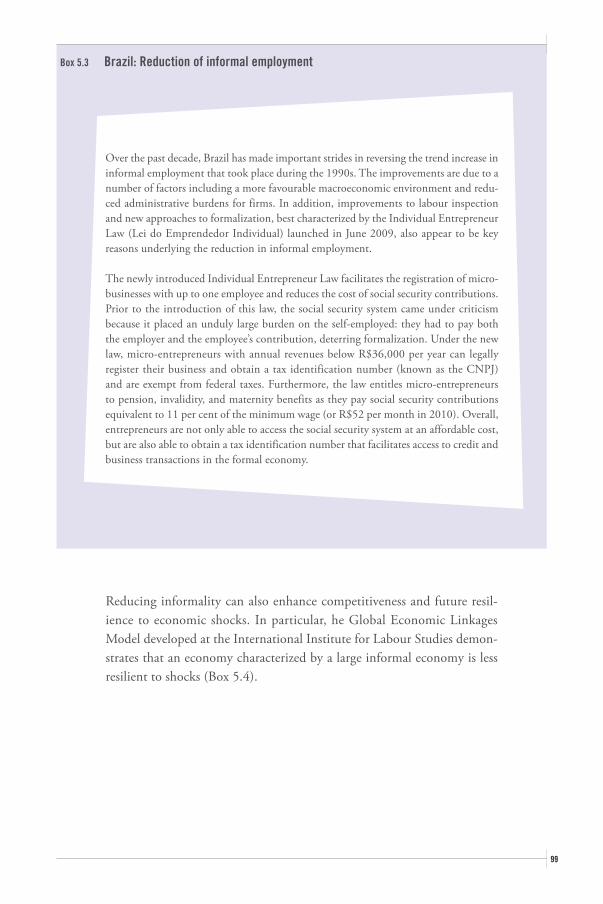
Box 5.3 Brazil: Reduction of informal employment
Over the past decade, Brazil has made important strides in reversing the trend increase in informal employment that took place during the 1990s. The improvements are due to a number of factors including a more favourable macroeconomic environment and redu-ced administrative burdens for firms. In addition, improvements to labour inspection and new approaches to formalization, best characterized by the Individual Entrepreneur Law (Lei do Emprendedor Individual) launched in June 2009, also appear to be key reasons underlying the reduction in informal employment.
The newly introduced Individual Entrepreneur Law facilitates the registration of micro-businesses with up to one employee and reduces the cost of social security contributions. Prior to the introduction of this law, the social security system came under criticism because it placed an unduly large burden on the self-employed: they had to pay both the employer and the employee’s contribution, deterring formalization. Under the new law, micro-entrepreneurs with annual revenues below R$36,000 per year can legally register their business and obtain a tax identification number (known as the CNPJ) and are exempt from federal taxes. Furthermore, the law entitles micro-entrepreneurs to pension, invalidity, and maternity benefits as they pay social security contributions equivalent to 11 per cent of the minimum wage (or R$52 per month in 2010). Overall, entrepreneurs are not only able to access the social security system at an affordable cost, but are also able to obtain a tax identification number that facilitates access to credit and business transactions in the formal economy.
99
Reducing informality can also enhance competitiveness and future resil-ience to economic shocks. In particular, he Global Economic Linkages Model developed at the International Institute for Labour Studies demon-strates that an economy characterized by a large informal economy is less resilient to shocks (Box 5.4).

Box 5.4 Global Economic Linkages Model: Informality and resilience
The Global Economic Linkages (GEL) Model developed at the International Institute for Labour Studies can help to shed light on the employment dynamics across the business cycle. In particular, the model allows for labour market segmentation, i.e. the primary labour market is regulated and characterized by high pay/high productivity jobs and is modelled using a search and matching function which allows for equilibrium unemployment. The secondary labour market is unregulated: wages are flexible and labour demand and supply clear at each point in time. The model allows for workers to switch between the two labour markets even though switching is costly.
The model reveals first – as evidenced in the case of Indonesia – that informality is countercyclical (box figure, panel A). In the downturn, formal jobs are substituted by informal ones, resulting in a deterioration of overall job quality. Second, the simulations indicate that an economy with a large informal sector is less resilient to an economic shock or crisis (Figure 5.2, panel B). In particular, the more informal employment there is the greater the economic volatility.
Figure 5.2 Informality and output variation from steady state with an economic shock Panel A. Informality variation
Panel B. Output variation 0.0
-0.1
-0.2
-0.3
-0.4
-0.5
-0.6
-0.7
-0.8
0.020
0.015
0.010
0.005
0.000
-0.005
Quarter
1 6 11 16 21 26 31 36 41 46 51 56Quarter
Large informal employment
Low informal employment
Source: Bridji and Charpe (2010).
1 6 11 16 21 26 31 36 41 46 51 56
info
rmal
em
ploy
men
t,dev
iatio
n fr
om s
tead
y st
ate
Outp
ut d
evia
tion
from
ste
ady
stat
e
Chapter 5 Post-crisis policy challenges 100
INDONESIA : REINFORCING DOMESTIC DEMAND IN TIMES OF CRISIS

101
C SKILLS DEVELOPMENT AND YOUTH UNEMPLOYMENT
Youth unemployment in Indonesia is comparably high…Generally speaking, youth unemployment rates are often more sensitive to economic fluctuations than the rates for their adult counterparts.69 The current crisis is no exception. The youth unemployment rate in Indonesia increased by 1.3 percentage points, from 21.1 per cent in the first quarter of 2008 to 22.4 per cent in the first quarter of 2009 – on a par with the increases in the global youth unemployment rates (Figure 5.3, panel A). But with nearly one-fifth of Indonesian youth unable to find work, the rates themselves were nearly double the global average of 13 per cent in 2009. Indeed, among countries with available information, youth unem-ployment rates in Indonesia are among the highest, even within the Asian region. In the South-East Asia and the Pacific region, the average youth unemployment rate was 15 per cent in 2009, more than 7 percentage points lower than that of Indonesia. The ratio of youth unemployment to total unemployment is also comparably higher in Indonesia (Figure 5.3, panel B). However, since 2009 youth unemployment rates have since moderately improved falling to just under 20 per cent in February 2010. Nevertheless, youth are not benefit as much from the recovery as their adult counterparts and thus a number of reform options could be considered with a vision to improving the employment outcomes of youth.
…and e#orts are needed to reduce skills mismatch...Part of the problem appears to lie in skills mismatch – in both supply and demand. On the one hand, the occupational share of skilled jobs has not kept pace with the increase in education levels.70 On the other hand, employers cite the fact that the skills of recent graduates are not in line with those required for the job. In this respect, the lack of dialogue between employers and training institutions results in an important skills mismatch and less than optimal use of skills development resources and education-al attainment. It is therefore important to give consideration to ways of improving the school-to-work transition. Generally speaking, building
69 ILO (2010b).70 World Bank (2010).

Figure 5.3 Youth and total unemployment developments during the crisis, selected countries and regions, 2008–2009
Note: Data for Indonesia refer to February 2009; data for South-East Asia and the Pacific refer to the years 2008 and 2009, respectively.Source: ILO, Laborsta; ILO (2010b); EUROSTAT.
3.0
2.5
2.0
1.5
1.0
0.5
0
30
25
20
15
10
5
0
Turk
ey
Indo
nesia
Russ
ian
Fed.
Braz
il
EU-2
7
Uni
ted
Stat
es
Sout
h-Ea
st A
sia &
the P
acifi
c
Wor
ld
Aus
tral
ia
Kor
ea, R
ep. o
f
Mex
ico
Japa
n
Kor
ea, R
ep. o
f
Indo
nesia
Sout
h-Ea
st A
sia &
the P
acifi
c
Braz
il
EU-2
7
Aus
tral
ia
Russ
ian
Fed.
Wor
ld
Japa
n
Mex
ico
Uni
ted
Stat
es
Turk
ey
Q1 2009
Q1 2008
Panel B. Ratio of youth to total unemployment rates, by country and region, 2009
Panel A. Changes in youth unemployment rate, 1st quarter of 2008 and 1st quarter of 2009 (percentage points)
Chapter 5 Post-crisis policy challenges 102
INDONESIA : REINFORCING DOMESTIC DEMAND IN TIMES OF CRISIS

103
better linkages between education and training provisions (supply) and the private sector (demand) is critical.
Importantly, in Indonesia improving employment opportunities for youth is one of the main priorities of the Government and represents an impor-tant element of the mid-term development plan (RPJM) for 2010–2014. In particular, the Ministry of Manpower and Transmigration has recently allocated additional resources to reinvigorate the existing apprenticeship programme. In moving forward, it is important to recognize that the exist-ing system – as pointed out by a recent ILO study71 – fails to address the current challenges: (i) the existing system does not adequately address the gaps between supply and demand for skills; (ii) there is a pressing need to increase the number of apprenticeships – in 2009 there were 10,000 per-sons placed in the enterprise-based apprenticeship programme but nearly 5 million youth were unemployed that year; and (iii) improved coordination efforts are needed to ensure effective delivery.
…complemented by more direct e#orts to promote employment opportunities…
Given the magnitude of the youth employment problem, while improve-ments to school-to-work transitions are a step in the right direction, complementary efforts are needed to improve the overall employment opportunities available to youth. In this respect, in the short term the Government could consider specific measures to encourage the hiring of youth – perhaps targeted to disadvantaged youth – as has been the case in a number of countries during the crisis (Box 5.5). This is particularly relevant, given that in many instances it is often the most qualified youth who benefit from apprenticeship programmes, training provisions and sub-sequent employment opportunities. In the medium term, more empha-sis is needed on labour market information. In this respect, an effective public employment service (PES) could complement an apprenticeship programme by providing job-search assistance, facilitating skills training
71 ILO (2010c).

Box 5.5 Incentives for hiring youth: China and the Republic of Korea
China: In response to the worsening global financial crisis, China introduced a series of financial incentives for enterprises to encourage them to hire more college graduates who were having trouble finding jobs. These incentives came in the form of subsidized internship programmes for university graduates (mainly in Hong Kong, China). The Government also introduced small guaranteed loans for entrepreneurs, and tax breaks for companies that hire college graduates.
Republic of Korea: The Republic of Korea’s main employment creation measure for youth during the current global financial crisis was the reinstatement of the SME youth internship programme in 2009. For a six-month internship, the Government pays 50 per cent of the interns’ monthly wages and subsequently provides a monthly stipend for ano-ther period of six months if full-time employment is secured following the internship. In 2009, 90,000 youth participated in the programme, with 80 per cent of the parti-cipants acquiring a full-time job at an SME upon completion. The Korean Chamber of Commerce and Industry (KCCI) has recently proposed shortening the internship period to three months and extending the time period when new hires receive stipends to nine months.
Chapter 5 Post-crisis policy challenges 104
INDONESIA : REINFORCING DOMESTIC DEMAND IN TIMES OF CRISIS
and also helping in early identification of vulnerable jobseekers. A well-functioning PES could be envisioned as an integral part of any future plans to introduce an unemployment insurance scheme or employment guarantee programme (discussed above).
…while addressing skills development and training issues more broadly.The problem of labour market information and mismatch, however, is not unique to young jobseekers. More generally, labour information is often too scarce and not analysed for integrated and coherent skills development policies at the provincial level. In particular, the training delivery system is fragmented between institutions at the central level, and much dupli-cation exists in the region. Most skills training is not competency-based and certificates are often not recognized throughout the country.72 While the Government is moving forward with a national qualification system, a number of considerations need to be borne in mind:
72 This sub-section on skills development and training has been developed by Patrick Daru of the ILO Country Office for Jakarta.

105
Improve the provision of labour market information: There is a lack of coherence surrounding the provision of labour market information. There is a need to map out who generates what labour market informa-tion, under which format, for whom and for what use. This can then be used to identify the gaps and improve the quality of the information. Of particular relevance to this aspect would be the greater involvement of employers’ organizations in a productive dialogue with government at all levels, to identify skills in demand and plan accordingly.
Increase outreach to remote areas: Most schools and training centres in rural and remote locations are struggling to provide market-oriented skills edu-cation and to facilitate the job search of their graduates. It has been found that the closer the location to an urban area, the better the quality of the education and training provided; this is particularly the case in Eastern Indonesia. Community empowerment programmes can pick up this slack by including a skills training component (as some do) and ensure that it is competency-based.
Provide competency-based training: Most of the skills training in Indonesia is not competency-based and does not lead to a structured certification process. The professional standards set up by the BNSP (an Indonesian standard-setting institution) proposed a model where skills are (i) com-petency-based; (ii) traceable in process; (iii) characterized by measurable outputs; and (iv) demand-driven in orientation. However, in practice the accredited commercial bodies for sector-specific assessment and cer-tification prove to be too costly, and as a consequence most training is not based on outcomes recognized across the country. To address this issue, policy-makers should review options for the establishment of cost-effective assessment and certification systems, and should ensure that competency-based certification is implemented for all training institu-tions.
Review training delivery programmes: Most central departments and direc-torates have their own delivery channels for skills development, and would not consider funding skills development programmes at other training institutions. Consequently, in the field, (i) the “status” of a training insti-tution, rather than its demonstrated aptitudes, is the main criterion for

Chapter 5 Post-crisis policy challenges 106
INDONESIA : REINFORCING DOMESTIC DEMAND IN TIMES OF CRISIS
accessing various skills development funds; (ii) there is little coordina-tion and referral, and no common quality assurance across institutions. There is thus a need for provincial reviews of training delivery channels, and for central institutions to adopt tendering procedures to award skills development funds.

107
D ROLE OF JOB-CENTRED MACROECONOMIC POLICIES
!e past decade has been characterized by "scal prudence…In the wake of the Asian financial crisis in 1997, debt levels in Indonesia grew significantly as the Government rescued the embattled banking and financial system. In the year 2000, government gross debt as a percentage of GDP was nearly 100 per cent (Figure 5.4, panel A). The period following the crisis, however, was one marked by fiscal prudence when government efforts focused on getting debt levels under control. Since 2000, debt as a percentage of GDP has continued to decline, falling below 30 per cent in 2009.
..with debt to GDP falling more than 70 percentage points.In comparison with other Asian economies, debt levels in Indonesia are cur-rently among the lowest in the region (Figure 5.4, panel B), where they are close to or above 50 per cent. This strategy of fiscal prudence was not com-promised in the context of the current crisis given that the total stimulus package, at only 1.2 per cent of GDP, was among the lowest in the region. Moreover, the bulk of expenditures were related to personal income tax changes that were previously planned as part of the tax system reform and were subsequently rolled into the fiscal stimulus efforts announced.
Monetary policy has kept in%ation – for the most part – under control…Following the crisis, inflationary pressures were also of particular concern – in 2001 and 2002 inflation approached 12 per cent per annum (Figure 5.5, panel A). The policy stance of the Bank of Indonesia was thus principally concerned with keeping inflation under control; in this it generally suc-ceeded until the onset of the food crisis in 2005 and 2006 when inflation again jumped to double-digit figures. Since that time, despite a modest rise in 2008 (again due to the food crisis), inflation pressures have subsided and are currently hovering around 4 per cent. Lending rates have nevertheless continued a downwards trend and as a result are comparably high at close to 15 per cent (Figure 5.5, panel B).
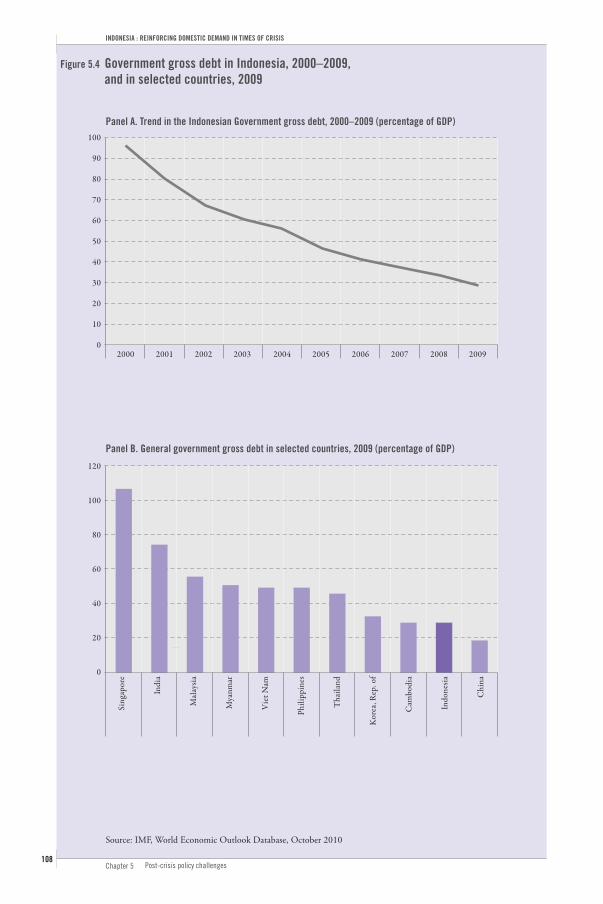
Figure 5.4 Government gross debt in Indonesia, 2000–2009, and in selected countries, 2009
Source: IMF, World Economic Outlook Database, October 2010
120
100
80
60
40
20
0
100
90
80
70
60
50
40
30
20
10
02000 2001 2002 2003 2004 2005 2006 2007 2008 2009
Panel A. Trend in the Indonesian Government gross debt, 2000–2009 (percentage of GDP)
Panel B. General government gross debt in selected countries, 2009 (percentage of GDP)
Sing
apor
e
Indi
a
Mal
aysia
Mya
nmar
Vie
t Nam
Phili
ppin
es
Tha
iland
Kor
ea, R
ep. o
f
Cam
bodi
a
Indo
nesia
Chi
na
Chapter 5 Post-crisis policy challenges 108
INDONESIA : REINFORCING DOMESTIC DEMAND IN TIMES OF CRISIS

Figure 5.5 Lending interest rate and annual inflation rate in Indonesia, 2000–2009, and in selected countries, 2009
Source: ADB (2010).
20
18
16
14
12
10
8
6
4
2
0
22
20
18
16
14
12
10
8
6
4
2
02000 2001 2002 2003 2004 2005 2006 2007 2008 2009
Panel A. Trends in the lending interest rate and annual inflation rate in Indonesia, 2000–2009 (percentages)
Panel B. Lending interest rate and annual inflation rate in selected countries, 2009 (percentages)
Sri L
anka
Vie
t Nam
Indo
nesia
Indi
a
Tha
iland
Kor
ea, R
ep. o
f
Sing
apor
e
Anual inflation rate
Lending interest rate
109

Chapter 5 Post-crisis policy challenges 110
INDONESIA : REINFORCING DOMESTIC DEMAND IN TIMES OF CRISIS
…but lending rates remain comparably high, especially for SMEs.The high lending rates are a particular issue for micro- and small and medium-sized enterprises (MSMEs) – as rates to small businesses often exceed 20 per cent. This has important implications for overall investment in Indonesia as well as employment creation. SMEs account for over half of Indonesia’s GDP and the vast majority of employment. The Government, recognizing the important contribution of MSMEs to the Indonesian economy, has launched the People’s Business Credit (Kredit Usaha Rakyat, KUR) with the intention of supplying credit to viable MSMEs. In 2010, the Government allocated some IDR 20 trillion through KUR in the form of credit across a range of state-owned banks. But more importantly, some of the root causes of the difficulties for SMEs in accessing finance need to be addressed. Since the 1990s KUK, or Kredit Usaha Kecit (Small Business Loans) has been put in place, requiring banks to set aside 20 per of their loan portfolio for SMEs. However, banks may be reluctant to lend due to lack of information and the perceived excessive cost of processing small loans. Reforms in this area could help to improve the culture of mistrust between both lenders and SMEs. The experience of Viet Nam, which recently introduced reforms to facilitate the loan proc-ess for SMEs, as well as a nationwide credit guarantee system to support commercial bank lending, could be a way forward for Indonesia as well. At the local level, Viet Nam also has bank-supported training centres (BTC) that provide training for more than 2,700 local bankers in services such as customer focus, credit risk and lending.
Moving forward, policy choices should recognize the complementarities among employment, social and economic objectives.
In conclusion, Indonesia’s experience in the context of the current cri-sis demonstrates how labour market and social policies, if well-designed, contribute to rather than hinder economic growth. Much of the success underlying Indonesia’s experience lies in the reforms and policy effort on the heels of the 1997 Asian financial crisis. In this respect, the Government of Indonesia is acutely aware of how employment and social-friendly mac-

111
roeconomic policies can play a critical role in boosting incomes and stim-ulating job creation, which in turn have positive impacts on economic growth and society more broadly.
Moving forward therefore, the Government should build upon these les-sons and take advantage of its relatively strong fiscal position and positive economic outlook to address a number of the persistent labour market and social challenges raised in this chapter. Spending to address these issues should be considered an investment, one that will bring returns in terms of improved incomes, employment outcomes and productivity growth, as well as long-term improvements in growth and fiscal space as the tax base expands. As the experience of the past crises demonstrates, it will also make Indonesia more resilient to future shocks while helping to achieve greater equity with growth.

Chapter 5 Post-crisis policy challenges 112
INDONESIA : REINFORCING DOMESTIC DEMAND IN TIMES OF CRISIS
REFERENCES
Asian Development Bank (ADB). 2010. Key indicators for Asia and the Pacific 2010 (Manila).
Bacchetta, M.; Ernst, E.; Bustamente, J. P. 2009. Globalization and informal jobs in developing countries: A joint study of the International Labour Office and the Secretariat of the World Trade Organization (Geneva, ILO/WTO).
Bridji, S.; Charpe, M. 2010. “Active labour market policies, search costs and positive fiscal multiplier”, mimeo (Geneva, IILS).
Chatterjee, S. 1999. “Lessons from the economic crisis: Case study of Indonesia”, in Journal of Asia-Pacific Studies, Vol. 6, No. 1, pp.17–63.
Economic and Social Commission for Asia and the Pacific (ESCAP). 2001. Strengthening policies and programmes on social safety nets: Issues, recommendations and selected studies, Social Policy Paper No. 8 (New York, United Nations).
Inter-American Development Bank. 2007. Recommendations and best practices on taxa-tion of SMEs in Latin America, paper presented at ITD Global Conference on Taxation of Small and Medium Enterprises.
International Labour Organization (ILO). 2010a. Global Jobs Pact country scan: Indonesia (Geneva).
—. 2010b. Global Employment Trends for Youth: August 2010: Special issue on the impact of the global economic crisis on youth (Geneva).
—. 2010c. Effectiveness, efficiency and impact of Indonesia’s apprenticeship programme, Job Opportunities for Youth (JOY) Project (Jakarta).
—. 2010d. Republic of Korea’s response to the crisis, G20 Country Briefs, presented at the Meeting of Labour and Employment Ministers, Washington, DC, 20–21 Apr. Available at: http://www.ilo.org/public/libdoc/jobcrisis/download/g20_korea_countrybrief.pdf [2 Feb. 2011].
International Monetary Fund (IMF). 2010a. Indonesia: Financial system stability assess-ment, IMF Country Report No. 10/288, September.
—. 2010b. Indonesia: 2010 article IV consultation–staff report; Staff statement; Public information notice on the executive board discussion; and Statement by the executive director for Indonesia, IMF Country Report No. 10/284 (Washington, DC).

113
—. 2004. Indonesia: 2004 Article IV consultation and post-program monitoring discussions–staff report; Staff statement; Public information notice on the executive board Ddscussion, IMF Country Report No. 04/188 (Washington, DC). Korea Chamber of Commerce and Industry (KCCI). 2010. The opinions about youth internship programmes in SMEs (Seoul).
Nasution, A. 2007. Comments on Jonathan Fiechter and Krirk Vanikkul (2007), “Financial Sector Reform after the Crisis”: The case of Indonesia, paper presented at the Conference: Financial stability and financial sector supervision – Lessons from the past decade and way forward, Tokyo, Japan, 17 December.
Overseas Development Institute (ODI). 2006. The Maharashtra Employment Guarantee Scheme, India, Policy Brief 6, Inter-Regional Inequality Facility (London).
Pangestu, M. 2003. The Indonesian bank crisis and restructuring: Lessons and implications for other developing countries, G-24 Discussion Paper Series, No. 23, November (Geneva, UNCTAD).
Shah, A. 2010. “India’s Rural Employment Guarantee Scheme leads to greater bargai-ning power for rural laborers”, online article in Green World Investor, Jul. Available at http://greenworld investor.com.
Tong, S. Y; Zhang, Y. 2009. China’s responses to the economic crisis, EAI Background Brief No. 438 (Singapore, East Asian Institute (EAI)).
Witter, S. and B. Garshong. 2009. Something old or something new? Social health insurance in Ghana, in BMC International Health and Human Rights. Volume 9, No. 20. http://www.biomedcentral.com/content/pdf/1472-698X-9-20.pdf
World Bank. 2010. Indonesia Economic Quarterly: Looking forward, Sep. (Washington, DC).

ISBN 978-92-9014-966-8
9 789290 149668
INDONESIA : REINFORCING DOMESTIC DEMAND IN TIMES OF CRISIS
It is often argued that the cost of social equity is less economic growth, high-lighting the supposed trade-off between these two goals. The crisis that erupted in 2008 – which was preceded by rising social inequalities – has shown that this is simply not the case. In fact, if prop-erly designed, equity-enhancing policies can also promote prosperity and reduce the risk of future crises. The aim of the Studies on Growth with Equity is to show how such policy complementarities can be achieved.
The experience of Indonesia shows how growth could be combined with equity goals in responding to the crisis. Rather than resorting to competitive devalua-tions, wage cuts and financial deregula-tion – as predicated by the conventional wisdom – Indonesia opted for a well-designed boost to domestic demand and prudent financial management. Though much remains to be done, the country has been rewarded with encouraging social and economic results.

![Housing Consumers Protection Measures Act - NHBRC CONSUMERS PROTECTION … · 1 HOUSING CONSUMERS PROTECTION MEASURES ACT NO. 95 OF 1998 [ASSENTED TO 20 OCTOBER, 1998] [DATE OF COMMENCEMENT:](https://img.pdfslide.net/doc/110x75/5a9dfe647f8b9ad2298bd4fd/housing-consumers-protection-measures-act-consumers-protection-1-housing-consumers.jpg)