Embed Size (px)
Citation preview
www.epa.nsw.gov.au
Environment Protection Authority
Social Research on Small to Medium Enterprises (SME) Waste and
Recycling Summary Benchmark Study
i
© 2016 State of NSW and Environment Protection Authority
With the exception of photographs, the State of NSW and Environment Protection Authority are pleased to allow this material to be reproduced in whole or in part for educational and non-commercial use, provided the meaning is unchanged and its source, publisher and authorship are acknowledged. Specific permission is required for the reproduction of photographs.
Every effort has been made to ensure that the information in this document is accurate at the time of publication. However, as appropriate, readers should obtain independent advice before making any decision based on this information.
All content in this publication is owned by the EPA and is protected by Crown Copyright. It is licensed under the Creative Commons Attribution 4.0 International (CC BY 4.0) , subject to the exemptions contained in the licence. The legal code for the licence is available at Creative Commons .
The EPA asserts the right to be attributed as author of the original material in the following manner: © State of New South Wales and the Environment Protection Authority 2016.
Published by:
Environment Protection Authority 59 Goulburn Street, Sydney NSW 2000 PO Box A290, Sydney South NSW 1232 Phone: +61 2 9995 5000 (switchboard) Phone: 131 555 (NSW only – environment information and publications requests) Fax: +61 2 9995 5999 TTY users: phone 133 677, then ask for 131 555 Speak and listen users: phone 1300 555 727, then ask for 131 555 Email: [email protected] Website: www.epa.nsw.gov.au
Report pollution and environmental incidents Environment Line: 131 555 (NSW only) or [email protected] See also www.epa.nsw.gov.au
ISBN 978 1 76039 297 0 EPA 2016/0139 March 2016
1
Contents
1. Executive Summary ...................................................................................................................... 2
2. Background ................................................................................................................................... 4
2.1 Aims of the Business Recycling Program ............................................................................... 4
2.2 Bin Trim business grants ......................................................................................................... 4
2.3 Bin Trim recycling equipment rebates ..................................................................................... 5
2.4 Circulate, NSW EPA Industrial Ecology program ................................................................... 5
3. Research objectives ..................................................................................................................... 5
4. Research notes ............................................................................................................................. 6
5. Summary of findings .................................................................................................................... 6
6. Key recommendations ................................................................................................................. 7
7. Sample and methodology ............................................................................................................ 8
7.1 Methodology for the surveys ................................................................................................... 8
7.2 Profile of the SME sample ....................................................................................................... 9
7.3 Survey of waste service providers ........................................................................................ 10
7.4 Profile of the WSP sample .................................................................................................... 11
7.5 Waste services website audit ................................................................................................ 12
8. Summary analysis of SMEs by industry sector ....................................................................... 12
9. Detailed findings ......................................................................................................................... 13
9.1 SME attitudes towards waste and recycling ......................................................................... 13
9.2 Sources of advice and support for SMEs .............................................................................. 19
9.3 WSPs and SME clients ......................................................................................................... 19
9.4 Are SMEs aware of their waste costs? ................................................................................. 20
9.5 Do SMEs monitor their waste and recycling? ....................................................................... 21
9.6 Do SMEs have a waste and recycling action plan? .............................................................. 26
9.7 What waste and recycling actions are SMEs doing? ............................................................ 27
9.8 What do SMEs think are their barriers to further waste reduction and recycling? ................ 32
9.9 WSP barriers to providing SMEs with services to increase recycling .................................. 36
9.10 SMEs and recycling equipment............................................................................................. 38
9.11 Are SMEs willing to invest in waste reduction measures? .................................................... 38
9.12 Impact of financial assistance on installation of new recycling equipment ........................... 39
9.13 Profile of SMEs who say ‘we don’t know how to reduce waste’ ........................................... 44
9.14 Impact of the Bin Trim program............................................................................................. 45
10. SME segmentation map of attitudes and behaviours ............................................................. 47
11. References ................................................................................................................................... 51
12. Appendix 1 – SME Survey .......................................................................................................... 52
Summary Benchmark Social Research on SME Waste and Recycling
2
1. Executive Summary
This report is based on the research findings of Instinct and Reason as outlined in the
unpublished report Bin Trim Social Research for Benchmarking and Program Evaluation. It
benchmarks the current small and medium sized enterprise (SME) culture around waste
management, resource recovery and recycling and provides an insight into the relationship
between SMEs and their waste service providers.
Nearly all SMEs claim to be currently engaged in recycling activities of some form, and this
widespread claim is consistent across all industry sectors covered in the research program.
One of the most strongly held SME views is the link they make between reducing waste and
increasing recycling, and their desire to be a sustainable and ethical business (41% strongly
agree and 35% agree).
However, most SMEs firmly believe they have done all they can to minimise waste and
maximise recycling (35% strongly agree and 33% agree). This limits contemplation of further
action and reduces their likelihood of tuning in to ‘new news’ about waste reduction and
enhanced recycling opportunities. Furthermore, similar majorities of SMEs state their waste
(71% either strongly agree or agree) and recycling bills (69% either strongly agree or agree)
are a relatively small cost of their business. This set of attitudes inhibits active information
searches and also the passive receipt of information and knowledge.
The motivators for further action in waste reduction and enhanced recycling come from a
desire for a competitive edge (53% agree), its role in motivating staff (51% agree) and in
being able to promote that they recycle and minimise waste to their own customers (40%
agree).
The major attitudinal barriers to further action on waste and recycling improvements included
the fact that costs were relatively low for both the waste bill (36% strongly agree and 35%
tend to agree) and the recycling bill (38% strongly agree and 31% tend to agree), the belief
that all that could be done had been done (35% strongly agree and 33% tend to agree), and
the perceived lack of space to keep the bins needed to recycle effectively (18% strongly
agree and 19% tend to agree).
The great majority of SMEs report being satisfied with their recycling services (86%). Given
that the wider evidence suggests that SMEs are only recycling limited types of waste, this
result is concerning.
Overall, only one third of the SMEs interviewed believed they were very well informed about
the information, assistance and support that is available to help them manage waste and to
control their waste removal and recycling costs. About the same amount (32%) believe it is
very easy for them to get access to tailored advice or support to help them better manage
waste and to control their waste removal and recycling costs. The remainder do not. Most
SMEs seek information directly from waste service providers by either visiting their website
(48%) or contacting the waste service provider directly (48%). Local government is seen to
play a very useful role as well with 39% of SMEs reporting they had received information
from this source.
An SME segmentation map of attitudes and behaviours towards waste minimisation and
recycling groups SMEs by their ‘mindsets’. SME ‘mindsets’ identified through the
segmentation include:
Disciples are keen to invest in waste reduction measures (such as a new recycling
system or recycling equipment) and have already conducted an assessment of their
waste and recycling. 22% of SMEs surveyed fall within this category.
3
Spectators are keen to invest in waste reduction measures yet haven’t undertaken an
assessment. 19% of SMEs surveyed fall within this category.
Doubters have undertaken an assessment of their waste and recycling yet are reluctant
to invest in waste reduction measures. 13% of SMEs surveyed fall within this category.
Disengaged SMEs have not conducted an assessment and have no desire to invest in
waste reduction measures. 46% of SMEs surveyed appear to be disengaged.
To improve SME performance in waste minimisation and recycling this study has detailed
some key recommendations in Section 6 including:
1) Actively promote ‘reducing waste and recycling more’ to SMEs
2) Use reinforcement strategies for SMEs that are on the right path. Provide strong follow-
up support to SMEs to reinforce good behavior
3) Disrupt the SME’s view that they are recycling all they can and they can’t do any more
4) Key messages should be used when approaching SMEs about reducing waste and
improving recycling outcomes
5) Use strategies that facilitate change.
Bin Trim assessments appear to be working well and driving considerable behaviour change
in SMEs. The key impacts of the Bin Trim assessment appear to be threefold. Firstly SMEs
are much more likely to have an action plan in place. Secondly management is more likely to
be focusing on the issue with reviews of their waste and recycling policies. Finally they are
likely to be on the lookout for new (presumably better) waste and recycling systems. In a
related study, 93% of the surveyed Bin Trim SMEs said they had implemented all or some of
their action plan recommendations; 83% said their recycling had already increased and
nearly 63% said they will save money as a result of the Bin Trim program (NSW EPA, 2015
Unpublished).
However, as knowledge increases about waste and recycling through participation in
programs such as Bin Trim, the barriers to taking the next steps become clearer to SMEs.
Future government assistance is still likely to be of value in overcoming these barriers.
Summary Benchmark Social Research on SME Waste and Recycling
4
2. Background
The NSW Environment Protection Authority (EPA) is responsible for raising awareness of
regulatory requirements, delivering strong compliance and enforcement programs, and
driving improved waste and recycling practices.
Waste Less, Recycle More is a five-year $465.7 million waste and recycling initiative for New
South Wales that will deliver economic, employment and environmental benefits for local
communities and will transform waste and recycling.
Under the Waste Less, Recycle More initiative the EPA is delivering the Business Recycling
Program to improve small and medium enterprises’ (SMEs) waste and recycling culture and
behaviour. The Business Recycling Program, including the Bin Trim business grants, Bin
Trim recycling equipment rebates and Circulate, NSW EPA Industrial Ecology program all
focus on the issue of waste and recycling among SMEs.
The EPA engaged Instinct and Reason to conduct social research with SMEs regarding their
knowledge, attitudes and behaviour in relation to waste and recycling. The research
benchmarks the current SME culture around waste management, resource recovery and
recycling. While SMEs were the focus of the research, it also provides an insight into the
relationship between SMEs and their waste service providers.
This report is based on the research findings of Instinct and Reason as outlined in the unpublished report Bin Trim Social Research for Benchmarking and Program Evaluation.
This research will help inform the delivery of communications and education programs under
the Waste Less, Recycle More initiative. This research will also help measure the
effectiveness of the Business Recycling Program through follow-up tracking surveys.
2.1 Aims of the Business Recycling Program
The Business Recycling Program aims to:
1. support businesses to reduce waste and increase recycling
2. provide SMEs in New South Wales with low-cost access to new and upgraded small-
scale infrastructure to increase resource recovery
3. create opportunities for medium and large businesses to re-use or recover waste
through the introduction of a NSW Industrial Ecology Business Support Network
4. work cooperatively with the Australian Packaging Covenant (APC) by co-funding
appropriate infrastructure for the recycling of packaging waste
5. continue to fund programs to make it easy for businesses to locate recyclers
6. continue to fund training programs to support industry and develop markets for recycled
materials.
2.2 Bin Trim business grants
The $11.1-million Bin Trim program is funding organisations with waste expertise to engage
with 20,000 small and medium enterprises to help them reduce waste and increase
recycling. The Bin Trim Business program helps businesses measure their waste and
provides tailored advice and assistance on how to reduce, re-use and recycle materials.
In Round 1, funding was made available for grants between $50,000 and $250,000 for successful applicants to provide free Bin Trim assessments to participating businesses and
5
to identify opportunities to recycle more. A total of 43 applications were received, of which 27 were successful in obtaining $4,76 million in grant funding.
Bin Trim grantees began implementing their projects in July 2014 by recruiting businesses and conducting assessments of their waste and recycling bins. Grantees developed tailored action plans and helped to implement these to reduce waste and increase or improve recycling. Second (follow-up) assessments were completed by May 2015.
Round 2 of the Bin Trim grants program commenced in September 2015 with projects to be completed by March 2017. $6.87 million was allocated to 26 grantees who will engage with SMEs across the state through the Bin Trim program.
2.3 Bin Trim recycling equipment rebates
The Bin Trim Rebate program provides rebates of between $1,000 and $50,000 to help
businesses with the cost of recycling equipment. The EPA will fund up to 50% of the total
cost of the equipment. Only businesses assessed under an approved EPA program or other
on application, are eligible to apply. The rebate program opened in October 2014 and will
continue until June 2017.
2.4 Circulate, NSW EPA Industrial Ecology program
Through facilitators, the EPA is fostering the development of Industrial Ecology projects and
networks on a regional basis across New South Wales. The projects are formed by groups
of businesses – medium to large enterprises – who elect to work together to develop
commercial applications for the re-use of waste items currently being sent to landfill,
including food, paper and cardboard, timber and plastics.
Businesses can participate in one of two ways, by:
becoming an Industrial Ecology facilitator, and supporting the establishment of Industrial
Ecology projects and networks for their nominated region
joining a regional Industrial Ecology network as a participating business.
Over four years to 2017, the Circulate, NSW EPA Industrial Ecology program is seeking to
engage with 1000 medium to large enterprises to establish approximately 100 Industrial
Ecology projects across New South Wales. During this period the program is targeting
160,000 tonnes of landfill diversion from participating businesses.
3. Research objectives
Benchmark SME knowledge, attitudes and behaviour towards recycling
Develop indicators to measure the current knowledge, attitudes and behaviour of SMEs
in regard to the topic of recycling, including uptake of recycling services and how and
why these decisions are made.
Establish a baseline for future qualitative evaluation and benchmarking.
Benchmark knowledge, attitudes and behaviour of waste service provider contractors
and the waste industry towards SME recycling.
Develop indicators to measure the current knowledge, attitudes and behaviour of waste service provider contractors towards assisting SMEs to recycle more
Establish a baseline for future qualitative evaluation and benchmarking.
Summary Benchmark Social Research on SME Waste and Recycling
6
Benchmark recycling services offered to SMEs and all businesses
Establish a baseline of waste and recycling services currently offered to SMEs by
existing waste and recycling services for the purposes of future evaluation and
benchmarking.
4. Research notes
Weighting
Data from the survey of SMEs has been weighted to reflect the actual population of
businesses in each industry sector based on Australian Bureau of Statistics (ABS) data.
Rounding
Results are provided as a percentage to the nearest whole number. In some figures and
tables, this may result in totals adding up to slightly more or less than 100%.
Significant differences
Significance testing has been applied to the results and statistically significant differences (at
a 95% confidence interval) are indicated through the report.
5. Summary of findings
Nearly all SMEs claim to be currently engaged in recycling activities of some form, and
this widespread claim is consistent across all industry sectors covered in the research
program.
One of the most strongly held SME views is the link they make between reducing waste
and increasing the amount of product they recycle, and their desire to be a sustainable
and ethical business (41% strongly agree and 35% agree).
However, most SMEs firmly believe they have done all they can to minimise waste and
maximise recycling (35% strongly agree and 33% agree). This limits contemplation of
further action and reduces their likelihood of tuning in to ‘new news’ about waste
reduction and enhanced recycling opportunities.
Furthermore, similar majorities of SMEs state their waste (71% either strongly agree or
agree) and recycling bills (69% either strongly agree or agree) are a relatively small cost
of their business.
This set of attitudes inhibits active information searches and also the passive receipt of
information and knowledge.
The motivators for further action in waste reduction and enhanced recycling come from a
desire for a competitive edge (53% agree), its role in motivating staff (51% agree) and in
being able to promote that they recycle and minimise waste to their own customers (40%
agree).
The major attitudinal barriers to further action on waste and recycling improvements
included the fact that costs were relatively low for both the waste bill (36% strongly agree
and 35% tend to agree) and the recycling bill (38% strongly agree and 31% tend to
agree), the belief that all that could be done had been done (35% strongly agree and
33% tend to agree), and the perceived lack of space to keep the bins needed to recycle
effectively (18% strongly agree and 19% tend to agree).
7
The great majority of SMEs report being satisfied with their recycling services (86%).
Overall, only one third of the SMEs interviewed believed they were very well informed
about the information, assistance and support that is available to help them manage
waste and to control their waste removal and recycling costs.
About the same amount (32%) believe it is very easy for them to get access to tailored
advice or support to help them better manage waste and to control their waste removal
and recycling costs. The remainder do not.
Most SMEs seek information directly from waste service providers by either visiting their
website (48%) or contacting the waste service provider directly (48%). Local government
is seen to play a very useful role as well with 39% of SMEs reporting they had received
information from this source.
Bin Trim assessments appear to be working well and driving considerable behavior
change in SMEs.
6. Key recommendations
Actively promote ‘reducing waste and recycling more’ to SMEs
SMEs are not searching for information at this point. SMEs will need to be actively
approached or ‘door knocked’.
Use reinforcement strategies for SMEs that are on the right path
Reinforce the good behaviour in those on the right path to reduced waste and improved
recycling. Some SMEs are already disciples of change and need reinforcing messages that
their behaviours are on the right track – here is what else you can do.
Provide strong follow-up support to businesses to reinforce the good behaviour
After a waste assessment and advice to a business, they often become more aware of the
gaps in their knowledge. They see the barriers to further change more clearly and they are
more likely to say that financial assistance could help them. These businesses rely on good
follow-up support to overcome their individual challenges to improved waste and recycling.
Disrupt the SME’s view that they are recycling all they can and they can’t do any more
Key messages should be used when approaching SMEs about reducing waste and improving recycling outcomes
‘SMEs are doing well but they could do more’. Size the SME waste problem for them -
demonstrate they are part of the 1.8 million tonnes of business waste going to landfill
each year. Acknowledge their good work in recycling the basics.
‘A good business (or an ethical and sustainable business) reduces waste and recycles
more’.
‘Staff get motivated by working for an ethical and sustainable business’ or,
‘Staff are motivated by reducing their waste and improving their recycling.’
‘Reducing waste and improving recycling will enhance your profile among competitors
and customers.’
Summary Benchmark Social Research on SME Waste and Recycling
8
Use strategies that facilitate changes
Most SMEs need support to facilitate the changes that will improve recycling. These SMEs
have positive attitudes and say they are engaged in at least some positive recycling
behaviour. However, these SMEs may be holding back on change and this suggests a
facilitation strategy – making it as easy as possible for SMEs to make the necessary
changes to their operations.
7. Sample and methodology
7.1 Methodology for the surveys
The benchmark study commenced with a review of related literature and research to
uncover a wide range of potential benchmarking questions.
Rapid appraisal interviews
The benchmarking questions were then tested with a small number of SMEs through a rapid
appraisal interview process. The rapid appraisal stage was designed to assist in the survey
design; in particular to ensure questions were asked that could be answered by waste
service providers (WSPs) and SMEs and that reflected real-world interactions. The
interviews were used to make assessments of what questions could realistically, easily and
accurately be answered by WSPs and SMEs about their waste and recycling activities. The
researchers found that WSPs were suspicious of the research and were reluctant to
participate in the interviews. A letter from the EPA authenticating the study still appeared to
be insufficient with many still suspicious and declining to participate. The rapid appraisal
interviews were not designed to provide ‘data’ in their own right but were critical in ensuring
the interview questions were relevant and engaging. As a result uptake of the survey was
high and terminations almost nil.
Survey of 639 SMEs
The benchmarking survey was well-received by SMEs and appeared to be a relatively easy
survey for SMEs to complete.
639 interviews were conducted across New South Wales with SME owners or managers
responsible for waste management.
All 639 SMEs were recruited over the phone.
455 of the SME sample completed the interview by computer-assisted telephone
interviewing (CATI) and 184 of the SMEs completed the interview through an online
survey (SurveyMonkey).
Data collection followed a pilot test of the survey instrument to ensure all questions were
clearly understood by the SME respondent. Once issues were ironed out from the pilot
test, the main sample was collected. With the assistance of the rapid appraisal interviews
and the literature review the survey did not require any changes between the pilot and
the final survey.
Researchers ensured interviews were conducted with the best respondent of the
business and at their most preferred time.
The sample was obtained using a sourced list of NSW businesses that made use of:
o Dun and Bradstreet’s Company 360 business listing, which allows for business
lookups based on industry, company size, location
9
o Yellow Pages lookups, targeting specific industries
o other online sources (TrueLocal, business websites, vicdir)
o publications, such as BRW, which publish lists of businesses on a regular basis.
Only SMEs with 6–199 full-time equivalent employees were included within the survey
sample.
The researchers requested to speak with the main decision-maker for the business on
waste management and recycling.
Quotas were placed on industry, and company size to ensure the sample covered a
representative mix of SMEs.
The survey with the 639 SMEs was completed relatively easily and in only a few days. It
would appear that because the survey was identified at the onset as being for the EPA,
and that it was not a formal audit, most SMEs responded very positively to being asked
their opinions and about their current waste and recycling behaviours.
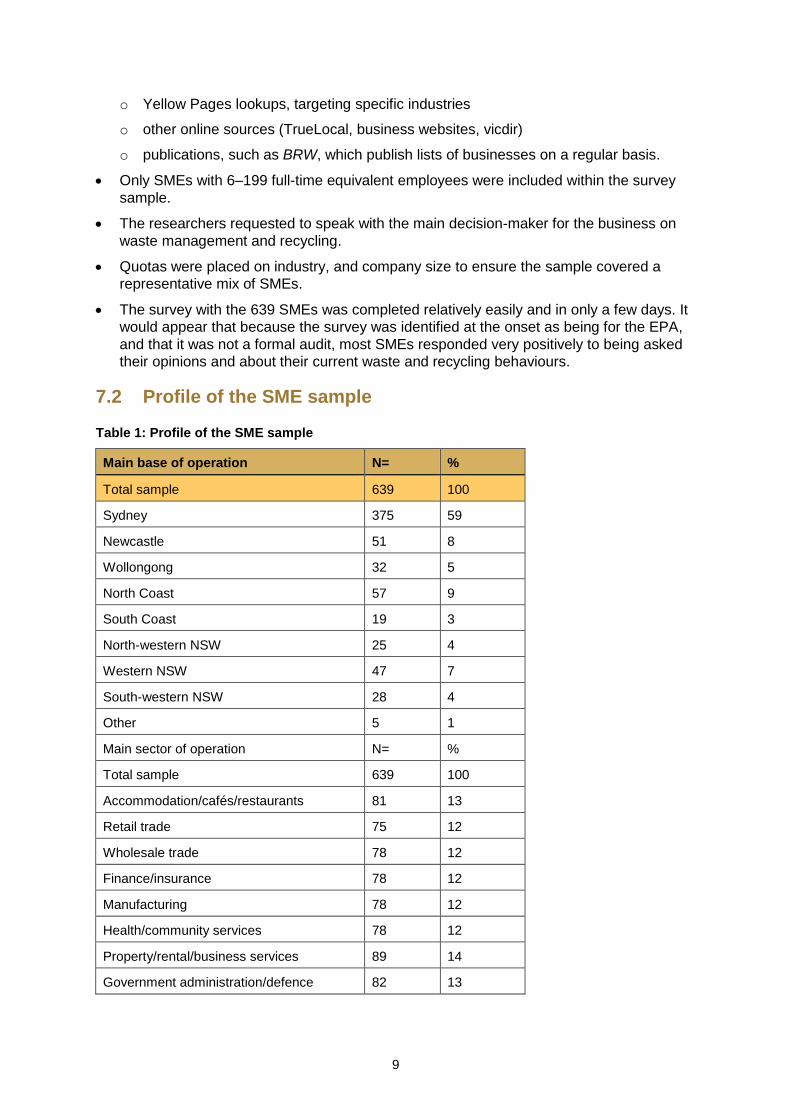
7.2 Profile of the SME sample
Table 1: Profile of the SME sample
Main base of operation N= %
Total sample 639 100
Sydney 375 59
Newcastle 51 8
Wollongong 32 5
North Coast 57 9
South Coast 19 3
North-western NSW 25 4
Western NSW 47 7
South-western NSW 28 4
Other 5 1
Main sector of operation N= %
Total sample 639 100
Accommodation/cafés/restaurants 81 13
Retail trade 75 12
Wholesale trade 78 12
Finance/insurance 78 12
Manufacturing 78 12
Health/community services 78 12
Property/rental/business services 89 14
Government administration/defence 82 13
Summary Benchmark Social Research on SME Waste and Recycling
10
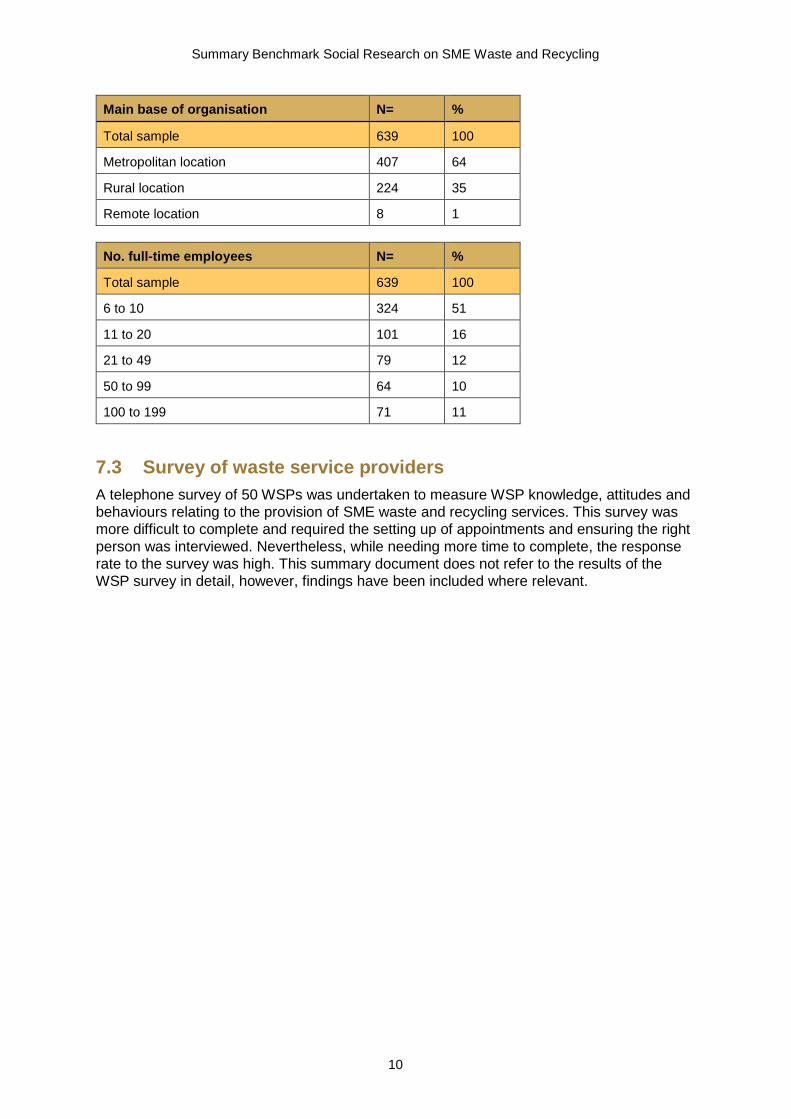
Main base of organisation N= %
Total sample 639 100
Metropolitan location 407 64
Rural location 224 35
Remote location 8 1
No. full-time employees N= %
Total sample 639 100
6 to 10 324 51
11 to 20 101 16
21 to 49 79 12
50 to 99 64 10
100 to 199 71 11
7.3 Survey of waste service providers
A telephone survey of 50 WSPs was undertaken to measure WSP knowledge, attitudes and
behaviours relating to the provision of SME waste and recycling services. This survey was
more difficult to complete and required the setting up of appointments and ensuring the right
person was interviewed. Nevertheless, while needing more time to complete, the response
rate to the survey was high. This summary document does not refer to the results of the
WSP survey in detail, however, findings have been included where relevant.
11
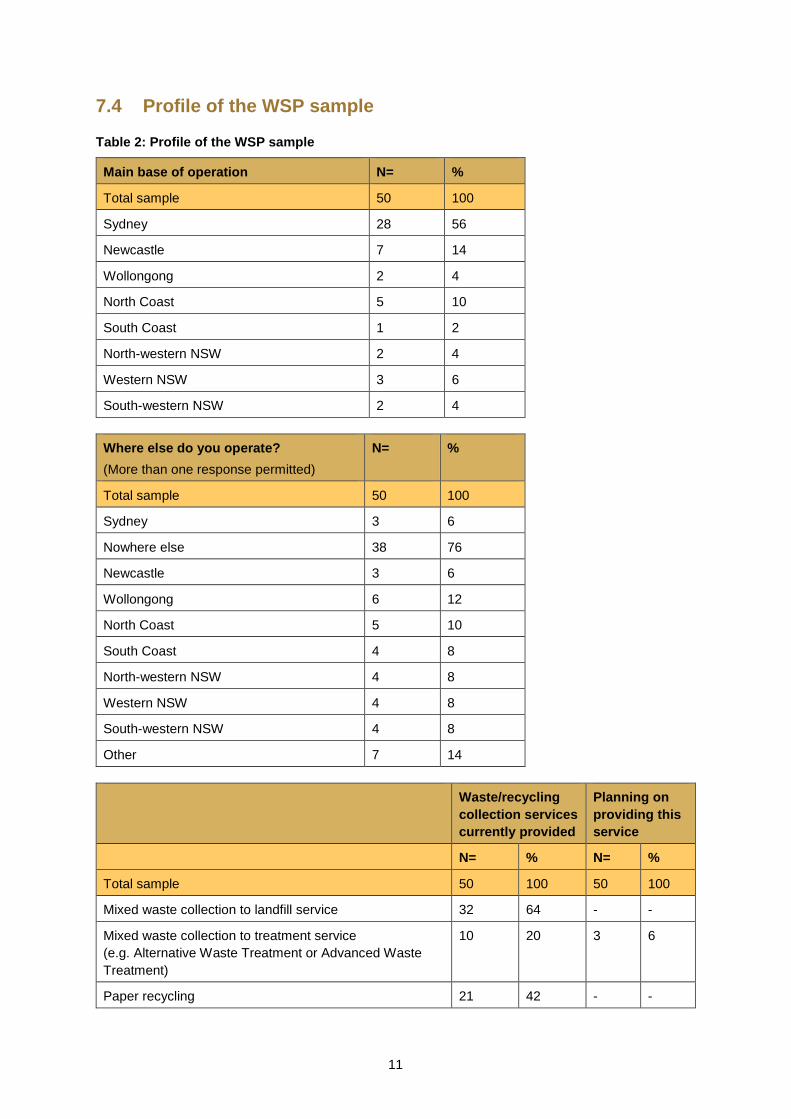
7.4 Profile of the WSP sample
Table 2: Profile of the WSP sample
Main base of operation N= %
Total sample 50 100
Sydney 28 56
Newcastle 7 14
Wollongong 2 4
North Coast 5 10
South Coast 1 2
North-western NSW 2 4
Western NSW 3 6
South-western NSW 2 4
Where else do you operate?
(More than one response permitted)
N= %
Total sample 50 100
Sydney 3 6
Nowhere else 38 76
Newcastle 3 6
Wollongong 6 12
North Coast 5 10
South Coast 4 8
North-western NSW 4 8
Western NSW 4 8
South-western NSW 4 8
Other 7 14
Waste/recycling
collection services
currently provided
Planning on
providing this
service
N= % N= %
Total sample 50 100 50 100
Mixed waste collection to landfill service 32 64 - -
Mixed waste collection to treatment service
(e.g. Alternative Waste Treatment or Advanced Waste
Treatment)
10 20 3 6
Paper recycling 21 42 - -
Summary Benchmark Social Research on SME Waste and Recycling
12
Waste/recycling
collection services
currently provided
Planning on
providing this
service
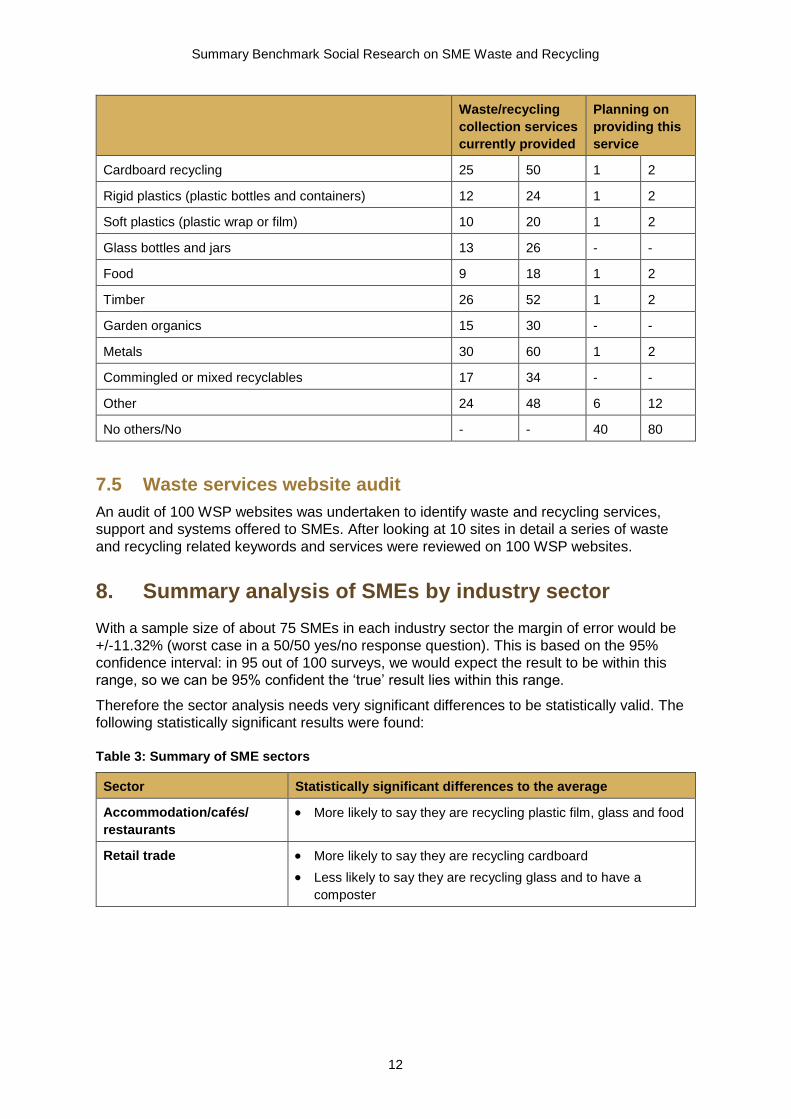
Cardboard recycling 25 50 1 2
Rigid plastics (plastic bottles and containers) 12 24 1 2
Soft plastics (plastic wrap or film) 10 20 1 2
Glass bottles and jars 13 26 - -
Food 9 18 1 2
Timber 26 52 1 2
Garden organics 15 30 - -
Metals 30 60 1 2
Commingled or mixed recyclables 17 34 - -
Other 24 48 6 12
No others/No - - 40 80
7.5 Waste services website audit
An audit of 100 WSP websites was undertaken to identify waste and recycling services,
support and systems offered to SMEs. After looking at 10 sites in detail a series of waste
and recycling related keywords and services were reviewed on 100 WSP websites.
8. Summary analysis of SMEs by industry sector
With a sample size of about 75 SMEs in each industry sector the margin of error would be
+/-11.32% (worst case in a 50/50 yes/no response question). This is based on the 95%
confidence interval: in 95 out of 100 surveys, we would expect the result to be within this
range, so we can be 95% confident the ‘true’ result lies within this range.
Therefore the sector analysis needs very significant differences to be statistically valid. The
following statistically significant results were found:
Table 3: Summary of SME sectors
Sector Statistically significant differences to the average
Accommodation/cafés/
restaurants
More likely to say they are recycling plastic film, glass and food
Retail trade More likely to say they are recycling cardboard
Less likely to say they are recycling glass and to have a
composter
13
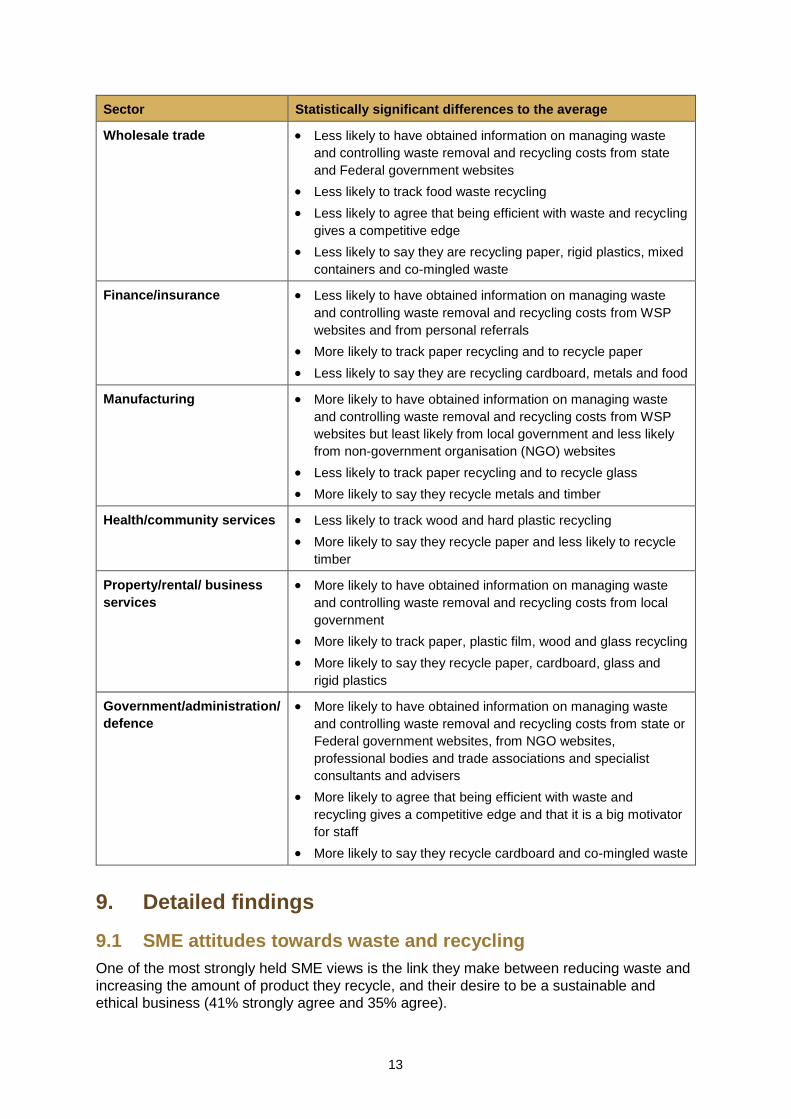
Sector Statistically significant differences to the average
Wholesale trade Less likely to have obtained information on managing waste
and controlling waste removal and recycling costs from state
and Federal government websites
Less likely to track food waste recycling
Less likely to agree that being efficient with waste and recycling
gives a competitive edge
Less likely to say they are recycling paper, rigid plastics, mixed
containers and co-mingled waste
Finance/insurance Less likely to have obtained information on managing waste
and controlling waste removal and recycling costs from WSP
websites and from personal referrals
More likely to track paper recycling and to recycle paper
Less likely to say they are recycling cardboard, metals and food
Manufacturing More likely to have obtained information on managing waste
and controlling waste removal and recycling costs from WSP
websites but least likely from local government and less likely
from non-government organisation (NGO) websites
Less likely to track paper recycling and to recycle glass
More likely to say they recycle metals and timber
Health/community services Less likely to track wood and hard plastic recycling
More likely to say they recycle paper and less likely to recycle
timber
Property/rental/ business
services
More likely to have obtained information on managing waste
and controlling waste removal and recycling costs from local
government
More likely to track paper, plastic film, wood and glass recycling
More likely to say they recycle paper, cardboard, glass and
rigid plastics
Government/administration/
defence
More likely to have obtained information on managing waste
and controlling waste removal and recycling costs from state or
Federal government websites, from NGO websites,
professional bodies and trade associations and specialist
consultants and advisers
More likely to agree that being efficient with waste and
recycling gives a competitive edge and that it is a big motivator
for staff
More likely to say they recycle cardboard and co-mingled waste
9. Detailed findings
9.1 SME attitudes towards waste and recycling
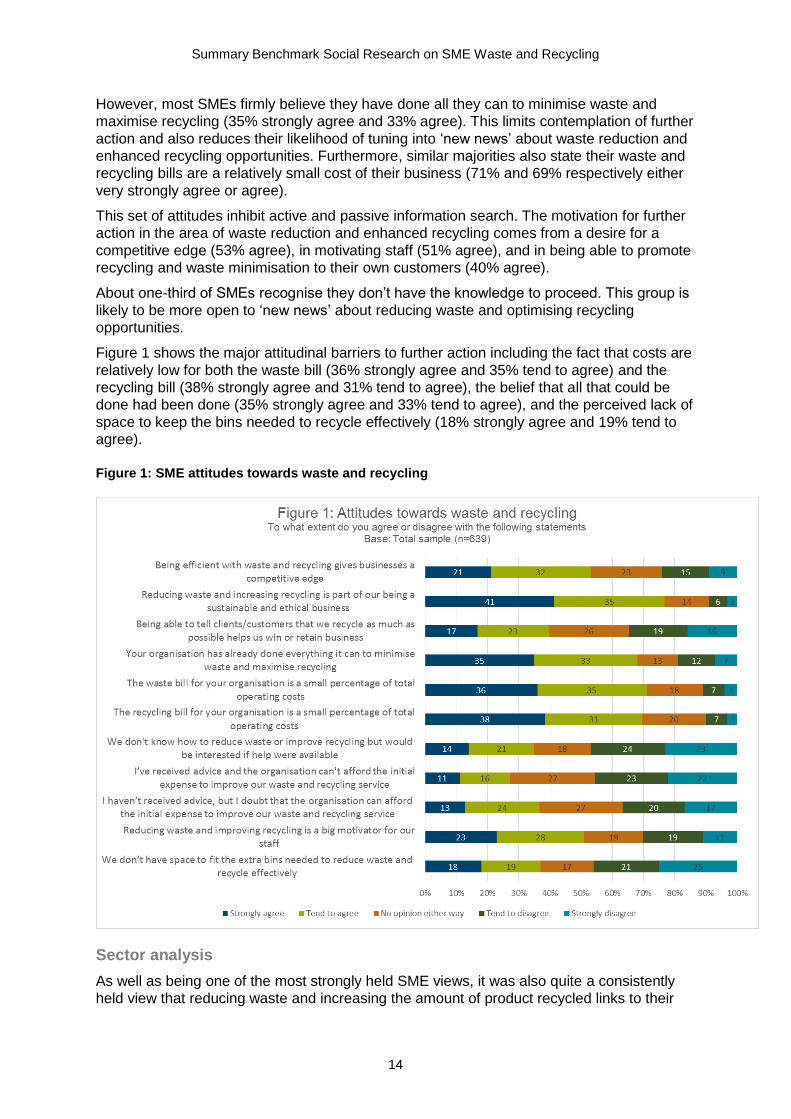
One of the most strongly held SME views is the link they make between reducing waste and
increasing the amount of product they recycle, and their desire to be a sustainable and
ethical business (41% strongly agree and 35% agree).
Summary Benchmark Social Research on SME Waste and Recycling
14
However, most SMEs firmly believe they have done all they can to minimise waste and
maximise recycling (35% strongly agree and 33% agree). This limits contemplation of further
action and also reduces their likelihood of tuning into ‘new news’ about waste reduction and
enhanced recycling opportunities. Furthermore, similar majorities also state their waste and
recycling bills are a relatively small cost of their business (71% and 69% respectively either
very strongly agree or agree).
This set of attitudes inhibit active and passive information search. The motivation for further
action in the area of waste reduction and enhanced recycling comes from a desire for a
competitive edge (53% agree), in motivating staff (51% agree), and in being able to promote
recycling and waste minimisation to their own customers (40% agree).
About one-third of SMEs recognise they don’t have the knowledge to proceed. This group is
likely to be more open to ‘new news’ about reducing waste and optimising recycling
opportunities.
Figure 1 shows the major attitudinal barriers to further action including the fact that costs are
relatively low for both the waste bill (36% strongly agree and 35% tend to agree) and the
recycling bill (38% strongly agree and 31% tend to agree), the belief that all that could be
done had been done (35% strongly agree and 33% tend to agree), and the perceived lack of
space to keep the bins needed to recycle effectively (18% strongly agree and 19% tend to
agree).
Figure 1: SME attitudes towards waste and recycling
Sector analysis
As well as being one of the most strongly held SME views, it was also quite a consistently
held view that reducing waste and increasing the amount of product recycled links to their
15
desire to be a sustainable and ethical business. Government administration held this view
most strongly (12% over the average). Also highly consistent across the sectors was the
view that they have done everything they can to minimise waste and maximise recycling.
Furthermore, similar consistency was also found across all sectors regarding the opinion
that the waste and recycling bills are a relatively small cost of business. With the costs of
waste management and recycling perceived to be low it is likely this contributes to the
relatively high levels of satisfaction with the status quo. The motivators for further action in
the area of waste reduction and enhanced recycling comes from a desire for a competitive
edge (also consistent across sectors except for wholesale trade which was 11% below the
SME average), in motivating staff (government/administration/defence sector, 12% above
the SME average) and in being able to promote recycling and waste minimisation to their
own customers (of more value to the accommodation/café/restaurant sector and
property/rental/business services sector which are both 7% above the SME average).
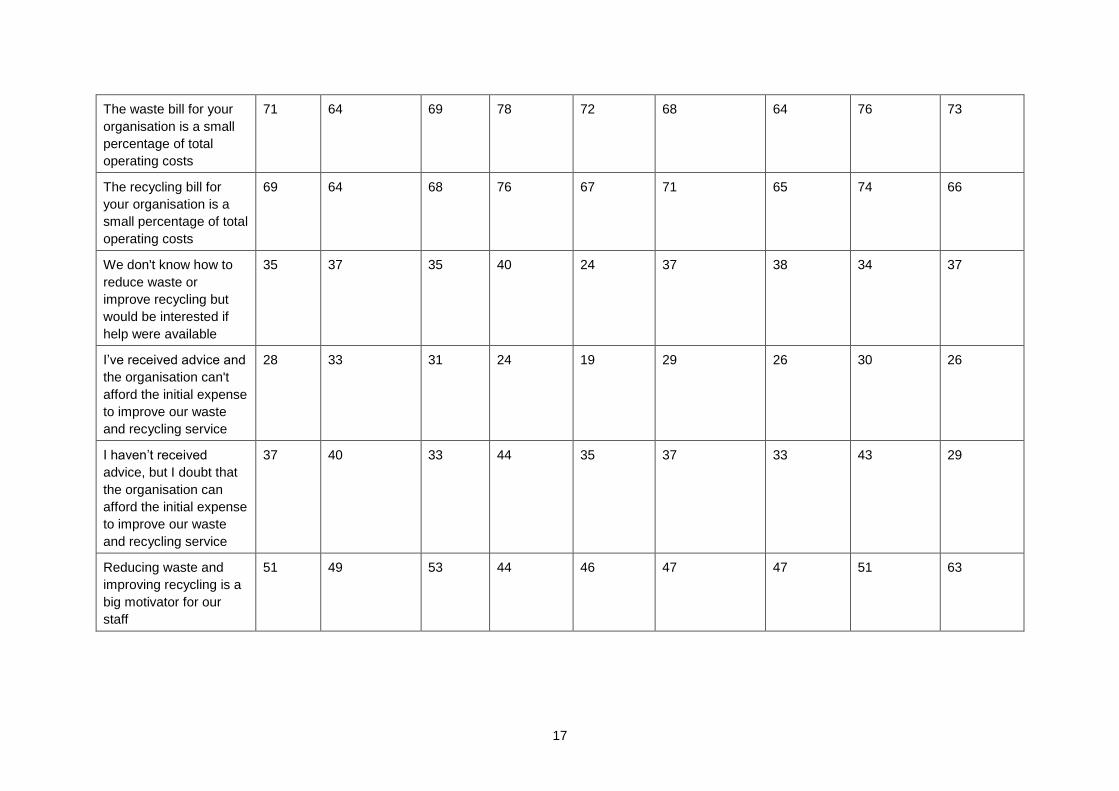
Table 4 shows that one key attitudinal barrier to further action was the lack of space to keep
the bins needed to recycle effectively (key for the health and community services sector
which rated this 8% above the SME average) and also the doubt that SMEs were able to
commit to investing in this area (as evidenced by agreement with the statement that, ‘despite
not having received advice the respondent doubted whether they could afford the initial
expense to improve waste and recycling’. This was mentioned as a barrier more frequently
by the wholesale trade sector at 7% above the SME average).
Summary Benchmark Social Research on SME Waste and Recycling
16
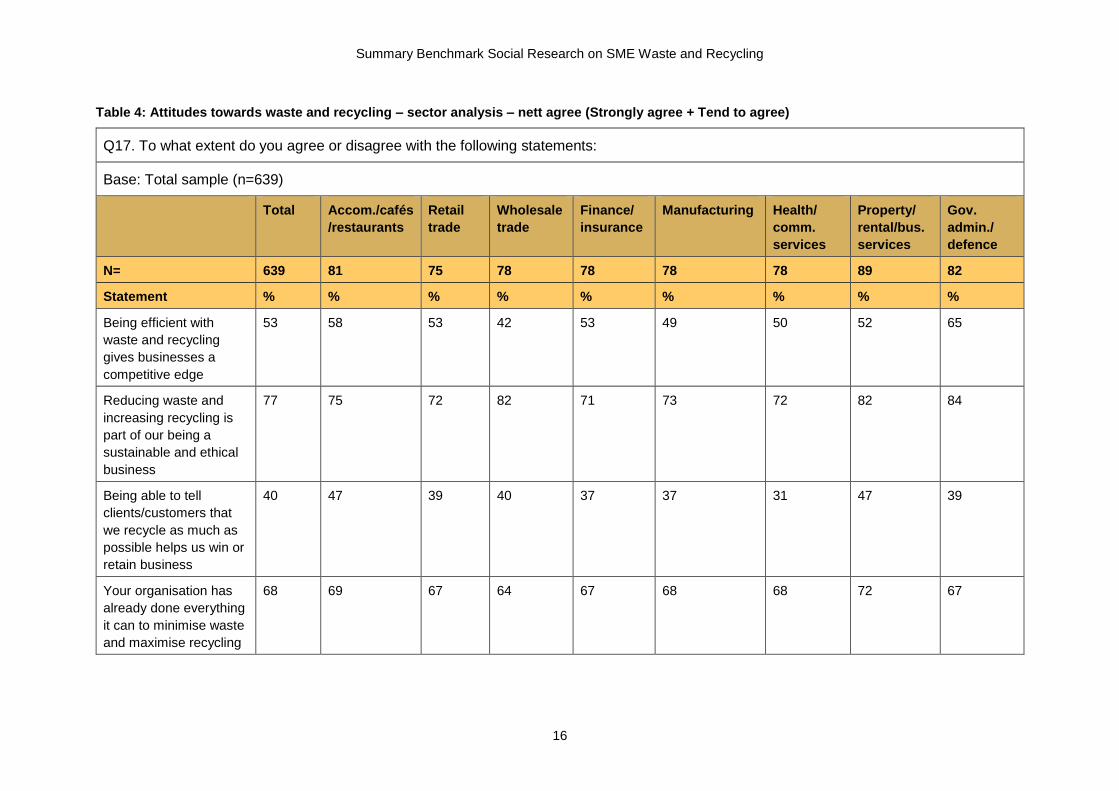
Table 4: Attitudes towards waste and recycling – sector analysis – nett agree (Strongly agree + Tend to agree)
Q17. To what extent do you agree or disagree with the following statements:
Base: Total sample (n=639)
Total Accom./cafés
/restaurants
Retail
trade
Wholesale
trade
Finance/
insurance
Manufacturing Health/
comm.
services
Property/
rental/bus.
services
Gov.
admin./
defence
N= 639 81 75 78 78 78 78 89 82
Statement % % % % % % % % %
Being efficient with
waste and recycling
gives businesses a
competitive edge
53 58 53 42 53 49 50 52 65
Reducing waste and
increasing recycling is
part of our being a
sustainable and ethical
business
77 75 72 82 71 73 72 82 84
Being able to tell
clients/customers that
we recycle as much as
possible helps us win or
retain business
40 47 39 40 37 37 31 47 39
Your organisation has
already done everything
it can to minimise waste
and maximise recycling
68 69 67 64 67 68 68 72 67
17
The waste bill for your
organisation is a small
percentage of total
operating costs
71 64 69 78 72 68 64 76 73
The recycling bill for
your organisation is a
small percentage of total
operating costs
69 64 68 76 67 71 65 74 66
We don't know how to
reduce waste or
improve recycling but
would be interested if
help were available
35 37 35 40 24 37 38 34 37
I’ve received advice and
the organisation can't
afford the initial expense
to improve our waste
and recycling service
28 33 31 24 19 29 26 30 26
I haven’t received
advice, but I doubt that
the organisation can
afford the initial expense
to improve our waste
and recycling service
37 40 33 44 35 37 33 43 29
Reducing waste and
improving recycling is a
big motivator for our
staff
51 49 53 44 46 47 47 51 63
Summary Benchmark Social Research on SME Waste and Recycling
18
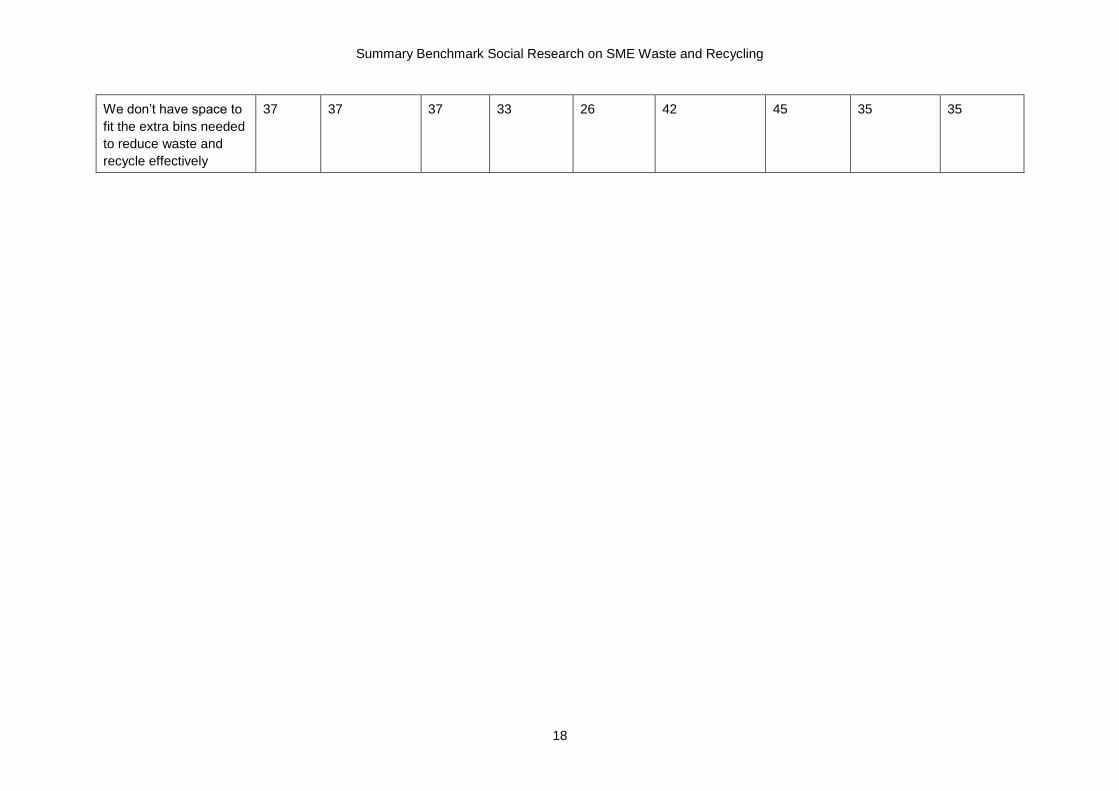
We don’t have space to
fit the extra bins needed
to reduce waste and
recycle effectively
37 37 37 33 26 42 45 35 35
19
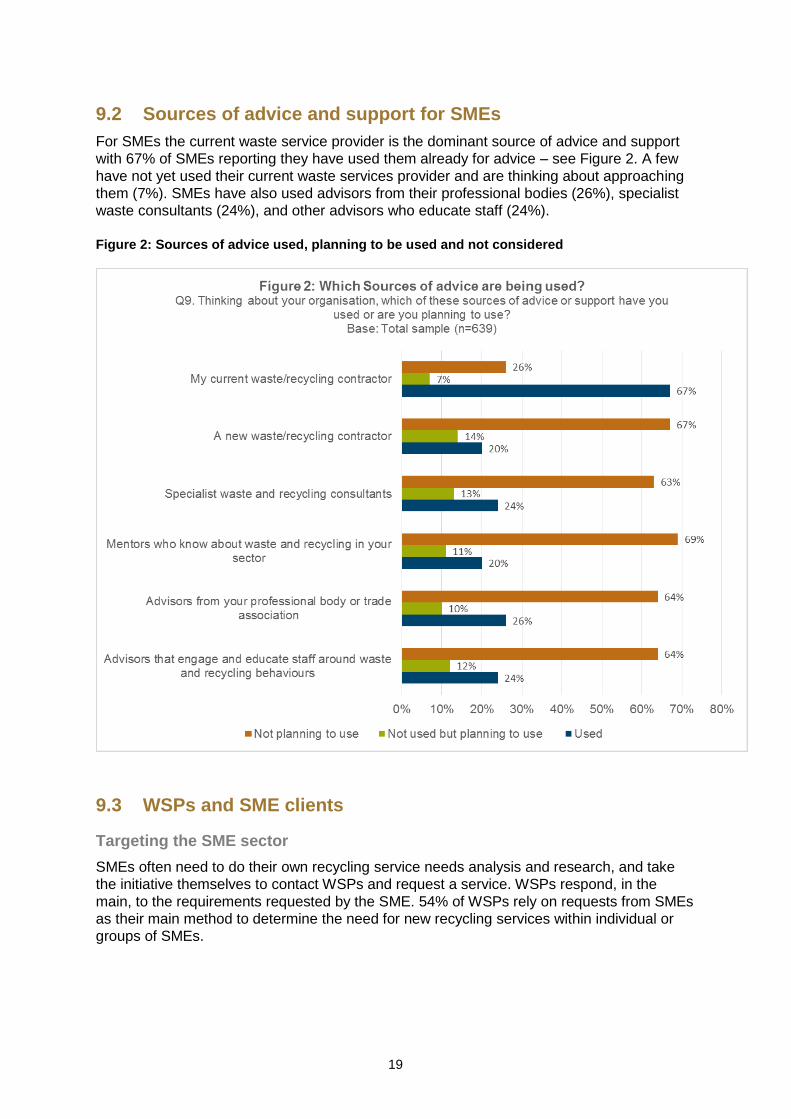
9.2 Sources of advice and support for SMEs
For SMEs the current waste service provider is the dominant source of advice and support
with 67% of SMEs reporting they have used them already for advice – see Figure 2. A few
have not yet used their current waste services provider and are thinking about approaching
them (7%). SMEs have also used advisors from their professional bodies (26%), specialist
waste consultants (24%), and other advisors who educate staff (24%).
Figure 2: Sources of advice used, planning to be used and not considered
9.3 WSPs and SME clients
Targeting the SME sector
SMEs often need to do their own recycling service needs analysis and research, and take
the initiative themselves to contact WSPs and request a service. WSPs respond, in the
main, to the requirements requested by the SME. 54% of WSPs rely on requests from SMEs
as their main method to determine the need for new recycling services within individual or
groups of SMEs.
Summary Benchmark Social Research on SME Waste and Recycling
20
How do WSPs provide information to SMEs?
WSPs surveyed report a heavy reliance on the use of their own website to communicate to
SMEs about reducing waste, contamination and increasing recycling (38% mentioned this as
their method of providing information).
The next tier of channels to reach SMEs rely heavily on local and state government
information sources, both mentioned by 36% of WSPs.
The third tier of channels used relate to face-to-face conversations and email alerts (32%
and 24% respectively) and then by fact sheets and information packs and handouts (20%
and 16% respectively).
Other NGO websites and specialist consultants form the fourth tier of information channels
used by WSPs to inform SMEs.
The website audit conducted as part of this study found that WSPs appear to rely heavily on
their sales representatives and not on their website to provide information and to promote
their services for SMEs. 69% of the WSP websites audited offered no waste reduction or
recycling education services for SMEs. Only three in ten WSP websites provided booking
services for SMEs.
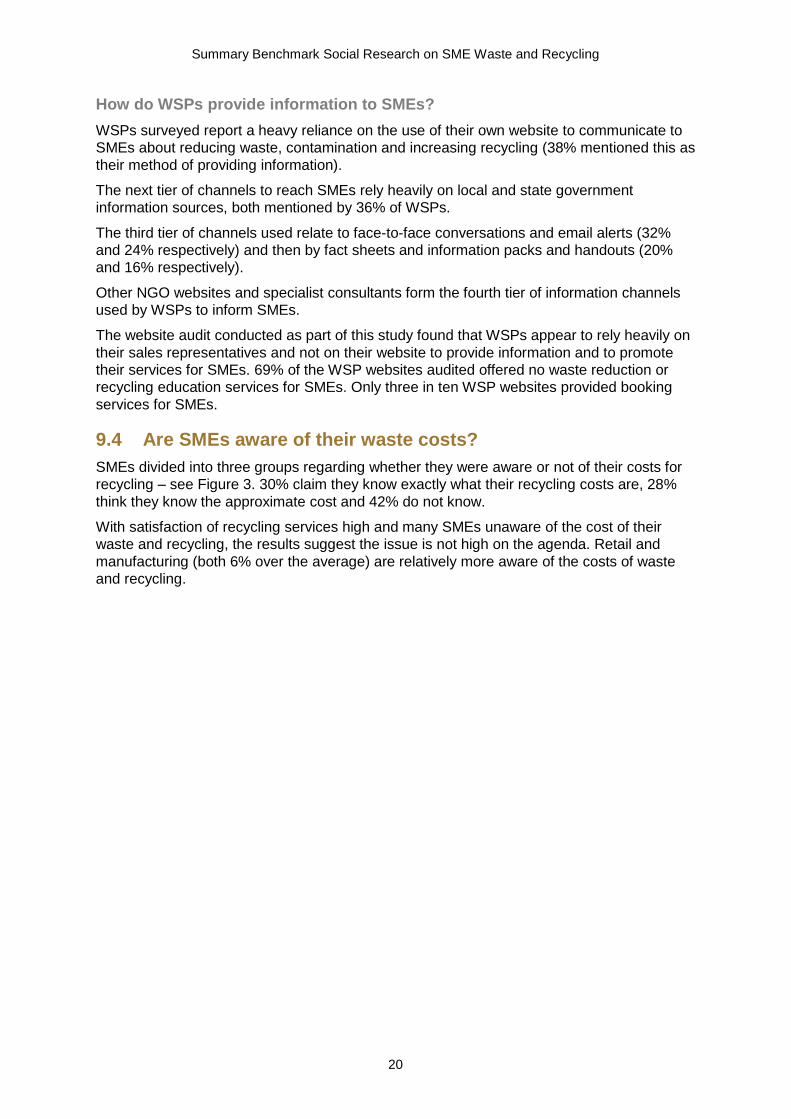
9.4 Are SMEs aware of their waste costs?
SMEs divided into three groups regarding whether they were aware or not of their costs for
recycling – see Figure 3. 30% claim they know exactly what their recycling costs are, 28%
think they know the approximate cost and 42% do not know.
With satisfaction of recycling services high and many SMEs unaware of the cost of their
waste and recycling, the results suggest the issue is not high on the agenda. Retail and
manufacturing (both 6% over the average) are relatively more aware of the costs of waste
and recycling.
21
Figure 3: Awareness of recycling and waste costs
9.5 Do SMEs monitor their waste and recycling?
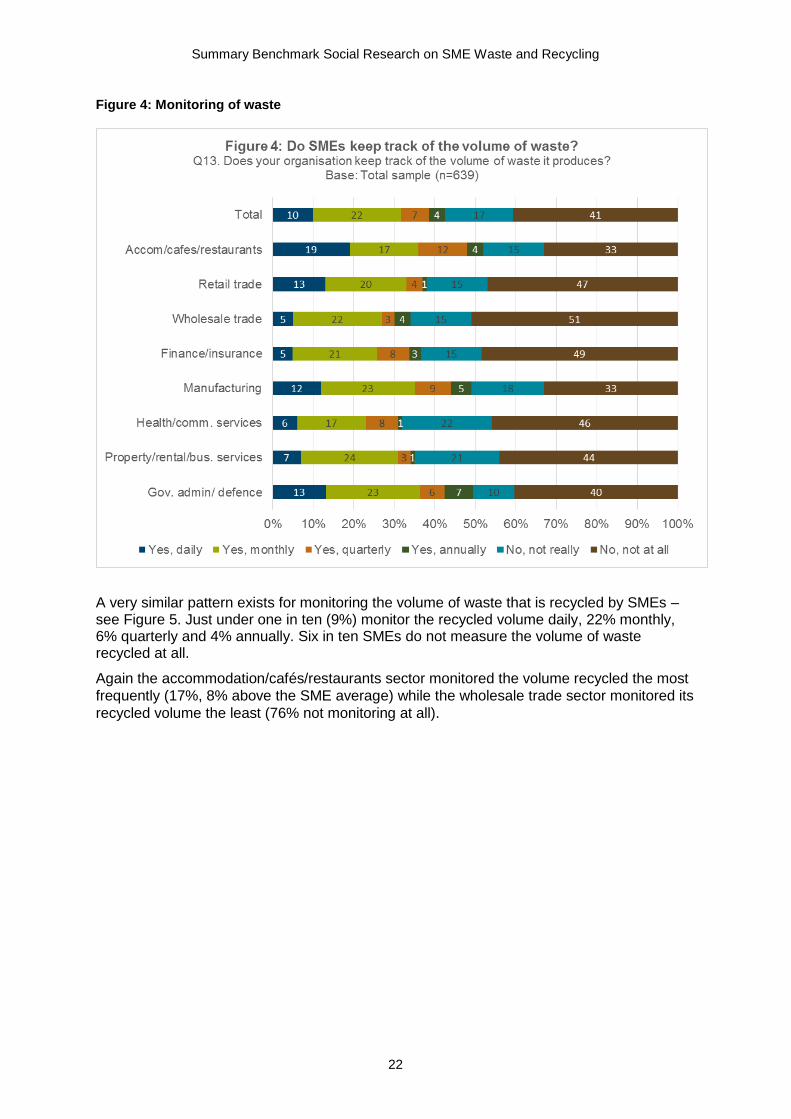
As shown in Figure 4, 10% SMEs are constantly vigilant in regard to the waste they produce.
Almost another quarter (22%) monitor it monthly, 7% quarterly and 4% annually. However
58% keep virtually no records. Failure to understand the quantity of waste and to monitor it
is another factor that is contributing to low levels of searching for and using information to
better manage waste and recycling.
Accommodation/cafés/restaurants is the sector with the greatest focus on monitoring waste
with 19% monitoring it daily (9% above the SME average).
The sectors least likely to monitor the volume of waste are health and community services
(68%), wholesale trade (66%), property/rentals/business services (65%) and
finance/insurance (64%).
Summary Benchmark Social Research on SME Waste and Recycling
22
Figure 4: Monitoring of waste
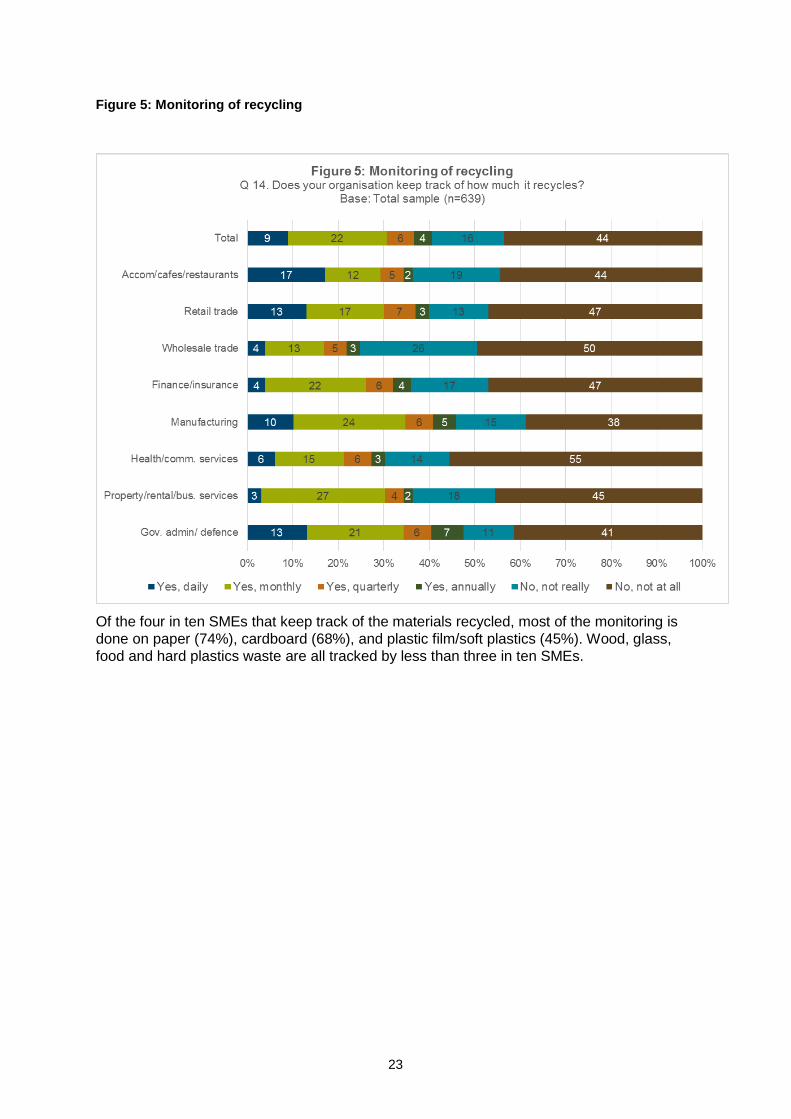
A very similar pattern exists for monitoring the volume of waste that is recycled by SMEs – see Figure 5. Just under one in ten (9%) monitor the recycled volume daily, 22% monthly, 6% quarterly and 4% annually. Six in ten SMEs do not measure the volume of waste recycled at all.
Again the accommodation/cafés/restaurants sector monitored the volume recycled the most
frequently (17%, 8% above the SME average) while the wholesale trade sector monitored its
recycled volume the least (76% not monitoring at all).
23
Figure 5: Monitoring of recycling
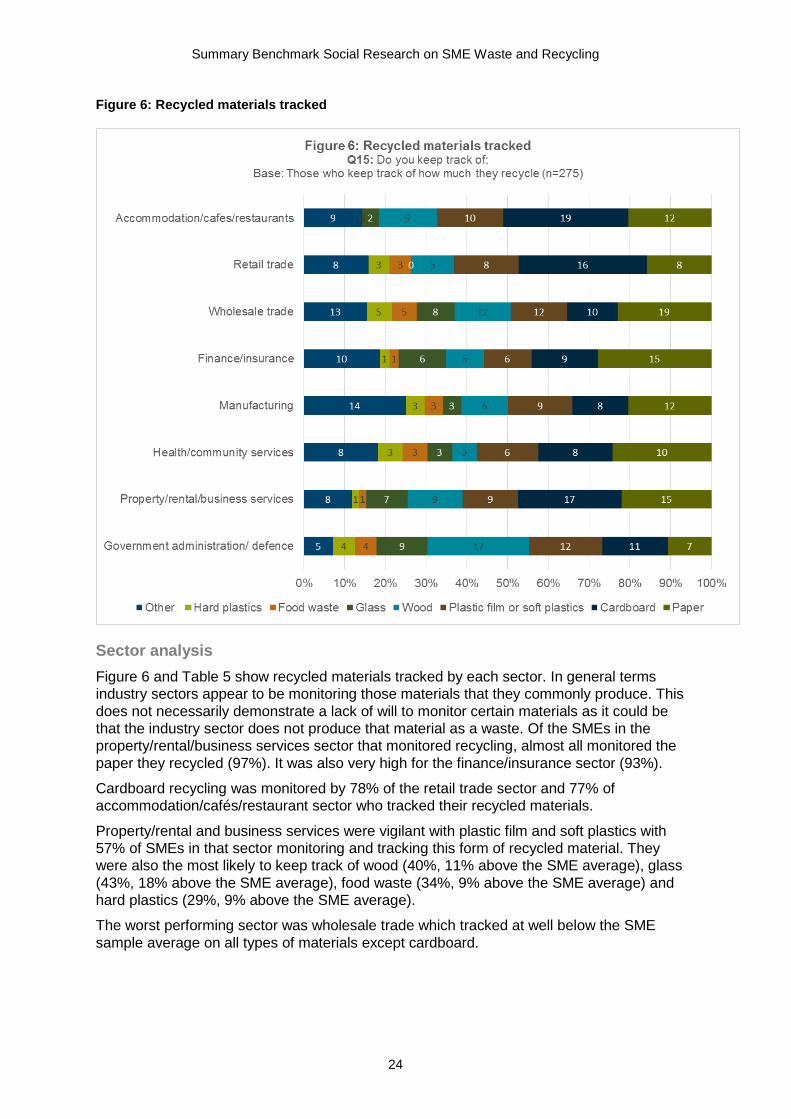
Of the four in ten SMEs that keep track of the materials recycled, most of the monitoring is
done on paper (74%), cardboard (68%), and plastic film/soft plastics (45%). Wood, glass,
food and hard plastics waste are all tracked by less than three in ten SMEs.
Summary Benchmark Social Research on SME Waste and Recycling
24
Figure 6: Recycled materials tracked
Sector analysis
Figure 6 and Table 5 show recycled materials tracked by each sector. In general terms
industry sectors appear to be monitoring those materials that they commonly produce. This
does not necessarily demonstrate a lack of will to monitor certain materials as it could be
that the industry sector does not produce that material as a waste. Of the SMEs in the
property/rental/business services sector that monitored recycling, almost all monitored the
paper they recycled (97%). It was also very high for the finance/insurance sector (93%).
Cardboard recycling was monitored by 78% of the retail trade sector and 77% of
accommodation/cafés/restaurant sector who tracked their recycled materials.
Property/rental and business services were vigilant with plastic film and soft plastics with
57% of SMEs in that sector monitoring and tracking this form of recycled material. They
were also the most likely to keep track of wood (40%, 11% above the SME average), glass
(43%, 18% above the SME average), food waste (34%, 9% above the SME average) and
hard plastics (29%, 9% above the SME average).
The worst performing sector was wholesale trade which tracked at well below the SME
sample average on all types of materials except cardboard.
25
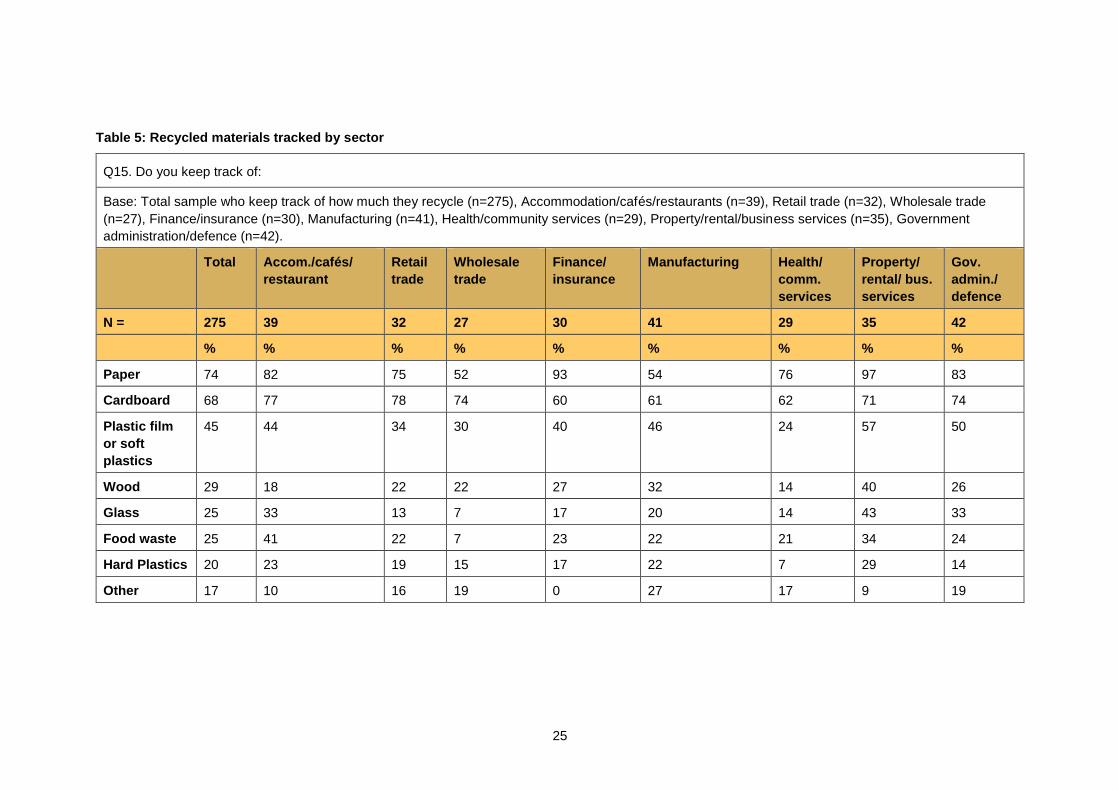
Table 5: Recycled materials tracked by sector
Q15. Do you keep track of:
Base: Total sample who keep track of how much they recycle (n=275), Accommodation/cafés/restaurants (n=39), Retail trade (n=32), Wholesale trade
(n=27), Finance/insurance (n=30), Manufacturing (n=41), Health/community services (n=29), Property/rental/business services (n=35), Government
administration/defence (n=42).
Total Accom./cafés/
restaurant
Retail
trade
Wholesale
trade
Finance/
insurance
Manufacturing Health/
comm.
services
Property/
rental/ bus.
services
Gov.
admin./
defence
N = 275 39 32 27 30 41 29 35 42
% % % % % % % % %
Paper 74 82 75 52 93 54 76 97 83
Cardboard 68 77 78 74 60 61 62 71 74
Plastic film
or soft
plastics
45 44 34 30 40 46 24 57 50
Wood 29 18 22 22 27 32 14 40 26
Glass 25 33 13 7 17 20 14 43 33
Food waste 25 41 22 7 23 22 21 34 24
Hard Plastics 20 23 19 15 17 22 7 29 14
Other 17 10 16 19 0 27 17 9 19
Summary Benchmark Social Research on SME Waste and Recycling
26
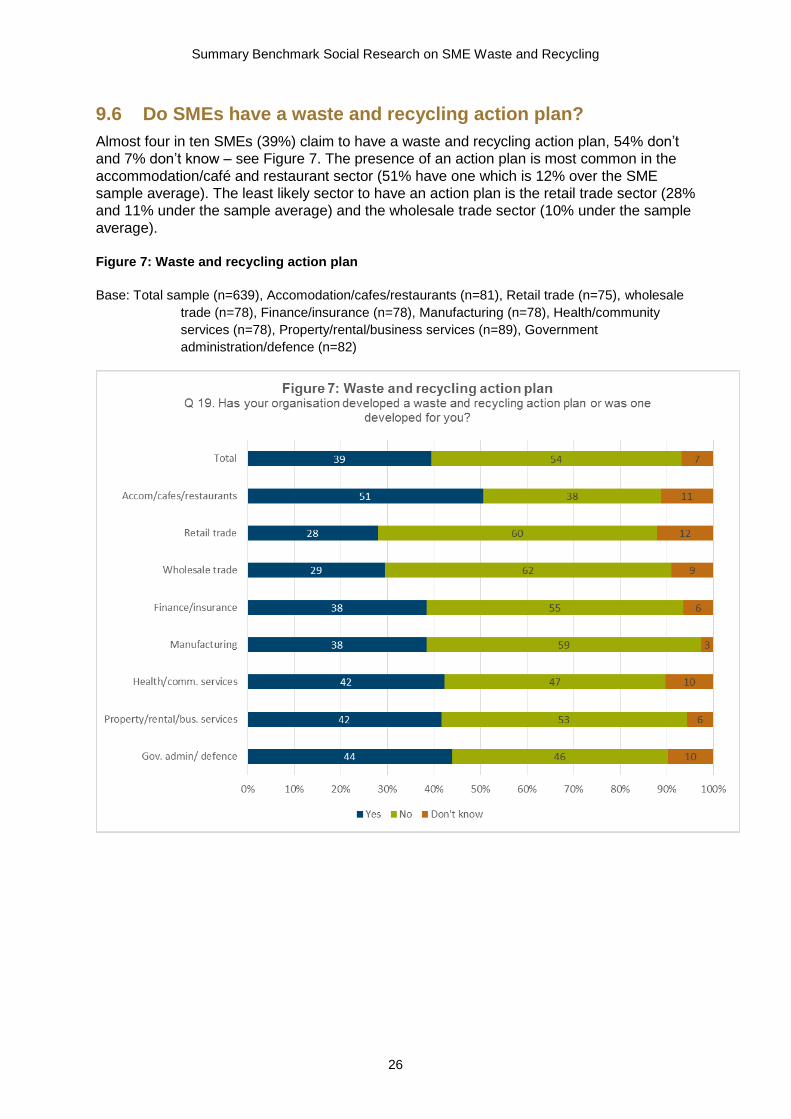
9.6 Do SMEs have a waste and recycling action plan?
Almost four in ten SMEs (39%) claim to have a waste and recycling action plan, 54% don’t
and 7% don’t know – see Figure 7. The presence of an action plan is most common in the
accommodation/café and restaurant sector (51% have one which is 12% over the SME
sample average). The least likely sector to have an action plan is the retail trade sector (28%
and 11% under the sample average) and the wholesale trade sector (10% under the sample
average).
Figure 7: Waste and recycling action plan
Base: Total sample (n=639), Accomodation/cafes/restaurants (n=81), Retail trade (n=75), wholesale
trade (n=78), Finance/insurance (n=78), Manufacturing (n=78), Health/community
services (n=78), Property/rental/business services (n=89), Government
administration/defence (n=82)
27
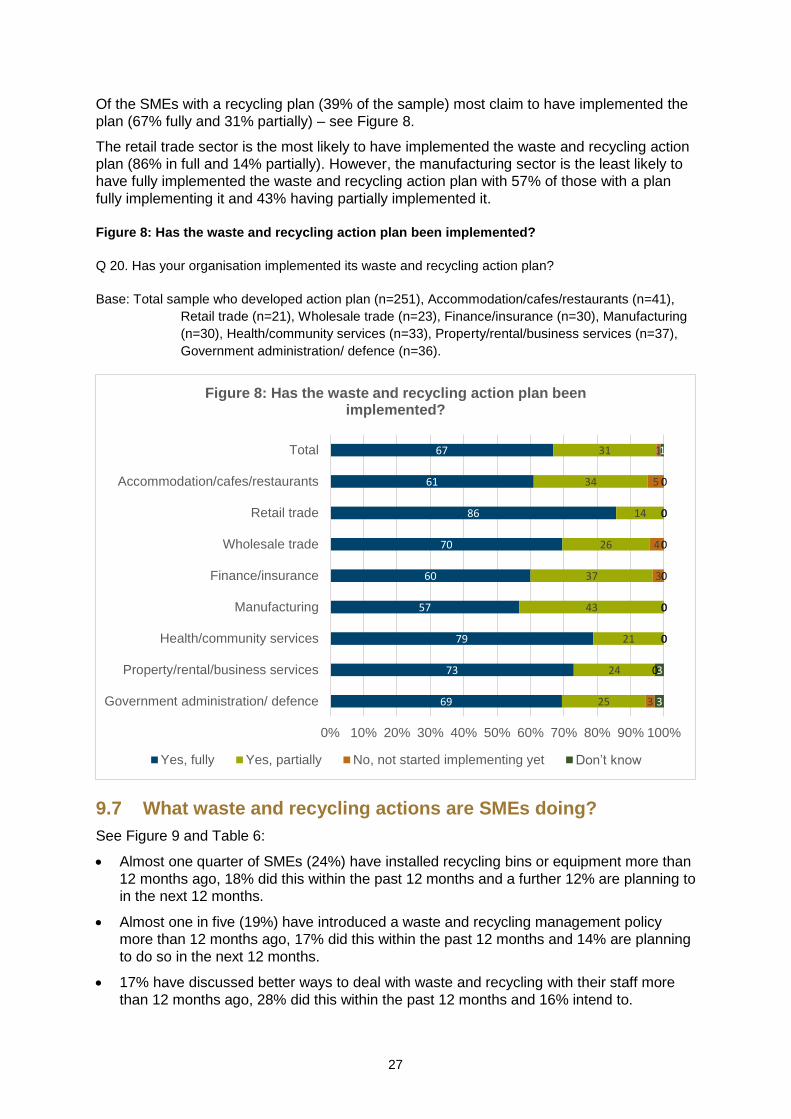
Of the SMEs with a recycling plan (39% of the sample) most claim to have implemented the
plan (67% fully and 31% partially) – see Figure 8.
The retail trade sector is the most likely to have implemented the waste and recycling action
plan (86% in full and 14% partially). However, the manufacturing sector is the least likely to
have fully implemented the waste and recycling action plan with 57% of those with a plan
fully implementing it and 43% having partially implemented it.
Figure 8: Has the waste and recycling action plan been implemented?
Q 20. Has your organisation implemented its waste and recycling action plan?
Base: Total sample who developed action plan (n=251), Accommodation/cafes/restaurants (n=41),
Retail trade (n=21), Wholesale trade (n=23), Finance/insurance (n=30), Manufacturing
(n=30), Health/community services (n=33), Property/rental/business services (n=37),
Government administration/ defence (n=36).
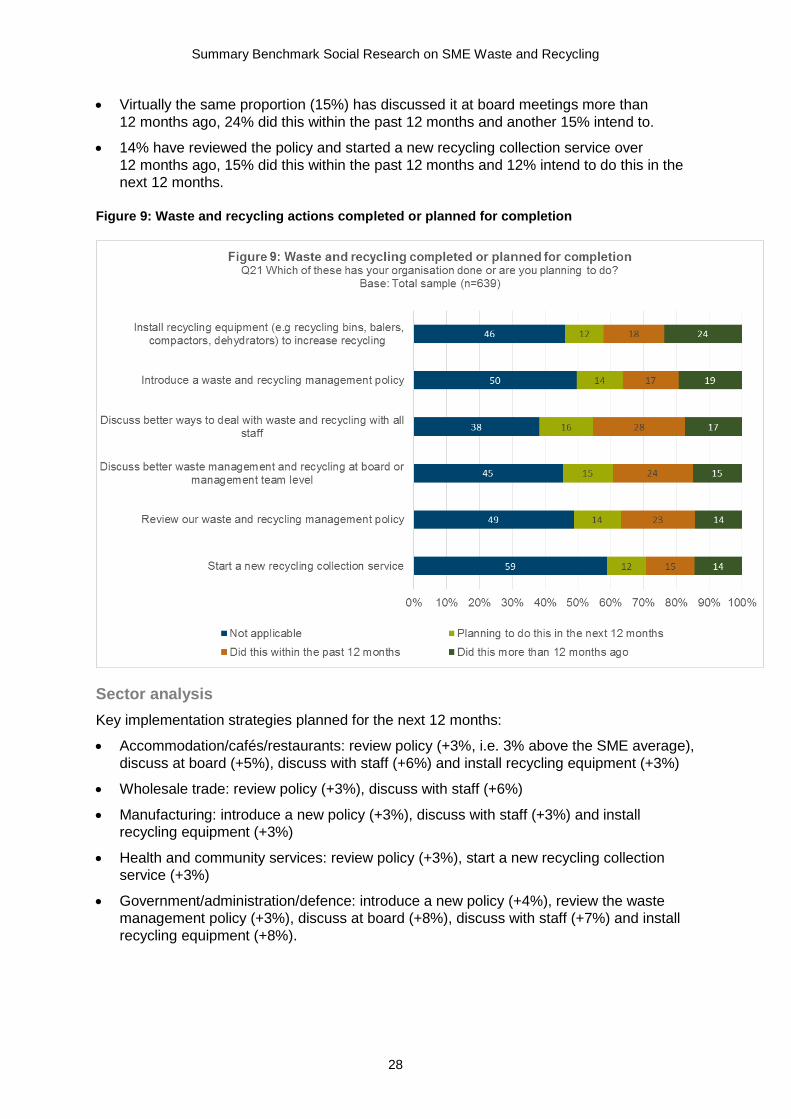
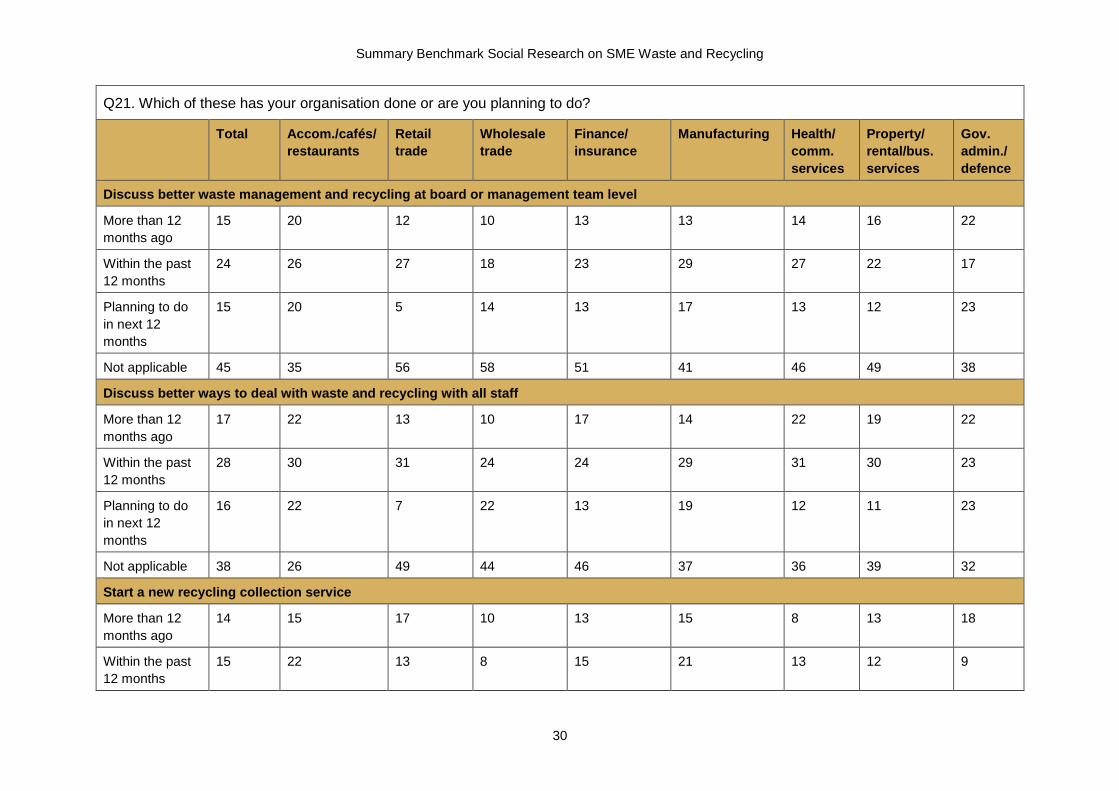
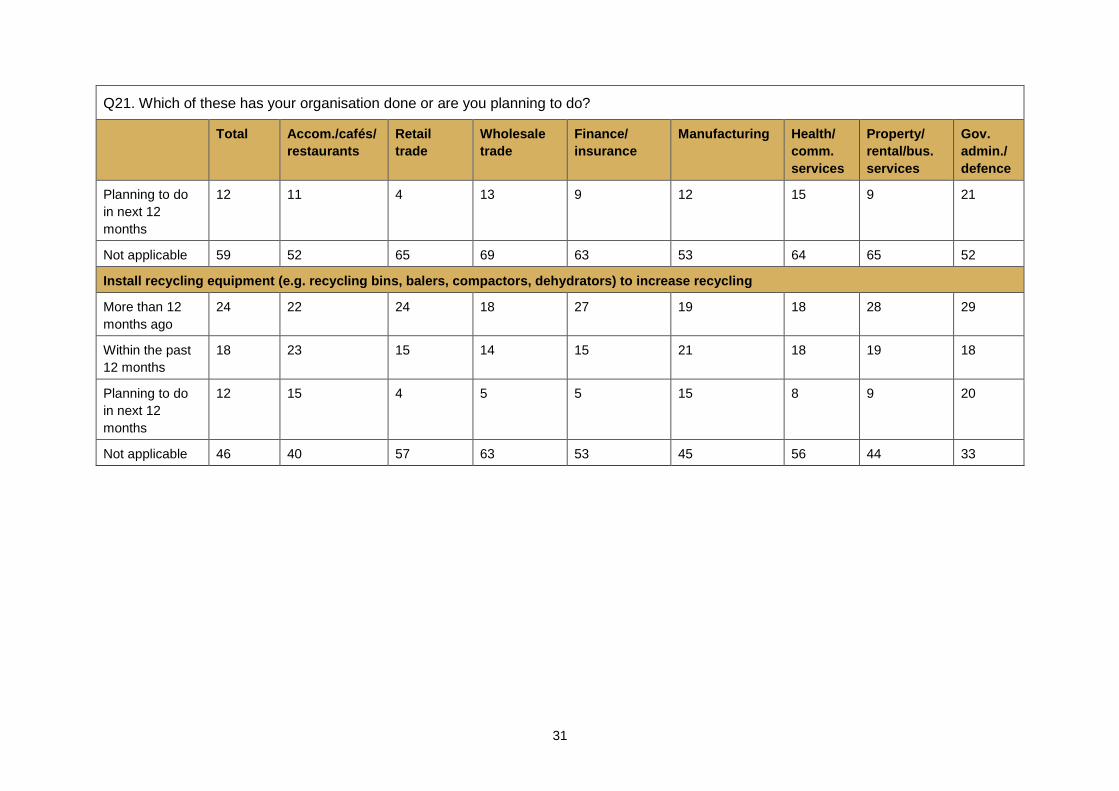
9.7 What waste and recycling actions are SMEs doing?
See Figure 9 and Table 6:
Almost one quarter of SMEs (24%) have installed recycling bins or equipment more than
12 months ago, 18% did this within the past 12 months and a further 12% are planning to
in the next 12 months.
Almost one in five (19%) have introduced a waste and recycling management policy
more than 12 months ago, 17% did this within the past 12 months and 14% are planning
to do so in the next 12 months.
17% have discussed better ways to deal with waste and recycling with their staff more
than 12 months ago, 28% did this within the past 12 months and 16% intend to.
69
73
79
57
60
70
86
61
67
25
24
21
43
37
26
14
34
31
3
0
0
0
3
4
0
5
1
3
3
0
0
0
0
0
0
1
0% 10% 20% 30% 40% 50% 60% 70% 80% 90% 100%
Government administration/ defence
Property/rental/business services
Health/community services
Manufacturing
Finance/insurance
Wholesale trade
Retail trade
Accommodation/cafes/restaurants
Total
Figure 8: Has the waste and recycling action plan been implemented?
Yes, fully Yes, partially No, not started implementing yet Don’t know
Summary Benchmark Social Research on SME Waste and Recycling
28
Virtually the same proportion (15%) has discussed it at board meetings more than
12 months ago, 24% did this within the past 12 months and another 15% intend to.
14% have reviewed the policy and started a new recycling collection service over
12 months ago, 15% did this within the past 12 months and 12% intend to do this in the
next 12 months.
Figure 9: Waste and recycling actions completed or planned for completion
Sector analysis
Key implementation strategies planned for the next 12 months:
Accommodation/cafés/restaurants: review policy (+3%, i.e. 3% above the SME average),
discuss at board (+5%), discuss with staff (+6%) and install recycling equipment (+3%)
Wholesale trade: review policy (+3%), discuss with staff (+6%)
Manufacturing: introduce a new policy (+3%), discuss with staff (+3%) and install
recycling equipment (+3%)
Health and community services: review policy (+3%), start a new recycling collection
service (+3%)
Government/administration/defence: introduce a new policy (+4%), review the waste
management policy (+3%), discuss at board (+8%), discuss with staff (+7%) and install
recycling equipment (+8%).
29
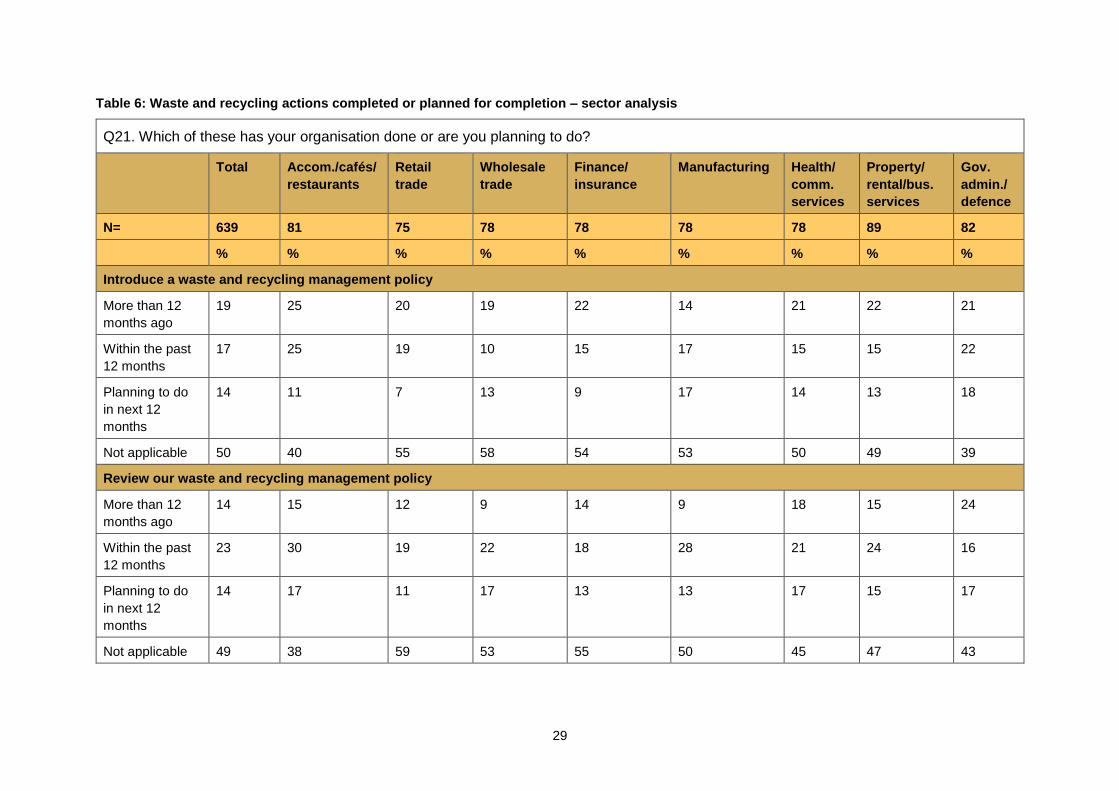
Table 6: Waste and recycling actions completed or planned for completion – sector analysis
Q21. Which of these has your organisation done or are you planning to do?
Total Accom./cafés/
restaurants
Retail
trade
Wholesale
trade
Finance/
insurance
Manufacturing Health/
comm.
services
Property/
rental/bus.
services
Gov.
admin./
defence
N= 639 81 75 78 78 78 78 89 82
% % % % % % % % %
Introduce a waste and recycling management policy
More than 12
months ago
19 25 20 19 22 14 21 22 21
Within the past
12 months
17 25 19 10 15 17 15 15 22
Planning to do
in next 12
months
14 11 7 13 9 17 14 13 18
Not applicable 50 40 55 58 54 53 50 49 39
Review our waste and recycling management policy
More than 12
months ago
14 15 12 9 14 9 18 15 24
Within the past
12 months
23 30 19 22 18 28 21 24 16
Planning to do
in next 12
months
14 17 11 17 13 13 17 15 17
Not applicable 49 38 59 53 55 50 45 47 43
Summary Benchmark Social Research on SME Waste and Recycling
30
Q21. Which of these has your organisation done or are you planning to do?
Total Accom./cafés/
restaurants
Retail
trade
Wholesale
trade
Finance/
insurance
Manufacturing Health/
comm.
services
Property/
rental/bus.
services
Gov.
admin./
defence
Discuss better waste management and recycling at board or management team level
More than 12
months ago
15 20 12 10 13 13 14 16 22
Within the past
12 months
24 26 27 18 23 29 27 22 17
Planning to do
in next 12
months
15 20 5 14 13 17 13 12 23
Not applicable 45 35 56 58 51 41 46 49 38
Discuss better ways to deal with waste and recycling with all staff
More than 12
months ago
17 22 13 10 17 14 22 19 22
Within the past
12 months
28 30 31 24 24 29 31 30 23
Planning to do
in next 12
months
16 22 7 22 13 19 12 11 23
Not applicable 38 26 49 44 46 37 36 39 32
Start a new recycling collection service
More than 12
months ago
14 15 17 10 13 15 8 13 18
Within the past
12 months
15 22 13 8 15 21 13 12 9
31
Q21. Which of these has your organisation done or are you planning to do?
Total Accom./cafés/
restaurants
Retail
trade
Wholesale
trade
Finance/
insurance
Manufacturing Health/
comm.
services
Property/
rental/bus.
services
Gov.
admin./
defence
Planning to do
in next 12
months
12 11 4 13 9 12 15 9 21
Not applicable 59 52 65 69 63 53 64 65 52
Install recycling equipment (e.g. recycling bins, balers, compactors, dehydrators) to increase recycling
More than 12
months ago
24 22 24 18 27 19 18 28 29
Within the past
12 months
18 23 15 14 15 21 18 19 18
Planning to do
in next 12
months
12 15 4 5 5 15 8 9 20
Not applicable 46 40 57 63 53 45 56 44 33
Summary Benchmark Social Research on SME Waste and Recycling
32
9.8 What do SMEs think are their barriers to further waste reduction and recycling?
In the preliminary interviews that led to the development of this benchmark survey, SMEs
reported time pressures as being the number one barrier to making more changes regarding
their waste reduction and recycling improvements.
In other recent research conducted by Instinct and Reason in unrelated areas with SMEs for
both state and Federal government agencies, financial barriers consistently feature
prominently with many SMEs reporting the challenges of cash flow and poor access to
capital for funding improvements to their business.
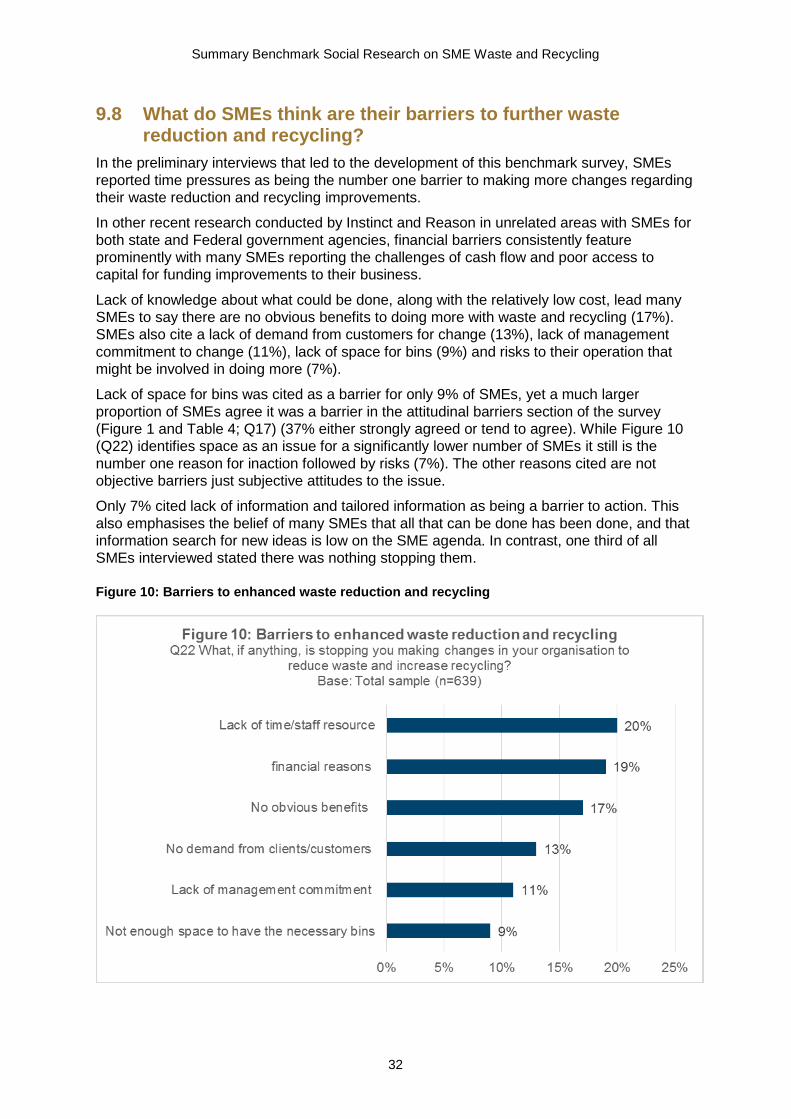
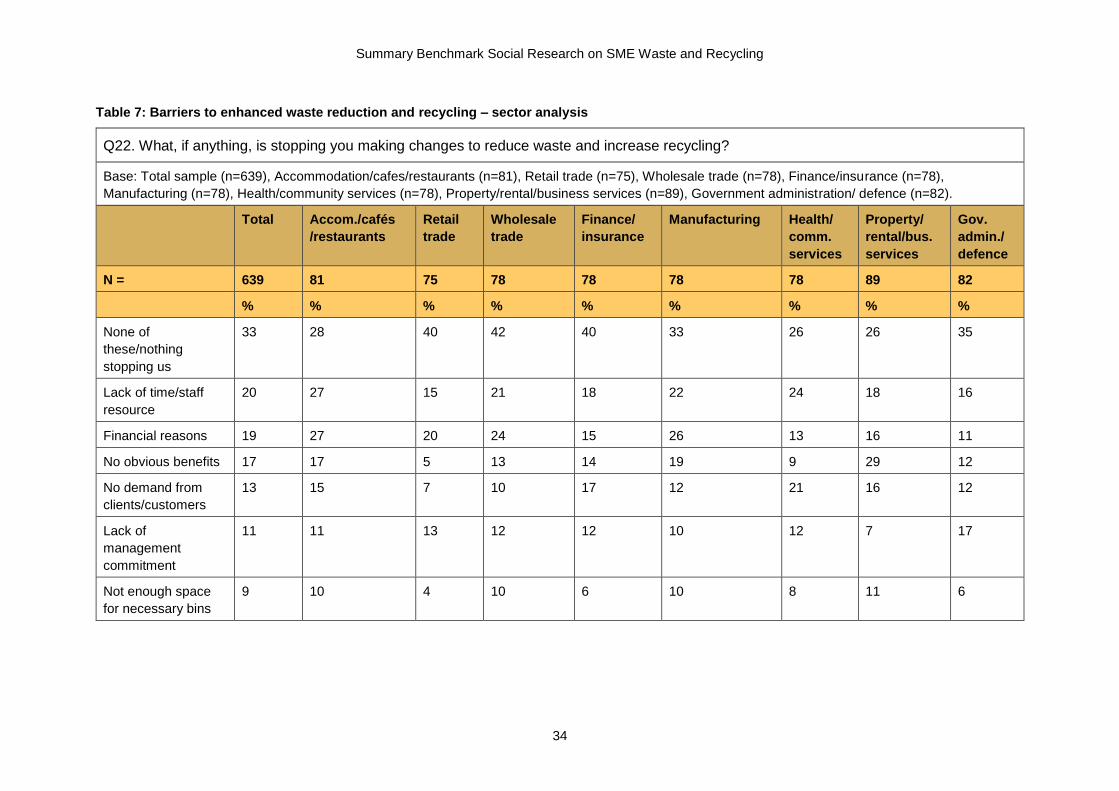
Lack of knowledge about what could be done, along with the relatively low cost, lead many
SMEs to say there are no obvious benefits to doing more with waste and recycling (17%).
SMEs also cite a lack of demand from customers for change (13%), lack of management
commitment to change (11%), lack of space for bins (9%) and risks to their operation that
might be involved in doing more (7%).
Lack of space for bins was cited as a barrier for only 9% of SMEs, yet a much larger
proportion of SMEs agree it was a barrier in the attitudinal barriers section of the survey
(Figure 1 and Table 4; Q17) (37% either strongly agreed or tend to agree). While Figure 10
(Q22) identifies space as an issue for a significantly lower number of SMEs it still is the
number one reason for inaction followed by risks (7%). The other reasons cited are not
objective barriers just subjective attitudes to the issue.
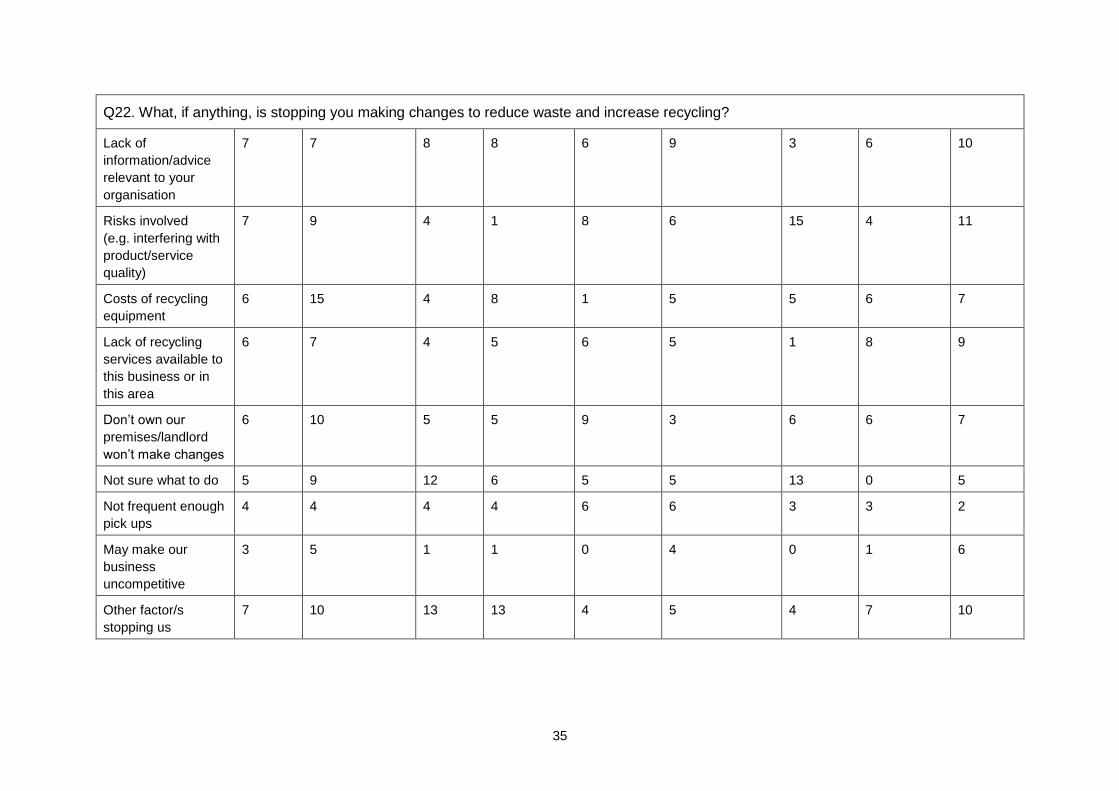
Only 7% cited lack of information and tailored information as being a barrier to action. This
also emphasises the belief of many SMEs that all that can be done has been done, and that
information search for new ideas is low on the SME agenda. In contrast, one third of all
SMEs interviewed stated there was nothing stopping them.
Figure 10: Barriers to enhanced waste reduction and recycling
33
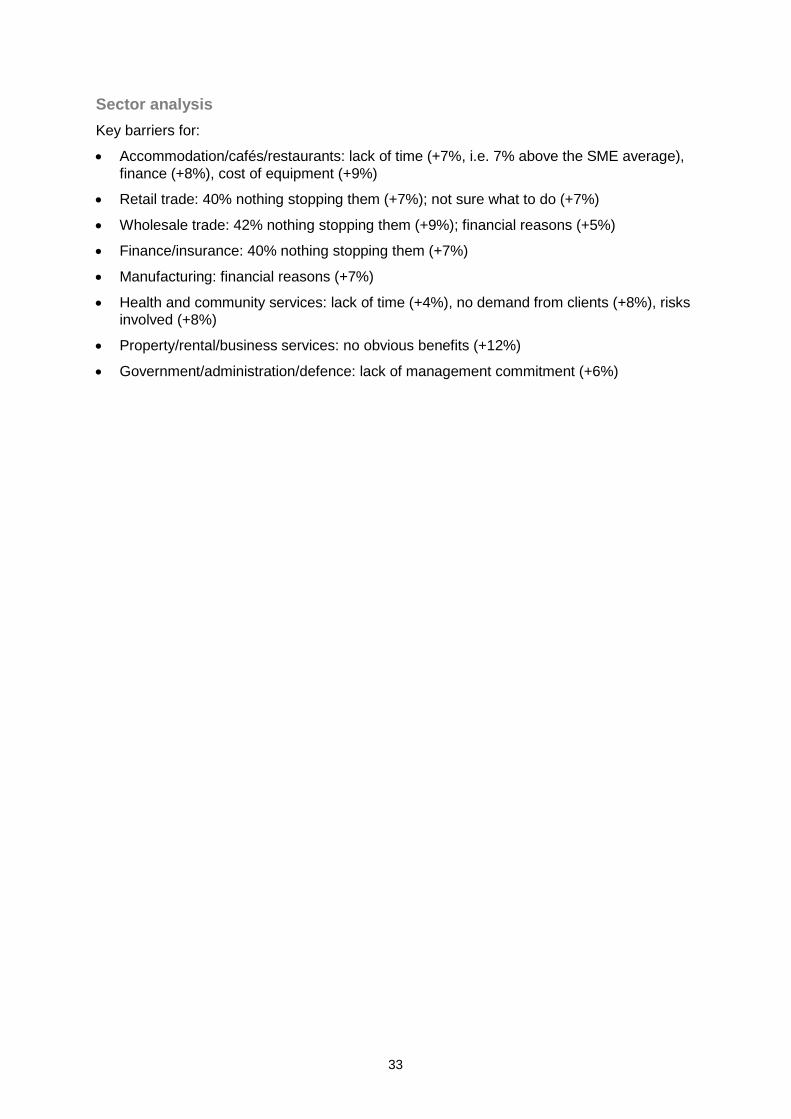
Sector analysis
Key barriers for:
Accommodation/cafés/restaurants: lack of time (+7%, i.e. 7% above the SME average),
finance (+8%), cost of equipment (+9%)
Retail trade: 40% nothing stopping them (+7%); not sure what to do (+7%)
Wholesale trade: 42% nothing stopping them (+9%); financial reasons (+5%)
Finance/insurance: 40% nothing stopping them (+7%)
Manufacturing: financial reasons (+7%)
Health and community services: lack of time (+4%), no demand from clients (+8%), risks
involved (+8%)
Property/rental/business services: no obvious benefits (+12%)
Government/administration/defence: lack of management commitment (+6%)
Summary Benchmark Social Research on SME Waste and Recycling
34
Table 7: Barriers to enhanced waste reduction and recycling – sector analysis
Q22. What, if anything, is stopping you making changes to reduce waste and increase recycling?
Base: Total sample (n=639), Accommodation/cafes/restaurants (n=81), Retail trade (n=75), Wholesale trade (n=78), Finance/insurance (n=78),
Manufacturing (n=78), Health/community services (n=78), Property/rental/business services (n=89), Government administration/ defence (n=82).
Total Accom./cafés
/restaurants
Retail
trade
Wholesale
trade
Finance/
insurance
Manufacturing Health/
comm.
services
Property/
rental/bus.
services
Gov.
admin./
defence
N = 639 81 75 78 78 78 78 89 82
% % % % % % % % %
None of
these/nothing
stopping us
33 28 40 42 40 33 26 26 35
Lack of time/staff
resource
20 27 15 21 18 22 24 18 16
Financial reasons 19 27 20 24 15 26 13 16 11
No obvious benefits 17 17 5 13 14 19 9 29 12
No demand from
clients/customers
13 15 7 10 17 12 21 16 12
Lack of
management
commitment
11 11 13 12 12 10 12 7 17
Not enough space
for necessary bins
9 10 4 10 6 10 8 11 6
35
Q22. What, if anything, is stopping you making changes to reduce waste and increase recycling?
Lack of
information/advice
relevant to your
organisation
7 7 8 8 6 9 3 6 10
Risks involved
(e.g. interfering with
product/service
quality)
7 9 4 1 8 6 15 4 11
Costs of recycling
equipment
6 15 4 8 1 5 5 6 7
Lack of recycling
services available to
this business or in
this area
6 7 4 5 6 5 1 8 9
Don’t own our
premises/landlord
won’t make changes
6 10 5 5 9 3 6 6 7
Not sure what to do 5 9 12 6 5 5 13 0 5
Not frequent enough
pick ups
4 4 4 4 6 6 3 3 2
May make our
business
uncompetitive
3 5 1 1 0 4 0 1 6
Other factor/s
stopping us
7 10 13 13 4 5 4 7 10
Summary Benchmark Social Research on SME Waste and Recycling
36
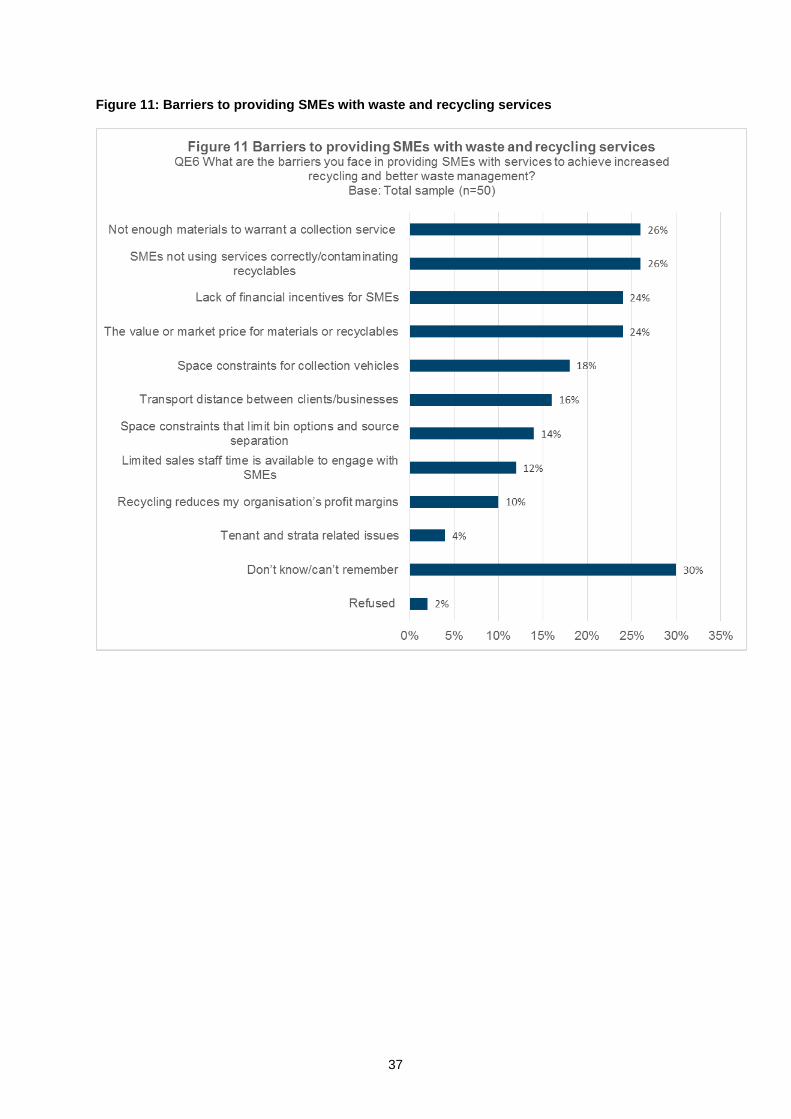
9.9 WSP barriers to providing SMEs with services to increase recycling
30% of WSPs say they either don’t know or can’t recall what barriers they face in providing
SMEs with better waste and recycling services. This might suggest that providing improved
services to SMEs is not front of mind for WSPs or that they have not investigated the
business case for or against in any detail.
The main reason WSPs hold back on services to increase recycling is the size of the pick-
up. This was mentioned by 26% of WSPs surveyed (see Figure 11).
Another key issue is that SMEs’ recycling is contaminated and this causes issues and often
results in withdrawal of services.
Again, linked to the size of the pick-up, there can be little financial incentive for SMEs to go
through the trouble of separating waste and having it recycled (mentioned by 24%). Similarly
the market price for recyclables is not driving interest for small collections (24%).
Space for collection vehicles (18%) and distance between clients (16%) are other
contributing factors that make some SME recycling unprofitable.
Finally the trouble of dealing with ‘many’ small customers can make the arrangement
unprofitable which ties in with mentions of complications caused by strata- and tenant-
related issues.
37
Figure 11: Barriers to providing SMEs with waste and recycling services
Summary Benchmark Social Research on SME Waste and Recycling
38
9.10 SMEs and recycling equipment
42% of SMEs claim to have installed new recycling equipment such as recycling bins,
balers, compactors or dehydrators in the past two years.
However, few SMEs claim to currently have significant recycling equipment in place, with
only 7% having a composter, 6% a baler, 6% a compactor and 4% a dehydrator. The
property sector was more likely than other industry sectors to have balers and compactors
than the average.
Financial reasons were cited as a barrier to further waste reduction and recycling by 19% of
SMEs. 6%of SMEs cited the specific cost of recycling equipment as a barrier to further
recycling. Just under three in ten (27%) of SMEs are open to financial assistance to install
recycling equipment and a further 28% may possibly be open to it. Those open to
purchasing equipment would use it to recycle more cardboard (80%), plastic film (74%), rigid
plastics (71%) food (64%), timber (63%) and expanded polystyrene (59%).
In particular the accommodation and restaurant/café sector would use investment in
equipment to recycle food; the retail sector for cardboard; the wholesale sector for
cardboard, plastic film and expanded polystyrene; the finance sector for timber; the health
sector for plastic film and the government sector to recycle more rigid plastics.
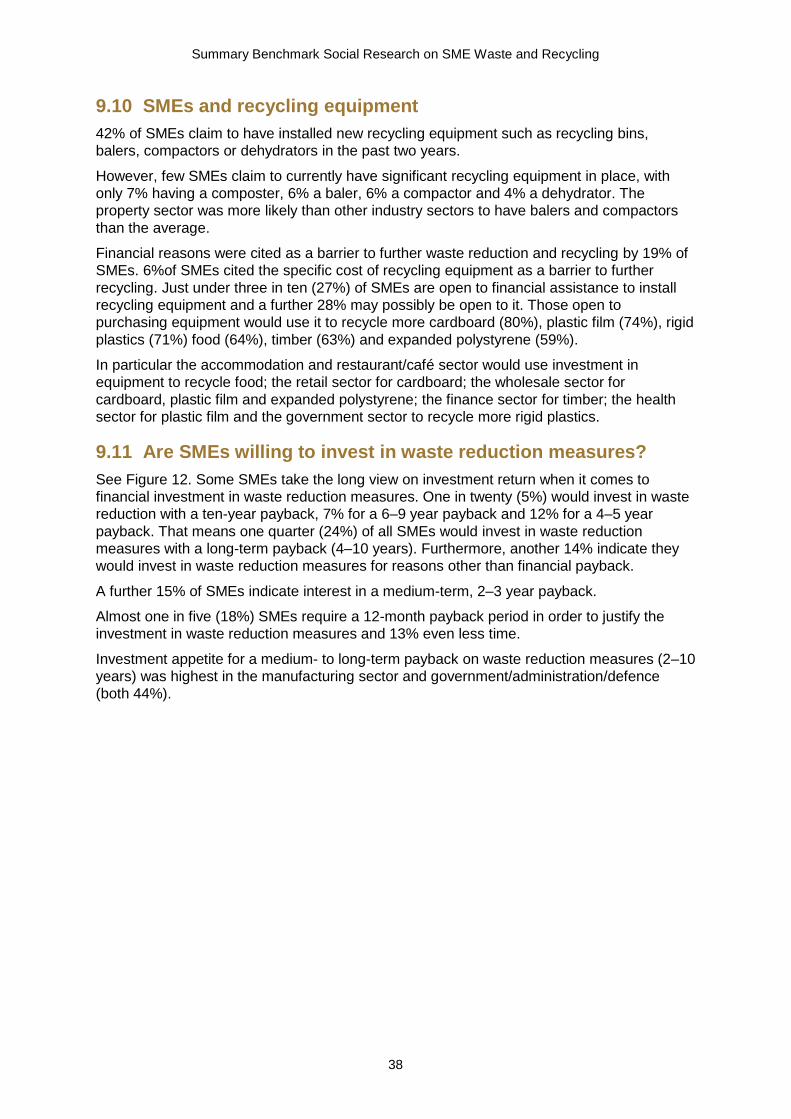
9.11 Are SMEs willing to invest in waste reduction measures?
See Figure 12. Some SMEs take the long view on investment return when it comes to
financial investment in waste reduction measures. One in twenty (5%) would invest in waste
reduction with a ten-year payback, 7% for a 6–9 year payback and 12% for a 4–5 year
payback. That means one quarter (24%) of all SMEs would invest in waste reduction
measures with a long-term payback (4–10 years). Furthermore, another 14% indicate they
would invest in waste reduction measures for reasons other than financial payback.
A further 15% of SMEs indicate interest in a medium-term, 2–3 year payback.
Almost one in five (18%) SMEs require a 12-month payback period in order to justify the
investment in waste reduction measures and 13% even less time.
Investment appetite for a medium- to long-term payback on waste reduction measures (2–10
years) was highest in the manufacturing sector and government/administration/defence
(both 44%).
39
Figure 12: Payback period for investment in waste reduction measures
Q16. If your organisation were to invest in waste reduction measures (such as a new recycling
system, or a new piece of recycling equipment like a baler), over what period of time
would you want the measure to pay for themselves?
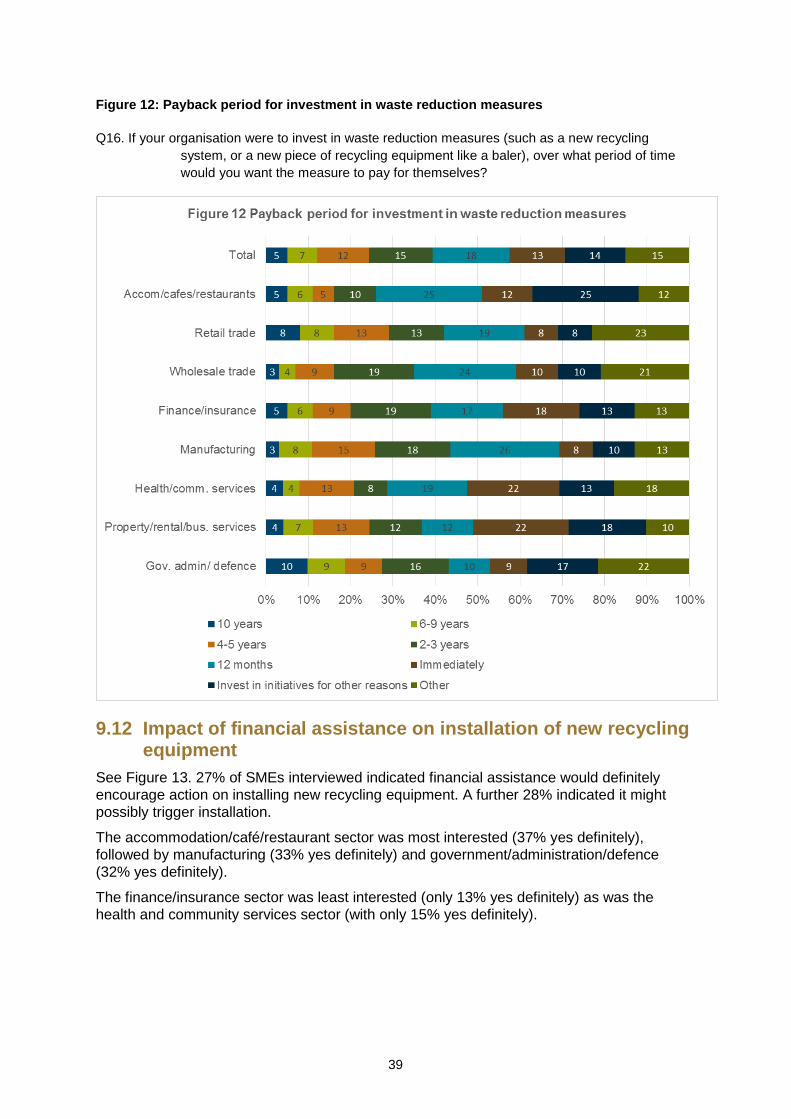
9.12 Impact of financial assistance on installation of new recycling equipment
See Figure 13. 27% of SMEs interviewed indicated financial assistance would definitely
encourage action on installing new recycling equipment. A further 28% indicated it might
possibly trigger installation.
The accommodation/café/restaurant sector was most interested (37% yes definitely),
followed by manufacturing (33% yes definitely) and government/administration/defence
(32% yes definitely).
The finance/insurance sector was least interested (only 13% yes definitely) as was the
health and community services sector (with only 15% yes definitely).
Summary Benchmark Social Research on SME Waste and Recycling
40
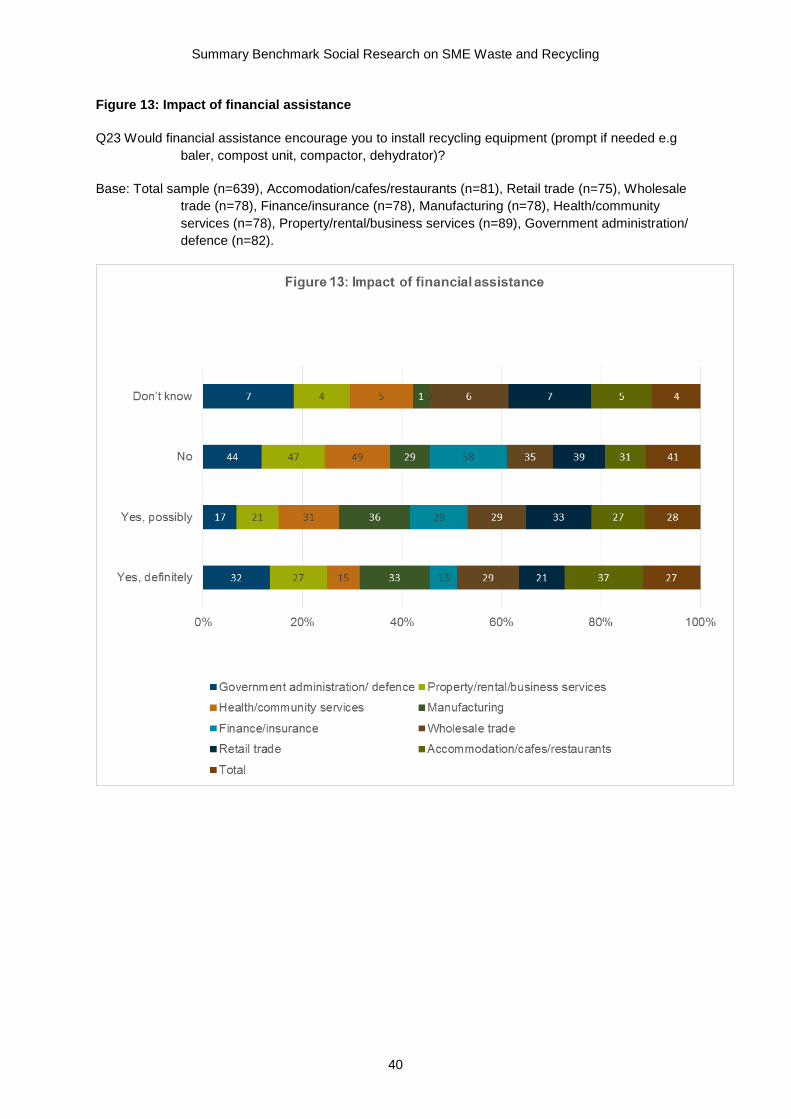
Figure 13: Impact of financial assistance
Q23 Would financial assistance encourage you to install recycling equipment (prompt if needed e.g
baler, compost unit, compactor, dehydrator)?
Base: Total sample (n=639), Accomodation/cafes/restaurants (n=81), Retail trade (n=75), Wholesale
trade (n=78), Finance/insurance (n=78), Manufacturing (n=78), Health/community
services (n=78), Property/rental/business services (n=89), Government administration/
defence (n=82).
41
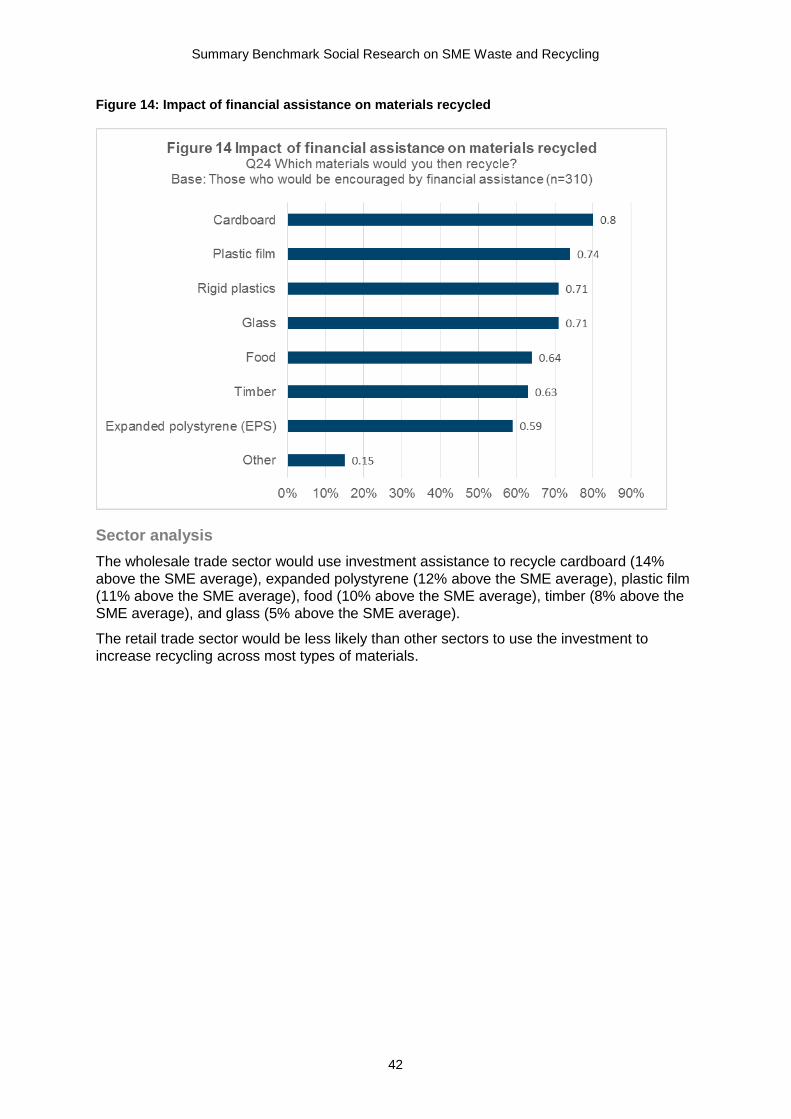
What materials would be recycled with investment support?
The new investments would be focused on the materials widely recycled already – namely
cardboard (80%), plastic film (74%) and rigid plastics (71%).
However, investment assistance is likely to lead to more of the less-recycled products being
recycled as well, with 71% of SMEs who want the investment assistance saying they would
recycle glass, 64% food, 63% timber and 59% expanded polystyrene (see Figure 14 and
Table 8).
Summary Benchmark Social Research on SME Waste and Recycling
42
Figure 14: Impact of financial assistance on materials recycled
Sector analysis
The wholesale trade sector would use investment assistance to recycle cardboard (14%
above the SME average), expanded polystyrene (12% above the SME average), plastic film
(11% above the SME average), food (10% above the SME average), timber (8% above the
SME average), and glass (5% above the SME average).
The retail trade sector would be less likely than other sectors to use the investment to
increase recycling across most types of materials.
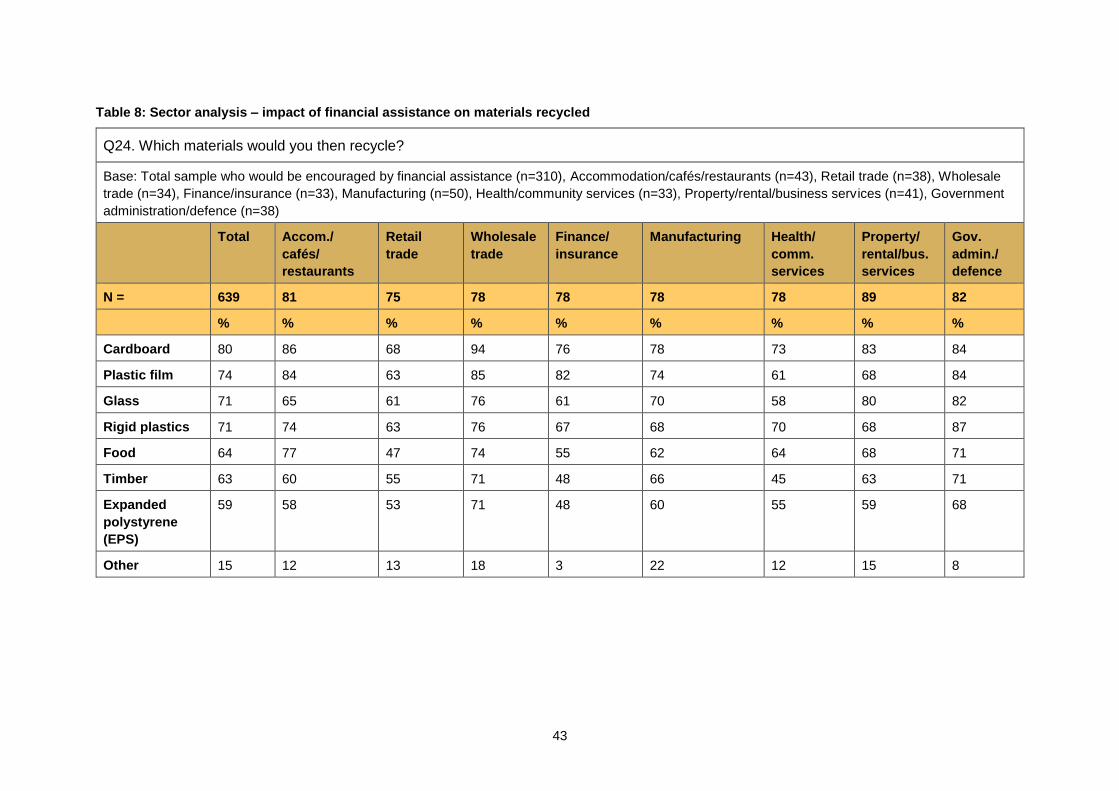
43
Table 8: Sector analysis – impact of financial assistance on materials recycled
Q24. Which materials would you then recycle?
Base: Total sample who would be encouraged by financial assistance (n=310), Accommodation/cafés/restaurants (n=43), Retail trade (n=38), Wholesale
trade (n=34), Finance/insurance (n=33), Manufacturing (n=50), Health/community services (n=33), Property/rental/business services (n=41), Government
administration/defence (n=38)
Total Accom./
cafés/
restaurants
Retail
trade
Wholesale
trade
Finance/
insurance
Manufacturing Health/
comm.
services
Property/
rental/bus.
services
Gov.
admin./
defence
N = 639 81 75 78 78 78 78 89 82
% % % % % % % % %
Cardboard 80 86 68 94 76 78 73 83 84
Plastic film 74 84 63 85 82 74 61 68 84
Glass 71 65 61 76 61 70 58 80 82
Rigid plastics 71 74 63 76 67 68 70 68 87
Food 64 77 47 74 55 62 64 68 71
Timber 63 60 55 71 48 66 45 63 71
Expanded
polystyrene
(EPS)
59 58 53 71 48 60 55 59 68
Other 15 12 13 18 3 22 12 15 8
Summary Benchmark Social Research on SME Waste and Recycling
44
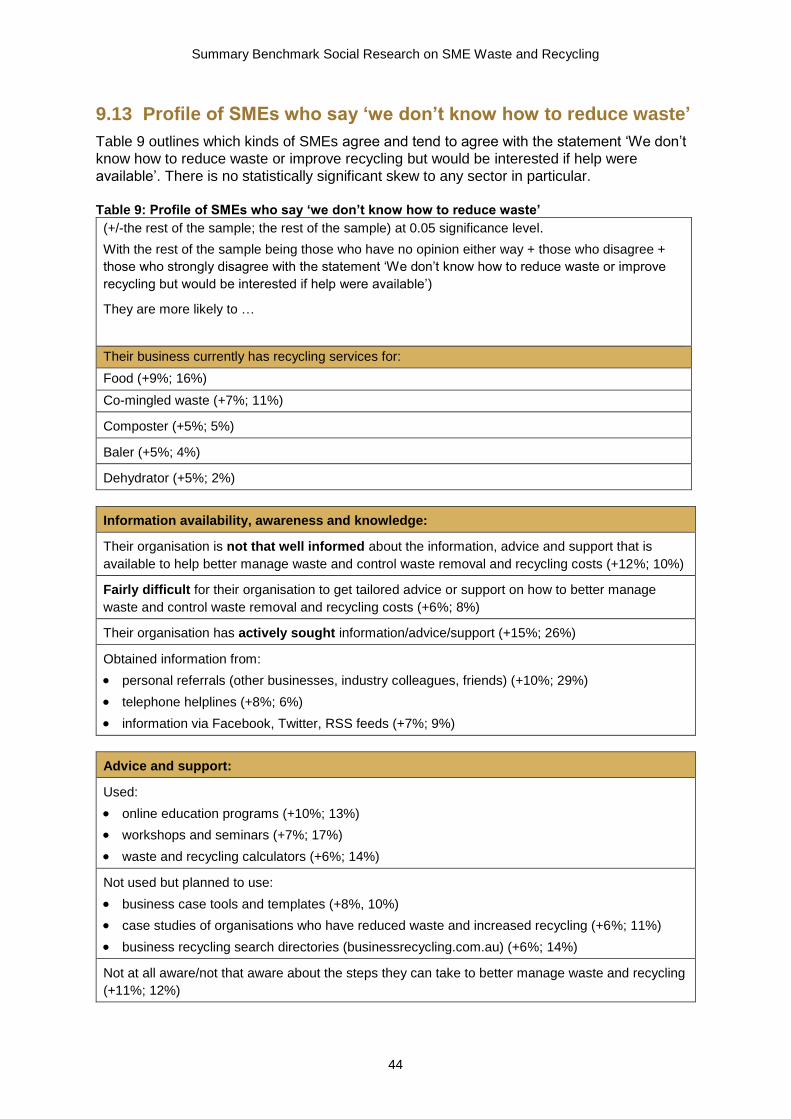
9.13 Profile of SMEs who say ‘we don’t know how to reduce waste’
Table 9 outlines which kinds of SMEs agree and tend to agree with the statement ‘We don’t
know how to reduce waste or improve recycling but would be interested if help were
available’. There is no statistically significant skew to any sector in particular.
Table 9: Profile of SMEs who say ‘we don’t know how to reduce waste’
(+/-the rest of the sample; the rest of the sample) at 0.05 significance level.
With the rest of the sample being those who have no opinion either way + those who disagree +
those who strongly disagree with the statement ‘We don’t know how to reduce waste or improve
recycling but would be interested if help were available’)
They are more likely to …
Their business currently has recycling services for:
Food (+9%; 16%)
Co-mingled waste (+7%; 11%)
Composter (+5%; 5%)
Baler (+5%; 4%)
Dehydrator (+5%; 2%)
Information availability, awareness and knowledge:
Their organisation is not that well informed about the information, advice and support that is
available to help better manage waste and control waste removal and recycling costs (+12%; 10%)
Fairly difficult for their organisation to get tailored advice or support on how to better manage
waste and control waste removal and recycling costs (+6%; 8%)
Their organisation has actively sought information/advice/support (+15%; 26%)
Obtained information from:
personal referrals (other businesses, industry colleagues, friends) (+10%; 29%)
telephone helplines (+8%; 6%)
information via Facebook, Twitter, RSS feeds (+7%; 9%)
Advice and support:
Used:
online education programs (+10%; 13%)
workshops and seminars (+7%; 17%)
waste and recycling calculators (+6%; 14%)
Not used but planned to use:
business case tools and templates (+8%, 10%)
case studies of organisations who have reduced waste and increased recycling (+6%; 11%)
business recycling search directories (businessrecycling.com.au) (+6%; 14%)
Not at all aware/not that aware about the steps they can take to better manage waste and recycling
(+11%; 12%)
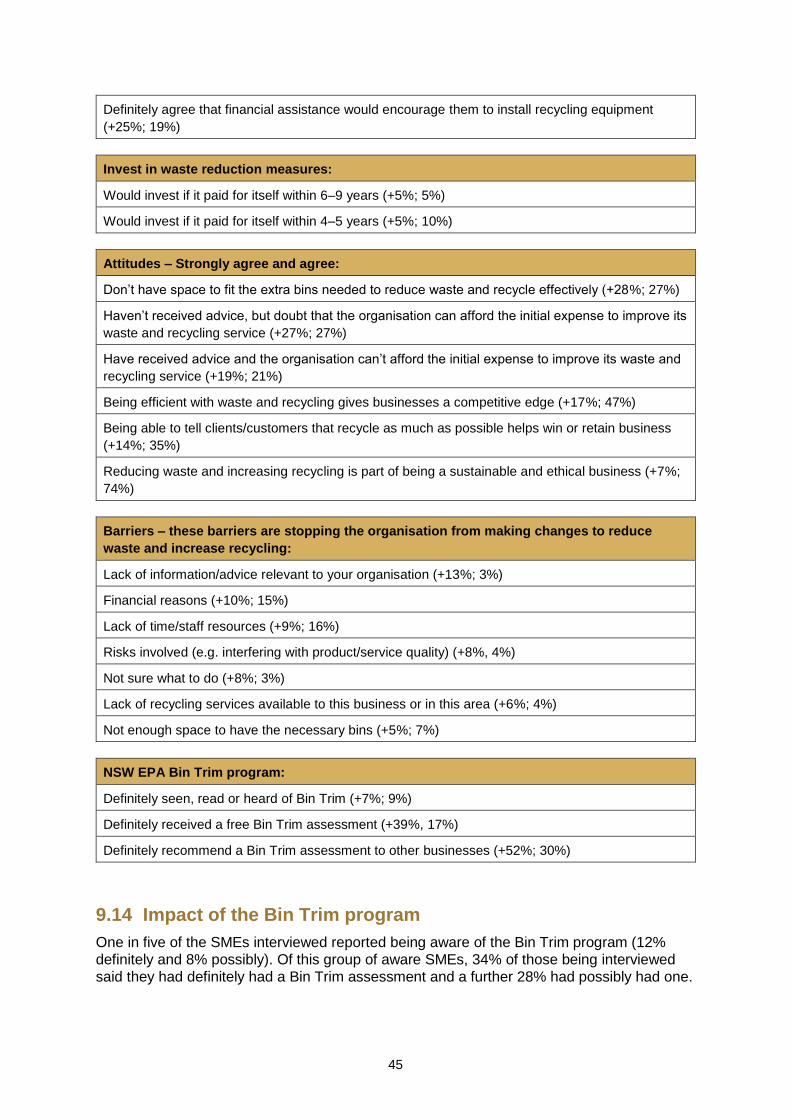
45
Definitely agree that financial assistance would encourage them to install recycling equipment
(+25%; 19%)
Invest in waste reduction measures:
Would invest if it paid for itself within 6–9 years (+5%; 5%)
Would invest if it paid for itself within 4–5 years (+5%; 10%)
Attitudes – Strongly agree and agree:
Don’t have space to fit the extra bins needed to reduce waste and recycle effectively (+28%; 27%)
Haven’t received advice, but doubt that the organisation can afford the initial expense to improve its
waste and recycling service (+27%; 27%)
Have received advice and the organisation can’t afford the initial expense to improve its waste and
recycling service (+19%; 21%)
Being efficient with waste and recycling gives businesses a competitive edge (+17%; 47%)
Being able to tell clients/customers that recycle as much as possible helps win or retain business
(+14%; 35%)
Reducing waste and increasing recycling is part of being a sustainable and ethical business (+7%;
74%)
Barriers – these barriers are stopping the organisation from making changes to reduce
waste and increase recycling:
Lack of information/advice relevant to your organisation (+13%; 3%)
Financial reasons (+10%; 15%)
Lack of time/staff resources (+9%; 16%)
Risks involved (e.g. interfering with product/service quality) (+8%, 4%)
Not sure what to do (+8%; 3%)
Lack of recycling services available to this business or in this area (+6%; 4%)
Not enough space to have the necessary bins (+5%; 7%)
NSW EPA Bin Trim program:
Definitely seen, read or heard of Bin Trim (+7%; 9%)
Definitely received a free Bin Trim assessment (+39%, 17%)
Definitely recommend a Bin Trim assessment to other businesses (+52%; 30%)
9.14 Impact of the Bin Trim program
One in five of the SMEs interviewed reported being aware of the Bin Trim program (12%
definitely and 8% possibly). Of this group of aware SMEs, 34% of those being interviewed
said they had definitely had a Bin Trim assessment and a further 28% had possibly had one.
Summary Benchmark Social Research on SME Waste and Recycling
46
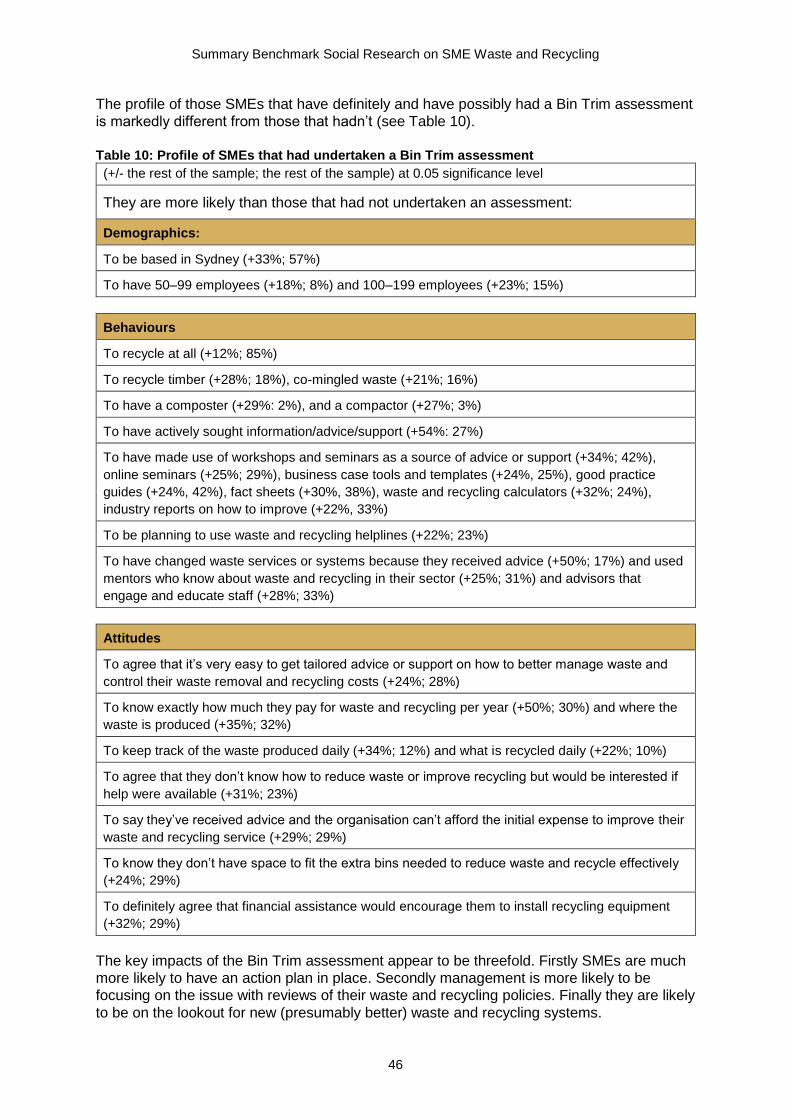
The profile of those SMEs that have definitely and have possibly had a Bin Trim assessment
is markedly different from those that hadn’t (see Table 10).
Table 10: Profile of SMEs that had undertaken a Bin Trim assessment
(+/- the rest of the sample; the rest of the sample) at 0.05 significance level
They are more likely than those that had not undertaken an assessment:
Demographics:
To be based in Sydney (+33%; 57%)
To have 50–99 employees (+18%; 8%) and 100–199 employees (+23%; 15%)
Behaviours
To recycle at all (+12%; 85%)
To recycle timber (+28%; 18%), co-mingled waste (+21%; 16%)
To have a composter (+29%: 2%), and a compactor (+27%; 3%)
To have actively sought information/advice/support (+54%: 27%)
To have made use of workshops and seminars as a source of advice or support (+34%; 42%),
online seminars (+25%; 29%), business case tools and templates (+24%, 25%), good practice
guides (+24%, 42%), fact sheets (+30%, 38%), waste and recycling calculators (+32%; 24%),
industry reports on how to improve (+22%, 33%)
To be planning to use waste and recycling helplines (+22%; 23%)
To have changed waste services or systems because they received advice (+50%; 17%) and used
mentors who know about waste and recycling in their sector (+25%; 31%) and advisors that
engage and educate staff (+28%; 33%)
Attitudes
To agree that it’s very easy to get tailored advice or support on how to better manage waste and
control their waste removal and recycling costs (+24%; 28%)
To know exactly how much they pay for waste and recycling per year (+50%; 30%) and where the
waste is produced (+35%; 32%)
To keep track of the waste produced daily (+34%; 12%) and what is recycled daily (+22%; 10%)
To agree that they don’t know how to reduce waste or improve recycling but would be interested if
help were available (+31%; 23%)
To say they’ve received advice and the organisation can’t afford the initial expense to improve their
waste and recycling service (+29%; 29%)
To know they don’t have space to fit the extra bins needed to reduce waste and recycle effectively
(+24%; 29%)
To definitely agree that financial assistance would encourage them to install recycling equipment
(+32%; 29%)
The key impacts of the Bin Trim assessment appear to be threefold. Firstly SMEs are much
more likely to have an action plan in place. Secondly management is more likely to be
focusing on the issue with reviews of their waste and recycling policies. Finally they are likely
to be on the lookout for new (presumably better) waste and recycling systems.
47
However, as knowledge increases about waste and recycling (through participation in waste
assessment programs such as Bin Trim) the barriers to taking the next steps become clearer
to SMEs. Future government assistance is still likely to be of value in overcoming these
barriers.
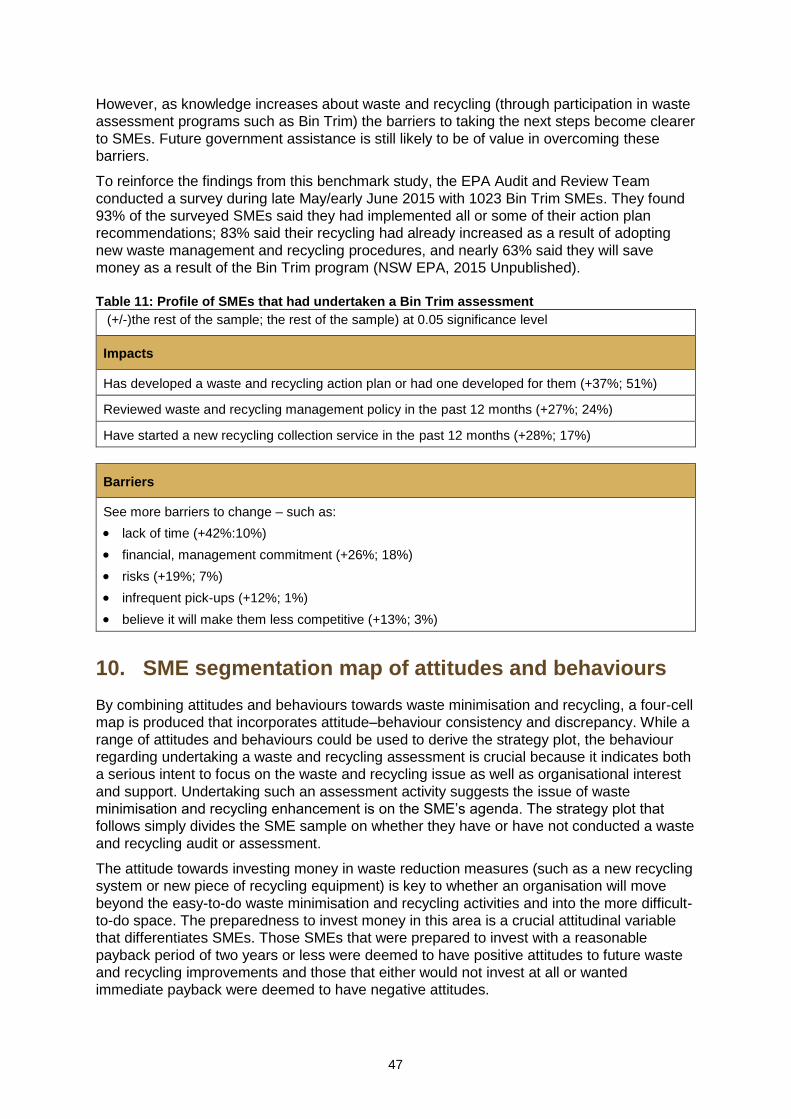
To reinforce the findings from this benchmark study, the EPA Audit and Review Team
conducted a survey during late May/early June 2015 with 1023 Bin Trim SMEs. They found
93% of the surveyed SMEs said they had implemented all or some of their action plan
recommendations; 83% said their recycling had already increased as a result of adopting
new waste management and recycling procedures, and nearly 63% said they will save
money as a result of the Bin Trim program (NSW EPA, 2015 Unpublished).
Table 11: Profile of SMEs that had undertaken a Bin Trim assessment
(+/-)the rest of the sample; the rest of the sample) at 0.05 significance level
Impacts
Has developed a waste and recycling action plan or had one developed for them (+37%; 51%)
Reviewed waste and recycling management policy in the past 12 months (+27%; 24%)
Have started a new recycling collection service in the past 12 months (+28%; 17%)
Barriers
See more barriers to change – such as:
lack of time (+42%:10%)
financial, management commitment (+26%; 18%)
risks (+19%; 7%)
infrequent pick-ups (+12%; 1%)
believe it will make them less competitive (+13%; 3%)
10. SME segmentation map of attitudes and behaviours
By combining attitudes and behaviours towards waste minimisation and recycling, a four-cell
map is produced that incorporates attitude–behaviour consistency and discrepancy. While a
range of attitudes and behaviours could be used to derive the strategy plot, the behaviour
regarding undertaking a waste and recycling assessment is crucial because it indicates both
a serious intent to focus on the waste and recycling issue as well as organisational interest
and support. Undertaking such an assessment activity suggests the issue of waste
minimisation and recycling enhancement is on the SME’s agenda. The strategy plot that
follows simply divides the SME sample on whether they have or have not conducted a waste
and recycling audit or assessment.
The attitude towards investing money in waste reduction measures (such as a new recycling
system or new piece of recycling equipment) is key to whether an organisation will move
beyond the easy-to-do waste minimisation and recycling activities and into the more difficult-
to-do space. The preparedness to invest money in this area is a crucial attitudinal variable
that differentiates SMEs. Those SMEs that were prepared to invest with a reasonable
payback period of two years or less were deemed to have positive attitudes to future waste
and recycling improvements and those that either would not invest at all or wanted
immediate payback were deemed to have negative attitudes.
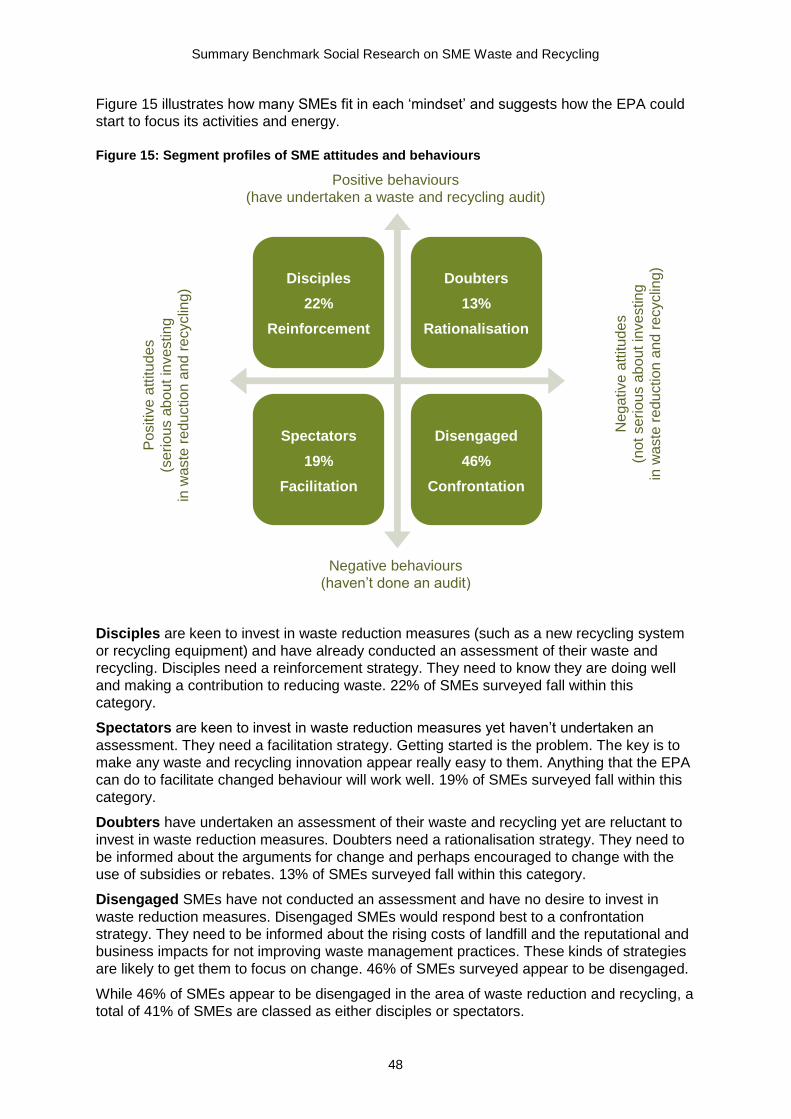
Summary Benchmark Social Research on SME Waste and Recycling
48
Figure 15 illustrates how many SMEs fit in each ‘mindset’ and suggests how the EPA could
start to focus its activities and energy.
Figure 15: Segment profiles of SME attitudes and behaviours
Positive behaviours
(have undertaken a waste and recycling audit)
Negative behaviours
(haven’t done an audit)
Disciples are keen to invest in waste reduction measures (such as a new recycling system
or recycling equipment) and have already conducted an assessment of their waste and
recycling. Disciples need a reinforcement strategy. They need to know they are doing well
and making a contribution to reducing waste. 22% of SMEs surveyed fall within this
category.
Spectators are keen to invest in waste reduction measures yet haven’t undertaken an
assessment. They need a facilitation strategy. Getting started is the problem. The key is to
make any waste and recycling innovation appear really easy to them. Anything that the EPA
can do to facilitate changed behaviour will work well. 19% of SMEs surveyed fall within this
category.
Doubters have undertaken an assessment of their waste and recycling yet are reluctant to
invest in waste reduction measures. Doubters need a rationalisation strategy. They need to
be informed about the arguments for change and perhaps encouraged to change with the
use of subsidies or rebates. 13% of SMEs surveyed fall within this category.
Disengaged SMEs have not conducted an assessment and have no desire to invest in
waste reduction measures. Disengaged SMEs would respond best to a confrontation
strategy. They need to be informed about the rising costs of landfill and the reputational and
business impacts for not improving waste management practices. These kinds of strategies
are likely to get them to focus on change. 46% of SMEs surveyed appear to be disengaged.
While 46% of SMEs appear to be disengaged in the area of waste reduction and recycling, a
total of 41% of SMEs are classed as either disciples or spectators.
Disciples
22%
Reinforcement
Doubters
13%
Rationalisation
Spectators
19%
Facilitation
Disengaged
46%
Confrontation
Po
sitiv
e a
ttitu
de
s
(se
rio
us a
bou
t in
vestin
g
in w
aste
re
du
ction a
nd
re
cyclin
g)
Ne
ga
tive a
ttitu
de
s
(not se
riou
s a
bo
ut in
vestin
g
in w
aste
re
du
ction a
nd
re
cyclin
g)
49
There were no significant differences across the different industry sectors.
Figure 16 highlights the differences between the segments and provides more insight into where each segment differs on the variables measured in the survey.
Disengaged tend to be very small SMEs that require much higher levels of intervention
to get them to focus on an issue like waste and recycling. They are also the kind of
organisations of least interest to WSPs and in many respects are, at present, on their
own to find ways to reduce waste and to recycle more. (26% of WSPs stated that ‘Not
enough materials to warrant a collection service’ was a barrier to providing assistance to
SMEs).
Doubters simply believe they have done all they can. They need to be shown good
arguments as to what else they can do by way of waste minimisation and recycling more.
Spectators are planning to do a lot of things but simply not getting around to it. Making
action by these SMEs easier and perhaps providing special incentives to act ‘right now’
will assist them to get started on waste minimisation and recycling more.
Disciples are larger SME organisations that are better organised and have multiple
motivations to improve waste and recycling. They need to be encouraged to continue to
find ways to do things even better.
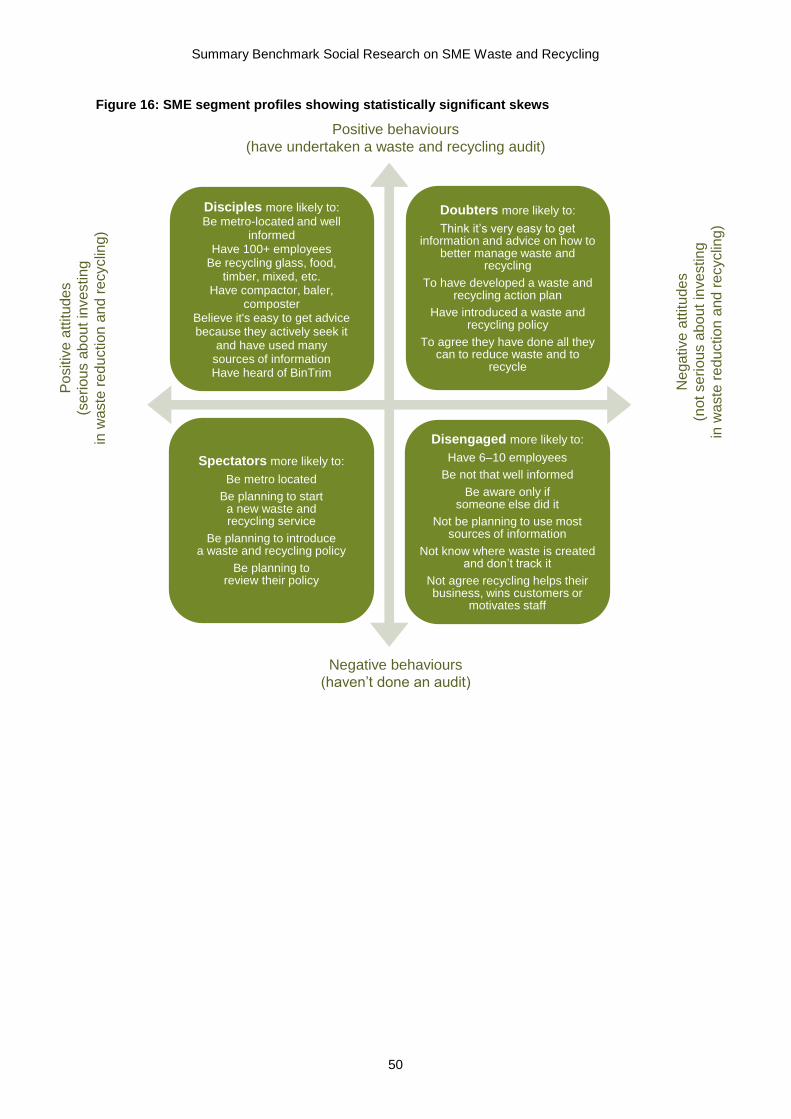
Summary Benchmark Social Research on SME Waste and Recycling
50
Figure 16: SME segment profiles showing statistically significant skews
Positive behaviours
(have undertaken a waste and recycling audit)
Negative behaviours
(haven’t done an audit)
Disciples more likely to:
Be metro-located and well informed
Have 100+ employeesBe recycling glass, food,
timber, mixed, etc.Have compactor, baler,
composterBelieve it's easy to get advice because they actively seek it
and have used many sources of informationHave heard of BinTrim
Doubters more likely to:
Think it’s very easy to get information and advice on how to
better manage waste and recycling
To have developed a waste and recycling action plan
Have introduced a waste and recycling policy
To agree they have done all they can to reduce waste and to
recycle
Spectators more likely to:
Be metro located
Be planning to start a new waste and recycling service
Be planning to introduce a waste and recycling policy
Be planning to review their policy
Disengaged more likely to:
Have 6–10 employees
Be not that well informed
Be aware only if someone else did it
Not be planning to use most sources of information
Not know where waste is created and don’t track it
Not agree recycling helps their business, wins customers or
motivates staff
Po
sitiv
e a
ttitu
de
s
(se
riou
s a
bou
t in
vestin
g
in w
aste
re
du
ction a
nd
re
cyclin
g)
Ne
ga
tive a
ttitu
de
s
(not se
riou
s a
bo
ut in
vestin
g
in w
aste
re
du
ction a
nd
re
cyclin
g)
51
11. References
NSW EPA, Instinct and Reason for, 2015 unpublished, Bin Trim Social Research for Benchmarking and Program Evaluation NSW EPA, Wright Corporate Strategy for, 2015 Unpublished, Bin Trim Program Audit and Review Report Round 1
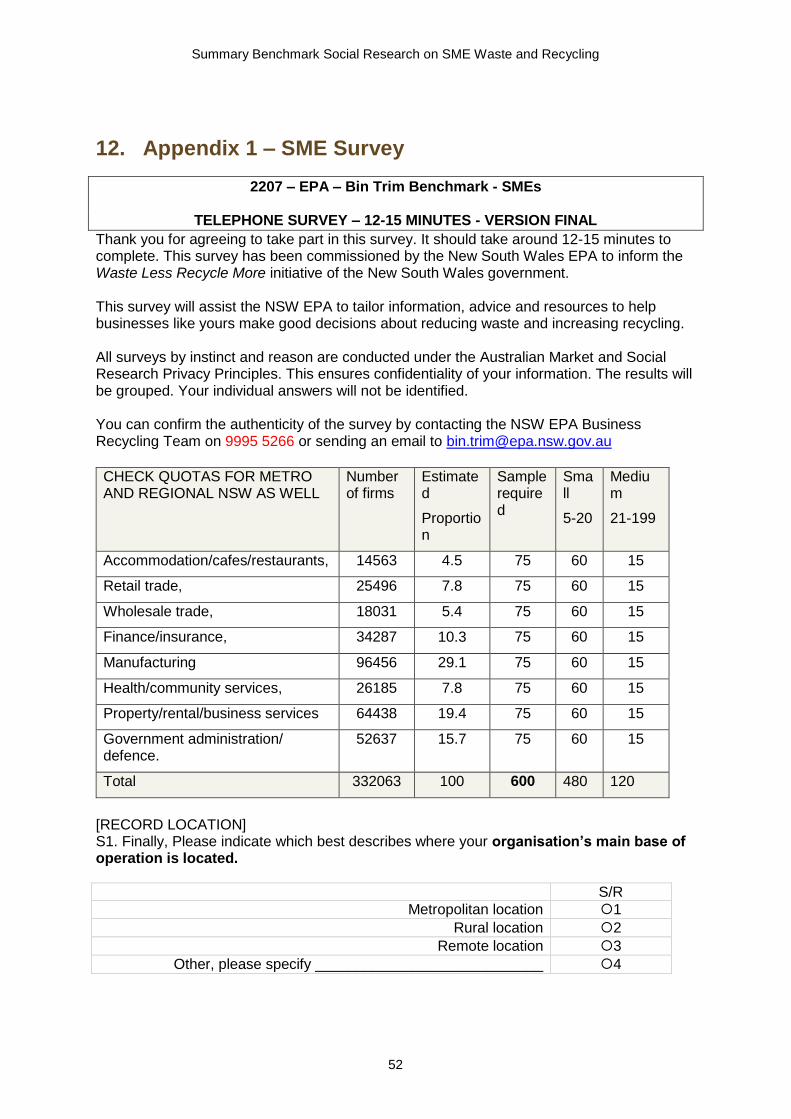
Summary Benchmark Social Research on SME Waste and Recycling
52
12. Appendix 1 – SME Survey
2207 – EPA – Bin Trim Benchmark - SMEs
TELEPHONE SURVEY – 12-15 MINUTES - VERSION FINAL
Thank you for agreeing to take part in this survey. It should take around 12-15 minutes to complete. This survey has been commissioned by the New South Wales EPA to inform the Waste Less Recycle More initiative of the New South Wales government. This survey will assist the NSW EPA to tailor information, advice and resources to help businesses like yours make good decisions about reducing waste and increasing recycling. All surveys by instinct and reason are conducted under the Australian Market and Social Research Privacy Principles. This ensures confidentiality of your information. The results will be grouped. Your individual answers will not be identified. You can confirm the authenticity of the survey by contacting the NSW EPA Business Recycling Team on 9995 5266 or sending an email to [email protected]
CHECK QUOTAS FOR METRO AND REGIONAL NSW AS WELL
Number of firms
Estimated
Proportion
Sample required
Small
5-20
Medium
21-199
Accommodation/cafes/restaurants, 14563 4.5 75 60 15
Retail trade, 25496 7.8 75 60 15
Wholesale trade, 18031 5.4 75 60 15
Finance/insurance, 34287 10.3 75 60 15
Manufacturing 96456 29.1 75 60 15
Health/community services, 26185 7.8 75 60 15
Property/rental/business services 64438 19.4 75 60 15
Government administration/ defence.
52637 15.7 75 60 15
Total 332063 100 600 480 120
[RECORD LOCATION] S1. Finally, Please indicate which best describes where your organisation’s main base of operation is located.
S/R
Metropolitan location 1
Rural location 2
Remote location 3
Other, please specify ____________________________ 4
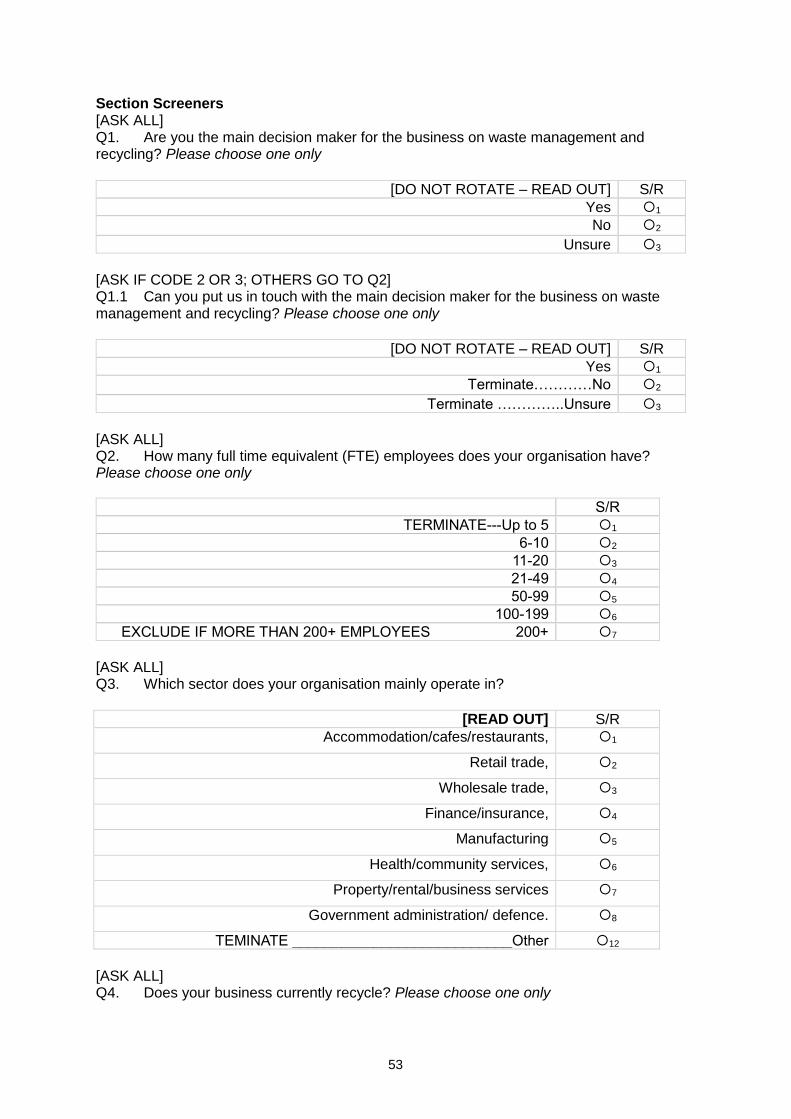
53
Section Screeners [ASK ALL] Q1. Are you the main decision maker for the business on waste management and recycling? Please choose one only
[DO NOT ROTATE – READ OUT] S/R
Yes 1
No 2
Unsure 3
[ASK IF CODE 2 OR 3; OTHERS GO TO Q2] Q1.1 Can you put us in touch with the main decision maker for the business on waste management and recycling? Please choose one only
[DO NOT ROTATE – READ OUT] S/R
Yes 1
Terminate…………No 2
Terminate …………..Unsure 3
[ASK ALL] Q2. How many full time equivalent (FTE) employees does your organisation have? Please choose one only
S/R
TERMINATE---Up to 5 1
6-10 2
11-20 3
21-49 4
50-99 5
100-199 6
EXCLUDE IF MORE THAN 200+ EMPLOYEES 200+ 7
[ASK ALL] Q3. Which sector does your organisation mainly operate in?
[READ OUT] S/R
Accommodation/cafes/restaurants, 1
Retail trade, 2
Wholesale trade, 3
Finance/insurance, 4
Manufacturing 5
Health/community services, 6
Property/rental/business services 7
Government administration/ defence. 8
TEMINATE ___________________________Other 12
[ASK ALL] Q4. Does your business currently recycle? Please choose one only
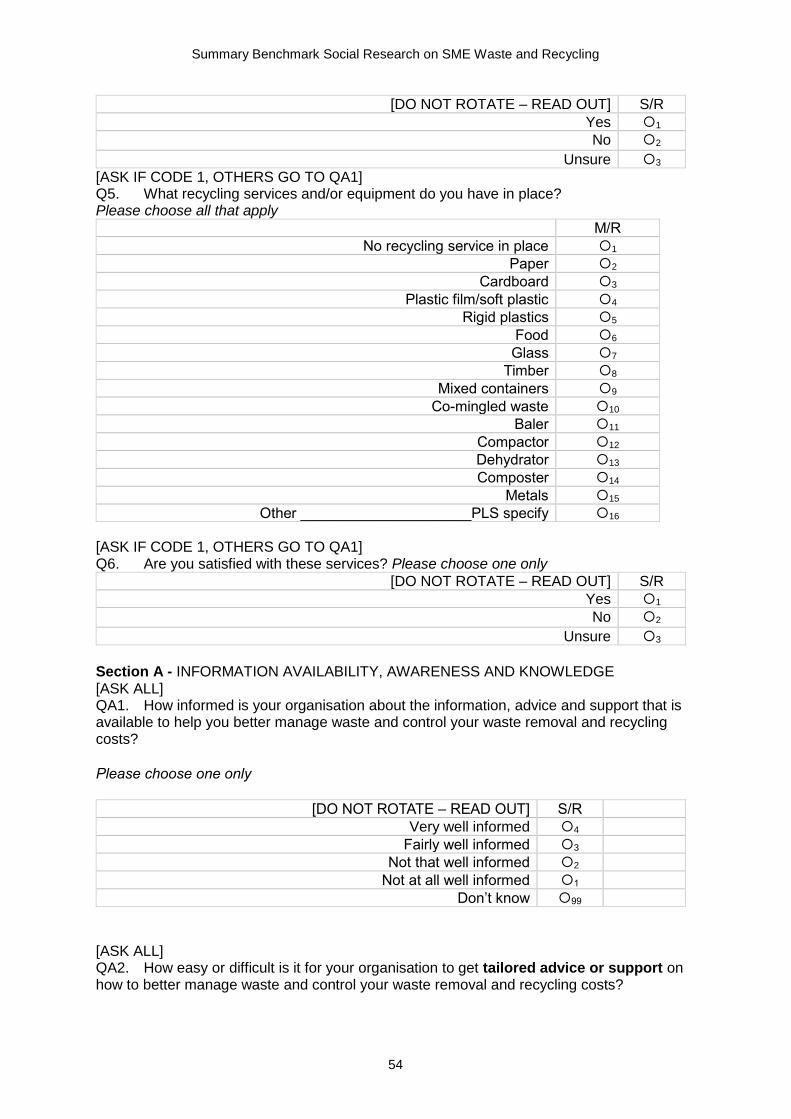
Summary Benchmark Social Research on SME Waste and Recycling
54
[DO NOT ROTATE – READ OUT] S/R
Yes 1
No 2
Unsure 3
[ASK IF CODE 1, OTHERS GO TO QA1] Q5. What recycling services and/or equipment do you have in place? Please choose all that apply
M/R
No recycling service in place 1
Paper 2
Cardboard 3
Plastic film/soft plastic 4
Rigid plastics 5
Food 6
Glass 7
Timber 8
Mixed containers 9
Co-mingled waste 10
Baler 11
Compactor 12
Dehydrator 13
Composter 14
Metals 15
Other _____________________PLS specify 16
[ASK IF CODE 1, OTHERS GO TO QA1] Q6. Are you satisfied with these services? Please choose one only
[DO NOT ROTATE – READ OUT] S/R
Yes 1
No 2
Unsure 3
Section A - INFORMATION AVAILABILITY, AWARENESS AND KNOWLEDGE [ASK ALL] QA1. How informed is your organisation about the information, advice and support that is available to help you better manage waste and control your waste removal and recycling costs?
Please choose one only
[DO NOT ROTATE – READ OUT] S/R
Very well informed 4
Fairly well informed 3
Not that well informed 2
Not at all well informed 1
Don’t know 99
[ASK ALL] QA2. How easy or difficult is it for your organisation to get tailored advice or support on how to better manage waste and control your waste removal and recycling costs?

55
Please choose one only
[DO NOT ROTATE – READ OUT] S/R
Very easy 4
Fairly easy 3
Fairly difficult 2
Very difficult 1
Don’t know 99
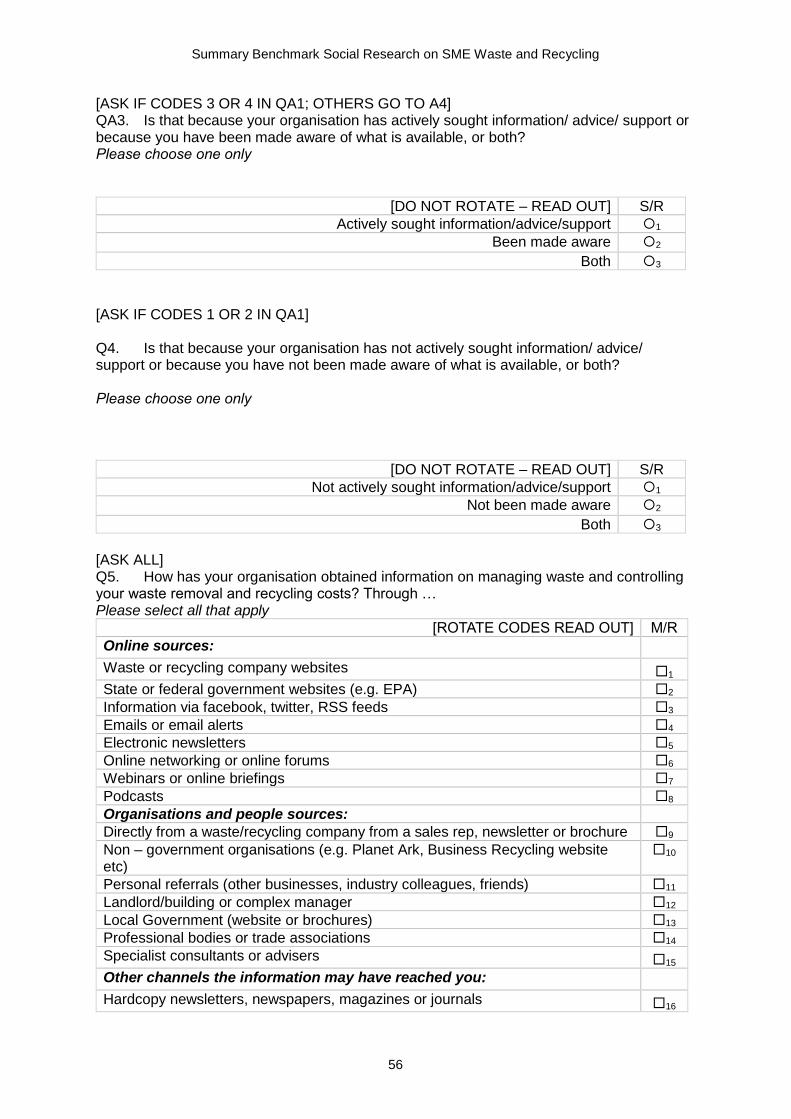
Summary Benchmark Social Research on SME Waste and Recycling
56
[ASK IF CODES 3 OR 4 IN QA1; OTHERS GO TO A4] QA3. Is that because your organisation has actively sought information/ advice/ support or because you have been made aware of what is available, or both? Please choose one only
[DO NOT ROTATE – READ OUT] S/R
Actively sought information/advice/support 1
Been made aware 2
Both 3
[ASK IF CODES 1 OR 2 IN QA1] Q4. Is that because your organisation has not actively sought information/ advice/ support or because you have not been made aware of what is available, or both? Please choose one only
[DO NOT ROTATE – READ OUT] S/R
Not actively sought information/advice/support 1
Not been made aware 2
Both 3
[ASK ALL] Q5. How has your organisation obtained information on managing waste and controlling your waste removal and recycling costs? Through … Please select all that apply
[ROTATE CODES READ OUT] M/R
Online sources:
Waste or recycling company websites 1
State or federal government websites (e.g. EPA) 2
Information via facebook, twitter, RSS feeds 3
Emails or email alerts 4
Electronic newsletters 5
Online networking or online forums 6
Webinars or online briefings 7
Podcasts 8
Organisations and people sources:
Directly from a waste/recycling company from a sales rep, newsletter or brochure 9
Non – government organisations (e.g. Planet Ark, Business Recycling website etc)
10
Personal referrals (other businesses, industry colleagues, friends) 11
Landlord/building or complex manager 12
Local Government (website or brochures) 13
Professional bodies or trade associations 14
Specialist consultants or advisers 15
Other channels the information may have reached you:
Hardcopy newsletters, newspapers, magazines or journals 16

57
[ROTATE CODES READ OUT] M/R
Handbooks or factsheets 17
Videos/DVDs 18
Telephone helplines 19
Radio or TV 20
Other (Please specify) 97
None of these 99
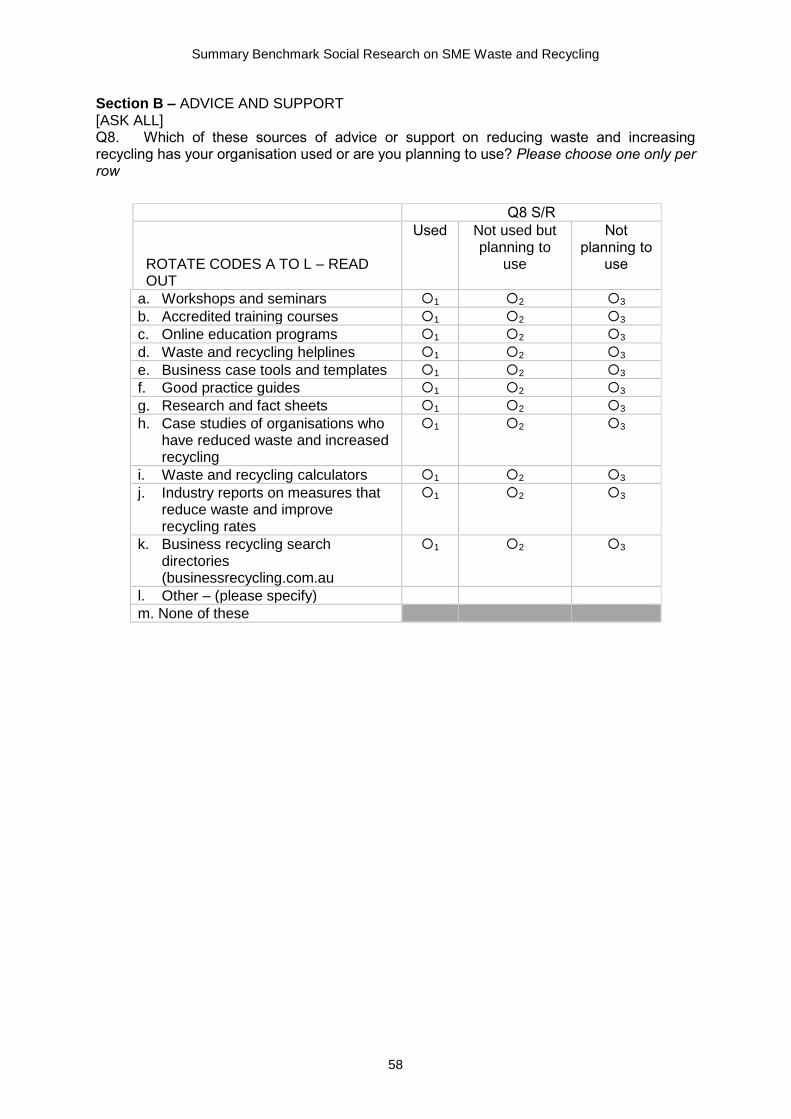
Summary Benchmark Social Research on SME Waste and Recycling
58
Section B – ADVICE AND SUPPORT [ASK ALL] Q8. Which of these sources of advice or support on reducing waste and increasing recycling has your organisation used or are you planning to use? Please choose one only per row
Q8 S/R
ROTATE CODES A TO L – READ OUT
Used
Not used but planning to
use
Not planning to
use
a. Workshops and seminars 1 2 3
b. Accredited training courses 1 2 3
c. Online education programs 1 2 3
d. Waste and recycling helplines 1 2 3
e. Business case tools and templates 1 2 3
f. Good practice guides 1 2 3
g. Research and fact sheets 1 2 3
h. Case studies of organisations who have reduced waste and increased recycling
1 2 3
i. Waste and recycling calculators 1 2 3
j. Industry reports on measures that reduce waste and improve recycling rates
1 2 3
k. Business recycling search directories (businessrecycling.com.au
1 2 3
l. Other – (please specify)
m. None of these
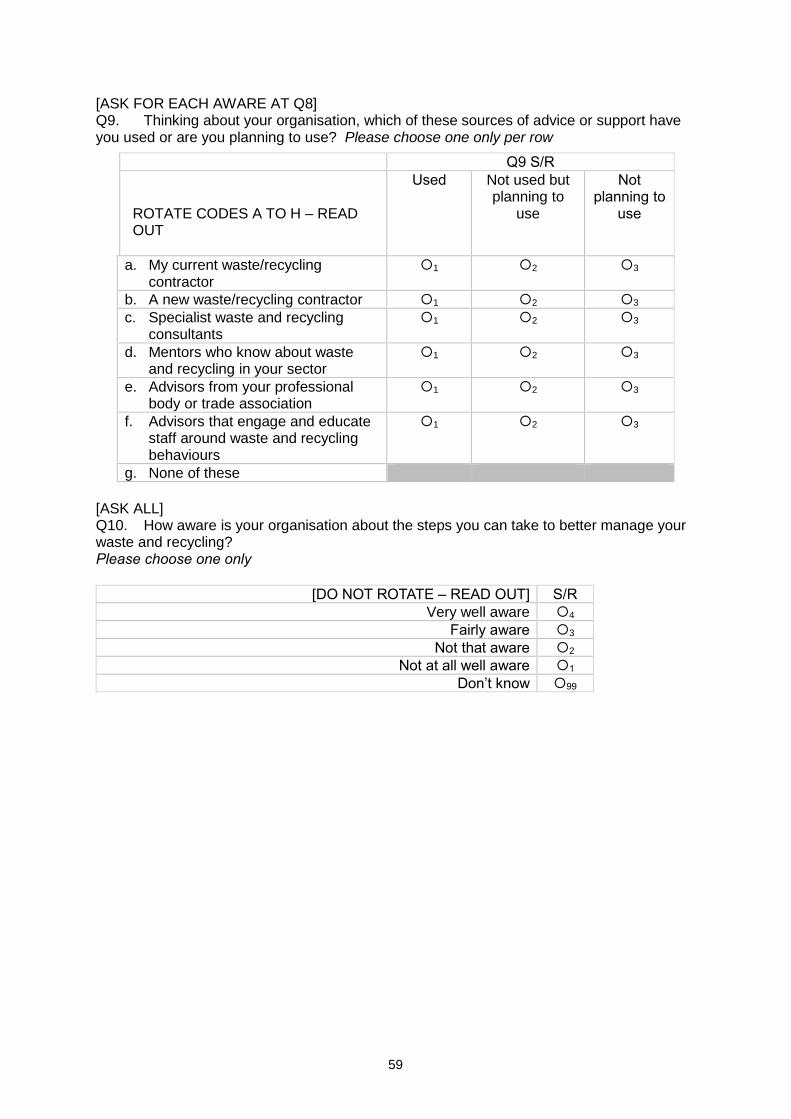
59
[ASK FOR EACH AWARE AT Q8] Q9. Thinking about your organisation, which of these sources of advice or support have you used or are you planning to use? Please choose one only per row
[ASK ALL] Q10. How aware is your organisation about the steps you can take to better manage your waste and recycling? Please choose one only
[DO NOT ROTATE – READ OUT] S/R
Very well aware 4
Fairly aware 3
Not that aware 2
Not at all well aware 1
Don’t know 99
Q9 S/R
ROTATE CODES A TO H – READ OUT
Used
Not used but planning to
use
Not planning to
use
a. My current waste/recycling contractor
1 2 3
b. A new waste/recycling contractor 1 2 3
c. Specialist waste and recycling consultants
1 2 3
d. Mentors who know about waste and recycling in your sector
1 2 3
e. Advisors from your professional body or trade association
1 2 3
f. Advisors that engage and educate staff around waste and recycling behaviours
1 2 3
g. None of these
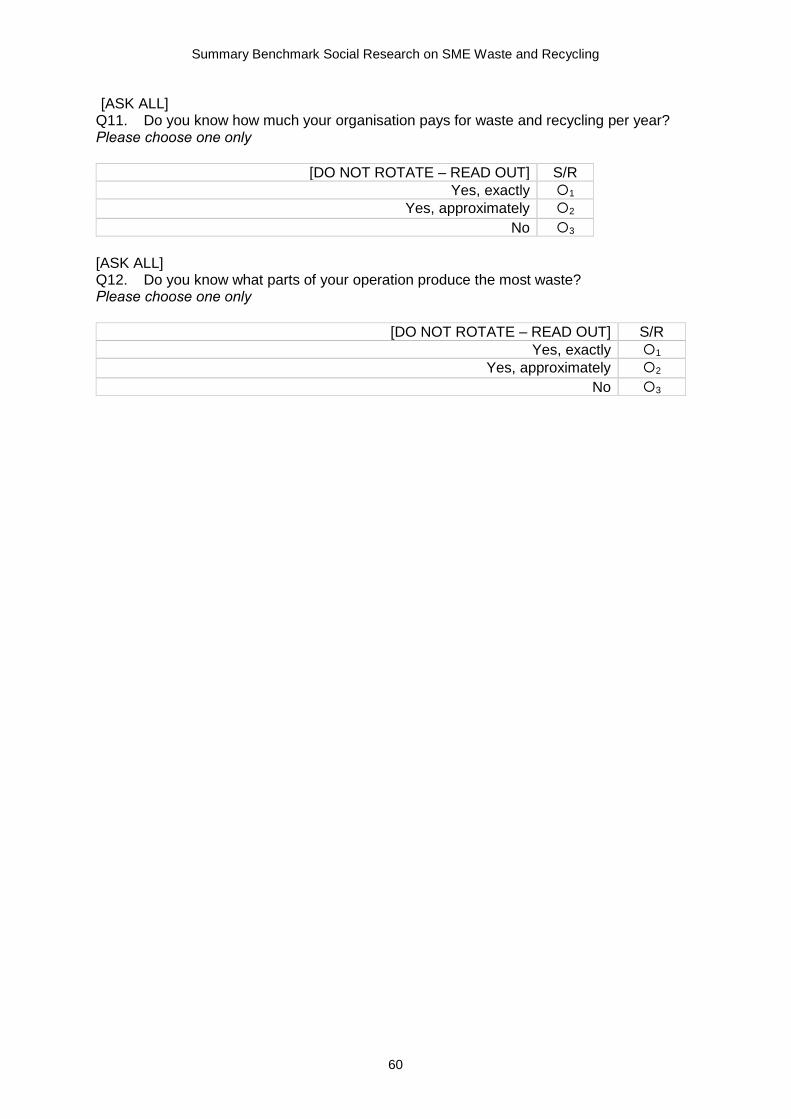
Summary Benchmark Social Research on SME Waste and Recycling
60
[ASK ALL] Q11. Do you know how much your organisation pays for waste and recycling per year? Please choose one only
[DO NOT ROTATE – READ OUT] S/R
Yes, exactly 1
Yes, approximately 2
No 3
[ASK ALL] Q12. Do you know what parts of your operation produce the most waste? Please choose one only
[DO NOT ROTATE – READ OUT] S/R
Yes, exactly 1
Yes, approximately 2
No 3
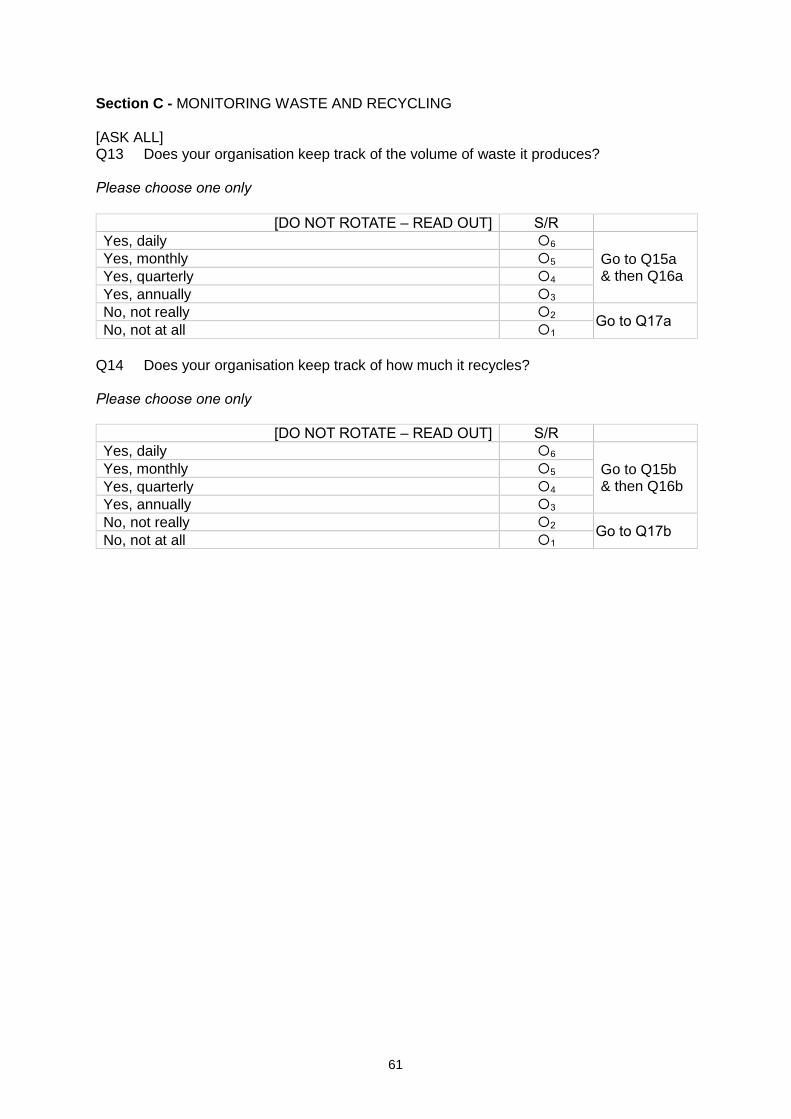
61
Section C - MONITORING WASTE AND RECYCLING [ASK ALL] Q13 Does your organisation keep track of the volume of waste it produces? Please choose one only
[DO NOT ROTATE – READ OUT] S/R
Yes, daily 6
Go to Q15a & then Q16a
Yes, monthly 5
Yes, quarterly 4
Yes, annually 3
No, not really 2 Go to Q17a
No, not at all 1
Q14 Does your organisation keep track of how much it recycles? Please choose one only
[DO NOT ROTATE – READ OUT] S/R
Yes, daily 6
Go to Q15b & then Q16b
Yes, monthly 5
Yes, quarterly 4
Yes, annually 3
No, not really 2 Go to Q17b
No, not at all 1
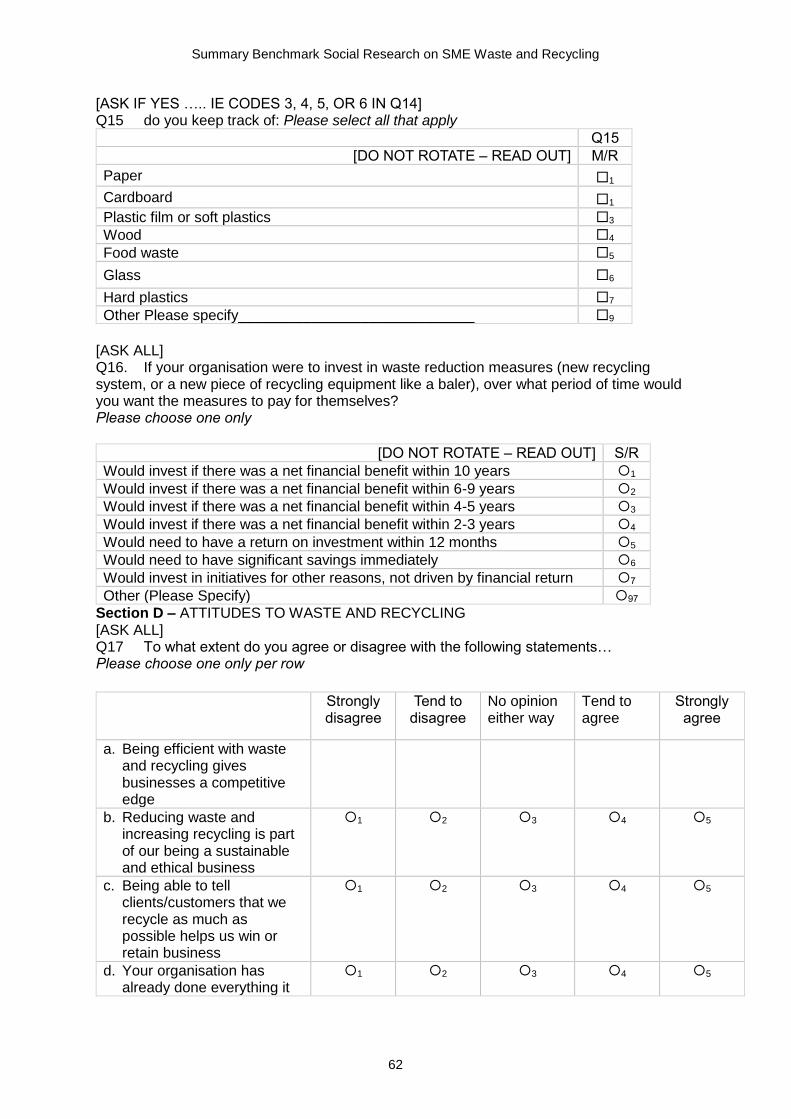
Summary Benchmark Social Research on SME Waste and Recycling
62
[ASK IF YES ….. IE CODES 3, 4, 5, OR 6 IN Q14] Q15 do you keep track of: Please select all that apply
Q15
[DO NOT ROTATE – READ OUT] M/R
Paper 1
Cardboard 1
Plastic film or soft plastics 3
Wood 4
Food waste 5
Glass 6
Hard plastics 7
Other Please specify_____________________________ 9
[ASK ALL] Q16. If your organisation were to invest in waste reduction measures (new recycling system, or a new piece of recycling equipment like a baler), over what period of time would you want the measures to pay for themselves? Please choose one only
[DO NOT ROTATE – READ OUT] S/R
Would invest if there was a net financial benefit within 10 years 1
Would invest if there was a net financial benefit within 6-9 years 2
Would invest if there was a net financial benefit within 4-5 years 3
Would invest if there was a net financial benefit within 2-3 years 4
Would need to have a return on investment within 12 months 5
Would need to have significant savings immediately 6
Would invest in initiatives for other reasons, not driven by financial return 7
Other (Please Specify) 97
Section D – ATTITUDES TO WASTE AND RECYCLING [ASK ALL] Q17 To what extent do you agree or disagree with the following statements… Please choose one only per row
Strongly disagree
Tend to disagree
No opinion either way
Tend to agree
Strongly agree
a. Being efficient with waste and recycling gives businesses a competitive edge
b. Reducing waste and increasing recycling is part of our being a sustainable and ethical business
1 2 3 4 5
c. Being able to tell clients/customers that we recycle as much as possible helps us win or retain business
1 2 3 4 5
d. Your organisation has already done everything it
1 2 3 4 5
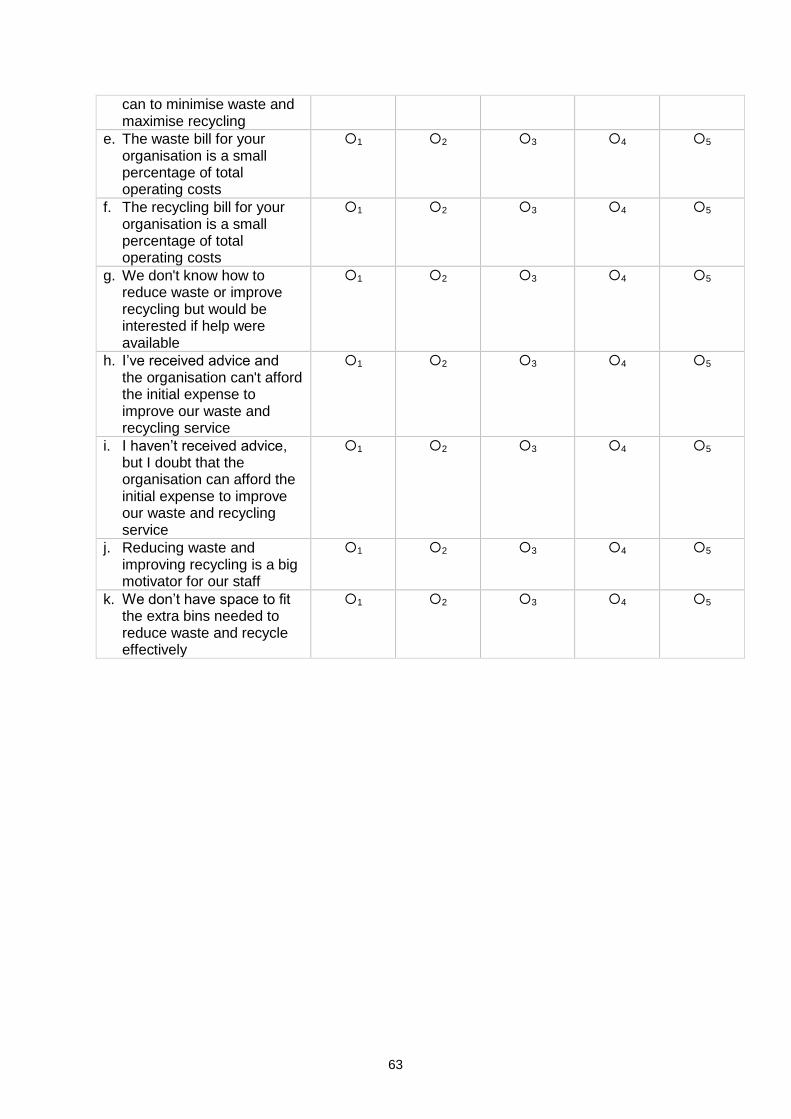
63
can to minimise waste and maximise recycling
e. The waste bill for your organisation is a small percentage of total operating costs
1 2 3 4 5
f. The recycling bill for your organisation is a small percentage of total operating costs
1 2 3 4 5
g. We don't know how to reduce waste or improve recycling but would be interested if help were available
1 2 3 4 5
h. I’ve received advice and the organisation can't afford the initial expense to improve our waste and recycling service
1 2 3 4 5
i. I haven’t received advice, but I doubt that the organisation can afford the initial expense to improve our waste and recycling service
1 2 3 4 5
j. Reducing waste and improving recycling is a big motivator for our staff
1 2 3 4 5
k. We don’t have space to fit the extra bins needed to reduce waste and recycle effectively
1 2 3 4 5
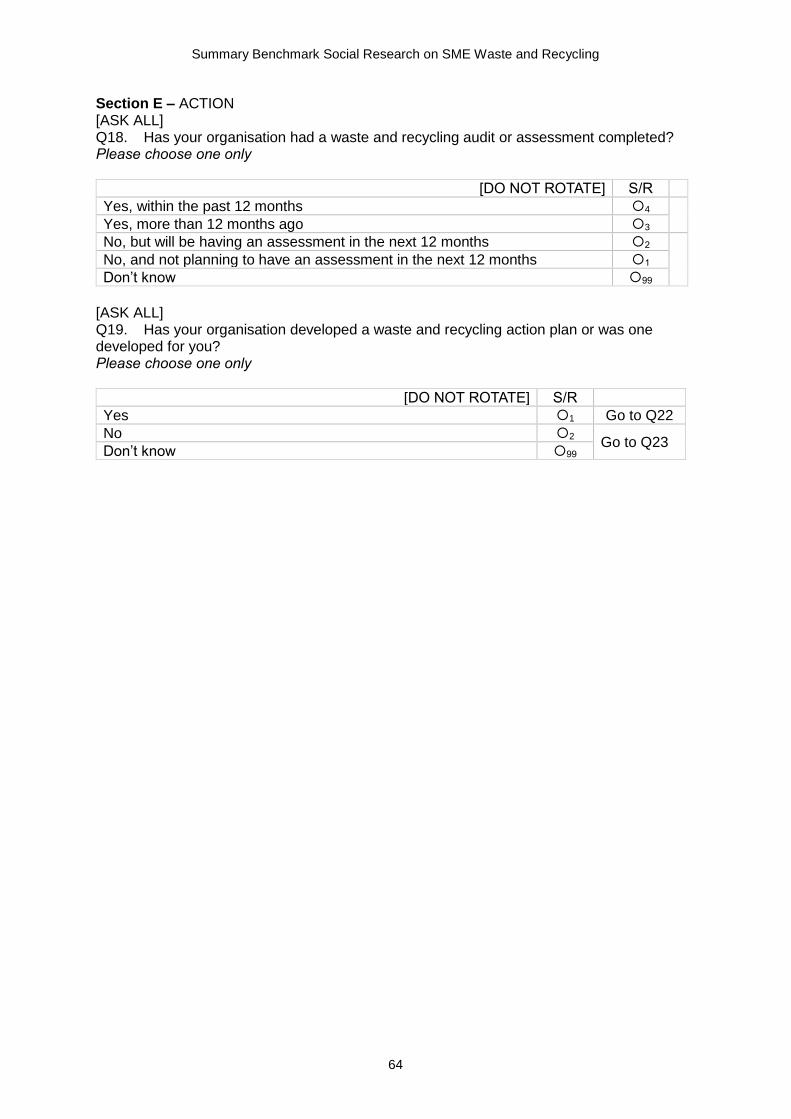
Summary Benchmark Social Research on SME Waste and Recycling
64
Section E – ACTION [ASK ALL] Q18. Has your organisation had a waste and recycling audit or assessment completed? Please choose one only
[DO NOT ROTATE] S/R
Yes, within the past 12 months 4
Yes, more than 12 months ago 3
No, but will be having an assessment in the next 12 months 2
No, and not planning to have an assessment in the next 12 months 1
Don’t know 99
[ASK ALL] Q19. Has your organisation developed a waste and recycling action plan or was one developed for you? Please choose one only
[DO NOT ROTATE] S/R
Yes 1 Go to Q22
No 2 Go to Q23
Don’t know 99
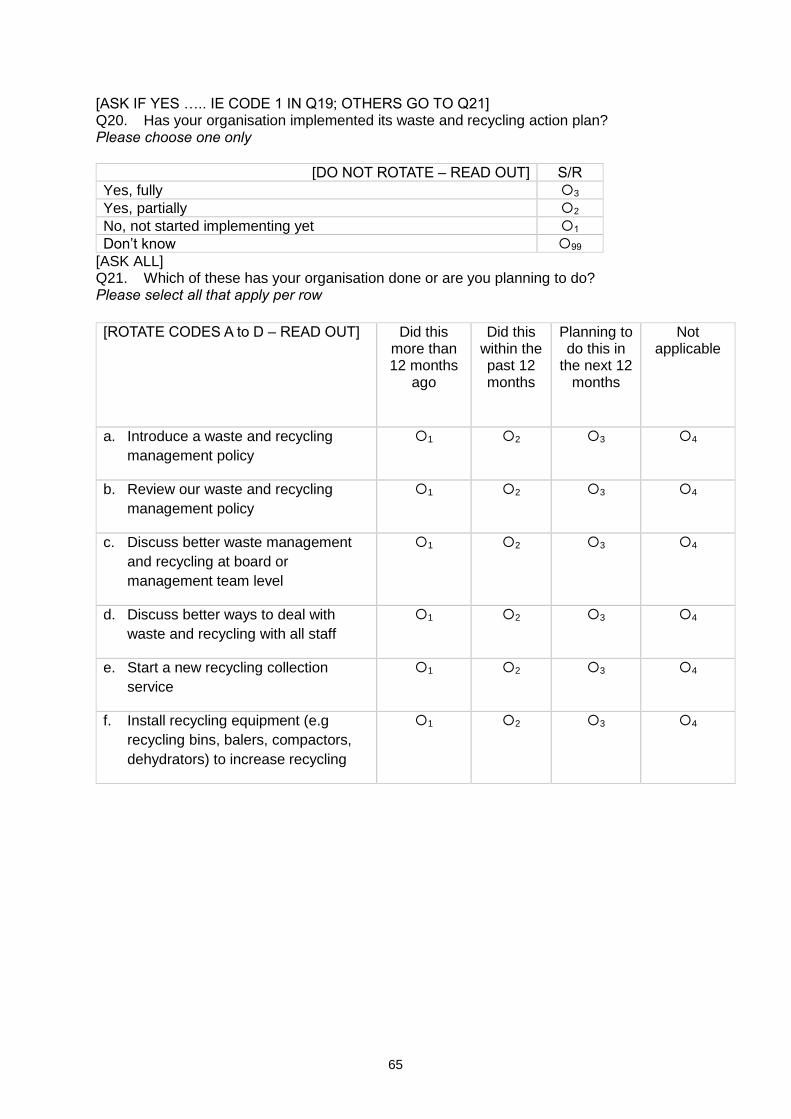
65
[ASK IF YES ….. IE CODE 1 IN Q19; OTHERS GO TO Q21] Q20. Has your organisation implemented its waste and recycling action plan? Please choose one only
[DO NOT ROTATE – READ OUT] S/R
Yes, fully 3
Yes, partially 2
No, not started implementing yet 1
Don’t know 99
[ASK ALL] Q21. Which of these has your organisation done or are you planning to do? Please select all that apply per row
[ROTATE CODES A to D – READ OUT] Did this more than 12 months
ago
Did this within the past 12 months
Planning to do this in
the next 12 months
Not applicable
a. Introduce a waste and recycling
management policy
1 2 3 4
b. Review our waste and recycling
management policy
1 2 3 4
c. Discuss better waste management
and recycling at board or
management team level
1 2 3 4
d. Discuss better ways to deal with
waste and recycling with all staff
1 2 3 4
e. Start a new recycling collection
service
1 2 3 4
f. Install recycling equipment (e.g
recycling bins, balers, compactors,
dehydrators) to increase recycling
1 2 3 4
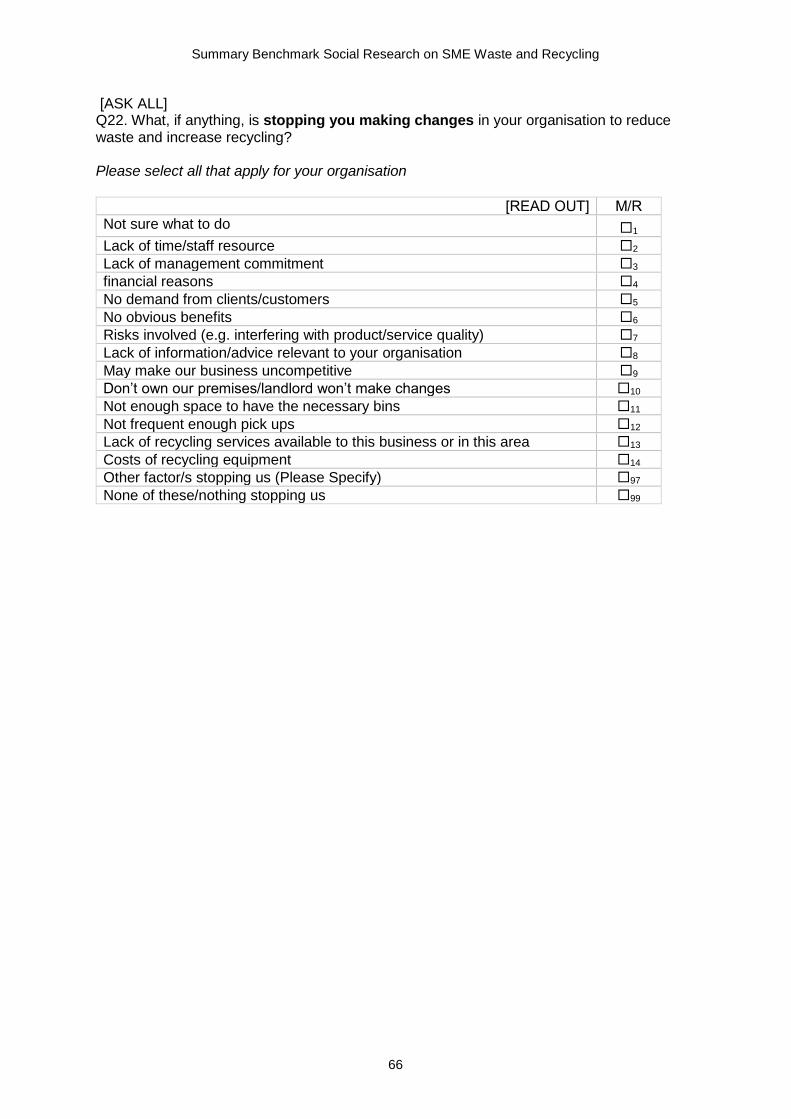
Summary Benchmark Social Research on SME Waste and Recycling
66
[ASK ALL] Q22. What, if anything, is stopping you making changes in your organisation to reduce waste and increase recycling? Please select all that apply for your organisation
[READ OUT] M/R
Not sure what to do 1
Lack of time/staff resource 2
Lack of management commitment 3
financial reasons 4
No demand from clients/customers 5
No obvious benefits 6
Risks involved (e.g. interfering with product/service quality) 7
Lack of information/advice relevant to your organisation 8
May make our business uncompetitive 9
Don’t own our premises/landlord won’t make changes 10
Not enough space to have the necessary bins 11
Not frequent enough pick ups 12
Lack of recycling services available to this business or in this area 13
Costs of recycling equipment 14
Other factor/s stopping us (Please Specify) 97
None of these/nothing stopping us 99
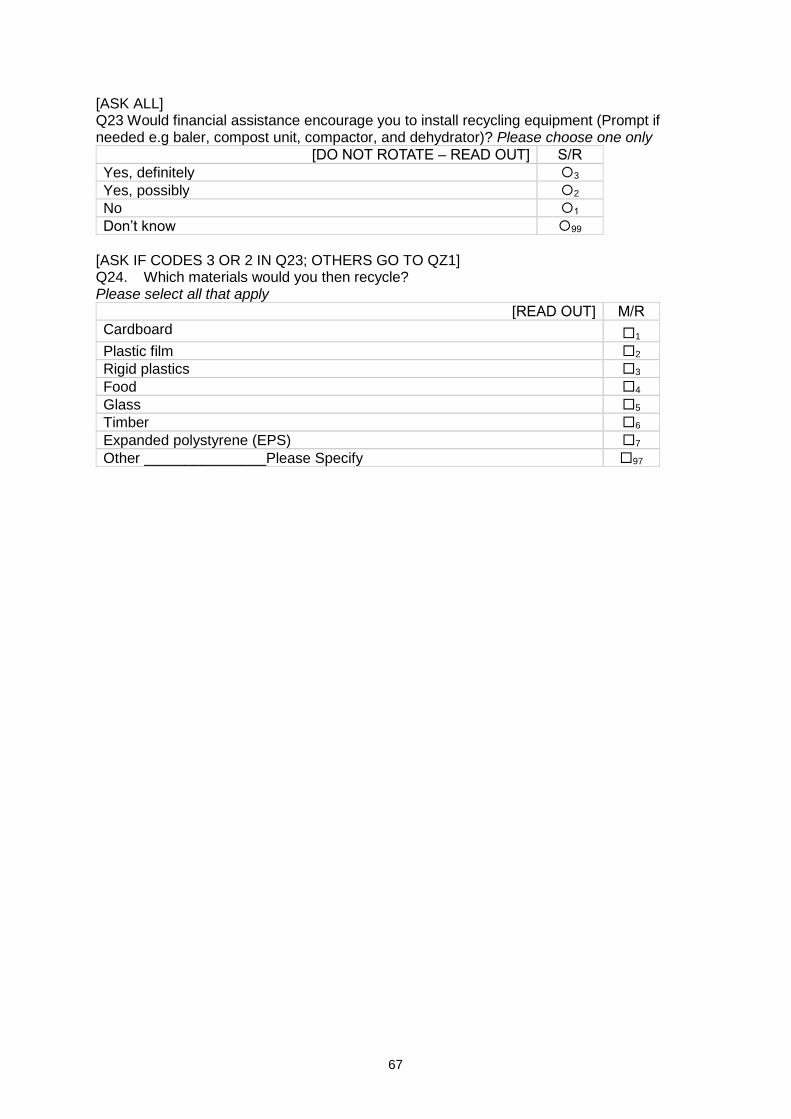
67
[ASK ALL] Q23 Would financial assistance encourage you to install recycling equipment (Prompt if needed e.g baler, compost unit, compactor, and dehydrator)? Please choose one only
[DO NOT ROTATE – READ OUT] S/R
Yes, definitely 3
Yes, possibly 2
No 1
Don’t know 99
[ASK IF CODES 3 OR 2 IN Q23; OTHERS GO TO QZ1] Q24. Which materials would you then recycle? Please select all that apply
[READ OUT] M/R
Cardboard 1
Plastic film 2
Rigid plastics 3
Food 4
Glass 5
Timber 6
Expanded polystyrene (EPS) 7
Other _______________Please Specify 97
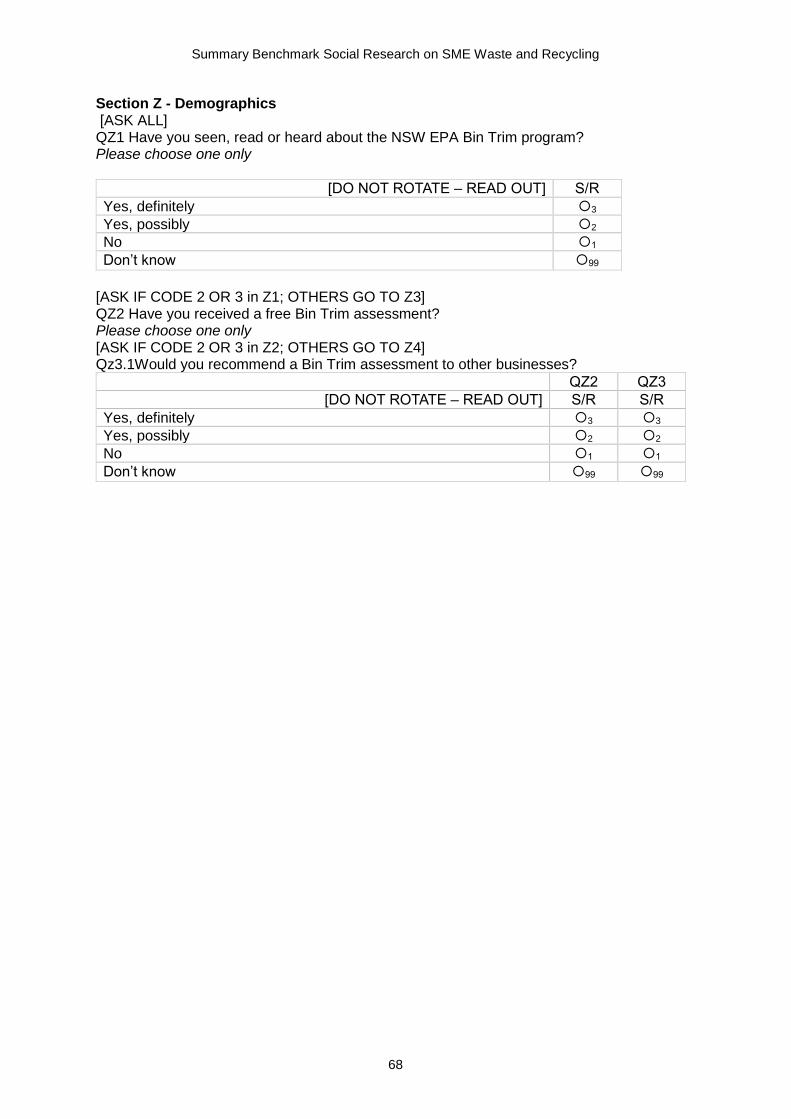
Summary Benchmark Social Research on SME Waste and Recycling
68
Section Z - Demographics [ASK ALL] QZ1 Have you seen, read or heard about the NSW EPA Bin Trim program? Please choose one only
[DO NOT ROTATE – READ OUT] S/R
Yes, definitely 3
Yes, possibly 2
No 1
Don’t know 99
[ASK IF CODE 2 OR 3 in Z1; OTHERS GO TO Z3] QZ2 Have you received a free Bin Trim assessment? Please choose one only [ASK IF CODE 2 OR 3 in Z2; OTHERS GO TO Z4] Qz3.1Would you recommend a Bin Trim assessment to other businesses?
QZ2 QZ3
[DO NOT ROTATE – READ OUT] S/R S/R
Yes, definitely 3 3
Yes, possibly 2 2
No 1 1
Don’t know 99 99
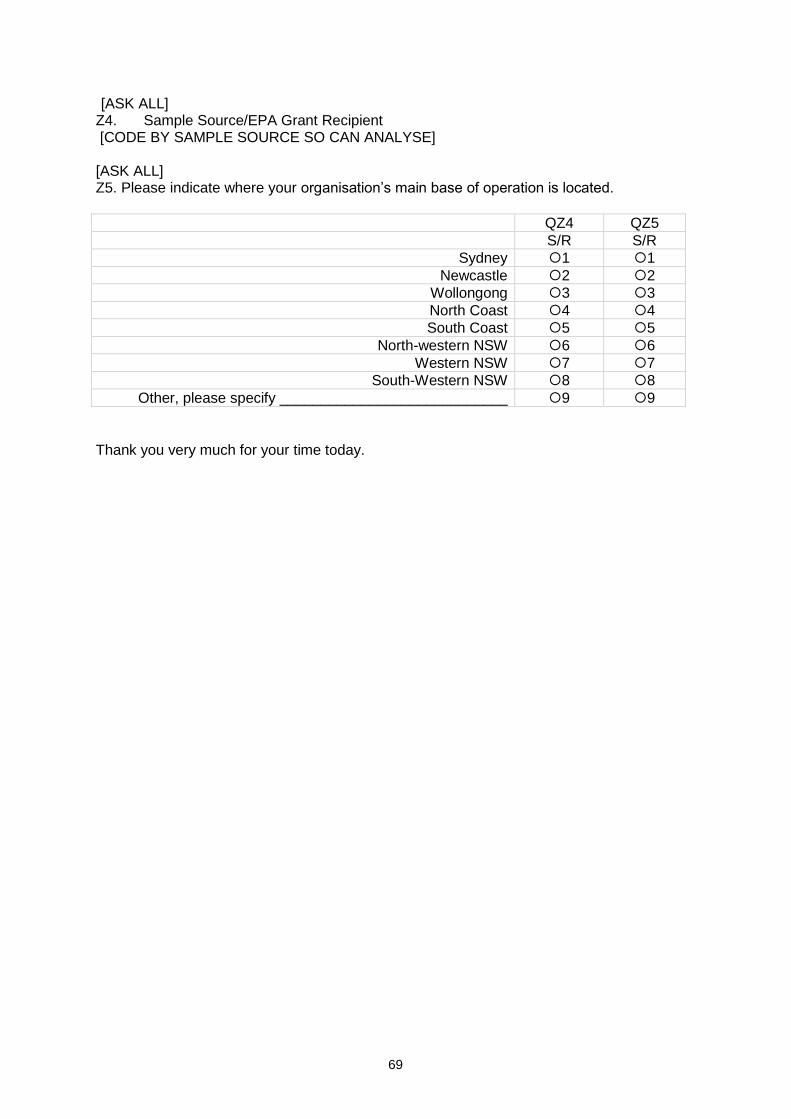
69
[ASK ALL] Z4. Sample Source/EPA Grant Recipient [CODE BY SAMPLE SOURCE SO CAN ANALYSE] [ASK ALL] Z5. Please indicate where your organisation’s main base of operation is located.
QZ4 QZ5
S/R S/R
Sydney 1 1
Newcastle 2 2
Wollongong 3 3
North Coast 4 4
South Coast 5 5
North-western NSW 6 6
Western NSW 7 7
South-Western NSW 8 8
Other, please specify ____________________________ 9 9
Thank you very much for your time today.