Embed Size (px)
Citation preview
Social Security and the Emigration of Immigrants
by Harriet Orcutt Duleep *
Each year the Social Security Administration forecasts the financial sta- tus of the Old-Age, Survivors, and Disability Insurance (OASDI) programs by projecting trends in key variables such as the labor-force participation and earnings of the U. S. population. In the difficult task of projecting the long-term financial status of Social Security, assumptions are made concern. ing the relationship of immigrants to Social Security. An important aspect of that relationship is the emigration of immigrants.
This article describes the general assumptions related to the level and timing of emigration that underlie projections of Social Security’s financial status and examines how closely these assumptions fit research findings based on a variety of data sources. Previous trends in emigration and factor: that may affect current and future levels of emigration are described. The article also presents theoretical expectations and empirical evidence con- cerning the timing of emigration.
*This work has been done in the author’s capacity as a visiting scholar to the Division of Economic Research, Office of Research and Statistics of the Social Se- curity Administration. The author is a senior research associate of the Urban Insti- tute, Washington, DC. Correspondence should be addressed to Harriet Duleep in care of the Social Security Bulletin, Room 205, Van Ness Center, 4301 Connecticut Avenue, NW., Washington, DC 20008.
Over the past decade, more than a third of the Nation’s population growth was due to immigration. This influx of new immi- grants will have a profound effect on So- cial Security by affecting the size and composition of the population contributing to and benefiting from the Old-Age, Survi- vors, and Disability Insurance (OASDI) program. The extent to which immigration influences the Social Security system is affected by the emigration of immigrants. Emigration affects how many immigrants contribute to the system, how long immi- grants contribute to the system, and whether immigrants are eventually eligible for Social Security benefits. Although reasonably good estimates of the number of legal immigrants are available on an annual basis from the Immigration and Naturalization Service (INS), little is known about emigration, other than that the vast majority of emigrants are immi- grants. This lack of information led the 1991 Advisory Council on Social Security to conclude:
Because of lack of data on emigration and other-than-legal immigration, even present levels of net immigration are only educated guesses that may be far from accurate. (Social Security Adminis- tration 1991, p. 33).
This article describes the general as- sumptions related to emigration that under- lie projections of Social Security’s finan- cial status and examines how closely these assumptions fit research findings. The first section provides a simplified overview of how immigration enters into the Social Security projections and summarizes the assumptions that are made about the mag- nitude and timing of emigration. The second section focuses on the magnitude of emigration, first describing previous trends in emigration and then discussing factors that may affect current and future levels of emigration. The following sec- tions focus on the timing of emigration. The first one proposes four hypothetical models of the decision to emigrate and explores the implications of these models for the timing of emigration. The next section sheds empirical light on the timing of emigration. The article concludes with a discussion of the correspondence be-
Social Security Bulletin l Vol. 57, No. I l Spring 1994 37
tween research findings and the assump- tions concerning the magnitude and tim- ing of emigration that underlie projec- tions of Social Security’s financial status.
Chart I .-Schematic overview- of immigration in Social Security projections
Emigration and
estimated number of legal immigrants entering the United States in year t
Social Security Projections PLUS
Each year the financial status of the OASDI program is forecast by the Social Security Administration by projecting trends in key demographic and economic variables based on historical aggregate trends as well as educated guesses about the likely direction of future trends. Esti- mated trends in economic variables. such as labor-force participation and earnings, are imposed upon estimated trends in the size of the age- and sex-specific popula- tions that contribute to and benefit from Social Security. Estimates of net immi- gration are one component of these popu- lation projections: they are derived by subtracting from the number of persons who immigrate those who emigrate.
estimated net number of illegal immigrants entering the United States in year t
MINUS
estimated number of legal immigrants who emigrate in y/ear t
(assumed to equal 30 percent of all legal immigrants entering the United States in year t)
PLUS
estimated number of emigrants eligible for Social Security benefits
(assumed to equal 5 percent of all legal immigrants entering the United States in year t)
EQUALS
net immigration population in year t
-->impose estimated age and sex distribution on net immigration population
Chart 1 provides a simplified sche- matic overview of how immigration enters into Social Security projections in a particular year and the assumptions concerning the magnitude and timing of emigration that underlie the actuarial projections of Social Security’s financial status.’ To arrive at an estimate of net immigration in a particular year, Social Security actuaries begin with the esti- mated number of legal immigrants enter- ing the United States in that year. To this number the estimated net number of illegal immigrants is added. From the resulting total, the estimated number of legal immigrants who emigrate in that year is subtracted. This number is cur- rently assumed to equal 30 percent of the these immigrants no longer reside in the United States long enough to be fulIy number of legal immigrants admitted in United States, they are still considered to insured implies that of those who emi-
-.--. .
->incorporate net immigration by age and sex in estimate of total U.S. population
->impose estimated labor-force participation, unemployment, hours and weeks worked, and
wages on total U.S. population.
the year.* be part of the Social Security system and grate, 17 percent (or 5130) emigrate after The resulting number would gener- are added back into the increase in popu- becoming eligible for Social Security
ally be referred to as net immigration. lation due to immigration. benefits and 83 percent (100 percent However, net immigration, from the The number of emigrants in a particu- minus 17 percent) leave the United States perspective of Social Security’s actuarial far year who are assumed to have become before becoming eligible for Social Secu- projections, is total immigration minus insured for current or future receipt of rity benefits. As 40 quarters of work in the emigration of all immigrants who Social Security benefits is assumed to covered employment is typically required emigrate “out of the system.” The actu- equal 5 percent of the number of legal today to become fully insured,3 and most aria] projections assume that some of the immigrants admitted in that year. Sub- immigrants start to work shortly after legal immigrants emigrate after having tracting 5 percentage points from the coming to the United States,4 these as- worked sufficient quarters to be eligible emigration rate of 30 percent to account sumptions roughly translate into assum- for Social Security benefits. Although for emigrants who have been in the ing that 83 percent of all immigrants who
38 Social Security Bulletin l Vol. 57. No. I l Spring 1994
emigrate do so before residing in the United States 10 years, and 17 percent emigrate after residing in the United States 10 years or more.’
Since the emigrants who are assumed to eventually receive benefits are added to the total population upon which labor force and earnings behavior is imposed (chart I), there is no explicit treatment of potential differences in labor-force vari- ables between these emigrants and the native born (or immigrants who do not emigrate). The work patterns of these emigrants would most closely approxi- mate the native born if they began con- tributing to the system in their twenties and emigrated close to retirement age.
In a symmetrical fashion, since the 83 percent of all emigrants in a given year who are assumed to emigrate before becoming fully insured are subtracted from the total population prior to the imposition of labor-force and earnings characteristics, there is an implicit as- sumption that these immigrants leave without contributing to the system. This assumption would most closely approxi- mate reality if immigrants who do not become fully insured emigrated soon after immigration.
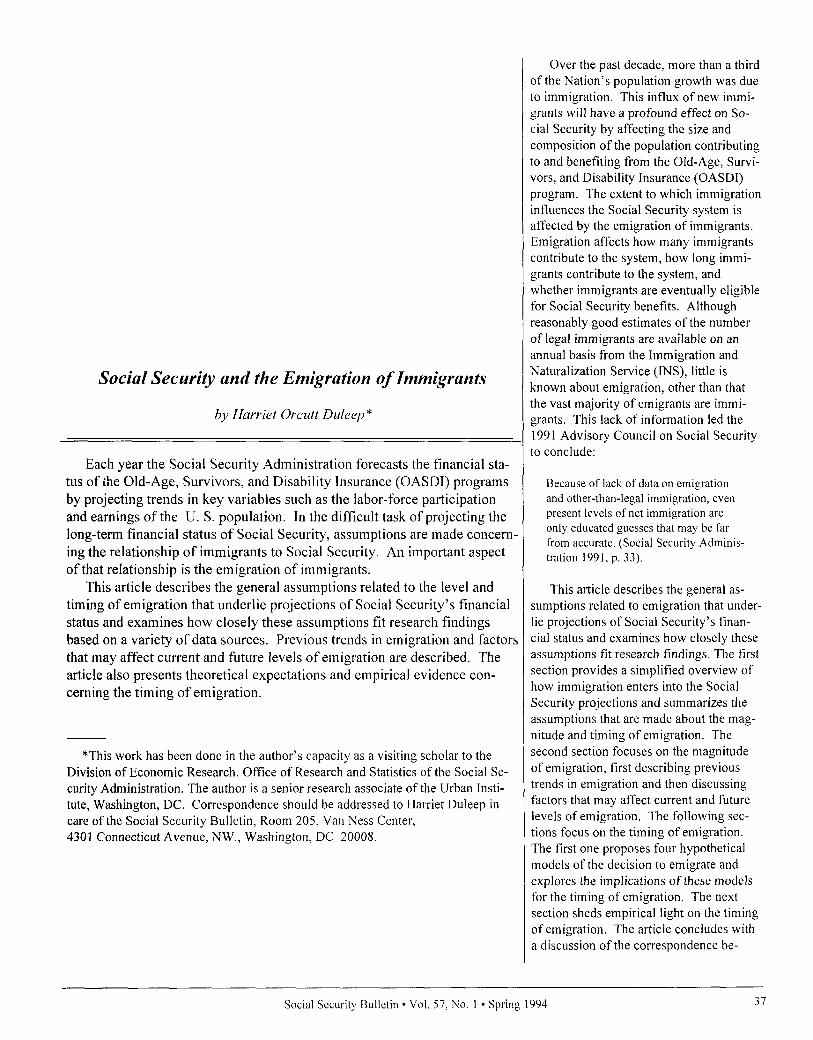
Chart 2.-Emigration over time, 1900-79
Emigration rate
In summary, a total of 30 percent of The basis for the actuarial assumption all legal immigrants are assumed to emi- that the number of all legal immigrants grate. Of those who emigrate, 83 percent who emigrate in a given year is equal to are assumed to emigrate before having 30 percent of the number of legal immi-
acquired sufficient quarters of coverage grants admitted in the year comes from to be eligible for Social Security benefits. dividing total legal emigration over a Since it generally takes 40 quarters to long period of time by total legal immi- become fully insured, this assumption is gration during the same time span. Be- approximately consistent with the as- fore 1950, the Government collected sumption that 83 percent of those who annual statistics on those who left the emigrate leave during their first 10 years United States. Using this record and in the United States. Seventeen percent other sources of information, it was esti- of all emigrants are assumed to leave mated that between 1908 and 1957 some after working sufficient quarters to be 15.7 million immigrants were admitted eligible for Social Security benefits or, in for permanent residence and 4.8 million general, after living at least 10 years in immigrants emigrated (Bureau of the the United States. These emigrants are Census 1 960).6 An assumed emigration added to the general population for rate of approximately 30 percent arises, whom labor-force characteristics are since 4.8 million divided by 15.7 million assumed. is 0.3057.
This section and the following one focus on the magnitude and the timing of emigration, weaving together various strands of research, and examining how closely the Social Security assumptions fit the resulting assemblage of research findings.
However, rates derived from totals measured over long periods of time may hide volatility. As shown in chart 2, emigration has been far from stable.’ Over the last century the emigration rate (defined as the number of immigrants who emigrated during a 5-year period divided by the number of immigrants admitted during the same time period) has fluctuated from an all-time high of
0.6
1900-04 1905-09 1910-14 1915.19 1920-24 1925-29 1930.34 3935-39 1940-44 1945-49 1950.54 1955-59 1960.64 1965-69 1970.74 1975-79
Year
Social Security Bulletin l Vol. 57. No. 1 l Spring 1994
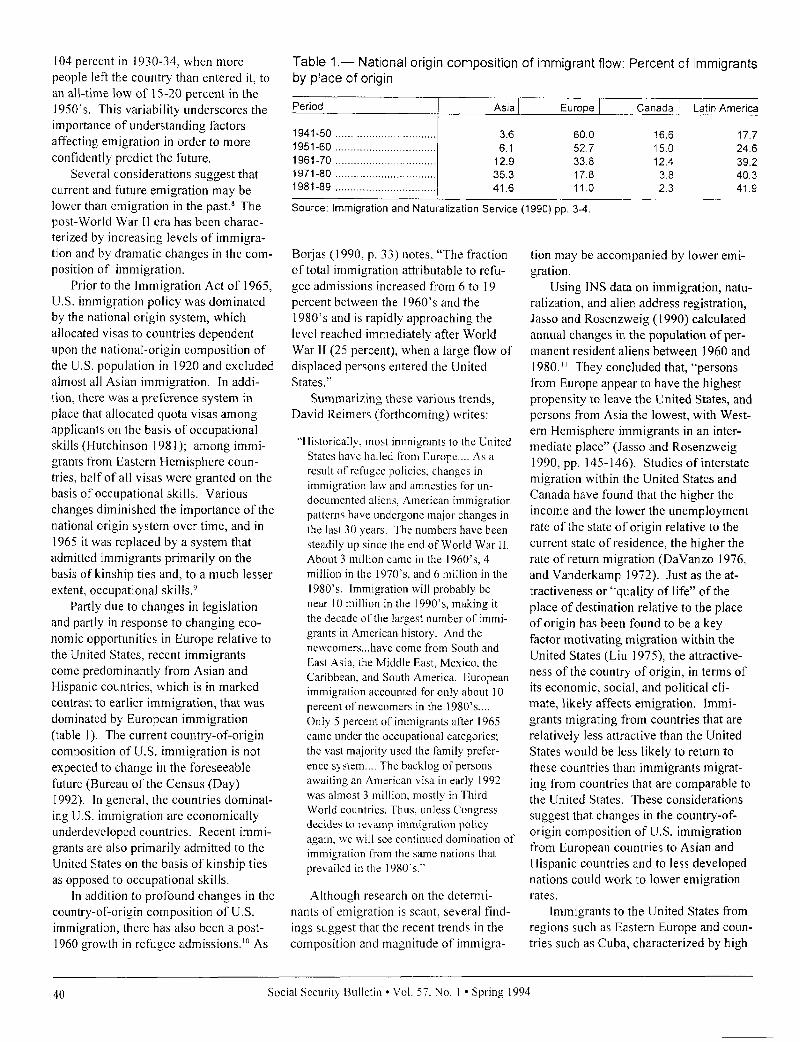
104 percent in 1930-34, when more people left the country than entered it, to an all-time low of 15-20 percent in the 1950’s. This variability underscores the importance of understanding factors affecting emigration in order to more confidently predict the future.
Table I.- National origin composition of immigrant flow: Percent of immigrants by place of origin
Period Asia Europe / Canada Latin America
Several considerations suggest that current and future emigration may be lower than emigration in the past.’ The post-World War II era has been charac- terized by increasing levels of immigra- tion and by dramatic changes in the com- position of immigration.
1941-50 . . . . .._.........__............*. 3.6 60.0 1951-60 _.__...._...._......_....,,,.,,,. 6.1 52.7 1961-70 .__._.__.,_.__..._..........,.,. 12.9 33.8 1971-80 ..,..._.._._.._,.,..,.,....,,.,,. 35.3 17.8 i 981-89 ,....__.._...__,,,,.,.........,,,, 41.6 11.0
Source: Immigration and Naturalization Service (1990) pp. 3-4.
Prior to the Immigration Act of 1965, U.S. immigration policy was dominated by the national origin system, which allocated visas to countries dependent upon ?he national-origin composition of the U.S. population in 1920 and excluded almost all Asian immigration. In addi- tion. there was a preference system in place that alIocated quota visas among applicants on the basis of occupational skills (Hutchinson 198 1); among immi- grants from Eastern Hemisphere coun- tries, helf of all visas were granted on the basis of occupational skills. Various changes diminished the importance of the national origin system over time, and in 1965 it was replaced by a system that admitted immigrants primarily on the basis of kinship ties and, to a much lesser extent, occupational skills.”
Borjas (1990, p. 33) notes, “The fraction of total immigration attributable to refu- gee admissions increased from 6 to I9 percent between the 1960’s and the 1980’s and is rapidly approaching the level reached immediately after World War II (25 percent), when a large flow of displaced persons entered the United States.”
Summarizing these various trends, David Reimers (forthcoming) writes:
Partly due to changes in legislation and partly in response to changing eco- nomic opportunities in Europe relative to the United States, recent immigrants come predominantly from Asian and Hispanic countries, which is in marked contrast to earlier immigration, that was dominated by European immigration (table 1). The current country-of-origin composition of U.S. immigration is not expected to change in the foreseeable future (Bureau of the Census (Day) 1992). In general. the countries dominat- ing U.S. immigration are economically underdeveloped countries. Recent immi- grants are also primarily admitted to the United States on the basis of kinship ties as opposed to occupational skills.
“Historically, most immigrants to the United States have hailed from Europe.... As a result of’refugec policies, changes in immigration la\v and amnesties for un- documented aliens. American immigration patterns have undergone major changes in the last 30 years. The numbers have been steadily up since the end of World War II. About 3 million came in the 1960’s, 4 million in the 1970’s. and 6 miilion in the 1980’s. Immigration will probably be near IO million in the 1990’s, making it the decade of the largest number of immi- grants in American history. And the newcomers...have come from South and East Asia, the Middle East, Mexico. the Caribbean, and South America. European immigration accounted for only about IO percent of newcomers in the 198O’s.... Only 5 percent of immigrants after 1965 came under the occupational categories; the vast majority used the family prefer- ence system.... The backlog of persons awaiting an American visa in early 1992 was almost 3 million, mostly in Third World countries. Thus, unless Congress decides to rev-amp immigration policy again, we will see continued domination of immigration from the same nations that prevailed in the 19X0’s,”
In addition to profound changes in the Although research on the determi- country-of-origin composition of U.S. nants of emigration is scant, several find- immigration, there has also been a post- ings suggest that the recent trends in the 1960 growth in refugee admissions.‘O As composition and magnitude of immigra-
16.6 17.7 15.0 24.6 12.4 39.2
3.8 40.3 2.3 41.9
tion may be accompanied by lower emi- gration.
Using INS data on immigration, natu- ralization, and alien address registration, Jasso and Rosenzweig (1990) calculated annual changes in the population of per- manent resident aliens between 1960 and 1980.” They concluded that, “persons from Europe appear to have the highest propensity to leave the United States, and persons from Asia the lowest, with West- ern Hemisphere immigrants in an inter- mediate place” (Jasso and Rosenzweig 1990. pp. 145-146). Studies of interstate migration within the United States and Canada have found that the higher the income and the lower the unemployment rate of the state of origin relative to the current state of residence, the higher the rate of return migration (DaVanzo 1976: and Vanderkamp 1972). Just as the at- tractiveness or “quality of life” of the place of destination relative to the place of origin has been found to be a key factor motivating migration within the United States (Liu 1975); the attractive- ness of the country of origin, in terms of its economic, social, and political cli- mate, likely affects emigration. Immi- grants migrating from countries that are relatively less attractive than the United States would be less likely to return to these countries than immigrants migrat- ing from countries that are comparable to the United States. These considerations suggest that changes in the country-of- origin composition of U.S. immigration from European countries to Asian and Hispanic countries and to less developed nations could work to lower emigration rates.
Immigrants to the United States from regions such as Eastern Europe and coun- tries such as Cuba, characterized by high
40 Social Security Bulletin l Vol. 57. No. I l Spring 1994
refugee admissions, have had low emi- gration rates (Warren 1979, and Jasso and Rosenzweig 1990). Indeed, it is the predominance of refugees during the 1950’s that probably accounts for the very low emigration during this period (see chart 2). One would expect the post- 1960’s rise in refugee admissions to contribute to lower emigration rates as well.
Migration studies suggest that prox- imity to family and friends is a key factor in the decision to migrate: people tend to migrate towards areas where family and friends are present, and the presence of family and friends in the place of origin discourages migration (Lansing and Mueller 1967, Fabricant 1970, Green- wood 1969, and Nelson 1959). It logi- cally follows that the greater the presence of family and friends in the United States, the lower the likelihood of emi- gration. Theoretically, the development of kinship-based immigrant communities in the United States (reflecting the pre- dominance of kinship-based admissions) should lower emigration.
A characteristic of recent immigrants is that they are starting at substantially lower earnings than earlier immigrants with similar levels of education (Borjas 1992). Various types of theoretical and empirical evidence suggest that immi- grants with low entry earnings, relative to other immigrants, have relatively high earnings growth (Chiswick 1978a, 1978b, 1979; and Duleep and Regets 1992, 1994(a), 1994(b), 1994(c)) and that reductions over time in the entry earnings of immigrant cohorts (defined by country of origin, age, and education) are associ- ated with increases in earnings growth (Duleep and Regets 1994(c)). The high earnings growth of immigrant cohorts with low entry earnings likely reflects high rates of investment following immi- gration in U.S.-specific skills by immi- grants initially lacking such skills. Theo- retically, the greater the investment in U.S.-specific skills, the lower the propen- sity to emigrate since time in the United States would be needed to reap the re- wards of the investment. As such, one might expect reductions in the entry earnings of immigrants (within age and education categories) to be associated
with reductions in the propensity to emi- grate.‘=
The relationship between the entry earnings of immigrants and their subse- quent emigration can be explored by computing the median earnings of immi- grants within cohorts defined by year of immigration, country of origin, and age, and then computing the 1 O-year emigra- tion rate for each cohort by counting how many immigrants are in the same cohort 10 years later using the subsequent de- cennial census. Using the 1970 and 1980 censuses, the median earnings in 1970 of cohorts of immigrants who entered the United States between I965 and 1970 were related to their 1 O-year emigration, as estimated by differences in cohort sample size between 1970 and 1980. This analysis reveals that immigrant cohorts with high entry earnings have higher emigration rates than immigrant cohorts with low entry earnings. The positive correlation between entry earn- ings and emigration persists within edu- cational categories. I3 An implication of this finding is that the precipitous over- time decline in the education-adjusted entry earnings of immigrants may be accompanied by a lower propensity to emigrate.
The preceding considerations suggest that the emigration rates for today’s im- migrants are likely to be lower than the historical estimates that guide the as- sumptions used to project Social Security’s financial status. Indeed, the Census Bureau’s mid-range population projection for the years I992 to 2050 assumes an annual immigration of 1,040,OOO and annual emigration of 160,000, with an implied emigration rate of 15.38 percent. I4 Underlying the Cen- sus Bureau’s projections of net immigra- tion is the idea that when immigration is high, emigration rates will be low and when immigration is low, emigration rates will be high. The rationale behind this assumption is that the same factors that attract large numbers of immigrants should logically lead to low propensities to emigrate. Since the Census Bureau’s mid-range net immigration projection assumes high immigration, the corre- sponding emigration rate is assumed to be low.
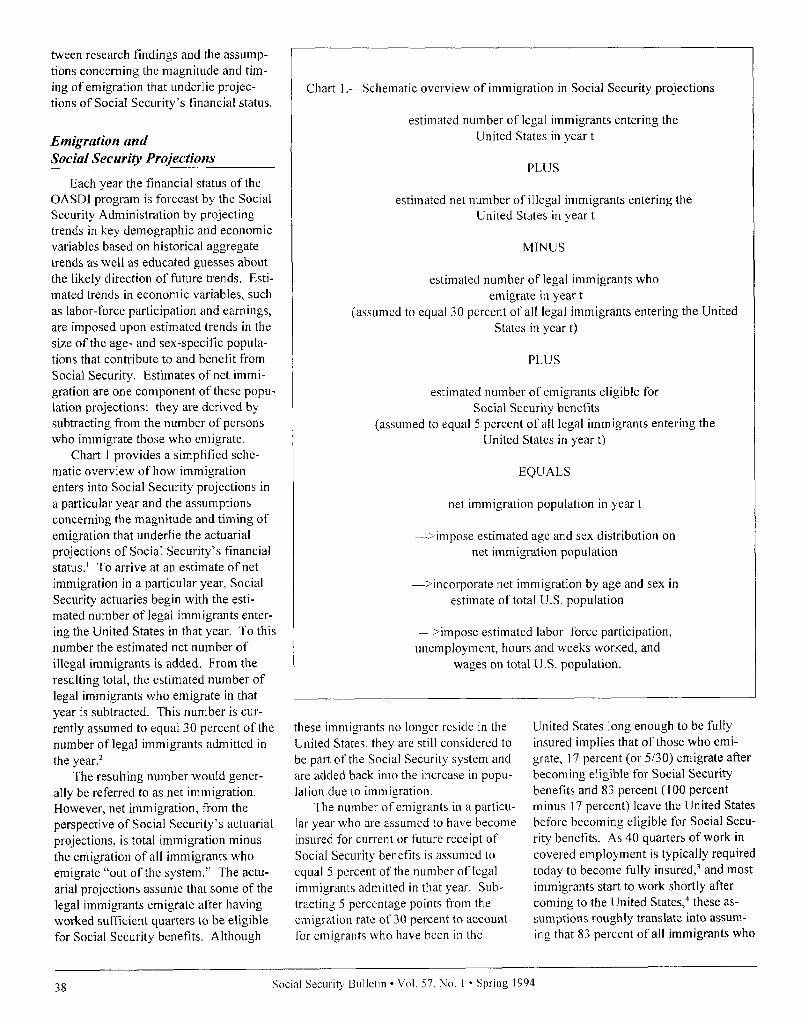
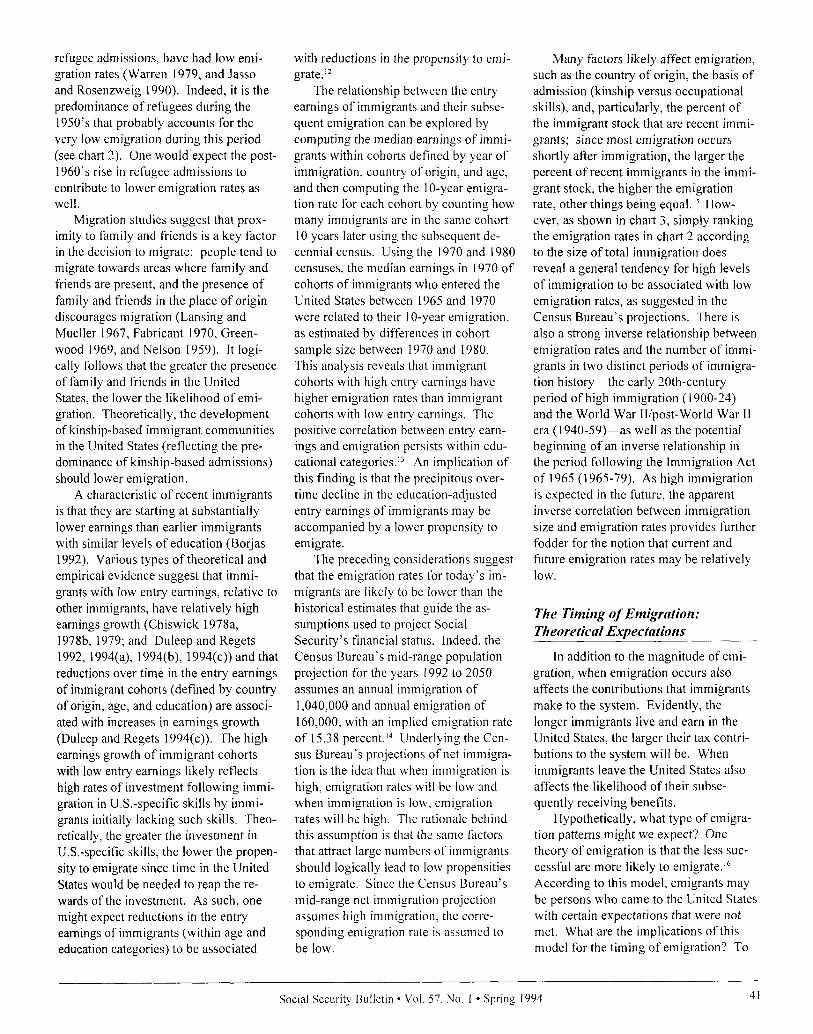
Many factors likely affect emigration, such as the country of origin, the basis of admission (kinship versus occupational skills), and, particularly, the percent of the immigrant stock that are recent immi- grants; since most emigration occurs shortly after immigration, the larger the percent ofrecent immigrants in the immi- grant stock, the higher the emigration rate, other things being equal.” How- ever, as shown in chart 3, simply ranking the emigration rates in chart 2 according to the size of total immigration does reveal a general tendency for high levels of immigration to be associated with low emigration rates, as suggested in the Census Bureau’s projections. There is also a strong inverse relationship between emigration rates and the number of immi- grants in two distinct periods of immigra- tion history-the early 20th-century period of high immigration ( 1900-24) and the World War II/post-World War II era (1940-59&as well as the potential beginning of an inverse relationship in the period following the Immigration Act of 1965 (1965-79). As high immigration is expected in the future, the apparent inverse correlation between immigration size and emigration rates provides further fodder for the notion that current and future emigration rates may be relatively low.
The Timing of Emigration: Theoretical Expectations
In addition to the magnitude of emi- gration, when emigration occurs also affects the contributions that immigrants make to the system. Evidently, the longer immigrants live and earn in the United States, the larger their tax contri- butions to the system will be. When immigrants leave the United States also affects the likelihood of their subse- quently receiving benefits.
Hypothetically, what type of emigra- tion patterns might we expect? One theory of emigration is that the less suc- cessful are more likely to emigrate.‘” According to this model, emigrants may be persons who came to the United States with certain expectations that were not met. What are the implications of this model for the timing of emigration? To
Social Security Bulletin 9 Vol. 57. No. I l Spring 1994 41
the extent that human capital acquired in the United States is not perfectly transfer- able to the country of origin, the opportu- nity cost of being in the United States, in terms of foregone investment in the country of origin, would increase the longer an immigrant stayed in the United States. (Forms of human capital invest- ment that may not be completely trans- ferable from the United States to the country of origin include obvious ones such as learning English for an immi- grant from a non-English speaking coun- try to more subtle ones such as the for- mation of work-related contacts.) At the same time, human capital specifically relevant to the immigrant’s country of
origin, acquired before migrating, would obsolesce. For both reasons, the cost of a mistaken immigration would increase with time spent in the United States. Accordingly, emigration would be ex- pected to occur soon after immigration. The nonpecuniary costs of emigration would likely rise as well with duration in the United States as attachments to the U.S. home, way of life, and friends grow. These increasing nonpecuniary costs of emigration would also work to make the probability of emigration fall with time in the United States.
Emigrants may also be individuals who never intended to stay permanently in the United States. Such persons likely
Chart 3.--Immigration and emigration, 1900-79
Emigration rate
1.2
1930.34 I
0.6
1,173 1,418 1,795 2,4l I 3,256 5,175
Number of immigrants (in thousands)
use U.S.-acquired capital and skills to improve their job opportunities and earn- ings in their country of origin. For in- stance, knowledge gained and contacts made from a stay in the United States might help a country-of-origin business that markets to the United States. This type of immigration would be of short duration as well since, following an ini- tial adjustment period, the incremental gains in future earnings in the country of origin from additional time spent in the United States would likely decrease, while the costs of being away from the country of origin in terms of obsoles- cence of country-of-origin human capital would increase.” Furthermore, the nonpecuniary costs of being away from one’s home country, relatives, and friends would increase the longer an immigrant was in the United States.
The preceding considerations suggest that, in the absence of other factors, emi- gration would generally occur shortly after immigration and that the probability of emigration would fall with time in the United States.
Social Security insurance is one fac- tor that might delay emigration among persons who never intended to stay in the United States and among persons who want to emigrate after some U.S. experi- ence. Being fully insured under the So- cial Security system, which is a necessary requirement for most Social Security benefits, requires that a person work a certain number of quarters in Social Security covered employment.‘8 For persons who turned 2 1 after 1950, 40 quarters (which would require a mini- mum of 10 years, if continuously em- ployed) are required to become fully insured.” For persons born earlier, fully insured status generally requires at least one quarter of coverage per year elapsing after 1950 and before the year in which the individual turns 62.*’ An important aspect of becoming fully insured is that it can be achieved at any time during a person’s work career and does not neces- sarily require employment close to the time of benefit receipt. Thus, immigrants could work the requisite number of quar- ters during their twenties, emigrate in their early thirties, and receive Social Security old-age benefits when they retire
42 Social Security Bulletin l Vol. 57, No. I l Spring 1994
30 years later in their countries of ori- gin.21
The closer an immigrant’s duration in the United States was to the required number of quarters of coverage, the more likely that emigration would be post- poned until fully insured status was achieved. Accordingly, one would ex- pect a surge of emigration at the number of years in the United States correspond- ing to the required work period for Social Security tilly insured status. Further- more, one would expect this type of emigration to increase the older immi- grants are when they immigrate to the United States, since the present value of retirement benefits increases with age at immigration, while the cost of foregone investments-in terms of staying longer in the United States than would otherwise be optimal-likely decreases with age at immigration.
Alternatively, emigrants might be immigrants who follow a work in the U.S./retire in country of origin model of immigration and emigration. In this model, immigrants have decided it is to their advantage to spend their working lives in the United States. However, upon retirement work-related factors are no longer relevant to the decision as to
where to live. Other concerns, such as a desire to spend one’s retirement years in the country of origin or cost-of-living differences between the United States and the country of origin, could domi- nate. Given these factors, one might expect an increase in emigration with the onset of retirement. Beyond retirement age, emigration would be unlikely since the decision as to where to spend retire- ment would probably be made to maxi- mize time in that location.
In the work in the U.S./retire in the country of origin model, the probability of emigration at retirement should in- crease with the age at which immigrants first entered the United States. The younger the age at immigration, the longer the preretirement time period over which nonpecuniary attachments to the United States would strengthen and coun- try-of-origin attachments would weaken. Both factors would make emigration at retirement age increasingly less likely the younger the age of immigration.
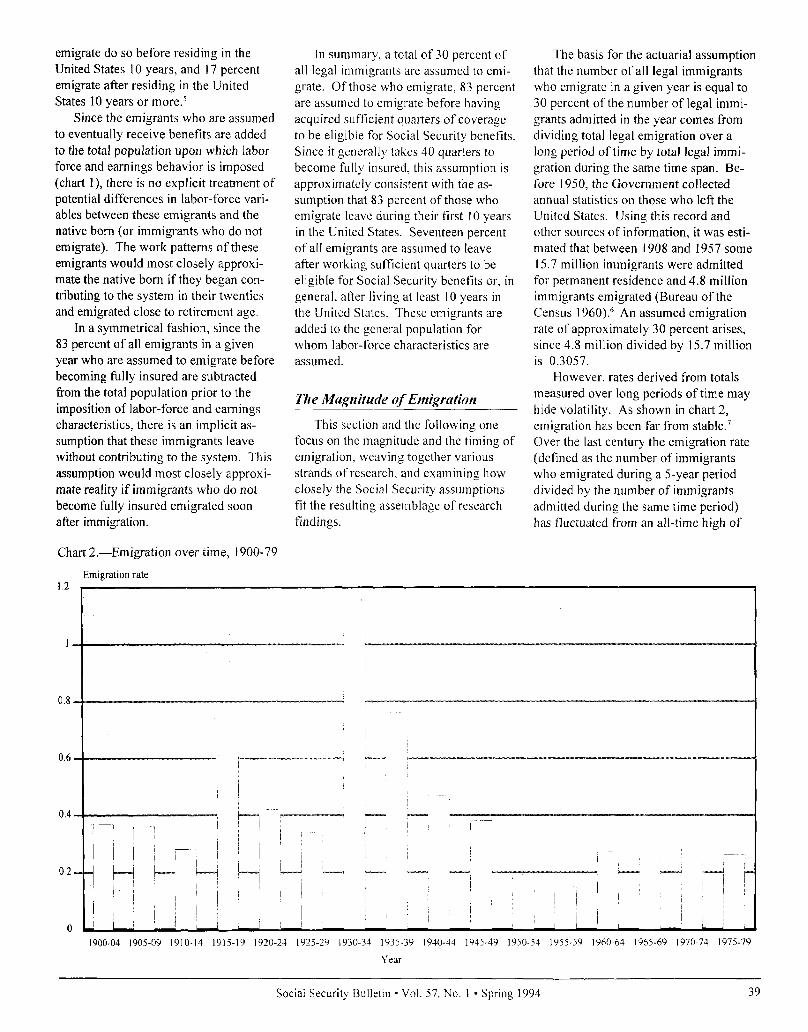
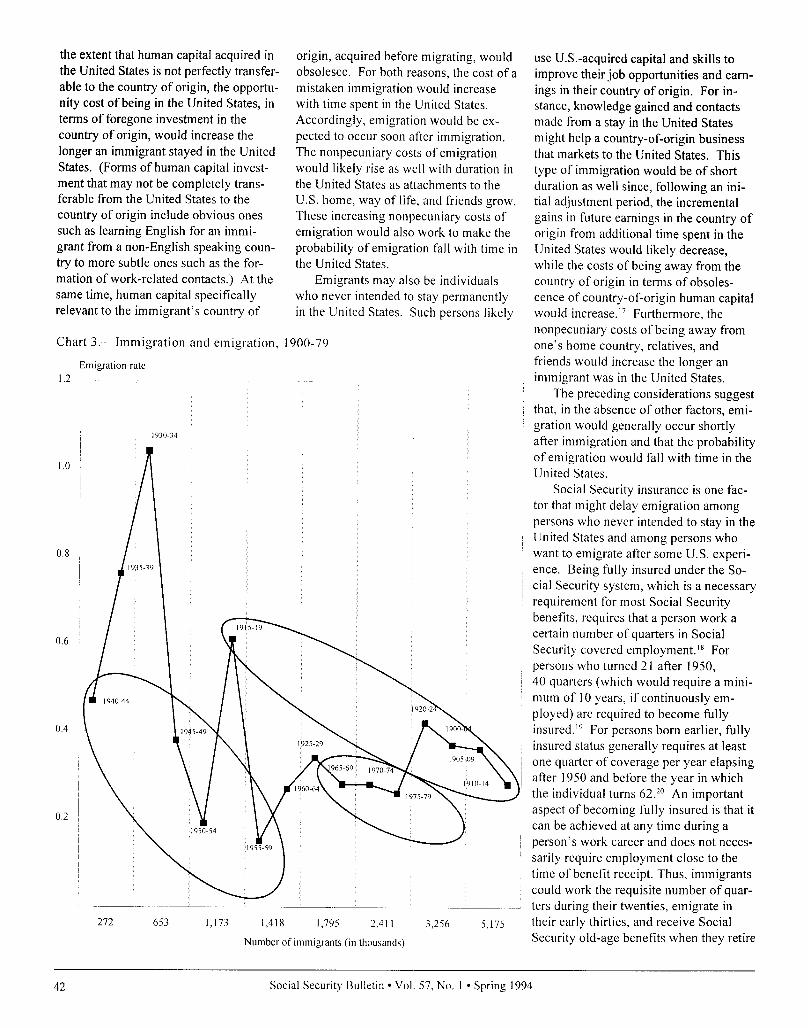
In summary, theoretical consider- ations suggest that most emigration will occur soon after immigration and that the probability of emigration after achieving Social Security benefit eligibility will increase with the age at which immi-
Chart 4.-The timing of emigration: theoretical expectations
Probability of emigration
grants first enter the United States. These theoretical considerations are jointly displayed in chart 4. This chart shows the probability of emigration as a func- tion of years in the United States and age at immigration. The dashed line in the age-at-immigration/years-in-the-U.S. plane delineates the retirement age, as- sumed to be 65. For example, this line shows that a person who immigrated to the United States at age 25 would reach the retirement age of 65 after 40 years in the United States. The dotted line shows the minimum duration in the United States (given an immigrant’s date of birth) required to become fully insured under Social Security.22 According to theoretical expectations, emigration tends to be concentrated in the first few years after immigration. However, the older the age at immigration, the more likely that immigrants will emigrate after stay- ing in the United States long enough to become fully insured and/or at retirement age.
The Timing cjf Emigration: Empirical Evidence
By piecing together results from various studies, a sketch of when emigra-
Age at immigration
Retirement age at 65
Social Security Bulletin l Vol. 57. No. I l Spring 1994
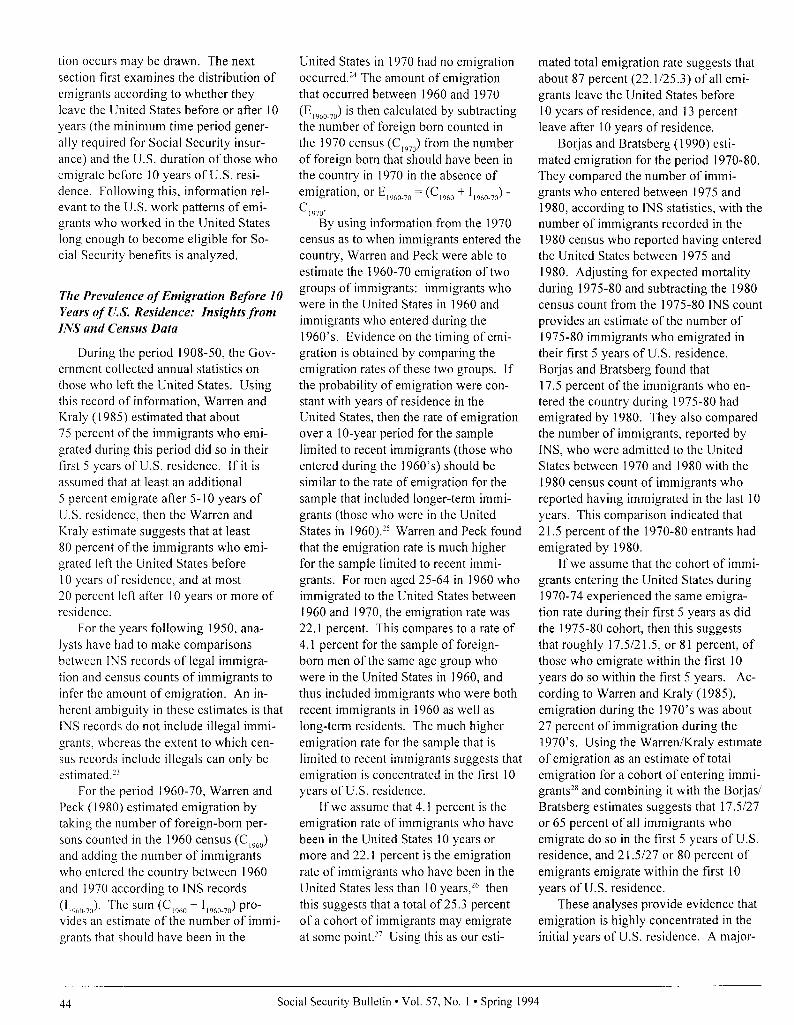
tion occurs may be drawn. The next section first examines the distribution of emigrants according to whether they leave the United States before or after 10 years (the minimum time period gener- ally required for Social Security insur- ance) and the U.S. duration of those who emigrate before IO years of U.S. resi- dence. Following this, information rel- evant to the U.S. work patterns of emi- grants who worked in the United States long enough to become eligible for So- cial Security benefits is analyzed.
The Prevalence of Emigration Before 10 Yews of U.S. Residence: Insights from INS and Census Data
During the period 1908-50, the Gov- ernment collected annual statistics on those who left the United States. Using this record of information, Warren and Kraly (1985) estimated that about 75 percent of the immigrants who emi- grated during this period did so in their first 5 years of U.S. residence. If it is assumed that at least an additional 5 percent emigrate after 5-10 years of U.S. residence, then the Warren and Kraly estimate suggests that at least 80 percent of the immigrants who emi- grated left the United States before IO years of residence, and at most 20 percent left after IO years or more of residence.
For the years following 1950, ana- lysts have had to make comparisons between INS records of legal immigra- tion and census counts of immigrants to infer the amount of emigration. An in- herent ambiguity in these estimates is that INS records do not include illegal immi- grants, whereas the extent to which cen- sus records include illegals can only be estimated.2’
For the period 1960-70, Warren and Peck (I 980) estimated emigration by taking the number of foreign-born per- sons counted in the 1960 census (C,,,,) and adding the number of immigrants who entered the country between 1960 and 1970 according to INS records
0 M.70)~ The sum G96” + 1,960.,o) pro- vides an estimate of the number of immi- grants that should have been in the
United States in 1970 had no emigration occurred.24 The amount of emigration that occurred between 1960 and 1970 (E,960-70) is then calculated by subtracting the number of foreign born counted in the 1970 census (C,,,,) from the number of foreign born that should have been in the country in 1970 in the absence of
emigration, or E,,,,.,, = (C,,,, + L,,,,,> - n L
1970 By using information from the 1970
census as to when immigrants entered the country, Warren and Peck were able to estimate the 1960-70 emigration of two groups of immigrants: immigrants who were in the United States in 1960 and immigrants who entered during the 1960’s. Evidence on the timing of emi- gration is obtained by comparing the emigration rates of these two groups. If the probability of emigration were con- stant with years of residence in the United States, then the rate of emigration over a IO-year period for the sample limited to recent immigrants (those who entered during the 1960’s) should be similar to the rate of emigration for the sample that included longer-term immi- grants (those who were in the United States in I 960).25 Warren and Peck found that the emigration rate is much higher for the sample limited to recent immi- grants. For men aged 25-64 in 1960 who immigrated to the United States between I960 and 1970, the emigration rate was 22.1 percent. This compares to a rate of 4.1 percent for the sample of foreign- born men of the same age group who were in the United States in 1960, and thus included immigrants who were both recent immigrants in 1960 as well as long-term residents. The much higher emigration rate for the sample that is limited to recent immigrants suggests that emigration is concentrated in the first 10 years of U.S. residence.
If we assume that 4.1 percent is the emigration rate of immigrants who have been in the United States 10 years or more and 22. I percent is the emigration rate of immigrants who have been in the United States less than 10 years,26 then this suggests that a total of 25.3 percent of a cohort of immigrants may emigrate at some point.Z7 Using this as our esti-
mated total emigration rate suggests that about 87 percent (22.1/25.3) of all emi- grants leave the United States before 10 years of residence, and I3 percent leave after IO years of residence.
Borjas and Bratsberg (1990) esti- mated emigration for the period 1970-80. They compared the number of immi- grants who entered between 1975 and 1980, according to INS statistics, with the number of immigrants recorded in the 1980 census who reported having entered the United States between 1975 and 1980. Adjusting for expected mortality during 1975-80 and subtracting the 1980 census count from the 1975-80 INS count provides an estimate of the number of 1975-80 immigrants who emigrated in their first 5 years of U.S. residence. Borjas and Bratsberg found that 17.5 percent of the immigrants who en- tered the country during 1975-80 had emigrated by 1980. They also compared the number of immigrants, reported by INS, who were admitted to the United States between 1970 and 1980 with the 1980 census count of immigrants who reported having immigrated in the last 10 years. This comparison indicated that 2 I .5 percent of the 1970-80 entrants had emigrated by 1980.
If we assume that the cohort of immi- grants entering the United States during 1970-74 experienced the same emigra- tion rate during their first 5 years as did the 1975-80 cohort, then this suggests that roughly 17.512 I .5, or 8 I percent, of those who emigrate within the first 10 years do so within the first 5 years. Ac- cording to Warren and Kraly (1985), emigration during the 1970’s was about 27 percent of immigration during the 1970’s. Using the WarreniKraly estimate of emigration as an estimate of total emigration for a cohort of entering immi- grants2* and combining it with the Borjasi Bratsberg estimates suggests that 17.5127 or 65 percent of all immigrants who emigrate do so in the first 5 years of U.S. residence, and 21.5127 or 80 percent of emigrants emigrate within the first IO years of U.S. residence.
These analyses provide evidence that emigration is highly concentrated in the initial years of U.S. residence. A major-
44 Social Security Bulletin l Vol. 57, No. 1 l Spring 1994
ity of the immigrants who emigrate do so within 5 years of U.S. residence, and about 80 percent or more emigrate within the first IO years. Only 13 to 20 percent of the immigrants who emi- grate appear to do so after 10 years. This range encompasses the current actuarial assumption that 17 percent of all emi- grants emigrate after becoming eligible for benefits.
Furthermore, these patterns of emi- gration appear to be stable over time. Given the historical constancy in the percent of all emigrants who leave the United States after 10 years, a better approach in Social Security projections may be to assume that a constant percent of emigrants emigrate after IO years, rather than assuming that 5 percent of all immigrants emigrate after IO years. Us- ing the current approach, the percent of all emigrants who leave after 10 years will vary with the emigration rate (as- sumed to be a certain percentage of the number of legal immigrants admitted during that period). For instance, if the number of emigrants during a given time period was assumed to be 20 percent of the number of immigrants during that time period (instead of the currently assumed 30 percent), then the projected percent of emigrants who emigrate after 10 years would be 5 percent divided by 20 percent, or 25 percent, instead of I7 percent (5130). If the number of emi- grants was assumed to be 35 percent of the number of immigrants, the projected percent of emigrants who emigrate after 10 years would be 14 percent (5/35). Yet, the preceding analysis suggests that the percent of emigrants who leave after 10 years may not systematically vary with the level of emigration. A prefer- able procedure may be to assume (once the level of emigration has been chosen) that a constant percent of emigrants emi- grate after attaining Social Security eligi- bility.*” The analytical review presented here suggests that the appropriate per- centage of emigrants who eventually receive Social Security benefits is in the neighborhood of the currently assumed 17 percent.
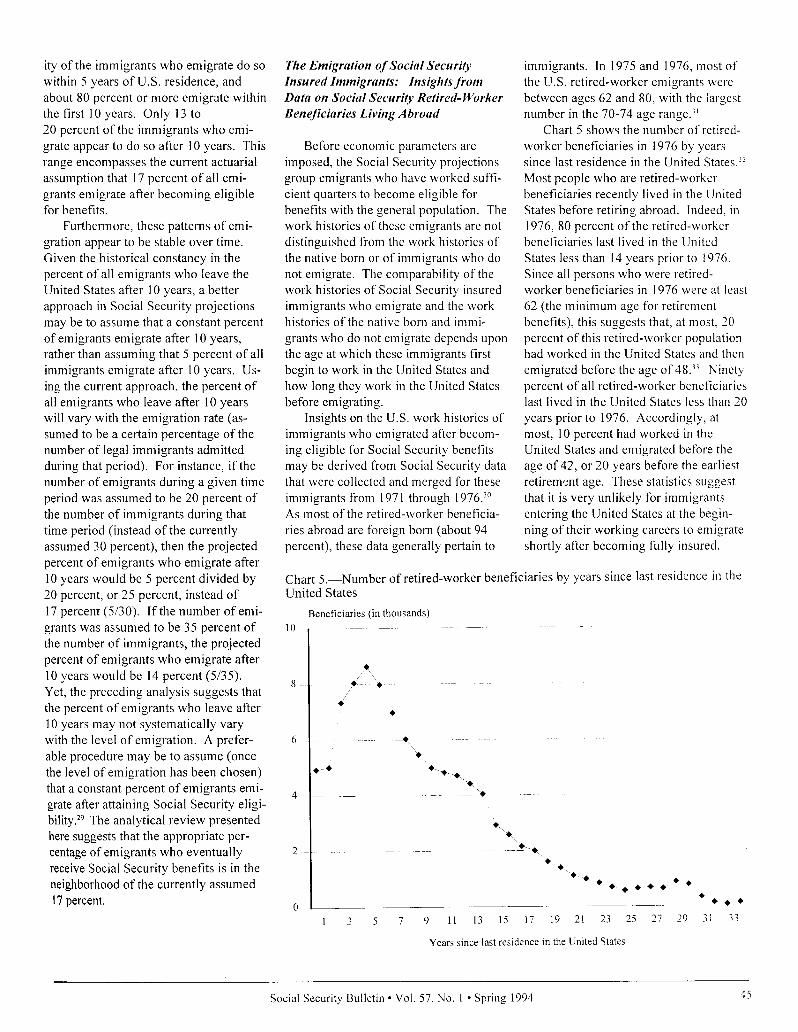
The Emigration of Social Security immigrants. In 1975 and 1976, most of Insured Immigrants: Insights from the U.S. retired-worker emigrants were Data on Social Security Retired- Worker between ages 62 and 80, with the largest Benejlcinries Living Abroad number in the 70-74 age range.”
Before economic parameters are imposed, the Social Security projections group emigrants who have worked sufti- cient quarters to become eligible for benefits with the general population. The work histories of these emigrants are not distinguished from the work histories of the native born or of immigrants who do not emigrate. The comparability of the work histories of Social Security insured immigrants who emigrate and the work histories of the native born and immi- grants who do not emigrate depends upon the age at which these immigrants first begin to work in the United States and how long they work in the United States before emigrating.
Insights on the U.S. work histories of immigrants who emigrated after becom- ing eligible for Social Security benefits may be derived from Social Security data that were collected and merged for these immigrants from I97 I through 1976.j” As most of the retired-worker beneficia- ries abroad are foreign born (about 94 percent), these data generally pertain to
Chart 5 shows the number of retired- worker beneficiaries in 1976 by years since last residence in the United States.‘? Most people who are retired-worker beneficiaries recently lived in the United States before retiring abroad. Indeed, in 1976, 80 percent of the retired-worker beneficiaries last lived in the United States less than 14 years prior to 1976. Since all persons who were retired- worker beneficiaries in 1976 were at least 62 (the minimum age for retirement benefits), this suggests that, at most, 20 percent of this retired-worker population had worked in the United States and then emigrated before the age of 48.” Ninety percent of all retired-worker beneficiaries last lived in the United States less than 20 years prior to 1976. Accordingly, at most, 10 percent had worked in the United States and emigrated before the age of 42, or 20 years before the earliest retirement age. These statistics suggest that it is very unlikely for immigrants entering the United States at the begin- ning of their working careers to emigrate shortly after becoming fully insured.
Chart 5.-Number of retired-worker beneficiaries by years since last residence in the United States
Beneficiaries (in thousands)
lo I ~~~~ ~~ ~~ ~
9 11 13 15 17 19 21 23 25 27 29 3i 33
Years since last residence in the United States
Social Security Bulletin l Vol. 57. No. I l Spring 1994
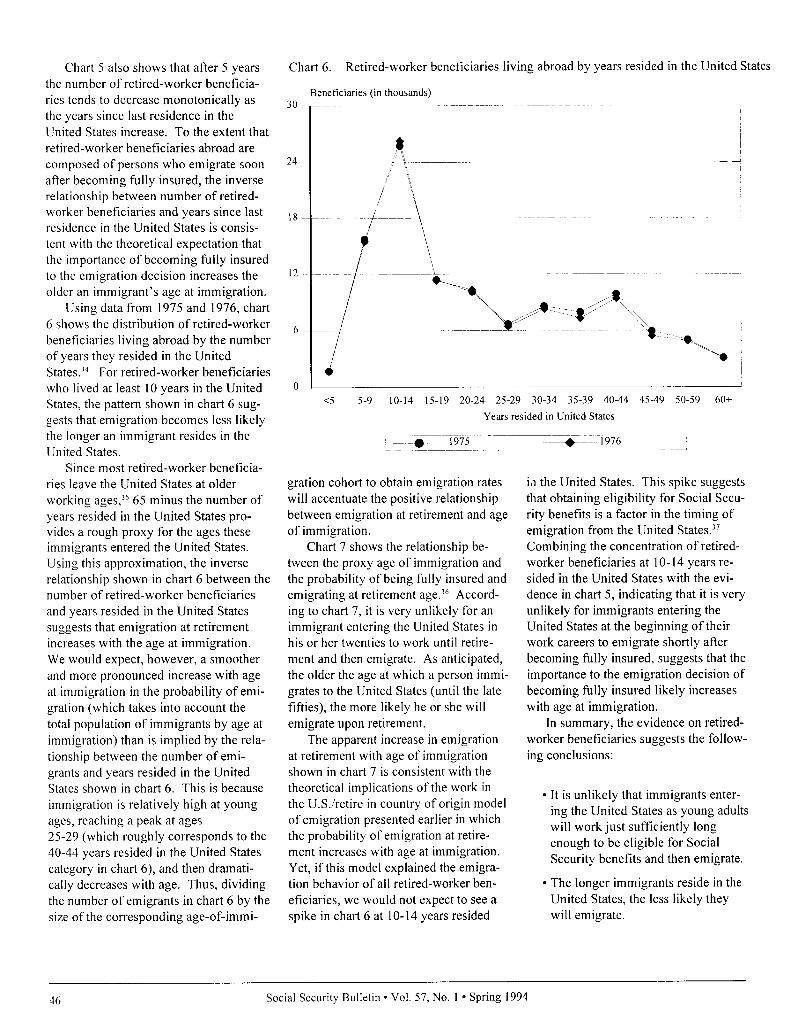
Chart 5 also shows that after 5 years the number of retired-worker beneficia- ries tends to decrease monotonically as the years since last residence in the United States increase. To the extent that retired-worker beneficiaries abroad are composed of persons who emigrate soon after becoming fully insured, the inverse relationship between number of retired- worker beneficiaries and years since last residence in the United States is consis- tent with the theoretical expectation that the importance of becoming fully insured to the emigration decision increases the older an immigrant’s age at immigration.
Using data from 1975 and 1976, chart 6 shows the distribution of retired-worker beneficiaries living abroad by the number of years they resided in the United States.14 For retired-worker beneficiaries who lived at least 10 years in the United States, the pattern shown in chart 6 sug- gests that emigration becomes less likely the longer an immigrant resides in the United States.
Since most retired-worker beneficia- ries leave the United States at older working ages,35 65 minus the number of years resided in the United States pro- vides a rough proxy for the ages these immigrants entered the United States. Using this approximation, the inverse relationship shown in chart 6 between the number of retired-worker beneficiaries and years resided in the United States suggests that emigration at retirement increases with the age at immigration. We would expect, however, a smoother and more pronounced increase with age at immigration in the probability of emi- gration (which takes into account the total population of immigrants by age at immigration) than is implied by the rela- tionship between the number of emi- grants and years resided in the United States shown in chart 6. This is because immigration is relatively high at young ages, reaching a peak at ages 25-29 (which roughly corresponds to the 40-44 years resided in the United States category in chart 6) and then dramati- cally decreases with age. Thus, dividing the number of emigrants in chart 6 by the size of the corresponding age-of-immi-
Chart 6.-Retired-worker beneficiaries living abroad by years resided in the United States
Beneficiaries (in thousands)
24
I 4 5-9 lo-14 15-19 20-24 25-29 30-34 35-39 40-44 45-49 50-59 60+
Years resided in United States
gration cohort to obtain emigration rates will accentuate the positive relationship between emigration at retirement and age of immigration.
Chart 7 shows the relationship be- tween the proxy age of immigration and the probability of being fully insured and emigrating at retirement age.36 Accord- ing to chart 7, it is very unlikely for an immigrant entering the United States in his or her twenties to work until retire- ment and then emigrate. As anticipated, the older the age at which a person immi- grates to the United States (until the late fifties), the more likely he or she will emigrate upon retirement.
The apparent increase in emigration at retirement with age of immigration shown in chart 7 is consistent with the theoretical implications of the work in the U.S./retire in country of origin model of emigration presented earlier in which the probability of emigration at retire- ment increases with age at immigration. Yet, if this model explained the emigra- tion behavior of all retired-worker ben- eficiaries, we would not expect to see a spike in chart 6 at 1 O-l 4 years resided
in the United States. This spike suggests that obtaining eligibility for Social Secu- rity benefits is a factor in the timing of emigration from the United States3’ Combining the concentration of retired- worker beneficiaries at lo- 14 years re- sided in the United States with the evi- dence in chart 5, indicating that it is very unlikely for immigrants entering the United States at the beginning of their work careers to emigrate shortly after becoming fully insured, suggests that the importance to the emigration decision of becoming fully insured likely increases with age at immigration.
In summary, the evidence on retired- worker beneficiaries suggests the follow- ing conclusions:
l It is unlikely that immigrants enter- ing the United States as young adults will work just sufficiently long enough to be eligible for Social Security benefits and then emigrate.
l The longer immigrants reside in the United States, the less likely they will emigrate.
46 Social Security Bulletin l Vol. 57, No. I l Spring 1994
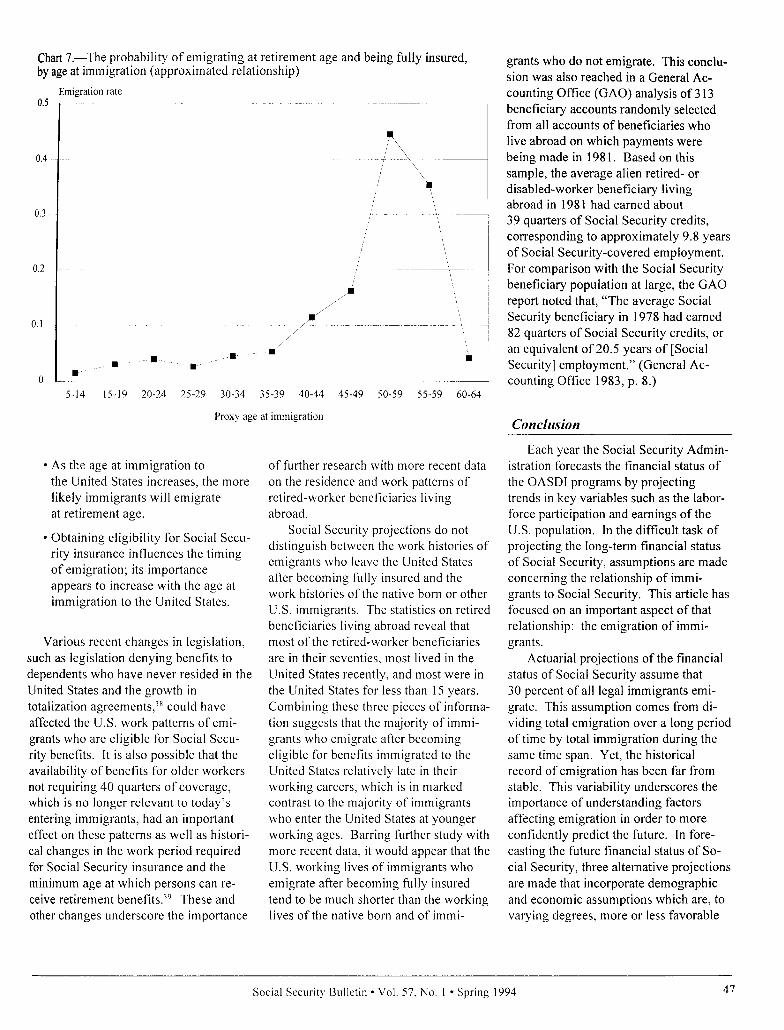
Chart 7.-The probability of emigrating at retirement age and being fully insured, by age at immigration (approximated relationship)
Emigration rate 0.5
0.4
0.3
0.2
0.1
0
5-14 15-19 20-24 25-29 30-34 35-39 40-44 45-49 50-59 55-59 60-64
Proxy age at immigration
l As the age at immigration to of further research with more recent data the United States increases, the more on the residence and work patterns of likely immigrants will emigrate retired-worker beneficiaries living at retirement age. abroad.
. Obtaining eligibility for Social Secu- rity insurance influences the timing of emigration; its importance appears to increase with the age at immigration to the United States.
Social Security projections do not distinguish between the work histories of emigrants who leave the United States after becoming fully insured and the work histories of the native born or other U.S. immigrants. The statistics on retired beneficiaries living abroad reveal that most of the retired-worker beneficiaries are in their seventies, most lived in the United States recently, and most were in the United States for less than 15 years. Combining these three pieces of informa- tion suggests that the majority of immi- grants who emigrate after becoming eligible for benefits immigrated to the United States relatively late in their working careers, which is in marked contrast to the majority of immigrants who enter the United States at younger working ages. Barring further study with more recent data, it would appear that the U.S. working lives of immigrants who emigrate after becoming fully insured tend to be much shorter than the working lives of the native born and of immi-
Various recent changes in legislation, such as legislation denying benefits to dependents who have never resided in the United States and the growth in totalization agreements3* could have affected the U.S. work patterns of emi- grants who are eligible for Social Secu- rity benefits. It is also possible that the availability of benefits for older workers not requiring 40 quarters of coverage, which is no longer relevant to today’s entering immigrants, had an important effect on these patterns as well as histori- cal changes in the work period required for Social Security insurance and the minimum age at which persons can re- ceive retirement benefits.” These and other changes underscore the importance
grants who do not emigrate. This conclu- sion was also reached in a General Ac- counting Office (GAO) analysis of 3 13 beneficiary accounts randomly selected from all accounts of beneficiaries who live abroad on which payments were being made in 198 1. Based on this sample, the average alien retired- or disabled-worker beneficiary living abroad in 198 1 had earned about 39 quarters of Social Security credits, corresponding to approximately 9.8 years of Social Security-covered employment. For comparison with the Social Security beneficiary population at large, the GAO report noted that, “The average Social Security beneficiary in 1978 had earned 82 quarters of Social Security credits, or an equivalent of 20.5 years of [Social Security] employment.” (General Ac- counting Office 1983, p. 8.)
Conclusion
Each year the Social Security Admin- istration forecasts the financial status of the OASDI programs by projecting trends in key variables such as the labor- force participation and earnings of the U.S. population. In the difficult task of projecting the long-term financial status of Social Security, assumptions are made concerning the relationship of immi- grants to Social Security. This article has focused on an important aspect of that relationship: the emigration of immi- grants.
Actuarial projections of the financial status of Social Security assume that 30 percent of all legal immigrants emi- grate. This assumption comes from di- viding total emigration over a long period of time by total immigration during the same time span. Yet, the historical record of emigration has been far from stable. This variability underscores the importance of understanding factors affecting emigration in order to more confidently predict the future. In fore- casting the future financial status of So- cial Security, three alternative projections are made that incorporate demographic and economic assumptions which are, to varying degrees, more or less favorable
Social Security Bulletin l Vol. 57, No. I l Spring 1994 47
to Social Security’s financial status. The same emigration rate is assumed in all three projections.
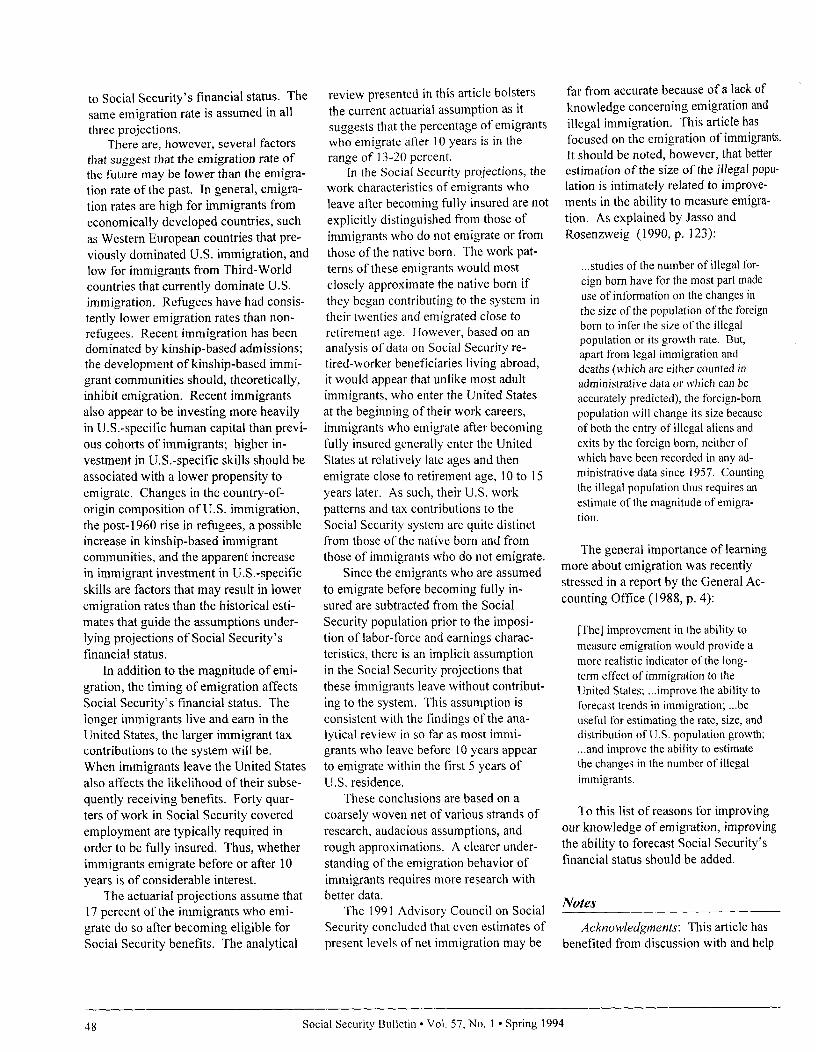
There are, however, several factors that suggest that the emigration rate of the future may be lower than the emigra- tion rate of the past. In general, emigra- tion rates are high for immigrants from economically developed countries, such as Western European countries that pre- viously dominated U.S. immigration, and low for immigrants from Third-World countries that currently dominate U.S. immigration. Refugees have had consis- tently lower emigration rates than non- refugees. Recent immigration has been dominated by kinship-based admissions; the development of kinship-based immi- grant communities should, theoretically, inhibit emigration. Recent immigrants also appear to be investing more heavily in U.S.-specific human capital than previ- ous cohorts of immigrants; higher in- vestment in U.S.-specific skills should be associated with a lower propensity to emigrate. Changes in the country-of- origin composition of U.S. immigration, the post- 1960 rise in refugees, a possible increase in kinship-based immigrant communities, and the apparent increase in immigrant investment in U.S.-specific skills are factors that may result in lower emigration rates than the historical esti- mates that guide the assumptions under- lying projections of Social Security’s financial status.
In addition to the magnitude of emi- gration, the timing of emigration affects Social Security’s financial status. The longer immigrants live and earn in the United States, the larger immigrant tax contributions to the system will be. When immigrants leave the United States also affects the likelihood of their subse- quently receiving benefits. Forty quar- ters of work in Social Security covered employment are typically required in order to be fully insured. Thus, whether immigrants emigrate before or after 10 years is of considerable interest.
The actuarial projections assume that 17 percent of the immigrants who emi- grate do so after becoming eligible for Social Security benefits. The analytical
review presented in this article bolsters the current actuarial assumption as it suggests that the percentage of emigrants who emigrate after 10 years is in the range of 13-20 percent.
In the Social Security projections, the work characteristics of emigrants who leave after becoming fully insured are not explicitly distinguished from those of immigrants who do not emigrate or from those of the native born. The work pat- terns of these emigrants would most closely approximate the native born if they began contributing to the system in their twenties and emigrated close to retirement age. However, based on an analysis of data on Social Security re- tired-worker beneficiaries living abroad, it would appear that unlike most adult immigrants, who enter the United States at the beginning of their work careers, immigrants who emigrate after becoming fully insured generally enter the United States at relatively late ages and then emigrate close to retirement age, 10 to 1.5 years later. As such, their U.S. work patterns and tax contributions to the Social Security system are quite distinct from those of the native born and from those of immigrants who do not emigrate.
Since the emigrants who are assumed to emigrate before becoming fully in- sured are subtracted from the Social Security population prior to the imposi- tion of labor-force and earnings charac- teristics, there is an implicit assumption in the Social Security projections that these immigrants leave without contribut- ing to the system. This assumption is consistent with the findings of the ana- lytical review in so far as most immi- grants who leave before 10 years appear to emigrate within the first 5 years of U.S. residence.
These conclusions are based on a coarsely woven net of various strands of research, audacious assumptions, and rough approximations. A clearer under- standing of the emigration behavior of immigrants requires more research with better data.
The 199 1 Advisory Council on Social Security concluded that even estimates of present levels of net immigration may be
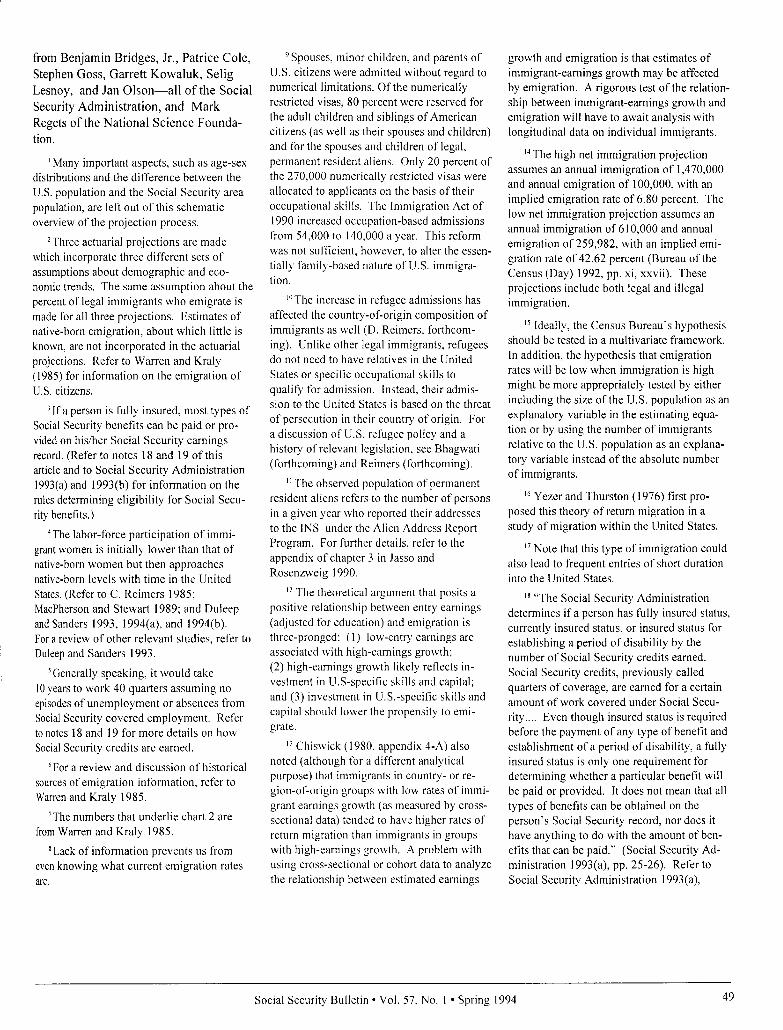
far from accurate because of a lack of knowledge concerning emigration and illegal immigration. This article has focused on the emigration of immigrants. It should be noted, however, that better estimation of the size of the illegal popu- lation is intimately related to improve- ments in the ability to measure emigra- tion. As explained by Jasso and Rosenzweig (1990, p. 123):
. ..studies of the number of illegal for- eign born have for the most part made use of information on the changes in the size of the population of the foreign born to infer the size of the illegal population or its growth rate. But, apart from legal immigration and deaths (which are either counted in administrative data or which can be accurately predicted), the foreign-born population will change its size because of both the entry of illegal aliens and exits by the foreign born, neither of which have been recorded in any ad- ministrative data since 1957. Counting the illegal population thus requires an estimate of the magnitude of emigra- tion.
The general importance of learning more about emigration was recently stressed in a report by the General Ac- counting Office (1988, p. 4):
[The] improvement in the ability to measure emigration would provide a more realistic indicator of the long- term effect of immigration to the United States; . ..improve the ability to forecast trends in immigration; . ..be useful for estimating the rate, size, and distribution of U.S. population growth; . ..and improve the ability to estimate the changes in the number of illegal immigrants.
To this list of reasons for improving our knowledge of emigration, improving the ability to forecast Social Security’s financial status should be added.
Notes
Acknowledgments: This article has benefited from discussion with and help
48 Social Security Bulletin l Vol. 57, No. I l Spring 1994
from Benjamin Bridges, Jr., Patrice Cole, Stephen Goss, Garrett Kowaluk, Selig Lesnoy, and Jan Olson-all of the Social Security Administration, and Mark Regets of the National Science Founda- tion.
’ Many important aspects, such as age-sex distributions and the difference between the US. population and the Social Security area population, are left out of this schematic overview of the prqjection process.
2 Three actuarial projections are made which incorporate three different sets of assumptions about demographic and eco- nomic trends, The same assumption about the percent of legal immigrants who emigrate is made for all three prqjections. Estimates of native-born emigration, about which little is known, are not incorporated in the actuarial projections. Refer to Warren and Kraly (1985) for information on the emigration of U.S. citizens.
’ I f a person is fully insured, most types of Social Security benefits can be paid or pro- vided on his/her Social Security earnings record. (Refer to notes I8 and 19 of this article and to Social Security Administration 1993(a) and 1993(b) for information on the rules determining eligibility for Social Secu- rity benefits.)
‘The labor-force participation of immi- grant women is initially lower than that of native-born women but then approaches native-born levels with time in the United States. (Refer to C. Reimers 1985; MacPherson and Stewart 1989; and Duleep and Sanders 1993, 1994(a), and 1994(b). For a review of other relevant studies, refer to Duleep and Sanders 1993.
(Generally speaking. it would take IO years to work 40 quarters assuming no episodes of unemployment or absences from Social Security covered employment. Refer to notes 18 and I9 for more details on how Social Security credits are earned.
“For a review and discussion of historical sources of emigration information, refer to Warren and Kraly 1985.
‘The numbers that underlie chart 2 are from Warren and Kraly 1985.
“Lack of information prevents us from even knowing what current emigration rates are.
“Spouses. minor children, and parents of U.S. citizens were admitted without regard to numerical limitations. Of the numerically restricted visas, 80 percent were reserved for the adult children and siblings of American citizens (as well as their spouses and children) and for the spouses and children of legal, permanent resident aliens. Only 20 percent of the 270,000 numerically restricted visas were allocated to applicants on the basis of their occupational skills. The Immigration Act of 1990 increased occupation-based admissions from 54,000 to 140,000 a year. This reform was not sufficient, however, to alter the essen- tially family-based nature of U.S. immigra- tion.
“‘The increase in refugee admissions has affected the country-of-origin composition of immigrants as well (D. Reimers, forthcom- ing). Unlike other legal immigrants, refugees do not riced to have relatives in the United States or specific occupational skills to qualify for admission. Instead, their admis- sion to the United States is based on the threat of persecution in their country of origin, For a discussion of U.S. refugee policy and a history of relevant legislation, see Bhagwati (forthcoming) and Reimers (forthcoming).
I! The observed population of permanent resident aliens refers to the number of persons in a given year who reported their addresses to the INS under the Alien Address Report Program. For further details, refer to the appendix of chapter 3 in Jasso and Rosenzweig 1990.
I2 The theoretical argument that posits a positive relationship between entry earnings (ad.justed for education) and emigration is three-pronged: (I) low-entry earnings are associated with high-earnings growth; (2) high-earnings growth likely reflects in- vestment in U.S-specific skills and capital; and (3) investment in IJ.S.-specific skills and capital should lower the propensity to emi- grate.
” Chiswick (1980, appendix 4-A) also noted (although for a different analytical purpose) that immigrants in country- or re- gion-of-origin groups with low rates of immi- grant earnings growth (as measured by cross- sectional data) tended to have higher rates of return migration than immigrants in groups with high-earnings growth. A problem with using cross-sectional or cohort data to analyze the relationship between estimated earnings
growth and emigration is that estimates of immigrant-earnings growth may be affected by emigration. A rigorous test of the relation- ship between immigrant-earnings growth and emigration will have to await analysis with longitudinal data on individual immigrants.
I4 The high net immigration projection assumes an annual immigration of I ,470,OOO and annual emigration of 100,000, with an implied emigration rate of 6.80 percent. The low net immigration projection assumes an annual immigration of 610,000 and annual emigration of 259,982, with an implied emi- gration rate of 42.62 percent (Bureau of the Census (Day) 1992, pp. xi, xxvii). These projections include both legal and illegal immigration.
‘j Ideally, the Census Bureau’s hypothesis should be tested in a multivariate framework. In addition, the hypothesis that emigration rates will be low when immigration is high might be more appropriately tested by either including the size of the U.S. population as an explanatory variable in the estimating equa- tion or by using the number of immigrants relative to the U.S. population as an explana- tory variable instead of the absolute number of immigrants.
r6 Yezer and Thurston (1976) first pro- posed this theory of return migration in a study of migration within the United States.
” Note that this type of immigration could also lead to frequent entries of short duration into the United States.
I* “The Social Security Administration determines if a person has fully insured status, currently insured status, or insured status for establishing a period of disability by the number of Social Security credits earned. Social Security credits, previously called quarters of coverage, are earned for a certain amount of work covered under Social Secu- rity.... Even though insured status is required before the payment of any type of benefit and establishment of a period of disability, a fully insured status is only one requirement for determining whether a particular benefit will be paid or provided. It does not mean that all types of benefits can be obtained on the person’s Social Security record, nor does it have anything to do with the amount of ben- efits that can be paid.” (Social Security Ad- ministration 1993(a), pp. 25-26). Refer to Social Security Administration 1993(a),
Social Security Bulletin l Vol. 57, No. I l Spring 1994 49
pp. 30-32 for a table showing the type of insured status required for each type of Social Security benefit.
I’) The expression “continuously em- ployed” is somewhat loosely used here. So- cial Security credits are earned by working at a job covered by Social Security. In general, to earn a credit in a calendar quarter for years prior to 1978, the individual must be paid $50 or more in wages in that quarter for covered employment or credited with the maximum taxable wages for that year. (For rules cover- ing self-employment and agriculture labor for years prior to 1978, refer to Social Security Administration 1993(a), pp. 32.) For years after 1977, the amount of annual wages or self-employment income necessary to acquire a specified number of quarters of coverage is determined by a formula that reflects national percentage increases in average wages (Social Security Administration 1993(a), pp. 32-33). For further details on the rules determining how credits are earned, refer to Social Secu- rity Administration 1993(a), pp. 32-35.
*O The decreasing number of required quarters with earlier birth years is to accom- modate the shorter potential working life under covered employment for persons who were already in the work force when the Social Security system was initiated. For more detail on the current and past rules governing eligibility for Social Security benefits, refer to Social Security Administra- tion 1993(a) and 1993(b).
21 This contrasts with Disability Insurance, which requires recent employment to be eligible for benefits.
22 This line is drawn assuming continuous employment and as if all of the immigrants entered the United States in 1970. The later the assumed year of immigration, the more the broken line would approach a straight line at 10 years in the United States.
23 Studies estimating the size of the illegal immigrant population include Passe1 and Robinson (1987) and Warren and Passe1 (1987).
24 This description is a highly simplified account of the Warren and Peck (I 980) meth- odology. For instance, in addition to adjust- ing for expected mortality, Warren and Peck adjust for the net migration of foreign-born students and differences between the 1960 and 1970 censuses in census undercount.
25 In actual fact, the 1960-70 emigration of immigrants who entered the United States during the 1960’s measures emigration over a period of 10 years or less.
“The figure of 4.1 percent overestimates the emigration rate of immigrants who have resided in the United States 10 years or more, since immigrants who had recently immi- grated were included in the 1960 population for which this rate was computed.
27 The total emigration rate is calculated in the following way: 0.221 + 0.041 (1 - 0.221) = 0.253. To arrive at a total emi- gration rate requires assuming that the emi- gration of a cohort of immigrants may be approximated by piecing together emigration rates for immigrants who have been in the United States varying lengths of time.
2X The Warren and Kraly estimate of the emigration rate is derived by dividing the number of immigrants who emigrated during a 5-year period by the number of immigrants admitted during the same time period. An average of their emigration rates for 1970-74 and 1975-79 (0.284 and 0.261, respectively) is 0.27. Warren and Kraly did not intend for their emigration rate estimates to portray the expected total emigration of a given cohort as is done here. To use their estimates in this manner requires two assumptions. One as- sumption is that there are no year-of-immigra- tion cohort effects in emigration. That is, persons who immigrated during the 1950’s, for instance, are assumed to have the same probability of emigrating after a given num- ber of years as persons who immigrated in the 1960’s. More troubling is the assumption that the size of entering immigrant cohorts is constant over time. To see that this assump- tion is required, consider first a cross-sec- tional estimate of the emigration rate across year-of-immigration cohorts using data that measures whether emigration occurred during 1975-79. The cross-sectional estimate would be computed in the following way: (number who emigrated O-4 years after immigration/ number who immigrated 1975-79) + (number who emigrated 5-9 years after immigration/ number who immigrated 1970-74) + (number who emigrated I O-14 years after immigration/ number who immigrated 1965-69) and so forth. The Warren-Kraly estimated emigration rate for 1975-79 is computed as (number who emigrated 1975-79inumber who immigrated 1975-79) which could also be written as (number who emigrated 1975-79 and who had immigrated I975-79inumber who immigrated 1975-79) + (number who emigrated 1975-79 and who had immigrated 1970-74inumber who immigrated 1975-79) + (number who emigrated 1975-79 and who had immigrated 1965-69inumber who immigrated 1975-79) and so forth. The WarrcniKraly estimated emigration rate and the cross-sectional esti-
mate would be equivalent if the number who immigrated 1975-79 = the number who immi- grated 1970-74 = the number who immigrated 1965-69, and so forth.
29 Of course, if the assumed emigration rate, as defined earlier, never changes in the actuarial projections, then this suggestion is irrelevant.
“’ The data tabulations that form the basis for this analysis may be found in Social Secu- rity Administration (197 l-76).
j1 In 1976,46 percent of the Social Secu- rity beneficiaries residing abroad were retired- worker beneficiaries, 3 percent were disabled- worker beneficiaries, 2 1 percent were the dependents of retired and disabled workers, and 30 percent were survivor beneficiaries.
32 “Years since last residence in the United States,” was tabulated from responses by beneficiary applicants abroad to a question on “last year resided in the United States” on SSA Form 21. This question is no longer included on the form. Data from 197 l-75 reveal the same patterns as the 1976 data shown in chart 5.
33 A majority of retired-worker beneficia- ries was at least 70 years of age in the 1976 sample. By assuming all retired-worker beneficiaries were 62 in 1976, these calcula- tions overstate the percent of all retired- worker beneficiaries who had worked in the United States and then emigrated before the age of 48.
3* SSA Form 21 asks how long Social Security beneficiary applicants abroad resided in the United States. The data for 1971-74, which are in more aggregated year categories, show the same basic pattern.
3j This is an implication of the recent United States residence of most retired- worker beneficiaries living abroad (chart 5) combined with the fact that all of the retired- worker beneficiaries were at least age 62.
36 Chart 6 shows the number of retired- worker beneficiaries living abroad by years resided in the United States. Chart 7 takes this information and imposes several assump- tions to get some idea of how the probability of emigrating at retirement age and being fully insured likely changes with the age at immigration, First, it is assumed that all of the retired beneficiaries emigrated at age 65. (An implication of the information contained in chart 5 is that most retired beneficiaries emigrated at older working ages.) Using this assumption, the number of retired-worker beneficiaries living abroad by age at immigra- tion can be approximated by using 65 minus
50 Social Security Bulletin l Vol. 57, No. I l Spring 1994
the number of years resided in the United States as a proxy for age at immigration. Determining how the probability of emigra- tion at retirement age likely changes with age at immigration requires taking into account the population of immigrants by age at immi- gration This was done by dividing the num- ber of retired-worker beneficiaries living abroad arranged in 5-year categories of years resided in the United States by the age distri- bution of the 1975 entering cohort of immi- grants (multiplied by 5). By using the 1975 age distribution, no account is taken of the varying levels of immigration across the years when retired-worker beneficiaries entered the United States.
37 For persons at least age 62 in 1975, only 24 or fewer quarters of work in covered em- ployment were required to be fully insured.
38 Totalization agreements provide for limited coordination of the United States OASDI program with the comparable pro- grams of other countries (Butcher and Erdos 1988). The agreements were authorized for the United States by an amendment to the Social Security Act in 1977. The following countries currently have totalization agree- ments with the United States: Belgium, Canada, France, Germany, Italy, the Nether- lands, Norway, Portugal, Spain, Sweden, Switzerland, and the United Kingdom.
” Historical changes in the requirements for various Social Security benefits are de- scribed in Social Security Administration 1993(a), and 1993(b).
References
Bhagwati, Jagdish. Forthcoming. “U.S. Immigration Policy,” in Immigrants and U.S. Immigration Policy. Harriet Orcutt Duleep and Phanindra Wunnava (eds.). Middlebury College Conference Volume.
Borjas, George. 1992. “National Origin and the Skills of Immigrants,” in National Bureau of Economic Research, Immigra- tion and the Work Force. George J. Borjas and Richard B. Freeman (eds.). Chicago: The University of Chicago Press.
Economy. New York: Basic Books.
1990. Friends or Strangers: The Impact of Immigrants on the U.S.
Borjas, George and Bernt Bratsberg. 1990. “Who Leaves? The Outmigration of the Foreign Born,” Mimeo.
Bureau of the Census. 1960. Historical Statistics of the United States. Washing- ton, DC: U.S. Government Printing Of- fice.
Butcher, Paul and Joseph Erdos. 1988. “In- ternational Social Security Agreements: The U.S. Experience,” Social &cur@ Bulletin, Vol. 5 1, No. 9 (September), pp. 4-12.
Chiswick, Barry R. 1980. An Analysis of the Economic Progress and Impact of Immi- grants Department of Labor (Mono- graph No. PBSO-200454). Washington, DC: National Technical Information Service.
1979. “The Economic Progress of Immigrants: Some Apparently Univer- sal Patterns,” in Contemporary Economic Problems, 1979. William Fellner (ed.). Washington, DC: American Enterprise Institute, pp. 359-399.
1978(a). “The Effect of Ameri- canization on the Earnings of Foreign- Born Men,” Journal of Political Economy, Vol. 86, No. 5 (October), pp. 897-922.
1978(b). “A Longitudinal Analy- sis of Occupational Mobility of Immi- grants,” Proceedings of the 30th Annual Winter Meeting, Industrial Relations Research Association. Barbara Dennis (ed.). Madison.
DaVanzo, Julie. 1976. “Differences Between Return and Non-Return Migration: An Econometric Analysis.” International Migration Review, Spring, pp. 13-27.
Day, Jennifer Cheeseman. 1992. “Population Projections of the United States, by Age, Sex, Race, and Hispanic Origin: 1992 to 2050,” in Current Population Reports (Series P-25, No. 1092). Bureau of the Census. Washington, DC: U.S. Govern- ment Printing Office.
Duleep, Harriet Orcutt and Mark C. Regets. 1994(a). “Admission Criteria and Immi- grant Earnings Profiles.” Program for Research on Immigration Policy. Discus- sion Paper No. PRIP-UI-30. Washington, DC: The Urban Institute.
Immigrant Earnings.” Program for Ke- 1994(b). “Country of Origin and
search on Immigration Policy. Discussion Paper No. PRIP-UI-3 I, Washington, DC: The Urban Institute.
1994(c). “The Elusive Concept of Immigrant Quality,” Program for Research on Immigration Policy. Discussion Paper No. PRIP-UI-28. Washington, DC: The Urban Institute.
1992. “Some Evidence on the Effect of Admission Criteria on Immigrant Assimilation,” in Immigration, Language and Ethnic Issues: Canada and the United States. Barry Chiswick (ed.). Washington, DC: American Enterprise Institute, pp. 41 O-440.
Duleep, Harriet Orcutt and Seth Sanders. 1994(a). “The Effect of Children on Women’s Work: Empirical Regularities Across Cultures.” Journal of Human Resources, forthcoming.
1994(b). “Identifying Stable Child Status-Work Relationships for Married Women: Insights from Recent Immigrants.” Program for Research on Immigration Policy. Discussion Paper No. PRIP-UI-32. Washington, DC: The Urban Institute.
1993. “The Decision to Work by Married Immigrant Women: Evidence from Asian Women.” Industrial Labor Relations Review, Vol. 46, No. 4 (July), pp. 67-80.
Fabricant, Ruth A. 1970. “An Expectational Model of Migration.” Journal of Regional Science, Vol. 10, No. 1 (April), pp. 13-24.
General Accounting Office. 1988. Immigra- tion: The Future Flow of Legal Immigra- tion to the United States. Washington, DC: General Accounting Office. January.
1983. Issues Concerning Social Security Benefits Paid to Aliens. Wash- ington, DC: General Accounting Offtce. March.
Greenwood, Michael J. 1969. “An Analysis of the Determinants of Geographic Labor Mobility in the United States.” Review of
Economics and Statistics, Vol. 5 1, No. 2 (May), pp. 189- 194.
Hutchinson, E. P. 198 1, Legislative History of American Immigration Policy, 1798-1965. Philadelphia: University of Pennsylvania Press.
Social Security Bulletin l Vol. 57, No. 1 l Spring 1994 51
Immigration and Naturalization Service. 1989. Statistical Yearbook of the Immi- gration and Naturalization Service. Washington, DC: U.S. Government Print- ing Office, pp. 3-4.
Jasso, Guillermina and Mark R. Rosenzweig. 1990. The New Chosen People: Immi- grants in the United States. New York: Russell Sage Foundation.
Lansing, John B. and Eva Mueller. 1967. The Geographic Mobility of Labor. Ann Arbor: Survey Research Center, Institute for Social Research, University of Michi- gan.
Liu, Ben-Chieh. 1975. “Differential Net Migration Rates and the Quality of Life.” Review of Economics and Statistics, Vol. 57, No. 3 (August), pp. 329-337.
MacPherson, David and James Stewart. 1989. “The Labor Force Participation and Earnings Profiles of Married Female Immigrants.” Quarterly Review of Eco- nomics and Business, Vol. 29, No. 3 (Au- tumn), pp. 57-72.
Nelson, Phillip. 1959. “Migration, Real Income and Information.” Journal of Regional Science, Vol. 1, No. 2 (Spring), pp. 43-74.
Passel, Jeffrey S. and J. Gregory Robinson. 1987. “Methodology for Developing Estimates of Coverage in the 1980 Census Based on Demographic Analysis: Net Undocumented Immigration,” in 1980 Census Preliminary Evaluation Results Memorandum Series, No. I 14. Washing- ton, DC: Bureau of the Census.
Reimers, Cordelia. 1985. “Cultural Differ- ences in Labor Force Participation Among Married Women.” American Economic Review, Vol. 75, No. 2 (May), pp. 251- 255.
Reimers, David M. Forthcoming. “Third World Immigration to the United States,” in Immigrants and U.S. Immigration Policy, Harriet Orcutt Duleep and Phanindra Wunnava (eds.). Middlebury College Conference Volume.
Social Security Administration. 199 i(a). Social Security Handbook, 1993 Eleventh Edition, Washington, 1 X: U.S. Government Printing Office.
1993(b). Annual Statist,,,al Supplement, 1993, to the Social. ,ecurify Bulletin. Washington, DC: U.S. Govern- ment Printing Office.
. 199 1. The Social Securilv Tech- nical Panel Report to the 1991 A, tvisory Council on Social Security. Washington, DC.
1971-76. Beneficiaries Residing Abroad (annual issues). Washington, DC: Office of Research and Statistics, Social Security Administration.
Vanderkamp, John, 1972. “Return Migration: Its Significance and Behavior.” Western Economic Journal, Vol. 10, No. 4 ( De- cember), pp. 460-465.
Warren, Robert. 1979. “Alien Emigration from the United States: 1963 to 1974.” Paper presented at the Annual Meeting of the Population Association of America, Philadelphia. April
Warren, Robert and Ellen Percy Kraly. 1985. “The Elusive Exodus: Emigration from the United States,” Population Reference Bureau Occasional Paper No. 8. Washing- ton DC: Population Reference Bureau.
Warren, Robert and Jeffrey Passel. 1987. “A Count of the Uncountable: Estimates of Undocumented Aliens Counted in the 1980 United States Census.” Demography, Vol. 24, No. 3 (August), pp. 375-393.
Warren, Robert and Jennifer Marks Peck. 1980. “Foreign-Born Emigration from the United States, 1960-1970.” Demography, Vol. 17, No. 1 (February), pp. 71-84.
Yezer, Anthony M. J. and Lawrence Thurston. 1976. ‘* Migration Patterns and Income Change: Implications for the Human Capital Approach to Migration.” Southern Economic Journal, Vol. 42, No. 4 (April), pp. 693-702.
52 Social Security Bulletin l Vol. 57, No. 1 l Spring 1994


![Bosnia Emigration[1]](https://img.pdfslide.net/doc/110x75/577d25951a28ab4e1e9f2a8f/bosnia-emigration1.jpg)