Embed Size (px)
Citation preview
SOCIAL SECURITY ADMINISTRATION BALTIMORE, MD 21235-0001
Office of the Chief Actuary
June 9, 2016
Mr. Kent Conrad, Co-Chair Mr. James B. Lockhart, III, Co-Chair Commission on Retirement Security and Personal Savings Bipartisan Policy Center 1225 Eye Street NW, Suite 1000 Washington, D.C. 20005
Dear Mr. Conrad and Mr. Lockhart:
I am writing in response to your request for estimates of the financial effects on Social Security of the plan released today by the Bipartisan Policy Center’s Commission on Retirement Security and Personal Savings. The estimates provided here reflect the intermediate assumptions of the 2015 Trustees Report. The Commission’s plan includes twelve provisions with direct effects on the Social Security Trust Funds. Note that the estimates provided here do not reflect the estimated effects of the Bipartisan Budget Act (BBA) of 2015, which was enacted after completion of the 2015 Trustees Report. Including the effects of the BBA would provide a small further improvement in the projected actuarial status of the Social Security Trust Funds. We have enjoyed working closely with Shai Akabas, Brian Collins, and other members of your team in developing this plan to meet your goals. The estimates and analysis provided here reflect the combined effort of many in the Office of the Chief Actuary, but most particularly Karen Glenn, Christopher Chaplain, Daniel Nickerson, Kyle Burkhalter, Michael Clingman, Anna Kirjusina, Katie Sutton, and Tiffany Bosley.
The enclosed tables provide estimates of the effects of the Commission’s plan on the cost, income, and combined trust fund reserves for the Old Age, Survivors, and Disability Insurance (OASDI) program, as well as estimated effects on retired worker benefit levels for selected hypothetical workers. In addition, tables 1b and 1b.n provide estimates of the federal budget implications of the twelve provisions. Assuming enactment of the plan, we estimate that the combined OASI and DI Trust Funds would be fully solvent throughout the 75-year projection period, under the intermediate assumptions of the 2015 Trustees Report. In addition, under this plan the OASDI program would meet the further conditions for sustainable solvency, because projected combined trust fund reserves would be growing as a percentage of the annual cost of the program at the end of the long-range period.
Because the OASI and DI Trust Funds are separate legal entities, estimates for the combined trust funds are consistent with an intent to reallocate the total payroll tax rate as needed to equalize the years of reserve depletion and the actuarial status of the two separate trust funds.
SOCIAL SECURITY
Page 2 – Bipartisan Policy Center
Such reallocations would be needed under this plan beyond the temporary reallocation enacted in
the BBA of 2015.
The Commission’s plan includes twelve basic provisions with direct effects on the OASDI
program. The following list provides a brief description of these provisions.
1) Use an annualized “mini-PIA” formula beginning with retired worker beneficiaries
becoming newly eligible in 2022, phased in over 5 years. The mini-PIA calculation
would compute an individual average monthly indexed earnings (mini-AIME) and
primary insurance amount (mini-PIA) for each year with taxable earnings.
2) Replace the current-law Windfall Elimination Provision (WEP) and Government
Pension Offset (GPO) for most OASI benefits with a new calculation based on covered
and non-covered earnings, beginning with individuals newly eligible in 2022.
3) Limit the spousal benefit paid on the account of a retired worker newly eligible in 2022
to the benefit received by the spouse of a newly-eligible retired worker with AIME at
the 75th
percentile.
4) Compute retired worker and spouse benefits for those married when first starting
benefits in 2022 or later using a specified joint-and-survivor annuity approach.
5) Beginning with retired worker beneficiaries newly eligible in 2022, add a new PIA bend
point at the wage-indexed equivalent of the 50th
percentile of the AIME distribution for
retired workers newly eligible in 2015, minus $100. In addition, change the present-law
first PIA bend point on a wage-indexed equivalent basis from $826 to $1,050 for 2015
and apply more progressive PIA factors.
6) Increase the OASDI taxable maximum by equal amounts over four years starting in
2017, reaching $195,000 for 2020, and index by growth in the average wage index
(AWI) plus 0.5 percentage point annually thereafter. Additional earnings taxed are
includable for AIME computations.
7) Increase the total OASDI payroll tax rate by 0.1 percentage point per year for 2017
through 2026, increasing the total rate from 12.4 percent for 2016 to 13.4 percent for
2026 and later.
8) After the normal retirement age (NRA) reaches age 67 for those attaining age 62 in
2022, increase it by 1 month every 2 years until the NRA reaches 69 for those attaining
age 62 in 2070. Also increase the age up to which delayed retirement credits may be
earned from 70 to 72 on the same schedule.
9) Use the chain-weighted version of the Consumer Price Index for All Urban Consumers
(C-CPI-U) to calculate the cost-of-living adjustment (COLA), beginning with the
December 2016 COLA.
10) Beginning in 2017, extend student benefits to age 22 for children of disabled or
deceased workers, if the child is a full-time student in high school or below, college, or
vocational school.
11) Beginning in 2022, for single/head-of-household/married-filing-separate taxpayers with
modified adjusted gross income (MAGI) of $250,000 or more and for joint filers with
MAGI of $500,000 or more, include up to 100 percent of Social Security benefits (up
from 85 percent) in income subject to federal personal income tax. All additional
revenue would be credited to the OASI and DI Trust Funds.
Page 3 – Bipartisan Policy Center
12) Beginning in 2020, create a new Social Security Basic Minimum Benefit (BMB). This
new minimum benefit would be available only after attaining NRA and would be set at
different levels for single persons and married couples. Individuals with adjusted gross
income (AGI) above specified thresholds would have the BMB reduced or completely
eliminated.
The balance of this letter provides a summary of the effects of the Commission’s plan on the
actuarial status of the OASDI program, our understanding of the specifications and intent of each
of the twelve provisions, and descriptions of our detailed financial estimates for trust fund
operations, benefit levels, and implications for the federal budget. See the “Specification for
Provisions of the Proposal” section of this letter for a detailed description of these twelve
provisions.
Summary of Effects of the Plan on OASDI Actuarial Status
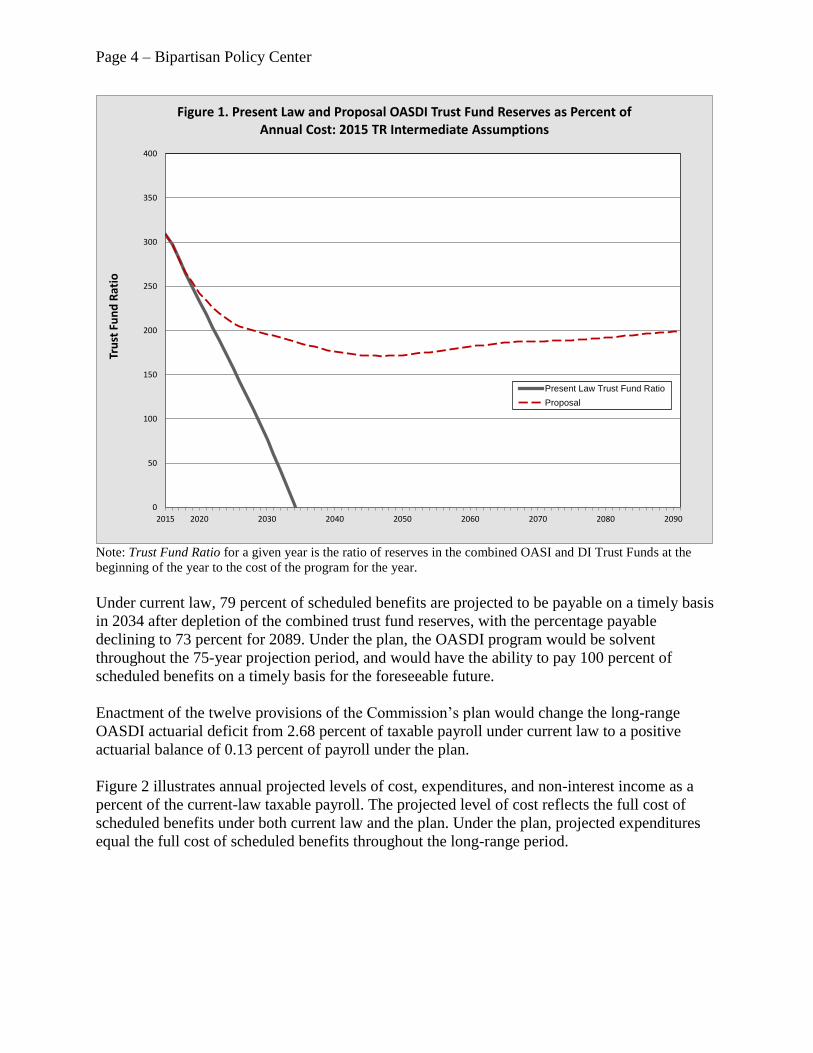
Figure 1 below illustrates the estimated trust fund ratio under present law and assuming
enactment of the Commission’s plan. The trust fund ratio is defined as the combined Old-Age
and Survivors Insurance (OASI) and Disability Insurance (DI) Trust Fund reserves expressed as
a percent of annual program cost. Assuming enactment of the plan, the combined OASI and DI
Trust Funds would be fully solvent throughout the 75-year projection period, under the
intermediate assumptions of the 2015 Trustees Report. In addition, because the projected trust
fund ratio is increasing at the end of the period, the plan meets the conditions for sustainable
solvency.
Page 4 – Bipartisan Policy Center
Note: Trust Fund Ratio for a given year is the ratio of reserves in the combined OASI and DI Trust Funds at the
beginning of the year to the cost of the program for the year.
Under current law, 79 percent of scheduled benefits are projected to be payable on a timely basis
in 2034 after depletion of the combined trust fund reserves, with the percentage payable
declining to 73 percent for 2089. Under the plan, the OASDI program would be solvent
throughout the 75-year projection period, and would have the ability to pay 100 percent of
scheduled benefits on a timely basis for the foreseeable future.
Enactment of the twelve provisions of the Commission’s plan would change the long-range
OASDI actuarial deficit from 2.68 percent of taxable payroll under current law to a positive
actuarial balance of 0.13 percent of payroll under the plan.
Figure 2 illustrates annual projected levels of cost, expenditures, and non-interest income as a
percent of the current-law taxable payroll. The projected level of cost reflects the full cost of
scheduled benefits under both current law and the plan. Under the plan, projected expenditures
equal the full cost of scheduled benefits throughout the long-range period.
0
50
100
150
200
250
300
350
400
2015 2020 2030 2040 2050 2060 2070 2080 2090
Tru
st F
un
d R
atio
Figure 1. Present Law and Proposal OASDI Trust Fund Reserves as Percent of Annual Cost: 2015 TR Intermediate Assumptions
Present Law Trust Fund Ratio
Proposal

Page 5 – Bipartisan Policy Center
From 2017 through 2021, OASDI program cost under the plan is very close to the cost under
current law. Starting in 2022, OASDI program annual cost under the plan becomes progressively
lower than under current law. This difference increases rapidly through about 2040, and then
increases gradually, reaching about 2.5 percent of current-law payroll by 2089. Beginning in
2017, non-interest income under the plan is projected to be higher than under current law, with
the difference growing rapidly from 0.3 percent of current-law payroll for 2017 to 1.5 percent of
current-law payroll for 2026, and then increasing gradually to 1.9 percent of current-law payroll
for 2089. The plan improves the annual balance (non-interest income minus program cost)
starting in 2017. The annual balance improves by 2.7 percent of payroll for 2034, with the
improvement increasing to 4.3 percent of payroll for 2089. However, under the plan, the annual
balance is still negative throughout the long-range period. The annual deficit decreases from 1.3
percent of payroll for 2015 to 0.4 percent of payroll for 2019 and then fluctuates through the end
of the long-range period, ultimately reaching 0.3 percent of payroll for 2089. Under current law,
the projected annual deficit for 2089 is 4.7 percent of payroll.
On a present value basis over the 75-year projection period, about 54 percent of the improvement
in the actuarial balance comes from increases in revenues (payroll taxes and taxation of benefits),
and about 46 percent comes from reductions in cost. By comparison, for the 75th
projection year
(2089), about 43 percent of the improvement in annual balance comes from revenue increases,
and about 57 percent of the improvement comes from reduction in cost.
11
12
13
14
15
16
17
18
19
2015 2020 2030 2040 2050 2060 2070 2080 2090
Pe
rce
nt
of
Pre
sen
t-La
w T
axab
le P
ayro
llFigure 2. Proposal and Present Law Cost, Expenditures, and Non-Interest Income
as Percent of Taxable Payroll: 2015 TR Intermediate Assumptions
Present Law Cost
Present Law Non-Interest Income
Present Law Expenditures
Proposal Cost
Proposal Non-Interest Income
Proposal Expenditures
Page 6 – Bipartisan Policy Center
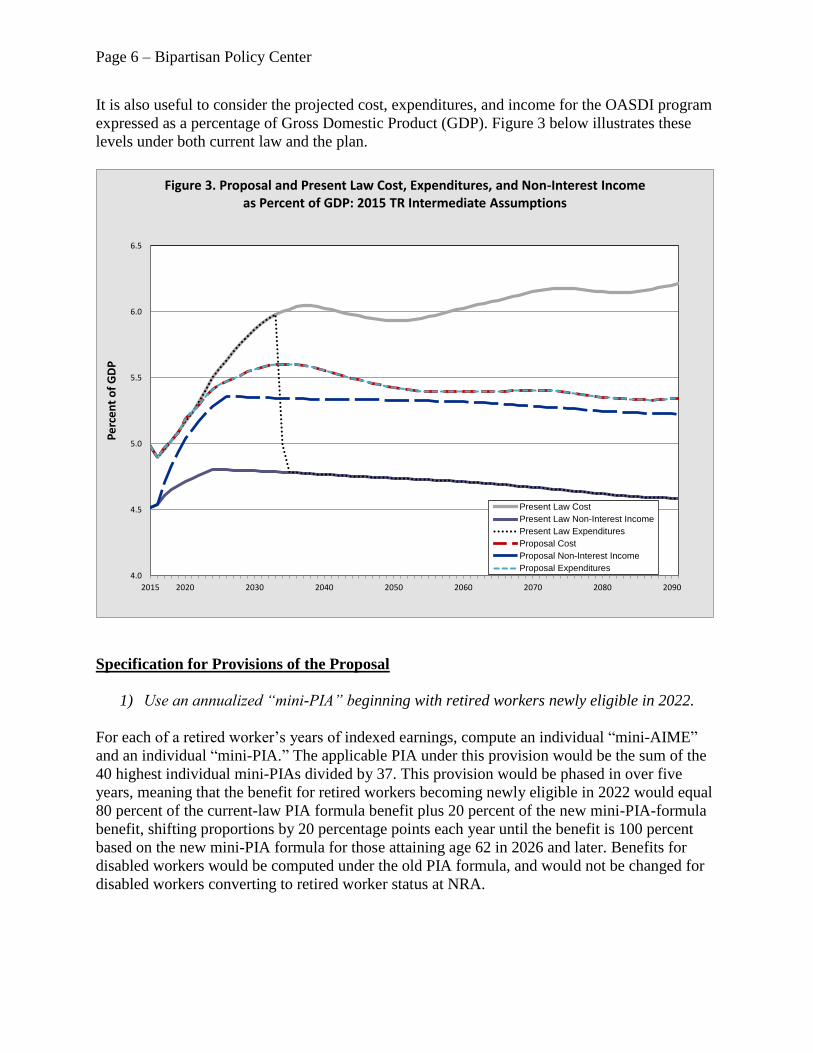
It is also useful to consider the projected cost, expenditures, and income for the OASDI program
expressed as a percentage of Gross Domestic Product (GDP). Figure 3 below illustrates these
levels under both current law and the plan.
Specification for Provisions of the Proposal
1) Use an annualized “mini-PIA” beginning with retired workers newly eligible in 2022.
For each of a retired worker’s years of indexed earnings, compute an individual “mini-AIME”
and an individual “mini-PIA.” The applicable PIA under this provision would be the sum of the
40 highest individual mini-PIAs divided by 37. This provision would be phased in over five
years, meaning that the benefit for retired workers becoming newly eligible in 2022 would equal
80 percent of the current-law PIA formula benefit plus 20 percent of the new mini-PIA-formula
benefit, shifting proportions by 20 percentage points each year until the benefit is 100 percent
based on the new mini-PIA formula for those attaining age 62 in 2026 and later. Benefits for
disabled workers would be computed under the old PIA formula, and would not be changed for
disabled workers converting to retired worker status at NRA.
4.0
4.5
5.0
5.5
6.0
6.5
2015 2020 2030 2040 2050 2060 2070 2080 2090
Pe
rce
nt
of
GD
P
Figure 3. Proposal and Present Law Cost, Expenditures, and Non-Interest Income as Percent of GDP: 2015 TR Intermediate Assumptions
Present Law Cost
Present Law Non-Interest Income
Present Law Expenditures
Proposal Cost
Proposal Non-Interest Income
Proposal Expenditures
Page 7 – Bipartisan Policy Center
We estimate that enactment of this provision alone would reduce the long-range OASDI
actuarial deficit by 0.28 percent of taxable payroll and would reduce the annual deficit for the
75th
projection year (2089) by 0.46 percent of payroll.
2) For most OASI benefits, replace the current Windfall Elimination Provision (WEP) and
Government Pension Offset (GPO) with a new calculation based on covered and non-
covered earnings, beginning with individuals newly eligible in 2022.
Under this provision, the current Windfall Elimination Provision (WEP) and Government
Pension Offset (GPO) as applied for OASI benefits would be replaced with the approach
proposed in the President’s FY2017 Budget. The WEP replacement involves three components:
(1) a “Super AIME” computed considering all earnings in Social Security Administration records
(both OASDI covered and non-covered) up to the annual taxable maximum for each year, (2) a
“Super PIA” based on the “Super AIME,” and (3) the “Covered” AIME based only on OASDI
covered earnings. The governing PIA for a worker (also applicable for his or her auxiliary
beneficiaries) is then calculated as the Covered AIME multiplied by the ratio of the Super PIA to
the Super AIME. The new computation will be effective for all payments on the record of a
retired worker beneficiary becoming newly eligible for benefits on or after January 1, 2022. As
under current law, upon the death of the worker, the governing PIA will revert to the standard
PIA based solely on covered earnings.
For the GPO replacement, three components are used in the computation: (1) a “Super PIA”
computed using both OASDI covered and non-covered earnings, (2) a standard PIA (“Covered
PIA”) based only on OASDI covered earnings, and (3) an age reduction factor. Each component
is calculated using the beneficiary’s own earnings record, without regard to insured status, as if
entitlement to worker benefits begins at the same time as application of the offset. The new
offset amount will be the difference between the Super PIA and Covered PIA, multiplied by the
age reduction factor, if applicable. If the beneficiary is dually entitled, the offset will be deducted
from the excess benefit payable as a spouse. The new offset will apply to benefits paid to a
spouse, former spouse, or surviving spouse of an insured worker when the spouse is age 62 and
older. The provision is effective for those attaining age 62 on or after January 1, 2022.
The new WEP and GPO formulas would not be applied for (1) DI benefits, (2) retired worker
benefits after the conversion from disabled worker status at NRA, or (3) survivor benefits
payable upon the death of a disabled worker.
We estimate that enactment of this provision alone would reduce the long-range OASDI
actuarial deficit by 0.08 percent of taxable payroll and would reduce the annual deficit for the
75th
projection year (2089) by 0.12 percent of payroll.
3) Limit the spousal benefit to that received by the spouse of the 75th
-percentile worker
beginning with retired workers newly eligible in 2022.
For this provision, the “75th
-percentile worker” is a retired worker newly eligible (age 62) in a
given year who has an AIME at the 75th
percentile among all individuals attaining 62 in the year
who are eligible for a retired worker benefit. For spouse benefits based on the accounts of retired
workers newly eligible after 2022, the threshold used for those newly eligible in 2022 would be
Page 8 – Bipartisan Policy Center
indexed by changes in the Chained Consumer Price Index for all Urban Consumers (C-CPI-U).
This provision affects divorced spouses and young spouses as well as aged spouses of retired
workers, but not spouses of disabled workers, including after the disabled worker converts to
retired worker status when attaining NRA.
We estimate that enactment of this provision alone would reduce the long-range OASDI
actuarial deficit by 0.11 percent of taxable payroll and would reduce the annual deficit for the
75th
projection year (2089) by 0.24 percent of payroll.
4) Compute benefits on a joint-and-survivor annuity basis beginning with retired workers
and spouses newly eligible in 2022.
For individuals attaining age 62 in 2022 and later who are married at the time they first become
entitled to either a retired worker benefit or an aged spouse benefit (on a retired worker's
account), benefits would be reduced while both spouses are alive to allow for increased survivor
benefits, such that the expected present value of total benefits would be unchanged on a cohort
basis. For those affected, the surviving spouse would receive 75 percent of the decedent’s benefit
plus whatever his or her own benefit would be if both individuals in the couple were still alive.
Because survivors of couples affected by this provision would receive higher benefits than under
current law, this provision would also reduce the retired worker and aged spouse benefit such
that, on a cohort basis, the expected amount of benefits paid from the worker’s account (with all
of the plan’s provisions incorporated) would be actuarially equivalent in present value to the
expected amount under current law.
We estimate that enactment of this provision alone would reduce the long-range OASDI
actuarial deficit by 0.06 percent of taxable payroll and would increase the annual deficit for the
75th
projection year (2089) by 0.14 percent of payroll.
5) Beginning with retired workers newly eligible in 2022, revise the PIA benefit formula.
This provision would add a new bend point that would fall between the two current-law PIA
bend points. The new bend point would be calculated as would be applicable for new eligibility
in 2015 at the AIME level of retired workers newly eligible in 2015, minus $100. This new bend
point would be indexed by the average wage indexing series up to the year of first application,
new eligibility in 2022, and for all subsequent years. In addition, this provision would move the
current-law first bend point starting for those newly eligible in 2022 from the wage-indexed
equivalent of $826 in 2015 to the wage-indexed equivalent of $1,050 in 2015. The current PIA
factors of 90 percent, 32 percent, and 15 percent would be changed to 95 percent, 32 percent
(above the revised current-law first bend point and below the new bend point), 15 percent (above
the new bend point and below the current-law second bend point), and 5 percent.
This change would be phased in over 10 years, from 2022 through 2031, on a weighted-average
basis. That is, the PIA would be calculated as 90 percent of the current-law formula plus 10
percent of the plan formula for 2022, 80 percent of the current-law formula plus 20 percent of the
plan formula for 2023, and so on. Disabled workers newly eligible in all future years would

Page 9 – Bipartisan Policy Center
retain the current PIA formula computation (benefits both before and after conversion to retired
worker benefit status at NRA).
We estimate that enactment of this provision alone would reduce the long-range OASDI
actuarial deficit by 0.05 percent of taxable payroll and would reduce the annual deficit for the
75th
projection year (2089) by 0.10 percent of payroll.
6) Increase the OASDI taxable maximum by equal amounts over four years starting in 2017,
reaching $195,000 for 2020 and increase indexing thereafter.
Under current law, payroll taxes totaling 12.4 percent apply to OASDI covered earnings in a year
up to the contribution and benefit base, or taxable maximum. This taxable maximum is $118,500
for 2015 and increases in the future with increases in the national average wage index (AWI). All
covered earnings subject to the payroll tax are credited toward computation of benefits as well as
attainment of insured status.
Under this provision, the taxable maximum would increase linearly from 2017 through 2020
until it equals $195,000 in 2020. After 2020, the taxable maximum would be indexed to the
annual percentage increase in the AWI plus 0.5 percentage point, a higher rate of increase than
under current law. Additional earnings taxed would be includable in the AIME computation for
benefit credit.
We estimate that enactment of this provision alone would reduce the long-range OASDI
actuarial deficit by 0.53 percent of taxable payroll and would reduce the annual deficit for the
75th
projection year (2089) by 0.60 percent of payroll.
7) Increase the OASDI payroll tax rate by 0.1 percentage point per year from 2017 through
2026 so that it equals 13.4 percent in years 2026 and later.
The payroll tax rate increase would be split evenly between the employer and employee share,
and would be split between the OASI and DI Trust Funds in proportion to currently scheduled
payroll tax rates.
We estimate that enactment of this provision alone would reduce the long-range OASDI
actuarial deficit by 0.87 percent of taxable payroll and would reduce the annual deficit for the
75th
projection year (2089) by 1.00 percent of payroll.
8) After the NRA reaches age 67 for those aged 62 in 2022, increase it by 1 month every 2
years until the NRA reaches 69.
Under current law, the NRA will increase from age 66 by 2 months per year for individuals
attaining age 62 in 2017 through 2022, reaching the NRA of 67 for those aged 62 in 2022 and
later. Under this provision, the NRA would, after 2022, increase by 1 month every 2 years until it
equals 69 for those attaining age 62 in 2070 and later. Also, the maximum age for accumulating
delayed retirement credits would increase at the same rate, ultimately reaching 72 for those

Page 10 – Bipartisan Policy Center
attaining 62 in 2070. This provision retains the earliest eligibility age for retired worker benefits
at 62.
We estimate that enactment of this provision alone would reduce the long-range OASDI
actuarial deficit by 0.47 percent of taxable payroll and would reduce the annual deficit for the
75th
projection year (2089) by 1.36 percent of payroll.
9) Use the chain-weighted version of the Consumer Price Index for All Urban Consumers
(C-CPI-U) to calculate the cost-of-living adjustment (COLA), beginning with the
December 2016 COLA.
Under current law, the annual cost-of-living adjustment (COLA) applied to Social Security
benefits is calculated using the Consumer Price Index for Urban Wage Earners and Clerical
Workers (CPI-W). We assume this change to the C-CPI-U would decrease the COLA by an
average of 0.3 percentage point per year. The new COLA would apply only to benefits paid from
the OASI Trust Fund, including benefits to DI beneficiaries after they convert to retired worker
status at normal retirement age.
We estimate that enactment of this provision alone would reduce the long-range OASDI
actuarial deficit by 0.46 percent of taxable payroll and would reduce the annual deficit for the
75th
projection year (2089) by 0.62 percent of payroll.
10) Beginning in 2017, extend student benefits to age 22 for children of disabled or deceased
workers, if the child is a full-time student in high school, college, or vocational school.
Under current law, child benefits can be paid after attaining age 18 until attainment of age 19, if
the child is a full-time attendee at secondary school or below. This provision would extend
payment of student benefits up to attainment of age 22 for children of disabled or deceased
workers, if the child is a full-time student in high school or below, college, or vocational school.
We estimate that enactment of this provision alone would increase the long-range OASDI
actuarial deficit by 0.06 percent of taxable payroll and would increase the annual deficit for the
75th
projection year (2089) by 0.06 percent of payroll.
11) Beginning in 2022, for single/head-of-household/married-filing-separate taxpayers with
modified adjusted gross income (MAGI) of $250,000 or more and for joint filers with
MAGI of $500,000 or more, include up to 100% of Social Security benefits in taxable
income.
Under current law, single tax filers with MAGI (approximately equal to adjusted gross income
(AGI), plus non-taxable interest income and half of their Social Security benefit) greater than
$25,000 may have to pay income tax on up to 50 percent of their Social Security benefits. If
MAGI exceeds $34,000, up to 85 percent of benefits may be taxable. The income tax revenue
from taxing up to 50 percent of Social Security benefits goes to the OASI and DI Trust Funds.
The additional income tax revenue derived from taxing more than 50 percent of benefits, up to
85 percent, goes to the Hospital Insurance (HI) Trust Fund. The process is similar for joint tax

Page 11 – Bipartisan Policy Center
filers, with $32,000 and $44,000 thresholds applying for possible taxation of up to 50 percent or
85 percent of the Social Security benefits, respectively. All threshold levels are fixed amounts
and are not indexed to price inflation or average wage increases.
This provision would add an additional level of benefit taxation on the remaining 15 percent of
Social Security benefits for taxpayers with MAGI exceeding thresholds of $250,000 for
single/head-of-household/married-filing-separate taxpayers and $500,000 for joint filers in 2022.
As a result, individuals with MAGI above these thresholds could be taxed on 100 percent of their
Social Security benefits. These thresholds would be indexed by the AWI in subsequent years.
Increased revenue from this provision would be credited to the OASI and DI Trust Funds.
Current-law taxation of benefits of up to 85% of benefits would be unchanged for those with
MAGI below these new $250,000/$500,000 thresholds.
We estimate that enactment of this provision alone would reduce the long-range OASDI
actuarial deficit by 0.01 percent of taxable payroll and would reduce the annual deficit for the
75th
projection year (2089) by 0.01 percent of payroll.
12) Beginning in 2020, create a Social Security Basic Minimum Benefit.
Eligibility for the Social Security Basic Minimum Benefit (BMB) would be limited to OASI
beneficiaries who have attained NRA. The BMB would be calculated on a household basis and
split equally among members of the household. In the case of a married couple, both spouses
would need to claim any Social Security benefits to which they are eligible before they could
receive the BMB. If both spouses have claimed and one is at NRA or above and the other has not
yet attained NRA, only the half of the BMB for the spouse over NRA would be paid. The BMB
amount for single beneficiaries would be equal to the higher of: (1) the BMB base ($604 in
2015), minus 70 percent of their current monthly OASI benefit (not including any BMB); and (2)
zero. The BMB amount for married beneficiaries would be equal to the higher of: (1) the BMB
base ($906 in 2015), minus 70 percent of the total household monthly OASI benefits (not
including any BMB); and (2) zero.
The BMB bases for single and married beneficiaries would be updated annually for changes in
the AWI; therefore, if someone is already receiving the BMB, it would increase by more than the
Social Security COLA amount for a subsequent year, whenever the AWI increase is larger. The
BMB amount would be recalculated at least annually, whenever there is a change in Social
Security benefits (e.g., annually for COLAs, upon conversion to a survivors benefit).
Single filers with AGI over $30,000 and joint filers with AGI (including taxable Social Security
benefits) over $45,000 would be subject to a clawback of the BMB through personal income tax
filings. Any BMB would be reduced by one dollar for every dollar of income above the
thresholds. The thresholds would increase after 2015 by changes in the C-CPI-U. Clawbacks
would be credited back to the OASI Trust Fund.
We estimate that enactment of this provision alone would increase the long-range OASDI
actuarial deficit by 0.19 percent of taxable payroll and would increase the annual deficit for the
75th
projection year (2089) by 0.24 percent of payroll.
Page 12 – Bipartisan Policy Center
Detailed Financial Results for the Provisions of the Proposal
Summary Results by Provision
Table A provides estimates of the effects on the OASDI long-range actuarial balance for each of
the twelve provisions of the Commission’s plan separately and on a combined basis. The table
also includes estimates of the effect of each provision on the annual balance (the difference
between income rate and the cost rate, expressed as a percent of current-law taxable payroll) for
the 75th
projection year, 2089. Interaction among individual provisions is reflected only in the
total estimates for the combined provisions.
Benefit Illustrations
Tables B1 and B2 provide illustrative examples of the projected change in benefit levels under
the three provisions that affect benefit levels for beneficiaries retiring at age 65 in future years at
five selected earnings levels, with selected numbers of years of work. The “Maximum-AIME
Steady Earner” is assumed to have earnings at ages 22 through 64 that equal the current-law
taxable maximum level (equivalent to $118,500 for 2015). As a result, the provision to increase
the taxable maximum does not affect benefit levels illustrated in these tables. Table B3 provides
additional important information on characteristics of retired workers represented by these
illustrations.
Table B1 compares the initial benefit levels, assuming retirement at age 65 under the provisions
of the plan, to both scheduled and payable current-law benefit levels. All benefit amounts under
the plan are higher than those scheduled in current law, especially for the very low and low
hypothetical earners with at least 30 years of earnings (due largely to the minimum benefit
provision). The final two columns of this table show the level of scheduled benefits under the
plan as a percentage of current-law scheduled and current-law payable benefits, respectively.
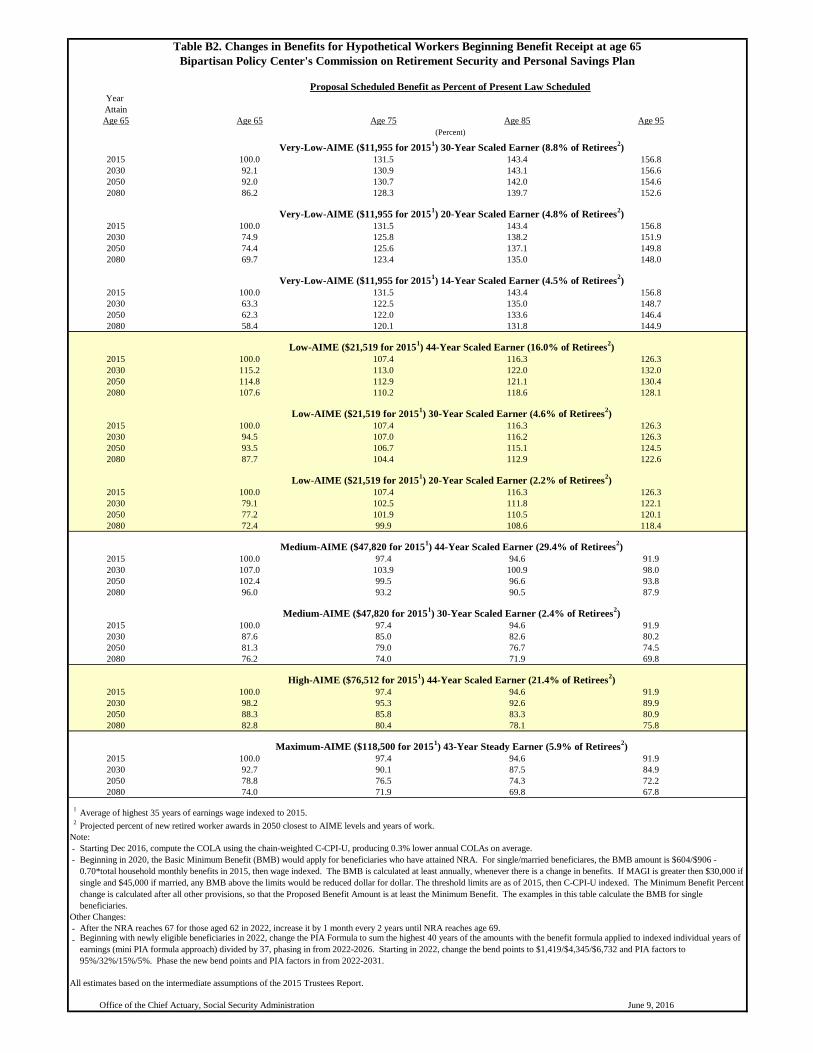
Table B2 compares the change in scheduled benefit levels at ages 65, 75, 85, and 95 under the
plan to scheduled benefits under current law, assuming retirement at age 65. Table B2 shows that
projected scheduled benefits under the provisions of the Commission’s plan increase in relation
to current-law scheduled benefits between ages 65 and 95, because of the change in computing
the COLA.
The hypothetical workers represented in these tables reflect average career-earnings patterns of
workers who started receiving retirement benefits under the Social Security program in recent
years. The tables subdivide workers with very low and low career-average earnings levels by
their numbers of years of non-zero earnings.
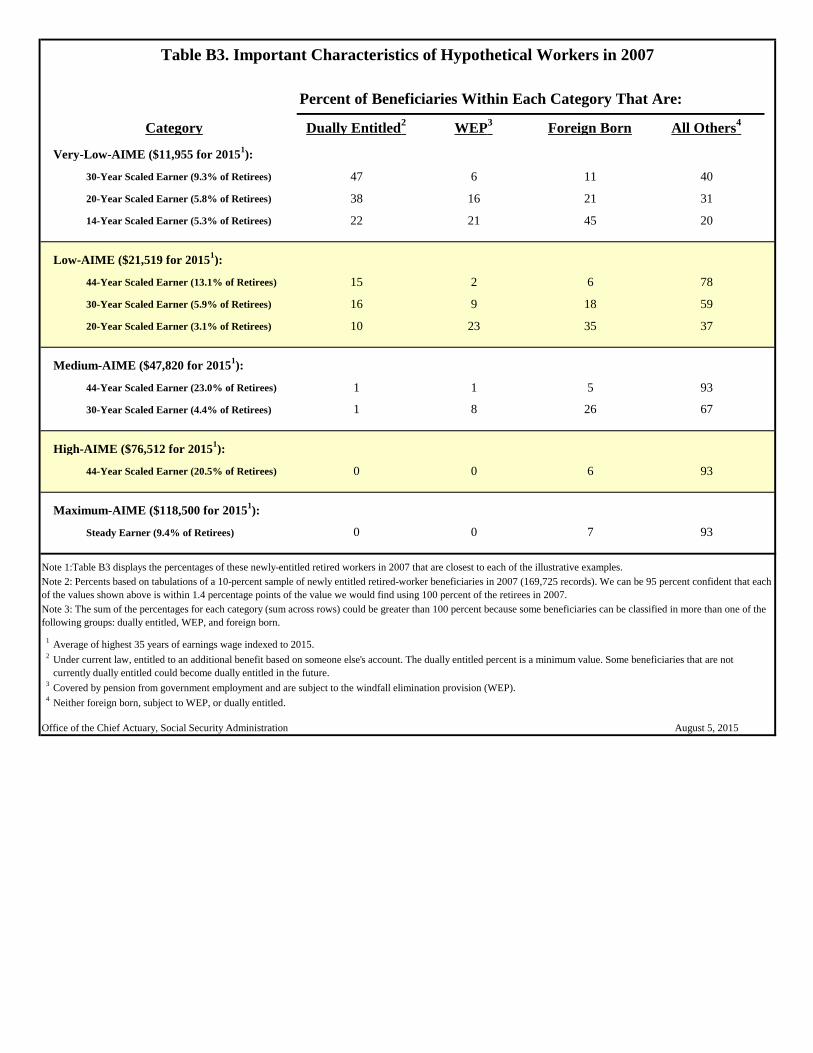
Table B3 provides information helpful in interpreting the benefit illustrations in tables B1 and
B2. Percentages in Table B3 are based on tabulations from a 10-percent sample of newly-entitled
retired workers in 2007. Table B3 displays the percentages of these newly-entitled retired
workers in 2007 that are closest to each of the illustrative examples and are:
Page 13 – Bipartisan Policy Center
1) “Dually Entitled”, meaning they received a higher spouse or widow(er) benefit based on
the career earnings of their husband or wife,
2) “WEP” (Windfall Elimination Provision), meaning that they received a reduced benefit
due to having a pension based on earnings that were not covered under the OASDI
program (primarily certain government workers), and they had less than 30 years of
substantial earnings that were taxable under the OASDI program,
3) “Foreign Born”, meaning that they entered the Social Security coverage area after birth
(and generally after entering working ages), and
4) “All Others”, meaning they had none of the three characteristics listed above.
The extent to which retired-worker beneficiaries represented by each of the illustrative examples
has any of the characteristics listed above (dually entitled, WEP, foreign born) is important
because such individuals are less dependent on the OASDI benefit that relates to their own
career-average earnings level.
Detailed Tables Containing Annual and Summary Projections
Enclosed with this letter are tables 1, 1a, 1b, 1b.n, 1c, and 1d, which provide annual and
summary projections for the plan.
Trust Fund Operations
Table 1 provides projections of the financial operations of the OASDI program under the plan
and shows that the combined OASDI Trust Funds would be fully solvent throughout the 75-year
projection period. The OASDI program would also be solvent for the foreseeable future
(sustainably solvent), because the OASDI trust fund ratio is projected to rise by the end of the
period, 2090. The table shows the annual cost and income rates, annual balances, and trust fund
ratios (reserves as percent of annual program cost) for OASDI, as well as the change from
current law in these cost rates, income rates, and annual balances. Included at the bottom of this
table are summarized rates for the 75-year (long-range) period.
The actuarial balance for the OASDI program over the 75-year projection period is improved by
2.81 percent of taxable payroll, from an actuarial deficit of 2.68 percent of payroll under current
law to a positive actuarial balance of 0.13 percent of taxable payroll.
Program Transfers and Trust Fund Reserves
Column 4 of Table 1a provides a projection of the level of reserves for the theoretical combined
OASI and DI Trust Funds, assuming enactment of the twelve Social Security provisions of the
Commission’s plan. These trust fund reserve amounts are expressed in present value dollars
discounted to January 1, 2015. The table indicates that the provisions include no new specified
transfers of general revenue to the trust funds. For purpose of comparison, the OASDI Trust
Fund reserves, expressed in present value dollars, are also shown for the current-law Social
Security program both without and with the added plan general fund transfers (zero in this case)
in columns 6 and 7.
Page 14 – Bipartisan Policy Center
Note that negative values in columns 4, 6, and 7 represent the “unfunded obligation” for the
program through the year. The unfunded obligation is the present value of the shortfall of
revenue needed to pay full scheduled benefits on a timely basis from the date of trust fund
reserve depletion through the end of the indicated year. Gross Domestic Product (GDP),
expressed in present value dollars, is shown in column 5 for comparison with other values in the
table.
Effect of the Social Security Provisions on the Federal Budget
Table 1b shows the projected effect, in present value discounted dollars, on the federal budget
(unified-budget and on-budget) cash flows and balances, assuming enactment of the twelve
Social Security provisions of the Commission’s plan. Table 1b.n provides the estimated nominal
dollar effect of enactment of the plan on annual budget balances for years 2015 through 2025.
All values in these tables represent the amount of change from the level projected under current
law. In addition, changes reflect the budget scoring convention that presumes benefits, not
payable under the law after depletion of trust fund reserves, would still be paid using revenue
provided from the General Fund of the Treasury. The reader should be cautioned that this
presumption of payment of benefits beyond the resources of the trust funds is prohibited under
current law and is also inconsistent with all past experience under the Social Security program.
Column 1 of Table 1b shows the added plan general fund transfers (zero for this plan). Column 2
shows the net changes in OASDI cash flow from all provisions of the plan.
We expect the net effect of the plan on unified budget cash flow (column 3) to be positive in
years 2017 and later, reflecting savings to the long-range actuarial balance from provisions 1-9
and 11.
Column 4 of Table 1b indicates that the effect of implementing the Commission’s plan is a
reduction of the federal debt held by the public, reaching about $11.7 trillion in present value at
the end of the 75-year projection period. Column 5 provides the projected effect of the plan on
the annual unified budget balances, including both the cash flow effect in column 3 and the
additional interest on the accumulated debt in column 4. Columns 6 and 7 indicate that the
provisions of this plan would have no expected direct effects on the on-budget cash flow, or on
the total federal debt, in the future.
It is important to note that we base these estimates on the intermediate assumptions of the 2015
Trustees Report, so these estimates are not consistent with estimates made by the Office of
Management and Budget or the Congressional Budget Office based on their assumptions. In
particular, all present values are discounted using trust fund yield assumptions under the
intermediate assumptions of the 2015 Trustees Report.
Annual Trust Fund Operations as a Percent of GDP
Table 1c provides annual cost, annual expenditures (amount that would be payable), and annual
tax income for the OASDI program expressed as a percentage of GDP for both current law and
assuming enactment of the twelve Social Security provisions of the Commission’s plan. Showing
Page 15 – Bipartisan Policy Center
the annual trust fund cash flows as a percent of GDP provides an additional perspective on these
trust fund operations in relation to the total value of goods and services produced in the United
States. The relationship between income and cost is similar when expressed as a percent of GDP
to that when expressed as a percent of taxable payroll (Table 1).
Effects on Trust Fund Reserves and Unfunded Obligations
Table 1d provides estimates of the changes in trust fund reserves. Values in this table are
expressed in present value dollars discounted to January 1, 2015.
For the 75-year (long-range) period as a whole, the current-law unfunded obligation of $10.7
trillion is replaced by a positive trust fund reserve of $1.1 trillion in present value assuming
enactment of the Commission’s plan. This change of $11.7 trillion results from:
A $6.3 trillion increase in revenue (column 2), primarily from additional tax revenue,
minus
A $5.4 trillion decrease in cost (column 3), primarily from increasing the NRA,
calculating the COLA using the C-CPI-U rather than the CPI-W, and decreasing future
benefits through changes in the PIA formula.
We hope these estimates are helpful. Please let me know if we may provide further assistance.
Sincerely,
Stephen C. Goss
Chief Actuary
Enclosures
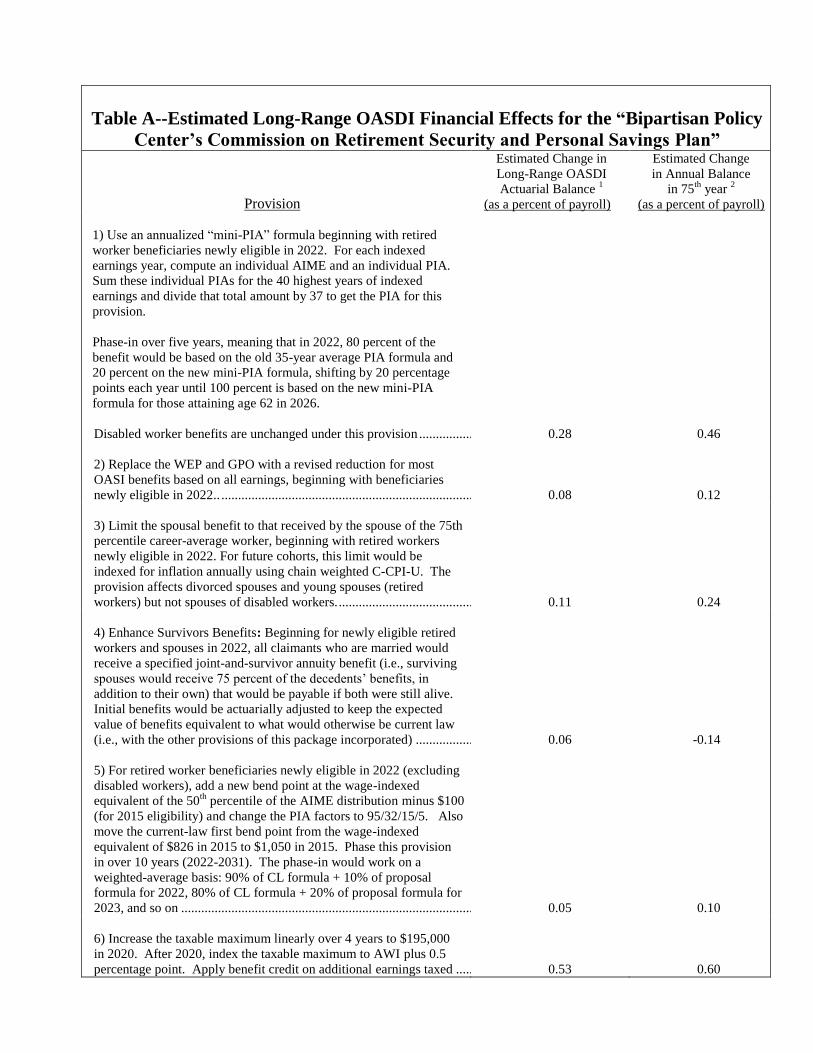
Table A--Estimated Long-Range OASDI Financial Effects for the “Bipartisan Policy
Center’s Commission on Retirement Security and Personal Savings Plan”
Provision
Estimated Change in
Long-Range OASDI
Actuarial Balance 1
(as a percent of payroll)
Estimated Change
in Annual Balance
in 75th
year 2
(as a percent of payroll)
1) Use an annualized “mini-PIA” formula beginning with retired
worker beneficiaries newly eligible in 2022. For each indexed
earnings year, compute an individual AIME and an individual PIA.
Sum these individual PIAs for the 40 highest years of indexed
earnings and divide that total amount by 37 to get the PIA for this
provision.
Phase-in over five years, meaning that in 2022, 80 percent of the
benefit would be based on the old 35-year average PIA formula and
20 percent on the new mini-PIA formula, shifting by 20 percentage
points each year until 100 percent is based on the new mini-PIA
formula for those attaining age 62 in 2026.
Disabled worker benefits are unchanged under this provision ...................................................................................... 0.28 0.46
2) Replace the WEP and GPO with a revised reduction for most
OASI benefits based on all earnings, beginning with beneficiaries
newly eligible in 2022.. ................................................................................................................................................. 0.08 0.12
3) Limit the spousal benefit to that received by the spouse of the 75th
percentile career-average worker, beginning with retired workers
newly eligible in 2022. For future cohorts, this limit would be
indexed for inflation annually using chain weighted C-CPI-U. The
provision affects divorced spouses and young spouses (retired
workers) but not spouses of disabled workers. .............................................................................................................. 0.11 0.24
4) Enhance Survivors Benefits: Beginning for newly eligible retired
workers and spouses in 2022, all claimants who are married would
receive a specified joint-and-survivor annuity benefit (i.e., surviving
spouses would receive 75 percent of the decedents’ benefits, in
addition to their own) that would be payable if both were still alive.
Initial benefits would be actuarially adjusted to keep the expected
value of benefits equivalent to what would otherwise be current law
(i.e., with the other provisions of this package incorporated) ....................................................................................... 0.06 -0.14
5) For retired worker beneficiaries newly eligible in 2022 (excluding
disabled workers), add a new bend point at the wage-indexed
equivalent of the 50th
percentile of the AIME distribution minus $100
(for 2015 eligibility) and change the PIA factors to 95/32/15/5. Also
move the current-law first bend point from the wage-indexed
equivalent of $826 in 2015 to $1,050 in 2015. Phase this provision
in over 10 years (2022-2031). The phase-in would work on a
weighted-average basis: 90% of CL formula + 10% of proposal
formula for 2022, 80% of CL formula + 20% of proposal formula for
2023, and so on ............................................................................................................................................................. 0.05 0.10
6) Increase the taxable maximum linearly over 4 years to $195,000
in 2020. After 2020, index the taxable maximum to AWI plus 0.5
percentage point. Apply benefit credit on additional earnings taxed ........................................................................... 0.53 0.60

Table A--Estimated Long-Range OASDI Financial Effects for the “Bipartisan Policy
Center’s Commission on Retirement Security and Personal Savings Plan”
Provision
Estimated Change in
Long-Range OASDI
Actuarial Balance 1
(as a percent of payroll)
Estimated Change
in Annual Balance
in 75th
year 2
(as a percent of payroll)
7) Increase the payroll tax rate by 0.1 percentage point per year for
2017 through 2026 so that it equals 13.4 percent for 2026 and later.
The increase would be split evenly between the employer and
employee share, and would be split between OASI and DI in
proportion to currently scheduled payroll tax rates ....................................................................................................... 0.87 1.00
8) After the normal retirement age (NRA) reaches 67 for those
attaining 62 in 2022, increase it by 1 month every 2 years until the
NRA reaches 69. Also increase the age up to which the delayed
retirement credit may be earned at the same rate (from 70 to 72). No
change to earliest eligibility age. ................................................................................................................................... 0.47 1.36
9) Beginning in 2017 (December 2016), for OASI beneficiaries only
(DI beneficiaries would only be affected when their benefit converts
to OASI at NRA), the annual COLA would be based on the chain
weighted version of the CPI-U ...................................................................................................................................... 0.46 0.62
10) Beginning in 2017, extend student benefits to age 22 for children
of disabled or deceased workers if the child is in high school or
below, college, or a vocational school (full-time) ......................................................................................................... -0.06 -0.06
11) Beginning in 2022, for single/head-of-household/married-filing-
separate taxpayers with MAGI of $250,000 or more and joint filers
with MAGI of $500,000 or more, include up to the remaining 15
percent of Social Security benefits in taxable income (increased from
up to 85 percent of benefits taxable under current law). In
subsequent years, update these thresholds for growth in wages
(AWI). Revenue from this provision would be credited to the Social
Security trust funds. Current law taxation of up to 85 percent of
Social Security benefits would remain unchanged ........................................................................................................ 0.01 0.01

Table A--Estimated Long-Range OASDI Financial Effects for the “Bipartisan Policy
Center’s Commission on Retirement Security and Personal Savings Plan”
Provision
Estimated Change in
Long-Range OASDI
Actuarial Balance 1
(as a percent of payroll)
Estimated Change
in Annual Balance
in 75th
year 2
(as a percent of payroll)
12) Beginning in 2020, create a Basic Minimum Benefit (BMB)
within Social Security (i.e., the cost of the BMB would be charged as
a cost to the OASI Trust Fund), with the following specifications:
Eligibility for the BMB would be limited to OASI
beneficiaries who have attained normal retirement age (NRA)
or above. OASI beneficiaries under NRA would not be
eligible for the BMB.
The BMB would be calculated on a household basis and split
equally between members of the household. In the case of a
married couple, both spouses would need to claim any Social
Security benefits for which they are eligible before they could
receive the BMB. If both spouses have claimed and one is
NRA or above and the other has not yet attained NRA, only
the half of the BMB for the spouse over NRA would be
payable.
The BMB amount for single beneficiaries would be equal to
either: 1) the BMB base ($604 in 2015) – 0.70 * current
monthly OASI benefit (not including any BMB), if positive;
or 2) zero.
The BMB amount for married beneficiaries would be equal to
either: 1) the BMB base ($906 in 2015) – 0.70 * total
household monthly OASI benefits (not including any BMB),
if positive; or 2) zero.
The BMB bases for singles and couples would be updated
annually for changes in the average wage index (AWI).
Single filers with Adjusted Gross Income (AGI) over $30,000
and joint filers with AGI (including taxable SS benefits) over
$45,000 would be subject to clawback of the BMB through
the income tax system. Any BMB would be reduced by one
dollar for every dollar of income above the thresholds.
(Thresholds, in 2015 dollars, would be indexed to chained
CPI-U.) Clawbacks would be credited back to the OASI
Trust Fund .......................................................................................................................................................... -0.19 -0.24
Total for all provisions, including interaction ......................................................................... 2.81 4.34
1Under current law, the estimated long-range OASDI actuarial balance is -2.68 percent of taxable payroll.
2Under current law, the estimated 75
th year annual balance is -4.65 percent of taxable payroll.
Notes: All estimates are based on the intermediate assumptions of the 2015 OASDI Trustees Report.
Estimates of individual provisions appear on a stand-alone basis relative to current law, unless otherwise stated.
Social Security Administration
Office of the Chief Actuary
June 9, 2016

Year
Attain Index NRA Reduced Benefit Minimum
Age 65 (Wage-Indexed (CPI-Indexed 1 Mth/ 2 Yrs4
COLA5
Formula6
Benefit7 Total Scheduled Payable
2015 Dollars) 2015 Dollars)
2015 709 709 0.0 0.0 0.0 0.0 0.0 100 100
2030 644 809 -1.3 -0.9 -5.9 0.0 -7.9 92 92
2050 643 1,022 -7.7 -0.9 0.5 0.0 -8.0 92 117
2080 646 1,431 -13.5 -0.9 0.5 0.0 -13.8 86 117
2015 709 709 0.0 0.0 0.0 0.0 0.0 100 100
2030 644 809 -1.3 -0.9 -23.5 0.0 -25.1 75 75
2050 643 1,022 -7.7 -0.9 -18.7 0.0 -25.6 74 94
2080 646 1,431 -13.5 -0.9 -18.7 0.0 -30.3 70 95
2015 709 709 0.0 0.0 0.0 0.0 0.0 100 100
2030 644 809 -1.3 -0.9 -35.3 0.0 -36.7 63 63
2050 643 1,022 -7.7 -0.9 -31.9 0.0 -37.7 62 79
2080 646 1,431 -13.5 -0.9 -32.0 0.0 -41.6 58 79
2015 927 927 0.0 0.0 0.0 0.0 0.0 100 100
2030 842 1,058 -1.3 -0.9 17.7 0.0 15.2 115 115
2050 842 1,337 -7.7 -0.9 25.5 0.0 14.8 115 146
2080 846 1,873 -13.5 -0.9 25.5 0.0 7.6 108 146
2015 927 927 0.0 0.0 0.0 0.0 0.0 100 100
2030 842 1,058 -1.3 -0.9 -3.4 0.0 -5.5 95 95
2050 842 1,337 -7.7 -0.9 2.2 0.0 -6.5 94 119
2080 846 1,873 -13.5 -0.9 2.2 0.0 -12.3 88 119
2015 927 927 0.0 0.0 0.0 0.0 0.0 100 100
2030 842 1,058 -1.3 -0.9 -19.2 0.0 -20.9 79 79
2050 842 1,337 -7.7 -0.9 -15.6 0.0 -22.8 77 98
2080 846 1,873 -13.5 -0.9 -15.6 0.0 -27.6 72 98
2015 1,528 1,528 0.0 0.0 0.0 0.0 0.0 100 100
2030 1,388 1,744 -1.3 -0.9 9.3 0.0 7.0 107 107
2050 1,388 2,204 -7.7 -0.9 11.9 0.0 2.4 102 130
2080 1,394 3,086 -13.5 -0.9 11.9 0.0 -4.0 96 130
2015 1,528 1,528 0.0 0.0 0.0 0.0 0.0 100 100
2030 1,388 1,744 -1.3 -0.9 -10.5 0.0 -12.4 88 88
2050 1,388 2,204 -7.7 -0.9 -11.1 0.0 -18.7 81 103
2080 1,394 3,086 -13.5 -0.9 -11.1 0.0 -23.8 76 103
2015 2,025 2,025 0.0 0.0 0.0 0.0 0.0 100 100
2030 1,839 2,310 -1.3 -0.9 0.3 0.0 -1.8 98 98
2050 1,838 2,920 -7.7 -0.9 -3.5 0.0 -11.7 88 112
2080 1,846 4,088 -13.5 -0.9 -3.5 0.0 -17.2 83 112
2015 2,452 2,452 0.0 0.0 0.0 0.0 0.0 100 100
2030 2,249 2,826 -1.3 -0.9 -5.2 0.0 -7.3 93 93
2050 2,248 3,570 -7.7 -0.9 -13.9 0.0 -21.2 79 100
2080 2,251 4,985 -13.5 -0.9 -13.7 0.0 -26.0 74 100
1Average of highest 35 years of earnings wage indexed to 2015.
2Projected percent of new retired worker awards in 2050 closest to AIME levels and years of work.
3After the trust fund reserves deplete under present law continuing taxes are expected to be enough to pay about three fourths of scheduled benefits.
4
5
6
7
All estimates based on the intermediate assumptions of the 2015 Trustees Report.
Office of the Chief Actuary, Social Security Administration June 9, 2016
Low-AIME ($21,519 for 20151) 44-Year Scaled Earner (16.0% of Retirees
2)
Low-AIME ($21,519 for 20151) 30-Year Scaled Earner (4.6% of Retirees
2)
Low-AIME ($21,519 for 20151) 20-Year Scaled Earner (2.2% of Retirees
2)
Medium-AIME ($47,820 for 20151) 44-Year Scaled Earner (29.4% of Retirees
2)
Medium-AIME ($47,820 for 20151) 30-Year Scaled Earner (2.4% of Retirees
2)
High-AIME ($76,512 for 20151) 44-Year Scaled Earner (21.4% of Retirees
2)
Maximum-AIME ($118,500 for 20151) 43-Year Steady Earner (5.9% of Retirees
2)
After the NRA reaches 67 for those aged 62 in 2022, increase it by 1 month every 2 years until NRA reaches age 69.
Starting Dec 2016, compute the COLA using the chain-weighted C-CPI-U, producing 0.3% lower annual COLAs on average.
Beginning with newly eligible beneficiaries in 2022, change the PIA Formula to sum the highest 40 years of the amounts with the benefit formula applied to indexed individual years of earnings
(mini PIA formula approach) divided by 37, phasing in from 2022-2026. Starting in 2022, change the bend points to $1,419/$4,345/$6,732 and PIA factors to 95%/32%/15%/5%. Phase the new
bend points and PIA factors in from 2022-2031.
Beginning in 2020, the Basic Minimum Benefit (BMB) would apply for beneficiaries who have attained NRA. For single/married beneficiares, the BMB amount is $604/$906 - 0.70*total
household monthly benefits in 2015, then wage indexed. The BMB is calculated at least annually, whenever there is a change in benefits. If MAGI is greater then $30,000 if single and $45,000 if
married, any BMB above the limits would be reduced dollar for dollar. The threshold limits are as of 2015, then C-CPI-U indexed. The Minimum Benefit Percent change is calculated after all
other provisions, so that the Proposed Benefit Amount is at least the Minimum Benefit. The examples in this table calculate the BMB for single beneficiaries.
(Percent change) (Percents)
Very-Low-AIME ($11,955 for 20151) 30-Year Scaled Earner (8.8% of Retirees
2)
Very-Low-AIME ($11,955 for 20151) 20-Year Scaled Earner (4.8% of Retirees
2)
Very-Low-AIME ($11,955 for 20151) 14-Year Scaled Earner (4.5% of Retirees
2)
Monthly Benefits3 Percent of Present Law:
Table B1. Changes in Benefits for Hypothetical Workers Beginning Benefit Receipt at age 65
Bipartisan Policy Center's Commission on Retirement Security and Personal Savings Plan
Scheduled Benefit Level Percent Change at age 65
Present Law Scheduled Proposal Scheduled Benefit
Year
Attain
Age 65 Age 65 Age 75 Age 85 Age 95
2015 100.0 131.5 143.4 156.8
2030 92.1 130.9 143.1 156.6
2050 92.0 130.7 142.0 154.6
2080 86.2 128.3 139.7 152.6
2015 100.0 131.5 143.4 156.8
2030 74.9 125.8 138.2 151.9
2050 74.4 125.6 137.1 149.8
2080 69.7 123.4 135.0 148.0
2015 100.0 131.5 143.4 156.8
2030 63.3 122.5 135.0 148.7
2050 62.3 122.0 133.6 146.4
2080 58.4 120.1 131.8 144.9
2015 100.0 107.4 116.3 126.3
2030 115.2 113.0 122.0 132.0
2050 114.8 112.9 121.1 130.4
2080 107.6 110.2 118.6 128.1
2015 100.0 107.4 116.3 126.3
2030 94.5 107.0 116.2 126.3
2050 93.5 106.7 115.1 124.5
2080 87.7 104.4 112.9 122.6
2015 100.0 107.4 116.3 126.3
2030 79.1 102.5 111.8 122.1
2050 77.2 101.9 110.5 120.1
2080 72.4 99.9 108.6 118.4
2015 100.0 97.4 94.6 91.9
2030 107.0 103.9 100.9 98.0
2050 102.4 99.5 96.6 93.8
2080 96.0 93.2 90.5 87.9
2015 100.0 97.4 94.6 91.9
2030 87.6 85.0 82.6 80.2
2050 81.3 79.0 76.7 74.5
2080 76.2 74.0 71.9 69.8
2015 100.0 97.4 94.6 91.9
2030 98.2 95.3 92.6 89.9
2050 88.3 85.8 83.3 80.9
2080 82.8 80.4 78.1 75.8
2015 100.0 97.4 94.6 91.9
2030 92.7 90.1 87.5 84.9
2050 78.8 76.5 74.3 72.2
2080 74.0 71.9 69.8 67.8
1Average of highest 35 years of earnings wage indexed to 2015.
2Projected percent of new retired worker awards in 2050 closest to AIME levels and years of work.
Note:
- Starting Dec 2016, compute the COLA using the chain-weighted C-CPI-U, producing 0.3% lower annual COLAs on average.
-
Other Changes:
-
-
All estimates based on the intermediate assumptions of the 2015 Trustees Report.
Office of the Chief Actuary, Social Security Administration June 9, 2016
High-AIME ($76,512 for 20151) 44-Year Scaled Earner (21.4% of Retirees
2)
Maximum-AIME ($118,500 for 20151) 43-Year Steady Earner (5.9% of Retirees
2)
Beginning in 2020, the Basic Minimum Benefit (BMB) would apply for beneficiaries who have attained NRA. For single/married beneficiares, the BMB amount is $604/$906 -
0.70*total household monthly benefits in 2015, then wage indexed. The BMB is calculated at least annually, whenever there is a change in benefits. If MAGI is greater then $30,000 if
single and $45,000 if married, any BMB above the limits would be reduced dollar for dollar. The threshold limits are as of 2015, then C-CPI-U indexed. The Minimum Benefit Percent
change is calculated after all other provisions, so that the Proposed Benefit Amount is at least the Minimum Benefit. The examples in this table calculate the BMB for single
beneficiaries.
After the NRA reaches 67 for those aged 62 in 2022, increase it by 1 month every 2 years until NRA reaches age 69.Beginning with newly eligible beneficiaries in 2022, change the PIA Formula to sum the highest 40 years of the amounts with the benefit formula applied to indexed individual years of
earnings (mini PIA formula approach) divided by 37, phasing in from 2022-2026. Starting in 2022, change the bend points to $1,419/$4,345/$6,732 and PIA factors to
95%/32%/15%/5%. Phase the new bend points and PIA factors in from 2022-2031.
Medium-AIME ($47,820 for 20151) 30-Year Scaled Earner (2.4% of Retirees
2)
Table B2. Changes in Benefits for Hypothetical Workers Beginning Benefit Receipt at age 65
Bipartisan Policy Center's Commission on Retirement Security and Personal Savings Plan
Proposal Scheduled Benefit as Percent of Present Law Scheduled
(Percent)
Very-Low-AIME ($11,955 for 20151) 30-Year Scaled Earner (8.8% of Retirees
2)
Very-Low-AIME ($11,955 for 20151) 20-Year Scaled Earner (4.8% of Retirees
2)
Very-Low-AIME ($11,955 for 20151) 14-Year Scaled Earner (4.5% of Retirees
2)
Low-AIME ($21,519 for 20151) 44-Year Scaled Earner (16.0% of Retirees
2)
Low-AIME ($21,519 for 20151) 30-Year Scaled Earner (4.6% of Retirees
2)
Low-AIME ($21,519 for 20151) 20-Year Scaled Earner (2.2% of Retirees
2)
Medium-AIME ($47,820 for 20151) 44-Year Scaled Earner (29.4% of Retirees
2)
Category Dually Entitled2
WEP3
Foreign Born All Others4
Very-Low-AIME ($11,955 for 20151):
30-Year Scaled Earner (9.3% of Retirees) 47 6 11 40
20-Year Scaled Earner (5.8% of Retirees) 38 16 21 31
14-Year Scaled Earner (5.3% of Retirees) 22 21 45 20
Low-AIME ($21,519 for 20151):
44-Year Scaled Earner (13.1% of Retirees) 15 2 6 78
30-Year Scaled Earner (5.9% of Retirees) 16 9 18 59
20-Year Scaled Earner (3.1% of Retirees) 10 23 35 37
Medium-AIME ($47,820 for 20151):
44-Year Scaled Earner (23.0% of Retirees) 1 1 5 93
30-Year Scaled Earner (4.4% of Retirees) 1 8 26 67
High-AIME ($76,512 for 20151):
44-Year Scaled Earner (20.5% of Retirees) 0 0 6 93
Maximum-AIME ($118,500 for 20151):
Steady Earner (9.4% of Retirees) 0 0 7 93
1Average of highest 35 years of earnings wage indexed to 2015.
2
3Covered by pension from government employment and are subject to the windfall elimination provision (WEP).
4Neither foreign born, subject to WEP, or dually entitled.
August 5, 2015
Note 3: The sum of the percentages for each category (sum across rows) could be greater than 100 percent because some beneficiaries can be classified in more than one of the
following groups: dually entitled, WEP, and foreign born.
Under current law, entitled to an additional benefit based on someone else's account. The dually entitled percent is a minimum value. Some beneficiaries that are not
currently dually entitled could become dually entitled in the future.
Office of the Chief Actuary, Social Security Administration
Table B3. Important Characteristics of Hypothetical Workers in 2007
Percent of Beneficiaries Within Each Category That Are:
Note 1:Table B3 displays the percentages of these newly-entitled retired workers in 2007 that are closest to each of the illustrative examples.
Note 2: Percents based on tabulations of a 10-percent sample of newly entitled retired-worker beneficiaries in 2007 (169,725 records). We can be 95 percent confident that each
of the values shown above is within 1.4 percentage points of the value we would find using 100 percent of the retirees in 2007.
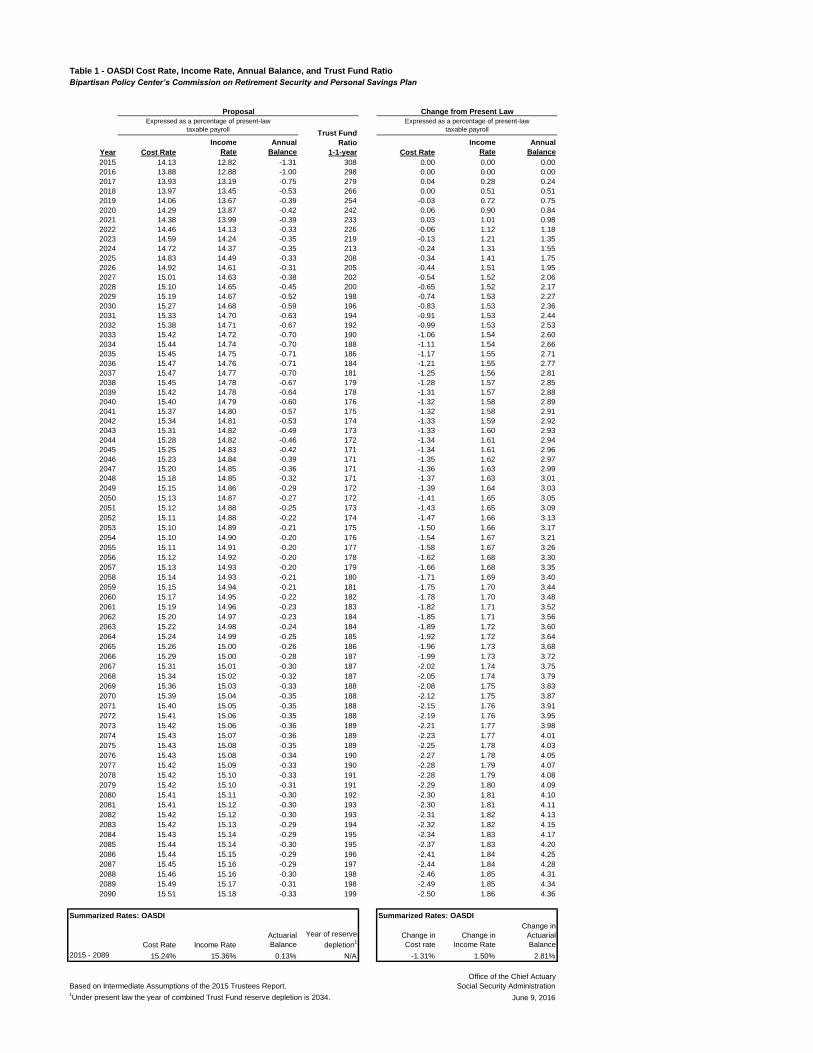
Table 1 - OASDI Cost Rate, Income Rate, Annual Balance, and Trust Fund Ratio
Bipartisan Policy Center’s Commission on Retirement Security and Personal Savings Plan
Year Cost Rate
Income
Rate
Annual
Balance Cost Rate
Income
Rate
Annual
Balance
2015 14.13 12.82 -1.31 308 0.00 0.00 0.00
2016 13.88 12.88 -1.00 298 0.00 0.00 0.00
2017 13.93 13.19 -0.75 279 0.04 0.28 0.24
2018 13.97 13.45 -0.53 266 0.00 0.51 0.51
2019 14.06 13.67 -0.39 254 -0.03 0.72 0.75
2020 14.29 13.87 -0.42 242 0.06 0.90 0.84
2021 14.38 13.99 -0.39 233 0.03 1.01 0.98
2022 14.46 14.13 -0.33 226 -0.06 1.12 1.18
2023 14.59 14.24 -0.35 219 -0.13 1.21 1.35
2024 14.72 14.37 -0.35 213 -0.24 1.31 1.55
2025 14.83 14.49 -0.33 208 -0.34 1.41 1.75
2026 14.92 14.61 -0.31 205 -0.44 1.51 1.95
2027 15.01 14.63 -0.38 202 -0.54 1.52 2.06
2028 15.10 14.65 -0.45 200 -0.65 1.52 2.17
2029 15.19 14.67 -0.52 198 -0.74 1.53 2.27
2030 15.27 14.68 -0.59 196 -0.83 1.53 2.36
2031 15.33 14.70 -0.63 194 -0.91 1.53 2.44
2032 15.38 14.71 -0.67 192 -0.99 1.53 2.53
2033 15.42 14.72 -0.70 190 -1.06 1.54 2.60
2034 15.44 14.74 -0.70 188 -1.11 1.54 2.66
2035 15.45 14.75 -0.71 186 -1.17 1.55 2.71
2036 15.47 14.76 -0.71 184 -1.21 1.55 2.77
2037 15.47 14.77 -0.70 181 -1.25 1.56 2.81
2038 15.45 14.78 -0.67 179 -1.28 1.57 2.85
2039 15.42 14.78 -0.64 178 -1.31 1.57 2.88
2040 15.40 14.79 -0.60 176 -1.32 1.58 2.89
2041 15.37 14.80 -0.57 175 -1.32 1.58 2.91
2042 15.34 14.81 -0.53 174 -1.33 1.59 2.92
2043 15.31 14.82 -0.49 173 -1.33 1.60 2.93
2044 15.28 14.82 -0.46 172 -1.34 1.61 2.94
2045 15.25 14.83 -0.42 171 -1.34 1.61 2.96
2046 15.23 14.84 -0.39 171 -1.35 1.62 2.97
2047 15.20 14.85 -0.36 171 -1.36 1.63 2.99
2048 15.18 14.85 -0.32 171 -1.37 1.63 3.01
2049 15.15 14.86 -0.29 172 -1.39 1.64 3.03
2050 15.13 14.87 -0.27 172 -1.41 1.65 3.05
2051 15.12 14.88 -0.25 173 -1.43 1.65 3.09
2052 15.11 14.88 -0.22 174 -1.47 1.66 3.13
2053 15.10 14.89 -0.21 175 -1.50 1.66 3.17
2054 15.10 14.90 -0.20 176 -1.54 1.67 3.21
2055 15.11 14.91 -0.20 177 -1.58 1.67 3.26
2056 15.12 14.92 -0.20 178 -1.62 1.68 3.30
2057 15.13 14.93 -0.20 179 -1.66 1.68 3.35
2058 15.14 14.93 -0.21 180 -1.71 1.69 3.40
2059 15.15 14.94 -0.21 181 -1.75 1.70 3.44
2060 15.17 14.95 -0.22 182 -1.78 1.70 3.48
2061 15.19 14.96 -0.23 183 -1.82 1.71 3.52
2062 15.20 14.97 -0.23 184 -1.85 1.71 3.56
2063 15.22 14.98 -0.24 184 -1.89 1.72 3.60
2064 15.24 14.99 -0.25 185 -1.92 1.72 3.64
2065 15.26 15.00 -0.26 186 -1.96 1.73 3.68
2066 15.29 15.00 -0.28 187 -1.99 1.73 3.72
2067 15.31 15.01 -0.30 187 -2.02 1.74 3.75
2068 15.34 15.02 -0.32 187 -2.05 1.74 3.79
2069 15.36 15.03 -0.33 188 -2.08 1.75 3.83
2070 15.39 15.04 -0.35 188 -2.12 1.75 3.87
2071 15.40 15.05 -0.35 188 -2.15 1.76 3.91
2072 15.41 15.06 -0.35 188 -2.19 1.76 3.95
2073 15.42 15.06 -0.36 189 -2.21 1.77 3.98
2074 15.43 15.07 -0.36 189 -2.23 1.77 4.01
2075 15.43 15.08 -0.35 189 -2.25 1.78 4.03
2076 15.43 15.08 -0.34 190 -2.27 1.78 4.05
2077 15.42 15.09 -0.33 190 -2.28 1.79 4.07
2078 15.42 15.10 -0.33 191 -2.28 1.79 4.08
2079 15.42 15.10 -0.31 191 -2.29 1.80 4.09
2080 15.41 15.11 -0.30 192 -2.30 1.81 4.10
2081 15.41 15.12 -0.30 193 -2.30 1.81 4.11
2082 15.42 15.12 -0.30 193 -2.31 1.82 4.13
2083 15.42 15.13 -0.29 194 -2.32 1.82 4.15
2084 15.43 15.14 -0.29 195 -2.34 1.83 4.17
2085 15.44 15.14 -0.30 195 -2.37 1.83 4.20
2086 15.44 15.15 -0.29 196 -2.41 1.84 4.25
2087 15.45 15.16 -0.29 197 -2.44 1.84 4.28
2088 15.46 15.16 -0.30 198 -2.46 1.85 4.31
2089 15.49 15.17 -0.31 198 -2.49 1.85 4.34
2090 15.51 15.18 -0.33 199 -2.50 1.86 4.36
Summarized Rates: OASDI Summarized Rates: OASDI
Cost Rate Income Rate
Actuarial
Balance
Change in
Cost rate
Change in
Income Rate
Change in
Actuarial
Balance
2015 - 2089 15.24% 15.36% 0.13% N/A -1.31% 1.50% 2.81%
Based on Intermediate Assumptions of the 2015 Trustees Report. Social Security Administration1Under present law the year of combined Trust Fund reserve depletion is 2034.
Change from Present Law
Year of reserve
depletion1
June 9, 2016
Office of the Chief Actuary
Proposal
Expressed as a percentage of present-law
taxable payrollTrust Fund
Ratio
1-1-year
Expressed as a percentage of present-law
taxable payroll
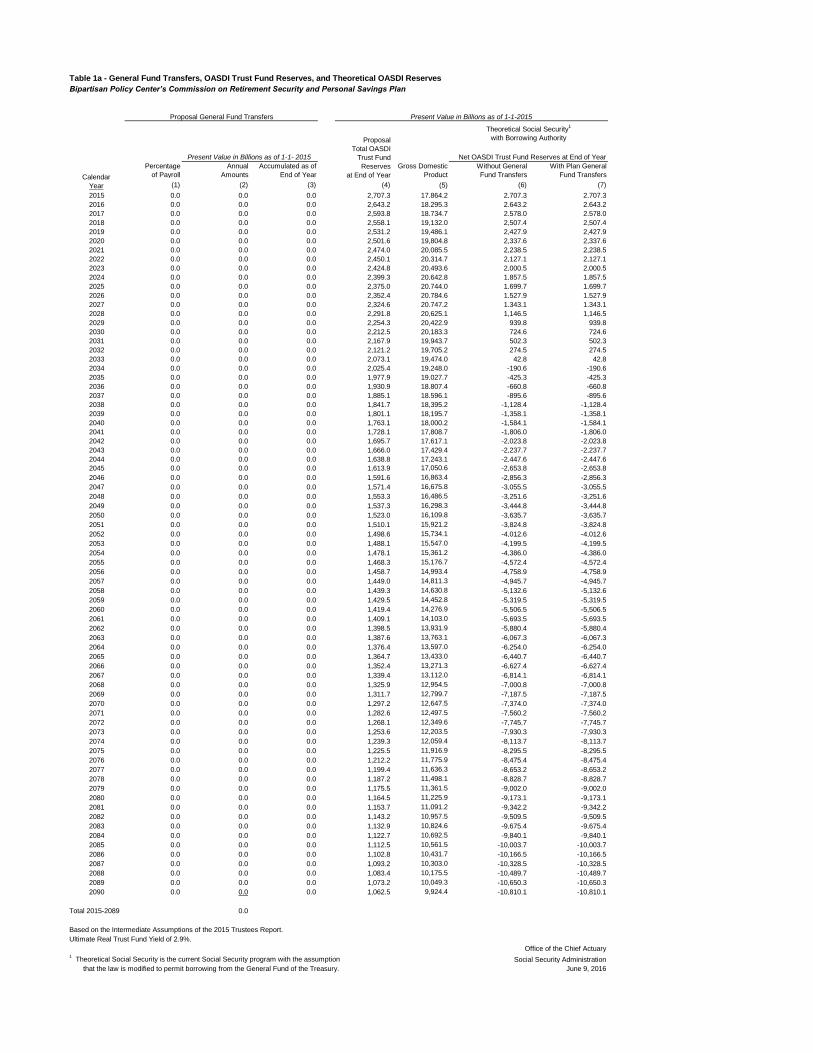
Table 1a - General Fund Transfers, OASDI Trust Fund Reserves, and Theoretical OASDI Reserves
Bipartisan Policy Center’s Commission on Retirement Security and Personal Savings Plan
Percentage
of Payroll
Annual
Amounts
Accumulated as of
End of Year
Gross Domestic
Product
Without General
Fund Transfers
With Plan General
Fund Transfers
(1) (2) (3) (4) (5) (6) (7)
2015 0.0 0.0 0.0 2,707.3 17,864.2 2,707.3 2,707.3
2016 0.0 0.0 0.0 2,643.2 18,295.3 2,643.2 2,643.2
2017 0.0 0.0 0.0 2,593.8 18,734.7 2,578.0 2,578.0
2018 0.0 0.0 0.0 2,558.1 19,132.0 2,507.4 2,507.4
2019 0.0 0.0 0.0 2,531.2 19,486.1 2,427.9 2,427.9
2020 0.0 0.0 0.0 2,501.6 19,804.8 2,337.6 2,337.6
2021 0.0 0.0 0.0 2,474.0 20,085.5 2,238.5 2,238.5
2022 0.0 0.0 0.0 2,450.1 20,314.7 2,127.1 2,127.1
2023 0.0 0.0 0.0 2,424.8 20,493.6 2,000.5 2,000.5
2024 0.0 0.0 0.0 2,399.3 20,642.8 1,857.5 1,857.5
2025 0.0 0.0 0.0 2,375.0 20,744.0 1,699.7 1,699.7
2026 0.0 0.0 0.0 2,352.4 20,784.6 1,527.9 1,527.9
2027 0.0 0.0 0.0 2,324.6 20,747.2 1,343.1 1,343.1
2028 0.0 0.0 0.0 2,291.8 20,625.1 1,146.5 1,146.5
2029 0.0 0.0 0.0 2,254.3 20,422.9 939.8 939.8
2030 0.0 0.0 0.0 2,212.5 20,183.3 724.6 724.6
2031 0.0 0.0 0.0 2,167.9 19,943.7 502.3 502.3
2032 0.0 0.0 0.0 2,121.2 19,705.2 274.5 274.5
2033 0.0 0.0 0.0 2,073.1 19,474.0 42.8 42.8
2034 0.0 0.0 0.0 2,025.4 19,248.0 -190.6 -190.6
2035 0.0 0.0 0.0 1,977.9 19,027.7 -425.3 -425.3
2036 0.0 0.0 0.0 1,930.9 18,807.4 -660.8 -660.8
2037 0.0 0.0 0.0 1,885.1 18,596.1 -895.6 -895.6
2038 0.0 0.0 0.0 1,841.7 18,395.2 -1,128.4 -1,128.4
2039 0.0 0.0 0.0 1,801.1 18,195.7 -1,358.1 -1,358.1
2040 0.0 0.0 0.0 1,763.1 18,000.2 -1,584.1 -1,584.1
2041 0.0 0.0 0.0 1,728.1 17,808.7 -1,806.0 -1,806.0
2042 0.0 0.0 0.0 1,695.7 17,617.1 -2,023.8 -2,023.8
2043 0.0 0.0 0.0 1,666.0 17,429.4 -2,237.7 -2,237.7
2044 0.0 0.0 0.0 1,638.8 17,243.1 -2,447.6 -2,447.6
2045 0.0 0.0 0.0 1,613.9 17,050.6 -2,653.8 -2,653.8
2046 0.0 0.0 0.0 1,591.6 16,863.4 -2,856.3 -2,856.3
2047 0.0 0.0 0.0 1,571.4 16,675.8 -3,055.5 -3,055.5
2048 0.0 0.0 0.0 1,553.3 16,486.5 -3,251.6 -3,251.6
2049 0.0 0.0 0.0 1,537.3 16,298.3 -3,444.8 -3,444.8
2050 0.0 0.0 0.0 1,523.0 16,109.8 -3,635.7 -3,635.7
2051 0.0 0.0 0.0 1,510.1 15,921.2 -3,824.8 -3,824.8
2052 0.0 0.0 0.0 1,498.6 15,734.1 -4,012.6 -4,012.6
2053 0.0 0.0 0.0 1,488.1 15,547.0 -4,199.5 -4,199.5
2054 0.0 0.0 0.0 1,478.1 15,361.2 -4,386.0 -4,386.0
2055 0.0 0.0 0.0 1,468.3 15,176.7 -4,572.4 -4,572.4
2056 0.0 0.0 0.0 1,458.7 14,993.4 -4,758.9 -4,758.9
2057 0.0 0.0 0.0 1,449.0 14,811.3 -4,945.7 -4,945.7
2058 0.0 0.0 0.0 1,439.3 14,630.8 -5,132.6 -5,132.6
2059 0.0 0.0 0.0 1,429.5 14,452.8 -5,319.5 -5,319.5
2060 0.0 0.0 0.0 1,419.4 14,276.9 -5,506.5 -5,506.5
2061 0.0 0.0 0.0 1,409.1 14,103.0 -5,693.5 -5,693.5
2062 0.0 0.0 0.0 1,398.5 13,931.9 -5,880.4 -5,880.4
2063 0.0 0.0 0.0 1,387.6 13,763.1 -6,067.3 -6,067.3
2064 0.0 0.0 0.0 1,376.4 13,597.0 -6,254.0 -6,254.0
2065 0.0 0.0 0.0 1,364.7 13,433.0 -6,440.7 -6,440.7
2066 0.0 0.0 0.0 1,352.4 13,271.3 -6,627.4 -6,627.4
2067 0.0 0.0 0.0 1,339.4 13,112.0 -6,814.1 -6,814.1
2068 0.0 0.0 0.0 1,325.9 12,954.5 -7,000.8 -7,000.8
2069 0.0 0.0 0.0 1,311.7 12,799.7 -7,187.5 -7,187.5
2070 0.0 0.0 0.0 1,297.2 12,647.5 -7,374.0 -7,374.0
2071 0.0 0.0 0.0 1,282.6 12,497.5 -7,560.2 -7,560.2
2072 0.0 0.0 0.0 1,268.1 12,349.6 -7,745.7 -7,745.7
2073 0.0 0.0 0.0 1,253.6 12,203.5 -7,930.3 -7,930.3
2074 0.0 0.0 0.0 1,239.3 12,059.4 -8,113.7 -8,113.7
2075 0.0 0.0 0.0 1,225.5 11,916.9 -8,295.5 -8,295.5
2076 0.0 0.0 0.0 1,212.2 11,775.9 -8,475.4 -8,475.4
2077 0.0 0.0 0.0 1,199.4 11,636.3 -8,653.2 -8,653.2
2078 0.0 0.0 0.0 1,187.2 11,498.1 -8,828.7 -8,828.7
2079 0.0 0.0 0.0 1,175.5 11,361.5 -9,002.0 -9,002.0
2080 0.0 0.0 0.0 1,164.5 11,225.9 -9,173.1 -9,173.1
2081 0.0 0.0 0.0 1,153.7 11,091.2 -9,342.2 -9,342.2
2082 0.0 0.0 0.0 1,143.2 10,957.5 -9,509.5 -9,509.5
2083 0.0 0.0 0.0 1,132.9 10,824.6 -9,675.4 -9,675.4
2084 0.0 0.0 0.0 1,122.7 10,692.5 -9,840.1 -9,840.1
2085 0.0 0.0 0.0 1,112.5 10,561.5 -10,003.7 -10,003.7
2086 0.0 0.0 0.0 1,102.8 10,431.7 -10,166.5 -10,166.5
2087 0.0 0.0 0.0 1,093.2 10,303.0 -10,328.5 -10,328.5
2088 0.0 0.0 0.0 1,083.4 10,175.5 -10,489.7 -10,489.7
2089 0.0 0.0 0.0 1,073.2 10,049.3 -10,650.3 -10,650.3
2090 0.0 0.0 0.0 1,062.5 9,924.4 -10,810.1 -10,810.1
Total 2015-2089 0.0
Based on the Intermediate Assumptions of the 2015 Trustees Report.
Ultimate Real Trust Fund Yield of 2.9%.
Office of the Chief Actuary1 Theoretical Social Security is the current Social Security program with the assumption Social Security Administration
that the law is modified to permit borrowing from the General Fund of the Treasury. June 9, 2016
Calendar
Year
Proposal General Fund Transfers Present Value in Billions as of 1-1-2015
Proposal
Total OASDI
Trust Fund
Reserves
at End of Year
Theoretical Social Security1
with Borrowing Authority
Present Value in Billions as of 1-1- 2015 Net OASDI Trust Fund Reserves at End of Year
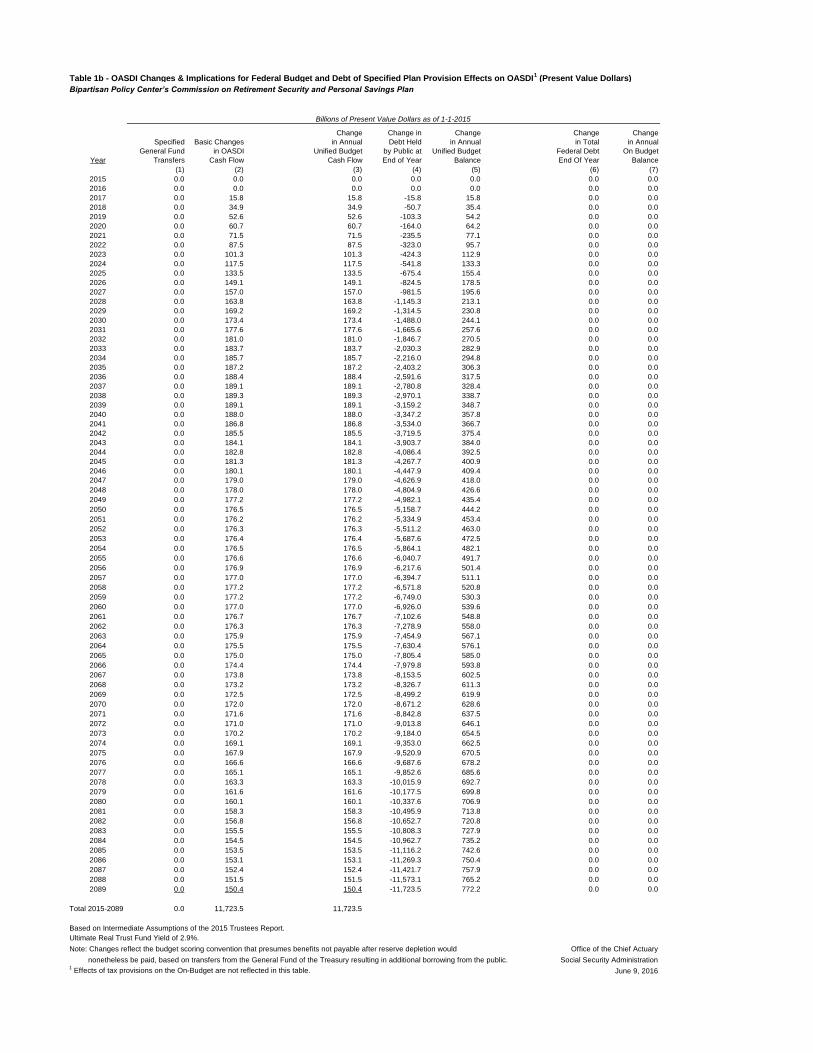
Table 1b - OASDI Changes & Implications for Federal Budget and Debt of Specified Plan Provision Effects on OASDI1 (Present Value Dollars)
Bipartisan Policy Center’s Commission on Retirement Security and Personal Savings Plan
Year
Specified
General Fund
Transfers
Basic Changes
in OASDI
Cash Flow
Change
in Annual
Unified Budget
Cash Flow
Change in
Debt Held
by Public at
End of Year
Change
in Annual
Unified Budget
Balance
Change
in Total
Federal Debt
End Of Year
Change
in Annual
On Budget
Balance
(1) (2) (3) (4) (5) (6) (7)
2015 0.0 0.0 0.0 0.0 0.0 0.0 0.0
2016 0.0 0.0 0.0 0.0 0.0 0.0 0.0
2017 0.0 15.8 15.8 -15.8 15.8 0.0 0.0
2018 0.0 34.9 34.9 -50.7 35.4 0.0 0.0
2019 0.0 52.6 52.6 -103.3 54.2 0.0 0.0
2020 0.0 60.7 60.7 -164.0 64.2 0.0 0.0
2021 0.0 71.5 71.5 -235.5 77.1 0.0 0.0
2022 0.0 87.5 87.5 -323.0 95.7 0.0 0.0
2023 0.0 101.3 101.3 -424.3 112.9 0.0 0.0
2024 0.0 117.5 117.5 -541.8 133.3 0.0 0.0
2025 0.0 133.5 133.5 -675.4 155.4 0.0 0.0
2026 0.0 149.1 149.1 -824.5 178.5 0.0 0.0
2027 0.0 157.0 157.0 -981.5 195.6 0.0 0.0
2028 0.0 163.8 163.8 -1,145.3 213.1 0.0 0.0
2029 0.0 169.2 169.2 -1,314.5 230.8 0.0 0.0
2030 0.0 173.4 173.4 -1,488.0 244.1 0.0 0.0
2031 0.0 177.6 177.6 -1,665.6 257.6 0.0 0.0
2032 0.0 181.0 181.0 -1,846.7 270.5 0.0 0.0
2033 0.0 183.7 183.7 -2,030.3 282.9 0.0 0.0
2034 0.0 185.7 185.7 -2,216.0 294.8 0.0 0.0
2035 0.0 187.2 187.2 -2,403.2 306.3 0.0 0.0
2036 0.0 188.4 188.4 -2,591.6 317.5 0.0 0.0
2037 0.0 189.1 189.1 -2,780.8 328.4 0.0 0.0
2038 0.0 189.3 189.3 -2,970.1 338.7 0.0 0.0
2039 0.0 189.1 189.1 -3,159.2 348.7 0.0 0.0
2040 0.0 188.0 188.0 -3,347.2 357.8 0.0 0.0
2041 0.0 186.8 186.8 -3,534.0 366.7 0.0 0.0
2042 0.0 185.5 185.5 -3,719.5 375.4 0.0 0.0
2043 0.0 184.1 184.1 -3,903.7 384.0 0.0 0.0
2044 0.0 182.8 182.8 -4,086.4 392.5 0.0 0.0
2045 0.0 181.3 181.3 -4,267.7 400.9 0.0 0.0
2046 0.0 180.1 180.1 -4,447.9 409.4 0.0 0.0
2047 0.0 179.0 179.0 -4,626.9 418.0 0.0 0.0
2048 0.0 178.0 178.0 -4,804.9 426.6 0.0 0.0
2049 0.0 177.2 177.2 -4,982.1 435.4 0.0 0.0
2050 0.0 176.5 176.5 -5,158.7 444.2 0.0 0.0
2051 0.0 176.2 176.2 -5,334.9 453.4 0.0 0.0
2052 0.0 176.3 176.3 -5,511.2 463.0 0.0 0.0
2053 0.0 176.4 176.4 -5,687.6 472.5 0.0 0.0
2054 0.0 176.5 176.5 -5,864.1 482.1 0.0 0.0
2055 0.0 176.6 176.6 -6,040.7 491.7 0.0 0.0
2056 0.0 176.9 176.9 -6,217.6 501.4 0.0 0.0
2057 0.0 177.0 177.0 -6,394.7 511.1 0.0 0.0
2058 0.0 177.2 177.2 -6,571.8 520.8 0.0 0.0
2059 0.0 177.2 177.2 -6,749.0 530.3 0.0 0.0
2060 0.0 177.0 177.0 -6,926.0 539.6 0.0 0.0
2061 0.0 176.7 176.7 -7,102.6 548.8 0.0 0.0
2062 0.0 176.3 176.3 -7,278.9 558.0 0.0 0.0
2063 0.0 175.9 175.9 -7,454.9 567.1 0.0 0.0
2064 0.0 175.5 175.5 -7,630.4 576.1 0.0 0.0
2065 0.0 175.0 175.0 -7,805.4 585.0 0.0 0.0
2066 0.0 174.4 174.4 -7,979.8 593.8 0.0 0.0
2067 0.0 173.8 173.8 -8,153.5 602.5 0.0 0.0
2068 0.0 173.2 173.2 -8,326.7 611.3 0.0 0.0
2069 0.0 172.5 172.5 -8,499.2 619.9 0.0 0.0
2070 0.0 172.0 172.0 -8,671.2 628.6 0.0 0.0
2071 0.0 171.6 171.6 -8,842.8 637.5 0.0 0.0
2072 0.0 171.0 171.0 -9,013.8 646.1 0.0 0.0
2073 0.0 170.2 170.2 -9,184.0 654.5 0.0 0.0
2074 0.0 169.1 169.1 -9,353.0 662.5 0.0 0.0
2075 0.0 167.9 167.9 -9,520.9 670.5 0.0 0.0
2076 0.0 166.6 166.6 -9,687.6 678.2 0.0 0.0
2077 0.0 165.1 165.1 -9,852.6 685.6 0.0 0.0
2078 0.0 163.3 163.3 -10,015.9 692.7 0.0 0.0
2079 0.0 161.6 161.6 -10,177.5 699.8 0.0 0.0
2080 0.0 160.1 160.1 -10,337.6 706.9 0.0 0.0
2081 0.0 158.3 158.3 -10,495.9 713.8 0.0 0.0
2082 0.0 156.8 156.8 -10,652.7 720.8 0.0 0.0
2083 0.0 155.5 155.5 -10,808.3 727.9 0.0 0.0
2084 0.0 154.5 154.5 -10,962.7 735.2 0.0 0.0
2085 0.0 153.5 153.5 -11,116.2 742.6 0.0 0.0
2086 0.0 153.1 153.1 -11,269.3 750.4 0.0 0.0
2087 0.0 152.4 152.4 -11,421.7 757.9 0.0 0.0
2088 0.0 151.5 151.5 -11,573.1 765.2 0.0 0.0
2089 0.0 150.4 150.4 -11,723.5 772.2 0.0 0.0
Total 2015-2089 0.0 11,723.5 11,723.5
Based on Intermediate Assumptions of the 2015 Trustees Report.
Ultimate Real Trust Fund Yield of 2.9%.
Note: Changes reflect the budget scoring convention that presumes benefits not payable after reserve depletion would Office of the Chief Actuary
nonetheless be paid, based on transfers from the General Fund of the Treasury resulting in additional borrowing from the public. Social Security Administration1 Effects of tax provisions on the On-Budget are not reflected in this table. June 9, 2016
Billions of Present Value Dollars as of 1-1-2015
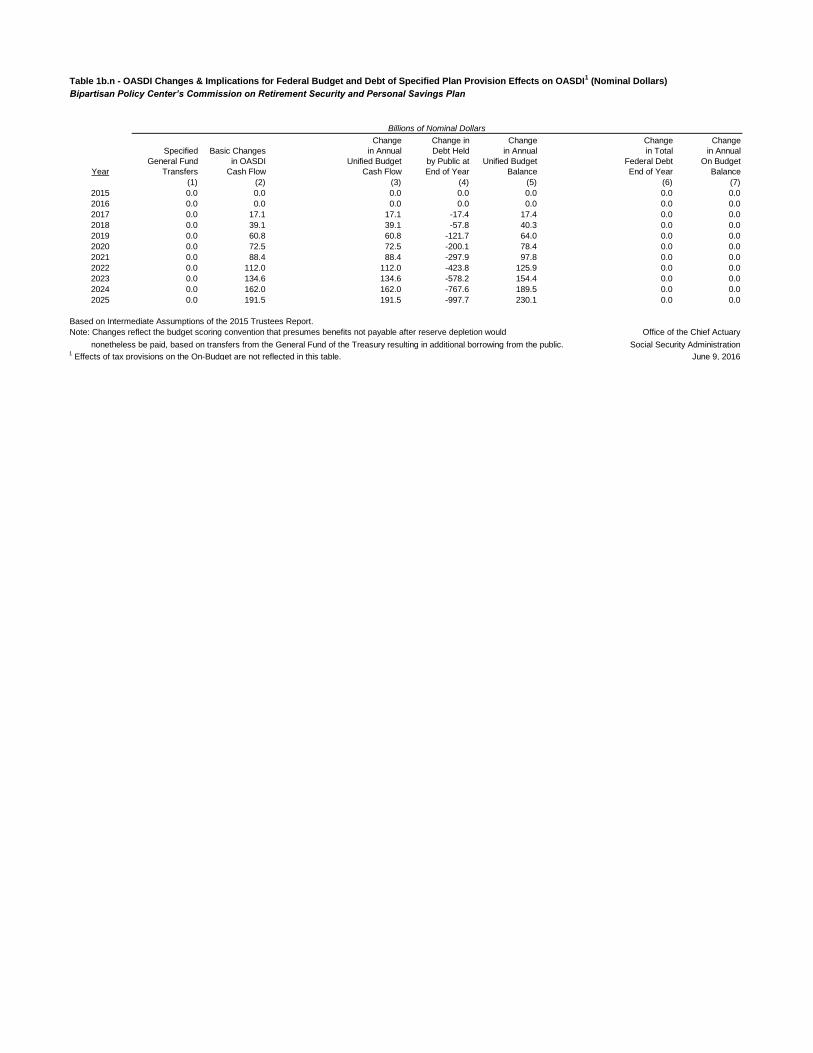
Table 1b.n - OASDI Changes & Implications for Federal Budget and Debt of Specified Plan Provision Effects on OASDI1 (Nominal Dollars)
Bipartisan Policy Center’s Commission on Retirement Security and Personal Savings Plan
Year
Specified
General Fund
Transfers
Basic Changes
in OASDI
Cash Flow
Change
in Annual
Unified Budget
Cash Flow
Change in
Debt Held
by Public at
End of Year
Change
in Annual
Unified Budget
Balance
Change
in Total
Federal Debt
End of Year
Change
in Annual
On Budget
Balance
(1) (2) (3) (4) (5) (6) (7)
2015 0.0 0.0 0.0 0.0 0.0 0.0 0.0
2016 0.0 0.0 0.0 0.0 0.0 0.0 0.0
2017 0.0 17.1 17.1 -17.4 17.4 0.0 0.0
2018 0.0 39.1 39.1 -57.8 40.3 0.0 0.0
2019 0.0 60.8 60.8 -121.7 64.0 0.0 0.0
2020 0.0 72.5 72.5 -200.1 78.4 0.0 0.0
2021 0.0 88.4 88.4 -297.9 97.8 0.0 0.0
2022 0.0 112.0 112.0 -423.8 125.9 0.0 0.0
2023 0.0 134.6 134.6 -578.2 154.4 0.0 0.0
2024 0.0 162.0 162.0 -767.6 189.5 0.0 0.0
2025 0.0 191.5 191.5 -997.7 230.1 0.0 0.0
Based on Intermediate Assumptions of the 2015 Trustees Report.
Note: Changes reflect the budget scoring convention that presumes benefits not payable after reserve depletion would Office of the Chief Actuary
nonetheless be paid, based on transfers from the General Fund of the Treasury resulting in additional borrowing from the public. Social Security Administration1 Effects of tax provisions on the On-Budget are not reflected in this table. June 9, 2016
Billions of Nominal Dollars
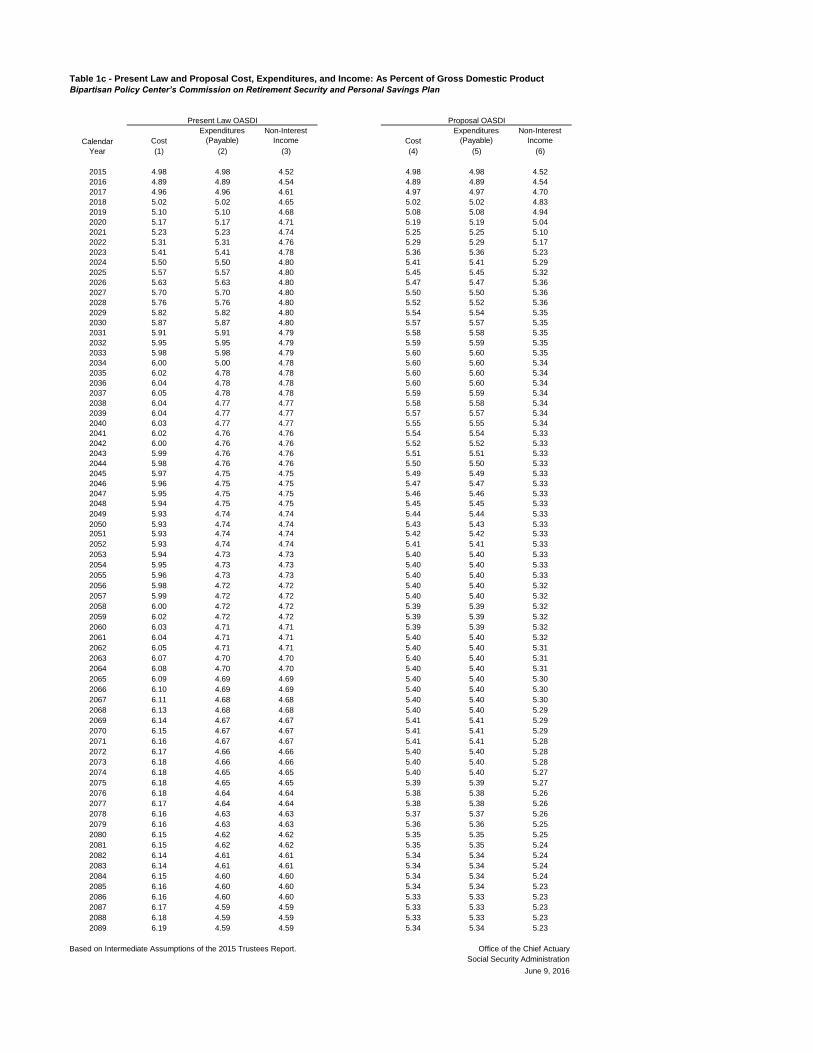
Table 1c - Present Law and Proposal Cost, Expenditures, and Income: As Percent of Gross Domestic Product
Cost
Expenditures
(Payable)
Non-Interest
Income Cost
Expenditures
(Payable)
Non-Interest
Income
(1) (2) (3) (4) (5) (6)
2015 4.98 4.98 4.52 4.98 4.98 4.52
2016 4.89 4.89 4.54 4.89 4.89 4.54
2017 4.96 4.96 4.61 4.97 4.97 4.70
2018 5.02 5.02 4.65 5.02 5.02 4.83
2019 5.10 5.10 4.68 5.08 5.08 4.94
2020 5.17 5.17 4.71 5.19 5.19 5.04
2021 5.23 5.23 4.74 5.25 5.25 5.10
2022 5.31 5.31 4.76 5.29 5.29 5.17
2023 5.41 5.41 4.78 5.36 5.36 5.23
2024 5.50 5.50 4.80 5.41 5.41 5.29
2025 5.57 5.57 4.80 5.45 5.45 5.32
2026 5.63 5.63 4.80 5.47 5.47 5.36
2027 5.70 5.70 4.80 5.50 5.50 5.36
2028 5.76 5.76 4.80 5.52 5.52 5.36
2029 5.82 5.82 4.80 5.54 5.54 5.35
2030 5.87 5.87 4.80 5.57 5.57 5.35
2031 5.91 5.91 4.79 5.58 5.58 5.35
2032 5.95 5.95 4.79 5.59 5.59 5.35
2033 5.98 5.98 4.79 5.60 5.60 5.35
2034 6.00 5.00 4.78 5.60 5.60 5.34
2035 6.02 4.78 4.78 5.60 5.60 5.34
2036 6.04 4.78 4.78 5.60 5.60 5.34
2037 6.05 4.78 4.78 5.59 5.59 5.34
2038 6.04 4.77 4.77 5.58 5.58 5.34
2039 6.04 4.77 4.77 5.57 5.57 5.34
2040 6.03 4.77 4.77 5.55 5.55 5.34
2041 6.02 4.76 4.76 5.54 5.54 5.33
2042 6.00 4.76 4.76 5.52 5.52 5.33
2043 5.99 4.76 4.76 5.51 5.51 5.33
2044 5.98 4.76 4.76 5.50 5.50 5.33
2045 5.97 4.75 4.75 5.49 5.49 5.33
2046 5.96 4.75 4.75 5.47 5.47 5.33
2047 5.95 4.75 4.75 5.46 5.46 5.33
2048 5.94 4.75 4.75 5.45 5.45 5.33
2049 5.93 4.74 4.74 5.44 5.44 5.33
2050 5.93 4.74 4.74 5.43 5.43 5.33
2051 5.93 4.74 4.74 5.42 5.42 5.33
2052 5.93 4.74 4.74 5.41 5.41 5.33
2053 5.94 4.73 4.73 5.40 5.40 5.33
2054 5.95 4.73 4.73 5.40 5.40 5.33
2055 5.96 4.73 4.73 5.40 5.40 5.33
2056 5.98 4.72 4.72 5.40 5.40 5.32
2057 5.99 4.72 4.72 5.40 5.40 5.32
2058 6.00 4.72 4.72 5.39 5.39 5.32
2059 6.02 4.72 4.72 5.39 5.39 5.32
2060 6.03 4.71 4.71 5.39 5.39 5.32
2061 6.04 4.71 4.71 5.40 5.40 5.32
2062 6.05 4.71 4.71 5.40 5.40 5.31
2063 6.07 4.70 4.70 5.40 5.40 5.31
2064 6.08 4.70 4.70 5.40 5.40 5.31
2065 6.09 4.69 4.69 5.40 5.40 5.30
2066 6.10 4.69 4.69 5.40 5.40 5.30
2067 6.11 4.68 4.68 5.40 5.40 5.30
2068 6.13 4.68 4.68 5.40 5.40 5.29
2069 6.14 4.67 4.67 5.41 5.41 5.29
2070 6.15 4.67 4.67 5.41 5.41 5.29
2071 6.16 4.67 4.67 5.41 5.41 5.28
2072 6.17 4.66 4.66 5.40 5.40 5.28
2073 6.18 4.66 4.66 5.40 5.40 5.28
2074 6.18 4.65 4.65 5.40 5.40 5.27
2075 6.18 4.65 4.65 5.39 5.39 5.27
2076 6.18 4.64 4.64 5.38 5.38 5.26
2077 6.17 4.64 4.64 5.38 5.38 5.26
2078 6.16 4.63 4.63 5.37 5.37 5.26
2079 6.16 4.63 4.63 5.36 5.36 5.25
2080 6.15 4.62 4.62 5.35 5.35 5.25
2081 6.15 4.62 4.62 5.35 5.35 5.24
2082 6.14 4.61 4.61 5.34 5.34 5.24
2083 6.14 4.61 4.61 5.34 5.34 5.24
2084 6.15 4.60 4.60 5.34 5.34 5.24
2085 6.16 4.60 4.60 5.34 5.34 5.23
2086 6.16 4.60 4.60 5.33 5.33 5.23
2087 6.17 4.59 4.59 5.33 5.33 5.23
2088 6.18 4.59 4.59 5.33 5.33 5.23
2089 6.19 4.59 4.59 5.34 5.34 5.23
Based on Intermediate Assumptions of the 2015 Trustees Report. Office of the Chief Actuary
Social Security Administration
June 9, 2016
Present Law OASDI Proposal OASDI
Calendar
Year
Bipartisan Policy Center’s Commission on Retirement Security and Personal Savings Plan
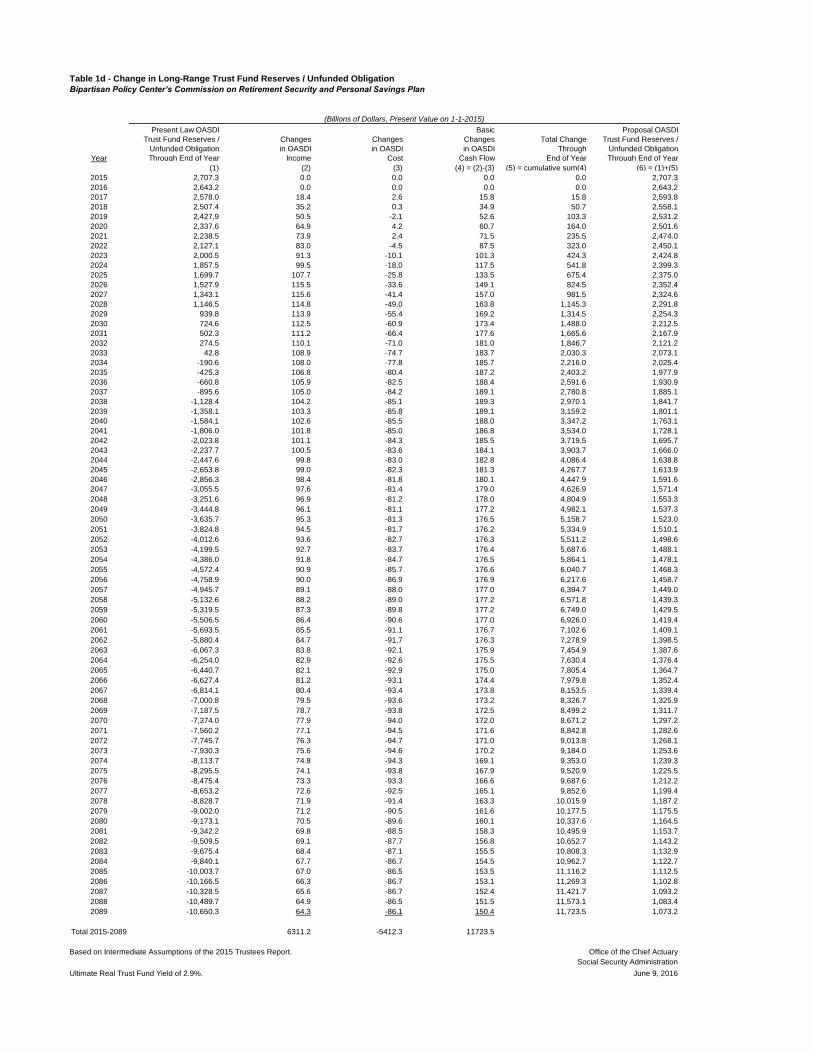
Table 1d - Change in Long-Range Trust Fund Reserves / Unfunded Obligation
Bipartisan Policy Center’s Commission on Retirement Security and Personal Savings Plan
Year
Present Law OASDI
Trust Fund Reserves /
Unfunded Obligation
Through End of Year
Changes
in OASDI
Income
Changes
in OASDI
Cost
Basic
Changes
in OASDI
Cash Flow
Total Change
Through
End of Year
Proposal OASDI
Trust Fund Reserves /
Unfunded Obligation
Through End of Year
(1) (2) (3) (4) = (2)-(3) (5) = cumulative sum(4) (6) = (1)+(5)
2015 2,707.3 0.0 0.0 0.0 0.0 2,707.3
2016 2,643.2 0.0 0.0 0.0 0.0 2,643.2
2017 2,578.0 18.4 2.6 15.8 15.8 2,593.8
2018 2,507.4 35.2 0.3 34.9 50.7 2,558.1
2019 2,427.9 50.5 -2.1 52.6 103.3 2,531.2
2020 2,337.6 64.9 4.2 60.7 164.0 2,501.6
2021 2,238.5 73.9 2.4 71.5 235.5 2,474.0
2022 2,127.1 83.0 -4.5 87.5 323.0 2,450.1
2023 2,000.5 91.3 -10.1 101.3 424.3 2,424.8
2024 1,857.5 99.5 -18.0 117.5 541.8 2,399.3
2025 1,699.7 107.7 -25.8 133.5 675.4 2,375.0
2026 1,527.9 115.5 -33.6 149.1 824.5 2,352.4
2027 1,343.1 115.6 -41.4 157.0 981.5 2,324.6
2028 1,146.5 114.8 -49.0 163.8 1,145.3 2,291.8
2029 939.8 113.9 -55.4 169.2 1,314.5 2,254.3
2030 724.6 112.5 -60.9 173.4 1,488.0 2,212.5
2031 502.3 111.2 -66.4 177.6 1,665.6 2,167.9
2032 274.5 110.1 -71.0 181.0 1,846.7 2,121.2
2033 42.8 108.9 -74.7 183.7 2,030.3 2,073.1
2034 -190.6 108.0 -77.8 185.7 2,216.0 2,025.4
2035 -425.3 106.8 -80.4 187.2 2,403.2 1,977.9
2036 -660.8 105.9 -82.5 188.4 2,591.6 1,930.9
2037 -895.6 105.0 -84.2 189.1 2,780.8 1,885.1
2038 -1,128.4 104.2 -85.1 189.3 2,970.1 1,841.7
2039 -1,358.1 103.3 -85.8 189.1 3,159.2 1,801.1
2040 -1,584.1 102.6 -85.5 188.0 3,347.2 1,763.1
2041 -1,806.0 101.8 -85.0 186.8 3,534.0 1,728.1
2042 -2,023.8 101.1 -84.3 185.5 3,719.5 1,695.7
2043 -2,237.7 100.5 -83.6 184.1 3,903.7 1,666.0
2044 -2,447.6 99.8 -83.0 182.8 4,086.4 1,638.8
2045 -2,653.8 99.0 -82.3 181.3 4,267.7 1,613.9
2046 -2,856.3 98.4 -81.8 180.1 4,447.9 1,591.6
2047 -3,055.5 97.6 -81.4 179.0 4,626.9 1,571.4
2048 -3,251.6 96.9 -81.2 178.0 4,804.9 1,553.3
2049 -3,444.8 96.1 -81.1 177.2 4,982.1 1,537.3
2050 -3,635.7 95.3 -81.3 176.5 5,158.7 1,523.0
2051 -3,824.8 94.5 -81.7 176.2 5,334.9 1,510.1
2052 -4,012.6 93.6 -82.7 176.3 5,511.2 1,498.6
2053 -4,199.5 92.7 -83.7 176.4 5,687.6 1,488.1
2054 -4,386.0 91.8 -84.7 176.5 5,864.1 1,478.1
2055 -4,572.4 90.9 -85.7 176.6 6,040.7 1,468.3
2056 -4,758.9 90.0 -86.9 176.9 6,217.6 1,458.7
2057 -4,945.7 89.1 -88.0 177.0 6,394.7 1,449.0
2058 -5,132.6 88.2 -89.0 177.2 6,571.8 1,439.3
2059 -5,319.5 87.3 -89.8 177.2 6,749.0 1,429.5
2060 -5,506.5 86.4 -90.6 177.0 6,926.0 1,419.4
2061 -5,693.5 85.5 -91.1 176.7 7,102.6 1,409.1
2062 -5,880.4 84.7 -91.7 176.3 7,278.9 1,398.5
2063 -6,067.3 83.8 -92.1 175.9 7,454.9 1,387.6
2064 -6,254.0 82.9 -92.6 175.5 7,630.4 1,376.4
2065 -6,440.7 82.1 -92.9 175.0 7,805.4 1,364.7
2066 -6,627.4 81.2 -93.1 174.4 7,979.8 1,352.4
2067 -6,814.1 80.4 -93.4 173.8 8,153.5 1,339.4
2068 -7,000.8 79.5 -93.6 173.2 8,326.7 1,325.9
2069 -7,187.5 78.7 -93.8 172.5 8,499.2 1,311.7
2070 -7,374.0 77.9 -94.0 172.0 8,671.2 1,297.2
2071 -7,560.2 77.1 -94.5 171.6 8,842.8 1,282.6
2072 -7,745.7 76.3 -94.7 171.0 9,013.8 1,268.1
2073 -7,930.3 75.6 -94.6 170.2 9,184.0 1,253.6
2074 -8,113.7 74.8 -94.3 169.1 9,353.0 1,239.3
2075 -8,295.5 74.1 -93.8 167.9 9,520.9 1,225.5
2076 -8,475.4 73.3 -93.3 166.6 9,687.6 1,212.2
2077 -8,653.2 72.6 -92.5 165.1 9,852.6 1,199.4
2078 -8,828.7 71.9 -91.4 163.3 10,015.9 1,187.2
2079 -9,002.0 71.2 -90.5 161.6 10,177.5 1,175.5
2080 -9,173.1 70.5 -89.6 160.1 10,337.6 1,164.5
2081 -9,342.2 69.8 -88.5 158.3 10,495.9 1,153.7
2082 -9,509.5 69.1 -87.7 156.8 10,652.7 1,143.2
2083 -9,675.4 68.4 -87.1 155.5 10,808.3 1,132.9
2084 -9,840.1 67.7 -86.7 154.5 10,962.7 1,122.7
2085 -10,003.7 67.0 -86.5 153.5 11,116.2 1,112.5
2086 -10,166.5 66.3 -86.7 153.1 11,269.3 1,102.8
2087 -10,328.5 65.6 -86.7 152.4 11,421.7 1,093.2
2088 -10,489.7 64.9 -86.5 151.5 11,573.1 1,083.4
2089 -10,650.3 64.3 -86.1 150.4 11,723.5 1,073.2
Total 2015-2089 6311.2 -5412.3 11723.5
Based on Intermediate Assumptions of the 2015 Trustees Report. Office of the Chief Actuary
Social Security Administration
Ultimate Real Trust Fund Yield of 2.9%. June 9, 2016
(Billions of Dollars, Present Value on 1-1-2015)