Embed Size (px)
Citation preview

SOCIAL STIGMA IN EPILEPSY,
A POPULATION-BASED STUDY IN MALAYSIA
KHENG-SEANG LIM
THESIS/DISSERTATION SUBMITTED
IN FULFILMENT OF
THE REQUIREMENTS FOR THE DEGREE OF
DOCTOR OF PHILOSOPHY
FACULTY OF MEDICINE
UNIVERSITY OF MALAYA
KUALA LUMPUR
2013
i
UNIVERSITI MALAYA
Original Literary Work Declaration Name of Candidate: Kheng-Seang LIM (I.C No: 741210-07-5341) Registration/Matric No: MHA 100058 Name of Degree: Philosophy of Doctor Title of Thesis: Social stigma in epilepsy, a population-based study in Malaysia Field of Study: Medicine I do solemnly and sincerely declare that: (1) I am the sole author/writer of this Work; (2) This Work is original; (3) Any use of any work in which copyright exists was done by way of fair dealing and for permitted purposes and any excerpt or extract from, or reference to or reproduction of any copyright work has been disclosed expressly and sufficiently and the title of the Work and its authorship have been acknowledged in this Work; (4) I do not have any actual knowledge nor do I ought reasonably to know that the making of this work constitutes an infringement of any copyright work; (5) I hereby assign all and every rights in the copyright to this Work to the University of Malaya (“UM”), who henceforth shall be owner of the copyright in this Work and that any reproduction or use in any form or by any means whatsoever is prohibited without the written consent of UM having been first had and obtained; (6) I am fully aware that if in the course of making this Work I have infringed any copyright whether intentionally or otherwise, I may be subject to legal action or any other action as may be determined by UM. Candidate’s Signature Date Subscribed and solemnly declared before, Witness’s Signature Date Name: Designation:
ii
Abstract (English)
This study aims to determine the magnitude of social stigma in epilepsy as measured by
the public attitudes toward epilepsy, in the general as well as in a specific population, in
Malaysia. The preliminary study showed that there is a significant impact of epilepsy on
the employment in Malaysia, an indirect indicator to a need to study social stigma
among Malaysian population. However, the systematic review revealed a need to
develop a cross-culturally applicable quantitative scale measuring the public attitudes
toward epilepsy, leading to the study on development and validation of a PATE (Public
Attitudes Toward Epilepsy) scale, which is developed based on a stigmatization model.
Factoring into personal and general domains led to a new concept of classifying the
public attitudes toward epilepsy into personal and general attitudes. In order to be
applied among Malaysian population, translation of the PATE scale Malay and Chinese
languages was performed. Psychometric testing of this translated version showed that
the Malay and Chinese translated PATE scales were valid and reliable. The study on
students showed that the scale is easily applied among a homogenous group and can be
used in a web-based design. In addition, attitudes of students were only better than the
general population in the general domain but not in the personal domain, indicating that
a significant discrepancy between the personal and general attitudes toward epilepsy.
The study on teachers showed significant better attitudes among teachers as compared
to the general population with tertiary education, suggesting that attitudes toward
epilepsy may be job specific. Population studies showed that there was no significant
difference in attitudes toward epilepsy between the Chinese and Malay populations.
However, on subcategory analysis, Chinese had better attitudes toward social contact
with people with epilepsy, indicating that Chinese patients with epilepsy might have
less social restriction as compared with the Malay. In addition, the studies also
demonstrated that each ethnic group had a unique urban-rural pattern of attitudes toward

iii
epilepsy, enable us to understand the cultural differences from the sociological
perspectives.
(333 words)
iv
Abstract (Malay Language)
Title in Malay: Stigma social terhadap penyakit sawan, satu pengajian di antara
penduduk di Malaysia
Kajian ini bertujuan untuk menentukan magnitud stigma sosial penyakit sawan seperti
yang diukur oleh sikap orang ramai terhadap sawan, di antara penduduk umum serta
dalam populasi tertentu di Malaysia. Kajian awal menunjukkan bahawa ada kesan yang
ketara bagi epilepsi ke atas pekerjaan di antara pesakit epilepsi di Malaysia, merupakan
petunjuk tidak langsung kepada keperluan untuk mengkaji stigma sosial di kalangan
penduduk Malaysia. Walau bagaimanapun, kajian yang sistematik mendedahkan
keperluan untuk membangunkan skala yang merentas budaya dan kuantitatif dalam
mengukur sikap orang ramai terhadap epilepsi. Ini membawa kepada kajian tentang
pembangunan dan pengesahan skala PATE (Public Attitudes Toward Epilepsy), yang
dibangunkan berdasarkan model stigma. Pemfaktoran kepada domain peribadi dan
umum membawa kepada konsep baru mengklasifikasikan sikap orang ramai terhadap
sawan kepada sikap peribadi dan umum. Dalam usaha untuk digunakan di kalangan
penduduk Malaysia, terjemahan skala PATE bahasa Melayu dan Cina telah
dilaksanakan. Ujian psikometrik versi yang diterjemahkan menunjukkan bahawa skala
PATE Melayu dan Cina yang diterjemahkan adalah sah dan boleh dipercayai. Kajian ke
atas pelajar menunjukkan bahawa skala itu mudah digunakan di kalangan kumpulan
seragam dan boleh digunakan dalam reka bentuk yang berasaskan web. Di samping itu,
sikap pelajar hanya lebih baik daripada penduduk umum di domain umum tetapi tidak
dalam domain peribadi, menunjukkan bahawa ada perbezaan ketara antara sikap
peribadi dan umum terhadap epilepsi. Kajian ke atas guru-guru yang menunjukkan
sikap yang ketara lebih baik di kalangan guru-guru berbanding dengan penduduk umum
yang pendidikan tinggi, menunjukkan bahawa sikap terhadap penyakit sawan mungkin
v
berasaskan kepada jenis pekerjaan. Kajian Populasi menunjukkan bahawa tidak ada
perbezaan yang ketara dalam sikap terhadap penyakit sawan antara penduduk Cina dan
Melayu. Walau bagaimanapun, pada analisis subkategori, Cina mempunyai sikap yang
lebih baik terhadap hubungan sosial dengan orang-orang dengan epilepsi, menunjukkan
bahawa pesakit Cina dengan epilepsi mungkin mempunyai kurang sekatan sosial
berbanding dengan Melayu. Di samping itu, kajian juga menunjukkan bahawa setiap
kumpulan etnik mempunyai corak bandar dan luar bandar yang unik dalam sikap
terhadap sawan membolehkan kita memahami perbezaan budaya dari perspektif
sosiologi.
(327 words)
vi
Acknowledgements
I would like to express my acknowledgement to Professor Dr. Tan Chong Tin for his
guidance, encouragement and understanding, without whom the project will be like a
ship without a captain. I would also want to thank the late Dr. Michael Donald Hills
(1941 – 1 May 2013) for his detailed assessment of my writing despite in his 70s
especially in the aspects of psychology and scale development. Associate Professor Dr.
Claire Choo Wan Yuen, the expert of statistics in our research team, has been giving
enormous input in this project which required an extensive statistical analysis especially
in scale development and translation.
I would also like to thank Miss Cathie Wu for her psychological input locally, Miss
Elsie Wong for her assistance in data collection, Dr. Thean-Seong Yeo and Miss May-
Kuen Shiu for their assistance in manuscript editing.
Most importantly, I would like to express my greatest gratitude to my beloved wife Leh-
Hua Hwong and children Yue and Tao, without their understanding and support, this
work will not be possibly complete.
This study is sponsored by High Impact Research Grant, from governmental research
fund (Reference No: UM.C/HIR/MOHE/MED–08).
vii
Table of Contents
Original Literary Work Declaration ................................................................................... i
Abstract (English) ............................................................................................................. ii
Abstract (Malay Language).............................................................................................. iv
Acknowledgements .......................................................................................................... vi
Table of Contents ............................................................................................................ vii
List of Figures .................................................................................................................. ix
List of Tables.................................................................................................................... xi
List of Appendices .......................................................................................................... xv
Chapter 1: Introduction ................................................................................................. 1
Chapter 2: Impact of epilepsy on employment in Malaysia- A preliminary study to
support the need for social stigma research in Malaysia................................................... 8
Chapter 3: Attitudes toward epilepsy, a systematic review. ....................................... 27
Chapter 4: Development and validation of the Public Attitudes Toward Epilepsy
(PATE) scale ................................................................................................................... 55
Chapter 5: Malay Public Attitudes Toward Epilepsy (PATE) scale: translation and
psychometric evaluation.................................................................................................. 83
Chapter 6: Chinese Public Attitudes Toward Epilepsy (PATE) scale: translation and
psychometric evaluation................................................................................................ 103
Chapter 7: A web-based survey of attitudes toward epilepsy in secondary and tertiary
students in Malaysia, using the Public Attitudes Toward Epilepsy (PATE) scale. ...... 123

viii
Chapter 8: Attitudes toward epilepsy among teachers in Malaysia, using the Public
Attitudes Toward Epilepsy (PATE) scale. .................................................................... 140
Chapter 9: Attitudes towards epilepsy among Malay population in Southeast Asia,
using the Public Attitudes Toward Epilepsy (PATE) scale, a preliminary study in
Malaysia ................................................................................................................. 156
Chapter 10: Attitudes towards epilepsy among Chinese population in Malaysia,
using the Public Attitudes Toward Epilepsy (PATE) scale. ......................................... 171
Chapter 11: Attitudes toward epilepsy among the Indonesian, a preliminary study in
Manado ............................................................................................................. 188
Chapter 12: Cultural and ethnic differences in attitudes toward epilepsy............... 199
Chapter 13: Knowledge and public attitudes toward epilepsy, using EKQ and PATE
scale ............................................................................................................. 208
Chapter 14: Conclusion: conceptual changes and future implications ................... 225

ix
List of Figures Figure 3-1. Countries with publications on public attitudes toward epilepsy (n=50). The
numbers represent the number of papers published in each country. ............................. 31
Figure 3-2. Publications on public attitudes towards epilepsy (n=132 papers) .............. 32
Figure 3-3. Negative attitudes against employment in epilepsy, according to
geographical distribution and year (n=66 papers) ........................................................... 33
Figure 3-4. Negative attitudes against employment in epilepsy, according to gross
domestic product per capita, based on papers published in 2001-2011 (n=47 papers).
Countries with high GDP per capita with poor attitude are circled, and the opposite are
squared. ........................................................................................................................... 35
Figure 4-1: Scree plot of the items related to attitudes towards epilepsy. ...................... 66
Figure 5-1: The relative relationship between the mean scores of the personal and
general domain, in current (Malay) and initial PATE studies. ....................................... 94
Figure 6-1: The relative relationship between the mean scores of the personal and
general domain, in current (Chinese) and initial PATE studies. ................................... 114
Figure 7-1: Linear curve estimation on how scores on the general domain related to the
scores on the personal domain (n=227). ....................................................................... 132
Figure 7-2: The mean scores on the personal and general domains of the PATE scale in
the current (on students, n=227) and previous (on a general population, n=130) studies.
....................................................................................................................................... 133
Figure 10-1: Comparison of the mean scores in general and personal domains in PATE
scale between the rural and urban Chinese and Malay. ................................................ 180
Figure 12-1: The percentages of responses to items related to marriage in Malaysian
Malay (n=253) and Chinese (n=348), and in Indonesian (n=100) cohorts. .................. 202

x
Figure 12-2: The percentages of responses to items related to employment in Malaysian
Malay (n=253) and Chinese (n=348), and in Indonesian (n=100) cohorts. .................. 204
Figure 12-3: Mean scores of each category in the Indonesian (n=100), Malaysian Malay
(n=253) and Chinese (n=348) populations .................................................................... 205
xi
List of Tables Table 2-1: Demographic profile of people with epilepsy, according to the status of
employment (n=250) ....................................................................................................... 14
Table 2-2: Medical profile of people with epilepsy, according to the status of
employment (n=250) ....................................................................................................... 15
Table 2-3: Non-parametric correlation analysis among the social and clinical variables
(n=250) ............................................................................................................................ 16
Table 2-4: Demographic and medical profile of people with epilepsy, according to
hierarchical cluster analysis (n=250) .............................................................................. 17
Table 2-5: Comparison of the socioeconomic status of the patients and their siblings,
(n=64 pairs) ..................................................................................................................... 18
Table 3-1: Examples of questions on attitudes towards marriage in epilepsy ................ 36
Table 3-2: Examples of questions on attitudes towards employment in epilepsy .......... 37
Table 3-3: Comparison of the attitudes against social contact between the community,
students and teachers, according to country .................................................................... 39
Table 4-1: Demographic characteristics of the respondents (n=130) ............................. 65
Table 4-2: Rotated factor matrix for attitudes towards epilepsy ..................................... 67
Table 4-3: Internal reliability and convergent validity of each domain .......................... 68
Table 4-4: Mean scores by domains and demographic characteristics (n=130) ............. 70
Table 5-1: Demographic characteristics of the respondents (n=140) ............................. 89
Table 5-2: Mean score, SD, floor and ceiling effects of the Malay PATE, as compared
with the results of the initial study performed in Malaysian population5 ....................... 91
Table 5-3: Item-domain and corrected item-total correlations. ...................................... 92
Table 5-4: Mean scores by domains and demographic characteristics (n=140) ............. 95

xii
Table 5-5: Correlation between the hypothesized domain and rotated principal
components ..................................................................................................................... 96
Table 5-6: Internal reliability and convergent validity of each domain .......................... 97
Table 6-1: Demographic characteristics of the respondents (n=130) ........................... 109
Table 6-2: Mean score, SD, floor and ceiling effects of the Chinese PATE, as compared
with the initial results in Malaysian population10 ......................................................... 111
Table 6-3: Item-domain and corrected item-total correlations. .................................... 112
Table 6-4: Mean scores by domains and demographic characteristics (n=140) ........... 115
Table 6-5: Correlation between the hypothesized domain and rotated principal
components ................................................................................................................... 116
Table 6-6: Internal reliability and convergent validity of each domain ........................ 117
Table 7-1: The means and standard deviations of the items and their correlations with
the total score in each domain (n=227) ......................................................................... 130
Table 7-2: Means and standard deviations and internal reliability of each domain in the
current (n=227) and previous studies10 (n=130) ........................................................... 131
Table 7-3: Mean scores by domains and demographic characteristics (n=227) ........... 133
Table 8-1: The means and standard deviations of the scores in each domain and item, in
teachers, students (Lim et al., 2013) and general population (Lim et al., 2012) ........... 147
Table 8-2: The means and standard deviations of the attitude scores toward various
social aspect of life in people with epilepsy, in teachers, students (Lim et al., 2013) and
general population (Lim et al., 2012) ............................................................................ 148
Table 8-3: The means and standard deviations of the attitude scores in each domain and
scores toward various social aspect of life in people with epilepsy, in teachers and
general population with tertiary education. (Lim et al., 2012) ..................................... 149

xiii
Table 8-4: The means and standard deviations of the scores in each domain and the
attitude scores toward various social aspects of life in people with epilepsy, in primary
(n=106) and secondary school teachers (n=80) ............................................................ 150
Table 9-1: Demographic characteristics of rural and urban Malay groups (N=93 and 160,
respectively). ................................................................................................................. 161
Table 9-2. Means and standard deviation (SD) of each domain in rural (n=93) and urban
Malay (n=160) groups. .................................................................................................. 162
Table 9-3. Mean scores by subcategory and group. (n=253) ........................................ 163
Table 9-4. Means and standard deviations of the items in each group. ........................ 164
Table 10-1: Demographic characteristics of the total participants (N=348), and the
urban and rural subgroups (N=188 and 160, respectively). .......................................... 176
Table 10-2: Mean scores and standard deviations by domains and demographic
characteristics (n=348) .................................................................................................. 177
Table 10-3. Mean scores by subcategory and group. (N=348) ..................................... 178
Table 10-4. Item means and standard deviations of the total participants (N=348), and
the urban and rural subgroups (N=188 and 160, respectively). .................................... 179
Table 10-5: Demographic characteristics of the total participants (N=348), and the
urban and rural subgroups (N=188 and 160, respectively). .......................................... 181
Table 10-6. Means and standard deviation (SD) of each domain and subcategory in
Chinese (n=348) and Malay (n=253) populations. ....................................................... 181
Table 10-7. Percentage of subjects agree and disagree with the items, comparison
between the Chinese and Malay populations (N=348 and 253 respectively). .............. 182
Table 11-1: Demographic characteristics of the total Indonesian cohort (N=100), and
the Malaysian Malay and Chinese cohort (N=253 and 348, respectively). .................. 192
Table 11-2: Mean scores and standard deviations by domains and demographic
characteristics (n=100) .................................................................................................. 193
xiv
Table 11-3. Means and standard deviation (SD) of each domain and subcategory in the
Indonesian (n=100), Malaysian Chinese (n=348) and Malay (n=253) populations. .... 194
Table 11-4. Percentage of subjects agree and disagree with the items, comparison
between the Indonesian and the Malaysian Chinese and Malay populations (N=100, 348
and 253 respectively). ................................................................................................... 195
Table 13-1: Demographic profile of the respondents. (n=297) .................................... 213
Table 13-2: Mean score of EKQ (34 items) by country................................................ 214
Table 13-3: Comparison between demographic characteristics and mean scores of EKQ
in 297 respondents. ....................................................................................................... 215
Table 13-4: Percentage of correct answer in the EKQ items, and association with the
mean scores in the personal and general domains in the PATE scale. ......................... 216
Table 13-5: Correlations between the total score in the EKQ and the mean score in the
PATE scale (n=297). ..................................................................................................... 218

xv
List of Appendices
Appendix 1: Public Attitudes Toward Epilepsy (PATE) Scale and scoring manual ...... 80
Appendix 2: Additional questions for construct validity. ............................................... 82
Appendix 3: Malay translated version of PATE scale .................................................. 102
Appendix 4: Chinese translated version of PATE scale ............................................... 122
1
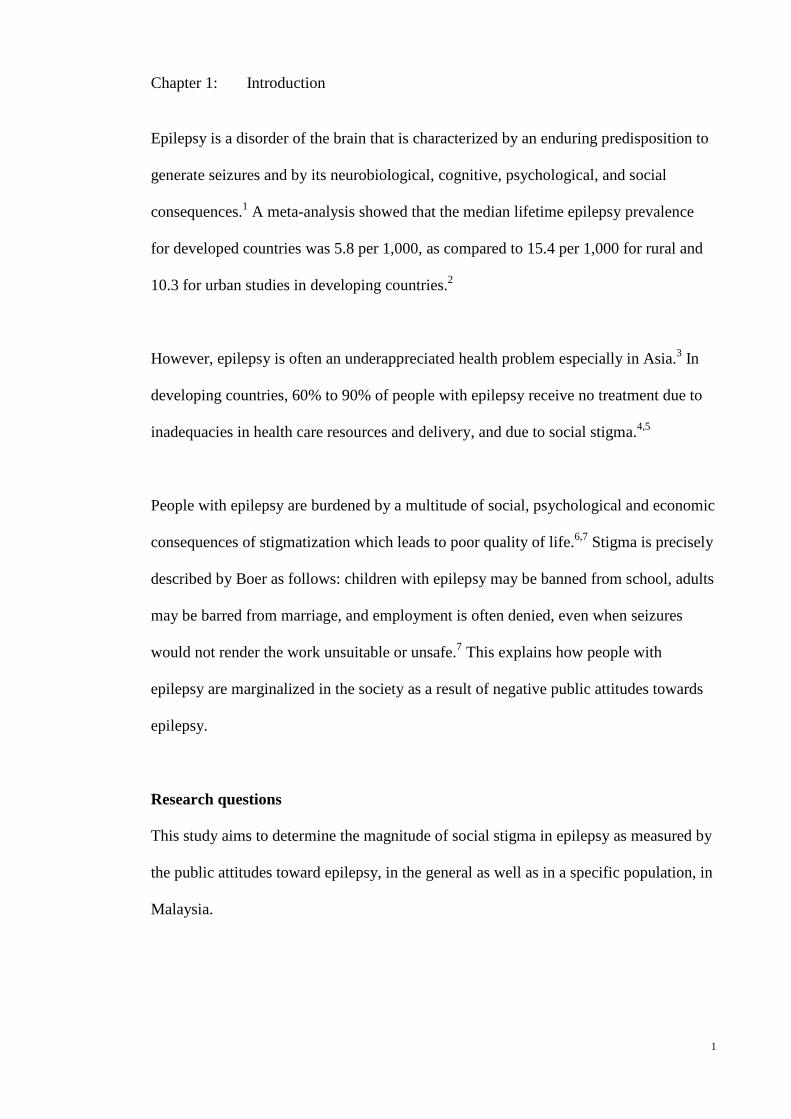
Chapter 1: Introduction
Epilepsy is a disorder of the brain that is characterized by an enduring predisposition to
generate seizures and by its neurobiological, cognitive, psychological, and social
consequences.1 A meta-analysis showed that the median lifetime epilepsy prevalence
for developed countries was 5.8 per 1,000, as compared to 15.4 per 1,000 for rural and
10.3 for urban studies in developing countries.2
However, epilepsy is often an underappreciated health problem especially in Asia.3 In
developing countries, 60% to 90% of people with epilepsy receive no treatment due to
inadequacies in health care resources and delivery, and due to social stigma.4,5
People with epilepsy are burdened by a multitude of social, psychological and economic
consequences of stigmatization which leads to poor quality of life.6,7 Stigma is precisely
described by Boer as follows: children with epilepsy may be banned from school, adults
may be barred from marriage, and employment is often denied, even when seizures
would not render the work unsuitable or unsafe.7 This explains how people with
epilepsy are marginalized in the society as a result of negative public attitudes towards
epilepsy.
Research questions
This study aims to determine the magnitude of social stigma in epilepsy as measured by
the public attitudes toward epilepsy, in the general as well as in a specific population, in
Malaysia.
2
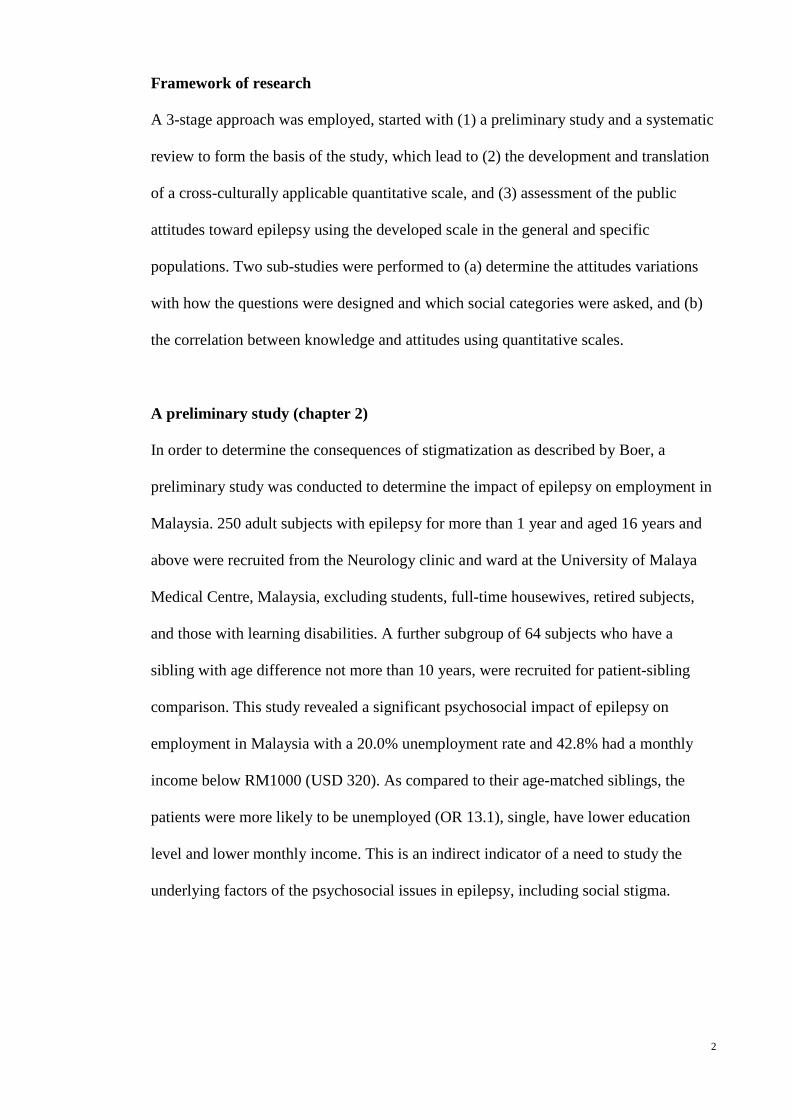
Framework of research
A 3-stage approach was employed, started with (1) a preliminary study and a systematic
review to form the basis of the study, which lead to (2) the development and translation
of a cross-culturally applicable quantitative scale, and (3) assessment of the public
attitudes toward epilepsy using the developed scale in the general and specific
populations. Two sub-studies were performed to (a) determine the attitudes variations
with how the questions were designed and which social categories were asked, and (b)
the correlation between knowledge and attitudes using quantitative scales.
A preliminary study (chapter 2)
In order to determine the consequences of stigmatization as described by Boer, a
preliminary study was conducted to determine the impact of epilepsy on employment in
Malaysia. 250 adult subjects with epilepsy for more than 1 year and aged 16 years and
above were recruited from the Neurology clinic and ward at the University of Malaya
Medical Centre, Malaysia, excluding students, full-time housewives, retired subjects,
and those with learning disabilities. A further subgroup of 64 subjects who have a
sibling with age difference not more than 10 years, were recruited for patient-sibling
comparison. This study revealed a significant psychosocial impact of epilepsy on
employment in Malaysia with a 20.0% unemployment rate and 42.8% had a monthly
income below RM1000 (USD 320). As compared to their age-matched siblings, the
patients were more likely to be unemployed (OR 13.1), single, have lower education
level and lower monthly income. This is an indirect indicator of a need to study the
underlying factors of the psychosocial issues in epilepsy, including social stigma.

3
A systematic review (chapter 3)
A systematic search using MEDLINE and EMBASE database were performed to
identify all studies published before May 2011 that reported public attitudes toward
epilepsy. 132 relevant articles from 50 countries including Malaysia were identified for
review. There was marked variation of attitudes between Western and non-Western
populations, and these attitudes were positively correlated with the standard of living.
There was also marked variation in the design of the questionnaires. There were only a
few quantitative scales measuring the attitudes toward epilepsy, but these scales are
limited by cultural adaptability. Furthermore, most studies were performed in general
population but not in a specific population, especially those deemed to have direct
influence on the people with epilepsy. There is a need to develop a standardized,
quantitative, and yet cross-culturally applicable measure of public attitudes toward
epilepsy for cross-sectional and longitudinal comparison, and to be applied in general as
well as specific populations.
Development of a quantitative scale (chapter 4)
This leads to the second stage of the research i.e. development of a quantitative scale
measuring the public attitudes toward epilepsy. The scale was developed in three phases:
(1) formative research and concept development; (2) item development; and (3) data
collection, reliability and validity testing. Based on a stigmatization model proposed by
Link and Phelan8, items assessing the separation and disadvantages of people with
epilepsy, were selected from the reviewed literatures. These items focused on social
restriction of people with epilepsy, specifically related to education, employment,
personal and marital relationship, which are less likely to be cultural variable. A 14-item
Public Attitudes Toward Epilepsy (PATE) scale was developed, which was factored
into two domains, i.e. a general domain (nine items) that requires minimal or no

4
consideration of respondents’ involvement, and a personal domain (five items) that
requires a long-term personal commitment or involvement such as marrying a person
with epilepsy, working with them or employing them. The PATE scale is a validated
scale with good internal consistency (Cronbach’s alpha of 0.868 and 0.633, in the
general and personal domains respectively).
Scale translation (chapter 5 and 6)
The PATE scale was subsequently translated into Malay and Chinese languages, to be
applied among the Malaysian population, of which majority are Malay and Chinese.
The translation process of PATE scale was performed in a three-stage cross-cultural
adaptation process as developed by the International Quality of Life Assessment
project9, i.e. (1) translation and cultural adaptation of the original scale into the Malay
and Chinese languages, and evaluation to ensure conceptual equivalence, (2) formal
psychometric testing of the assumptions underlying item scoring and construction of
multi-item scales, to ensure that the scoring algorithms can be applied to the population
concerned, and (3) validation and norming studies that provide a basis for interpretation.
The translated PATE scales were proven to be validated and reliable in measuring the
public attitudes toward epilepsy.
Specific populations (chapter 7 and 8)
A web-based survey design was used to study the attitudes toward epilepsy among the
students. This was the first web-based survey of public attitudes toward epilepsy in
Malaysia, as well as in Asia. Two hundred and seventy five high school and college
students were invited to participate in this survey through an email invitation from the
research team and 227 (82.5%) responded. The mean score in the general domain was
significantly lower than the general population but no difference in the personal domain.
5
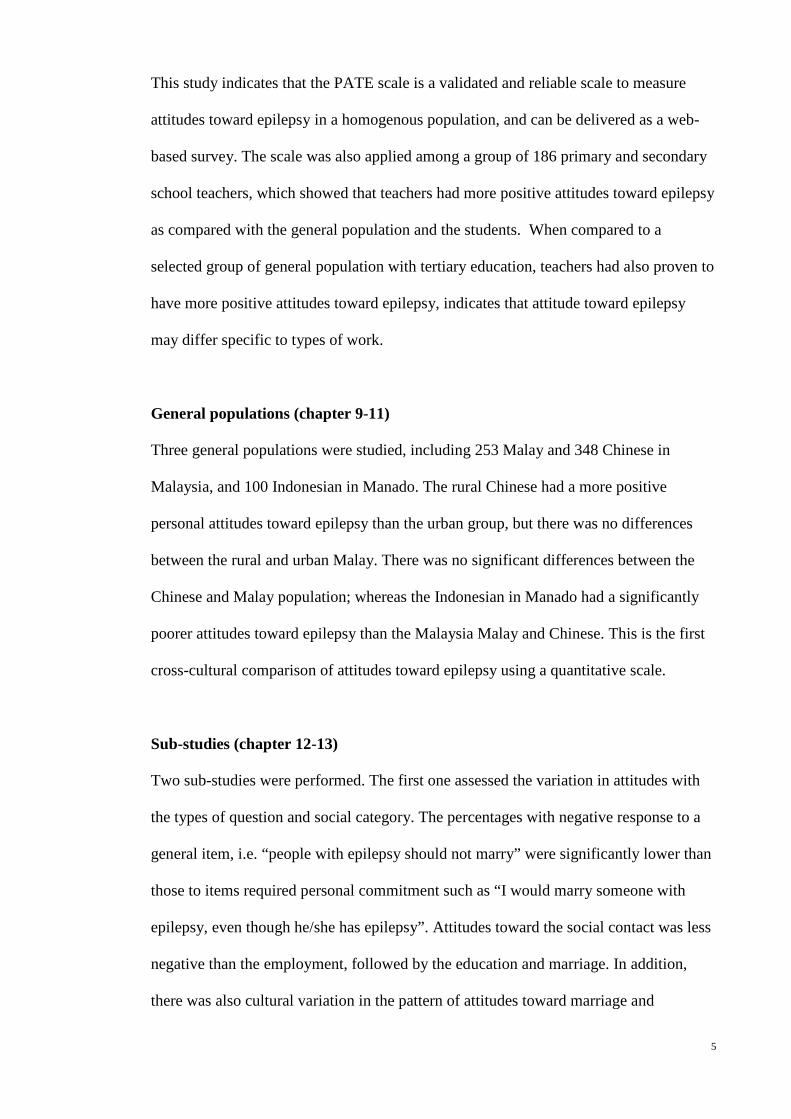
This study indicates that the PATE scale is a validated and reliable scale to measure
attitudes toward epilepsy in a homogenous population, and can be delivered as a web-
based survey. The scale was also applied among a group of 186 primary and secondary
school teachers, which showed that teachers had more positive attitudes toward epilepsy
as compared with the general population and the students. When compared to a
selected group of general population with tertiary education, teachers had also proven to
have more positive attitudes toward epilepsy, indicates that attitude toward epilepsy
may differ specific to types of work.
General populations (chapter 9-11)
Three general populations were studied, including 253 Malay and 348 Chinese in
Malaysia, and 100 Indonesian in Manado. The rural Chinese had a more positive
personal attitudes toward epilepsy than the urban group, but there was no differences
between the rural and urban Malay. There was no significant differences between the
Chinese and Malay population; whereas the Indonesian in Manado had a significantly
poorer attitudes toward epilepsy than the Malaysia Malay and Chinese. This is the first
cross-cultural comparison of attitudes toward epilepsy using a quantitative scale.
Sub-studies (chapter 12-13)
Two sub-studies were performed. The first one assessed the variation in attitudes with
the types of question and social category. The percentages with negative response to a
general item, i.e. “people with epilepsy should not marry” were significantly lower than
those to items required personal commitment such as “I would marry someone with
epilepsy, even though he/she has epilepsy”. Attitudes toward the social contact was less
negative than the employment, followed by the education and marriage. In addition,
there was also cultural variation in the pattern of attitudes toward marriage and
6
employment in epilepsy, between the Malaysian Chinese and Malay, and the Indonesian.
The second sub-study assessed the relationship between the knowledge and attitudes
toward epilepsy, using the Epilepsy Knowledge Questionnaire (EKQ) and the PATE
scale. This study showed that the knowledge toward epilepsy is significantly associated
with a better attitudes toward epilepsy. On item analysis, only certain aspects of
knowledge in epilepsy affected the attitudes toward epilepsy significantly, supports the
need to develop an attitude-specific epilepsy knowledge scale.
Conclusion
It is essential to study the public attitudes toward epilepsy as supported by a significant
unemployment rate and lower income among the people with epilepsy. Systematic
review revealed a need to develop a cross-culturally applicable quantitative scale in
measuring the public attitudes toward epilepsy. The PATE was developed, validated
and translated, and applied in various specific and general populations. There were
significant differences between the students and the teachers, the teachers and the
educated general population, the Malay and Chinese, and the Indonesian and Malaysian.
References
1. Fisher RS, van Emde Boas W, Blume W, et al. Epileptic seizures and epilepsy:
definitions proposed by the International League Against Epilepsy (ILAE) and the
International Bureau for Epilepsy (IBE). Epilepsia 2005;46:470-2.
2. Ngugi A, Bottomley C, Kleinschmidt I, Sander J, Newton C. Estimation of the
burden of active and life-time epilepsy: A meta-analytic approach. Epilepsia
2010;51:883-90.
7
3. Mac TL, Tran D-S, Quet F, Odermatt P, Preux P-M, Tan CT. Epidemiology,
aetiology, and clinical management of epilepsy in Asia: a systematic review. Lancet
Neurol 2007;6:533-43.
4. Shorvon S, Farmer P. Epilepsy in developing countries: a review of
epidemiological, sociocultural and treatment aspects. . Epilepsia 1988;29:S36-S45.
5. Meinardi H, Scott R, Reis R, JWA S. The Treatment Gap in Epilepsy: The
Current Situation and Ways Forward. Epilepsia 2001;42:136-49.
6. Jacoby A. Stigma, epilepsy, and quality of life. Epilepsy & Behavior
2002;3:S10–S20.
7. Boer H, Mula M, Sander J. The global burden and stigma of epilepsy. Epilepsy
& Behavior 2008;12:540-6.
8. Link BG, Phelan JC. Conceptualizing Stigma. Annu Rev Sociol 2001:363-85.
9. Ware JE, Jr., Keller SD, Gandek B, Brazier JE, Sullivan M. Evaluating
translations of health status questionnaires. Methods from the IQOLA project.
International Quality of Life Assessment. International journal of technology
assessment in health care 1995;11:525-51.

8
Chapter 2: Impact of epilepsy on employment in Malaysia- A preliminary study to
support the need for social stigma research in Malaysia.
(Published as Lim KS, Wo SW, Wong MH, Tan CT. Impact of epilepsy on employment in
Malaysia. Epilepsy & Behavior 2013;27:130-4)
Abstract
Introduction: Studies on the impact of epilepsy on employment had been extensively
performed in the European and some Asian countries but not in Southeast Asia such as
Malaysia, a country with a robust economy, low unemployment rate and minimal social
security benefits for the unemployed. This study aims to determine the impact of
epilepsy on employment in Malaysia. Methods: 250 subjects (52.4% males) with mean
age of 35.2 years were recruited from a tertiary neurology clinic in Malaysia. Results:
69.6% were employed full-time, 10.4% part-time and 20.0% unemployed. 42.8% had a
monthly income below poverty line, i.e. RM1000 (USD 320). Unemployment was
associated with female gender, lower education level, younger age of seizure onset, less
responsiveness to first antiepileptic drug (AED), higher seizure frequency and less
seizure freedom, and higher total score in seizure severity scale. The age of onset
(p=0.017), total score in seizure severity scale (p=0.018), and the responsiveness to first
AED (p=0.045) were the significant predictors of unemployment. Patients with part-
time employment had similar education level as those unemployed, but more likely to
be male and married; with intermediate age of seizure onset and seizure severity, but
with higher seizure frequency. As compared to their age-matched siblings, the patients
were more likely to be unemployed (OR 13.1), single, have lower education level and
lower monthly income. Conclusion: Epilepsy patients have high unemployment rate in
9
Malaysia, despite a robust economy and minimal social security. Besides being
unemployed, many were in part-time or low-income employment.
(247 words)
Introduction
Epilepsy is one of the common chronic serious neurological diseases present worldwide
with an estimated 50 million affected individuals. However, epilepsy is often an
underappreciated health problem especially in Asia. People with epilepsy (PWE) suffer
from stigmatization and are burdened by a multitude of social, psychological and
economic consequences which leads to poor quality of life, Malaysian epileptic patients
not being an exception. Understanding and minimizing the socioeconomic and
psychological impact of epilepsy is therefore as important as controlling the seizures.
A prospective study on childhood onset epilepsy in UK, followed up from childhood till
a mean age of 48, showed that the employment rate was 71% at the mean age of 23
years old, and 59% at the mean age of 48.1 Comparatively in India and Korea, the
unemployment rate of PWE was reported as 31-58%.2,3 However, a multicentered study
in Spain on employment in people with epilepsy showed that the employment rate was
58% and the unemployment rate was only 11%, similar to the general population.4
Medical factors play an important role in the employability of PWE. Unemployment
was shown to be associated with refractory epilepsy, occurrence of a seizure in the past
12 months, and polytherapy.4 Antiepileptic drug-related side effects was also part of the
reasons for unemployment.2 Those whose seizures were well controlled or in remission
generally did not report problems with employment.5 The positive predictive factors of

10
employment were normal intelligence, uninterrupted remission for 5 years, and no
history of status epilepticus.1 Seizure severity, assessed with scales such as the
Liverpool Seizure Severity Scale6, has been shown to affect the quality of life7-9 and
psychological variables, e.g. self-esteem, locus of control, and anxiety10, but the
correlation between seizure severity and the socioeconomic status in epilepsy was not
known.
Besides medical factors e.g. seizure frequency and severity, social and cultural factors
also limit the employability of people with epilepsy. Malaysia is a newly industrialized
country with emerging middle-income economy having a gross domestic product per
capita of USD 9,70011, and good economic growth rate. The unemployment rate is as
low as 3%. There are many labor intensive manufacturing industries and a large migrant
labor force from neighboring countries. In addition, the disability allowance in Malaysia
is only RM150 (USD 47.60) per month12, significantly lower compared to the West,
which should result in increased motivation for people with epilepsy to seek
employment . However, social stigma and workplace prejudice, which is prevalent in
Asia13 affected by the cultural misconception of epilepsy, often prevents a person with
epilepsy from being employed, although the persons with disabilities act in Malaysia
was recently established in 2008, with a subsection stated that persons with disabilities
shall have the right to access to employment on equal basis with persons without
disabilities.14 Therefore, our aim is to study the medical as well as social factors
affecting positively or negatively the employability of PWE in Malaysia, a country with
emerging middle income economy, low unemployment and having a different socio-
cultural background from the West.
11
Comparing PWE to general population may involve too many socioeconomic variables.
As we know, there are local factors that might influence the employability of PWE such
as the location of the center where the study is performed, the types of patients treated
in the specific clinical setting, the urban-rural residency with variation in employment
rate and types of employment available, and family background. Taking into account
the impact of these local socioeconomic factors, we thought that a direct comparison of
the employment status between the patients and their siblings will be more likely to
reflect the actual impact of epilepsy on employment. As far as it is known, there has
been no previous study comparing the employment status of epilepsy patients with that
of their siblings’.
This study aims to determine the impact of epilepsy in general on employment in PWE,
as well as investigate their individual socioeconomic background and how it affects
their employment status using a paired age-matched patient-sibling comparison.
Methodology
This is a sub-analysis of a cross-sectional, prospective, questionnaire driven, hospital-
based psychosocial pilot study, correlating the clinical and social factors with the
employment status in PWE.
344 subjects with epilepsy for more than 1 year and aged 16 years and above were
recruited from the Neurology clinic and ward at the University of Malaya Medical
Centre, Malaysia. Excluding 48 students, 18 full-time housewives, and 28 retired
subjects, 250 subjects were included in this sub-analysis. For each subject in the sub-
analysis, their demographic profile, socioeconomic background, details of epilepsy and
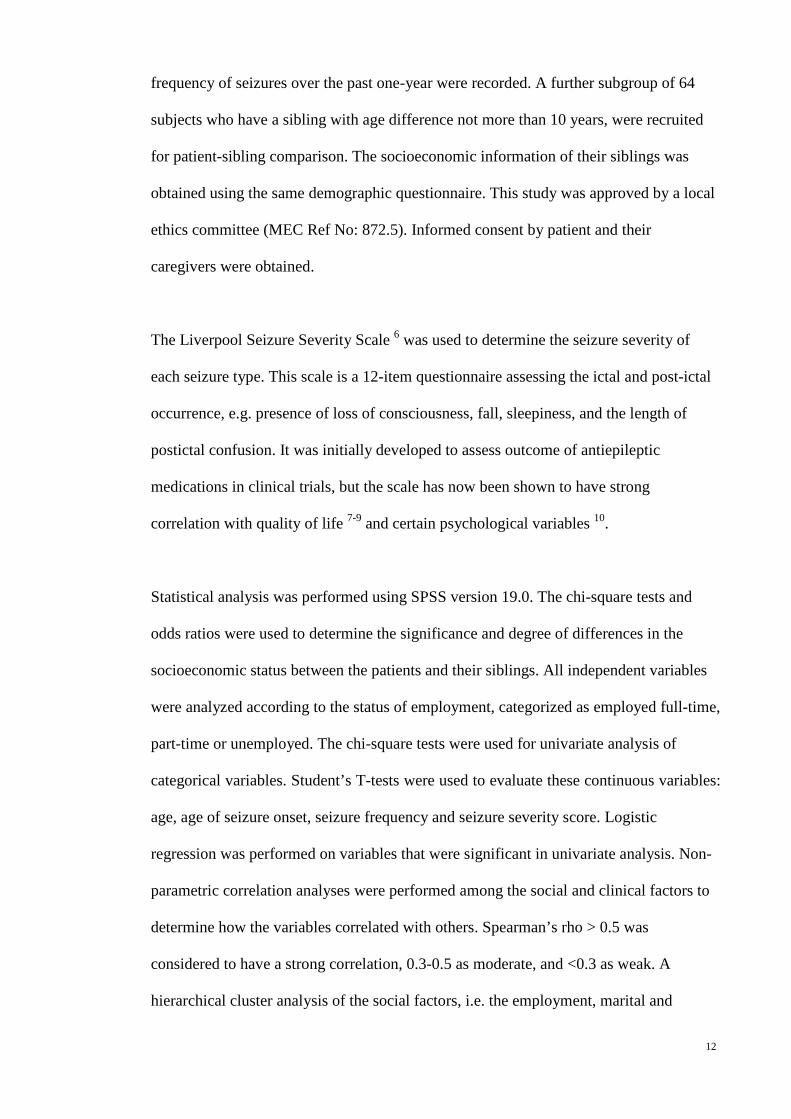
12
frequency of seizures over the past one-year were recorded. A further subgroup of 64
subjects who have a sibling with age difference not more than 10 years, were recruited
for patient-sibling comparison. The socioeconomic information of their siblings was
obtained using the same demographic questionnaire. This study was approved by a local
ethics committee (MEC Ref No: 872.5). Informed consent by patient and their
caregivers were obtained.
The Liverpool Seizure Severity Scale 6 was used to determine the seizure severity of
each seizure type. This scale is a 12-item questionnaire assessing the ictal and post-ictal
occurrence, e.g. presence of loss of consciousness, fall, sleepiness, and the length of
postictal confusion. It was initially developed to assess outcome of antiepileptic
medications in clinical trials, but the scale has now been shown to have strong
correlation with quality of life 7-9 and certain psychological variables 10.
Statistical analysis was performed using SPSS version 19.0. The chi-square tests and
odds ratios were used to determine the significance and degree of differences in the
socioeconomic status between the patients and their siblings. All independent variables
were analyzed according to the status of employment, categorized as employed full-time,
part-time or unemployed. The chi-square tests were used for univariate analysis of
categorical variables. Student’s T-tests were used to evaluate these continuous variables:
age, age of seizure onset, seizure frequency and seizure severity score. Logistic
regression was performed on variables that were significant in univariate analysis. Non-
parametric correlation analyses were performed among the social and clinical factors to
determine how the variables correlated with others. Spearman’s rho > 0.5 was
considered to have a strong correlation, 0.3-0.5 as moderate, and <0.3 as weak. A
hierarchical cluster analysis of the social factors, i.e. the employment, marital and

13
education status, was performed to demonstrate their relationship in clusters. The p-
value of less than 0.05 was set as significant unless stated otherwise.
Results
250 subjects (52.4% male) were included in this sub-analysis, with a mean age of 35.2
years, range from 16 to 77 years old. The mean age of onset was 19.0 years with
standard deviation of 10.8 years. 47.6% were Chinese, 27.2% Malay, 22.8% Indian and
2.4% other races. 56.0% were single and 65.6% had secondary education level or below.
174 (69.6%) of the subjects were employed full-time, 26 (10.4%) employed part-time,
and 50 (20.0%) unemployed. 107 subjects (42.8%) had monthly income below the
poverty line of RM1000 (USD 320) and 21 were receiving disability allowance.
Demographic and medical profile
As shown in Table 2-1, patients employed full-time were predominantly male, married
and more educated, compared to the unemployed. Patients who were unemployed had
significantly younger age of seizure onset during their childhood or adolescence,
compared to those with full-time employment. They were more likely to be
symptomatic in aetiology, and failed at least one antiepileptic drug (AED). In addition,
they had higher seizure frequency with less seizure freedom, and higher score in seizure
severity scale. (Table 2-2)
Patients with part-time employment had similar education level with those unemployed,
but were more likely to be male (p, not significant) and married (p<0.05). 76.9% had
monthly income of RM1000 and below. They had similar clinical profile with the
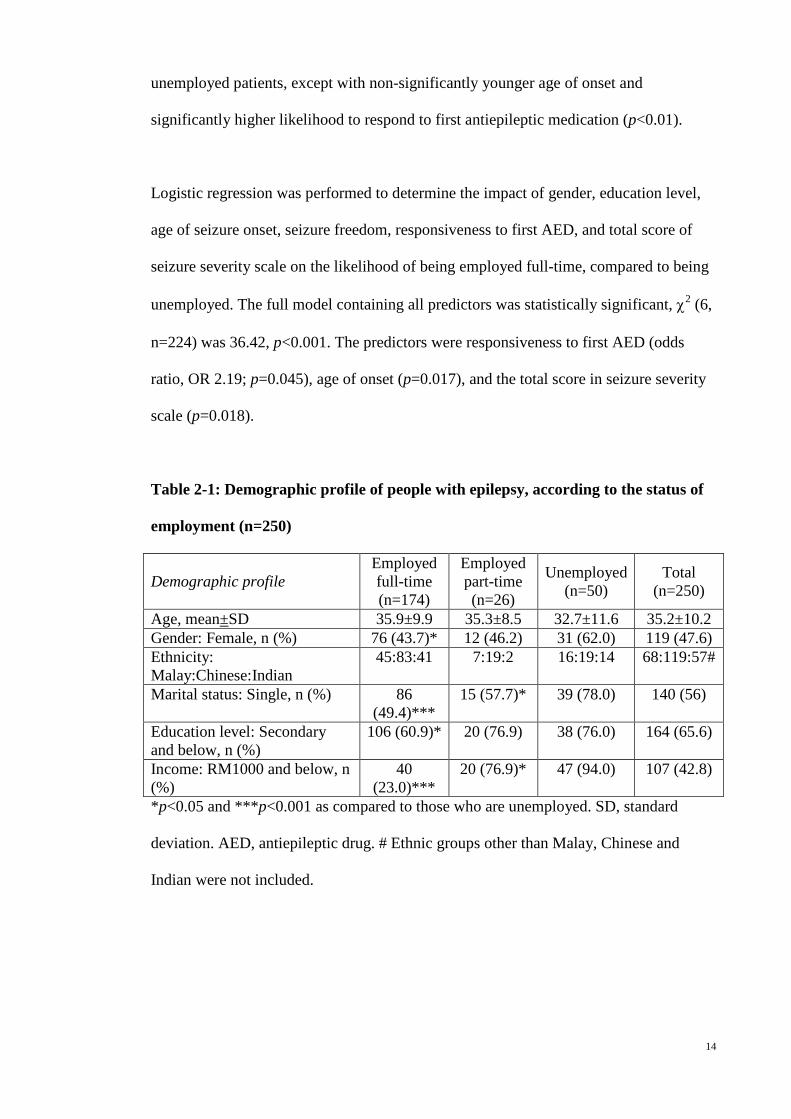
14
unemployed patients, except with non-significantly younger age of onset and
significantly higher likelihood to respond to first antiepileptic medication (p<0.01).
Logistic regression was performed to determine the impact of gender, education level,
age of seizure onset, seizure freedom, responsiveness to first AED, and total score of
seizure severity scale on the likelihood of being employed full-time, compared to being
unemployed. The full model containing all predictors was statistically significant, χ2 (6,
n=224) was 36.42, p<0.001. The predictors were responsiveness to first AED (odds
ratio, OR 2.19; p=0.045), age of onset (p=0.017), and the total score in seizure severity
scale (p=0.018).
Table 2-1: Demographic profile of people with epilepsy, according to the status of
employment (n=250)
Demographic profile Employed full-time (n=174)
Employed part-time (n=26)
Unemployed (n=50)
Total (n=250)
Age, mean±SD 35.9±9.9 35.3±8.5 32.7±11.6 35.2±10.2 Gender: Female, n (%) 76 (43.7)* 12 (46.2) 31 (62.0) 119 (47.6) Ethnicity: Malay:Chinese:Indian
45:83:41 7:19:2 16:19:14 68:119:57#
Marital status: Single, n (%) 86 (49.4)***
15 (57.7)* 39 (78.0) 140 (56)
Education level: Secondary and below, n (%)
106 (60.9)* 20 (76.9) 38 (76.0) 164 (65.6)
Income: RM1000 and below, n (%)
40 (23.0)***
20 (76.9)* 47 (94.0) 107 (42.8)
*p<0.05 and ***p<0.001 as compared to those who are unemployed. SD, standard
deviation. AED, antiepileptic drug. # Ethnic groups other than Malay, Chinese and
Indian were not included.
15
Table 2-2: Medical profile of people with epilepsy, according to the status of
employment (n=250)
Medical profile Employed full-time (n=174)
Employed part-time (n=26)
Unemployed (n=50)
Total (n=250)
Age of seizure onset, mean±S.D.
20.4±11.0***
18.4±9.7 14.3±9.3 19.0±10.8
Age of seizure onset before 20 years of age, n (%)
92 (52.9)** 18 (69.2) 39 (78.0) 149 (59.6)
Seizure type: Focal, n (%) 121 (69.5) 15 (57.7) 35 (70.0) 171 (74.3) Aetiology: Symptomatic, n (%) 54 (31.0)* 13 (50.0) 25 (50.0) 92 (40.0) Seizure frequency per year, mean±SD
1.9±4.3** 6.2±19.4 5.5±14.7 3.1±9.8
Seizure freedom for one year, n (%)
86 (49.4)** 10 (38.5) 12 (24.0) 108 (43.2)
Seizure severity scale (range from 0 to 100 marks)
21.9 ± 25.8***
28.3 ± 28.3 36.7 ± 25.4 25.3±26.1
Failed at least one AED, n (%) 60 (34.5)** 7 (26.9)** 29 (58.0) 96 (38.4) *p<0.05, **p<0.01 and ***p<0.001 as compared to those who are unemployed. SD,
standard deviation; AED, antiepileptic drug.
16
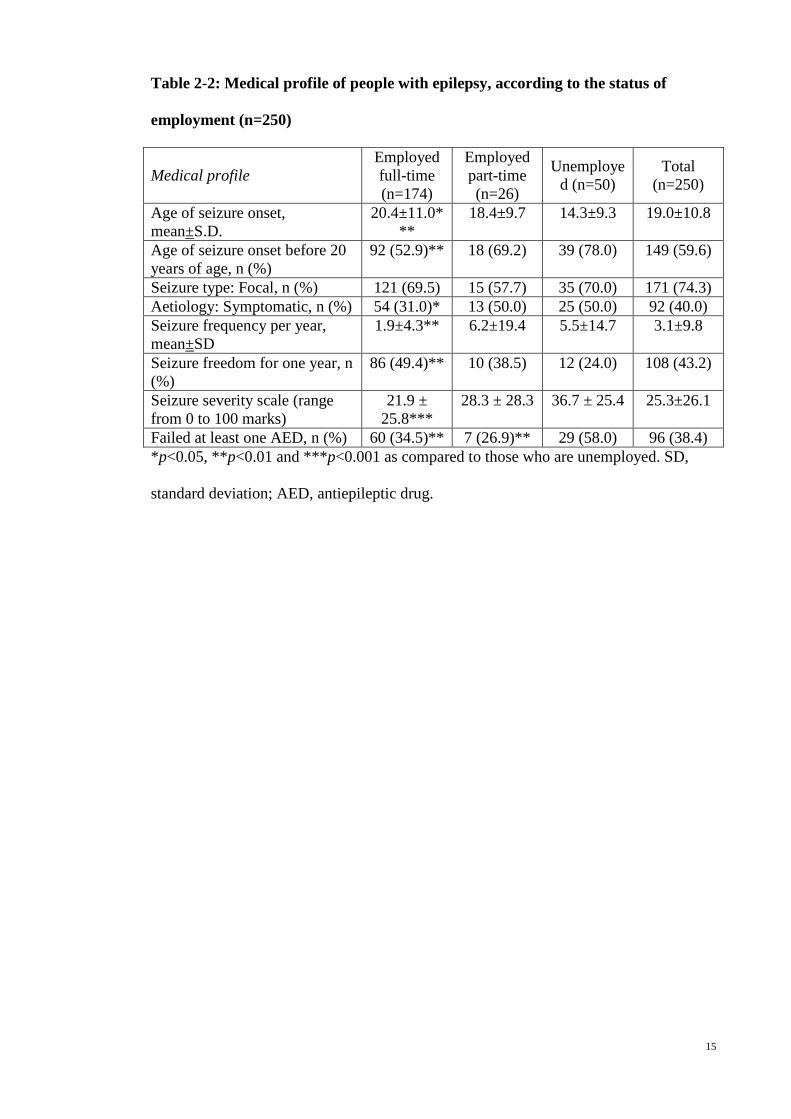
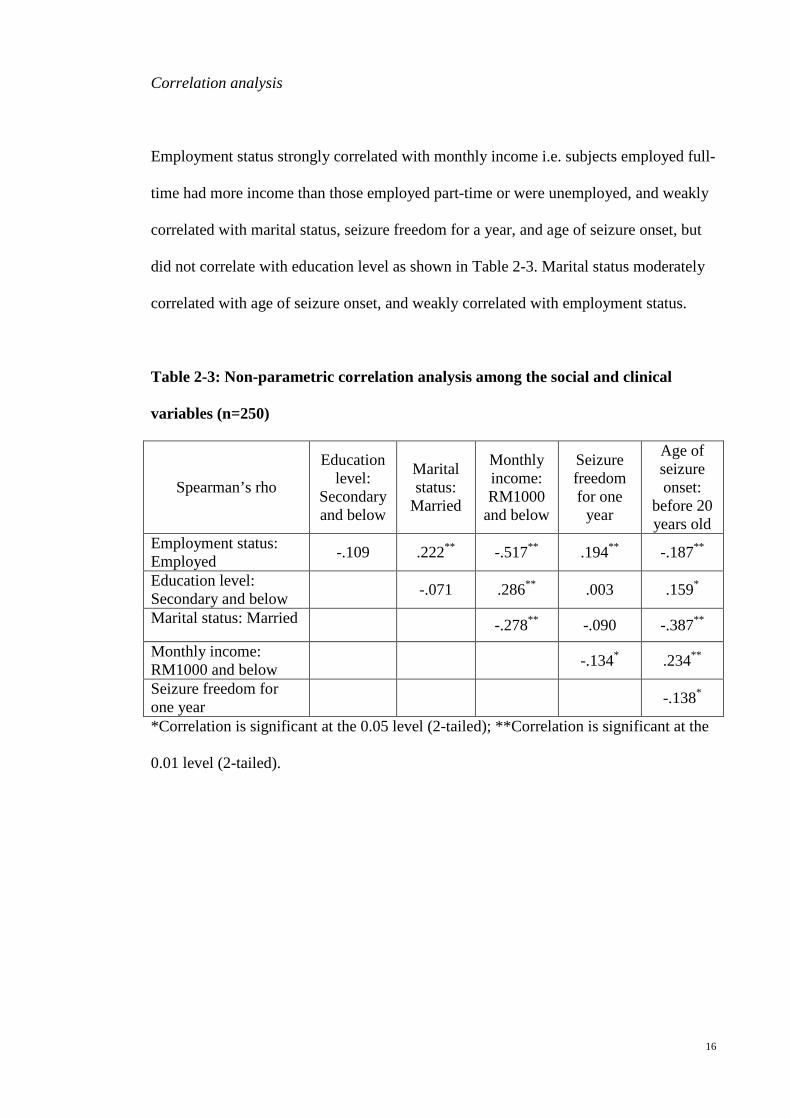
Correlation analysis
Employment status strongly correlated with monthly income i.e. subjects employed full-
time had more income than those employed part-time or were unemployed, and weakly
correlated with marital status, seizure freedom for a year, and age of seizure onset, but
did not correlate with education level as shown in Table 2-3. Marital status moderately
correlated with age of seizure onset, and weakly correlated with employment status.
Table 2-3: Non-parametric correlation analysis among the social and clinical
variables (n=250)
Spearman’s rho
Education level:
Secondary and below
Marital status:
Married
Monthly income: RM1000
and below
Seizure freedom for one
year
Age of seizure onset:
before 20 years old
Employment status: Employed -.109 .222** -.517** .194** -.187**
Education level: Secondary and below -.071 .286** .003 .159*
Marital status: Married -.278** -.090 -.387** Monthly income: RM1000 and below -.134* .234**
Seizure freedom for one year -.138*
*Correlation is significant at the 0.05 level (2-tailed); **Correlation is significant at the
0.01 level (2-tailed).
17
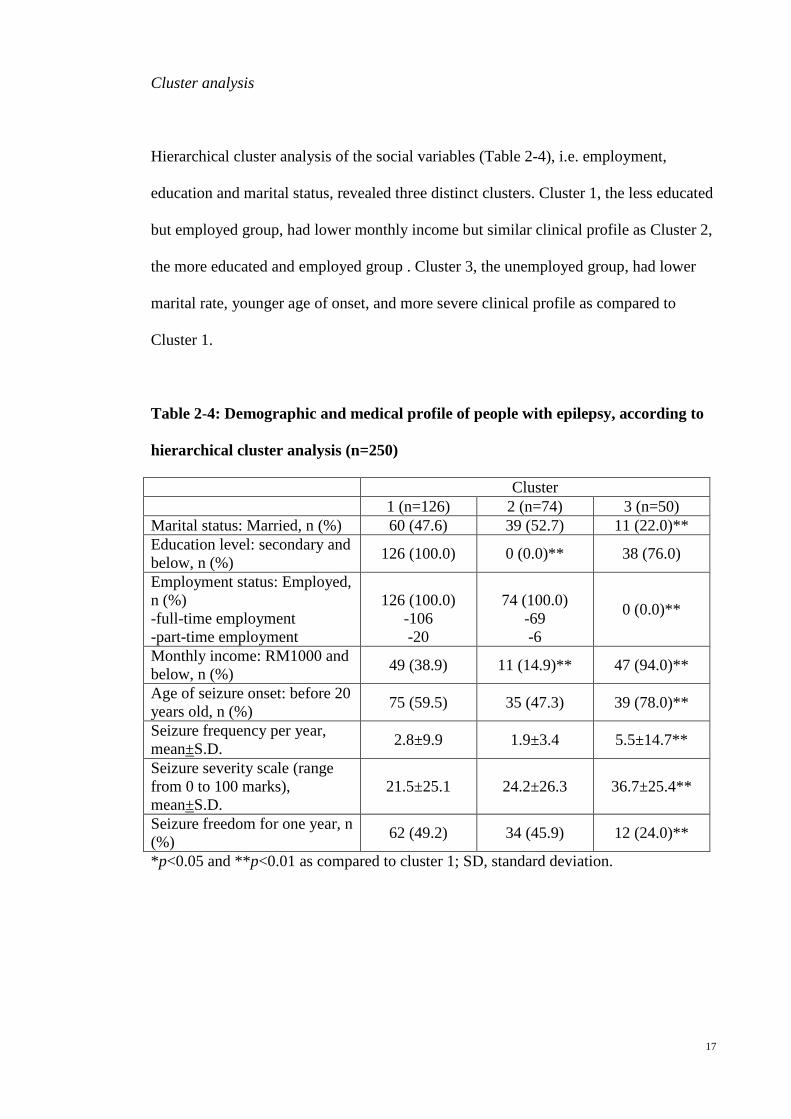
Cluster analysis
Hierarchical cluster analysis of the social variables (Table 2-4), i.e. employment,
education and marital status, revealed three distinct clusters. Cluster 1, the less educated
but employed group, had lower monthly income but similar clinical profile as Cluster 2,
the more educated and employed group . Cluster 3, the unemployed group, had lower
marital rate, younger age of onset, and more severe clinical profile as compared to
Cluster 1.
Table 2-4: Demographic and medical profile of people with epilepsy, according to
hierarchical cluster analysis (n=250)
Cluster 1 (n=126) 2 (n=74) 3 (n=50) Marital status: Married, n (%) 60 (47.6) 39 (52.7) 11 (22.0)** Education level: secondary and below, n (%) 126 (100.0) 0 (0.0)** 38 (76.0)
Employment status: Employed, n (%) -full-time employment -part-time employment
126 (100.0)
-106 -20
74 (100.0)
-69 -6
0 (0.0)**
Monthly income: RM1000 and below, n (%) 49 (38.9) 11 (14.9)** 47 (94.0)**
Age of seizure onset: before 20 years old, n (%) 75 (59.5) 35 (47.3) 39 (78.0)**
Seizure frequency per year, mean±S.D. 2.8±9.9 1.9±3.4 5.5±14.7**
Seizure severity scale (range from 0 to 100 marks), mean±S.D.
21.5±25.1 24.2±26.3 36.7±25.4**
Seizure freedom for one year, n (%) 62 (49.2) 34 (45.9) 12 (24.0)**
*p<0.05 and **p<0.01 as compared to cluster 1; SD, standard deviation.

18
Age-matched patient-sibling comparison
64 pairs of age-matched patient-sibling, consisting of 43.8% Chinese, 25.0% Malay and
31.2% Indian and, were included in this subgroup analysis. There was no statistically
significant difference in the mean age between the patients and their siblings (36.5±11.1
vs. 37.5±12.2 years, p >0.05). As shown in Table 2-5, the patients were more likely to
be unemployed (OR 13.1), have education at secondary level or lower (OR 2.5), and
single (OR 3.0), compared to their siblings. The percentage of patients with monthly
income of RM1000 and below was significantly higher than their siblings (OR 5.5).
Table 2-5: Comparison of the socioeconomic status of the patients and their
siblings, (n=64 pairs)
Patient (n=64)
Sibling (n=64)
Odds ratio
Age, mean±SD 36.5±11.1 37.5±12.2 Gender: Female, n (%) 27 (42.2) 36 (56.3) Marital status: Single, n (%) 40 (62.5)** 23 (35.9) 3.0 Education level: Secondary and below, n (%)
49 (76.6)* 36 (56.2) 2.5
Employment status: Unemployed, n (%)
19 (29.7)*** 2 (3.1) 13.1
Employment status: part-time, n (%) 2 (3.1) 1 (1.6) Monthly income: RM1000 and below, n (%)
29/64 (45.3)***
6/46 (13.0)# 5.5
*p<0.05, **p<0.01 and ***p<0.001 as compared to their siblings. SD, standard
deviation. #Full-time and part-time students were excluded from analysis.
19
Discussion
The unemployment rate of our studied population, calculated as a percentage of the
number of unemployed population of the labor force i.e. the total number of people
employed plus unemployed as defined by International Labour Organisation 15, was
20.7%. This is comparable to other published data 5,16 but significantly higher compared
to the 3.0% unemployment rate in Malaysia reported in June 2011.17 The
unemployment rate of their siblings at 3.1% as shown in Table 2-3 was more consistent
with the general rate of unemployment in Malaysia. We believe that the unemployment
rate of epilepsy patients of greater than 13 times their siblings’ unemployment rate is
particularly significant, as the result has taken into account the many social and
economic factors that may influence the employment rate locally. It should also be
noted that such a high unemployment rate occurs in the context of a society with robust
economy, low unemployment overall, and minimal social security and support for the
unemployed. Moreover, it is unusual for Malaysians to take on part-time employment.
The 10.4% of part-time employment among the epilepsy patients, with three quarter of
these patients having income below the poverty line (Table 2-1), demonstrate further the
difficulties of finding paid work in Malaysia.
Our data also showed that 42.8% of our patients had a monthly income below the
poverty line, i.e. RM1000 (USD 320), significantly higher than the 7.3% Malaysian
with RM1000 or less monthly household income in 2009 18 and 13% of their siblings.
They consisted of those who were unemployed, employed part-time as well as those in
low wage employment as shown in the cluster analysis. This indicates that people with
epilepsy in Malaysia are facing significant socioeconomic challenges.

20
The comparison between epilepsy patients and their siblings also showed that
significantly higher proportion of the patients remained single (62.5% vs 35.9%), and
had lower level of education (Table 2-4). It is likely that the lower level of education
contributed to unemployment, and the unemployment affected the marriage rate.
Review on employment in epilepsy showed that there were higher rates of
unemployment in individuals with more frequent seizures. 19 However, there were also
studies with contradictory results, reporting no correlation between seizure frequency
and employment status. 19 Adding a subgroup of part-time employment, this study
showed that those with more frequent seizure could still be employed but they were
mostly employed in a part-time position. In addition, the cluster analysis revealed a
subgroup of patients, with lower education level, employed full-time but yet with low
monthly income, who might be unemployed in countries with good unemployment or
disability benefits. Work serves as a purposeful activity and employment is known as an
important factor for psychological health. 20 Studies have repeatedly demonstrated that
the levels of depression and other forms of impaired mental health are significantly
higher among unemployed people. 21 Present study supports that patient with
uncontrolled epilepsy can still be employed especially in part-time position, and thus
provides a basis for establishing more part-time employment in the society for people
with epilepsy, which will increase their employment rate with consequent improvement
in the psychological health. In view of the increase in the percentage of part-time
employment over the years 22, it is recommended that a subcategory of part-time or low-
income employment be included in future study on employment in people with epilepsy,
especially in Asia.
21
The total score of Liverpool Seizure Severity Scale is lowest in those with full-time
employment, followed by part-time employment, and unemployment, as seen in Table
2-1. Logistic regression showed that seizure severity was a significant predictor of
employment status; whereas seizure frequency was not. This is consistent with
Bautista’s study which found that seizure severity is associated with quality of life
independent of seizure frequency. 9 Similarly in a study on psychological variables, the
importance of including seizure severity in the study is again demonstrated, in which
seizure severity, but not seizure frequency, was proven to be the most significant
predictor of psychological variables. 10
Age of seizure onset is another significant factor affecting the employment status of
people with epilepsy. The majority (78%) of unemployed patients had an age of seizure
onset prior to adulthood, significantly more than those with full-time employment.
Study has shown that children with seizure disorders have distinctive temperament and
character patterns, modulated by seizures, with higher harm avoidance, less persistence,
self-directedness, and cooperativeness than normal control. 23 In addition, adolescent
onset of epilepsy was also shown to influence the development of adult personality trait.
24 These studies thus support the hypothesis that patients with younger seizure onset
have higher tendency to adopt an avoidant coping strategy and less adult personality
trait, which prevent them from being employed or continue in employment.
Limitations and future studies
Socio-cultural factors might play a more important role than the clinical factors in
determining the employability especially in Asia, but were not assessed in this study.
These include the negative public attitudes against employment in epilepsy especially in
22
Asia 13, misconceptions such as work aggravates seizures, and an overprotective or
isolation approach to children with epilepsy. Exploration of the impact of these socio-
cultural factors on employment in epilepsy either qualitatively or quantitatively is
needed especially in the Asian population.
Psychological factors in related to employability were also not assessed in this study.
Previous study demonstrated that low self-esteem, passive coping style, and low self-
efficacy predicted unemployment.25 Perceived stigma and fear of discrimination at work
are also predictors of epilepsy patients not seeking for a job.2,26,27 Based on our finding
correlating younger age of seizure onset with unemployment, identifying and providing
counseling to patients with younger onset of epilepsy with coping difficulties might
reduce the rate of unemployment in epilepsy patients. In addition, a better
understanding of the impact of these psychological factors on the employability of
people with epilepsy may be achieved using patient-sibling comparison model, which
minimizing the influence of local socioeconomic factors.
Employment is associated with the belief in the importance of work, which is culturally
variable.26 In Varma’s study, patients who were unemployed have listed poor
motivation as one of the main reasons for not seeking a job.2 According to Maslow’s
need hierarchy theory, human is motivated by a hierarchy of needs: the physiological
needs, the safety needs, the love needs, the esteem needs and the need of self-
actualization.28 Previous study has shown that the majority of patients with epilepsy
who were employed believed that work was important for their personal growth and
financial needs.26 Therefore, in future study, the kind of needs that would motivate
epilepsy patients to seek employment should be examined.
23
This study was performed in a tertiary center, in which the patients recruited are
generally having more severe epilepsy with less seizure freedom (43.2%), as compared
to 75% reported in a community study.29 Therefore, the socioeconomic status of our
cohort is expected to be poorer than the general epilepsy population. However, the
heterogeneity of our cohort allows comparison between groups with different medico-
demographic profile.
Conclusion
The employment issue in epilepsy is not only affected by the clinical, but also the social
factors as shown in this study on the Malaysian population. Besides being unemployed,
many Malaysian epilepsy patients were in part-time or low-income employment in
Malaysia.
References
1. Sillanpaa M, Schmidt D. Long-term employment of adults with childhood-onset
epilepsy: a prospective population-based study. Epilepsia 2010;51:1053-60.
2. Varma NP, Sylaja PN, George L, Sankara Sarma P, Radhakrishnan K.
Employment concerns of people with epilepsy in Kerala, south India. Epilepsy &
Behavior 2007;10:250-4.
3. Lee SA. What we confront with employment of people with epilepsy in Korea.
Epilepsia 2005;46 Suppl 1:57-8.
4. Marinas A, Elices E, Gil-Nagel A, et al. Socio-occupational and employment
profile of patients with epilepsy. Epilepsy & Behavior 2011;21:223-7.

24
5. Jacoby A. Impact of epilepsy on employment status: findings from a UK study
of people with well-controlled epilepsy. Epilepsy Research 1995;21:125-32.
6. Scott-Lennox J, Bryant-Comstock L, Lennox R, Baker GA. Reliability, validity
and responsiveness of a revised scoring system for the Liverpool Seizure Severity Scale.
Epilepsy Research 2001;44:53-63.
7. Vickrey BG, Berg AT, Sperling MR, et al. Relationships between seizure
severity and health-related quality of life in refractory localization-related epilepsy.
Epilepsia 2000;41:760-4.
8. Sancho J, Ivanez V, Molins A, Lopez Gomez V, Masramon X, Perez M.
Changes in seizure severity and quality of life in patients with refractory partial epilepsy.
Epilepsy & Behavior 2010;19:409-13.
9. Bautista RED, Glen ET. Seizure severity is associated with quality of life
independent of seizure frequency. Epilepsy & Behavior 2009;16:325-9.
10. Smith DF, Baker GA, Dewey M, Jacoby A, Chadwick DW. Seizure frequency,
patient-perceived seizure severity and the psychosocial consequences of intractable
epilepsy. Epilepsy Research 1991;9:231-41.
11. World Economic Outlook Database-April 2012, International Monetary Fund.
(Accessed 30th July 2012, at http://www.imf.org/external/index.htm.)
12. Social benefit in Malaysia. (Accessed 30th July 2012, at
http://www.okujobs.com.my/oku-info-employee/.)
13. Lim KS, Lim CH, Tan CT. Attitudes toward epilepsy, a systematic review.
Neurology Asia 2011;16:269-80.
14. Persons with disabilities act 2008 (Act 685). (Accessed 19 November 2012, at
http://www.jkm.gov.my/index.php?option=com_content&view=article&id=352:2-akta-
oku&catid=46:orang-kurang-upaya&Itemid=81&lang=en.)
25
15. International Labour Organisation. (Accessed 30th July 2012, at
http://www.ilo.org/public/english/bureau/stat/res/index.htm.)
16. Collings JA. International differences in psychosocial well-being: a comparative
study of adults with epilepsy in three countries. Seizure 1994;3:183-90.
17. Unemployment rate in Malaysia. Department of statistics, Malaysia. (Accessed
30th July 2012, at http://www.statistics.gov.my/portal/index.php?lang=en.)
18. 10 Malaysian Plan. (Accessed 30th July 2012, at
http://www.pmo.gov.my/dokumenattached/speech/files/RMK10_Speech.pdf.)
19. Smeets VMJ, van Lierop BAG, Vanhoutvin JPG, Aldenkamp AP, Nijhuis FJN.
Epilepsy and employment: literature review. Epilepsy & Behavior 2007;10:354-62.
20. Paul KI, Geithner E, Moser K. Latent Deprivation among People who Are
Employed, Unemployed, or Out of the Labor Force. J Psychol 2009;143:477-91.
21. Sverko B, Galic Z, Sersic DM, Galesic M. Working in the hidden economy:
Associations with the latent benefits and psychological health. Eur J Work Organ
Psychol 2008;17:301-14.
22. Part-time work information sheet, International Labour Organization. (Accessed
30th July 2012, at http://www.ilo.org/travail/lang--en/index.htm.)
23. Park S, Yoo HK, Kim JY, et al. Temperament and character factors in Korean
children with seizure disorders. The Journal of Nervous and Mental Disease
2007;195:470-6.
24. Wilson SJ, Wrench JM, McIntosh AM, Bladin PF, Berkovic SF. Personality
development in the context of intractable epilepsy. Archives of Neurology 2009;66:68-
72.
25. Clarke BM, Upton AR, Castellanos C. Work beliefs and work status in epilepsy.
Epilepsy & Behavior 2006;9:119-25.

26
26. Bautista RED, Wludyka P. Factors associated with employment in epilepsy
patients. Epilepsy & Behavior 2007;10:89-95.
27. Ratsepp M, Oun A, Haldre S, Kaasik AE. Felt stigma and impact of epilepsy on
employment status among Estonian people: exploratory study. Seizure 2000;9:394-401.
28. Wahba MA, Bridwell LG. Maslow reconsidered: A review of research on the
need hierarchy theory. Organizational Behavior and Human Performance 1976;15:212-
40.
29. Shafer SQ, Hauser WA, Annegers JF, Klass DW. EEG and other early
predictors of epilepsy remission: a community study. Epilepsia 1988;29:590-600.
27
Chapter 3: Attitudes toward epilepsy, a systematic review.
(Published as Lim KS, Lim CH, Tan CT. Attitudes toward epilepsy, a systematic review.
Neurology Asia 2011;16:269-80)
Abstract
Surveys about attitudes towards those with epilepsy have been performed since 1949, in
order to understand the social stigma toward epilepsy. This review aims to demonstrate
the variation in public attitudes towards epilepsy and its associated factors, with a
critical review of the methodology used to examine attitudes towards epilepsy. There
was marked variation of attitudes between Western and non-Western populations, and
these attitudes were positively correlated with the standard of living. Besides the general
public, studies were also performed within specific groups, particularly teachers and
students. However absence of a standardized questionnaire makes direct comparison
difficult. A few quantitative methods were developed but these were limited by cultural
variations and thus lack of global acceptance. Short-term intervention studies
demonstrate an improvement of attitude with knowledge. Nonetheless, the cultural and
social reasons underlying the attitudes, and how this affects the life of people with
epilepsy, are understudied. Therefore, surveys on attitudes should continue to be carried
out, particularly in populations prone to have negative attitudes with emphasis on
underlying reasons, and such progress should be monitored longitudinally. Attitudes of
people such as parents, teachers, school counselors, health care professionals, and
employers, which have a direct impact on people with epilepsy, should be more
extensively studied.

28
Introduction
Epilepsy is a disorder of the brain that is characterized by an enduring predisposition to
generate seizures and by its neurobiological, cognitive, psychological, and social
consequences.1 A meta-analysis showed that the median lifetime epilepsy prevalence
for developed countries was 5.8 per 1,000, as compared to 15.4 per 1,000 for rural and
10.3 for urban studies in developing countries.2
However, epilepsy is often an underappreciated health problem especially in Asia.3 In
developing countries, 60% to 90% of people with epilepsy receive no treatment due to
inadequacies in health care resources and delivery, and due to social stigma.4,5
People with epilepsy are burdened by a multitude of social, psychological and economic
consequences of stigmatization which leads to poor quality of life.6,7 Stigma is precisely
described by Boer as follows: children with epilepsy may be banned from school, adults
may be barred from marriage, and employment is often denied, even when seizures
would not render the work unsuitable or unsafe.7 This explains how people with
epilepsy are marginalized in the society as a result of negative public attitudes towards
epilepsy.
The earliest research in social stigma was to examine public attitudes towards epilepsy
by Caveness in the United States in 1949.8 This was a population-based study, which
was subsequently repeated at 5-year intervals, until 1979.9-14 Since then, similar studies
were repeated in various countries and regions, in selected populations (e.g., teachers,
health care providers), and in various languages.
29
In this review, we aim to determine the variability of public attitudes towards epilepsy
among different populations, across time, and between different study populations as
well as the challenges in comparing results obtained from studies using differing
methodology. The pros and cons of various study methods will then be analyzed and
discussed, aiming to guide future research in attitudes towards epilepsy.
Methods
Search strategy and selection
MEDLINE and EMBASE database were systematically searched by the first and second
author to identify all studies published before May 2011 that reported public attitudes
toward epilepsy. The Boolean search using “(attitude*[Title] OR stigma[Title]) AND
epilepsy” were performed. Additional search using specific MeSH subheading “health
knowledge, attitudes, practice” was used to widen the scope of the search strategy.
Inclusion and exclusion criteria
A study was included if it reported the public or patients’ attitudes towards epilepsy,
regardless of its targeted respondents. Studies using qualitative methodology were not
excluded. Papers written in languages other than English were excluded in the search.
Case reports, review articles, meeting abstracts, brief communications, and non-journal
articles were excluded.

30
Study selection
All abstracts were independently reviewed by the two reviewers to determine if they
met eligibility criteria. Any study identified by either reviewer was included. The full
text articles of eligible abstracts were then reviewed independently by both reviewers to
determine final eligibility for data abstraction. Disagreements were resolved by
discussions between the reviewers. Additional papers were identified and gathered
manually by searching the reference lists of all included articles.
Data extraction and analysis
The data for all eligible articles were then independently abstracted by both reviewers
using a standardized form including variables such as the sample size, target
respondents, year of publication, country, and continent. Additional variables including
the percentage of negative attitudes toward marriage, employment and social contact
were screened and tabulated. Descriptive statistics including frequency and percentage
were used in analysis. The association between public attitudes towards epilepsy and the
standard of living in a country was examined. Gross domestic product (GDP) per capita
is a good indicator of standard of living in a country. GDP per capita for the year 2010
was thus used in this comparison, and obtained from World Economic Outlook
Database-April 2011, International Monetary Fund.
Results
Three hundred and thirty one abstracts were identified from the initial search with 129
full text articles meeting all eligibility criteria. These included 119 full text papers and
31
10 abstracts without full text papers from regional journals, e.g. Ethiopia Medical
Journal and West Africa Journal of Medicine, all of which were selected for data
abstraction. Three additional papers were identified from the reference lists and
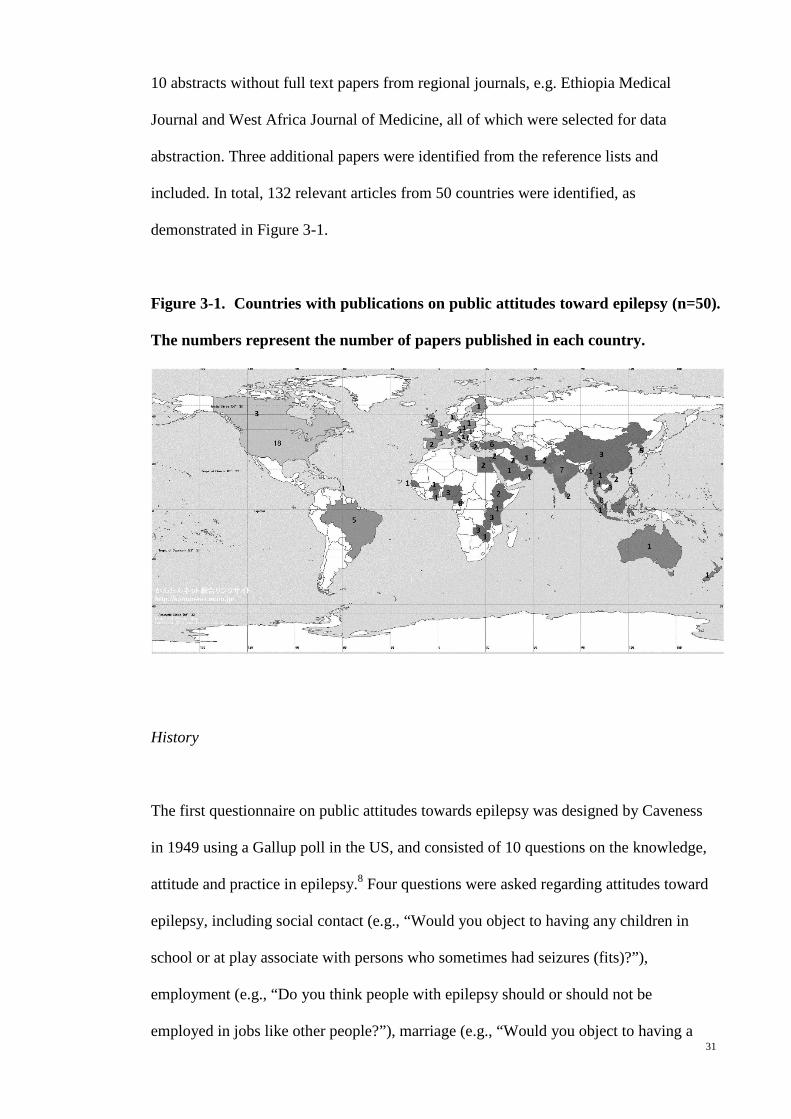
included. In total, 132 relevant articles from 50 countries were identified, as
demonstrated in Figure 3-1.
Figure 3-1. Countries with publications on public attitudes toward epilepsy (n=50).
The numbers represent the number of papers published in each country.
History
The first questionnaire on public attitudes towards epilepsy was designed by Caveness
in 1949 using a Gallup poll in the US, and consisted of 10 questions on the knowledge,
attitude and practice in epilepsy.8 Four questions were asked regarding attitudes toward
epilepsy, including social contact (e.g., “Would you object to having any children in
school or at play associate with persons who sometimes had seizures (fits)?”),
employment (e.g., “Do you think people with epilepsy should or should not be
employed in jobs like other people?”), marriage (e.g., “Would you object to having a

32
son or daughter of yours marrying a person who sometimes had seizures?”), and
perception (e.g., “Do you think epilepsy is a form of insanity or not?”).
The study by Caveness on public attitudes towards epilepsy was subsequently repeated,
modified, and quantified in various countries across the 6 continents, as in Figure 3-1
and 3-2, and carried out in various languages including Malay15, Thai16, Vietnamese17-19,
Chinese18,20-22, French23, Turkish24, Spanish25, Lao language26, Malayalam language27,28,
Swahili language29, and Urdu language.30
Figure 3-2. Publications on public attitudes towards epilepsy (n=132 papers)
The first paper in Europe was published in 197431, followed by Asia in 1984, Africa in
199132, Australia in 199433 and South America in 1998.34 There was an exponential
increasing trend in the number of publications after 1990, especially in Asia and Africa,
resulting in the highest number of publications in Asia (46/120, 38.7%), followed by
Africa and Europe (21.7% and 19.2%, respectively).
0
10
20
30
40
50
1951 1961 1971 1981 1991 2001 2011
Publ
icat
ion
on p
ublic
att
itude
s tow
ard
epile
psy,
n
Year
Africa Australia Asia
33
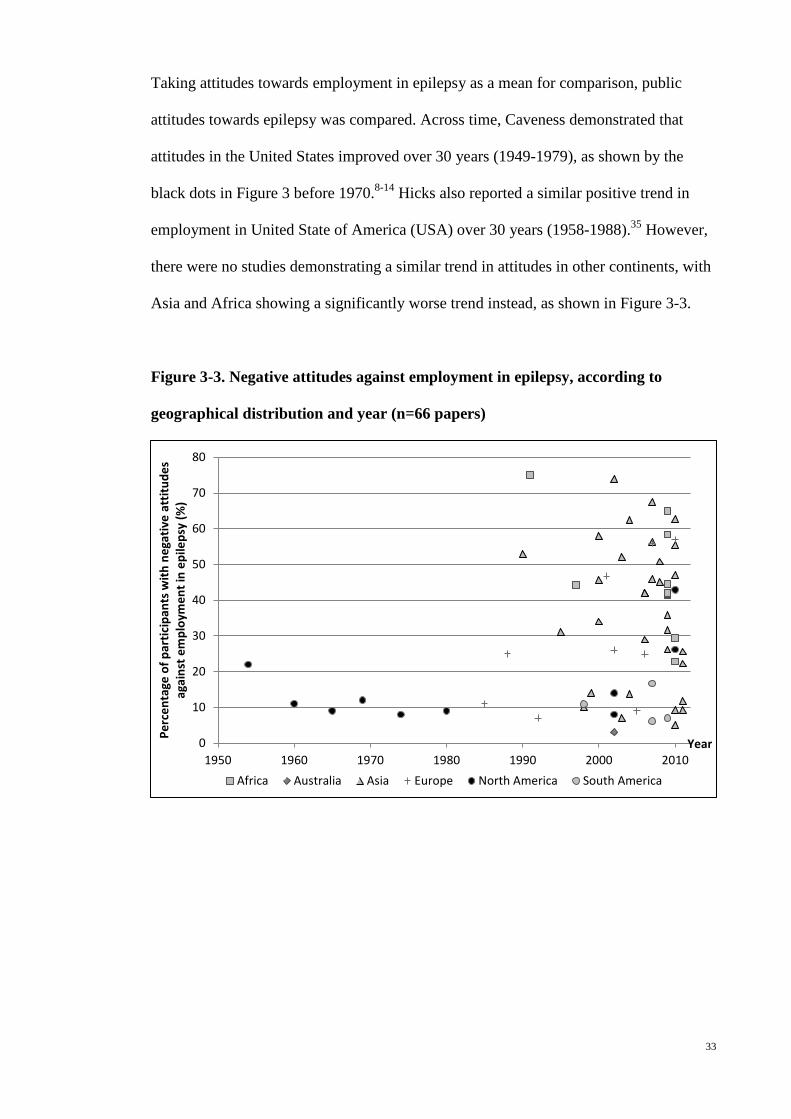
Taking attitudes towards employment in epilepsy as a mean for comparison, public
attitudes towards epilepsy was compared. Across time, Caveness demonstrated that
attitudes in the United States improved over 30 years (1949-1979), as shown by the
black dots in Figure 3 before 1970.8-14 Hicks also reported a similar positive trend in
employment in United State of America (USA) over 30 years (1958-1988).35 However,
there were no studies demonstrating a similar trend in attitudes in other continents, with
Asia and Africa showing a significantly worse trend instead, as shown in Figure 3-3.
Figure 3-3. Negative attitudes against employment in epilepsy, according to
geographical distribution and year (n=66 papers)
0
10
20
30
40
50
60
70
80
1950 1960 1970 1980 1990 2000 2010
Perc
enta
ge o
f par
ticip
ants
with
neg
ativ
e at
titud
es
agai
nst e
mpl
oym
ent i
n ep
ileps
y (%
)
Year
Africa Australia Asia Europe North America South America

34
Attitudes towards epilepsy and the associated factors
Factors associated with negative attitudes towards epilepsy
Attitudes towards epilepsy can be influenced by the individual’s socioeconomic
background, knowledge, and the illness perceptions of epilepsy. People from rural areas
with lower educational level and socioeconomic status have been found to have more
negative attitudes towards epilepsy.15,16,20,22,32,34,36-39 Other factors include old
age19,47,48,50, male gender22,36,37, female gender38, being single22, and Hindu ethnicity.40
Knowledge about epilepsy is an important factor in reducing the degree of
discrimination and negative attitudes toward epilepsy. Studies show that people with
less knowledge about epilepsy, or without personal contact with someone with epilepsy,
have poorer attitudes.15,16,20,34,36-39 The magnitude of the negative attitudes seems to be
aggravated by the presence of misconception of epilepsy, which include the perception
of epilepsy as a form of insanity16,37,20, being untreatable36,41, contagious30, hereditary41,
or a form of mental retardation.20
Attitudes toward epilepsy across continents
The studies in Northern America, in general, demonstrate more positive attitudes
towards epilepsy, as shown in Figure 3-3. However, direct comparison and statistical
analysis could not be performed as these papers utilized different questions and target
populations. Interestingly, Chung studied the attitudes of Chinese and Vietnamese
adults in the United States, and found a higher percentage of negative attitudes against

35
employment in epilepsy as compared to the earlier studies by Caveness (43% vs. 8-
22%).9-14,18
Asia and Africa are the two continents with the worst attitudes against employment in
epilepsy, where 50.0% (16/32) and 80.0% (8/10) of the published papers respectively
reported more than 40% of participants with negative attitudes, as compared to none in
North and South America, and Australia, except the study by Chung on Asian migrants
in the United States.19 Studies in South America were however only limited to Brazil
and Trinidad & Tobago.
Publications in Europe showed mixed results where two papers in Italy and one in
Hungary reported high percentage of participants with a negative attitude towards
employment in epilepsy (56%, 57% and 47%, respectively).38,42,43
Attitudes towards epilepsy and standard of living
Figure 3-4 shows that in general, the magnitude of negative attitudes towards epilepsy is
inversely proportional to the GDP per capita, except in Italy and Kuwait38,42,44, countries
with a high GDP per capita and a high percentage of negative attitudes towards epilepsy
(circled in Figure 3-4), and in Turkey, Brazil, India and the Chinese in Malaysia20,34,45-
49 ,countries with a low GDP per capita and a low percentage of negative attitudes
towards epilepsy (squared in Figure 3-4).
Figure 3-4. Negative attitudes against employment in epilepsy, according to gross
domestic product per capita, based on papers published in 2001-2011 (n=47
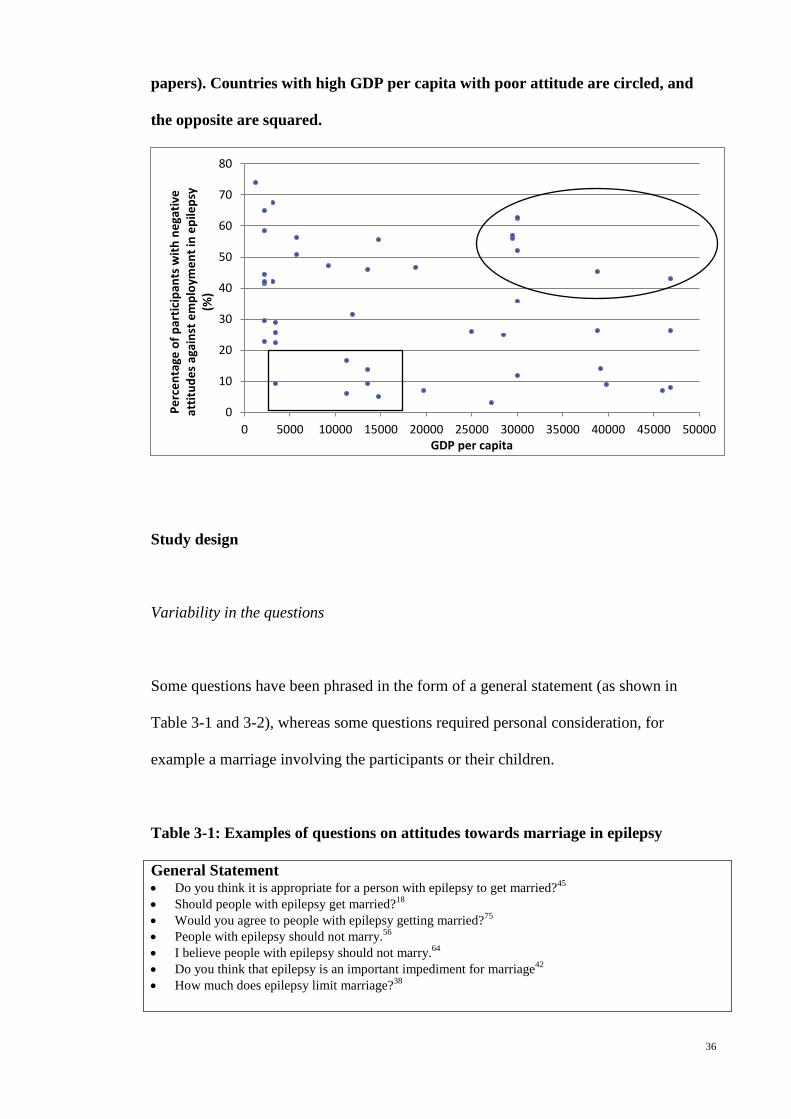
36
papers). Countries with high GDP per capita with poor attitude are circled, and
the opposite are squared.
Study design
Variability in the questions
Some questions have been phrased in the form of a general statement (as shown in
Table 3-1 and 3-2), whereas some questions required personal consideration, for
example a marriage involving the participants or their children.
Table 3-1: Examples of questions on attitudes towards marriage in epilepsy
General Statement • Do you think it is appropriate for a person with epilepsy to get married?45 • Should people with epilepsy get married?18 • Would you agree to people with epilepsy getting married?75 • People with epilepsy should not marry.56 • I believe people with epilepsy should not marry.64 • Do you think that epilepsy is an important impediment for marriage42 • How much does epilepsy limit marriage?38
0
10
20
30
40
50
60
70
80
0 5000 10000 15000 20000 25000 30000 35000 40000 45000 50000
Perc
enta
ge o
f par
ticip
ants
with
neg
ativ
e at
titud
es a
gain
st e
mpl
oym
ent i
n ep
ileps
y (%
)
GDP per capita

37
Personal consideration of marriage involving the participants themselves • Would you be willing personally to marry someone with epilepsy?76 • Would you marry a person with epilepsy?45,47 • Would you agree to marry (yourself or your children) with him/her provided this person is otherwise
acceptable?20,62,68 Personal consideration of marriage involving the participants’ children • Would you object to having a son or daughter of yours marrying a person who sometimes had seizures
(fits)? 9,11,14,19,22,37,50-55,77 • Do you allow your son to marry a girl with epilepsy?57-60 • Do you allow your daughter to marry a man with epilepsy?57-60 • Would you object to a person with epilepsy marrying a close relative of yours (brother, sister, or
child)?78,79 • Would you object to your child getting married to a person with epilepsy?18 • Would you object to your son or daughter marrying a person with epilepsy?44 • Would you allow your children to marry people with epilepsy?41,61,75 • My child can marry a people with epilepsy.23 • Would you agree to marry (yourself or your children) with him/her provided this person is otherwise
acceptable?20,62,68 • Would you approve if your son/daughter married a person with epilepsy?45 • I would object to the marriage of my child with someone who has epilepsy.46
Table 3-2: Examples of questions on attitudes towards employment in epilepsy
General statement • Equal employment opportunities should be available to individuals with epilepsy.63 • Do you think people with epilepsy should or should not be employed in jobs like other
people?”9,11,14,19,22,37,50-55,77 • Do you think that, in general, persons with epilepsy should be employed at the same jobs as other
people?53,78,79 • Do you think that epilepsy patients can be employed?28 • Do you think that epilepsy is an important impediment for a job42 Personal consideration as an employer • I would object to hiring someone who has epilepsy.46 • Would you employ someone with epilepsy?47 • Would you employ an epileptic?32 • Are you going to hire a person with epilepsy if you are an employer?41 • If you were an employer, would you hire people with epilepsy?44,75 • If you are an employer, do you allow a patient with epilepsy to be your employee?57 • If you were an employer, would you knowingly hire someone with epilepsy?18 • As an employer, would you hire a person who is subject to epileptic seizures?80 • Would you hire him/her in your own business provided he-she had the skills or qualifications for
it?62,68 • Assuming you had a business of your own, would you hire an epileptic in your own business, if he/she
has the skills or qualifications for it? 20 • If you were an employer, would you terminate the employment of persons with epilepsy, if a seizure
occurred during work because of unreported epilepsy?18 Personal consideration in relation to a specific job (with a choice of jobs including teacher, nurse, doctor etc.) • Would you be willing personally to employ someone with epilepsy in a clerical job?76 • What jobs do you think epileptics should not be employed in?20,57 • Which, if any, of the following jobs do you think people with epilepsy should not be employed in?39
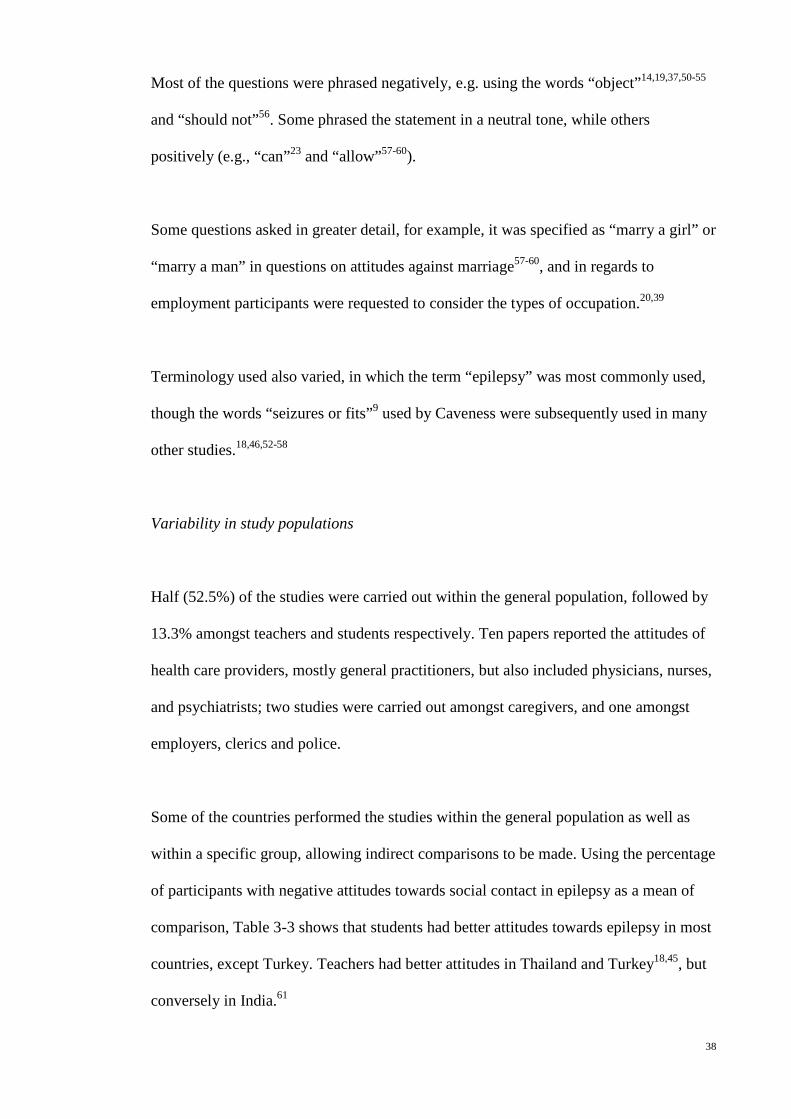
38
Most of the questions were phrased negatively, e.g. using the words “object”14,19,37,50-55
and “should not”56. Some phrased the statement in a neutral tone, while others
positively (e.g., “can”23 and “allow”57-60).
Some questions asked in greater detail, for example, it was specified as “marry a girl” or
“marry a man” in questions on attitudes against marriage57-60, and in regards to
employment participants were requested to consider the types of occupation.20,39
Terminology used also varied, in which the term “epilepsy” was most commonly used,
though the words “seizures or fits”9 used by Caveness were subsequently used in many
other studies.18,46,52-58
Variability in study populations
Half (52.5%) of the studies were carried out within the general population, followed by
13.3% amongst teachers and students respectively. Ten papers reported the attitudes of
health care providers, mostly general practitioners, but also included physicians, nurses,
and psychiatrists; two studies were carried out amongst caregivers, and one amongst
employers, clerics and police.
Some of the countries performed the studies within the general population as well as
within a specific group, allowing indirect comparisons to be made. Using the percentage
of participants with negative attitudes towards social contact in epilepsy as a mean of
comparison, Table 3-3 shows that students had better attitudes towards epilepsy in most
countries, except Turkey. Teachers had better attitudes in Thailand and Turkey18,45, but
conversely in India.61
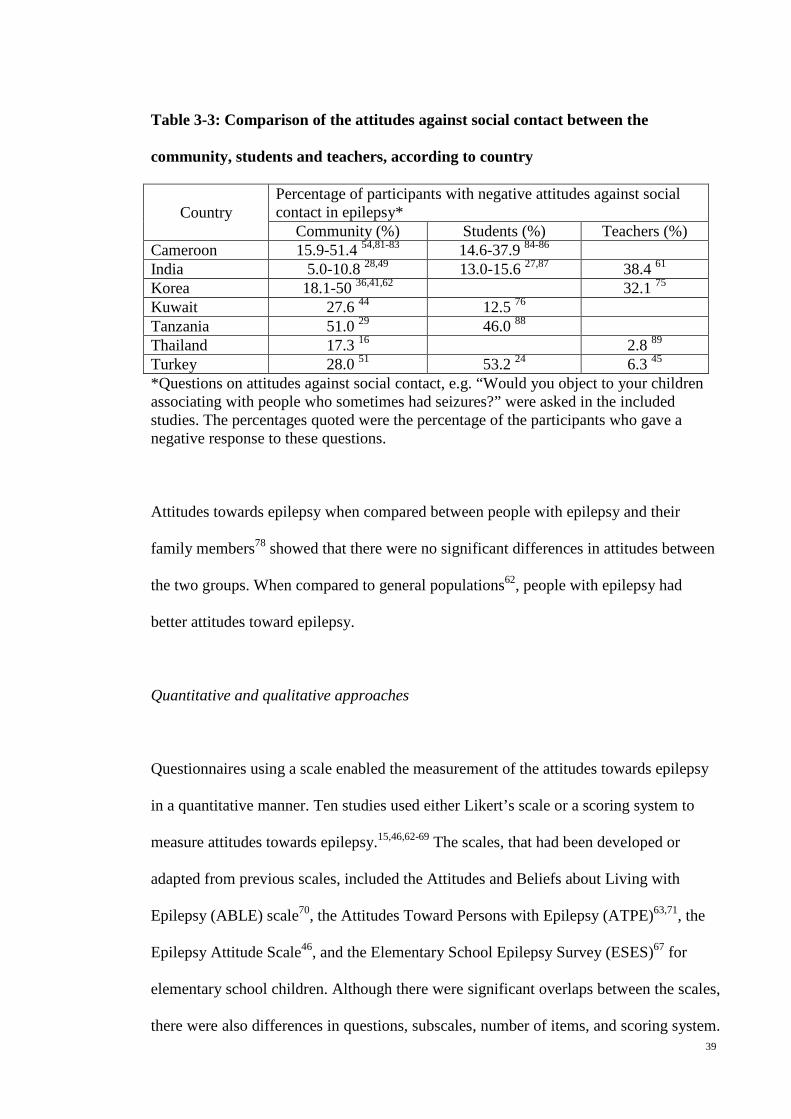
39
Table 3-3: Comparison of the attitudes against social contact between the
community, students and teachers, according to country
Country Percentage of participants with negative attitudes against social contact in epilepsy*
Community (%) Students (%) Teachers (%) Cameroon 15.9-51.4 54,81-83 14.6-37.9 84-86 India 5.0-10.8 28,49 13.0-15.6 27,87 38.4 61 Korea 18.1-50 36,41,62 32.1 75 Kuwait 27.6 44 12.5 76 Tanzania 51.0 29 46.0 88 Thailand 17.3 16 2.8 89 Turkey 28.0 51 53.2 24 6.3 45 *Questions on attitudes against social contact, e.g. “Would you object to your children associating with people who sometimes had seizures?” were asked in the included studies. The percentages quoted were the percentage of the participants who gave a negative response to these questions.
Attitudes towards epilepsy when compared between people with epilepsy and their
family members78 showed that there were no significant differences in attitudes between
the two groups. When compared to general populations62, people with epilepsy had
better attitudes toward epilepsy.
Quantitative and qualitative approaches
Questionnaires using a scale enabled the measurement of the attitudes towards epilepsy
in a quantitative manner. Ten studies used either Likert’s scale or a scoring system to
measure attitudes towards epilepsy.15,46,62-69 The scales, that had been developed or
adapted from previous scales, included the Attitudes and Beliefs about Living with
Epilepsy (ABLE) scale70, the Attitudes Toward Persons with Epilepsy (ATPE)63,71, the
Epilepsy Attitude Scale46, and the Elementary School Epilepsy Survey (ESES)67 for
elementary school children. Although there were significant overlaps between the scales,
there were also differences in questions, subscales, number of items, and scoring system.

40
One study in Africa used a qualitative approach (n=200) and provided new insight into
some of the aspects of attitudes that would otherwise remain undetected using
structured questionnaires, including attitudes such as tolerance, kindness, and sympathy
towards people with epilepsy.72
Intervention studies
Five intervention studies using educational programs, personal contact, or educational
material about epilepsy showed that besides an improvement in the knowledge about
epilepsy, there was also significant improvement in the attitudes towards
epilepsy.24,36,47,73,74
Discussion
Attitudes towards epilepsy and the associated factors
This study describes the prevalence and variability of public attitudes toward epilepsy.
The variation of attitudes across geographical regions are likely multifactorial. In
medical anthropology, the Western Civilization is viewed as depending mostly on a
naturalistic explanation of illness. This probably minimizes the misconception and
stigma in epilepsy, which may lead to better attitudes. In contrast, geographical regions
with strong cultural perception of disease that rely on non-scientific explanation, e.g.
Asia and Africa have poorer attitudes towards epilepsy. In addition, Western philosophy
with emphasis on basic human rights could be another explanation for better attitudes in
Western countries. Even though non-scientific influence on disease perception is still
41
predominant in Asia and Africa as evidenced by the misconception of epilepsy as
spiritual, contagious and a form of insanity, modern scientific education and political
emphasis on basic human rights might have a positive impact on these misconceptions.
However we have yet no historical data to prove the above.
The inversely proportional relationship between the magnitude of negative attitudes
towards epilepsy and the GDP per capita (Figure 3-4) might be indirectly related to
modern education and emphasis on human rights, or directly related to economic status.
As evidenced in many studies demonstrating better attitudes in urban population
compared to rural population in the same region, economic status has a direct impact on
attitude towards epilepsy. However, there are exceptions as shown in Figure 4, where
the economic status is not the only variable explaining the variation in public attitudes.
Factors associated with negative attitudes towards epilepsy have been extensively
examined. These include socioeconomic status, knowledge and education level,
perception and misconceptions. However, we are uncertain about the actual reasons
behind such negative attitudes. For example, a community that emphasizes a family’s
honor may be more likely to object to marriage with people with epilepsy as compared
to a community that emphasizes freedom of choice in marriage. Therefore, the cultural
values molding the attitudes should be explored qualitatively. The study by Chung,
which reported a higher percentage of negative attitudes against employment in epilepsy
in the Chinese and Vietnamese adults in United States as compared to American adults
(43% vs. 8-22%)9-14,18, suggested that cultural influence on public attitudes towards
epilepsy might not be easily changed merely through geographical migration.
42
Study design
Questionnaires varied depending on the population studied, and the local cultural
context and personal preferences, creating great difficulty in directly comparing
published study results. A general statement tended to produce more positive results,
giving a false impression. Questions which required personal consideration, either a
marriage involving the participants or their children, were more reflective of the actual
stigmatization, and this tended to skew the results negatively. In general, negatively
phrased statements encouraged negative attitude as disagreeing with a negatively
phrased statement is cognitively a complex task. Furthermore, statements which
emphasized parental authority, e.g. “Would you object to having a son or daughter of
yours marrying a person who sometimes had seizures (fits)?” may not be appropriate in
a society that emphasizes freedom of choice; whereas statements using the word “can”
assessed purely the personal perception of one’s suitability to work or marry, without
taking the parental authority into account. Questions asked in greater detail, such as
questions related to specific occupation, though providing the understanding of the
discriminating factors like gender and types of occupation, might have excessively
prolonged the survey.
Surveys on epilepsy patients allow us to determine the discrepancy between patients
and the general population in knowledge and perception towards epilepsy. The degree
of discrepancy will indirectly indicate the magnitude of social stigma in the studied
population. Therefore, direct comparison of attitudes towards epilepsy between epilepsy
patients and the public should be encouraged.
43
Previous studies had provided a way to measure public attitudes, either through a
questionnaire or a scale, but lack of standardization of the study design made direct
comparison among various studied populations difficult. A quantitative scale is essential
and practical to provide an overall picture of attitudes in a selected study population,
and allows for comparison among different populations. Furthermore, this approach
allows monitoring of changes over time, as well as measuring the outcome of an
intervention. However, none of the scales were widely accepted as a gold standard.
Thus we should aim to develop a standardized, quantitative, and cross-cultural measure
of public attitudes toward epilepsy for cross-sectional and longitudinal comparison.
Although there are specific questions dealing with a specific issue (e.g., employment),
the results might not reflect the actual concerns of the community and employers, and
the challenges faced by people with epilepsy. Therefore, qualitative assessment of the
concerns and challenges should be encouraged.
Interventional studies have shown that education on epilepsy could improve attitudes in
a studied group. These results reinforced the importance of public education in reducing
the stigma of epilepsy. Furthermore, this interventional design might be effective in
determining the usefulness of epilepsy awareness campaign in changing public attitudes.
However, we are uncertain of whether improvement in socioeconomic status and
education level of the population will translate into an improvement in public
perception and attitudes towards epilepsy. Longitudinal studies in multiple regions are
required to answer this uncertainty.
Most studies on attitudes are designed from a human rights perspective, to determine
whether the patients are being discriminated against. Other attitudes such as

44
overprotection, empathy and tolerance, are equally important. For example,
overprotection of children with epilepsy may affect their personality development.
Therefore, future studies should also aim at greater understanding of these attitudes.
It is a methodological challenge to study how public attitudes might impact life of
people with epilepsy. However, if we are unable to determine this relationship, we will
face a bottleneck in research of public attitudes toward epilepsy.
Thus, studies on attitudes should be conducted continuously, particularly in populations
prone to have negative attitudes with emphasis on underlying reasons, and progress
should be monitored longitudinally. Attitudes of people such as parents, teachers,
school counselors, health care professionals, and employers, which have direct impact
on people with epilepsy, should be more extensively studied.
Limitations of the study
This review only included studies presented in English, as it is limited by the
inaccessibility of journals written in other languages and the inability to interpret the
results without translation. Nonetheless, as shown in Figure 1, the information about
public attitudes towards epilepsy was available in most countries in each continent,
except Africa and South America.
Conclusion
Since 1949, public attitudes towards epilepsy had been extensively studied with an
exponential increase in publications in the past twenty years. However, the increase in

45
number of published studies did not lead to improved quality of care for people with
epilepsy. This review presents the background, development and progression of
research on public attitudes toward epilepsy, focusing on the status of attitudes across
time and geographical regions, its associated factors, as well as the study design, aiming
to provide a guide for future study.
References
1. Fisher RS, van Emde Boas W, Blume W, et al. Epileptic seizures and epilepsy:
definitions proposed by the International League Against Epilepsy (ILAE) and the
International Bureau for Epilepsy (IBE). Epilepsia 2005;46:470-2.
2. Ngugi A, Bottomley C, Kleinschmidt I, Sander J, Newton C. Estimation of the
burden of active and life-time epilepsy: A meta-analytic approach. Epilepsia
2010;51:883-90.
3. Mac TL, Tran D-S, Quet F, Odermatt P, Preux P-M, Tan CT. Epidemiology,
aetiology, and clinical management of epilepsy in Asia: a systematic review. Lancet
Neurol 2007;6:533-43.
4. Shorvon S, Farmer P. Epilepsy in developing countries: a review of
epidemiological, sociocultural and treatment aspects. . Epilepsia 1988;29:S36-S45.
5. Meinardi H, Scott R, Reis R, JWA S. The Treatment Gap in Epilepsy: The
Current Situation and Ways Forward. Epilepsia 2001;42:136-49.
6. Jacoby A. Stigma, epilepsy, and quality of life. Epilepsy & Behavior
2002;3:S10–S20.
7. Boer H, Mula M, Sander J. The global burden and stigma of epilepsy. Epilepsy
& Behavior 2008;12:540-6.
46
8. Caveness W. A survey of public attitudes toward epilepsy. Epilepsia 1949;4:19-
26.
9. Caveness W. A survey of public attitudes toward epilepsy, 1954. Epilepsia
1954;3:99-102.
10. Caveness WF. Trend in public attitudes toward epilepsy over the past decade.
Epilepsia 1960;1:385-93.
11. Caveness WF, Merritt HH, Gallup GH, Ruby EH. A survey of public attitudes
toward epilepsy in 1964, with an indicatin of trends over the past fifteen years.
Epilepsia 1965;6:75-86.
12. Caveness WF, Merritt HH, Gallup GH. A survey of public attitudes toward
epilepsy in 1969 with an indication of trends over the past twenty years. Epilepsia
1969;10:429-40.
13. Caveness WF, Merritt HH, Gallup GH, Jr. A survey of public attitudes toward
epilepsy in 1974 with an indication of trends over the past twenty-five years. Epilepsia
1974;15:523-36.
14. Caveness WF, Gallup GH, Jr. A survey of public attitudes toward epilepsy in
1979 with an indication of trends over the past thirty years. In: Epilepsia; 1980:509-18.
15. Neni SW, Latif AZA, Wong SY, Lua PL. Awareness, knowledge and attitudes
towards epilepsy among rural populations in East Coast Peninsular Malaysia: a
preliminary exploration. Seizure 2010;19:280-90.
16. Saengpattrachai M, Srinualta D, Lorlertratna N, Pradermduzzadeeporn E,
Poonpol F. Public familiarity with, knowledge of, and predictors of negative attitudes
toward epilepsy in Thailand. Epilepsy Behav 2010;17:497-505.
17. Tuan NA, Cuong LQ, Allebeck P, Chuc NTK, Tomson T. Knowledge attitudes
and practice toward epilepsy among adults in BaVi, Vietnam: first report from the
population-based EPIBAVI study. Epilepsia 2007;48:1914-9.

47
18. Chung K, Ivey SL, Guo W, et al. Knowledge, attitudes, and practice toward
epilepsy (KAPE): a survey of Chinese and Vietnamese adults in the United States.
Epilepsy Behav 2010;17:221-7.
19. Le QC, Dinh DT, Jallon P. Survey of public awareness, attitudes, and
understanding toward epilepsy in Nhan Chinh, Hanoi, Vietnam, in 2003. Epilepsy
Behav 2006;8:176-80.
20. Hasan SS, Alen YKS, Wayne WGW, Ahmadi K, Anwar M, Goh GK.
Understanding of and attitudes toward epilepsy among the urban Chinese population in
Malaysia. Singapore Med J 2010;51:290-9.
21. Wong V, Chung BHY. Survey of public awareness, attitudes, and understanding
toward epilepsy in Hong Kong. Epilepsia 2003;44:268-9; author reply 9-70.
22. Lim KS, Tan LP, Lim KT, Tan CT. Survey of public awareness, understanding,
and attitudes toward epilepsy among Chinese in Malaysia. Neurol J Southeast Asia
1999;4:31-6.
23. Ndoye NF, Sow AD, Diop AG, et al. Prevalence of epilepsy its treatment gap
and knowledge, attitude and practice of its population in sub-urban Senegal an
ILAE/IBE/WHO study. Seizure 2005;14:106-11.
24. Bozkaya IO, Arhan E, Serdaroglu A, Soysal AS, Ozkan S, Gucuyener K.
Knowledge of, perception of, and attitudes toward epilepsy of schoolchildren in Ankara
and the effect of an educational program. Epilepsy Behav 2010;17:56-63.
25. Garcia-Mas A, Rossinol F, Tsackos Moratalla A, Roca Bennasar M. Attitudes
toward epilepsy in Majorca. Arch Neurobiol (Madr) 1989;52:178-82.
26. Tran D-S, Odermatt P, Singphuoangphet S, et al. Epilepsy in Laos: knowledge,
attitudes, and practices in the community. Epilepsy Behav 2007;10:565-70.
48
27. Pandian JD, Santosh D, Kumar TS, Sarma PS, Radhakrishnan K. High school
students' knowledge, attitude, and practice with respect to epilepsy in Kerala, southern
India. Epilepsy Behav 2006;9:492-7.
28. Radhakrishnan K, Pandian JD, Santhoshkumar T, et al. Prevalence, knowledge,
attitude, and practice of epilepsy in Kerala, South India. Epilepsia 2000;41:1027-35.
29. Rwiza HT, Matuja WB, Kilonzo GP, et al. Knowledge, attitude, and practice
toward epilepsy among rural Tanzanian residents. Epilepsia 1993;34:1017-23.
30. Shafiq M, Tanwir M, Tariq A, et al. Epilepsy: public knowledge and attitude in
a slum area of Karachi, Pakistan. Seizure 2007;16:330-7.
31. Holdsworth L, Whitmore K. A study of children with epilepsy attending
ordinary schools. II: Information and attitudes held by their teachers. Dev Med Child
Neurol 1974;16:759-65.
32. Tekle-Haimanot R, Abebe M, Forsgren L, et al. Attitudes of rural people in
central Ethiopia towards epilepsy. Soc Sci Med 1991;32:203-9.
33. Frith JF, Harris MF, Beran RG. Management and attitudes of epilepsy by a
group of Sydney general practitioners. Epilepsia 1994;35:1244-7.
34. Santos IC, Guerreiro MM, Mata A, et al. Public awareness and attitudes toward
epilepsy in different social segments in Brazil. Arquivos De Neuro-Psiquiatria
1998;56:32-8.
35. Hicks RA, Hicks MJ. Attitudes of major employers toward the employment of
people with epilepsy: a 30-year study. Epilepsia 1991;32:86-8.
36. Kim M-K, Kim I-K, Kim B-C, Cho K-H, Kim S-J, Moon J-D. Positive trends of
public attitudes toward epilepsy after public education campaign among rural korean
residents. J Korean Med Sci 2003;18:248-54.

49
37. Spatt J, Bauer G, Baumgartner C, et al. Predictors for negative attitudes toward
subjects with epilepsy: a representative survey in the general public in Austria.
Epilepsia 2005;46:736-42.
38. Mecarelli O, Capovilla G, Romeo A, Rubboli G, Tinuper P, Beghi E. Past and
present public knowledge and attitudes toward epilepsy in Italy. Epilepsy Behav
2010;18:110-5.
39. McEwan L, Taylor J, Casswell M, et al. Knowledge of and attitudes expressed
toward epilepsy by carers of people with epilepsy: a UK perspective. Epilepsy Behav
2007;11:13-9.
40. Youssef FF, Dial S, Jaggernauth N, et al. Knowledge of, attitudes toward, and
perceptions of epilepsy among college students in Trinidad and Tobago. Epilepsy
Behav 2009;15:160-5.
41. Choi-Kwon S, Park KA, Lee HJ, et al. Familiarity with, knowledge of, and
attitudes toward epilepsy in residents of Seoul, South Korea. Acta Neurol Scand
2004;110:39-45.
42. Mecarelli O, Li Voti P, Vanacore N, et al. A questionnaire study on knowledge
of and attitudes toward epilepsy in schoolchildren and university students in Rome, Italy.
Seizure 2007;16:313-9.
43. Mirnics Z, Czikora G, Zavecz T, Halasz P. Changes in public attitudes toward
epilepsy in Hungary: Results of surveys conducted in 1994 and 2000. Epilepsia
2001;42:86-93.
44. Awad A, Sarkhoo F. Public knowledge and attitudes toward epilepsy in Kuwait.
Epilepsia 2008;49:564-72.
45. Bekiroglu N, Ozkan R, Gurses C, Arpaci B, Dervent A. A study on awareness
and attitude of teachers on epilepsy in Istanbul. Seizure-European Journal of Epilepsy
2004;13:517-22.

50
46. Aydemir N. Familiarity with, knowledge of, and attitudes toward epilepsy in
Turkey. Epilepsy Behav 2011;20:286-90.
47. Tedrus GMAS, Fonseca LC, Vieira ALdC. Knowledge and attitudes toward
epilepsy amongst students in the health area: intervention aimed at enlightenment. Arq
Neuropsiquiatr 2007;65:1181-5.
48. Falavigna A, Teles AR, Roth F, et al. Awareness, attitudes and perceptions on
epilepsy in Southern Brazil. Arquivos De Neuro-Psiquiatria 2007;65:1186-91.
49. Gourie-Devi M, Singh V, Bala K. Knowledge, attitude and practices among
patients of epilepsy attending tertiary hospital in Delhi, India and a review of Indian
studies: Neurology Asia. 15 (3) (pp 225-232), 2010. Date of Publication: December
2010.
50. Chung MY, Chang YC, Lai YH, Lai CW. Survey of public awareness,
understanding, and attitudes toward epilepsy in Taiwan. Epilepsia 1995;36:488-93.
51. Demirci S, Donmez CM, Gundogar D, Baydar CL. Public awareness of,
attitudes toward, and understanding of epilepsy in Isparta, Turkey. Epilepsy Behav
2007;11:427-33.
52. Hills MD, MacKenzie HC. New Zealand community attitudes toward people
with epilepsy. Epilepsia 2002;43:1583-9.
53. Masoudnia E. Awareness, understanding and attitudes towards epilepsy among
Iranian ethnic groups. Seizure 2009;18:369-73.
54. Njamnshi AK, Yepnjio FN, Tabah EN, et al. Public awareness, perceptions, and
attitudes with respect to epilepsy in Ebolowa and Sangmelima--Urban Cameroon.
Epilepsy Behav 2009;14:628-33.
55. Novotna I, Rektor I. The trend in public attitudes in the Czech Republic towards
persons with epilepsy. Eur J Neurol 2002;9:535-40.

51
56. Al-Adawi S, Al-Ismaily S, Martin R, et al. Psychosocial aspects of epilepsy in
Oman: attitude of health personnel. Epilepsia 2001;42:1476-81.
57. Daoud A, Al-Safi S, Otoom S, Wahba L, Alkofahi A. Public knowledge and
attitudes towards epilepsy in Jordan. Seizure 2007;16:521-6.
58. Atadzhanov M, Chomba E, Haworth A, Mbewe E, Birbeck GL. Knowledge,
attitudes, behaviors, and practices regarding epilepsy among Zambian clerics. Epilepsy
Behav 2006;9:83-8.
59. Chomba EN, Haworth A, Atadzhanov M, Mbewe E, Birbeck GL. Zambian
health care workers' knowledge, attitudes, beliefs, and practices regarding epilepsy.
Epilepsy Behav 2007;10:111-9.
60. Mbewe E, Haworth A, Atadzhanov M, Chomba E, Birbeck GL. Epilepsy-related
knowledge, attitudes, and practices among Zambian police officers. Epilepsy Behav
2007;10:456-62.
61. Thacker AK, Verma AM, Ji R, Thacker P, Mishra P. Knowledge awareness and
attitude about epilepsy among schoolteachers in India. Seizure 2008;17:684-90.
62. Yoo J-K, Jung K-Y, Park K-W, et al. Familiarity with, understanding of, and
attitudes toward epilepsy among people with epilepsy and healthy controls in South
Korea. Epilepsy Behav 2009;16:260-7.
63. Lee S-A, Yim SB, Rho YI, et al. Factors contributing to Korean teachers'
attitudes toward students with epilepsy. Epilepsy Behav 2011;20:378-81.
64. Kobau R, DiIorio CA, Anderson LA, Price PH. Further validation and reliability
testing of the Attitudes and Beliefs about Living with Epilepsy (ABLE) components of
the CDC Epilepsy Program Instrument on Stigma. Epilepsy Behav 2006;8:552-9.
65. Bishop M, Slevin B. Teachers' attitudes toward students with epilepsy: results of
a survey of elementary and middle school teachers. Epilepsy Behav 2004;5:308-15.

52
66. Bishop M, Boag EM. Teachers' knowledge about epilepsy and attitudes toward
students with epilepsy: results of a national survey. Epilepsy Behav 2006;8:397-405.
67. Lowe-Pearce C, Camfield CS. Elementary school epilepsy survey (ESES): a
new measure of elementary school students' knowledge and attitudes about epilepsy.
Epilepsy Behav 2005;7:687-96.
68. Diamantopoulos N, Kaleyias J, Tzoufi M, Kotsalis C. A survey of public
awareness, understanding, and attitudes toward epilepsy in Greece. Epilepsia
2006;47:2154-64.
69. Martiniuk A, Speechley K, Secco M, Karen Campbell M. Development and
psychometric properties of the Thinking about Epilepsy questionnaire assessing
children's knowledge and attitudes about epilepsy. Epilepsy Behav 2007 10:595-603.
70. Kobau R, Price P. Knowledge of epilepsy and familiarity with this disorder in
the US population: Results from the 2002 HealthStyles Survey. Epilepsia
2003;44:1449-54.
71. Antonak RF. Psychometric analysis and validation of the scale of Attitudes
Toward Persons with Epilepsy: Journal of Epilepsy. 3 (1) (pp 11-16), 1990. Date of
Publication: 1990.
72. Kabir M, Iliyasu Z, Abubakar I, Kabir Z, Farinyaro A. Knowledge, attitude and
beliefs about epilepsy among adults in a northern nigerian urban community. Annals of
African Medicine 2005;4:107-12.
73. Wang W, Zhao D, Wu J, et al. Changes in knowledge, attitude, and practice of
people with epilepsy and their families after an intervention in rural China. Epilepsy
Behav 2009;16:76-9.
74. Matovu HL. Changing community attitudes towards epilepsy in Uganda. Soc
Sci Med 1974;8:47-50.
53
75. Lee H, Lee SK, Chung CK, Yun SN, Choi-Kwon S. Familiarity with,
knowledge of, and attitudes toward epilepsy among teachers in Korean elementary
schools. Epilepsy Behav 2010;17:183-7.
76. Al-Rashed H, Al-Yahya D, Al-Kandari A, Shehab Aa, Al-Sabah R, Al-Taiar A.
Knowledge of, perceptions of, and attitudes toward epilepsy among university students
in Kuwait. Epilepsy Behav 2009;14:367-71.
77. Canger R, Cornaggia C. Public attitudes toward epilepsy in Italy: results of a
survey and comparison with U.S.A. and West German data. Epilepsia 1985;26:221-6.
78. Panda SB, Prabhu K, Rao S, et al. Evaluation of knowledge of and attitudes
toward epilepsy among the health science students of Manipal University. Epilepsy
Behav 2011;20:447-9.
79. Young GB, Derry P, Hutchinson I, et al. An epilepsy questionnaire study of
knowledge and attitudes in Canadian college students. Epilepsia 2002;43:652-8.
80. Iivanainen M, Uutela A, Vilkkumaa I. Public awareness and attitudes toward
epilepsy in Finland. Epilepsia 1980;21:413-23.
81. Njamnshi AK, Yepnjio FN, Bissek A-CZ-K. A survey of public knowledge,
attitudes, and practices with respect toepilepsy in Badissa village, centre region of
Cameroon. Epilepsy Behav 2009 16:254-9.
82. Njamnshi AK, Tabah EN, Yepnjio FN, et al. General public awareness,
perceptions, and attitudes with respect to epilepsy in the Akwaya Health District, South-
West Region, Cameroon. Epilepsy Behav 2009;15:179-85.
83. Njamnshi AK, Angwafor SA, Tabah EN, Jallon P, Muna WFT. General public
knowledge, attitudes, and practices with respect to epilepsy in the Batibo Health District,
Cameroon. Epilepsy Behav 2009;14:83-8.

54
84. Njamnshi AK, Angwafor SA, Baumann F, Angwafo FF, 3rd, Jallon P, Muna
WFT. Knowledge, attitudes, and practice of Cameroonian medical students and
graduating physicians with respect to epilepsy. Epilepsia 2009;50:1296-9.
85. Njamnshi AK, Angwafor SA, Jallon P, Muna WFT. Secondary school students'
knowledge, attitudes, and practice toward epilepsy in the Batibo Health District--
Cameroon. Epilepsia 2009;50:1262-5.
86. Njamnshi AK, Tabah EN, Bissek A-CZ-K. Knowledge, attitudes and practice
with respect to epilepsy among secondary school students in the Kumbo West Health
District - North West Region- Cameroon. . Epilepsy Behav 2010 18:247-53.
87. Goel D, Dhanai JS, Agarwal A, Mehlotra V, Saxena V. Knowledge, attitude and
practice of epilepsy in Uttarakhand, India: Annals of Indian Academy of Neurology. 14
(2) (pp 116-119), 2011. Date of Publication: April-June 2011.
88. Matuja WB, Rwiza HT. Knowledge, attitude and practice (KAP) towards
epilepsy in secondary school students in Tanzania. Cent Afr J Med 1994;40:13-8.
89. Kankirawatana P. Epilepsy awareness among school teachers in Thailand.
Epilepsia 1999;40:497-501.

55
Chapter 4: Development and validation of the Public Attitudes Toward Epilepsy
(PATE) scale
(Published as Lim KS, Wu C, Choo WY, Tan CT. Development and validation of a
public attitudes toward epilepsy (PATE) scale. Epilepsy & Behavior 2012;24:207-12.)
Abstract
Introduction: A quantitative scale of public attitudes towards epilepsy is essential to
determine the magnitude of social stigma against epilepsy. This study aims to develop
and validate a cross-culturally applicable scale of public attitudes toward epilepsy.
Methods: A set of questions was selected from questionnaires identified from a
literature review, followed by a panel review performed to determine the final version,
consisting of 18 items. A 1-5 Likert scale was used for scoring. Additional questions,
related to perception of the productivity of people with epilepsy and a modified epilepsy
stigma scale, were added as part of construct validation. One hundred and thirty
heterogeneous respondents were collected, consisting of various age groups, ethnicity
and occupation status levels. Results: After item and factor analysis, the final version
consisted of 14 items. Psychometric properties of the scale were first determined using
factor analysis, which revealed a general and a personal domain, with good internal
consistency (Cronbach’s coefficient 0.868 and 0.633, respectively). Construct validation
was demonstrated. The mean score for the personal domain was higher than the general
domain (2.72+0.56 and 2.09+0.59 respectively). The mean scores of those with tertiary
education were significantly lower for the general domain but not the personal domain.
Age was positively correlated with the mean scores in the personal domain but not the
56
general domain. Conclusion: This scale is a reliable and valid scale to assess public
attitudes toward epilepsy, in both the general and personal domains.
Key words: Epilepsy, attitudes, stigma, social stigma, scale
Introduction
Stigma against epilepsy has been accepted as one of the key factors influencing quality
of life for people with epilepsy. 1-4 Stigma against epilepsy is generally based on
stereotypical and uninformed impressions or characterizations of epilepsy. People with
epilepsy tend to be related to an epileptic identity, which is passively accepted as
undesired difference. 5 They are commonly negatively stereotyped as having a socially
discredited personality. 6
Socioeconomically, the stigmatized person experiences discrimination in the working
place, school, and community. Psychologically, those who perceive themselves to be
members of a stigmatized group, whether or not it is acknowledged by others, often
experience psychological distress and many view themselves contemptuously.7 Stigma
often acts as a self-fulfilling prophecy in that those who are stereotyped often start to act
in ways perceived as expected by the stereotyping perceiver. This psychological process
is not limited to change in behaviour, but may also shape emotions and beliefs. In turn,
these stereotypic beliefs become reinforced and further perpetuated by disabilities and
dysfunctional behaviours caused through self-fulfilling prophesy.
A systematic review was performed to understand the scope and extent of studies of
public attitudes towards epilepsy. 8 These studies of public attitudes towards epilepsy

57
typically were conducted both in general populations and in specific groups (e.g.
teachers and students), as well as among epileptic populations, of various ethnicities and
geographical regions. The initial study, done by Caveness in 1949, focused on questions
related to the rights of people with epilepsy to marry, be employed and socially
contacted, and has been widely applied thereafter. However, these studies mostly used a
‘yes’ or ‘no’ format and only direct comparison among groups was possible.
Quantitative study design using a scale allows us to measure the degree of social stigma,
so facilitating the design of interventional strategies to break the stigma cycle of
epilepsy. Up until 2011, ten studies using either Likert’s scale or a scoring system to
measure attitudes towards epilepsy were identified. 9-18 The scales included the
Attitudes and Beliefs about Living with Epilepsy (ABLE) scale 19, the Attitudes Toward
Persons with Epilepsy (ATPE) scale 9,20 the Epilepsy Attitude Scale 15, and the
Elementary School Epilepsy Survey (ESES) 14 for elementary school children.
These scales were factored into negative stereotypes, risk and safety concerns, fear and
social avoidance, and behavioural optimism, as well as social integration. 9,19,20
However, statements on factors like negative stereotypes (for example, “People with
epilepsy are possessed by a supernatural spirit.”) may not prevail in some cultures. Thus,
disagreement with these statements by the majority of the studied population does not
necessarily imply more positive attitudes towards epilepsy in this population. As a result,
these scales may not be suitable for some cultural groups.
Link and Phelan 21 proposed a four-component stigmatization model, inclusive of (1)
Differentiation and labelling: Individuals differentiate and label human variations; (2)
Linking to stereotypes: Prevailing cultural beliefs tie those labelled to adverse attributes;
58
(3) Separation between us and them: Labelled individuals are placed in distinctive
groups that serve to establish a sense of disconnection between "us" and "them"; and (4)
Disadvantage: Labelled individuals experience "status loss and discrimination" that
leads to unequal circumstances. Of these four components, differentiation and labelling,
and stereotyping may vary among different cultures. The third and fourth components,
i.e. separation between us and them, and disadvantage, picture the consequences of
stigmatization, irrespective of the types of differentiation and labelling. Therefore,
statements developed based on these first two components of the stigmatization model,
i.e. differentiation and labelling, and stereotyping, may not be suitable to be applied
universally; whereas statements related to the third and fourth components will do
otherwise.
Most studies on attitudes towards epilepsy included a knowledge component, which is a
broad category including the participant’s exposure to seizures and people with epilepsy
and their perceptions of its causes, manifestations, timeline and consequences. However,
correlation analyses have usually been performed on knowledge as a whole rather than
on individual subcategories. Furthermore, there are marked cultural variations, e.g.
some cultures may consider epilepsy as contagious but others not. However, this
knowledge might change over time e.g. the concept of hereditary following an
exponential development in genetics.
The initial questions on public attitudes towards epilepsy focused on questions requiring
the participants to make a personal judgement. For example, “I would get divorced if
my spouse was diagnosed with epilepsy.” 10 There is a lack of questions enquiring about
general opinions on the right of people with epilepsy to be socially contacted, employed,

59
and educated. This variation in question design is expected to enable us to understand a
broader spectrum of stigmatization, from a general as well as personal perspective.
The Epilepsy Attitude Scale 15 factored the scale according to positive and negative
attitudes. In general, negatively phrased statements tend to encourage negative attitude
expression as disagreeing with a negatively phrased statement is cognitively a complex
task. Thus, including both positive and negatively phrased statements in the same scale
will allow us to capture a broader range of response. However, instead of factoring the
scale into two separate components, it would be more appropriate to combine both
positively and negatively phrased items using a reverse scoring for one component
because of its similar context of measurement.
In this study, we aimed to develop a scale measuring public attitudes towards epilepsy,
which can be applied cross-culturally as characterized by: (1) including statements
related to separation and disadvantages in Link’s stigmatization model 21, (2) excluding
questions testing the participants’ knowledge and perception of epilepsy, (3) including
statements of general opinions about epilepsy as well as statements requiring personal
judgement, and (4) including both positively and negatively phrased statements.
Methodology
1. Scale Development
The scale was developed in three phases: (1) formative research and concept
development; (2) item development; (3) data collection, reliability and validity testing.
Phase one included a review of literature on attitudes towards epilepsy published before

60
May 2011. 8 In phase 2, a set of 52 items, assessing the separation and disadvantages of
people with epilepsy, were selected from the reviewed literature. These items focused
on social restriction of people with epilepsy, specifically related to education,
employment, personal and marital relationship. These items were reviewed by a panel
of neurologists, leading to a set of 18 items that were judged unambiguous, non-
redundant and that elicited relatively extreme responses.
These items were conceptualized into two components. The first component consisted
of items requiring long term or higher level of commitment, e.g. marrying with or
employing someone with epilepsy. The second component assessed respondents’
opinions which required lower level of personal commitment, e.g. social contact with
PWE or general opinions regarding the human rights of PWE. Conceptualization of the
items into two components was expected to provide an understanding of public attitudes
towards epilepsy from two different perspectives. The first perspective is the
understanding of actual stigmatization using items requiring consideration of higher
personal commitment but the response will tend to be skewed; whereas it was expected
that items requiring a general opinion would elicit a less skewed response.
These items were then randomly arranged and a 5-point Likert scale was added with 1
being strongly disagree and 5 being strongly agree, chosen because scales with five to
seven options are more valid than those with fewer options. 22 In addition, a scale with a
middle point, indicating neutral in opinion, was chosen to ensure the accuracy of
information collected and to prevent social desirable effect, though certain respondents
might tend to be neutral in most items. To prevent this, the respondents are encourage to
make a stand in as many items as possible. The score for all positively stated items, e.g.
“People with epilepsy have the same rights as all people.” were reversed, so that the
61
weighted sums of the items provide a measure of the respondent’s attitudes towards
epilepsy, with a higher score indicating a more negative attitude.
2. Sample recruitment
Selective (diversity) sampling of 130 respondents was performed in Petaling Jaya and
Kuala Lumpur in Malaysia after approval from the ethics committees at the University
Malaya Medical Center (MEC Ref No: 878.10). Petaling Jaya and Kuala Lumpur were
selected because they are two of the urban cities with highest population density, rural-
to-urban migration, and highest number of foreigners. Diversity sampling in these cities
allowed data collection from different age groups, ethnicities, and socio-economic status
levels, including a subset of foreigners. Written consents were obtained. All
questionnaires were administered anonymously.
3. Measures
Demographic data were also collected on the respondent’s gender, age, ethnicity,
marital status, education and employment status, current monthly income, and presence
of family member(s) with epilepsy or seizures. The instructions emphasized that the
scale was not a test, but rather an opinion questionnaire.
Three questions related to perception of the unproductivity of people with epilepsy were
added, as part of testing for construct validity. (Appendix 1) A 5-point Likert scale was
added to these questions with 1 representing ‘strongly disagree’ and 5 ‘strongly agree’.
A higher score indicated a stronger perception of people with epilepsy being
unproductive.
62
The epilepsy stigma scale is a 3-item scale assessing the patient’s perception of stigma
23, using a 5-point Likert scale. It is a validated scale to determine the perceived stigma
against people with epilepsy. The statements were mirrored to be answered by someone
without epilepsy. (Appendix 1) This mirror version was established to provide a
measure of social stigma, for testing construct validity. A higher score indicated a
higher level of social stigma towards people with epilepsy.
4. Statistical analysis
This study employed the Statistical Package for Social Sciences version 19 (SPSS 19.0)
for data analyses. All demographic data was analyzed descriptively and presented as
frequencies as well as percentages. For continuous data, independent t-tests were used
for group comparison.
Psychometric properties of the scale
Exploratory factor analysis
Exploratory factor analysis was conducted to determine how well the factor structure
revealed fitted with the original concepts identified as potential components of an
attitude towards epilepsy. 24 First, a scree test was used to determine how many
components should be formed. Correlation matrices were then used to understand the
relationships between items. Variance accounted for by each of the items within these
measures was assessed using extraction communalities, and any items with extraction
communalities below 0.2 at this stage were dropped from further analysis. Factor

63
extraction provided loading values to indicate the degree of involvement of items in
each factor pattern. Following initial factor extraction, an oblimin rotation with Kaiser
Normalization was used to transform the original matrices for easier interpretation. The
post-rotation factor loadings measure the importance of an item within each factor and
therefore were used to determine the items contributing to each factor. Items were
considered acceptable and retained if the loading coefficient was 0.4 or greater and
differences of at least 0.2 existed between the loadings on the two factors. Items
loading on more than one factor were ascribed to the factor for which the loading
coefficient was highest. Correlation matrices were examined to look for correlations ≥
0.9, which indicates item redundancy. Observation of the high loading items enabled
interpretation and naming of the final components of the scale.
Reliability
Item analysis, by calculating the Cronbach’s α value, was used to assess the internal
consistency of the overall scale and its components. Cronbach’s α values of 0.7 to 0.9
are considered acceptable 25; whereas values of 0.6 to 0.7 are considered satisfactory.
Test-retest reliability was not included as a measure of reliability, as it may
underestimate the degree of reliability of measurements over time by interpreting true
change as measurement instability. 26 Mean inter-item correlation was used if α values
were below 0.7, and a range of 0.2 to 0.4 was taken to indicate that items were
measuring the same construct. 27

64
Validity
Construct validity was assessed, given that there is no “gold standard” for the
measurement of public attitudes towards epilepsy. Three a priori predictions were made
based on hypothesized theory that, if upheld, would offer support of construct validity:
(1) subjects who perceived people with epilepsy as being less productive would have
overall more negative attitudes towards epilepsy; (2) subjects who had a higher stigma
score using the modified Jacoby’s stigma scale would have more negative attitudes
towards epilepsy, and (3) subjects who had a lower education level would have more
negative attitudes towards epilepsy. Pearson correlation was used to test the first two
predictions and coefficients of 0.5 to 1.0 were accepted as supportive of construct
validity. 28 Convergent validity was assessed by testing the correlation between the
score on each component and the total score.
Results
Demographic characteristics of the sample
A total of 130 respondents were recruited from the public, caregivers of persons with
epilepsy, and medical personnel. The mean age of the respondents was 41.4 + 14.6
years, ranging from 19 to 74 years. The respondents were almost equally distributed in
gender, with slightly higher proportions of Malay and Chinese compared to other ethnic
groups. More than half were married (56.9%), with a tertiary education level (54.7%),
and had fulltime employment (58.5%). Approximately 9.2% of the respondents had
family member(s) with epilepsy or seizures (See Table 4-1).
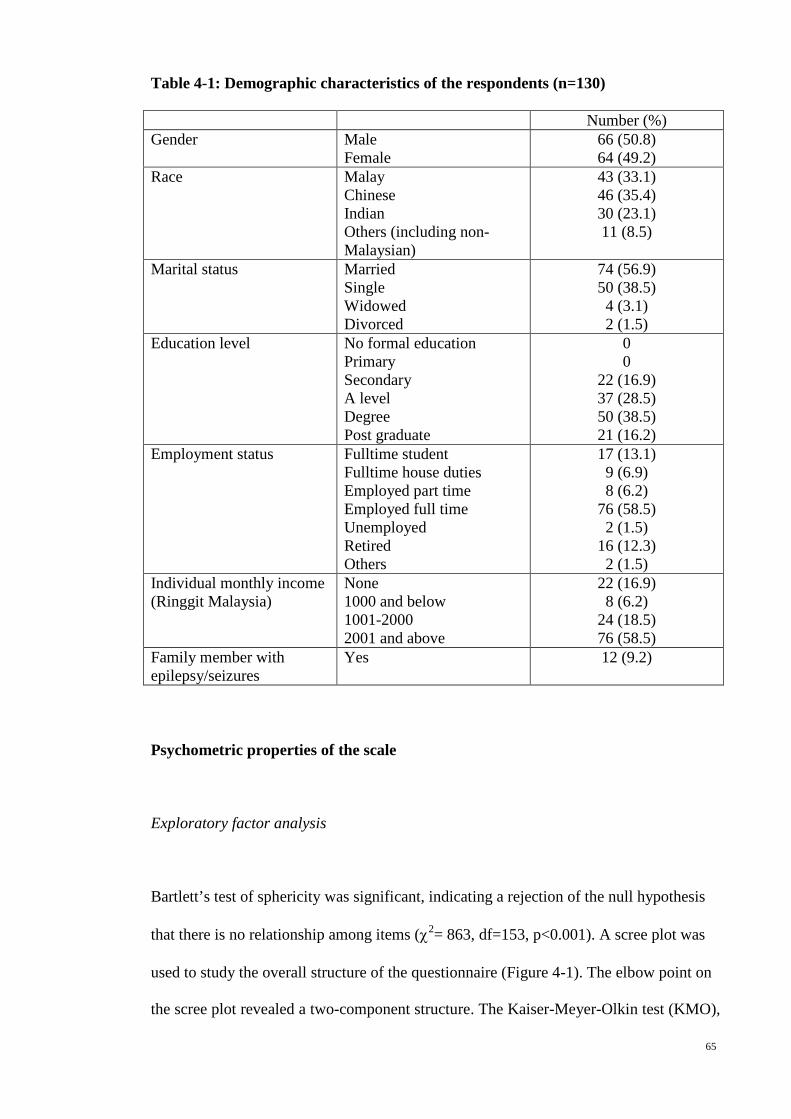
65
Table 4-1: Demographic characteristics of the respondents (n=130)
Number (%) Gender Male
Female 66 (50.8) 64 (49.2)
Race Malay Chinese Indian Others (including non-Malaysian)
43 (33.1) 46 (35.4) 30 (23.1) 11 (8.5)
Marital status Married Single Widowed Divorced
74 (56.9) 50 (38.5) 4 (3.1) 2 (1.5)
Education level No formal education Primary Secondary A level Degree Post graduate
0 0
22 (16.9) 37 (28.5) 50 (38.5) 21 (16.2)
Employment status Fulltime student Fulltime house duties Employed part time Employed full time Unemployed Retired Others
17 (13.1) 9 (6.9) 8 (6.2)
76 (58.5) 2 (1.5)
16 (12.3) 2 (1.5)
Individual monthly income (Ringgit Malaysia)
None 1000 and below 1001-2000 2001 and above
22 (16.9) 8 (6.2)
24 (18.5) 76 (58.5)
Family member with epilepsy/seizures
Yes
12 (9.2)
Psychometric properties of the scale
Exploratory factor analysis
Bartlett’s test of sphericity was significant, indicating a rejection of the null hypothesis
that there is no relationship among items (χ2= 863, df=153, p<0.001). A scree plot was
used to study the overall structure of the questionnaire (Figure 4-1). The elbow point on
the scree plot revealed a two-component structure. The Kaiser-Meyer-Olkin test (KMO),

66
a measure of sampling adequacy that tests the strength of partial correlations among
variables when the linear effects of items have been removed, showed a KMO estimate
of 0.841, exceeding the criterion of ≥0.7.
Figure 4-1: Scree plot of the items related to attitudes towards epilepsy.
No items were excluded because of low extraction communalities (below 0.2). Using an
oblimin rotation with Kaiser Normalization for a two-factor model, these items were
loaded into two domains with nine and five items respectively, as shown in Table 4-2
with the factor loadings of each item. Items 2, 5, 10 and 18 were excluded because they
failed to reach the 0.4 cut-off in the rotated factor matrix. Correlation matrices showed
none of the correlations was beyond the 0.9 range that would have indicated item
redundancy.
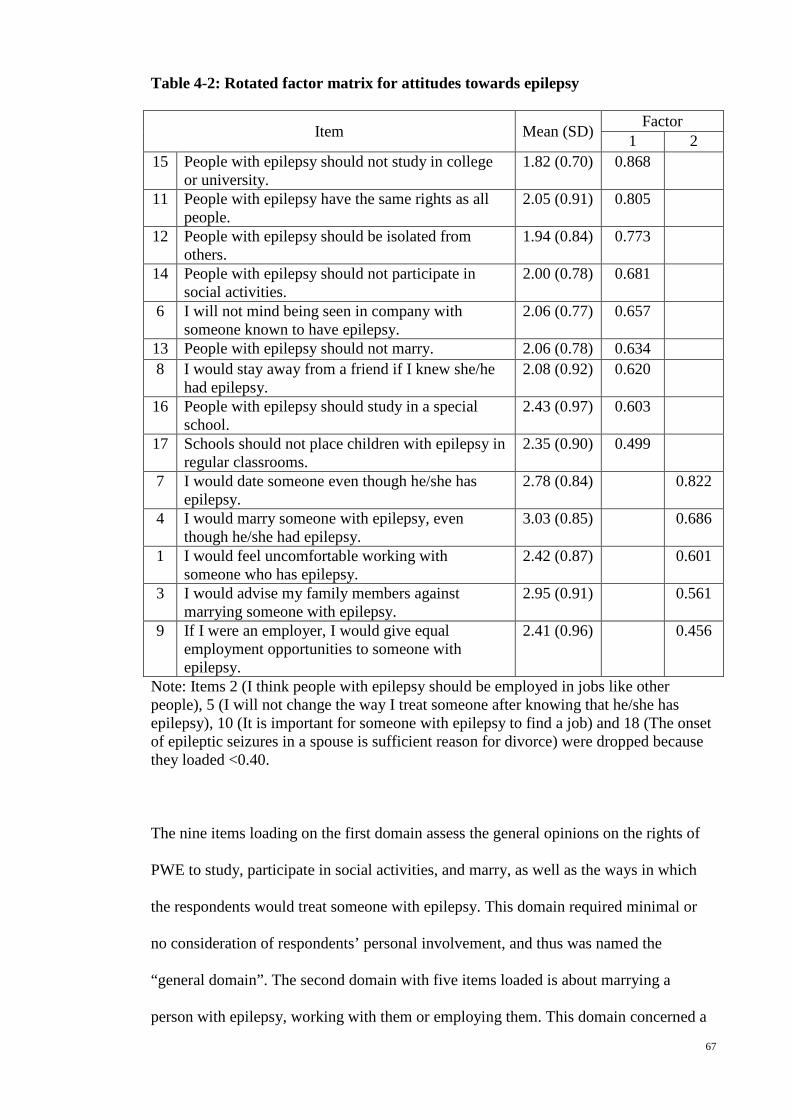
67
Table 4-2: Rotated factor matrix for attitudes towards epilepsy
Item Mean (SD) Factor 1 2
15 People with epilepsy should not study in college or university.
1.82 (0.70) 0.868
11 People with epilepsy have the same rights as all people.
2.05 (0.91) 0.805
12 People with epilepsy should be isolated from others.
1.94 (0.84) 0.773
14 People with epilepsy should not participate in social activities.
2.00 (0.78) 0.681
6 I will not mind being seen in company with someone known to have epilepsy.
2.06 (0.77) 0.657
13 People with epilepsy should not marry. 2.06 (0.78) 0.634 8 I would stay away from a friend if I knew she/he
had epilepsy. 2.08 (0.92) 0.620
16 People with epilepsy should study in a special school.
2.43 (0.97) 0.603
17 Schools should not place children with epilepsy in regular classrooms.
2.35 (0.90) 0.499
7 I would date someone even though he/she has epilepsy.
2.78 (0.84) 0.822
4 I would marry someone with epilepsy, even though he/she had epilepsy.
3.03 (0.85) 0.686
1 I would feel uncomfortable working with someone who has epilepsy.
2.42 (0.87) 0.601
3 I would advise my family members against marrying someone with epilepsy.
2.95 (0.91) 0.561
9 If I were an employer, I would give equal employment opportunities to someone with epilepsy.
2.41 (0.96) 0.456
Note: Items 2 (I think people with epilepsy should be employed in jobs like other people), 5 (I will not change the way I treat someone after knowing that he/she has epilepsy), 10 (It is important for someone with epilepsy to find a job) and 18 (The onset of epileptic seizures in a spouse is sufficient reason for divorce) were dropped because they loaded <0.40.
The nine items loading on the first domain assess the general opinions on the rights of
PWE to study, participate in social activities, and marry, as well as the ways in which
the respondents would treat someone with epilepsy. This domain required minimal or
no consideration of respondents’ personal involvement, and thus was named the
“general domain”. The second domain with five items loaded is about marrying a
person with epilepsy, working with them or employing them. This domain concerned a
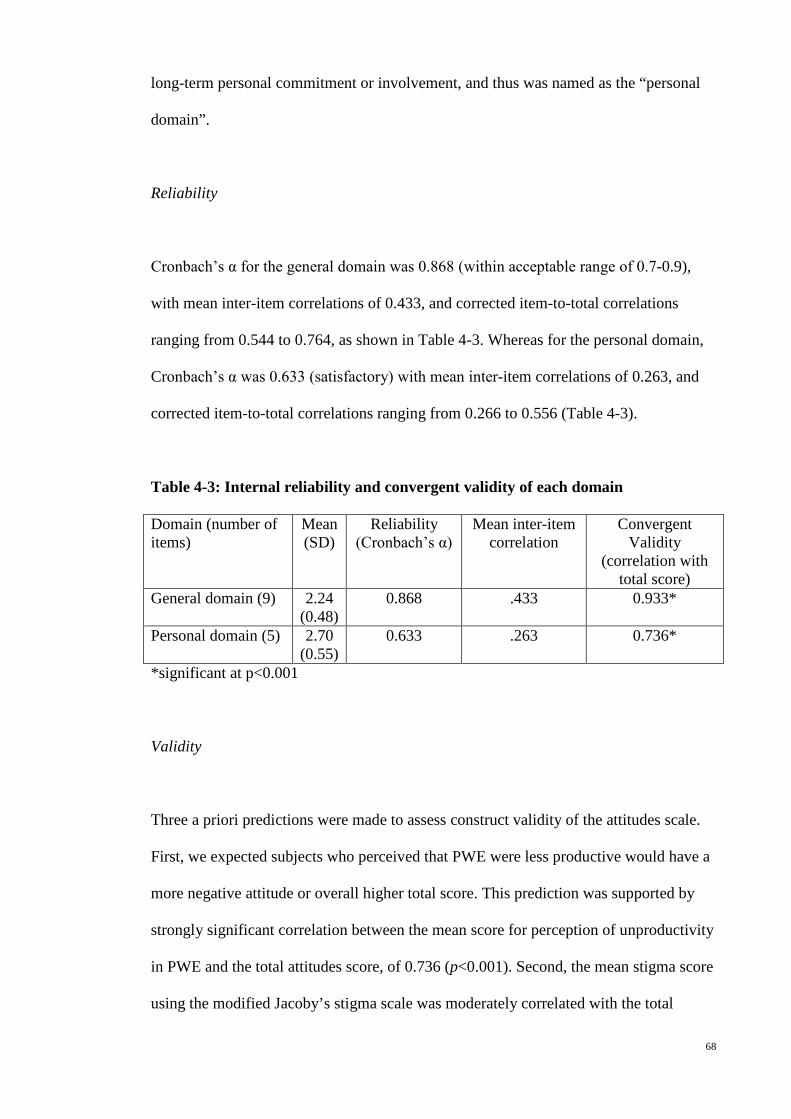
68
long-term personal commitment or involvement, and thus was named as the “personal
domain”.
Reliability
Cronbach’s α for the general domain was 0.868 (within acceptable range of 0.7-0.9),
with mean inter-item correlations of 0.433, and corrected item-to-total correlations
ranging from 0.544 to 0.764, as shown in Table 4-3. Whereas for the personal domain,
Cronbach’s α was 0.633 (satisfactory) with mean inter-item correlations of 0.263, and
corrected item-to-total correlations ranging from 0.266 to 0.556 (Table 4-3).
Table 4-3: Internal reliability and convergent validity of each domain
Domain (number of items)
Mean (SD)
Reliability (Cronbach’s α)
Mean inter-item correlation
Convergent Validity
(correlation with total score)
General domain (9) 2.24 (0.48)
0.868 .433 0.933*
Personal domain (5) 2.70 (0.55)
0.633 .263 0.736*
*significant at p<0.001
Validity
Three a priori predictions were made to assess construct validity of the attitudes scale.
First, we expected subjects who perceived that PWE were less productive would have a
more negative attitude or overall higher total score. This prediction was supported by
strongly significant correlation between the mean score for perception of unproductivity
in PWE and the total attitudes score, of 0.736 (p<0.001). Second, the mean stigma score
using the modified Jacoby’s stigma scale was moderately correlated with the total
69
attitude score with a Pearson correlation coefficient of 0.589 (p<0.001), supporting the
second prediction. Third, those with education level less than tertiary level had a higher
mean total attitude score, as compared to those with tertiary education level and above
(2.42 + 0.40 vs. 2.22 + 0.56 respectively, p-value < 0.05), supporting the third
prediction.
Convergent validity was demonstrated, as evidenced by strong and significant
correlations between the individual domains and the total attitudes score (r=0.933 and
0.736, p<0.001, for the general and personal domains respectively, as shown in table 4-
3).
Factor scores by domains and demographic characteristics
Mean scores were calculated for each domain, with a possible range from 1 to 5. Higher
scores indicated more negative attitudes. The mean and standard deviation of the total
score was 2.31 + 0.50. The mean score for the personal domain was higher than for the
general domain (2.72+0.56 and 2.09+0.59 respectively).
The mean scores for the general domain were shown by t-test to be significantly lower
in those with tertiary education (p<0.001), but did not differ by age, gender, marital
status, employment status, monthly income or family history. For the personal domain,
age significantly predicted mean scores. Persons with single marital status had lower
mean scores in the personal domain (p<0.05) but no significant difference was observed
for the general domain. (Table 4-4)

70
Table 4-4: Mean scores by domains and demographic characteristics (n=130)
Variable Group (n) General domain Personal domain Age1
-0.062 0.175*
Mean score (SD) Mean score (SD) Gender
Male (66) Female (64)
2.10 (0.58) 2.07 (0.60)
2.75 (0.56) 2.68 (0.58)
Marital status
Single (50) Others (80)
2.14 (0.65) 2.05 (0.55)
2.58 (0.62) 2.81 (0.51)*
Education level Tertiary (71) Others (59)
1.96 (0.62) 2.24 (0.51)**
2.68 (0.65) 2.76 (0.43)
Employment status Employed full time (76)
Others (54)
2.09 (0.61) 2.09 (0.57)
2.71 (0.55) 2.73 (0.59)
Monthly income in Ringgit Malaysia
2000 and above (76) Others (54)
2.03 (0.59) 2.17 (0.59)
2.74 (0.59) 2.68 (0.53)
Family member with epilepsy/seizures
Yes (12) No (118)
2.08 (0.54) 2.09 (0.60)
2.80 (0.61) 2.71 (0.56)
1Based on Pearson correlations *p-value is < 0.05 **p-value is <0.001 Discussion
The PATE scale was developed in response to a need for a brief, quantitative, easy-to-
use, and psychometrically sound tool to measure public attitudes towards epilepsy,
which can be employed in various cultural groups. Findings from the analysis
confirmed that the attitude scale has good item properties, and is valid and reliable.
After item and factor analysis, four items were omitted. The final version consisted of
14 items. Factor analysis revealed two spectrums of stigmatization, a “general domain”
with minimal personal commitment and a “personal domain” which requires long-term
commitment. Factor loadings were high on each dominant factor and low on the
nondominant factor. Statistical tests indicated the data was factorable based on
sufficient sample size relative to the number of items on our scale. 29 None of the
interitem correlations within each factor had correlation coefficients above 0.8,
supportive of the claim that there is no significant redundancy. Each subscale
71
demonstrated acceptable internal consistency, with Cronbach’s α of the general domain
within an acceptable range of 0.7 to 0.9, and Cronbach’s α of the personal domain
within a satisfactory range of 0.6 to 0.7.
Factor scores differed by domains. In previous studies without a general and personal
dichotomy, people from rural areas with lower educational level and socioeconomic
status have been found to have more negative attitudes towards epilepsy. 18,30-38 Other
factors include old age 34-36,39, male gender 32,33,37, female gender 35, being single 37, and
Hindu ethnicity. 40 In the current study, attitudes towards epilepsy in each demographic
group differed by domain assessed. Age was found to be positively correlated with
attitude scores in the personal domain, but not in the general domain. That is to say,
older participants gave higher scores indicating a less favourable attitude when relating
to epilepsy in a personal context. In the general context however, there seemed to be no
difference in attitude relating to age. In addition, participants with higher education
displayed better attitudes towards epilepsy in the general domain but this difference in
attitude was not observed in the personal domain.
Increased levels of stigma expressed by the older participants in the current study may
be explained by Socioemotional Selectivity Theory 41, which posits differences in
selecting social network composition and social preferences based on increasing
chronological age. With advancing age, perception of the limitation on time leads to
psychological and emotional needs to optimize one’s social network units. Pruning of
the compositional units in one’s social network may occur resulting in a smaller social
circle with increased emotional bonding. Older participants may be more stigmatized
towards those with epilepsy in context of their personal association but not in general
perception, due to this selection process.
72
With respects to the relationship found between increased education and better general
attitudes towards epilepsy patients, the current results seem to support previous stigma
research conducted in the area of chronic illnesses such as HIV/AIDS 42, whereby
effectiveness in reducing stigma is achieved to various degrees through increased
education in forms of information and exposure.
It is of note however, that while this positive correlation was observed, it was confined
to the general domain and no such relationship was found in the personal domain. This
seems to suggest an isolation of generalized knowledge-based attitude from an
interpersonal emotion-based attitude in the perception of sufferers of epilepsy. A
plausible explanation of this finding may lie in Evolutionary Psychology and its
conceptualization of stigma. Past research has proposed through the notion of natural
selection, the unique function of the formation of stigmas in achieving optimum genetic
material for the survival of future progeny 43. Therefore in contexts of personal contact
and socialization, increased education had no effect on personal attitude.
Limitations of the study
This study may be biased by only being performed in an urban city in Malaysia.
However, a selective sampling was performed with the aim to include a broad category
in each demographic variable to overcome selection bias. From the demographic data,
about 40% of the respondents had an education level below tertiary and an income less
than RM2000 a month, which can categorize them into the lower socio-economic group.

73
Further studies using the scale to assess attitudes to people with epilepsy using an
adequate sample of a known population are requied to provide further validation.
A second limitation was that the scale requires English fluency, reading comprehension,
and functional capacity, which may have excluded non-English-speaking population,
and adults with limited education. Malaysia is a multi-ethnic country, using various
languages in daily life. There might be cultural differences between groups using
different languages. Further research could investigate this
Two validity measures, i.e. perception of the productivity of people with epilepsy and a
modified epilepsy stigma scale, were initially used in this study to determine the
construct validity. However, on retrospective review, these two measures, though
measuring different aspects of social stigma, were not ideal because of their similarities
in content with the attitude scale. A high correlation may reflect shared biases. Thus, a
third hypothesis, i.e. subjects who had a lower education level would have more
negative attitudes towards epilepsy, was added to strengthen the construct validity.
Study implications
In order to overcome the shadow of stigmatization, we need an effective tool to measure
the degree of social stigma cross-sectionally as well as longitudinally. Using Link’s
stigmatization model as a guide, items with least cultural influence were selected, so
that the scale can be applied cross-culturally and allows comparison between various
populations. With its convenient size of only 14 items, together with its reliability and
validity, the usefulness of the scale in measuring the attitudes towards epilepsy
quantitatively is fully supported.
74
Variation in attitude scores between the personal and general domains has not been
reported before. This might explain the variation in results from previous studies on
public attitudes towards epilepsy, when different questions were used. In addition, this
finding provides a reason to study the underlying social and psychological factors
affecting social stigma not only from the general perspective, but also from an
individual perspective.
Knowledge about epilepsy has been shown to be an important factor in reducing the
degree of discrimination and negative attitudes toward epilepsy. 18,31-36,39 Intervention
studies using educational programs about epilepsy have found significant improvement
in attitudes towards epilepsy among the educated. However, as people with higher
education were found to have better attitudes towards epilepsy in the general domain
but not in the personal domain, the improvement in the attitudes with educational
programs might have been limited to attitudes in the general domain. This question
requires further research.
Conclusion
A scale assessing public attitudes towards epilepsy was developed using criteria that
allow it to be applied in various cultural groups. This study has demonstrated that it is a
psychometrically valid and reliable tool for measuring public attitudes towards epilepsy
in both the general and personal perspectives.
75
References
1. Jacoby A, Baker GA, Steen N, Potts P, Chadwick DW. The clinical course of
epilepsy and its psychosocial correlates: findings from a U.K. Community study.
Epilepsia 1996;37:148-61.
2. Kleinman A, Wang WZ, Li SC, et al. The social course of epilepsy: chronic
illness as social experience in interior China. Soc Sci Med 1995;40:1319-30.
3. Jacoby A. Felt versus enacted stigma: a concept revisited. Evidence from a study
of people with epilepsy in remission. Social Science Medicine 1994;38:269-74.
4. Baker GA, Brooks J, Buck D, Jacoby A. The stigma of epilepsy: a European
perspective. Epilepsia 2000;41:98-104.
5. Scambler G. Health-related stigma. Sociol Health Illn 2009;31:441-55.
6. Fenton G. Epilepsy. In: Lader M, ed. Handbook of psychiatry 2: mental disorder
and somatic illness. Cambridge: Cambridge University Press; 1983:147-85.
7. Heatherton TF, Kleck RE, Hebl MR, Hull JG. The social psychology of stigma.
New York: The Guilford Press; 2003.
8. Lim KS, Lim CH, Tan CT. Attitudes toward epilepsy, a systematic review.
Neurol Asia 2011;16:269-80.
9. Lee SA, Yim SB, Rho YI, et al. Factors contributing to Korean teachers'
attitudes toward students with epilepsy. Epilepsy Behav 2011;20:378-81.
10. Kobau R, DiIorio CA, Anderson LA, Price PH. Further validation and reliability
testing of the Attitudes and Beliefs about Living with Epilepsy (ABLE) components of
the CDC Epilepsy Program Instrument on Stigma. Epilepsy Behav 2006;8:552-9.
11. Yoo JK, Jung KY, Park KW, et al. Familiarity with, understanding of, and
attitudes toward epilepsy among people with epilepsy and healthy controls in South
Korea. Epilepsy Behav 2009;16:260-7.
76
12. Bishop M, Slevin B. Teachers' attitudes toward students with epilepsy: results of
a survey of elementary and middle school teachers. Epilepsy Behav 2004;5:308-15.
13. Bishop M, Boag EM. Teachers' knowledge about epilepsy and attitudes toward
students with epilepsy: results of a national survey. Epilepsy Behav 2006;8:397-405.
14. Lowe-Pearce C, Camfield CS. Elementary school epilepsy survey (ESES): a
new measure of elementary school students' knowledge and attitudes about epilepsy.
Epilepsy Behav 2005;7:687-96.
15. Aydemir N. Familiarity with, knowledge of, and attitudes toward epilepsy in
Turkey. Epilepsy & Behavior 2011;20:286-90.
16. Diamantopoulos N, Kaleyias J, Tzoufi M, Kotsalis C. A survey of public
awareness, understanding, and attitudes toward epilepsy in Greece. Epilepsia
2006;47:2154-64.
17. Martiniuk A, Speechley K, Secco M, Karen Campbell M. Development and
psychometric properties of the Thinking about Epilepsy questionnaire assessing
children's knowledge and attitudes about epilepsy. Epilepsy Behav 2007;10:595-603.
18. Neni SW, Latif AZA, Wong SY, Lua PL. Awareness, knowledge and attitudes
towards epilepsy among rural populations in East Coast Peninsular Malaysia: a
preliminary exploration. Seizure 2010;19:280-90.
19. Kobau R, Price P. Knowledge of epilepsy and familiarity with this disorder in
the US population: Results from the 2002 HealthStyles Survey. Epilepsia
2003;44:1449-54.
20. Antonak RF. Psychometric analysis and validation of the scale of Attitudes
Toward Persons with Epilepsy. J Epilepsy 1990;3:11-6.
21. Link BG, Phelan JC. Conceptualizing Stigma. Annu Rev Sociol 2001:363-85.
22. Aday LA. Designing and conducting health surveys. San Francisco: Jossey-Bass;
1996.
77
23. Jacoby A. Felt versus enacted stigma: a concept revisited. Evidence from a study
of people with epilepsy in remission. Soc Sci Med 1994;38:269-74.
24. Tabachnick BG, Fidell LS. Using multivariate statistics. 3rd ed. New York:
Harper Collins1996.
25. DeVellis RF. Scale development: Theory and applications 2nd ed. Thousand
Oaks, California: Sage; 2003.
26. Carmines EG, Zeller RA. Reliability and validity assessment. Newbury Park,
CA: Sage; 1979.
27. Briggs SR, Cheek JM. The role of factor analysis in the development and
evaluation of personality traits. J Pers 1986;54:106-48.
28. Cohen JW. Statistical power analysis for the behavioral sciences. 2nd ed.
Hillsdale, NJ: Lawrence Erlbaum Associates; 1988.
29. Pett MA, Lackey NR, Sullivan JJ. Assessing the characteristics of matrices. . In:
Pett MA, Lackey NR, Sullivan JJ, eds. Making sense of factor analysis: the use of factor
analysis for instrument development in health care research Thousand Oaks, CA: Sage;
2003:51-84.
30. Tekle-Haimanot R, Abebe M, Forsgren L, et al. Attitudes of rural people in
central Ethiopia towards epilepsy. Soc Sci Med 1991;32:203-9.
31. Saengpattrachai M, Srinualta D, Lorlertratna N, Pradermduzzadeeporn E,
Poonpol F. Public familiarity with, knowledge of, and predictors of negative attitudes
toward epilepsy in Thailand. Epilepsy Behav 2010;17:497-505.
32. Kim MK, Kim IK, Kim BC, Cho KH, Kim SJ, Moon JD. Positive trends of
public attitudes toward epilepsy after public education campaign among rural korean
residents. J Korean Med Sci 2003;18:248-54.
78
33. Spatt J, Bauer G, Baumgartner C, et al. Predictors for negative attitudes toward
subjects with epilepsy: a representative survey in the general public in Austria.
Epilepsia 2005;46:736-42.
34. Hasan SS, Alen YKS, Wayne WGW, Ahmadi K, Anwar M, Goh GK.
Understanding of and attitudes toward epilepsy among the urban Chinese population in
Malaysia. Singap Med J 2010;51:290-9.
35. Mecarelli O, Capovilla G, Romeo A, Rubboli G, Tinuper P, Beghi E. Past and
present public knowledge and attitudes toward epilepsy in Italy. Epilepsy Behav
2010;18:110-5.
36. McEwan L, Taylor J, Casswell M, et al. Knowledge of and attitudes expressed
toward epilepsy by carers of people with epilepsy: a UK perspective. Epilepsy Behav
2007;11:13-9.
37. Lim KS, Tan LP, Lim KT, Tan CT. Survey of public awareness, understanding,
and attitudes toward epilepsy among Chinese in Malaysia. Neurology Journal of
Southeast Asia 1999;4:31-6.
38. Santos IC, Guerreiro MM, Mata A, et al. Public awareness and attitudes toward
epilepsy in different social segments in Brazil. Arq Neuropsiquiatr 1998;56:32-8.
39. Hills MD, MacKenzie HC. New Zealand community attitudes toward people
with epilepsy. Epilepsia 2002;43:1583-9.
40. Youssef FF, Dial S, Jaggernauth N, et al. Knowledge of, attitudes toward, and
perceptions of epilepsy among college students in Trinidad and Tobago. Epilepsy
Behav 2009;15:160-5.
41. Carstensen LL, Isaacowitz DM, Charles ST. Taking time seriously. A theory of
socioemotional selectivity. Amer Psychol 1999;54:165-81.
42. Brown L, Macintyre K. Interventions to reduce HIV/AIDS stigma: What have
we learned? AIDS Educ Prev 2003;15:49-69.
79
43. Kurzban R, Leary MR. Evolutionary origins of stigmatization: The functions of
social exclusion. Psychol Bull 2001;127:187-208.
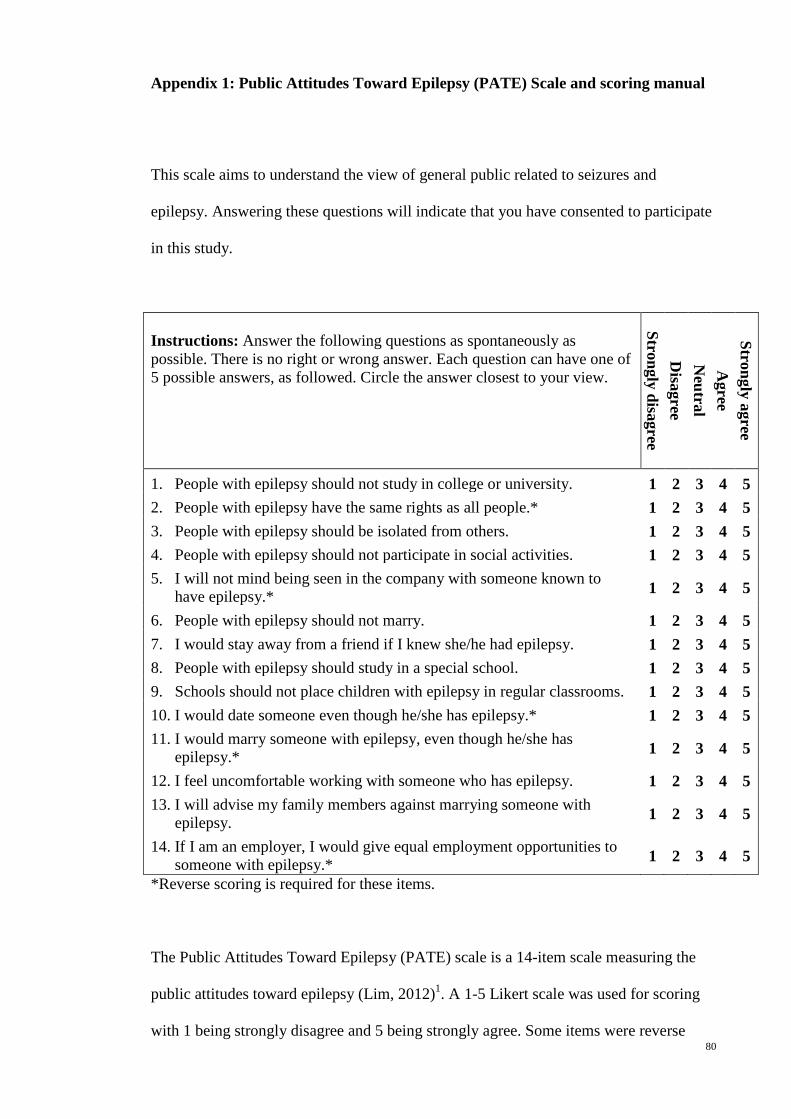
80
Appendix 1: Public Attitudes Toward Epilepsy (PATE) Scale and scoring manual
This scale aims to understand the view of general public related to seizures and
epilepsy. Answering these questions will indicate that you have consented to participate
in this study.
Instructions: Answer the following questions as spontaneously as possible. There is no right or wrong answer. Each question can have one of 5 possible answers, as followed. Circle the answer closest to your view.
Strongly disagree D
isagree N
eutral A
gree Strongly agree
1. People with epilepsy should not study in college or university. 1 2 3 4 5 2. People with epilepsy have the same rights as all people.* 1 2 3 4 5 3. People with epilepsy should be isolated from others. 1 2 3 4 5 4. People with epilepsy should not participate in social activities. 1 2 3 4 5 5. I will not mind being seen in the company with someone known to
have epilepsy.* 1 2 3 4 5
6. People with epilepsy should not marry. 1 2 3 4 5 7. I would stay away from a friend if I knew she/he had epilepsy. 1 2 3 4 5 8. People with epilepsy should study in a special school. 1 2 3 4 5 9. Schools should not place children with epilepsy in regular classrooms. 1 2 3 4 5 10. I would date someone even though he/she has epilepsy.* 1 2 3 4 5 11. I would marry someone with epilepsy, even though he/she has
epilepsy.* 1 2 3 4 5
12. I feel uncomfortable working with someone who has epilepsy. 1 2 3 4 5 13. I will advise my family members against marrying someone with
epilepsy. 1 2 3 4 5
14. If I am an employer, I would give equal employment opportunities to someone with epilepsy.* 1 2 3 4 5
*Reverse scoring is required for these items.
The Public Attitudes Toward Epilepsy (PATE) scale is a 14-item scale measuring the
public attitudes toward epilepsy (Lim, 2012)1. A 1-5 Likert scale was used for scoring
with 1 being strongly disagree and 5 being strongly agree. Some items were reverse

81
scored so that a higher score would indicate a more negative attitude. This scale was
performed in a general population and factored into two domains, i.e. a general domain
(items 1-9) that required minimal or no consideration of respondents’ involvement, and
a personal domain (items 10-14) that required a long-term personal commitment or
involvement. This is a validated scale with good internal consistency (Cronbach’s alpha
of 0.868 and 0.633, in the general and personal domains respectively).
Reference
1. Lim KS, Wu C, Choo WY, Tan CT. Development and validation of a Public
Attitudes Towards Epilepsy (PATE) scale. Epilepsy & Behavior 2012;24:207-12.
82
Appendix 2: Additional questions for construct validity.
Modified epilepsy stigma scale
1. I think people with epilepsy are inferior.
2. I am uncomfortable with people with epilepsy.
3. I would prefer to avoid people with epilepsy.
Perceptions of people with epilepsy being unproductive
1. People with epilepsy usually fail to reach the required standards of society.
2. People with epilepsy have low productivity.
3. People with epilepsy are not able to assume responsibility.
83
Chapter 5: Malay Public Attitudes Toward Epilepsy (PATE) scale: translation and
psychometric evaluation
(Published as KS Lim, Choo WY, Wu C, Tan CT. Malay Public Attitudes Toward
Epilepsy (PATE) scale: translation and psychometric evaluation. Epilepsy & Behavior
2013; 29 (2):395-9.)
Abstract
Introduction: None of the quantitative scale for public attitudes toward epilepsy was
translated to Malay language. This study aimed to translate and test the validity and
reliability of a Malay version of the Public Attitudes Toward Epilepsy (PATE) scale.
Method: The translation was performed according to standard principles and tested in
140 Malay-speaking adults aged more than 18 years for psychometric validation.
Results: The items in each domain had similar standard deviations (equal item
variance), ranged from 0.90-1.00 in personal domain and 0.87-1.23 in general domain.
The correlation between an item and its domain was 0.4 and above for all, and higher
than the correlation with the other domain. Multitrait analysis showed the Malay PATE
had a similar variance, floor and ceiling effects, and relative relationship between the
domains, as the original PATE. The Malay PATE scale showed a similar correlation
with almost all demographic variable except age. Item means were generally clustered
in the factor analysis as hypothesized, except item 1 and 2. The Cronbach’s α values
was within acceptable range (0.757 and 0.716 for the general and personal domains,
respectively). Conclusion: The Malay PATE scale is a validated and reliable translated
version in measuring the public attitudes toward epilepsy.
Keywords: Malay, PATE scale, attitudes, epilepsy, public
84
Introduction
People with epilepsy are burdened by a multitude of social, psychological and economic
consequences of stigmatization which leads to poor quality of life.1,2 There are great
variations in social stigma among various countries, ethnicities and cultural groups,
affected by various socio-economic and cultural factors. Assessment of the public
attitudes toward epilepsy is therefore best conducted in local languages.
Majority of the Malaysian population is Malay (50.4%) and most Malaysians speak the
Malay language, which is the national language. Surveys on public attitudes toward
epilepsy in Malaysians in Malay language had been performed previously.3,4 However,
a standard and quantitative scale was not used in these studies, resulting in difficulty in
comparing the results.5
There were a few quantitative assessment tools for public attitudes toward epilepsy,
such as the Attitudes and Beliefs about Living with Epilepsy (ABLE) scale6, the
Attitudes Toward Persons with Epilepsy (ATPE)7,8 , the Epilepsy Attitude Scale9, and
the Elementary School Epilepsy Survey (ESES)10 for elementary school children, but
not all can be applied cross-culturally as limited by items related to local perception of
epilepsy and none was translated into Malay language. The Public Attitudes Toward
Epilepsy (PATE) scale was designed to be applied cross-culturally, as characterized by
the following: (1) including statements related to separation and disadvantages in Link's
stigmatization model11, which are universally applicable, and (2) excluding questions

85
testing the participants' knowledge and perception of epilepsy, which are culturally
dependent.
The aim of this study was to test the validity and reliability of a Malay version of the
Public Attitudes Toward Epilepsy (PATE) scale.
Methodology
The Public Attitudes Toward Epilepsy (PATE) scale (Lim et. al. 2012) is a two-
dimensional 14-item scale measuring public attitudes towards epilepsy.5 The two
dimensions which the scale measures are (1) personal dimension/domain, includes items
that require participants to consider personal involvement and commitment with
sufferers of Epilepsy and (2) general domain, in which a general opinion of patients of
Epilepsy. Each item on the PATE is scored using a 5-point Likert scale with 1 being
“strongly disagree” and 5 being “strongly agree”. A higher total score reflects more
negative attitudes towards epilepsy. PATE scale is a valid and reliable test instrument,
demonstrating appropriate content and construct validity. Cronbach’s coefficient was
reported to be 0.633 and 0.868 for each respective dimension.
The translation process of PATE scale was performed using a three-stage cross-cultural
adaptation process as developed by the International Quality of Life Assessment
project12, i.e. (1) translation and cultural adaptation of the original scale into the Malay
language, and evaluation to ensure conceptual equivalence, (2) formal psychometric
testing of the assumptions underlying item scoring and construction of multi-item scales,
to ensure that the scoring algorithms can be applied to the population concerned, and (3)
validation and norming studies that provide a basis for interpretation.

86
Participants
Ten Malay-speaking adults from various socioeconomic backgrounds were included in
the translation and cultural adaptation process. For psychometric validation, a
convenience sampling of 140 Malay-speaking adults aged more than 18 years, from a
wide range of age and socioeconomic background. Samples were recruited from
Petaling Jaya and Kuala Lumpur, the two most populous and culturally diverse cities in
Malaysia. All questionnaires were self-reported and administered anonymously.
Consent was obtained whence participants responded to the questionnaire.
Demographic information on age, gender, education level, and social strata by
occupation were also obtained. This study was approved by the ethics committees of the
institutional review board (MEC Ref No: 878.10).
Translation and cultural adaptation
The Malay translation of the PATE scale was performed according to the Principles of
Good Practice Translation and Cultural Adaptation of Patient Reported Outcomes
Measures13, which include preparation, forward translation and reconciliation, backward
translation, harmonization, cognitive debriefing, and finalization. With these principles,
the aim was to develop a culturally sensitive version of the scale that was equivalent to
the original in the following aspects: item, semantic, operational and measurement
equivalence.
Translation: The PATE scale was first transferred to an Excel file for translation.
Forward translation was performed by two independent translators and the two
translations was reconciled into a single form. The reconciled form was back translated
87
into English by two independent translators, and combined into one back translation.
The back translation was compared with the original version. Differences was
highlighted and discussed by a panel consisted of two neurologists, a psychologist and a
statistician, and changes were made accordingly to ensure consistency in the concepts
between the original and the translations. This resulted in the Malay translated versions
of PATE.
Cognitive debriefing: To pretest the questionnaire, semi-structured interviews were
conducted with 10 Malay speaking participants. The interviews explored questions’
relevancy and understandability besides identifying potential difficulties in responding.
Finalization: An expert panel meeting was organized to evaluate the content and face
validity of the translated versions, the results of the pretesting, and the equivalence with
the original i.e. conceptual, semantic and normative equivalence for each item.
Statistical analysis
All data analyses were performed using Statistical Package for Social Sciences version
19 (SPSS 19.0). All demographic data were analyzed descriptively and presented as
frequencies and percentages. For continuous data with normal distribution, independent
t-tests were used for group comparison.
Psychometric and validation testing
Validity: Multitrait analysis and principal-axis factoring were used to evaluate the
validity of the translation based on the following assumptions:
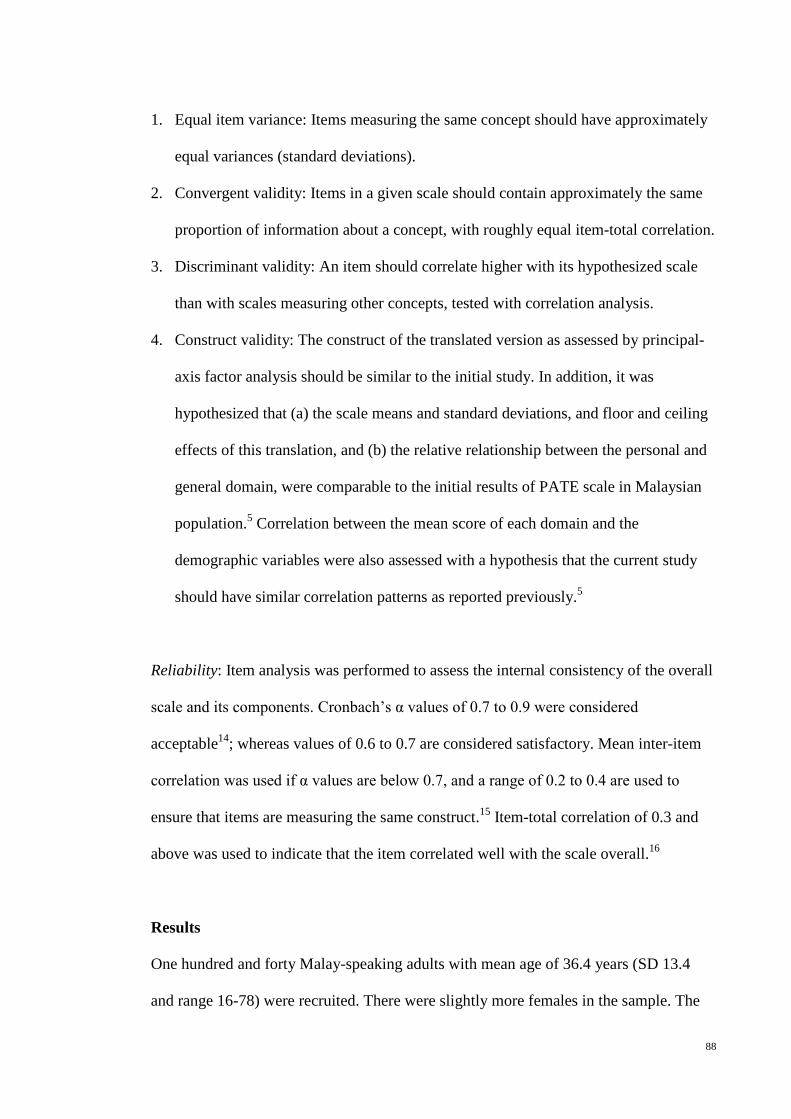
88
1. Equal item variance: Items measuring the same concept should have approximately
equal variances (standard deviations).
2. Convergent validity: Items in a given scale should contain approximately the same
proportion of information about a concept, with roughly equal item-total correlation.
3. Discriminant validity: An item should correlate higher with its hypothesized scale
than with scales measuring other concepts, tested with correlation analysis.
4. Construct validity: The construct of the translated version as assessed by principal-
axis factor analysis should be similar to the initial study. In addition, it was
hypothesized that (a) the scale means and standard deviations, and floor and ceiling
effects of this translation, and (b) the relative relationship between the personal and
general domain, were comparable to the initial results of PATE scale in Malaysian
population.5 Correlation between the mean score of each domain and the
demographic variables were also assessed with a hypothesis that the current study
should have similar correlation patterns as reported previously.5
Reliability: Item analysis was performed to assess the internal consistency of the overall
scale and its components. Cronbach’s α values of 0.7 to 0.9 were considered
acceptable14; whereas values of 0.6 to 0.7 are considered satisfactory. Mean inter-item
correlation was used if α values are below 0.7, and a range of 0.2 to 0.4 are used to
ensure that items are measuring the same construct.15 Item-total correlation of 0.3 and
above was used to indicate that the item correlated well with the scale overall.16
Results
One hundred and forty Malay-speaking adults with mean age of 36.4 years (SD 13.4
and range 16-78) were recruited. There were slightly more females in the sample. The

89
samples were predominantly of Malay ethnicity and married. Approximately two-thirds
of the participants had tertiary education level and with full-time employment. About
5.7% of the participants had family history of epilepsy. (Table 5-1)
Table 5-1: Demographic characteristics of the respondents (n=140)
Characteristics Frequency (%) Age 36.4 (13.4)* Gender Male Female
65 (46.4) 75 (53.6)
Race Malay Chinese Indian Others
117 (83.6)
2 (1.4) 17 (12.1) 4 (2.9)
Marital status Married Single Widowed Divorced
92 (65.7) 42 (30.0) 4 (2.9) 2 (1.4)
Education level None or primary education Secondary Pre-University Degree Post graduate
2 (1.4)
54 (38.6) 42 (30.0) 37 (26.4) 5 (3.6)
Employment status Fulltime student Housewife Employed part time Employed full time Unemployed Retired Others
17 (12.1) 11 (7.9) 7 (5.0)
84 (60.0) 6 (4.3) 11 (7.9) 4 (2.9)
Individual monthly income (Ringgit Malaysia) 1000 and below 1001-2000 2001 and above
33 (23.9) 46 (32.9) 61 (43.6)
Family member with epilepsy/seizures 8 (5.7) * reported as mean (standard deviation)

90
Translation equivalence and acceptability
The back-translation of the Malay PATE was equivalent to the original PATE for all the
questions and responses, except item 5. For item 5, the equivalent Malay translation for
dating is “kencan” which is not commonly used terminology among Malaysian. A more
commonly used terminology is “temujanji” which can be interpreted as “dating” or
“making an appointment”. A phrase “(date) with someone” was thus added to the verb
to make the meaning more explicit. All 10 participants involved in the cognitive
debriefing indicated that the items were relevant, easy to understand, and had no
difficulty in answering the questions. No change was made in the final expert panel
meeting to the reconciled Malay translation of the scale.
Psychometric and validation testing
1. Equal item variance
The mean score and standard deviation (SD), floor and ceiling effects of each item in
the Malay PATE were shown in Table 5-2, according to the domain and were compared
to the results performed in the initial study.5 The items in each domain had similar
standard deviations (equal item variance), ranged from 0.90-1.00 in personal domain
and 0.87-1.23 in general domain. (Table 5-2)

91
Table 5-2: Mean score, SD, floor and ceiling effects of the Malay PATE, as
compared with the results of the initial study performed in Malaysian population5
ID Item
Mean (SD) Floor/Ceiling effects (%) Malay PATE
(n=140)
General populations
(n=130)
Malay PATE
(n=140)
General populations
(n=130)
Personal domain 2.37 (0.64) *** 2.72 (0.56)
1 I feel uncomfortable working with someone who has epilepsy.
2.06 (0.90) ** 2.42 (0.87) 25.0/2.1 10.8/1.5
2 I will advise my family members against marrying someone with epilepsy.
2.51 (1.00) *** 2.95 (0.91) 15.7/2.1 6.9/2.3
3 I would marry someone with epilepsy, even though he/she has epilepsy.#
2.76 (0.91) * 3.03 (0.85) 7.9/3.6 2.3/3.8
5 I would date someone even though he/she has epilepsy.# 2.62 (0.92) 2.78 (0.84) 8.6/2.9 3.1/3.1
7
If I am an employer, I would give equal employment opportunities to someone with epilepsy.#
1.89 (0.93) *** 2.41 (0.96) 37.1/2.1 10.8/4.6
General domain 2.09 (0.59) 2.09 (0.59)
4 I will not mind being seen in the company with someone known to have epilepsy. #
1.99 (1.01) 2.06 (0.77) 32.1/5.0 16.9/1.5
6 I would stay away from a friend if I knew she/he had epilepsy.
1.74 (0.91) ** 2.08 (0.92) 45.7/2.9 21.5/3.8
8 People with epilepsy have the same rights as all people. # 1.82 (1.01) 2.05 (0.91) 42.9/5.0 26.2/2.3
9 People with epilepsy should be isolated from others. 1.84 (0.87) 1.94 (0.84) 39.3/0.7 32.3/0.8
10 People with epilepsy should not marry. 1.91 (0.87) 2.06 (0.78) 35.7/0.7 22.3/0.8
11 People with epilepsy should not participate in social activities. 1.97 (0.98) 2.00 (0.78) 38.6/10.0 22.3/0.8
12 People with epilepsy should not study in college or university.
2.05 (1.00) * 1.82 (0.70) 30.7/3.6 32.3/0.8
13 People with epilepsy should study in a special school.
2.76 (1.23) * 2.43 (0.97) 17.1/9.3 16.9/1.5
14 Schools should not place children with epilepsy in regular classrooms.
2.74 (1.13) ** 2.35 (0.90) 14.3/5.0 13.8/2.3
#These items were reversely scored. Significant at *p <0.05, ** p <0.01 and *** p <0.001, as compared to the results of the initial study performed among Malaysian population.

92
2. Convergent and discriminant validity
The correlation between an item and its domain was 0.4 and above for all, and higher
than the correlation with the other domain, as highlighted in bold in Table 5-3.
Table 5-3: Item-domain and corrected item-total correlations.
ID Correlation Personal domain
General domain
Corrected Item-total correlation
1 I feel uncomfortable working with someone who has epilepsy. .636** .587** .440
2 I will advise my family members against marrying someone with epilepsy. .653** .390** .439
3 I would marry someone with epilepsy, even though he/she has epilepsy.# .755** .380** .610
5 I would date someone even though he/she has epilepsy.# .737** .213* .526
7 If I am an employer, I would give equal employment opportunities to someone with epilepsy.#
.632** .343** .371
4 I will not mind being seen in the company with someone known to have epilepsy. # .366** .567** .295
6 I would stay away from a friend if I knew she/he had epilepsy. .413** .614** .458
8 People with epilepsy have the same rights as all people. # .316** .539** .336
9 People with epilepsy should be isolated from others. .396** .696** .637
10 People with epilepsy should not marry. .435** .547** .450 11 People with epilepsy should not participate
in social activities. .292** .607** .467
12 People with epilepsy should not study in college or university. .377** .674** .506
13 People with epilepsy should study in a special school. .318** .618** .435
14 Schools should not place children with epilepsy in regular classrooms. .156 .561** .399
Significant at *p <0.05, ** p <0.001. Number in bold indicated that the correlation of item is higher with its hypothesized scale than with scales measuring other concepts.

93
3. Construct validity
a) Compatibility with previous study
The scale means and standard deviations, the floor and ceiling effects of the Malay
PATE were compared with the initial results in Malaysian general population in Table
5-2. The means of 4 items (1, 2, 3 and 7) in the personal domain were significantly
lower, and the means of 3 items (12, 13 and 14) in the general domain were
significantly higher, than the original PATE. The standard deviations were slightly
higher but comparable between the two groups. The floor and ceiling effects followed
the same pattern as initial study, in which the floor effect was greater than the ceiling
effect in all items. In addition, the floor effect in all items in the Malay PATE was
greater than the original study.
As shown in Figure 5-1, the mean score in the personal domain of Malay PATE was
significantly lower than the initial study (p<0.001). The relative relationship between
the personal and general domains was similar between the Malay and initial PATE.
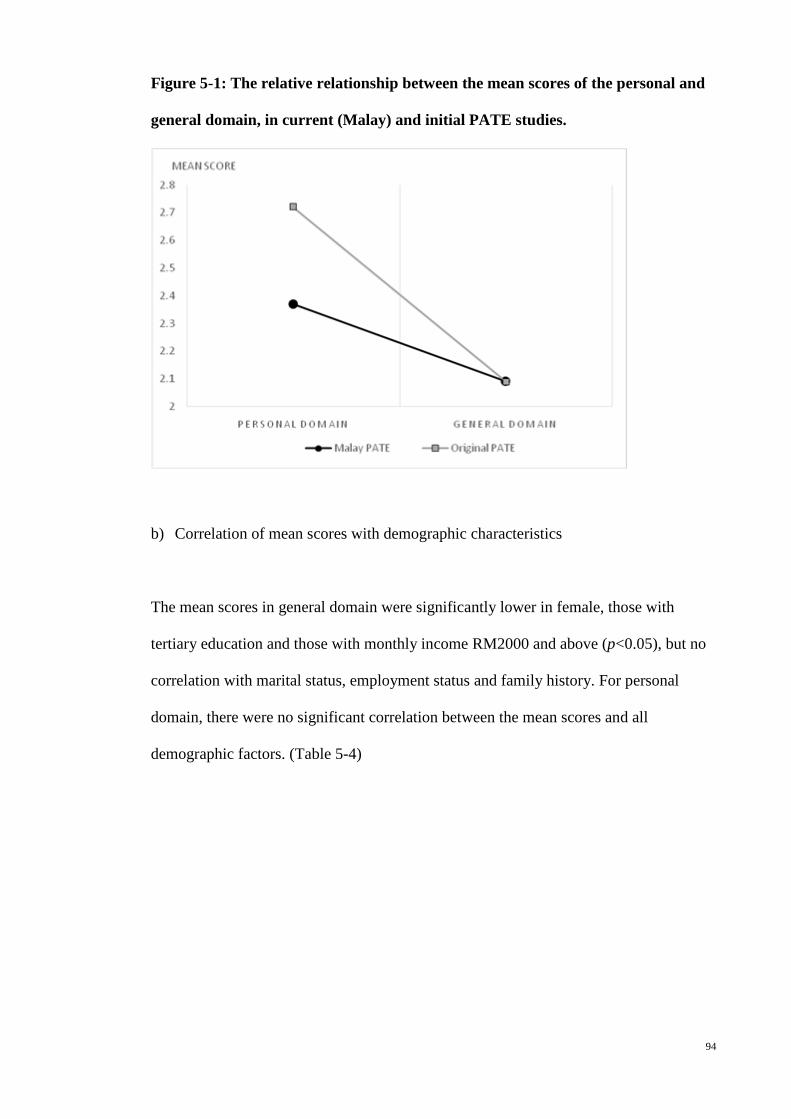
94
Figure 5-1: The relative relationship between the mean scores of the personal and
general domain, in current (Malay) and initial PATE studies.
b) Correlation of mean scores with demographic characteristics
The mean scores in general domain were significantly lower in female, those with
tertiary education and those with monthly income RM2000 and above (p<0.05), but no
correlation with marital status, employment status and family history. For personal
domain, there were no significant correlation between the mean scores and all
demographic factors. (Table 5-4)

95
Table 5-4: Mean scores by domains and demographic characteristics (n=140)
Variable Group (n) General domain
Personal domain
Total
Age1
0.110 0.105 0.106
Mean score (SD)
Mean score (SD)
Mean score (SD)
Gender
Male (65) Female (75)
2.25 (0.53) 1.95 (0.60)**
2.44 (0.58) 2.31 (0.68)
2.32 (0.48) 2.08 (0.57)**
Marital status
Single (42) Others (98)
2.14 (0.58) 2.07 (0.59)
2.46 (0.53) 2.33 (0.68)
2.25 (0.49) 2.16 (0.56)
Education level Tertiary (84) Others (56)
1.99 (0.58) 2.23 (0.57)*#
2.34 (0.67) 2.42 (0.59)
2.12 (0.55) 2.30 (0.50)
Employment status Employed full time (84) Others (56)
2.10 (0.57) 2.08 (0.61)
2.34 (0.59) 2.41 (0.71)
2.18 (0.52) 2.20 (0.58)
Monthly income in Ringgit Malaysia
2000 and above (61) Others (79)
1.96 (0.54) 2.19 (0.60)*
2.36 (0.70) 2.38 (0.59)
2.10 (0.53) 2.26 (0.54)
Family member with epilepsy/ seizures
Yes (8) No (132)
1.99 (0.38) 2.10 (0.60)
2.30 (0.39) 2.37 (0.65)
2.10 (0.29) 2.20 (0.55)
1Based on Pearson correlation, Significant at *p < 0.05. #This difference was comparable to the initial PATE study.
c) Correlation between the items and rotated principal components
Table 5-5 showed the factor loadings of the items using a principal axis factor analysis
and their correlation with the hypothesized domain. The results fit the hypothesized
personal and general domains, except items 1 and 2 which had a higher loading on the
general domain than the hypothesized with a difference of more than 0.2 (0.563 and
0.237 respectively).
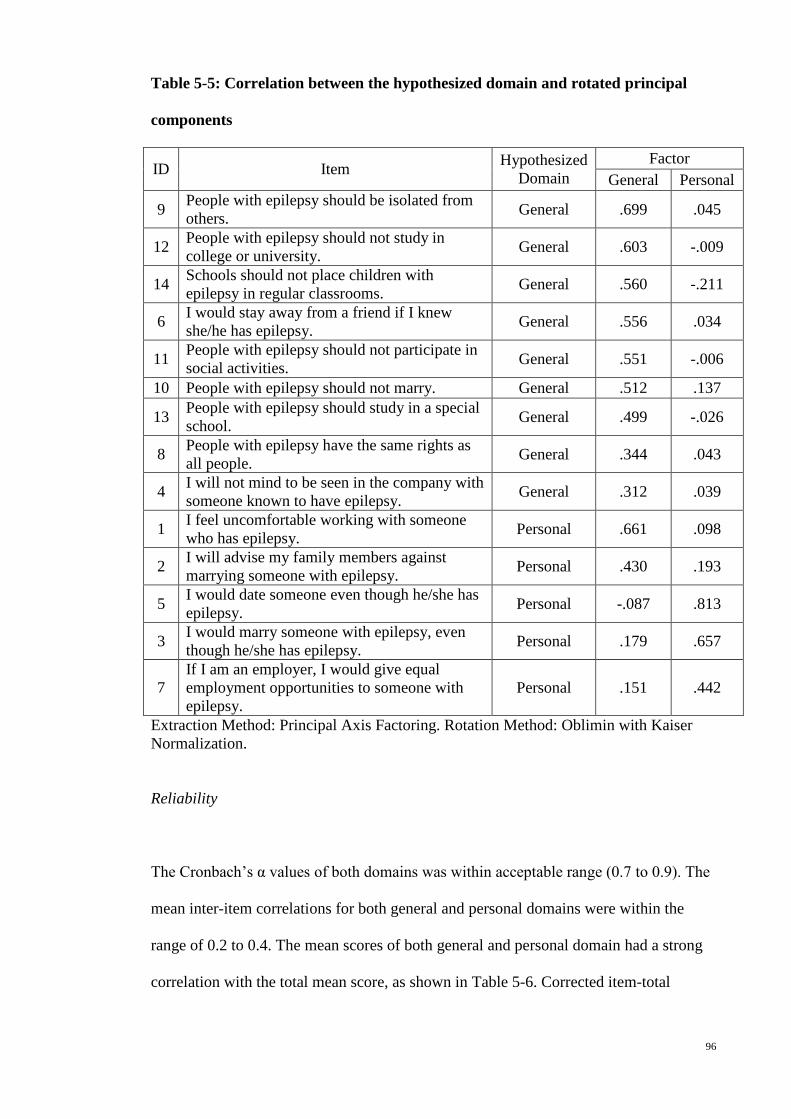
96
Table 5-5: Correlation between the hypothesized domain and rotated principal
components
ID Item Hypothesized Domain
Factor General Personal
9 People with epilepsy should be isolated from others. General .699 .045
12 People with epilepsy should not study in college or university. General .603 -.009
14 Schools should not place children with epilepsy in regular classrooms. General .560 -.211
6 I would stay away from a friend if I knew she/he has epilepsy. General .556 .034
11 People with epilepsy should not participate in social activities. General .551 -.006
10 People with epilepsy should not marry. General .512 .137
13 People with epilepsy should study in a special school. General .499 -.026
8 People with epilepsy have the same rights as all people. General .344 .043
4 I will not mind to be seen in the company with someone known to have epilepsy. General .312 .039
1 I feel uncomfortable working with someone who has epilepsy. Personal .661 .098
2 I will advise my family members against marrying someone with epilepsy. Personal .430 .193
5 I would date someone even though he/she has epilepsy. Personal -.087 .813
3 I would marry someone with epilepsy, even though he/she has epilepsy. Personal .179 .657
7 If I am an employer, I would give equal employment opportunities to someone with epilepsy.
Personal .151 .442
Extraction Method: Principal Axis Factoring. Rotation Method: Oblimin with Kaiser Normalization.
Reliability
The Cronbach’s α values of both domains was within acceptable range (0.7 to 0.9). The
mean inter-item correlations for both general and personal domains were within the
range of 0.2 to 0.4. The mean scores of both general and personal domain had a strong
correlation with the total mean score, as shown in Table 5-6. Corrected item-total
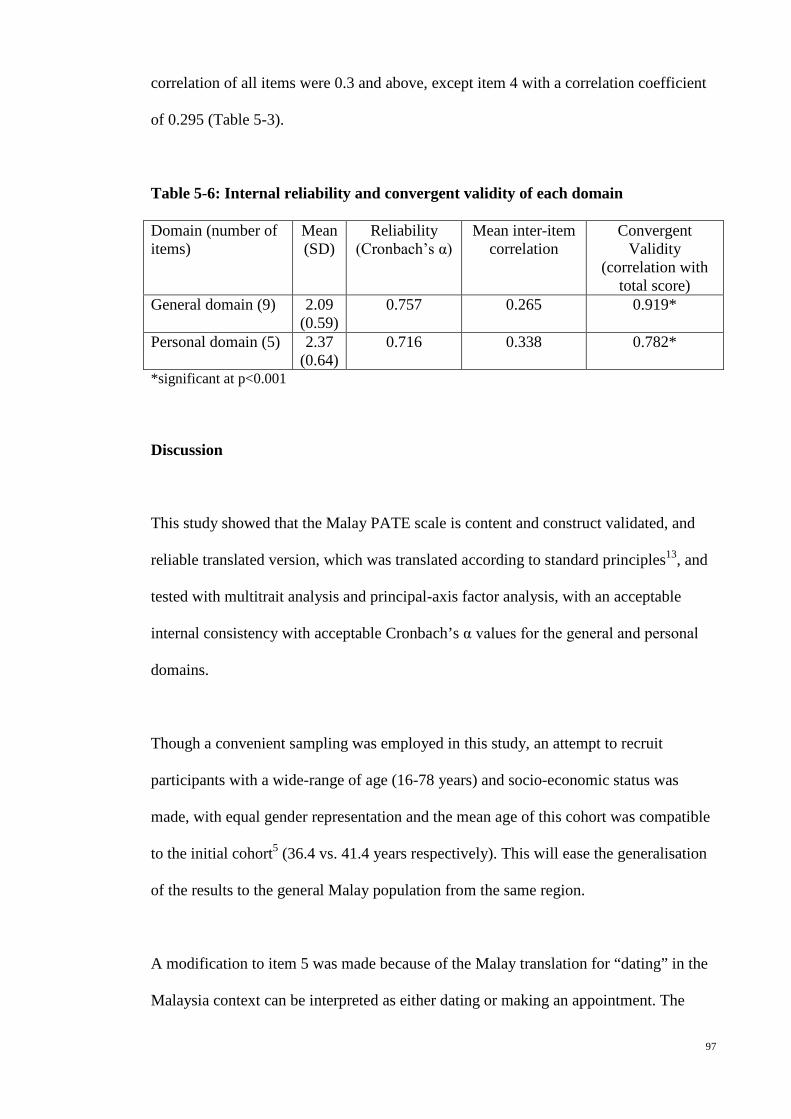
97
correlation of all items were 0.3 and above, except item 4 with a correlation coefficient
of 0.295 (Table 5-3).
Table 5-6: Internal reliability and convergent validity of each domain
Domain (number of items)
Mean (SD)
Reliability (Cronbach’s α)
Mean inter-item correlation
Convergent Validity
(correlation with total score)
General domain (9) 2.09 (0.59)
0.757 0.265 0.919*
Personal domain (5) 2.37 (0.64)
0.716 0.338 0.782*
*significant at p<0.001
Discussion
This study showed that the Malay PATE scale is content and construct validated, and
reliable translated version, which was translated according to standard principles13, and
tested with multitrait analysis and principal-axis factor analysis, with an acceptable
internal consistency with acceptable Cronbach’s α values for the general and personal
domains.
Though a convenient sampling was employed in this study, an attempt to recruit
participants with a wide-range of age (16-78 years) and socio-economic status was
made, with equal gender representation and the mean age of this cohort was compatible
to the initial cohort5 (36.4 vs. 41.4 years respectively). This will ease the generalisation
of the results to the general Malay population from the same region.
A modification to item 5 was made because of the Malay translation for “dating” in the
Malaysia context can be interpreted as either dating or making an appointment. The

98
mean score and standard deviation of this item were compatible with other items within
the same domain and the original study, indicating that the modified item is measuring
the same concept. The translated version had fulfilled the criteria for equal item
variance, convergent and discriminant validity
Multitrait analysis showed the Malay PATE had a similar variance, floor and ceiling
effects (Table 5-2), relative relationship between the domains (Figure 5-1), as the
original PATE. All items in the Malay PATE had greater floor effects, is likely because
the attitudes toward epilepsy among Malay-speaking population were better than the
general population. All items in the translated version had greater floor than ceiling
effects, compatible to the original PATE study.
The Malay PATE scale showed a similar correlation with almost all demographic
variable, as the original study, except gender and monthly income. In this study, the
female and those with higher monthly income had significantly more positive attitudes
toward epilepsy, in related to the items in the general domain, which was not found in
the original study.
The deviation of items 1 and 2 from the hypothesized domain with a difference of more
than 0.2 as compared the factor loading in the other domain. (Table 5-5) resulted in a re-
examination of the concepts of these two items. Item 1 (I feel uncomfortable working
with someone who has epilepsy) had almost similar correlation with both personal and
general domains (0.636 and 0.587 respectively, as shown in Table 5-3). Conceptually,
item 1 can be included into either domain depends on how close the relationship among
the co-workers. For example, if a person is working in a big company, having a co-
worker who has epilepsy has not much impact on his life and thus item 1 may not
99
necessary be categorized as personal. Item 2 (I will advise my family members against
marrying someone with epilepsy) had a strong item-domain correlation (Table 5-3). The
panel also viewed that for local Malay population, which formed the majority (83.6%)
in this study, this item is consistent with the concept in the personal domain. However,
personal opinion against a family member marrying a person with epilepsy can be
overridden by the paternal authority in the family among the Malay population.
However, in order to maintain the consistency of comparison among various translated
versions of PATE, no change in the factoring of these two items was made but a note
was added to this translated version, stating that factoring of these two items can be
culturally dependent.
The reliability of the Malay PATE was confirmed by a Cronbach’s α value that was
within acceptable range. In addition, the mean inter-item correlations were within the
acceptable range and all corrected item-total correlation were above 0.3, indicating that
this translated version is a reliable tool in measuring the public attitudes toward epilepsy.
Limitations and future implications
This Malay translated version of the PATE scale was tested among a multi-ethnic group
of Malay speaking Malaysian population in the urban region, with predominant Malay.
Malay language was the second language in those who are not Malay. However, it was
an advantage to have multiple ethnic group involvement in the translation adaptation
process, to ensure the cross-cultural validity of this translated version. In Malaysia and
some of the South-East Asian countries e.g. Indonesia, Malay language is a common
second language including the indigenous groups. The Malay translated PATE scale
100
will enable us to understand the public attitudes toward epilepsy among this group of
population.
Conclusion
The Malay PATE scale is a validated and reliable translated version in measuring the
public attitudes toward epilepsy.
References
1. Jacoby A. Stigma, epilepsy, and quality of life. Epilepsy & Behavior
2002;3:S10–S20.
2. Boer H, Mula M, Sander J. The global burden and stigma of epilepsy. Epilepsy
& Behavior 2008;12:540-6.
3. Ramasundrum V, Zabidi AMH, Chong TT. Public awareness, attitudes and
understanding towards epilepsy in Kelantan, Malaysia. Neurology Journal of Southeast
Asia 2000;5:55-60.
4. Lua PL, Neni WS. Awareness, knowledge, and attitudes with respect to epilepsy:
an investigation in relation to health-related quality of life within a Malaysian setting.
Epilepsy & behavior : E&B 2011;21:248-54.
5. Lim KS, Wu C, Choo WY, Tan CT. Development and validation of a Public
Attitudes Towards Epilepsy (PATE) scale. Epilepsy & Behavior 2012;24:207-12.
6. Kobau R, Price P. Knowledge of epilepsy and familiarity with this disorder in
the US population: Results from the 2002 HealthStyles Survey. Epilepsia
2003;44:1449-54.
101
7. Antonak RF. Psychometric analysis and validation of the scale of Attitudes
Toward Persons with Epilepsy: Journal of Epilepsy. 3 (1) (pp 11-16), 1990. Date of
Publication: 1990.
8. Lee SA, Yim SB, Rho YI, et al. Factors contributing to Korean teachers'
attitudes toward students with epilepsy. Epilepsy Behav 2011;20:378-81.
9. Aydemir N. Familiarity with, knowledge of, and attitudes toward epilepsy in
Turkey. Epilepsy & Behavior 2011;20:286-90.
10. Lowe-Pearce C, Camfield CS. Elementary school epilepsy survey (ESES): a
new measure of elementary school students' knowledge and attitudes about epilepsy.
Epilepsy Behav 2005;7:687-96.
11. Link BG, Phelan JC. Conceptualizing Stigma. Annu Rev Sociol 2001:363-85.
12. Ware JE, Jr., Keller SD, Gandek B, Brazier JE, Sullivan M. Evaluating
translations of health status questionnaires. Methods from the IQOLA project.
International Quality of Life Assessment. International journal of technology
assessment in health care 1995;11:525-51.
13. Wild D, Grove A, Martin M, et al. Principles of Good Practice for the
Translation and Cultural Adaptation Process for Patient-Reported Outcomes (PRO)
Measures: report of the ISPOR Task Force for Translation and Cultural Adaptation.
Value Health 2005;8:94-104.
14. DeVellis RF. Scale development: Theory and applications 2nd ed. Thousand
Oaks, California: Sage; 2003.
15. Briggs SR, Cheek JM. The role of factor analysis in the development and
evaluation of personality traits. J Pers 1986;54:106-48.
16. Field A. Discovering Statistics Using SPSS. 2nd ed. London: Sage; 2005.

102
Appendix 3: Malay translated version of PATE scale
Arahan: Jawab soalan-soalan berikut dengan secara spontan yang mungkin. Tidak ada jawapan yang betul atau salah. Setiap soalan mempunyai lima jawapan yang mungkin. Bulatkan jawapan yang paling dekat dengan pandangan anda.
Sangat Tidak
Bersetuju
Tidak B
ersetuju
Tidak Pasti
Bersetuju
Sangat Bersetuju
1. Penghidap epilepsi tidak wajar belajar di kolej atau universiti. 1 2 3 4 5 2. Penghidap epilepsi mempunyai hak yang sama seperti semua
orang. 1 2 3 4 5
3. Penghidap epilepsi harus diasingkan daripada orang lain. 1 2 3 4 5 4. Penghidap epilepsi tidak harus mengambil bahagian dalam
aktiviti sosial. 1 2 3 4 5
5. Saya tidak kisah dilihat bersama dengan seseorang yang diketahui menghidapi epilepsi. 1 2 3 4 5
6. Penghidap epilepsi tidak harus berkahwin. 1 2 3 4 5 7. Saya akan menjauhkan diri dari seorang kawan jika saya
mengetahui dia menghidapi epilepsi. 1 2 3 4 5
8. Penghidap epilepsi harus belajar di sekolah khas. 1 2 3 4 5 9. Sekolah tidak harus menempatkan kanak-kanak yang
menghidapi epilepsi ke dalam bilik darjah biasa. 1 2 3 4 5
10. Saya akan bertemujanji (dating) dengan seorang lelaki/perempuan walaupun dia menghidapi epilepsi. 1 2 3 4 5
11. Saya akan berkhawin dengan seseorang walaupun dia menghidapi epilepsi. 1 2 3 4 5
12. Saya rasa tidak selesa bekerja dengan seseorang yang menghidapi epilepsi. 1 2 3 4 5
13. Saya akan menasihati ahli keluarga saya untuk tidak berkahwin dengan seseorang yang menghidapi epilepsi. 1 2 3 4 5
14. Jika saya seorang majikan, saya akan memberi peluang pekerjaan yang sama adil kepada seseorang yang menghidapi epilepsi
1 2 3 4 5
103
Chapter 6: Chinese Public Attitudes Toward Epilepsy (PATE) scale: translation and
psychometric evaluation
(Published as Lim KS, Choo WY, Wu C, Hills MD, Tan CT. Chinese Public Attitudes
Toward Epilepsy (PATE) scale: translation and psychometric evaluation. Neurology
Asia 2013; 18 (3):261-270.)
Abstract
Introduction: None of the quantitative scale for public attitudes toward epilepsy was
translated to Chinese language. This study aimed to translate and test the validity and
reliability of a Chinese version of the Public Attitudes Toward Epilepsy (PATE) scale.
Method: The translation was performed according to standard principles and tested in
140 Chinese-speaking adults aged more than 18 years for psychometric validation.
Results: The items in each domain had similar standard deviations (equal item
variance), ranged from 0.85-0.95 in personal domain and 0.75-1.04 in general domain.
The correlation between an item and its domain was 0.4 and above for all, and higher
than the correlation with the other domain. Multitrait analysis showed the Chinese
PATE had a similar variance, floor and ceiling effects, and relative relationship between
the domains, as the original PATE. The Chinese PATE scale showed a similar
correlation with almost all demographic variable except age. Item means were generally
clustered in the factor analysis as hypothesized. The Cronbach’s α values was within
acceptable range (0.773) in the personal domain and satisfactory range (0.693) in the
general domain. Conclusion: The Chinese PATE scale is a validated and reliable
translated version in measuring the public attitudes toward epilepsy.

104
Keywords: Chinese, PATE scale, attitudes, epilepsy, public
Introduction
People with epilepsy are burdened by a multitude of social, psychological and economic
consequences of stigmatization which leads to poor quality of life.1,2 There are great
variation in social stigma among various countries, ethnicities and cultural groups,
affected by various socio-economic and cultural factors. Assessment of the public
attitudes toward epilepsy is therefore best conducted in local languages.
Public surveys on attitudes toward epilepsy had been conducted in many countries in
local languages.3 However, a standard and quantitative scale was not used in most
studies, resulting in difficulty in comparing the results.
There were a few quantitative assessment tools for public attitudes toward epilepsy,
such as the Attitudes and Beliefs about Living with Epilepsy (ABLE) scale4, the
Attitudes Toward Persons with Epilepsy (ATPE)5,6, the Epilepsy Attitude Scale7, and
the Elementary School Epilepsy Survey (ESES)8 for elementary school children, but not
all can be applied cross-culturally as limited by items related to local perception of
epilepsy and none was translated into Chinese language. The Public Attitudes Toward
Epilepsy (PATE) scale was designed to be applied cross-culturally, as characterized by
the following: (1) including statements related to separation and disadvantages in Link's
stigmatization model9, which are universally applicable, and (2) excluding questions
testing the participants' knowledge and perception of epilepsy, which are culturally
dependent.

105
The aim of this study was to test the validity and reliability of a Chinese version of the
Public Attitudes Toward Epilepsy (PATE) scale.
Methodology
The Public Attitudes Toward Epilepsy (PATE) scale (Lim et. al. 2012) is a two-
dimensional 14-item scale measuring public attitudes towards epilepsy.10 The two
dimensions which the scale measures are (1) personal dimension/domain, include items
that require participants to consider personal involvement and commitment with
sufferers of Epilepsy and (2) general domain, in which a general opinion of patients of
Epilepsy is gauged by each item. Each item on the PATE is scored using a 5-point
Likert’s Scale with 1 being “strongly disagree” and 5 being “strongly agree”. A higher
total score reflects more negative attitudes towards epilepsy. PATE scale is a valid and
reliable test instrument, demonstrating appropriate content and construct validity, and
Cronbach’s coefficient of 0.633 and 0.868.
The translation process of PATE scale was performed in a three-stage cross-cultural
adaptation process as developed by the International Quality of Life Assessment
project11, i.e. (1) translation and cultural adaptation of the original scale into the Chinese
language, and evaluation to ensure conceptual equivalence, (2) formal psychometric
testing of the assumptions underlying item scoring and construction of multi-item scales,
to ensure that the scoring algorithms can be applied to the population concerned, and (3)
validation and norming studies that provide a basis for interpretation.
106
Participants
Ten Chinese-speaking adults from various socioeconomic backgrounds were included
in the translation and cultural adaptation process. For psychometric validation, a
convenience sampling of 140 Chinese-speaking adults aged more than 18 years, from a
wide range of age and socioeconomic background, were recruited from Petaling Jaya
and Kuala Lumpur in Malaysia. Answering the questionnaire was regarded as having
given consent. All questionnaires were administered anonymously. Demographic
information on age, gender, education level, and social strata by occupation were also
obtained. This study was approved by the ethics committees at the University Malaya
Medical Center, Malaysia (MEC Ref No: 878.10).
Translation and cultural adaptation
The Chinese translations of the PATE scale was performed according to the Principles
of Good Practice Translation and Cultural Adaptation of Patient Reported Outcomes
Measures12, which include preparation, forward translation and reconciliation, backward
translation, harmonization, cognitive debriefing, and finalization. With these principles,
the aim was to develop a culturally sensitive version of the scale that was equivalent to
the original in the following aspects: item, semantic, operational and measurement
equivalence.
Translation: The PATE scale was first transferred to an Excel file for translation.
Forward translation was performed by two independent translators and the two
translations was reconciled into a single form. The reconciled form was back translated
into English by two independent translators, and combined into one back translation.

107
The back translation was compared with the original version. Differences was
highlighted and discussed by a panel consisted of two neurologists, a psychologist and a
statistician, and changes were made accordingly to ensure consistency in the concepts
between the original and the translations. This resulted in the Chinese translated
versions of PATE.
Cognitive debriefing: Ten adults knowledgeable in the Chinese language were pretested
using semistructured interviews to explore whether questions are relevant and
understandable, as well as to identify potential difficulties in answering.
Finalization: An expert panel meeting was organized to evaluate the content and face
validity of the translated versions, the results of the pretesting, and the equivalence with
the original i.e. conceptual, semantic and normative equivalence for each item.
Statistical analysis
This study employed Statistical Package for Social Sciences version 19 (SPSS 19.0) for
data analyses. All demographic data were analyzed descriptively and presented as
frequencies as well as percentages. For continuous data, independent t-tests were used
for group comparison.
Psychometric and validation testing
Validity: Multitrait analysis and principal-axis factoring were used to evaluate the
validity of the translation based on the following assumptions:

108
5. Equal item variance: Items measuring the same concept should have approximately
equal variances (standard deviations).
6. Convergent validity: Items in a given scale should contain approximately the same
proportion of information about a concept, with roughly equal item-total correlation.
7. Discriminant validity: An item should correlate higher with its hypothesized scale
than with scales measuring other concepts, tested with correlation analysis.
8. Construct validity: The construct of the translated version as assessed by principal-
axis factor analysis should be similar to the initial study. In addition, it was
hypothesized that (a) the scale means and standard deviations, and floor and ceiling
effects of this translation, and (b) the relative relationship between the personal and
general domain, were comparable to the initial results of PATE scale in Malaysian
population.10 Correlation between the mean score of each domain and the
demographic variables were also assessed with a hypothesis that the current study
should have similar correlation patterns as reported previously.10
Reliability: Item analysis was performed to assess the internal consistency of the overall
scale and its components. Cronbach’s α values of 0.7 to 0.9 were considered
acceptable13; whereas values of 0.6 to 0.7 are considered satisfactory. Mean inter-item
correlation was used if α values are below 0.7, and a range of 0.2 to 0.4 are used to
ensure that items are measuring the same construct.14 Item-total correlation of 0.3 and
above was used to indicate that the item correlated well with the scale overall.15
Results
One hundred and forty Chines-speaking adults with mean age of 41.8 years (standard
deviation, SD, 15.2 and range, 18-76) were recruited. There were 43.6% male, 62.9%

109
married, 55.7% with tertiary education level, 49.3% with full-time employment, and 5.7%
with family history of epilepsy. (Table 6-1)
Table 6-1: Demographic characteristics of the respondents (n=130)
Number (%) Gender Male
Female 61 (43.6) 79 (56.4)
Race Chinese 140 (100.0) Marital status Married
Single Divorced
88 (62.9) 51 (36.4) 1 (0.7)
Education level No formal education Primary Secondary Pre-University Degree Post graduate
1 (0.7) 16 (11.4) 45 (32.1) 39 (27.9) 30 (21.4) 9 (6.4)
Employment status Fulltime student Housewife Employed part time Employed full time Unemployed Retired Others
15 (10.7) 25 (17.9) 6 (4.3)
69 (49.3) 5 (3.6)
19 (13.6) 1 (0.7)
Individual monthly income (Ringgit Malaysia)
None 1000 and below 1001-2000 2001 and above
42 (30.0) 12 (8.6) 27 (19.3) 59 (42.1)
Family member with epilepsy/seizures
Yes
8 (5.7)
Translation equivalence and acceptability
The back-translation of the Chinese PATE was equivalent to the original PATE for all
the questions and responses. All ten participants involved in the cognitive debriefing
indicated that the items were relevant, easy to understand, and had no difficulty in
answering the questions. No change was made in the final expert panel meeting to the
reconciled Chinese translation of the scale.
110
Psychometric and validation testing
4. Equal item variance
The mean score and standard deviation (SD), floor and ceiling effects of each item in
the Chinese PATE were shown in table 6-2, according to the domain and were
compared to the results performed in the initial study.10 The items in each domain had
similar standard deviations (equal item variance), ranged from 0.85-0.95 in personal
domain and 0.75-1.04 in general domain. (Table 6-2)

111
Table 6-2: Mean score, SD, floor and ceiling effects of the Chinese PATE, as
compared with the initial results in Malaysian population10
ID Item
Mean (SD) Floor/Ceiling effects (%)
Chinese PATE
(n=140)
General populations (n=130)
Chinese PATE
(n=140)
General populations (n=130)
Personal domain 2.41 (0.66) 2.72 (0.56)***
1 I feel uncomfortable working with someone who has epilepsy. 2.00 (0.87) 2.42
(0.87)*** 26.4/1.4 10.8/1.5
2 I will advise my family members against marrying someone with epilepsy.
2.38 (0.95) 2.95 (0.91)*** 17.1/1.4 6.9/2.3
3 I would marry someone with epilepsy, even though he/she has epilepsy.#
2.91 (0.94) 3.03 (0.85) 5.7/7.1 2.3/3.8
5 I would date someone even though he/she has epilepsy.# 2.54 (0.93) 2.78
(0.84)* 8.6/3.6 3.1/3.1
7 If I am an employer, I would give equal employment opportunities to someone with epilepsy.#
2.24 (0.85) 2.41 (0.96) 16.4/0.7 10.8/4.6
General domain 2.08 (0.49) 2.09 (0.59) 4 I will not mind being seen in the
company with someone known to have epilepsy. #
1.94 (0.94) 2.06 (0.77) 31.4/3.6 16.9/1.5
6 I would stay away from a friend if I knew she/he had epilepsy. 1.71 (0.84) 2.08
(0.92)** 42.9/2.9 21.5/3.8
8 People with epilepsy have the same rights as all people. # 1.90 (0.93) 2.05 (0.91) 35.0/2.1 26.2/2.3
9 People with epilepsy should be isolated from others. 1.70 (0.75) 1.94
(0.84)* 42.1/0.7 32.3/0.8
10 People with epilepsy should not marry. 2.26 (0.92) 2.06 (0.78) 19.3/1.4 22.3/0.8
11 People with epilepsy should not participate in social activities. 1.86 (0.85) 2.00 (0.78) 34.3/1.4 22.3/0.8
12 People with epilepsy should not study in college or university. 1.95 (0.89) 1.82 (0.70) 30.0/2.1 32.3/0.8
13 People with epilepsy should study in a special school. 2.81 (1.04) 2.43
(0.97)** 9.3/3.6 16.9/1.5
14 Schools should not place children with epilepsy in regular classrooms.
2.59 (1.03) 2.35 (0.90)* 10.0/5.7 13.8/2.3
#These items were reversely scored. *p-value is <0.05, ** p-value is <0.01 and *** p-value is <0.001, as compared to current study.

112
5. Convergent and discriminant validity
The correlation between an item and its domain was 0.4 and above for all, and higher
than the correlation with the other domain, as highlighted in bold in table 6-3.
Table 6-3: Item-domain and corrected item-total correlations.
ID Correlation Personal domain
General domain
Corrected Item-total correlation
1 I feel uncomfortable working with someone who has epilepsy. .594** .522** .420
2 I will advise my family members against marrying someone with epilepsy. .749** .421** .596
3 I would marry someone with epilepsy, even though he/she has epilepsy.# .844** .369** .785
5 I would date someone even though he/she has epilepsy.# .722** .225** .597
7 If I am an employer, I would give equal employment opportunities to someone with epilepsy.#
.568** .265** .346
4 I will not mind being seen in the company with someone known to have epilepsy. # .258** .563** .247
6 I would stay away from a friend if I knew she/he had epilepsy. .303** .503** .227
8 People with epilepsy have the same rights as all people. # .400** .587** .341
9 People with epilepsy should be isolated from others. .295** .669** .546
10 People with epilepsy should not marry. .474** .542** .375 11 People with epilepsy should not participate
in social activities. .209* .640** .462
12 People with epilepsy should not study in college or university. .276** .565** .403
13 People with epilepsy should study in a special school. .384** .644** .476
14 Schools should not place children with epilepsy in regular classrooms. .179* .493** .277
*p-value is <0.05, and ** p-value is <0.01. Number in bold indicated that the correlation of item is higher with its hypothesized scale than with scales measuring other concepts.

113
6. Construct validity
d) Compatibility with previous study
The scale means and standard deviations, the floor and ceiling effects of the Chinese
PATE were compared with the initial results in Malaysian general population in Table
6-2. The means of items 1, 2, 5, 6 and 9 were significantly lower, except items 13 and
14 with higher mean, than the initial PATE. The standard deviations were comparable
between the two groups. The floor and ceiling effects followed the same pattern as
initial study, in which the floor effect was greater than the ceiling effect in all items.
However, in four items (1, 4, 6 and 11) the floor effect of the Chinese PATE was greater
(more than 25%) when there was a smaller floor effect (<25%) noted in the initial study.
As shown in figure 1, the mean score in the personal domain of Chinese PATE was
significantly lower than the initial study (p<0.001). The relative relationship between
the personal and general domains were similar between the Chinese and initial PATE.
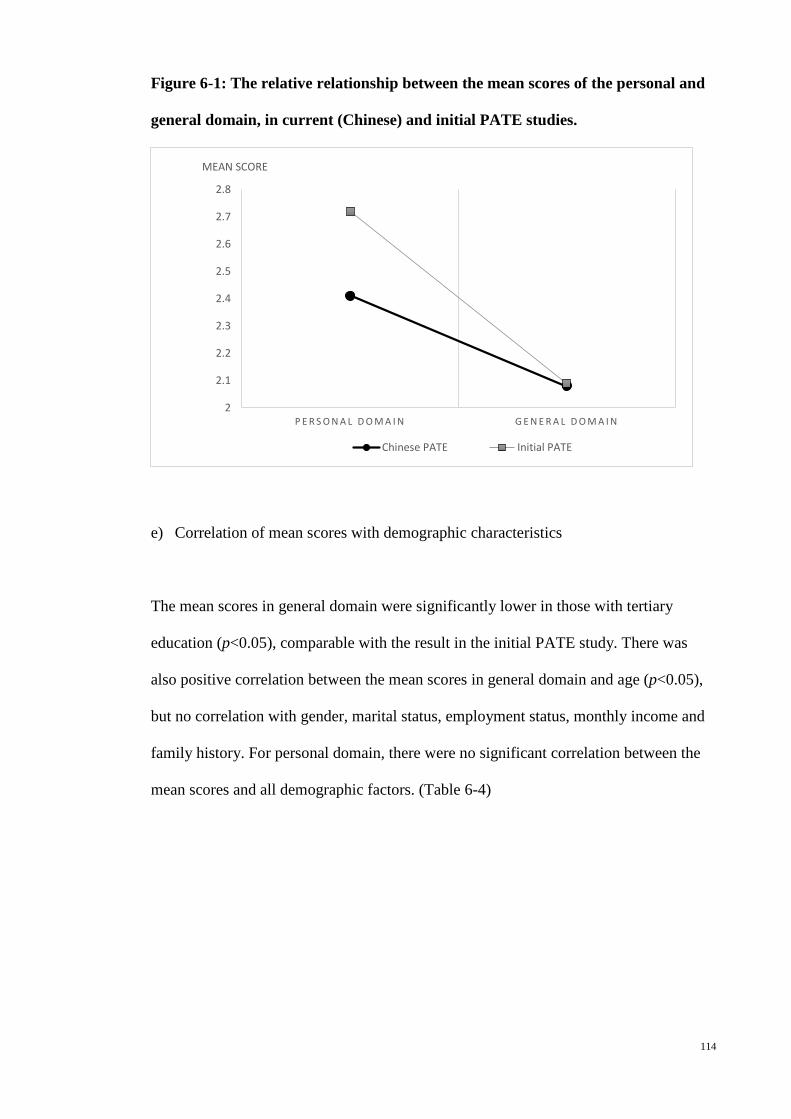
114
Figure 6-1: The relative relationship between the mean scores of the personal and
general domain, in current (Chinese) and initial PATE studies.
e) Correlation of mean scores with demographic characteristics
The mean scores in general domain were significantly lower in those with tertiary
education (p<0.05), comparable with the result in the initial PATE study. There was
also positive correlation between the mean scores in general domain and age (p<0.05),
but no correlation with gender, marital status, employment status, monthly income and
family history. For personal domain, there were no significant correlation between the
mean scores and all demographic factors. (Table 6-4)
2
2.1
2.2
2.3
2.4
2.5
2.6
2.7
2.8
P E R S O N A L D O M A I N G E N E R A L D O M A I N
MEAN SCORE
Chinese PATE Initial PATE
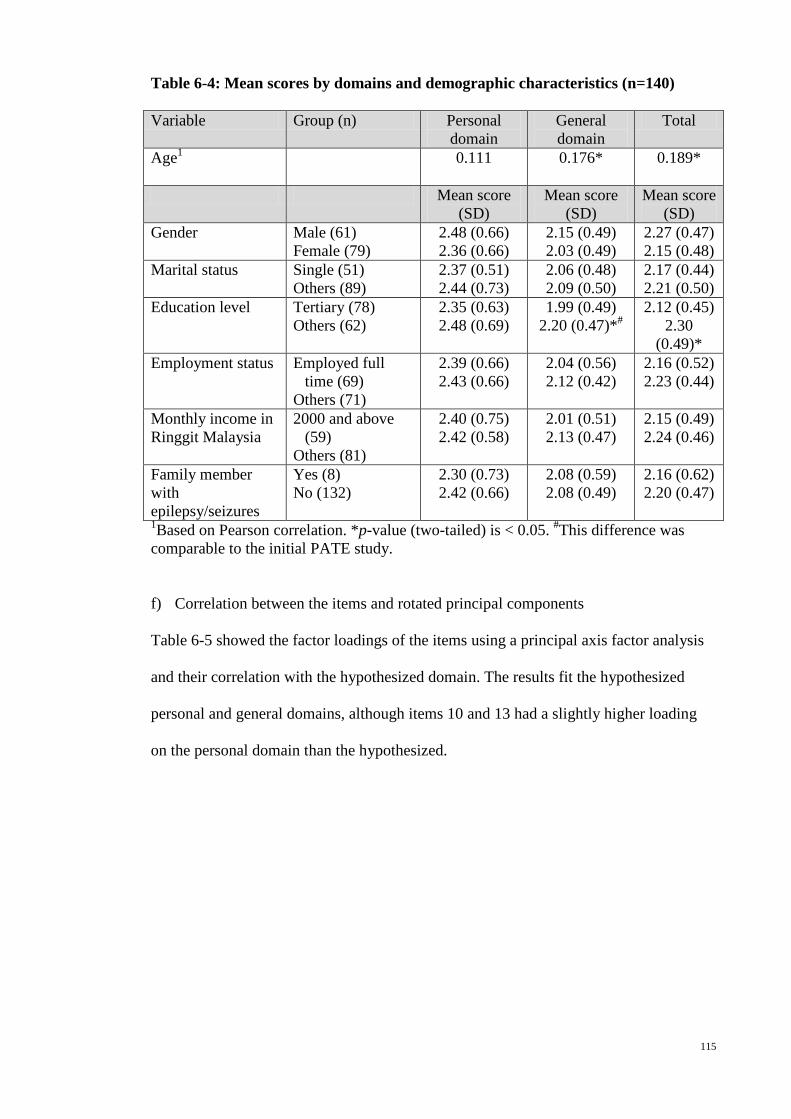
115
Table 6-4: Mean scores by domains and demographic characteristics (n=140)
Variable Group (n) Personal domain
General domain
Total
Age1
0.111 0.176* 0.189*
Mean score (SD)
Mean score (SD)
Mean score (SD)
Gender
Male (61) Female (79)
2.48 (0.66) 2.36 (0.66)
2.15 (0.49) 2.03 (0.49)
2.27 (0.47) 2.15 (0.48)
Marital status
Single (51) Others (89)
2.37 (0.51) 2.44 (0.73)
2.06 (0.48) 2.09 (0.50)
2.17 (0.44) 2.21 (0.50)
Education level Tertiary (78) Others (62)
2.35 (0.63) 2.48 (0.69)
1.99 (0.49) 2.20 (0.47)*#
2.12 (0.45) 2.30
(0.49)* Employment status Employed full
time (69) Others (71)
2.39 (0.66) 2.43 (0.66)
2.04 (0.56) 2.12 (0.42)
2.16 (0.52) 2.23 (0.44)
Monthly income in Ringgit Malaysia
2000 and above (59)
Others (81)
2.40 (0.75) 2.42 (0.58)
2.01 (0.51) 2.13 (0.47)
2.15 (0.49) 2.24 (0.46)
Family member with epilepsy/seizures
Yes (8) No (132)
2.30 (0.73) 2.42 (0.66)
2.08 (0.59) 2.08 (0.49)
2.16 (0.62) 2.20 (0.47)
1Based on Pearson correlation. *p-value (two-tailed) is < 0.05. #This difference was comparable to the initial PATE study.
f) Correlation between the items and rotated principal components
Table 6-5 showed the factor loadings of the items using a principal axis factor analysis
and their correlation with the hypothesized domain. The results fit the hypothesized
personal and general domains, although items 10 and 13 had a slightly higher loading
on the personal domain than the hypothesized.
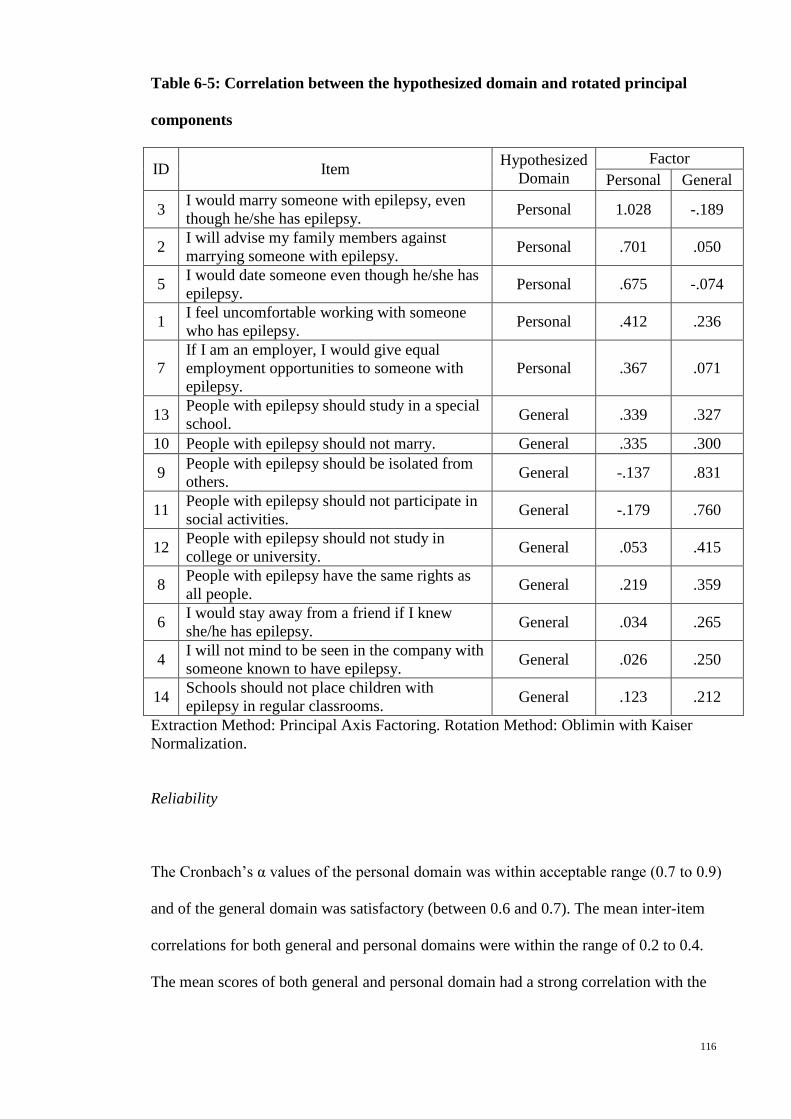
116
Table 6-5: Correlation between the hypothesized domain and rotated principal
components
ID Item Hypothesized Domain
Factor Personal General
3 I would marry someone with epilepsy, even though he/she has epilepsy. Personal 1.028 -.189
2 I will advise my family members against marrying someone with epilepsy. Personal .701 .050
5 I would date someone even though he/she has epilepsy. Personal .675 -.074
1 I feel uncomfortable working with someone who has epilepsy. Personal .412 .236
7 If I am an employer, I would give equal employment opportunities to someone with epilepsy.
Personal .367 .071
13 People with epilepsy should study in a special school. General .339 .327
10 People with epilepsy should not marry. General .335 .300
9 People with epilepsy should be isolated from others. General -.137 .831
11 People with epilepsy should not participate in social activities. General -.179 .760
12 People with epilepsy should not study in college or university. General .053 .415
8 People with epilepsy have the same rights as all people. General .219 .359
6 I would stay away from a friend if I knew she/he has epilepsy. General .034 .265
4 I will not mind to be seen in the company with someone known to have epilepsy. General .026 .250
14 Schools should not place children with epilepsy in regular classrooms. General .123 .212
Extraction Method: Principal Axis Factoring. Rotation Method: Oblimin with Kaiser Normalization.
Reliability
The Cronbach’s α values of the personal domain was within acceptable range (0.7 to 0.9)
and of the general domain was satisfactory (between 0.6 and 0.7). The mean inter-item
correlations for both general and personal domains were within the range of 0.2 to 0.4.
The mean scores of both general and personal domain had a strong correlation with the

117
total mean score, as shown in Table 6-6. Corrected item-total correlation of all items
were 0.3 and above except items 4, 6 and 14 (Table 6-3).
Table 6-6: Internal reliability and convergent validity of each domain
Domain (number of items)
Mean (SD)
Reliability (Cronbach’s α)
Mean inter-item correlation
Convergent Validity
(correlation with total score)
General domain (9) 2.08 (0.49)
0.693 0.206 0.899*
Personal domain (5) 2.41 (0.66)
0.773 0.399 0.785*
*significant at p<0.001
Discussion
This study showed that the Chinese PATE scale is a validated and reliable translated
version, which was translated according to standard principles12, and tested with
multitrait analysis and principal-axis factor analysis, with an acceptable internal
consistency with a Cronbach’s α values of 0.693 and 0.773 for the general and personal
domains.
Though a convenient sampling was employed in this study, an attempt to recruit
participants with a wide-range of age (18-72 years) and socio-economic status was
made, with equal gender representation and the mean age of this cohort was compatible
to the initial cohort10 (41.8 vs. 41.4 years respectively). This will ease the generalisation
of the results to the general Chinese population from the same region.
The translated version had fulfilled the criteria for equal item variance, convergent and
discriminant validity, based on the results shown in table 6-2 and 6-3.
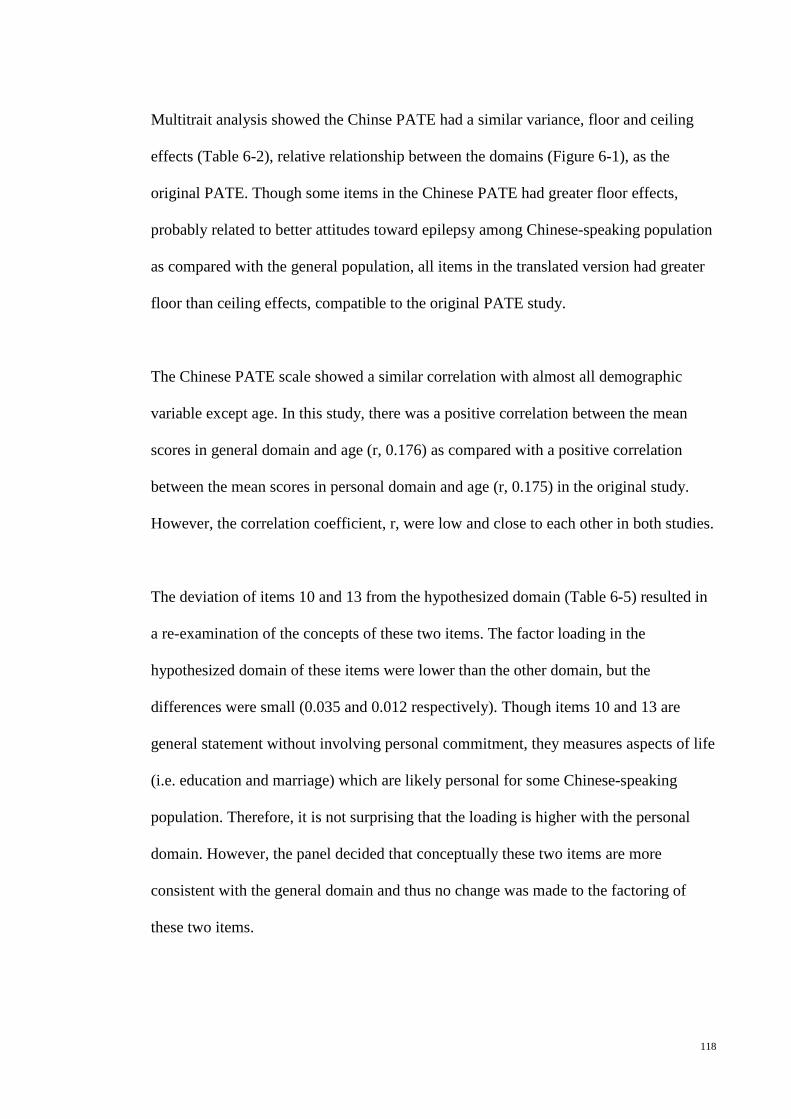
118
Multitrait analysis showed the Chinse PATE had a similar variance, floor and ceiling
effects (Table 6-2), relative relationship between the domains (Figure 6-1), as the
original PATE. Though some items in the Chinese PATE had greater floor effects,
probably related to better attitudes toward epilepsy among Chinese-speaking population
as compared with the general population, all items in the translated version had greater
floor than ceiling effects, compatible to the original PATE study.
The Chinese PATE scale showed a similar correlation with almost all demographic
variable except age. In this study, there was a positive correlation between the mean
scores in general domain and age (r, 0.176) as compared with a positive correlation
between the mean scores in personal domain and age (r, 0.175) in the original study.
However, the correlation coefficient, r, were low and close to each other in both studies.
The deviation of items 10 and 13 from the hypothesized domain (Table 6-5) resulted in
a re-examination of the concepts of these two items. The factor loading in the
hypothesized domain of these items were lower than the other domain, but the
differences were small (0.035 and 0.012 respectively). Though items 10 and 13 are
general statement without involving personal commitment, they measures aspects of life
(i.e. education and marriage) which are likely personal for some Chinese-speaking
population. Therefore, it is not surprising that the loading is higher with the personal
domain. However, the panel decided that conceptually these two items are more
consistent with the general domain and thus no change was made to the factoring of
these two items.
119
The reliability of the Chinese PATE was confirmed by a Cronbach’s α value that was
within acceptable range in the personal domain and satisfactory range in the general
domain. In addition, the mean inter-item correlations were within the acceptable range.
Though there were three items with corrected item-total correlation below 0.3, they
were nonetheless all above 0.2. Corrected item-total correlation above 0.2 was viewed
as acceptable by some authors16, and was decided by the panel that these items should
not be removed from the scale.
Conclusion
The Chinese PATE scale is a validated and reliable translated version in measuring the
public attitudes toward epilepsy.
References
1. Jacoby A. Stigma, epilepsy, and quality of life. Epilepsy & Behavior
2002;3:S10–S20.
2. Boer H, Mula M, Sander J. The global burden and stigma of epilepsy. Epilepsy
& Behavior 2008;12:540-6.
3. Lim KS, Lim CH, Tan CT. Attitudes toward epilepsy, a systematic review.
Neurol Asia 2011;16:269-80.
4. Kobau R, Price P. Knowledge of epilepsy and familiarity with this disorder in
the US population: Results from the 2002 HealthStyles Survey. Epilepsia
2003;44:1449-54.

120
5. Antonak RF. Psychometric analysis and validation of the scale of Attitudes
Toward Persons with Epilepsy: Journal of Epilepsy. 3 (1) (pp 11-16), 1990. Date of
Publication: 1990.
6. Lee SA, Yim SB, Rho YI, et al. Factors contributing to Korean teachers'
attitudes toward students with epilepsy. Epilepsy Behav 2011;20:378-81.
7. Aydemir N. Familiarity with, knowledge of, and attitudes toward epilepsy in
Turkey. Epilepsy Behav 2011;20:286-90.
8. Lowe-Pearce C, Camfield CS. Elementary school epilepsy survey (ESES): a
new measure of elementary school students' knowledge and attitudes about epilepsy.
Epilepsy Behav 2005;7:687-96.
9. Link BG, Phelan JC. Conceptualizing Stigma. Annu Rev Sociol 2001:363-85.
10. Lim KS, Wu C, Choo WY, Tan CT. Development and validation of a Public
Attitudes Towards Epilepsy (PATE) scale. Epilepsy and Behavior 2012;24:207-12.
11. Ware JE, Jr., Keller SD, Gandek B, Brazier JE, Sullivan M. Evaluating
translations of health status questionnaires. Methods from the IQOLA project.
International Quality of Life Assessment. International journal of technology
assessment in health care 1995;11:525-51.
12. Wild D, Grove A, Martin M, et al. Principles of Good Practice for the
Translation and Cultural Adaptation Process for Patient-Reported Outcomes (PRO)
Measures: report of the ISPOR Task Force for Translation and Cultural Adaptation.
Value Health 2005;8:94-104.
13. DeVellis RF. Scale development: Theory and applications 2nd ed. Thousand
Oaks, California: Sage; 2003.
14. Briggs SR, Cheek JM. The role of factor analysis in the development and
evaluation of personality traits. J Pers 1986;54:106-48.
15. Field A. Discovering Statistics Using SPSS. 2nd ed. London: Sage; 2005.

121
16. Everitt BS. The Cambridge Dictionary of Statistics. 2nd ed2002.

122
Appendix 4: Chinese translated version of PATE scale
说明:尽可能自发地回答以下问题。答案并无对和错。每个问题有如下五种选择。请圈出最靠接近你的想法的答案。
非常不认同
不认同
不肯定
认同
非常认同
1. 有癫痫症的人不应该在学院或大学读书。 1 2 3 4 5
2. 有癫痫症的人拥有和全部人同等的权利。 1 2 3 4 5
3. 有癫痫症的人应该和其他人隔绝。 1 2 3 4 5
4. 有癫痫症的人不应该参加社会活动。 1 2 3 4 5
5. 我不介意被人看见和一位有癫痫症的人在一起。
1 2 3 4 5
6. 有癫痫症的人不应该结婚。 1 2 3 4 5
7. 我会远离一个朋友,如果我知道她/他有癫痫症。
1 2 3 4 5
8. 有癫痫症的人应在特殊学校学习。 1 2 3 4 5
9. 学校不应该把有癫痫病的儿童纳入普通课室。 1 2 3 4 5
10. 我会和男/女生约会,就算他/她有癫痫症。 1 2 3 4 5
11. 我会和有癫痫症的人结婚,就算他有癫痫症。 1 2 3 4 5
12. 和有癫痫症的人一起工作,我会觉得不舒服。 1 2 3 4 5
13. 我会劝告我的家人不要和有癫痫症的人结婚。 1 2 3 4 5
14. 如果我是雇主,我会给有癫痫症的人同等的就业机会。
1 2 3 4 5
123
Chapter 7: A web-based survey of attitudes toward epilepsy in secondary and
tertiary students in Malaysia, using the Public Attitudes Toward Epilepsy (PATE) scale.
(Published as Lim KS, Hills MD, Choo WY, Wong MH, Wu C, Tan CT. A web-based
survey of attitudes toward epilepsy in secondary and tertiary students in Malaysia,
using the Public Attitudes Toward Epilepsy (PATE) scale. Epilepsy & Behavior
2013;26:158-61.)
Abstract
Background: Students’ attitudes toward epilepsy have been studied in few countries
but none of the studies used a quantitative scale. We aimed to determine the validity and
reliability of the Public Attitudes Toward Epilepsy (PATE) scale in a homogenous
population consisting of secondary and tertiary students in Malaysia, and to quantify
their attitudes toward epilepsy, using a web-based survey. Results: A total of 227
respondents with a mean age of 19.6±2.07 years, predominantly Chinese (85%), female
(62%) and in a pre-university education level (71%) completed the web-based survey.
Psychometric testing showed that the PATE is a valid and reliable scale to be applied in
a homogenous population. The mean score in the personal domain was significantly
higher than that in the general domain (2.73±0.61 vs. 2.12±0.60 respectively, p<0.001).
Compared with a study previously performed on a general population (Lim et al., 2012),
the mean score in the general domain was significantly lower (p<0.01); whereas there
was no significant difference between the mean scores in the personal domain. The
mean scores for the general domain were significantly lower for those with tertiary
education (p<0.001), but did not correlate with gender and ethnicity. Conclusion: The
124
attitudes of secondary and tertiary students are better than those of the general
population in the general domain, but not in the personal domain.
(217 words)
Key words: Epilepsy, students, attitudes, stigma, scale
Introduction
Public attitudes in secondary or tertiary students have been studied in Cameroon 1-3,
India 4,5, Kuwait 6, Tanzania 7, and Turkey 8, and showed better attitudes toward
epilepsy amongst students than in the general community in most countries, except
Turkey. A systematic review by the first author 9 had concluded that the questions used
in these studies were not standardized, making direct comparison between these
countries difficult. In addition, only yes-no questions were used in these studies, making
quantification of the attitudes toward epilepsy impossible.
The Public Attitudes Toward Epilepsy (PATE) scale was performed in a general
population and factored into two domains, i.e. a general domain that required minimal
or no consideration of respondents’ involvement, and a personal domain that required a
long-term personal commitment or involvement. 10 As reported in the previous study,
the mean scores of those with tertiary education were significantly lower for the general
domain but not the personal domain and age was positively correlated with the mean
scores in the personal domain but not the general domain. 10 Therefore, it is postulated
that the secondary and tertiary students will score lower in the general domain but not
the personal domain. However, in order to apply the scale for future comparison, it is
essential to test the reliability and validity of this scale in a homogenous group.
125
Web-based survey or online survey is becoming more popular in research, accounted
for 20% of global-data-collection expenditure in 2006. 11 There are several advantages
to using a web-based survey, including faster and simpler data collection, cheaper cost,
applicability of restriction to avoid missing data, and more importantly minimal social
desirability effects as a result of being less intrusive 12.
This study therefore aimed to test the reliability and validity of this scale in a
homogenous group and quantify the attitudes toward epilepsy in secondary and tertiary
students in Malaysia, using a web-based design with a quantitative scale (PATE). A
comparison with the previous study in general population will also be performed.
Methodology
1. Sample recruitment
This was the first web-based survey of public attitudes toward epilepsy in Malaysia, as
well as in Asia, and was performed after approval from the ethics committees at the
University Malaya Medical Center (MEC Ref No: 878.10). Two hundred and seventy
five high school and college students from Petaling Jaya and Kuala Lumpur in Malaysia
were selected through convenient sampling and invited to participate in this survey
through an email invitation from the research team and 227 (82.5%) responded.
Responding to the email invitation was regarded as giving consent. All questionnaires
were administered anonymously.
126
2. Measures
The Public Attitudes Toward Epilepsy (PATE) scale is a 14-item scale measuring the
public attitudes toward epilepsy 10. A 5-point Likert scale was used for scoring with 1
being strongly disagree and 5 being strongly agree. Positively stated items were reverse
scored so that a higher score would indicate a more negative attitude. This scale was
performed in a general population and factored into two domains, i.e. a general domain
(nine items) that required minimal or no consideration of respondents’ involvement, and
a personal domain (five items) that required a long-term personal commitment or
involvement such as marrying a person with epilepsy, working with them or employing
them. This is a validated scale with good internal consistency (Cronbach’s alpha of
0.868 and 0.633, in the general and personal domains respectively).
A form comprising the 14-item in PATE scale was designed in the SurveyMonkey
website, which allowed the researchers to send out email invitations. Responding to a
link in the email allowed the respondents to enter their answers, which were saved
automatically into a database. Every item had to be answered before the respondents
were allowed to proceed to the next item, to avoid missing data. The instructions
emphasized that the scale was not a test, but rather an opinion questionnaire.
Demographic data were also collected on the subject’s gender, age, ethnicity, highest
education level, and the presence of family member(s) with epilepsy or seizures.
127
3. Statistical analysis
This study employed the Statistical Package for Social Sciences version 19 (SPSS 19.0)
for data analysis. All demographic data was analyzed descriptively, with nominal data
presented as frequencies as well as percentages, while continuous data were presented
as means and standard variations. For continuous data, independent t-tests were used for
group comparison.
Psychometric properties of the PATE in a specific population
The psychometric testing was based on the following assumptions:
1. Items measuring the same concept should have approximately equal variances
(standard deviations); a test of equal item variance.
2. Items should be internally consistent, assessed as having item-total correlations of
0.4 and above.
3. Items in a given scale should contain approximately the same proportion of
information about a concept, with roughly equal item-total correlations.
4. An item should correlate more highly with its hypothesized scale than with scales
measuring other concepts (item discriminant validity), tested with correlation
analysis. Pearson correlation coefficients of 0.5 to 1.0 were accepted as indicators of
strong correlation.13
5. Scale scores should be reproducible (assessed by Cronbach’s α coefficient) and
interpretable (i.e. the correlation between scales should be less than their internal
reliability coefficients if each scale measures a unique concept). Cronbach’s α
values of 0.7 to 0.9 were considered acceptable 14; whereas values of 0.6 to 0.7 were
considered satisfactory. Mean inter-item correlation was used if α values were

128
below 0.7, and a range of 0.2 to 0.4 was used to ensure that items were measuring
the same construct. 15
Comparison between the scores in personal and general domains
The difference between the mean scores in the personal and general domain was tested
with a paired samples t-test. In order to test whether the score on the personal domain in
the PATE scale was influenced by the score on the general domain, regression analysis
was performed.
Comparison with previous study
Independent t-tests were calculated using OpenEpi 16, an open software, to determine
the significance of differences in the mean scores between the current and the previous
studies.
Results
Demographic characteristics of the sample
A total of 227 respondents completed the web-survey. The mean age of the respondents
was 19.6 ± 2.07 years (ranging from 17 to 28 years). The respondents were
predominantly female (62.1%) and Chinese (85.5%). 12.8% of the respondents were at
secondary level, 71.4% at pre-university level and 15.9% at tertiary level. 2.6% of the
respondents had family member(s) with epilepsy or seizures.
129
Psychometric properties of the PATE scale for secondary and tertiary students
As a test of equal item variance, the standard variations of the items in the personal and
general domains were measured. Within the personal domain, the standard variations of
all items were approximately equal, ranging from 0.88 to 1.12. The standard variations
of items within the general domain were also approximately equal (ranging from 0.80-
1.08), as shown in Table 7-1.
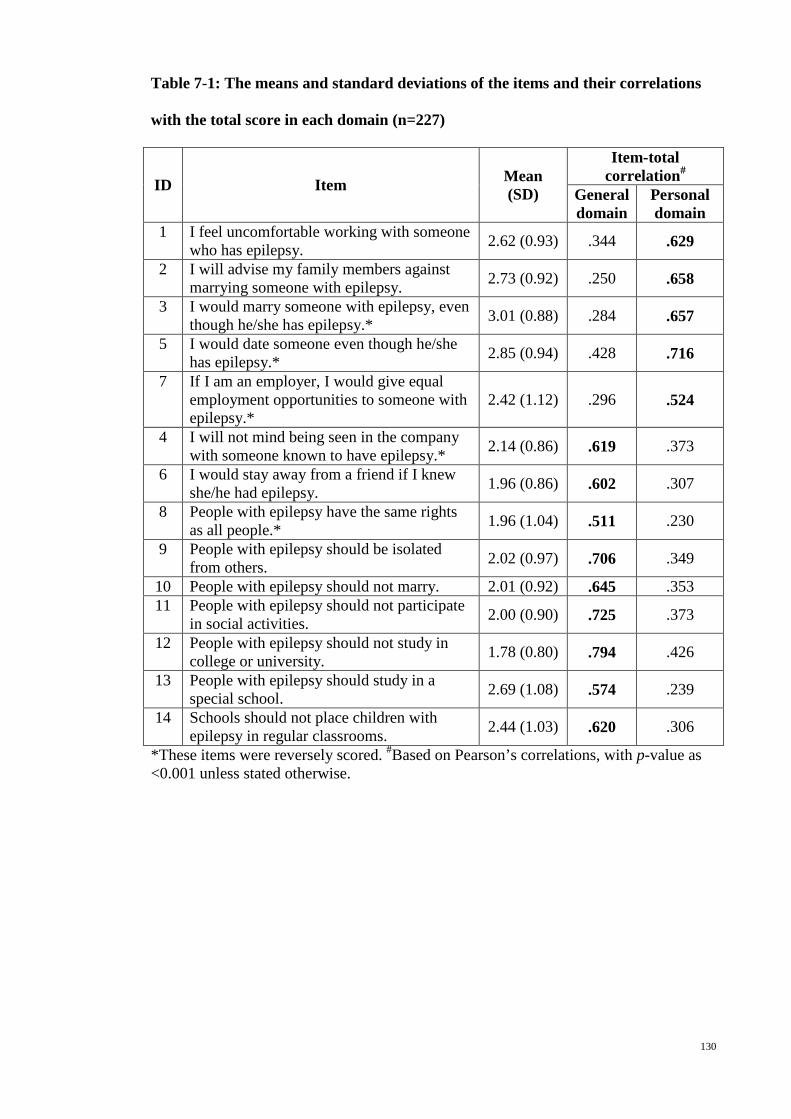
130
Table 7-1: The means and standard deviations of the items and their correlations
with the total score in each domain (n=227)
ID Item Mean (SD)
Item-total correlation#
General domain
Personal domain
1 I feel uncomfortable working with someone who has epilepsy. 2.62 (0.93) .344 .629
2 I will advise my family members against marrying someone with epilepsy. 2.73 (0.92) .250 .658
3 I would marry someone with epilepsy, even though he/she has epilepsy.* 3.01 (0.88) .284 .657
5 I would date someone even though he/she has epilepsy.* 2.85 (0.94) .428 .716
7 If I am an employer, I would give equal employment opportunities to someone with epilepsy.*
2.42 (1.12) .296 .524
4 I will not mind being seen in the company with someone known to have epilepsy.* 2.14 (0.86) .619 .373
6 I would stay away from a friend if I knew she/he had epilepsy. 1.96 (0.86) .602 .307
8 People with epilepsy have the same rights as all people.* 1.96 (1.04) .511 .230
9 People with epilepsy should be isolated from others. 2.02 (0.97) .706 .349
10 People with epilepsy should not marry. 2.01 (0.92) .645 .353 11 People with epilepsy should not participate
in social activities. 2.00 (0.90) .725 .373
12 People with epilepsy should not study in college or university. 1.78 (0.80) .794 .426
13 People with epilepsy should study in a special school. 2.69 (1.08) .574 .239
14 Schools should not place children with epilepsy in regular classrooms. 2.44 (1.03) .620 .306
*These items were reversely scored. #Based on Pearson’s correlations, with p-value as <0.001 unless stated otherwise.
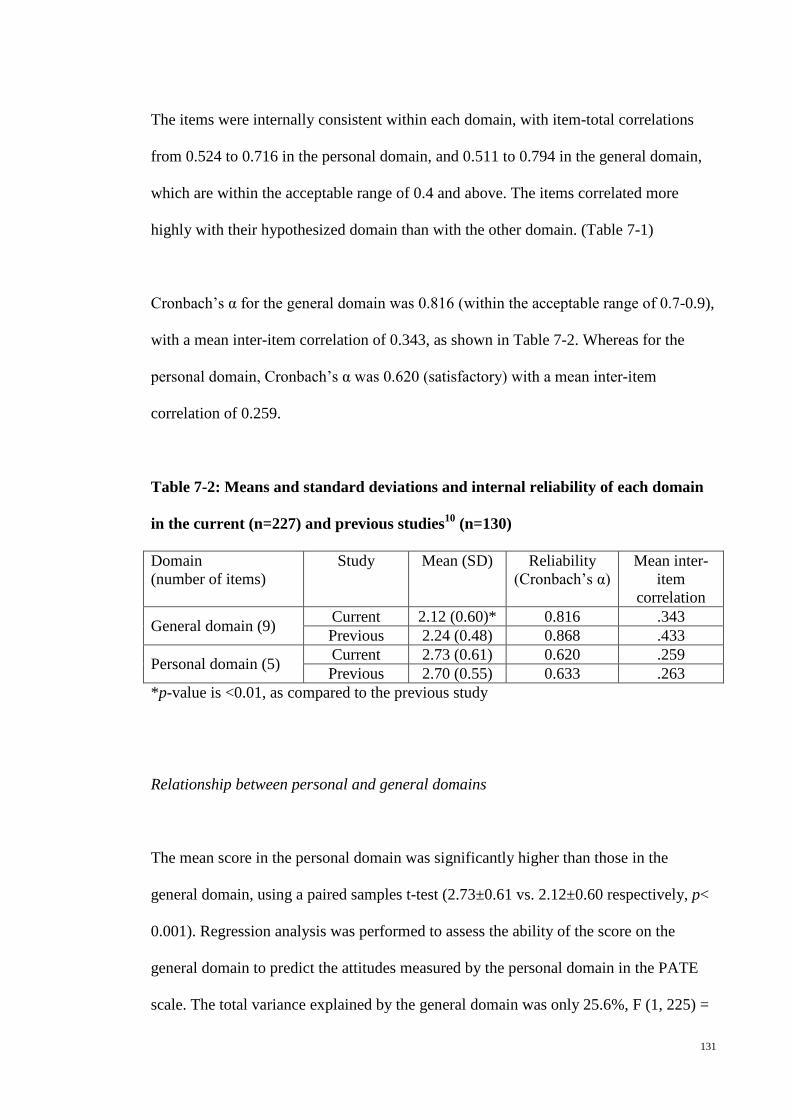
131
The items were internally consistent within each domain, with item-total correlations
from 0.524 to 0.716 in the personal domain, and 0.511 to 0.794 in the general domain,
which are within the acceptable range of 0.4 and above. The items correlated more
highly with their hypothesized domain than with the other domain. (Table 7-1)
Cronbach’s α for the general domain was 0.816 (within the acceptable range of 0.7-0.9),
with a mean inter-item correlation of 0.343, as shown in Table 7-2. Whereas for the
personal domain, Cronbach’s α was 0.620 (satisfactory) with a mean inter-item
correlation of 0.259.
Table 7-2: Means and standard deviations and internal reliability of each domain
in the current (n=227) and previous studies10 (n=130)
Domain (number of items)
Study Mean (SD) Reliability (Cronbach’s α)
Mean inter-item
correlation
General domain (9) Current 2.12 (0.60)* 0.816 .343 Previous 2.24 (0.48) 0.868 .433
Personal domain (5) Current 2.73 (0.61) 0.620 .259 Previous 2.70 (0.55) 0.633 .263
*p-value is <0.01, as compared to the previous study
Relationship between personal and general domains
The mean score in the personal domain was significantly higher than those in the
general domain, using a paired samples t-test (2.73±0.61 vs. 2.12±0.60 respectively, p<
0.001). Regression analysis was performed to assess the ability of the score on the
general domain to predict the attitudes measured by the personal domain in the PATE
scale. The total variance explained by the general domain was only 25.6%, F (1, 225) =
132
77.53, p<0.001, as demonstrated graphically by the scatter plot and linear curve
estimation in figure 7-1.
Figure 7-1: Linear curve estimation on how scores on the general domain related
to the scores on the personal domain (n=227).
Comparison with previous study
As shown in figure 7-2, the mean score on the general domain was significantly lower
than in the previous study performed on a general population (p<0.01); whereas there
was no significant difference between the mean scores on the personal domain.
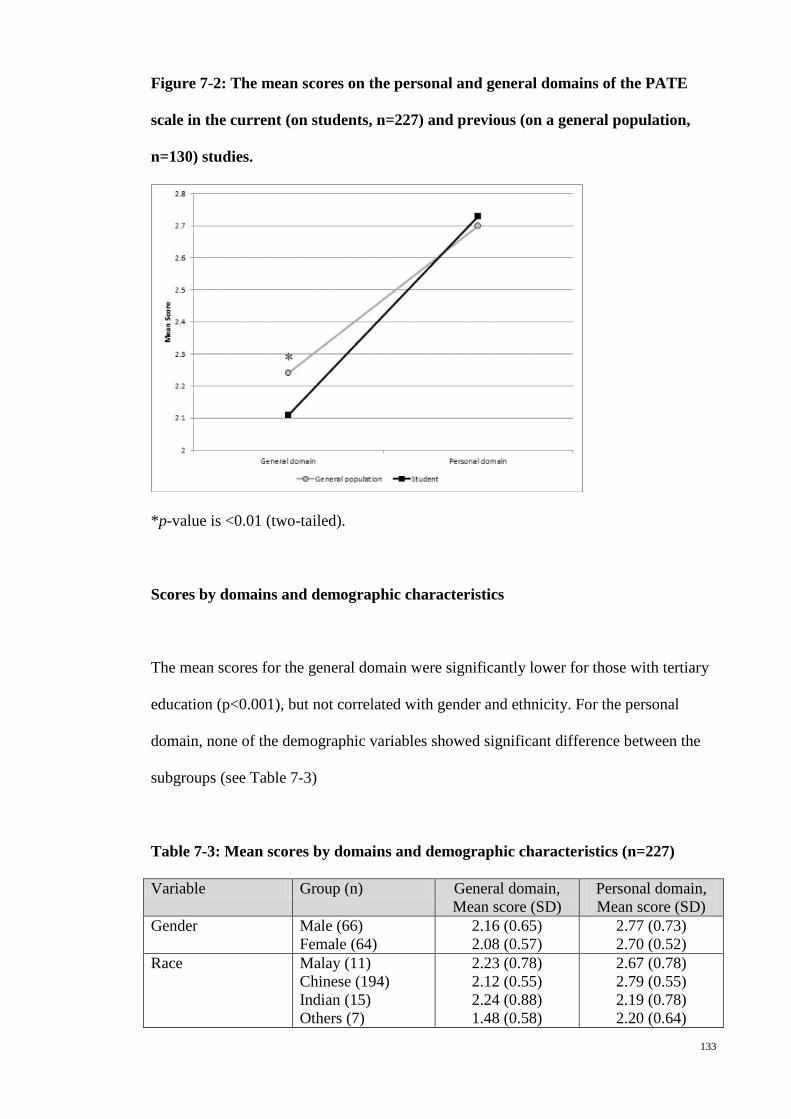
133
Figure 7-2: The mean scores on the personal and general domains of the PATE
scale in the current (on students, n=227) and previous (on a general population,
n=130) studies.
*p-value is <0.01 (two-tailed).
Scores by domains and demographic characteristics
The mean scores for the general domain were significantly lower for those with tertiary
education (p<0.001), but not correlated with gender and ethnicity. For the personal
domain, none of the demographic variables showed significant difference between the
subgroups (see Table 7-3)
Table 7-3: Mean scores by domains and demographic characteristics (n=227)
Variable Group (n) General domain, Mean score (SD)
Personal domain, Mean score (SD)
Gender
Male (66) Female (64)
2.16 (0.65) 2.08 (0.57)
2.77 (0.73) 2.70 (0.52)
Race Malay (11) Chinese (194) Indian (15) Others (7)
2.23 (0.78) 2.12 (0.55) 2.24 (0.88) 1.48 (0.58)
2.67 (0.78) 2.79 (0.55) 2.19 (0.78) 2.20 (0.64)

134
Education level Secondary (29) Pre-university
(162) Tertiary (36)
1.99 (0.47) 2.20 (0.61)
1.79 (0.55)*
2.58 (0.54) 2.76 (0.62) 2.69 (0.60)
Family member with epilepsy/seizures
Yes (6) No (221)
1.83 (0.25) 2.12 (0.61)
2.80 (0.67) 2.72 (0.60)
*p-value is < 0.001, as compared to the mean scores for those at either the secondary or pre-university levels
Discussion
This study showed that the PATE scale is a validated and reliable scale to measure
attitudes towards epilepsy in a homogenous group, which fulfilled the assumptions of (1)
equal item variance, with the items within the same domain having approximately equal
variances, (2) internal consistency, with all item-total correlations above 0.4, (3) equal
item-total correlation, (4) item discriminant validation, with all items correlating more
strongly with their domain total, as compared to their correlation with other domain, and
(5) reproducibility, with acceptable Cronbach’s α of 0.816 and 0.620 in the general and
the personal domains respectively.
The psychometric properties of the PATE scale in the current study were comparable to
those found in the previous study, with good item discriminant validation in each
domain and internal consistency. The degree of internal consistency as measured by
Cronbach’s α in the current study was comparable to those in the previous study, i.e.
0.816 vs. 0.868 in the general domain and 0.620 vs. 0.633 in the personal domain. The
item-to-total correlations in the current study were all above 0.4, better as compared to
some item-to-total correlations in the previous study below 0.4, probably because the
current study was performed in a homogenous group.

135
Although the mean score on the personal domain was significantly correlated with the
mean score on the general domain, the correlation coefficient was lower than the
internal reliability coefficients, supporting the contention that each domain was
measuring a unique concept. Regression analysis demonstrated that only 25.6% of the
variance of the score in personal domain was explained by the score in general domain.
This indicates that there are other factors, beside those covered by the general domain,
that influence the score on the personal domain. Future studies determining the
predictive or correlated factors covered by the attitudes in the personal domain will be
important to help overcoming stigma in epilepsy.
As shown in this study, the attitudes of the students for the general domain were
significantly better than the attitudes of a general population. This is consistent with the
findings of previous studies on the public attitudes of students. 1-7 However, such a
relationship was not found in the personal domain.
Similarly, a positive correlation between the education level and the attitudes toward
epilepsy was noted for the general domain but not for the personal domain. This is
consistent with the results noted in the initial PATE study, which reported a positive
correlation between increased education and better attitudes towards epilepsy only in
the general domain. 10 This supports the notion proposed in that study that there is an
isolation of generalized knowledge-based attitude versus an interpersonal emotion-
based attitude towards perceiving people with epilepsy.
136
Limitations
Some concern had been felt that social desirability may have affected the results
obtained from the public survey. An interview with paper-and-pencil is more intrusive,
causing a tendency to answer more positively. A web-based survey tends to minimize
social desirability effects, and thus the results will tend to be more negative, especially
when answering the questions in the personal domain. This possibility had to be taken
into consideration when interpreting the results.
A second limitation was that the study method required fluency and reading
comprehension in English, as well as access to the web, which could have biased the
sample. However, learning English is part of the primary and secondary education
system in Malaysia, and most families or schools have access to the web.
This study recruited students from private colleges and Chinese secondary school,
resulting in majority (85.5%) of the participants were Chinese, which is
disproportionate to the ethnic distribution in Malaysia with only 24.6% Chinese.
Study implications
As far as is known, this is the first study on attitudes toward epilepsy using a web-based
survey. This ensured an easier, simpler and more reliable data collection, with possibly
less social desirability effects. This should enable standardized replication of the study,
and increase the ease of comparison, either with other populations or longitudinally in
the same population.
137
This study has demonstrated the validity and reliability of the PATE scale in a
homogenous population, and thus allows the scale to be applied to either a general or a
specific population. In addition, differences between the scores of different populations
can be tested quantitatively.
Conclusion
The PATE scale is a validated and reliable scale to measure attitudes toward epilepsy in
a homogenous population, and can be delivered through a web-based survey. The
attitudes of secondary and tertiary students are better than the general population for the
general domain, but not the personal domain.
References
1. Njamnshi AK, Angwafor SA, Baumann F, Angwafo FF, Jallon P, Muna WFT.
Knowledge, attitudes, and practice of Cameroonian medical students and graduating
physicians with respect to epilepsy. Epilepsia 2009;50:1296-9.
2. Njamnshi AK, Angwafor SA, Jallon P, Muna WFT. Secondary school students'
knowledge, attitudes, and practice toward epilepsy in the Batibo Health District--
Cameroon. Epilepsia 2009;50:1262-5.
3. Njamnshi AK, Tabah EN, Bissek A-CZ-K. Knowledge, attitudes and practice
with respect to epilepsy among secondary school students in the Kumbo West Health
District - North West Region- Cameroon. Epilepsy Behav 2010;18:247-53.
4. Goel D, Dhanai JS, Agarwal A, Mehlotra V, Saxena V. Knowledge, attitude and
practice of epilepsy in Uttarakhand, India. Annals of Indian Academy of Neurology
2011;14:116-9.
138
5. Pandian JD, Santosh D, Kumar TS, Sarma PS, Radhakrishnan K. High school
students' knowledge, attitude, and practice with respect to epilepsy in Kerala, southern
India. Epilepsy Behav 2006;9:492-7.
6. Al-Rashed H, Al-Yahya D, Al-Kandari A, Shehab Aa, Al-Sabah R, Al-Taiar A.
Knowledge of, perceptions of, and attitudes toward epilepsy among university students
in Kuwait. Epilepsy Behav 2009;14:367-71.
7. Matuja WB, Rwiza HT. Knowledge, attitude and practice (KAP) towards
epilepsy in secondary school students in Tanzania. Cent Afr J Med 1994;40:13-8.
8. Bozkaya IO, Arhan E, Serdaroglu A, Soysal AS, Ozkan S, Gucuyener K.
Knowledge of, perception of, and attitudes toward epilepsy of schoolchildren in Ankara
and the effect of an educational program. Epilepsy Behav 2010;17:56-63.
9. Lim KS, Lim CH, Tan CT. Attitudes toward epilepsy, a systematic review.
Neurol Asia 2011;16:269-80.
10. Lim KS, Wu C, Choo WY, Tan CT. Development and validation of a Public
Attitudes Towards Epilepsy (PATE) scale. Epilepsy & Behavior 2012;24:207-12.
11. Vehovar V, Lozar Manfreda K. Overview: Online Surveys. In: Fielding N, Lee
RM, Blank G, eds. The SAGE Handbook of Online Research Methods. London: SAGE;
2008:177-94.
12. Kiesler S, Sproull LS. Response effects in the electronic survey. Public Opin Q
1986;50:402-13.
13. Cohen JW. Statistical power analysis for the behavioral sciences. 2nd ed.
Hillsdale, NJ: Lawrence Erlbaum Associates; 1988.
14. DeVellis RF. Scale development: Theory and applications 2nd ed. Thousand
Oaks, California: Sage; 2003.
15. Briggs SR, Cheek JM. The role of factor analysis in the development and
evaluation of personality traits. J Pers 1986;54:106-48.

139
16. OpenEpi: Open Source Epidemiologic Statistics for Public Health , Version
2.3.1. (Accessed 2012/04/29, at www.OpenEpi.com.)
140
Chapter 8: Attitudes toward epilepsy among teachers in Malaysia, using the Public
Attitudes Toward Epilepsy (PATE) scale.
(Published as Lim KS, Hills MD, Choo WY, Wong MH, Wu C, Tan CT. Attitudes toward
epilepsy among the primary and secondary school teachers in Malaysia, using the
Public Attitudes Toward Epilepsy (PATE) scale. Epilepsy Research 2013; 106 (3):433-
9.)
Abstract
Introduction: There is a lack of study comparing the attitudes toward epilepsy between
the teachers and general population, teachers and students, using a similar quantitative
scale. Methods: This study was performed in one primary and one secondary school in
Kuala Lumpur, Malaysia, using the Public Attitudes Toward Epilepsy (PATE) scale.
Results: A total of 186 teachers aged 39.6 ± 10.4 years completed the questionnaire.
The mean scores in both personal and general domains of PATE scale were
significantly better in the teachers, comparing to the scores in the secondary and college
students reported in previous study (Lim et al., 2013; p<0.001 and <0.05 respectively).
The mean scores in personal domain was significantly better in the teachers, comparing
to the general population reported by Lim et al. (2012; p<0.001). This hold true when
comparing teachers with general population with tertiary education, suggesting that the
better attitude is specific to the job, rather than tertiary education generally. Subanalysis
showed that the attitudes of teachers were significantly better than the general
population and the students related to employment and social life, but were equally
negative on issues directly related to education, such as placing children with epilepsy
in regular classes. Conclusion: Teachers had more positive attitudes toward epilepsy as
141
compared with the general population with tertiary education. Attitude to epilepsy may
differ specific to types of work.
Introduction
Epilepsy is a disorder of the brain that is characterized by an enduring predisposition to
generate seizures and by its neurobiological, cognitive, psychological, and social
consequences.1 People with epilepsy are burdened by a multitude of social,
psychological and economic consequences of stigmatization which leads to poor quality
of life.2,3 Teachers’ attitudes toward epilepsy can have significant impact on students
with epilepsy, and have been extensively studied in Asia as well as Africa, South and
North America, and Europe. 4
However, a systematic review by the first author 4 had concluded that a standard set of
questions was not used in most of the previous studies, making direct comparison
difficult. In addition, yes-no questions were used in these studies, except two studies 5,6
employed quantitative scale in measuring the attitudes toward epilepsy among teachers,
making quantification of the attitudes toward epilepsy impossible.
There was no comprehensive study comparing the attitudes between teachers and
students, which may inform the teacher-learner difference in attitudes toward epilepsy.
In our previous review 4, we have found that there were limited study using the
percentage of participants with negative attitudes towards social contact in epilepsy,
teachers had better attitudes in Thailand and Turkey 7,8, but conversely in India 9 as
compared to general population or students. There was also no study found examining
142
whether the better attitudes among the teachers as compared to the general population is
due to the effect of tertiary education, or specific to the profession.
The Public Attitudes Toward Epilepsy (PATE) scale was performed in a general
population and factored into two domains, i.e. a general domain that required minimal
or no consideration of respondents’ involvement (e.g., “People with epilepsy have the
same rights as all people.”), and a personal domain that required a long-term personal
commitment or involvement (e.g., “I would date someone even though he/she has
epilepsy.”). 10 Lower score indicate a more positive attitude. As reported in the previous
study, the mean scores of those with tertiary education were significantly lower for the
general domain but not the personal domain and age was positively correlated with the
mean scores in the personal domain but not the general domain. 10,11
This study aimed to determine the teachers’ attitudes toward epilepsy using a
quantitative scale, with direct comparison with the attitudes of students and general
population reported in the previous studies using the same scale. 10,11 In addition, this
study also aimed to compare the attitudes between the primary and secondary school
teachers.
Methodology
1. Sample recruitment
This was the first quantitative study of teachers’ attitudes toward epilepsy in Malaysia,
as well as in Southeast Asia, and was performed after approval from the ethics
committees at the University Malaya Medical Center (MEC Ref No: 878.10). One

143
primary and one secondary schools were selected from the schools in Kuala Lumpur, a
metropolitan city in Malaysia and its adjacent cities through opportunity sampling. Two
hundred and seventy teachers were approached and 186 (68.9%) agreed to participate in
this study. This consisted of 106 respondents from a primary school and 80 from a
secondary school. Answering the questionnaire was regarded as having given consent.
All questionnaires were administered anonymously. The attitudes of the general
population and students toward epilepsy using the PATE scale were quoted, for direct
comparison, from the previous studies performed in the same region by the same
research team. In the study on the attitudes of the general population 10, a total of 130
samples was recruited from the public area in same city, using similar approach. In the
study on the secondary and college students 11, the sample size was 227, recruited using
a web-based survey.
2. Measures
The Public Attitudes Toward Epilepsy (PATE) scale is a 14-item scale measuring the
public attitudes toward epilepsy (Lim, 2012)10. A 1-5 Likert scale was used for scoring
with 1 being strongly disagree and 5 being strongly agree. Some items were reverse
scored so that a higher score would indicate a more negative attitude. This scale was
performed in a general population and factored into two domains, i.e. a general domain
(nine items) that required minimal or no consideration of respondents’ involvement, and
a personal domain (five items) that required a long-term personal commitment or
involvement. This is a validated scale with good internal consistency (Cronbach’s alpha
of 0.868 and 0.633, in the general and personal domains respectively).

144
The instructions emphasized that the scale was not a test, but rather an opinion
questionnaire. The mean score for all items as well as the mean scores in the general
and personal domains were calculated. For subanalysis according to the social aspects
of life, the items in the scale were further subcategorized into four groups, i.e. attitudes
toward marital relationship (items 2, 3, 5 and 10), employment (items 1 and 7),
education (items 12 to 14) and social life (items 4, 6, 9 and 11). Demographic data were
also collected on the subject’s gender, age, ethnicity, marital status, highest education
level, monthly income, and the presence of family member(s) with epilepsy or seizures.
3. Statistical analysis
This study employed the Statistical Package for Social Sciences version 19 (SPSS 19.0)
for data analysis. All demographic data was analyzed descriptively, with nominal data
presented as frequencies as well as percentages, while continuous data were presented
as means and standard variations. Psychometric properties of the PATE scale in
teachers was determined by calculating the Cronbach’s α and mean inter-item
correlation to ensure the consistency of the items in each domain among teachers.
A one-way between-groups analysis of variance was conducted for comparison of the
mean scores between the teachers and the general population, and students, followed by
a post-hoc comparisons. In order to explore whether education level was a cofactor
affecting the difference between the teachers and the general population, a univariate
analysis with education level as a cofactor was performed. In addition, the scores of the
teachers were compared with those of a subgroup of general population with tertiary
education (n=108) extracted from previous study.10

145
Comparison of the scores between the primary and secondary school teachers were
performed using independent student t-tests. Because of the difference in ethnicity and
education level between the two groups, a univariate analysis with ethnicity and
education level as the cofactors was performed to determine whether the difference
between the two groups was affected by these factors.
Results
Demographic characteristics of the sample
A total of 186 respondents completed the questionnaire. The mean age of the
respondents was 39.6 ± 10.4 years (ranging from 20 to 58 years). The respondents were
predominant female (82.8%) and Chinese (76.3%). 75.3% of the respondents were
married, 94.1% had tertiary education and 95.2% were employed full-time. 94.1% had
income above RM2000 (USD 656) a month. 3.8% of the respondents had family
member(s) with epilepsy or seizures.
Psychometric properties of the PATE scale in teachers
The mean score of all 14-item was 2.18 ± 0.53, in which the mean score in general
domain was 1.97 ± 0.59, and in personal domain was 2.40 ± 0.61. Cronbach’s α for the
general domain was 0.815 (within the acceptable range of 0.7-0.9), with a mean inter-
item correlation of 0.342. Whereas for the personal domain, Cronbach’s α was 0.747
(within the acceptable range of 0.7-0.9) with a mean inter-item correlation of 0.373.
146
Attitudes toward epilepsy between the groups
Analysis of variance showed that there were a significant difference in the mean scores
in both personal (p<0.001) and general (p<0.05) domains among the teachers, students
and general population.
Attitudes toward epilepsy between the teachers and students
Post-hoc comparison showed that the mean scores in both personal and general domains
of PATE scale were significantly lower in the teachers, comparing to the secondary and
college students (p<0.001 and <0.05 respectively), as shown in table 8-1. On item
analysis, the teachers scored significantly lower in 8 items and higher in one item (item
10), as compared to the students (Table 8-1). Subanalysis according to social aspects of
life showed that the attitudes of teachers were significantly (p<0.001) better than the
students toward employment and social life, but not toward marital relationship and
education. (Table 8-2)

147
Table 8-1: The means and standard deviations of the scores in each domain and
item, in teachers, students (Lim et al., 2013) and general population (Lim et al.,
2012)
ID Item
Mean (SD)
Teachers (n=186)
Students (n=227)
General populations
(n=130) Personal domain 2.40 (0.61) 2.73 (0.61)
*** 2.72
(0.56)*** 1 I feel uncomfortable working with
someone who has epilepsy. 1.95 (0.79) 2.62 (0.93)***
2.42 (0.87)***
2 I will advise my family members against marrying someone with epilepsy.
2.58 (0.94) 2.73 (0.92) 2.95 (0.91)***
3 I would marry someone with epilepsy, even though he/she has epilepsy.# 2.78 (0.84) 3.01
(0.88)** 3.03 (0.85)*
5 I would date someone even though he/she has epilepsy.# 2.63 (0.87) 2.85 (0.94)* 2.78 (0.84)
7 If I am an employer, I would give equal employment opportunities to someone with epilepsy.#
2.03 (0.88) 2.42 (1.12)***
2.41 (0.96)***
General domain 1.97 (0.59) 2.12 (0.60) * 2.09 (0.59)
4 I will not mind being seen in the company with someone known to have epilepsy. #
1.97 (1.05) 2.14 (0.86) 2.06 (0.77)
6 I would stay away from a friend if I knew she/he had epilepsy. 1.76 (0.91) 1.96 (0.86)* 2.08
(0.92)** 8 People with epilepsy have the same
rights as all people. # 1.62 (0.88) 1.96 (1.04)***
2.05 (0.91)***
9 People with epilepsy should be isolated from others. 1.68 (0.85) 2.02
(0.97)*** 1.94
(0.84)** 10 People with epilepsy should not marry. 2.19 (0.93) 2.01 (0.92)* 2.06 (0.78) 11 People with epilepsy should not
participate in social activities. 1.77 (0.84) 2.00 (0.90)** 2.00 (0.78)*
12 People with epilepsy should not study in college or university. 1.80 (0.79) 1.78 (0.80) 1.82 (0.70)
13 People with epilepsy should study in a special school. 2.50 (1.00) 2.69 (1.08) 2.43 (0.97)
14 Schools should not place children with epilepsy in regular classrooms. 2.41 (1.01) 2.44 (1.03) 2.35 (0.90)
#These items were reversely scored. *p-value is <0.05, ** p-value is <0.01 and *** p-value is <0.001, as compared to current study.
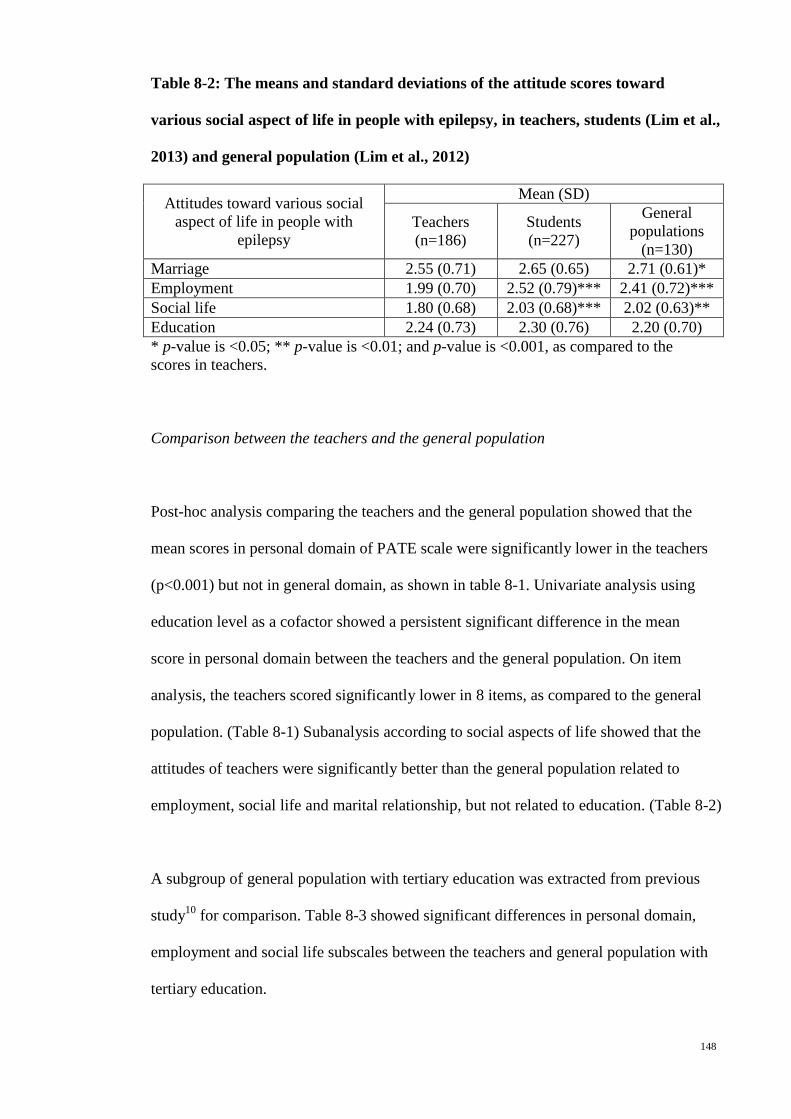
148
Table 8-2: The means and standard deviations of the attitude scores toward
various social aspect of life in people with epilepsy, in teachers, students (Lim et al.,
2013) and general population (Lim et al., 2012)
Attitudes toward various social aspect of life in people with
epilepsy
Mean (SD)
Teachers (n=186)
Students (n=227)
General populations
(n=130) Marriage 2.55 (0.71) 2.65 (0.65) 2.71 (0.61)* Employment 1.99 (0.70) 2.52 (0.79)*** 2.41 (0.72)*** Social life 1.80 (0.68) 2.03 (0.68)*** 2.02 (0.63)** Education 2.24 (0.73) 2.30 (0.76) 2.20 (0.70) * p-value is <0.05; ** p-value is <0.01; and p-value is <0.001, as compared to the scores in teachers.
Comparison between the teachers and the general population
Post-hoc analysis comparing the teachers and the general population showed that the
mean scores in personal domain of PATE scale were significantly lower in the teachers
(p<0.001) but not in general domain, as shown in table 8-1. Univariate analysis using
education level as a cofactor showed a persistent significant difference in the mean
score in personal domain between the teachers and the general population. On item
analysis, the teachers scored significantly lower in 8 items, as compared to the general
population. (Table 8-1) Subanalysis according to social aspects of life showed that the
attitudes of teachers were significantly better than the general population related to
employment, social life and marital relationship, but not related to education. (Table 8-2)
A subgroup of general population with tertiary education was extracted from previous
study10 for comparison. Table 8-3 showed significant differences in personal domain,
employment and social life subscales between the teachers and general population with
tertiary education.
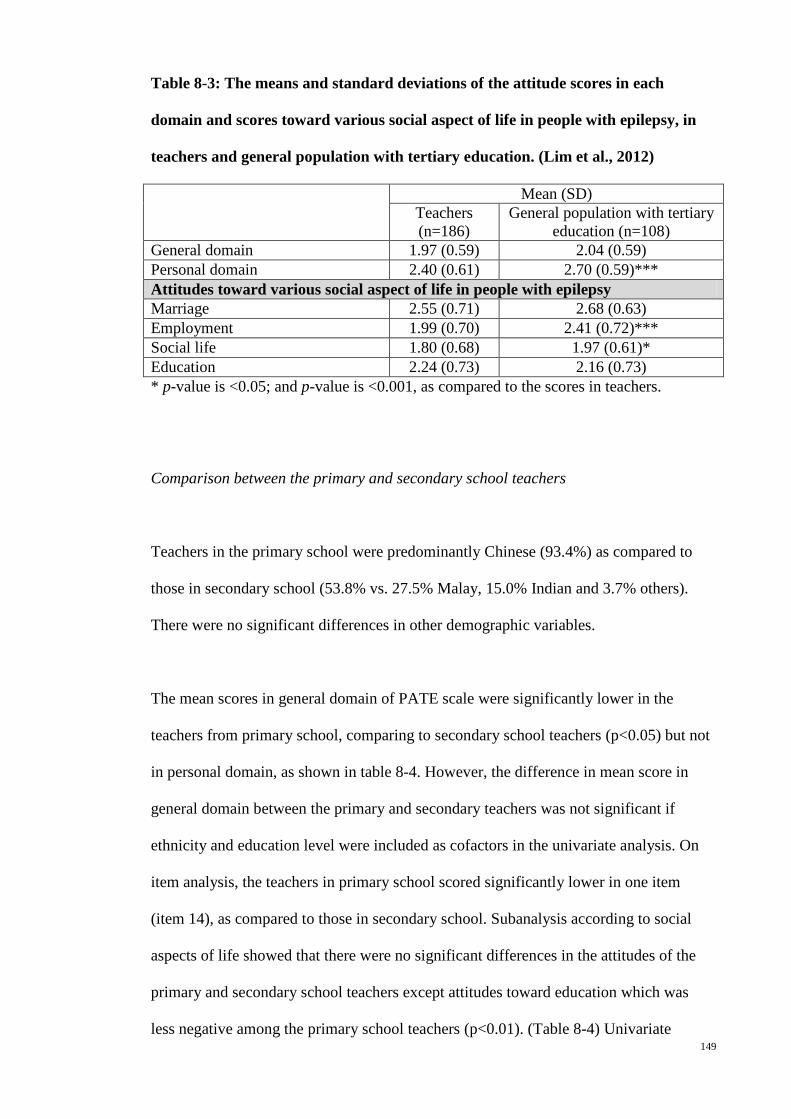
149
Table 8-3: The means and standard deviations of the attitude scores in each
domain and scores toward various social aspect of life in people with epilepsy, in
teachers and general population with tertiary education. (Lim et al., 2012)
Mean (SD) Teachers (n=186)
General population with tertiary education (n=108)
General domain 1.97 (0.59) 2.04 (0.59) Personal domain 2.40 (0.61) 2.70 (0.59)*** Attitudes toward various social aspect of life in people with epilepsy Marriage 2.55 (0.71) 2.68 (0.63) Employment 1.99 (0.70) 2.41 (0.72)*** Social life 1.80 (0.68) 1.97 (0.61)* Education 2.24 (0.73) 2.16 (0.73) * p-value is <0.05; and p-value is <0.001, as compared to the scores in teachers.
Comparison between the primary and secondary school teachers
Teachers in the primary school were predominantly Chinese (93.4%) as compared to
those in secondary school (53.8% vs. 27.5% Malay, 15.0% Indian and 3.7% others).
There were no significant differences in other demographic variables.
The mean scores in general domain of PATE scale were significantly lower in the
teachers from primary school, comparing to secondary school teachers (p<0.05) but not
in personal domain, as shown in table 8-4. However, the difference in mean score in
general domain between the primary and secondary teachers was not significant if
ethnicity and education level were included as cofactors in the univariate analysis. On
item analysis, the teachers in primary school scored significantly lower in one item
(item 14), as compared to those in secondary school. Subanalysis according to social
aspects of life showed that there were no significant differences in the attitudes of the
primary and secondary school teachers except attitudes toward education which was
less negative among the primary school teachers (p<0.01). (Table 8-4) Univariate
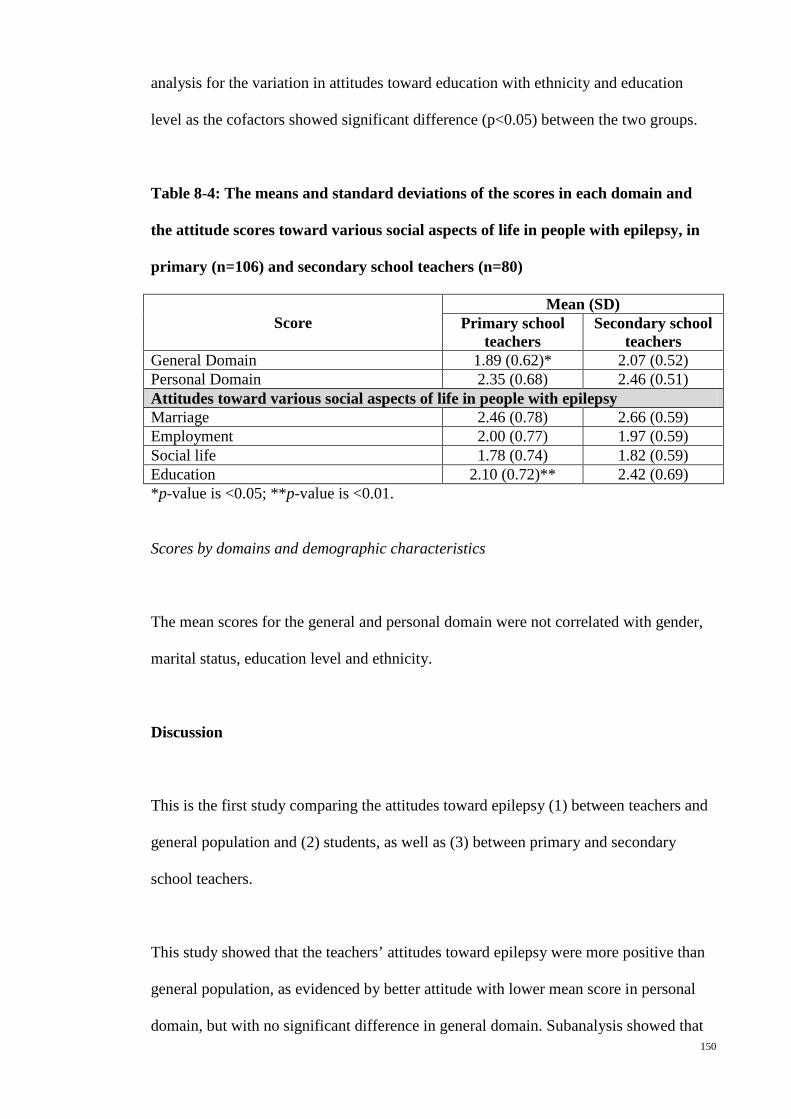
150
analysis for the variation in attitudes toward education with ethnicity and education
level as the cofactors showed significant difference (p<0.05) between the two groups.
Table 8-4: The means and standard deviations of the scores in each domain and
the attitude scores toward various social aspects of life in people with epilepsy, in
primary (n=106) and secondary school teachers (n=80)
Score Mean (SD)
Primary school teachers
Secondary school teachers
General Domain 1.89 (0.62)* 2.07 (0.52) Personal Domain 2.35 (0.68) 2.46 (0.51) Attitudes toward various social aspects of life in people with epilepsy Marriage 2.46 (0.78) 2.66 (0.59) Employment 2.00 (0.77) 1.97 (0.59) Social life 1.78 (0.74) 1.82 (0.59) Education 2.10 (0.72)** 2.42 (0.69) *p-value is <0.05; **p-value is <0.01.
Scores by domains and demographic characteristics
The mean scores for the general and personal domain were not correlated with gender,
marital status, education level and ethnicity.
Discussion
This is the first study comparing the attitudes toward epilepsy (1) between teachers and
general population and (2) students, as well as (3) between primary and secondary
school teachers.
This study showed that the teachers’ attitudes toward epilepsy were more positive than
general population, as evidenced by better attitude with lower mean score in personal
domain, but with no significant difference in general domain. Subanalysis showed that
151
the positive attitudes in teachers are more toward employment issue in people in
epilepsy but not marriage or personal relationship. It is worrying that overall, teachers
did not have a significantly different attitude toward education among people with
epilepsy from the general population, with similar answers to questions 12 to 14, i.e.,
people with epilepsy should not study in college or university, should study in a special
school, and should not be placed in regular classroom. Specific education should be
targeted to overcome this.
Teachers in this cohort were predominantly female, with higher marital rate and
education level, as compared with the general population cohort reported in previous
study.10 We have previously shown that education is associated with better scores
particularly in the general domain.10 When we compared the attitudes among the
teachers with a subgroup of general population with tertiary education (table 8-3), we
found that the teachers also had more positive attitudes than the public with tertiary
education, particularly in the personal domain, especially in employment and social life.
This suggests that the more positive attitudes in teachers might be directly related to the
occupation itself rather than just the higher level of education.
The teachers’ attitudes were more positive toward employment but not marriage, and
this might be related to the personality of a teacher. Using Myers-Briggs type indicator
with four scales including sensing versus intuition12, American teachers were found to
be more sensible than intuitive, i.e. be more factually based, and focus on practical
concrete problems.13 This might explains how teachers deal with the practical issues e.g.
employment in a more positive manner, but not in a personal issue such as marriage.
However, this postulation requires confirmation from future studies using the
appropriate measures.
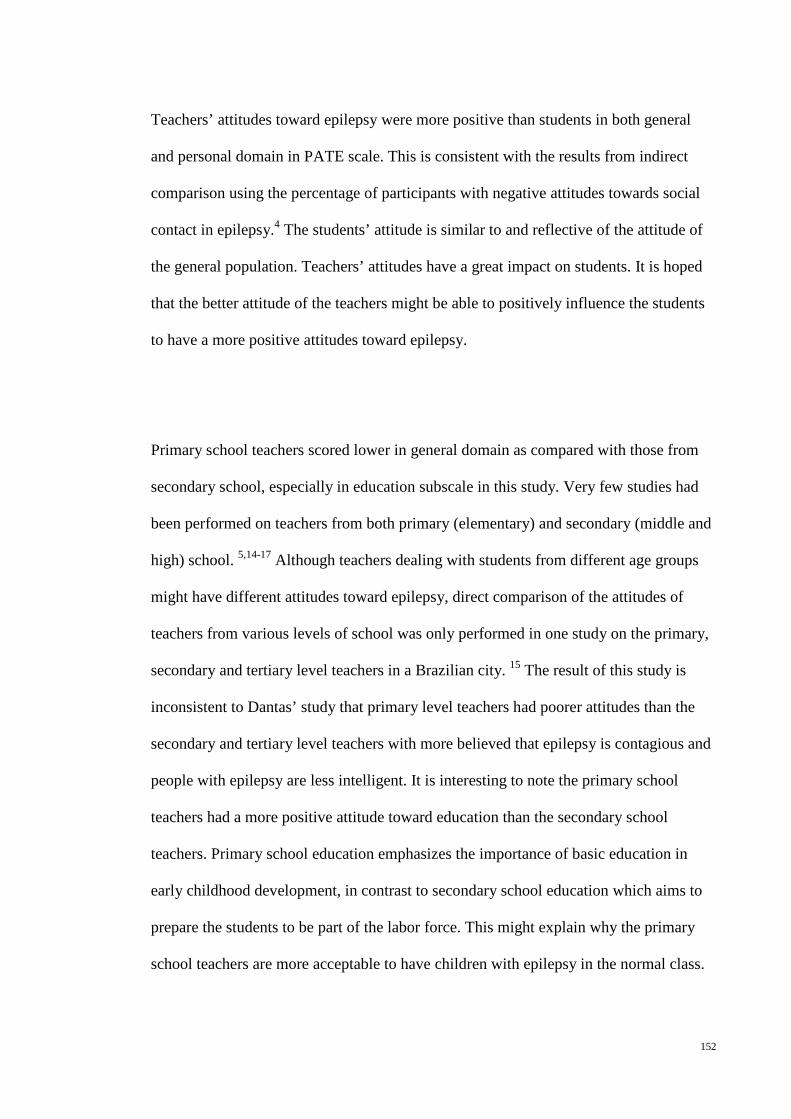
152
Teachers’ attitudes toward epilepsy were more positive than students in both general
and personal domain in PATE scale. This is consistent with the results from indirect
comparison using the percentage of participants with negative attitudes towards social
contact in epilepsy.4 The students’ attitude is similar to and reflective of the attitude of
the general population. Teachers’ attitudes have a great impact on students. It is hoped
that the better attitude of the teachers might be able to positively influence the students
to have a more positive attitudes toward epilepsy.
Primary school teachers scored lower in general domain as compared with those from
secondary school, especially in education subscale in this study. Very few studies had
been performed on teachers from both primary (elementary) and secondary (middle and
high) school. 5,14-17 Although teachers dealing with students from different age groups
might have different attitudes toward epilepsy, direct comparison of the attitudes of
teachers from various levels of school was only performed in one study on the primary,
secondary and tertiary level teachers in a Brazilian city. 15 The result of this study is
inconsistent to Dantas’ study that primary level teachers had poorer attitudes than the
secondary and tertiary level teachers with more believed that epilepsy is contagious and
people with epilepsy are less intelligent. It is interesting to note the primary school
teachers had a more positive attitude toward education than the secondary school
teachers. Primary school education emphasizes the importance of basic education in
early childhood development, in contrast to secondary school education which aims to
prepare the students to be part of the labor force. This might explain why the primary
school teachers are more acceptable to have children with epilepsy in the normal class.

153
Limitations and study implications
This study was performed in only two schools in a metropolitan city and thus the results
cannot be generalized to the general population. However, the previous studies 10,11
were also performed in the same region, which allows direct comparison.
Though the attitudes toward epilepsy were quantified and compared, only demographic
factors were included in this study as the possible factors influencing the attitudes.
Cultural or psychological factors such as teachers’ personality will be included in future
study, to depict how they may affect one’s attitudes toward epilepsy. This study also
forms a basis for qualitative study in understanding these underlying factors.
Using the percentage of teachers agreeing to “Would you object to your children
associating with people who sometimes had seizures?” as a mean of comparison, the
systematic review by the first author 4 showed that teachers in Korea and India had
poorer attitudes as compared with those in Thailand and Turkey. However, a
comparison of the overall attitudes toward epilepsy is impossible. Replication of this
study using a quantitative scale in other countries will allow a direct comparison of the
teachers’ attitudes toward epilepsy between different populations.
Conclusion
We were able to show that teachers had more positive attitudes toward epilepsy as
compared with the general population and students, this was more than can be
accounted for by the tertiary education. We also showed that primary school education
had better attitude than secondary school teachers, probably related to the overall goal
154
of their work. This shows that attitude to epilepsy may differ in different types of work.
The roles may change the attitude to epilepsy. It is thus particularly important to study
the attitude to epilepsy in members of different professions or opinion leaders that may
have greater impact on the quality of life of people with epilepsy, such as teachers,
school counselors, media workers, and human resource officers, and parents.
References
1. Fisher RS, van Emde Boas W, Blume W, et al. Epileptic seizures and epilepsy:
definitions proposed by the International League Against Epilepsy (ILAE) and the
International Bureau for Epilepsy (IBE). Epilepsia 2005;46:470-2.
2. Jacoby A. Stigma, epilepsy, and quality of life. Epilepsy & Behavior
2002;3:S10–S20.
3. Boer H, Mula M, Sander J. The global burden and stigma of epilepsy. Epilepsy
& Behavior 2008;12:540-6.
4. Lim KS, Lim CH, Tan CT. Attitudes toward epilepsy, a systematic review.
Neurology Asia 2011;16:269-80.
5. Lee SA, Korean SC. Teachers' attitudes towards and knowledge about epilepsy
in Korea. European Journal of Neurology 2009;16:486.
6. Bishop M, Boag EM. Teachers' knowledge about epilepsy and attitudes toward
students with epilepsy: results of a national survey. Epilepsy & Behavior 2006;8:397-
405.
7. Chung K, Ivey SL, Guo W, et al. Knowledge, attitudes, and practice toward
epilepsy (KAPE): a survey of Chinese and Vietnamese adults in the United States.
Epilepsy & Behavior 2010;17:221-7.
155
8. Bekiroglu N, Ozkan R, Gurses C, Arpaci B, Dervent A. A study on awareness
and attitude of teachers on epilepsy in Istanbul. Seizure 2004;13:517-22.
9. Thacker AK, Verma AM, Ji R, Thacker P, Mishra P. Knowledge awareness and
attitude about epilepsy among schoolteachers in India. Seizure 2008;17:684-90.
10. Lim KS, Wu C, Choo WY, Tan CT. Development and validation of a Public
Attitudes Towards Epilepsy (PATE) scale. Epilepsy & Behavior 2012;24:207-12.
11. Lim KS, Hills MD, Choo WY, Wong MH, Wu C, Tan CT. A web-based survey
of attitudes toward epilepsy in secondary and tertiary students in Malaysia, using the
Public Attitudes Toward Epilepsy (PATE) scale. Epilepsy & Behavior 2013;26:158-61.
12. Myers IB, McCaulley MH, Most R. Manual: A guide to the development and
use of the Myers-Briggs Type Indicator. Palo Alto, CA: Consulting Psychologists Press;
1985.
13. Macdaid GP, McCaulley MH, Kainz RI. Myers-Briggs type indicator atlas of
type tables. Center for Applications of Psychological Type, Gainesville, Florida1986.
14. Bishop M, Slevin B. Teachers' attitudes toward students with epilepsy: results of
a survey of elementary and middle school teachers. Epilepsy & Behavior 2004;5:308-15.
15. Dantas FG, Cariri GA, Ribeiro Filho AR. Knowledge and attitudes toward
epilepsy among primary, secondary and tertiary level teachers. Arq Neuropsiquiatr
2001;59:712-6.
16. Mecarelli O, Capovilla G, Romeo A, Rubboli G, Tinuper P, Beghi E.
Knowledge and attitudes toward epilepsy among primary and secondary schoolteachers
in Italy. Epilepsy & Behavior 2011;22:285-92.
17. Sanya EO, Salami TA, Goodman OO, Buhari OI, Araoye MO. Perception and
attitude to epilepsy among teachers in primary, secondary and tertiary educational
institutions in middle belt Nigeria. Trop Doct 2005;35:153-6.

156
Chapter 9: Attitudes towards epilepsy among Malay population in Southeast Asia,
using the Public Attitudes Toward Epilepsy (PATE) scale, a preliminary study in
Malaysia
Abstract
Introduction: The people with epilepsy in rural population had been shown to encounter
greater stigmatization, probably secondary to poorer attitudes toward epilepsy. This
survey aimed to ascertain the variation in attitudes toward epilepsy between rural and
urban Malays in Malaysia, using a validated Malay version of Public Attitudes Toward
Epilepsy (PATE) scale.
Method: 253 Malay subjects (57.3% female) with a mean age of 38.93±13.49 years
were recruited, 160 from Kuala Lumpur (urban) and 93 from Kelantan (rural).
Results: The rural Malay population in this survey were significantly older, less
educated, less full-time employed and had lower monthly income (p<0.001). There was
no significant different in the mean total scores in the personal and general domains of
the PATE scale. On subcategory analysis, the rural group showed more favorable
attitude in items related to marriage (p<0.05). Item analysis showed that the rural
population had more negative attitude against epilepsy person participate in social
activities (item 4).
Conclusion: There were no significant differences in general attitudes toward epilepsy
between rural and urban Malay population. However, rural Malays were more positive
toward marriage in people with epilepsy.
157
Introduction
Epilepsy is a disorder of the brain that is characterized by an enduring predisposition to
generate seizures and by its neurobiological, cognitive, psychological, and social
consequences.1 Epilepsy is one of the most common serious neurological disorders,
affecting approximately 50 million of human beings nationwide,2 especially in
developing countries3,4. Yet, 60% to 90% of individuals with epilepsy in developing
countries remain untreated due to various reasons including inadequacy in health care
resources and social stigma5,6.
Quality of life of epileptic person is mainly determined by duration of disease and
extent of seizure control, and other non-epileptic parameters such as social stigma
attributed significantly too7-9. Social stigma affliction attached to epilepsy has been
revealed to be more devastating than the disease itself 10,11. The degree of stigmatism
varies greatly in terms of socio-economic variance which had been acknowledged
through studies especially in between the countries in Asia and the West.12
Malaysia is a multiethnic developing country with limited studies available on public
awareness and attitude towards epilepsy. Rural and sub-urban areas are usually with
higher prevalence of epilepsy as well as higher treatment gap.4,13. Besides that, rural
individuals with lower education level and socioeconomic status have been found to
have more negative attitudes towards epilepsy, deeply discrediting for an epileptic
individual with higher level of stigmatization.14-19
Surveys conducted on Taiwan population stated rural group had greater objection
towards person with epilepsy to be employed under comparison with urban group (38%
158
vs. 75%, respectively).20 Moreover, rural population in USA demonstrated greater
negative stereotype than urban population.21 On the other hand, turkey population study
found that urban population had more negative attitudes toward epilepsy with 20%
believed epilepsy is a form of insanity, significantly higher than 10% in rural
population.22 Whereas a previous study conducted on Malaysian Chinese population
showed non-significant differences between rural Chinese and urban Chinese in the
attitudes toward epilepsy.23
Malay community is the largest community (50.4%) in Malaysia. However, studies on
the Malay population were limited and none have ever compared the attitude toward
epilepsy between the rural and urban Malay population. Identification of the predictors
of the attitude differences between the urban and rural populations using an objective
scale, would elucidate psychosocial understanding and aid in future intervention
designation.
This study aimed to quantify the differences in attitudes toward epilepsy between rural
and urban Malay population in Malaysia, using the Public Attitudes Toward Epilepsy
(PATE) scale.
Method
Study population
A total of 253 respondents were recruited through convenient sampling with a mean age
of 38.93±13.49 years, 160 respondents from Kuala Lumpur and Petaling Jaya (urban
region) and 93 respondents from Kubang Kerian, Kelantan (rural region). Verbal

159
consents were obtained in agreement to carry out survey and all questionnaires were
administered anonymously. The selection criteria given that subjects must not be an
epileptic person and that they should be permanent residents of the district studied.
Ethical approval from the ethics committee at University Malaya Medical Center
(MREC no.: 878.10) and University of Science Malaysia (USM no.: 260.3(3)) were
obtained.
Measures
Public Attitudes Toward Epilepsy (PATE) scale is a 14-item scales measuring attitudes
towards epilepsy among public24. A 5-point Likert scale with reversed scoring system
was adopted, 1 being strongly disagree and 5 being strong agree. It is conceptualized
into two domains: a total of 9 items loading on general domain which required minimal
or no consideration of subject’s personal involvement and personal domain which
constituted of 5 items which involved long-term personal commitment such as marrying
to epileptic individual, working with them or employed epileptic candidate. Higher
PATE scores indicated more negative attitude through reversely scored of positively
stated items. The interviewers were encouraged to provide only necessity explanation
for point’s clarification in order to minimize results deviation.
The Malay version of PATE scale is a reliable and validated scale with good internal
consistency for both general and personal domains (Cronbach’s coefficient 0.868 and
0.633, respectively).25

160
Demographic data were collected on the subject’s race, age, gender, marital status,
education status, employment status, occupation, income level, and family history for
descriptive and continuous analysis.
Statistical analysis
Statistical Package for Social Sciences version 19 (SPSS 19.0) was adopted for data
analyses. Descriptive analyses were depicted using mean, standard deviation and simple
percentages as appropriate. The differences in socio-economic variables between the
two groups were assessed using Chi-square tests. Comparisons of mean scores in the
personal domain, general domains, as well as individual items were performed using
student’s t-test. Univariate analysis were performed to determine the impacts of
demographic variables on the differences between the urban and rural groups. In
addition, the items were further subcategorized into various socio-economic subgroups
according to previous publication, i.e. categorize question of “I will advise my family
members against marrying someone with epilepsy.” into marriage related item26 and the
urban-rural differences of the mean subcategory scores were assessed using independent
sample student’s t-test. Significant level was set at p<0.05 (2-tailed).
Results
1. Demographic characteristic of samples
A total of 253 respondents were recruited. The rural Malay population in this survey
were significantly older, less educated, less full-time employed and had lower monthly
income, than the urban group (p-value <0.001, as shown in Table 9-1)

161
Table 9-1: Demographic characteristics of rural and urban Malay groups (N=93
and 160, respectively).
Demographic Variables Group
Rural Malay ( N= 93) Urban Malay ( N=
160)
Gender: Female, n (%) 60 (64.5%) 85 (53.1%)
Age, mean ±SD 43.63±13.54 36.19±12.72*
Marital Status: married, n (%) 73 (78.5%) 106 (66.3%)
Education Level: Tertiary level, n
(%)
15 (16.1%) 49 (30.6%)*
Employment Status: Full time, n
(%)
24 (25.8%) 98 (61.3%)*
Income: RM2000 and above, n (%) 21 (22.6%) 80 (50%)*
*p-value is <0.001, as compared to the rural group.
3.2 Attitudes toward epilepsy in rural and urban Malay, using PATE scale
Generally, the mean score in general domain was higher than those in the personal
domain in both urban and rural populations (p-value <0.001), as shown in Table 9-2.
There were no significant differences in the total mean scores as well as the mean scores
in the general and personal domains in PATE scale between the urban and rural groups.
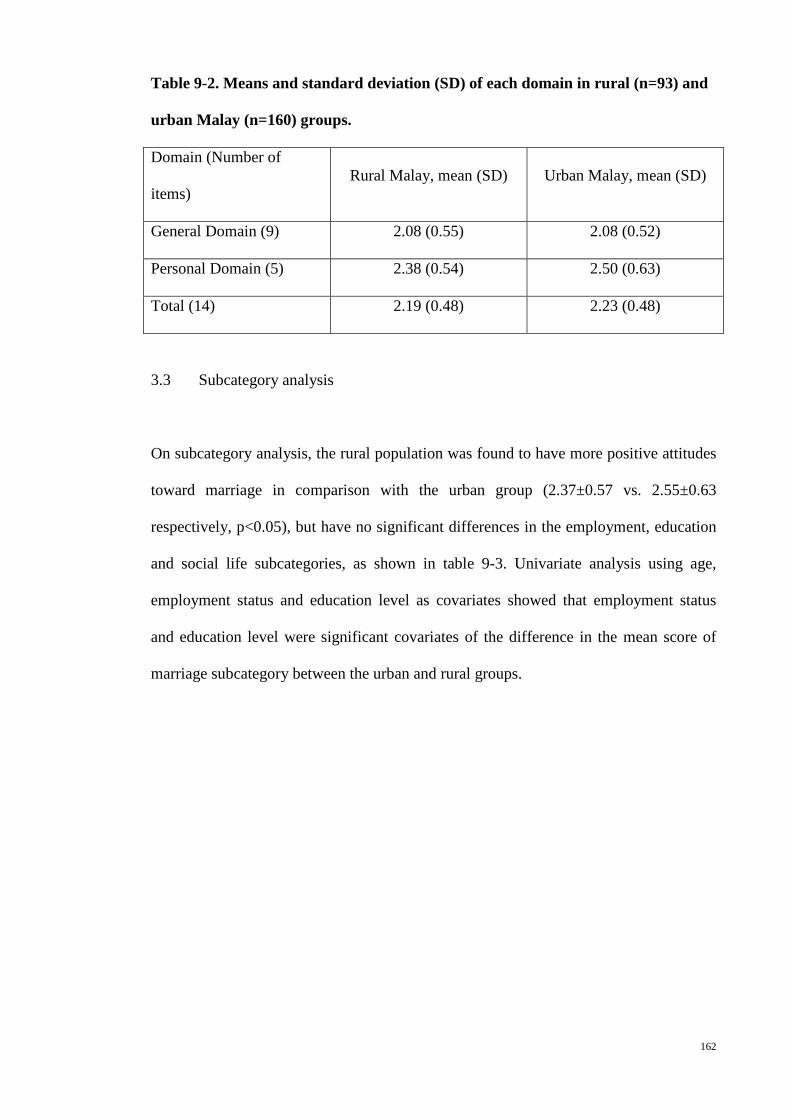
162
Table 9-2. Means and standard deviation (SD) of each domain in rural (n=93) and
urban Malay (n=160) groups.
Domain (Number of
items) Rural Malay, mean (SD) Urban Malay, mean (SD)
General Domain (9) 2.08 (0.55) 2.08 (0.52)
Personal Domain (5) 2.38 (0.54) 2.50 (0.63)
Total (14) 2.19 (0.48) 2.23 (0.48)
3.3 Subcategory analysis
On subcategory analysis, the rural population was found to have more positive attitudes
toward marriage in comparison with the urban group (2.37±0.57 vs. 2.55±0.63
respectively, p<0.05), but have no significant differences in the employment, education
and social life subcategories, as shown in table 9-3. Univariate analysis using age,
employment status and education level as covariates showed that employment status
and education level were significant covariates of the difference in the mean score of
marriage subcategory between the urban and rural groups.
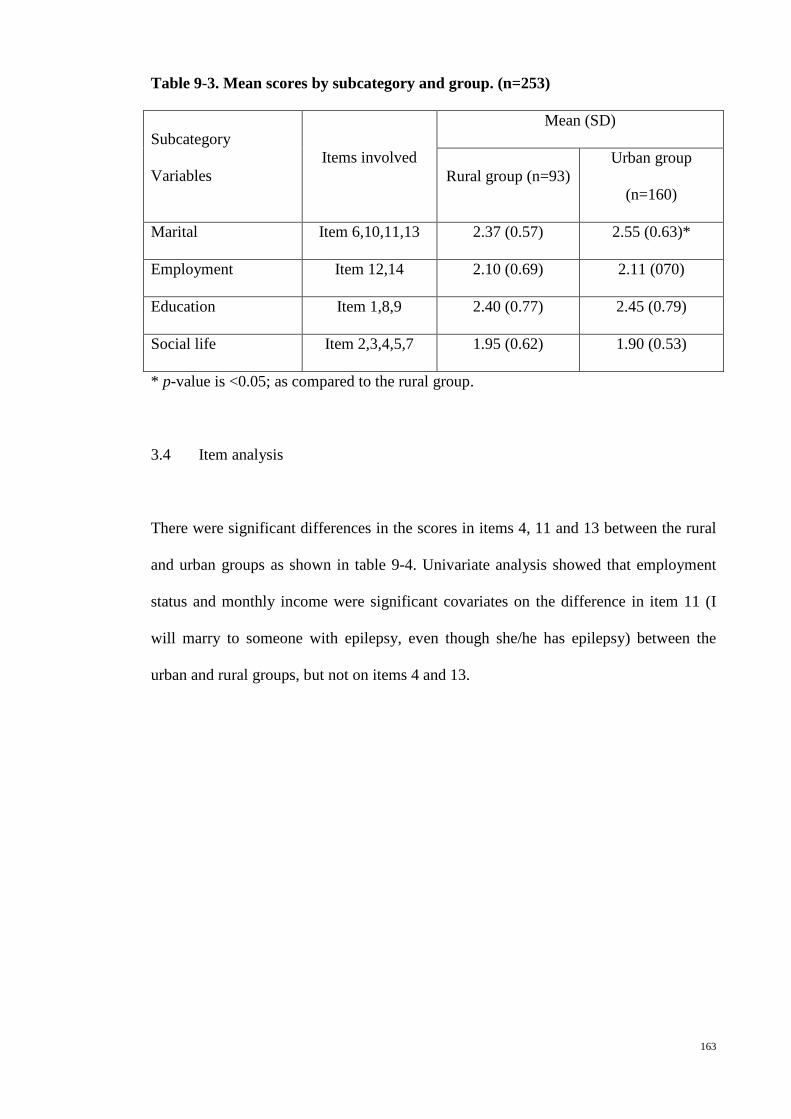
163
Table 9-3. Mean scores by subcategory and group. (n=253)
Subcategory
Variables Items involved
Mean (SD)
Rural group (n=93) Urban group
(n=160)
Marital Item 6,10,11,13 2.37 (0.57) 2.55 (0.63)*
Employment Item 12,14 2.10 (0.69) 2.11 (070)
Education Item 1,8,9 2.40 (0.77) 2.45 (0.79)
Social life Item 2,3,4,5,7 1.95 (0.62) 1.90 (0.53)
* p-value is <0.05; as compared to the rural group.
3.4 Item analysis
There were significant differences in the scores in items 4, 11 and 13 between the rural
and urban groups as shown in table 9-4. Univariate analysis showed that employment
status and monthly income were significant covariates on the difference in item 11 (I
will marry to someone with epilepsy, even though she/he has epilepsy) between the
urban and rural groups, but not on items 4 and 13.

164
Table 9-4. Means and standard deviations of the items in each group.
Item
Rural Malay
(n=96),
means (SD)
Urban
Malay
(n=160),
means (SD)
1. People with epilepsy should not study in college or
university. 2.19 (1.14) 2.00 (0.93)
2. People with epilepsy have the same rights as all
people. 1.76 (0.95) 1.87 (0.90)
3. People with epilepsy should be isolated from others. 1.75 (0.84) 1.87 (0.81)
4. People with epilepsy should not participate in social
activities. 2.49 (1.14)
1.99
(0.92)***
5. I will not mind being seen in the company with
someone known to have epilepsy. 2.02 (0.98) 1.90 (0.87)
6. People with epilepsy should not marry. 1.78 (0.72) 1.91 (0.79)
7. I would stay away from a friend if I know she/he has
epilepsy. 1.74 (0.83) 1.87 (0.90)
8. People with epilepsy should study in a special school. 2.52 (1.16) 2.69 (1.16)
9. Schools should not place children with epilepsy into
regular classrooms. 2.49 (1.08) 2.66 (1.08)
10. I would date someone even though he/she has
epilepsy. 2.74 (0.92) 2.71 (0.89)
11. I would marry someone with epilepsy, even though
he/she has epilepsy. 2.67 (0.77) 2.90 (0.90)*
12. I feel uncomfortable working with someone who has
epilepsy. 2.26 (0.90) 2.19 (0.84)
13. I will advise my family members against marrying
someone with epilepsy. 2.31 (0.87)
2.68 (0.97)
**
14. If I am an employer, I would give employment
opportunity to someone with epilepsy. 1.94 (0.85) 2.04 (0.97)
* p-value is <0.05; ** p-value is <0.01; and ***p-value is <0.001, as compared to the
rural group.

165
Discussion
This study showed that there were no significant differences in attitudes toward epilepsy
between rural and urban Malay population generally, based on the mean scores in the
personal and general domains in PATE scale. However, on subcategory and item
analysis, the rural Malay had shown a more positive attitudes toward marriage in people
with epilepsy, as compared with the urban Malay population.
Absence of urban-rural difference in the attitudes toward epilepsy was similarly
reflected in the study performed on the Chinese population in Malaysia.23 This is in
contrary to studies reporting better attitudes toward epilepsy in the urban20,21 or in the
rural22 population.
In Malaysia, all Malay population believe in the same religion, which is Islam, and
practice the religious customs following the same scripture, irrespective of the
residential region. Therefore, the urban-rural boundary is demarcated by socio-
economic differences, as shown in table 1, but not the cultural or religious differences.
The absence of urban-rural difference in attitudes toward epilepsy in Malaysian Malay
suggests that public attitudes are probably more culturally dependent rather than socio-
economically dependent.
This study showed that rural Malay population had more positive attitude toward
marriage in people with epilepsy than the urban group, affected by socioeconomic
factors. It is postulated to be related to the difference in mate selection between the
urban and rural population. In a modern society, mate selection preference is determined
by nonphysical characteristics that maximize the survival or reproductive prospects,27
166
compatible with the findings in a study in Taiwan which stated that those with higher
education were more prejudiced against marrying an epileptic person.28 In rural, ability
to reproduce is still one of the main mate selection criteria. This might explain being an
epileptic is not an exclusion criteria in mate selection in rural population, thus less
prejudice against marrying someone with epilepsy in this group of people.
Item analysis showed that the rural population had more negative attitude against
epilepsy person participate in social activities (item 4). This reflects the overprotective
attitudes especially in rural area, as supported by many studies demonstrated a
significant social deficit among rural populations in Asian countries.29,30 Similar attitude
was also found in the research conducted by Saengsuwan in Thailand showing that 90%
of participants would believe person with epilepsy cannot live in the society like healthy
people do31.
Future Implication
Findings in this study were similar to previous study in Chinese population of
Malaysia23, revealing the urban-rural differences in attitudes toward certain social
aspects of life in people with epilepsy. This will serve as a guide for the development
of social intervention among the Malay population in various parts of Malaysia.
Conclusion
There were no significant differences in general attitudes toward epilepsy between rural
and urban Malay population. However, on subcategory analysis, the rural Malay had
167
shown a more positive attitudes toward marriage in people with epilepsy, as compared
with the urban Malay population.
References
1. Fisher RS, van Emde Boas W, Blume W, et al. Epileptic seizures and epilepsy:
definitions proposed by the International League Against Epilepsy (ILAE) and the
International Bureau for Epilepsy (IBE). Epilepsia 2005;46:470-2.
2. Kobau R, Price P. Knowledge of epilepsy and familiarity with this disorder in
the U.S population: results form the 2002 health styles survey. Epilepsia 2003;44:1449-
54.
3. Matuja W, Rwiza HT. Knowledge, attitude and practice (KAP) towards epilepsy
in secondary school students in Tanzania. Central African Journal of Medicine
1994;40:13-8.
4. Organization WH. Epilepsy in The WHO African Region: Bridging the Gap.
Netherlands2004:1-43.
5. Shorvon RD, Farmer PJ. Epilepsy in developing countries: a review of
epidemiological, sociocultural and treatment aspects. Epilepsia 1988;29:S36-S45.
6. Lim KS, Chin HL, Chong TT. Attitudes toward epilepsy, a systemic review.
Neurology Aisa 2011;16:269-80.
7. Jacoby A. Stigma, epilepsy and quality of life. Epilepsiy Behaviour 2002;3:10-
20.
8. Nicholaos D, Joseph K, Meropi T, Charilaos K. A Survey of Public Awareness,
Understanding, and Attitudes toward Epilepsy in Greece. Epilepsia 2006;47:2154-64.
9. Schachter S. Improving quality of life beyond seizure control. Epileptic
Disorders 2005;7:S34-S8.

168
10. Rahman AFA. Awareness and knowledge of epilepsy among students in a
Malaysian university. Seizure 2005;14:593-6.
11. Jacoby A, Gory J, Gamble C, Baker GA. Public knowledge, private grief: A
study of public attitudes to epilepsy in the United Kingdom and implications for stigma.
Epilepsia 2004;45:1405-15.
12. Ramasundrum V, Zabidi AMH, Chong TT. Public awareness, attitudes and
understanding towards epilepsy in Kelantan, Malaysia. Neurology Journal of Southeast
Asia 2000;5:55-60.
13. Matuja W. Aetiological factors in Tanzanian epileptics. East Africa Medicine
Journal 1989;66:343-8.
14. Nwe NW, Chit S. Public awareness, attitude and understanding toward epilepsy
among Myanmar people. Neurology Journal of Southeast Asia 2002;7:81-8.
15. Hashmi SJ, Dixit JV. Knowlege, attitude and practice of epilepsy among
patients and family members attending urban health and training centre, Shahganj,
Aurangabad, India. Global Journal of Medicine and Public Health 2012;1:3-5.
16. Neni SW, Latif AZA, Wong SY, Lua PL. Awareness, knowledge and attitudes
towards epilepsy among rural populations in East Coast Peninsular Malaysia: a
preliminary exploration. . Seizure 2010;19:280-90.
17. Saengpattrachai M, Srinualta D, Lorlertratna N, Pradermduzzadeeporn E,
Poonpol F. Public familiarity with, knowledge of, and predictors of negative attitudes
toward epilepsy in Thailand. Epilepsy Behaviour 2010;17:497-505.
18. Hasan HH, Alen YKS, Wayne WGW, Ahmadi K, Anwar M, Goh GK.
Understanding of and attitudes toward epilepsy among the urban Chinese population in
Malaysian. Singapore Medicine Journal 2010;51:290-9.
19. Tekle-Haimanot R, Abebe M, Forsgren L. Attitudes of rural people in central
Ethiopia towards epilepsy. Social Science Medicine 1991;32:203-9.

169
20. Chung YM, Chang YC, Lai YH, Lai CW. Survey of Public Awareness,
Understanding, and Attitudes Toward Epilepsy in Taiwan. Epilepsia 1995;36:488-93.
21. Kobau R, Dilorio C, Anderson L, Price P. Further validation and reliability
testing of the Attitudes and Beliefs about Living with Epilepsy (ABLE) components of
the CDC Epilepsy Progam Instrument on Stigma. Epilepsy & Behaviour 2006;8:552-9.
22. Demirci S, Donmez C, Gundogar D, Baydar C. Public awareness of, attitude
toward, and understanding of epilepsy in Isparta, Turkey. Epilepsy & Behaviour
2007;11:427-33.
23. Lim KS, Tan LP, Lim KT, Chong TT. Survey of public awareness,
understanding, and attitudes toward epilepsy among Chinese in Malaysia. Neurology
Journal of Southeast Asia 1999;4:31-6.
24. Lim KS, Wu C, Choo WY, Chong TT. Development and validation of a public
attitudes toward epilepsy (PATE) scale. Epilepsy & Behavior 2012;24:207-12.
25. Lim KS, Choo WY, Wu C, Hills MD, Tan CT. Malay Public Attitudes Toward
Epilepsy (PATE) scale: translation and psychometric evaluation. (unpublished) 2013.
26. Lim KS, Chin HL, Chong TT. Attitudes toward epilepsy, a systemic review. .
Neurology Asia 2011;16:269-80.
27. Feingold A. Gender differences in mate selection preferences: a test of the
parental investment model. Psychol Bull 1992;112:125-39.
28. Chung MY, Chang YC, Lai YH, Lai CW. Survey of public awareness,
understanding, and attitudes toward epilepsy in Taiwan. Epilepsia 1995;36:488-93.
29. Pal DK, Chaudhury G, Sengupta S, Das T. Social integration of children with
epilepsy in rural India. Soc Sci Med 2002;54:1867-74.
30. Alwis Ad, Kariyawasam S, Weerasinghe C. School drop out and fallout from
idiopathic epilepsy in rural Sri Lanka. Sri Lanka Journal of Child Health 2008;37:8-11.
170
31. Saengsuwan J, Boonyaleepan S, Srijakkot J, et al. Public perception of epilepsy:
A survey from the rural population in Notheastern Thailand. Journal of Neuroscience
and Behavioural Health 2009;1:006-11.

171
Chapter 10: Attitudes towards epilepsy among Chinese population in Malaysia, using
the Public Attitudes Toward Epilepsy (PATE) scale.
Abstract
Introduction: Comparison of attitudes toward epilepsy among populations using a
standard and quantitative scale was not available. This study aimed to determine the
differences between the rural and urban Chinese populations in Malaysia, and between
the Chinese and Malay populations, using the Public Attitudes Toward Epilepsy (PATE)
scale. Method: A total of 348 respondents, with a mean age of 38.7±15.2 years (range
18-76), of which 188 from Kuala Lumpur and Petaling Jaya (urban) and 160 from
Sekinchan (rural), were recruited. Results: The mean score in personal domain was
significantly lower in the rural group, as compared with the score in the urban group
(p<0.05, adjusted for age and gender). On subcategory analysis, the rural population
was found to have more positive attitudes toward marriage and employment in
comparison with the urban group (p<0.05). The mean score in both personal and general
domains of the Chinese population were lower than those in the Malay population but
not statistically different. Chinese population had a lower mean scores in the social life
subcategory than the Malay (p<0.01). Conclusion: The rural Chinese had a more
positive personal attitudes toward epilepsy than the urban group. There was no
significant differences between the Chinese and Malay population.
Keywords: attitudes, epilepsy, Chinese
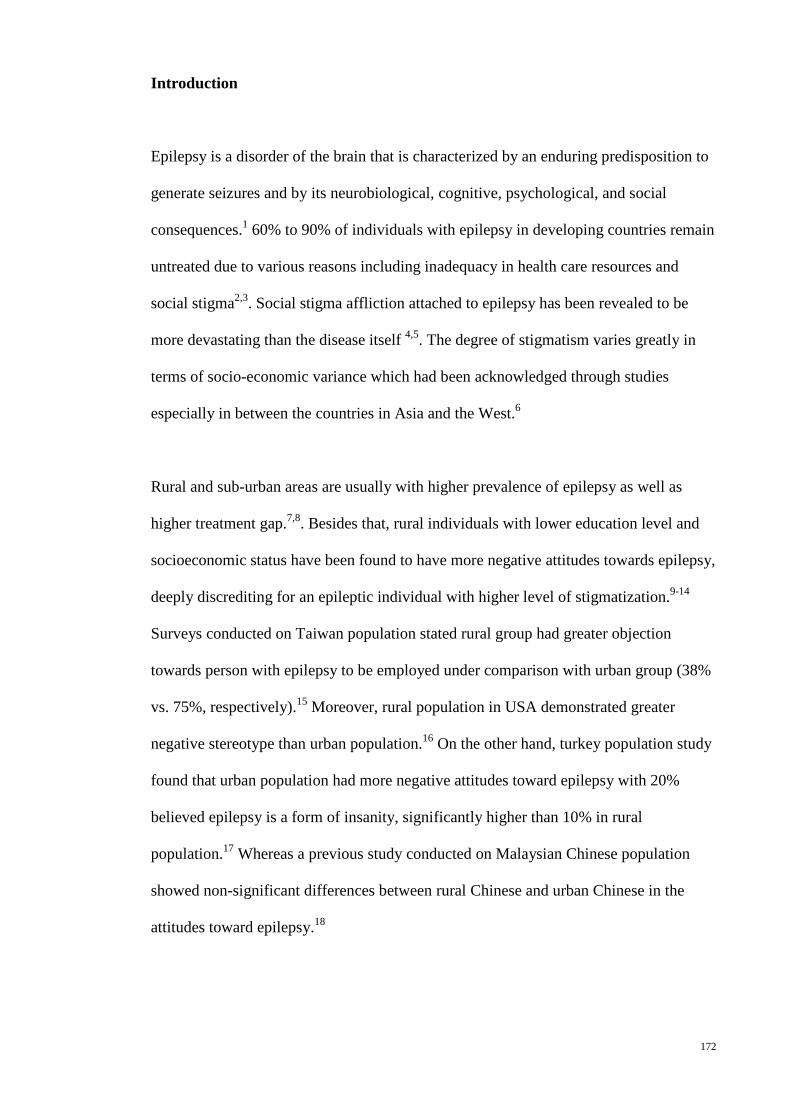
172
Introduction
Epilepsy is a disorder of the brain that is characterized by an enduring predisposition to
generate seizures and by its neurobiological, cognitive, psychological, and social
consequences.1 60% to 90% of individuals with epilepsy in developing countries remain
untreated due to various reasons including inadequacy in health care resources and
social stigma2,3. Social stigma affliction attached to epilepsy has been revealed to be
more devastating than the disease itself 4,5. The degree of stigmatism varies greatly in
terms of socio-economic variance which had been acknowledged through studies
especially in between the countries in Asia and the West.6
Rural and sub-urban areas are usually with higher prevalence of epilepsy as well as
higher treatment gap.7,8. Besides that, rural individuals with lower education level and
socioeconomic status have been found to have more negative attitudes towards epilepsy,
deeply discrediting for an epileptic individual with higher level of stigmatization.9-14
Surveys conducted on Taiwan population stated rural group had greater objection
towards person with epilepsy to be employed under comparison with urban group (38%
vs. 75%, respectively).15 Moreover, rural population in USA demonstrated greater
negative stereotype than urban population.16 On the other hand, turkey population study
found that urban population had more negative attitudes toward epilepsy with 20%
believed epilepsy is a form of insanity, significantly higher than 10% in rural
population.17 Whereas a previous study conducted on Malaysian Chinese population
showed non-significant differences between rural Chinese and urban Chinese in the
attitudes toward epilepsy.18

173
Malaysia is a multiethnic developing country with limited studies available on public
awareness and attitude towards epilepsy. Chinese community is the second largest
community (24.6%) in Malaysia, after the Malay community. Surveys on public
attitudes toward epilepsy in Malaysian Chinese and Malay had been performed
previously.6,18,19 However, a standard and quantitative scale was not used in these
studies, resulting in difficulty in comparing the results.
This study aimed to quantify the attitudes toward epilepsy among Chinese population in
Malaysia, to determine the differences in attitudes toward epilepsy between the rural
and urban Chinese, and between the Chinese and Malay populations by comparing to a
similar study on the Malay population20, using the Public Attitudes Toward Epilepsy
(PATE) scale.
Method
Study population
A total of 348 respondents were recruited through convenient sampling, of which 188
respondents were from Kuala Lumpur and Petaling Jaya (urban region) and 160
respondents from Sekinchan (rural region). Verbal consents were obtained in agreement
to carry out survey and all questionnaires were administered anonymously. The
selection criteria given that subjects must not be an epileptic person and that they should
be permanent residents of the district studied. Ethical approval from the ethics
committee at University Malaya Medical Center (MREC no.: 878.10).
Measures

174
The Public Attitudes Toward Epilepsy (PATE) scale is a 14-item scale measuring the
public attitudes toward epilepsy (Lim, 2012)21. A 1-5 Likert scale was used for scoring
with 1 being strongly disagree and 5 being strongly agree. Some items were reverse
scored so that a higher score would indicate a more negative attitude. This scale was
performed in a general population and factored into two domains, i.e. a general domain
(nine items) that required minimal or no consideration of respondents’ involvement, and
a personal domain (five items) that required a long-term personal commitment or
involvement. This is a validated scale with good internal consistency (Cronbach’s alpha
of 0.868 and 0.633, in the general and personal domains respectively).
This study was performed using either the original or the Chinese PATE scales. The
Chinese version of PATE scale is a validated translated version with good internal
consistency in both general and personal domains (Cronbach’s coefficient 0.868 and
0.633, respectively).22
Demographic data were collected on the subject’s race, age, gender, marital status,
education status, employment status, occupation, and income level for descriptive and
continuous analysis.
Statistical analysis
Statistical Package for Social Sciences version 19 (SPSS 19.0) was adopted for data
analyses. Descriptive analyses were depicted using mean, standard deviation and simple
percentages as appropriate. The differences in demographic variables between two
groups were assessed using Chi-square tests and student’s t-test. Comparisons of mean

175
scores in the personal and general domains as well as individual items were performed
using student’s t-test. Adjustment for the demographic differences between groups was
performed using a one-way between-group analysis of variance. In addition, the items
were further subcategorized into various socio-economic subgroups according to
previous publication, i.e. categorize question of “I will advise my family members
against marrying someone with epilepsy.” into marriage related item23 and the urban-
rural differences of the subcategory mean scores were assessed using student’s t-test.
The mean scores in the domains and subcategories were also compared with the mean
scores of a Malay population of 253 subjects (57.3% female) with similar mean age of
38.93±13.49 years, recruited from both urban and rural areas.20 Recoding of the item
answers to reflect the percentage of respondents with negative attitudes toward each
item was performed, as shown in table 10-7. This is to enable a direct inspection of the
attitudes toward epilepsy among various ethnic groups, and the comparison was tested
with Chi-square tests. Significant level was set at p<0.05.
Results
1. Demographic characteristic of samples
A total of 348 respondents, with a mean age of 38.7±15.2 years (range 18-76) and 46.0%
rural, were recruited. (Table 10-1) The rural Chinese population were significantly
younger, male predominant, less educated, and less full-time employed, than the urban
group (p-value <0.001).

176
Table 10-1: Demographic characteristics of the total participants (N=348), and the
urban and rural subgroups (N=188 and 160, respectively).
Demographic Variables Total Group
Urban Chinese
Rural Chinese
Gender: Female, n (%) 160 (46.0) 104 (55.3) 56 (35.0)* Age, mean ±SD 38.7 ±15.2 42.0 ±15.2 34.7 ±14.2* Marital Status: Single, n (%) 149 (42.8) 114 (60.6) 81 (56.0) Education Level: Tertiary level, n (%) 157 (45.1) 121 (64.4) 36 (22.5)* Employment Status: Full time, n (%) 165 (47.4) 96 (51.1) 69 (43.1)* Income: RM2000 and above, n (%) 148 (42.5) 88 (46.8) 60 (37.7) Presence of family history, n (%) 16 (4.6) 9 (4.8) 7 (4.4) *p-value is <0.001, as compared to the urban group.
2. Attitudes toward epilepsy according to demographic characteristics
The mean score in personal domain was significantly lower in the rural group, as
compared with the score in the urban group (p<0.01), as shown in Table 10-2. A
univariate analysis was performed to determine the effect of age and gender on the
urban-rural difference in the mean score in personal domain. After adjusting for age and
gender, the difference in the mean score in personal domain between the urban and rural
groups was still statistically significant. (p<0.05) Those who were single and with
monthly income less than RM2000 had lower mean scores in the general domain, as
compared with the others (p<0.05), but had no significant difference in the mean scores
in personal domain.

177
Table 10-2: Mean scores and standard deviations by domains and demographic
characteristics (n=348)
Variable Group (n) General domain
Personal domain Total
Age1 -0.009 0.067 0.024 Mean score (SD) Geographical location
Urban (188) Rural (160)
2.08 (0.54) 1.99 (0.54)
2.46 (0.63) 2.28 (0.64)**
2.22 (0.49) 2.10 (0.52)*
Gender
Male (188) Female (160)
2.06 (0.52) 2.02 (0.55)
2.39 (0.66) 2.36 (0.62)
2.18 (0.50) 2.14 (0.51)
Marital status
Single (149) Others (199)
2.11 (0.55) 1.99 (0.51)*
2.41 (0.59) 2.35 (0.68)
2.22 (0.51) 2.12 (0.50)
Education level Tertiary (157) Others (191)
2.04 (0.54) 2.04 (0.53)
2.40 (0.62) 2.36 (0.66)
2.17 (0.50) 2.16 (0.52)
Employment status Employed full time (165)
Others (183)
2.01 (0.56) 2.07 (0.51)
2.33 (0.64) 2.42 (0.65)
2.13 (0.51) 2.19 (0.50)
Monthly income in Ringgit Malaysia
2000 and above (200)
Others (148)
1.98 (0.56) 2.09 (0.51)*
2.32 (0.69) 2.42 (0.60)
2.10 (0.53) 2.20 (0.49)
Family member with epilepsy/seizures
Yes (16) No (332)
2.02 (0.58) 2.04 (0.53)
2.30 (0.65) 2.38 (0.64)
2.12 (0.57) 2.16 (0.51)
1Based on Pearson correlation; *p-value is < 0.05; and **p-value is < 0.01, when compared between groups.
3. Comparison of attitudes toward epilepsy between urban and rural Chinese:
subcategory and item analyses
On subcategory analysis, the rural population was found to have more positive attitudes
toward marriage and employment in comparison with the urban group (p<0.05), but
have no significant differences in the education and social life subcategories, as shown
in table 10-3.
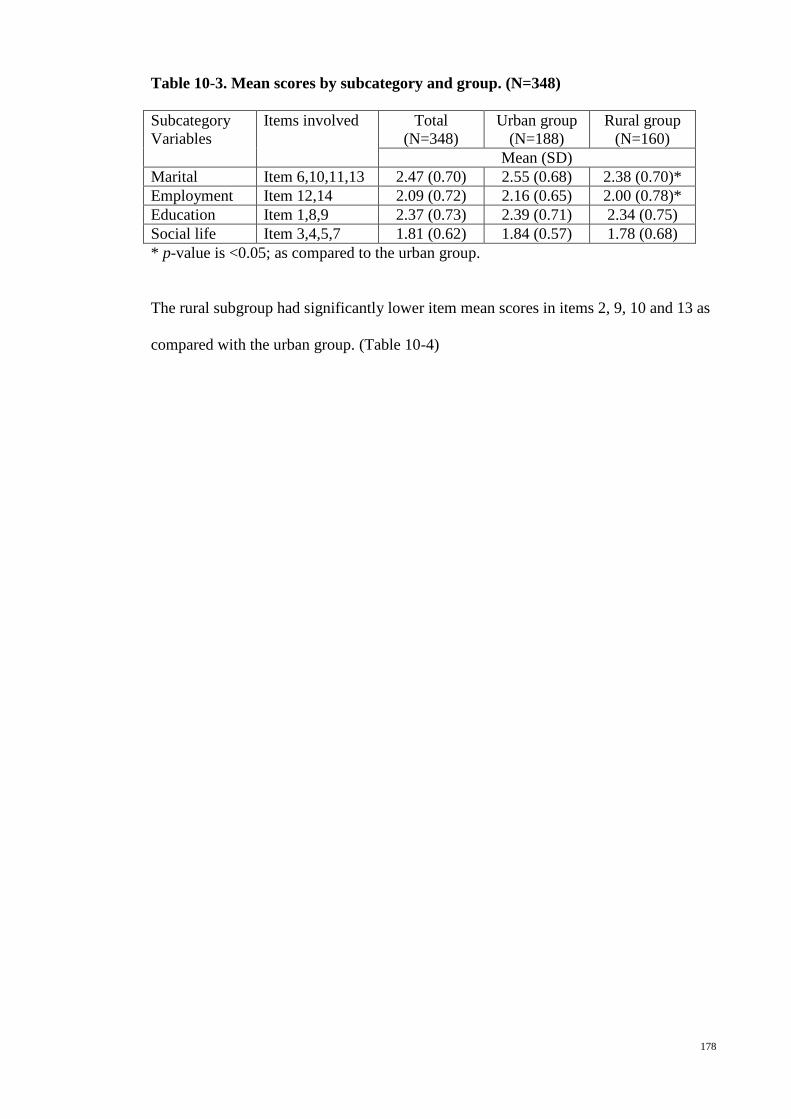
178
Table 10-3. Mean scores by subcategory and group. (N=348)
Subcategory Variables
Items involved Total (N=348)
Urban group (N=188)
Rural group (N=160)
Mean (SD) Marital Item 6,10,11,13 2.47 (0.70) 2.55 (0.68) 2.38 (0.70)* Employment Item 12,14 2.09 (0.72) 2.16 (0.65) 2.00 (0.78)* Education Item 1,8,9 2.37 (0.73) 2.39 (0.71) 2.34 (0.75) Social life Item 3,4,5,7 1.81 (0.62) 1.84 (0.57) 1.78 (0.68) * p-value is <0.05; as compared to the urban group.
The rural subgroup had significantly lower item mean scores in items 2, 9, 10 and 13 as
compared with the urban group. (Table 10-4)
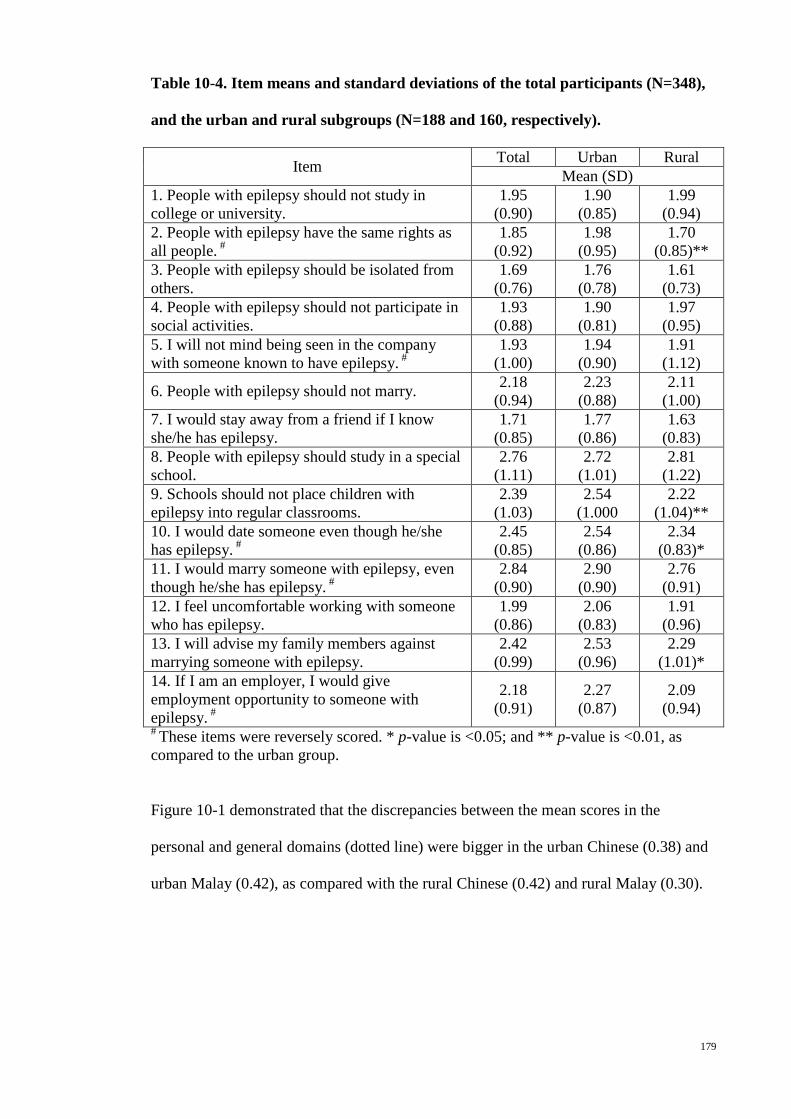
179
Table 10-4. Item means and standard deviations of the total participants (N=348),
and the urban and rural subgroups (N=188 and 160, respectively).
Item Total Urban Rural Mean (SD)
1. People with epilepsy should not study in college or university.
1.95 (0.90)
1.90 (0.85)
1.99 (0.94)
2. People with epilepsy have the same rights as all people. #
1.85 (0.92)
1.98 (0.95)
1.70 (0.85)**
3. People with epilepsy should be isolated from others.
1.69 (0.76)
1.76 (0.78)
1.61 (0.73)
4. People with epilepsy should not participate in social activities.
1.93 (0.88)
1.90 (0.81)
1.97 (0.95)
5. I will not mind being seen in the company with someone known to have epilepsy. #
1.93 (1.00)
1.94 (0.90)
1.91 (1.12)
6. People with epilepsy should not marry. 2.18 (0.94)
2.23 (0.88)
2.11 (1.00)
7. I would stay away from a friend if I know she/he has epilepsy.
1.71 (0.85)
1.77 (0.86)
1.63 (0.83)
8. People with epilepsy should study in a special school.
2.76 (1.11)
2.72 (1.01)
2.81 (1.22)
9. Schools should not place children with epilepsy into regular classrooms.
2.39 (1.03)
2.54 (1.000
2.22 (1.04)**
10. I would date someone even though he/she has epilepsy. #
2.45 (0.85)
2.54 (0.86)
2.34 (0.83)*
11. I would marry someone with epilepsy, even though he/she has epilepsy. #
2.84 (0.90)
2.90 (0.90)
2.76 (0.91)
12. I feel uncomfortable working with someone who has epilepsy.
1.99 (0.86)
2.06 (0.83)
1.91 (0.96)
13. I will advise my family members against marrying someone with epilepsy.
2.42 (0.99)
2.53 (0.96)
2.29 (1.01)*
14. If I am an employer, I would give employment opportunity to someone with epilepsy. #
2.18 (0.91)
2.27 (0.87)
2.09 (0.94)
# These items were reversely scored. * p-value is <0.05; and ** p-value is <0.01, as compared to the urban group.
Figure 10-1 demonstrated that the discrepancies between the mean scores in the
personal and general domains (dotted line) were bigger in the urban Chinese (0.38) and
urban Malay (0.42), as compared with the rural Chinese (0.42) and rural Malay (0.30).
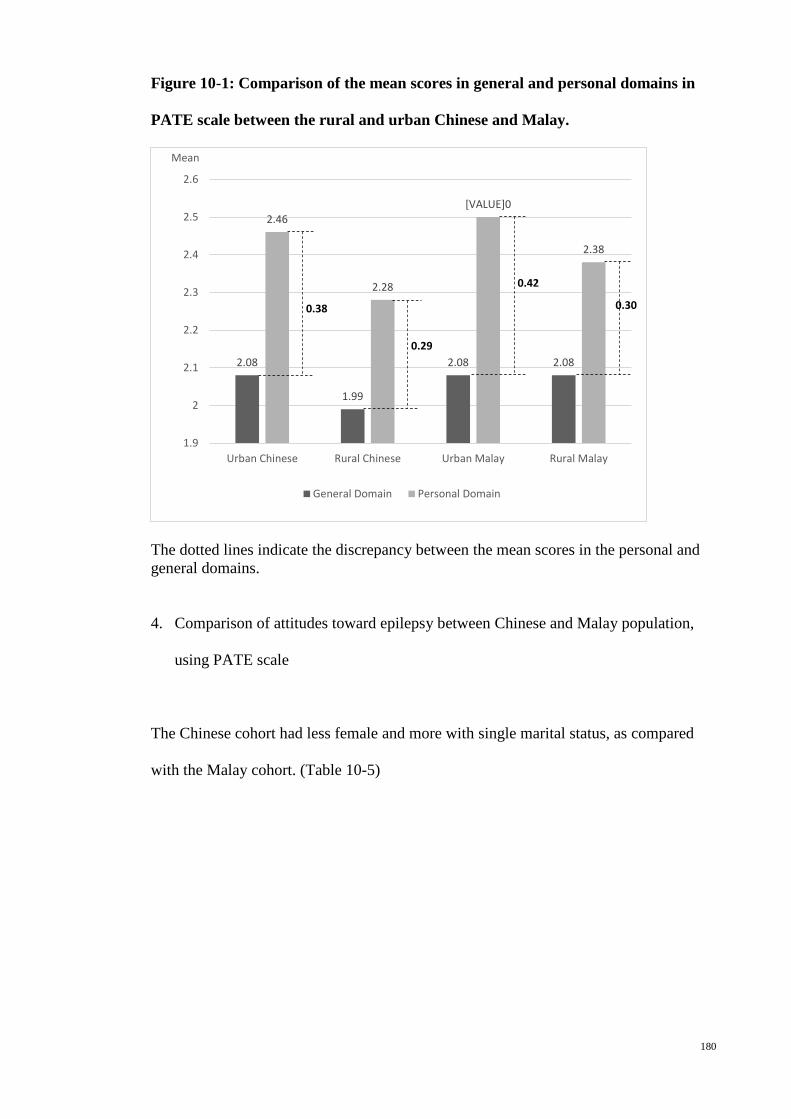
180
Figure 10-1: Comparison of the mean scores in general and personal domains in
PATE scale between the rural and urban Chinese and Malay.
The dotted lines indicate the discrepancy between the mean scores in the personal and general domains.
4. Comparison of attitudes toward epilepsy between Chinese and Malay population,
using PATE scale
The Chinese cohort had less female and more with single marital status, as compared
with the Malay cohort. (Table 10-5)
2.08
1.99
2.08 2.08
2.46
2.28
[VALUE]0
2.38
1.9
2
2.1
2.2
2.3
2.4
2.5
2.6
Urban Chinese Rural Chinese Urban Malay Rural Malay
Mean
General Domain Personal Domain
0.38
0.29
0.42
0.30

181
Table 10-5: Demographic characteristics of the total participants (N=348), and the
urban and rural subgroups (N=188 and 160, respectively).
Demographic Variables Chinese Malay Gender: Female, n (%) 160 (46.0) 145 (57.3)* Age, mean ±SD 38.7±15.2 38.9±13.6 Marital Status: Single, n (%) 149 (42.8) 65 (25.7)* Education Level: Tertiary level, n (%) 157 (45.1) 130 (51.4) Employment Status: Full time, n (%) 165 (47.4) 122 (48.2) Income: RM2000 and above, n (%) 148 (42.5) 101 (39.9) *p-value is <0.01, as compared to the urban group.
The mean score in both personal and general domains of the Chinese population were
lower than those in the Malay population but not statistically different, as shown in
Table 10-6. Chinese population had a lower mean scores in the social life category than
the Malay (p<0.01), indicating that Chinese had a better attitudes toward social contact
with people with epilepsy.
Table 10-6. Means and standard deviation (SD) of each domain and subcategory in
Chinese (n=348) and Malay (n=253) populations.
Chinese, mean (SD) Malay, mean (SD) Domain (Number of items) General Domain (9) 2.04 (0.53) 2.08 (0.55) Personal Domain (5) 2.37 (0.64) 2.46 (0.60) Total (14) 2.16 (0.51) 2.22 (0.49) Subcategory (Items included) Marital (6,10,11,13) 2.47 (0.70) 2.49 (0.63) Employment (12,14) 2.09 (0.72) 2.09 (0.68) Education (1,8,9) 2.37 (0.73) 2.43 (0.78) Social life (3,4,5,7) 1.81 (0.62) 1.95 (0.63)* * p-value is <0.01; as compared to the Chinese population.
The responses were recoded into agree and disagree by merging the answers 1 and 2 in
the Likert’s scale into “disagree” and answers 4 and 5 into “agree” as shown in Table
10-7. There was less Chinese respondents with negative attitudes toward items 1, 3, 4, 9
and 10, as compared with the Malay. There were a total of 28.7% among Chinese

182
respondents and 26.1% among Malay respondents who thought “people with epilepsy
should study in a special school” (item 8). For item 10, 11 and 13 related to marriage,
there were less than 20% of the respondents, either Malay or Chinese, with answers
indicative of negative attitudes toward marriage with people with epilepsy.
Table 10-7. Percentage of subjects agree and disagree with the items, comparison
between the Chinese and Malay populations (N=348 and 253 respectively).
Item Agree/Disagree (%) 1
Chinese Malay 1. People with epilepsy should not study in college or university. 7.5/84.5* 9.1/76.7
2. People with epilepsy have the same rights as all people. 87.4/7.5 88.9/5.5
3. People with epilepsy should be isolated from others. 2.9/90.2* 4.3/83.4
4. People with epilepsy should not participate in social activities. 8.0/84.5*** 13.4/70.8
5. I will not mind being seen in the company with someone known to have epilepsy. 83.6/10.1 84.2/7.5
6. People with epilepsy should not marry. 7.8/69.0*** 2.8/83.4 7. I would stay away from a friend if I know she/he has epilepsy. 4.3/91.1 5.5/88.5
8. People with epilepsy should study in a special school. 28.7/47.1 26.1/54.2
9. Schools should not place children with epilepsy into regular classrooms. 16.4/62.9* 24.5/53.0
10. I would date someone even though he/she has epilepsy. 59.2/10.1*** 43.1/17.8
11. I would marry someone with epilepsy, even though he/she has epilepsy. 35.1/18.7 32.8/17.0
12. I feel uncomfortable working with someone who has epilepsy. 6.6/79.3 9.1/73.1
13. I will advise my family members against marrying someone with epilepsy. 13.2/55.7 15.4/47.8
14. If I am an employer, I would give employment opportunity to someone with epilepsy.
70.4/8.9** 81.8/5.9
1 The percentage is the total of those who answered either 1 and 2 as disagree, or 4 and 5 as agree. * p-value is <0.05; ** p-value is <0.01; and p-value is <0.001 as compared to the Malay population.
Discussion

183
This study showed that the rural Chinese population had a more positive attitudes
toward epilepsy, related to items in the personal domain which required a long-term
personal commitment, especially on marital and employment aspects. When compared
with the Malay population, Chinese had a better attitudes toward social contact with
people with epilepsy.
The urban-rural difference in the attitudes toward epilepsy in this study is in contrary to
the previous study with a more positive attitudes in the urban population among the
Malaysian Chinese18 and the Turkish populations.17 However, this is comparable to
studies reporting better attitudes toward epilepsy in the urban15,16.
Table 10-2 demonstrated that the urban-rural difference was only significant in the
domain required long-term personal commitment (personal domain) but not in the
general domain. There is a bigger discrepancy between the mean scores in the personal
and general domains in the urban population (figure 10-1), suggesting that their
attitudes toward epilepsy were less consistent across all domains, when compared with
the rural Chinese. This discrepancy is consistent with the previous studies using the
PATE scale. This is an important finding indicating that understanding the public
attitudes toward epilepsy from general point of view is inadequate in the social stigma
studies in epilepsy, especially in the urban Chinese population.
Chinese population in Malaysia has great variation in the cultural and religious practices,
as contrast with the Malay which believe in the same religion, which is Islam. Therefore,
as compared with the absence of urban-rural difference in attitudes toward epilepsy in
Malay, the difference in the mean scores in the personal domain in this study is likely

184
secondary to the socio-economic differences which demarcated the urban-rural
boundary.
This study showed that rural Chinese population had a more positive attitude toward
marriage and employment in people with epilepsy than the urban group, compatible
with the finding in a study on Malay population (Ref) as well as a Taiwan study which
stated that those with higher education were more prejudiced against marrying an
epileptic person.15 The industry in urban city is highly skill-based and more competitive,
as compared with small or labor-based industry in the rural area. (Ref) This might
explain how the rural population perceive the capability of the people with epilepsy in
coping with a less skill-based employment.
There were more than 25% of the respondents think that people with epilepsy should
study in special school. Only slightly more than 50% think that people with epilepsy
should be placed into regular classrooms. This indicated a strongly negative attitudes
among Malaysian Chinese and Malay populations toward education in people with
epilepsy. This is likely to have a significant impact on children with epilepsy. Future
study should focus on understanding of the underlying reasons leading to this negative
attitudes toward education in epilepsy, as well as the magnitude of impact of this public
attitudes on children with epilepsy.
Future Implication
Findings in this study were similar to previous study in Chinese population of
Malaysia18, revealing the urban-rural differences in attitudes toward certain social
185
aspects of life in people with epilepsy. This will serve as a guide for the development
of social intervention among the Chinese population in various parts of Malaysia.
Conclusion
The rural Chinese had a more positive attitudes toward epilepsy as compared with the
urban group, based on the mean scores in the personal domain in PATE scale. There
was no significant differences between the Chinese and Malay population.
References
1. Fisher RS, van Emde Boas W, Blume W, et al. Epileptic seizures and epilepsy:
definitions proposed by the International League Against Epilepsy (ILAE) and the
International Bureau for Epilepsy (IBE). Epilepsia 2005;46:470-2.
2. Shorvon RD, Farmer PJ. Epilepsy in developing countries: a review of
epidemiological, sociocultural and treatment aspects. Epilepsia 1988;29:S36-S45.
3. Lim KS, Chin HL, Chong TT. Attitudes toward epilepsy, a systemic review.
Neurology Asia 2011;16:269-80.
4. Rahman AFA. Awareness and knowledge of epilepsy among students in a
Malaysian university. Seizure 2005;14:593-6.
5. Jacoby A, Gory J, Gamble C, Baker GA. Public knowledge, private grief: A
study of public attitudes to epilepsy in the United Kingdom and implications for stigma.
Epilepsia 2004;45:1405-15.
6. Ramasundrum V, Zabidi AMH, Chong TT. Public awareness, attitudes and
understanding towards epilepsy in Kelantan, Malaysia. Neurology Journal of Southeast
Asia 2000;5:55-60.
7. Epilepsy in The WHO African Region: Bridging the Gap. 2004;4:1-43.

186
8. Matuja W. Aetiological factors in Tanzanian epileptics. East Africa Medicine
Journal 1989;66:343-8.
9. Nwe NW, Chit S. Public awareness, attitude and understanding toward epilepsy
among Myanmar people. Neurology Journal of Southeast Asia 2002;7:81-8.
10. Hashmi SJ, Dixit JV. Knowlege, attitude and practice of epilepsy among
patients and family members attending urban health and training centre, Shahganj,
Aurangabad, India. Global Journal of Medicine and Public Health 2012;1:3-5.
11. Neni SW, Abdul Latif AZ, Wong SY, Lua PL. Awareness, knowledge and
attitudes towards epilepsy among rural populations in East Coast Peninsular Malaysia:
A preliminary exploration. Seizure-European Journal of Epilepsy 2010;19:280-90.
12. Saengpattrachai M, Srinualta D, Lorlertratna N, Pradermduzzadeeporn E,
Poonpol F. Public familiarity with, knowledge of, and predictors of negative attitudes
toward epilepsy in Thailand. Epilepsy Behaviour 2010;17:497-505.
13. Hasan HH, Alen YKS, Wayne WGW, Ahmadi K, Anwar M, Goh GK.
Understanding of and attitudes toward epilepsy among the urban Chinese population in
Malaysian. Singapore Medicine Journal 2010;51:290-9.
14. Tekle-Haimanot R, Abebe M, Forsgren L. Attitudes of rural people in central
Ethiopia towards epilepsy. Social Science Medicine 1991;32:203-9.
15. Chung YM, Chang YC, Lai YH, Lai CW. Survey of Public Awareness,
Understanding, and Attitudes Toward Epilepsy in Taiwan. Epilepsia 1995;36:488-93.
16. Kobau R, Dilorio C, Anderson L, Price P. Further validation and reliability
testing of the Attitudes and Beliefs about Living with Epilepsy (ABLE) components of
the CDC Epilepsy Progam Instrument on Stigma. Epilepsy & Behaviour 2006;8:552-9.
17. Demirci S, Donmez C, Gundogar D, Baydar C. Public awareness of, attitude
toward, and understanding of epilepsy in Isparta, Turkey. Epilepsy & Behavior
2007;11:427-33.
187
18. Lim KS, Tan LP, Lim KT, Tan CT. Survey of public awareness, understanding,
and attitudes toward epilepsy among Chinese in Malaysia. Neurology Journal of
Southeast Asia 1999;4:31-6.
19. Lua PL, Neni WS. Awareness, knowledge, and attitudes with respect to epilepsy:
An investigation in relation to health-related quality of life within a Malaysian setting.
Epilepsy and Behavior 2011;21:248-54.
20. Wo M, Lim KS, Bhaskar S, Tan CT. Comparison of attitudes towards epilepsy
between rural and urban Malay population in Malaysia, using the Public Attitudes
Toward Epilepsy (PATE) scale. 2013;(unpublished).
21. Lim KS, Wu C, Choo WY, Tan CT. Development and validation of a Public
Attitudes Towards Epilepsy (PATE) scale. Epilepsy & Behavior 2012;24:207-12.
22. Lim KS, Choo WY, Wu C, Hills MD, Tan CT. Malay Public Attitudes Toward
Epilepsy (PATE) scale: translation and psychometric evaluation. 2013;(unpublished).
23. Lim KS, Lim CH, Tan CT. Attitudes toward epilepsy, a systematic review.
Neurology Asia 2011;16:269-80.
24. Chung MY, Chang YC, Lai YH, Lai CW. Survey of public awareness,
understanding, and attitudes toward epilepsy in Taiwan. Epilepsia 1995;36:488-93.
188
Chapter 11: Attitudes toward epilepsy among the Indonesian, a preliminary study in
Manado
Abstract
Introduction: Till date, there were only two studies on attitudes toward epilepsy
performed in Indonesia. This study aimed to understand the public attitudes toward
epilepsy in Manado, which is the capital city of the North Sulawesi province of
Indonesia, using a quantitative PATE scale. Methodology: A total of 100 general public
with a mean age of 31.7±12.3 years (range 17-60) were recruited through convenient
sampling from Manado, Indonesia. Results: Those with tertiary education level had
lower mean score in the general domain (p<0.01) but not in the personal domain. The
mean score in both personal and general domains of the Indonesian population were
significantly higher than those in the Malaysian population. Indonesian population had a
lower mean scores in the all subcategories than the Malaysian. Conclusion: This study
showed a significant poorer attitudes toward epilepsy among the Indonesian in Manado,
as compared to the Malay in Malaysia as well as the Malaysian Chinese.
(153 words)
Introduction
Indonesia is a republic country in Southeast Asia, with both Dutch and Islamic
influence but at the same time has its own unique cultural characteristics. Indonesia
consists of hundreds of distinct native ethnic and linguistic groups, but yet have a shared
identity, defined by their national language. Its ethnic diversity and religious pluralism
189
provide a rich resource to understand the variation in social stigma among the
Indonesians.
Till date, there were only two studies on attitudes toward epilepsy performed in
Indonesia, one among the publics1 and one among the school teachers in Medan in
2001.2 These studies demonstrated a significantly negative attitudes towards epilepsy in
Indonesia as evidenced by more than half of the respondents objected their children
marrying a person with epilepsy, and thought that epilepsy was a mental illness1, and 17%
of the publics believed that saliva of the patients was able to spread the infections2.
The Public Attitudes Toward Epilepsy (PATE) scale was developed to measure the
public attitudes toward epilepsy quantitatively and factored into two domains, i.e. a
general domain that required minimal or no consideration of respondents’ involvement,
and a personal domain that required a long-term personal commitment or involvement.3
This scale was performed among the general population in Malaysia, a neighbouring
country with similar cultural background especially among the Muslims.
This study aimed to understand the public attitudes toward epilepsy in Manado, which
is the capital city of the North Sulawesi province of Indonesia, using a quantitative
PATE scale, with direct comparison with the attitudes among Malaysian populations
reported in the previous studies using the same scale.4,5
Methodology
Study population
190
A total of 100 respondents were recruited through convenient sampling from Manado,
Indonesia. Verbal consents were obtained in agreement to carry out survey and all
questionnaires were administered anonymously. The selection criteria given that
subjects must not be an epileptic person and that they should be permanent residents of
the district studied. Ethical approval from the ethics committee at University Malaya
Medical Center (MREC no.: 878.10).
Measures
The Public Attitudes Toward Epilepsy (PATE) scale is a 14-item scale measuring the
public attitudes toward epilepsy (Lim, 2012)3. A 1-5 Likert scale was used for scoring
with 1 being strongly disagree and 5 being strongly agree. Some items were reverse
scored so that a higher score would indicate a more negative attitude. This scale was
performed in a general population and factored into two domains, i.e. a general domain
(nine items) that required minimal or no consideration of respondents’ involvement, and
a personal domain (five items) that required a long-term personal commitment or
involvement. This is a validated scale with good internal consistency (Cronbach’s alpha
of 0.868 and 0.633, in the general and personal domains respectively).
This study was performed using the modified Malay PATE scales according to the
Indonesian Malay language. The Malay version of PATE scale is a reliable and
validated scale with good internal consistency for both general and personal domains
(Cronbach’s coefficient 0.868 and 0.633, respectively).6

191
Demographic data were collected on the subject’s race, age, gender, marital status,
education status, employment status, occupation, and income level for descriptive and
continuous analysis.
Statistical analysis
Statistical Package for Social Sciences version 19 (SPSS 19.0) was adopted for data
analyses. Descriptive analyses were depicted using mean, standard deviation and simple
percentages as appropriate. The differences in demographic variables between two
groups were assessed using Chi-square tests and one-way ANOVA. Comparisons of
mean scores in the personal and general domains between the Indonesian and the
Malaysian Malay and Chinese were performed using one-way ANOVA. In addition, the
items were further subcategorized into various socio-economic subgroups according to
previous publication, i.e. categorize question of “I will advise my family members
against marrying someone with epilepsy.” into marriage related item7.
Results
1. Demographic characteristic of samples
A total of 100 respondents, with a mean age of 31.7±12.3 years (range 17-60) were
recruited. (Table 11-1) The Indonesian cohort was significantly younger, female
predominant, higher single marital status and less full-time employed, than the
Malaysian cohort (p-value <0.01)
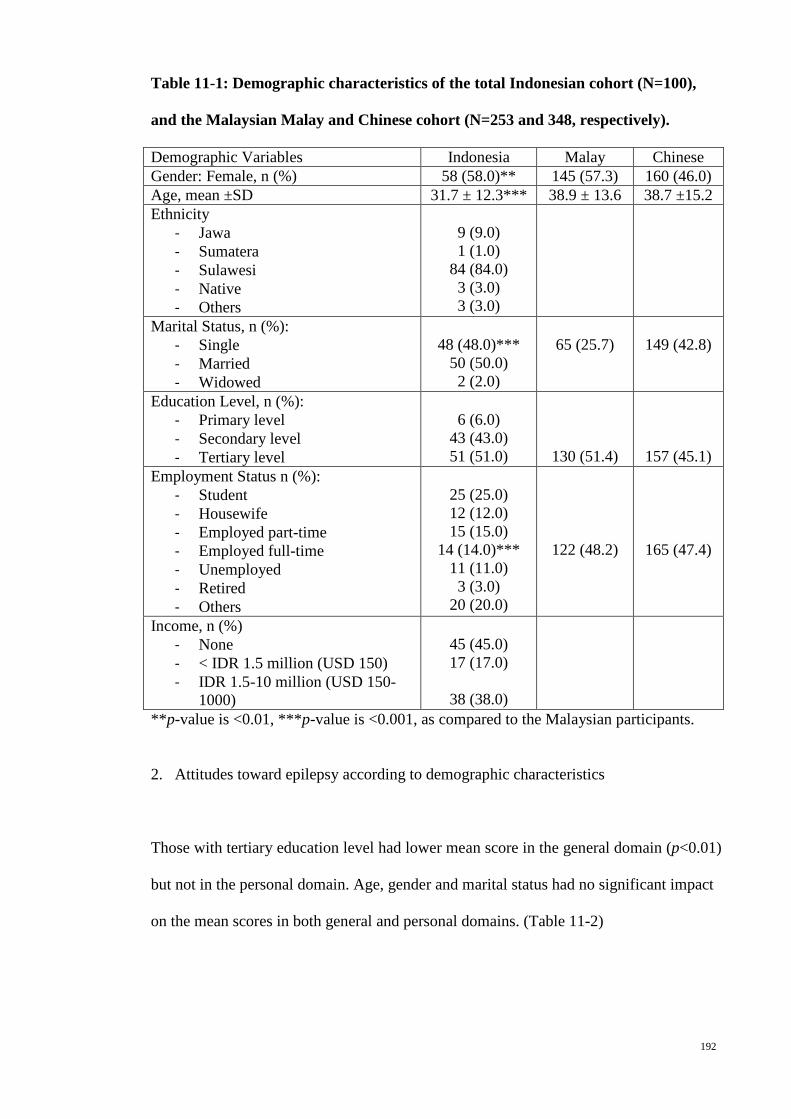
192
Table 11-1: Demographic characteristics of the total Indonesian cohort (N=100),
and the Malaysian Malay and Chinese cohort (N=253 and 348, respectively).
Demographic Variables Indonesia Malay Chinese Gender: Female, n (%) 58 (58.0)** 145 (57.3) 160 (46.0) Age, mean ±SD 31.7 ± 12.3*** 38.9 ± 13.6 38.7 ±15.2 Ethnicity
- Jawa - Sumatera - Sulawesi - Native - Others
9 (9.0) 1 (1.0)
84 (84.0) 3 (3.0) 3 (3.0)
Marital Status, n (%): - Single - Married - Widowed
48 (48.0)***
50 (50.0) 2 (2.0)
65 (25.7)
149 (42.8)
Education Level, n (%): - Primary level - Secondary level - Tertiary level
6 (6.0)
43 (43.0) 51 (51.0)
130 (51.4)
157 (45.1) Employment Status n (%):
- Student - Housewife - Employed part-time - Employed full-time - Unemployed - Retired - Others
25 (25.0) 12 (12.0) 15 (15.0)
14 (14.0)*** 11 (11.0) 3 (3.0)
20 (20.0)
122 (48.2)
165 (47.4)
Income, n (%) - None - < IDR 1.5 million (USD 150) - IDR 1.5-10 million (USD 150-
1000)
45 (45.0) 17 (17.0)
38 (38.0)
**p-value is <0.01, ***p-value is <0.001, as compared to the Malaysian participants.
2. Attitudes toward epilepsy according to demographic characteristics
Those with tertiary education level had lower mean score in the general domain (p<0.01)
but not in the personal domain. Age, gender and marital status had no significant impact
on the mean scores in both general and personal domains. (Table 11-2)
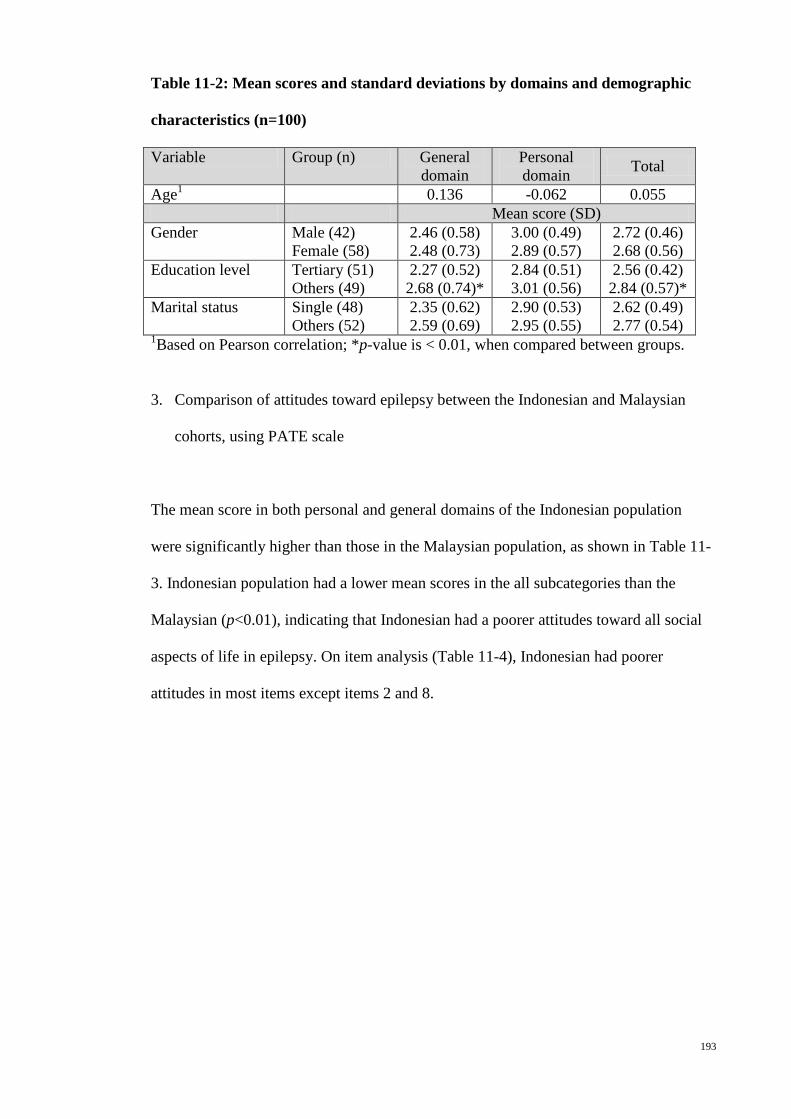
193
Table 11-2: Mean scores and standard deviations by domains and demographic
characteristics (n=100)
Variable Group (n) General domain
Personal domain Total
Age1 0.136 -0.062 0.055 Mean score (SD) Gender
Male (42) Female (58)
2.46 (0.58) 2.48 (0.73)
3.00 (0.49) 2.89 (0.57)
2.72 (0.46) 2.68 (0.56)
Education level Tertiary (51) Others (49)
2.27 (0.52) 2.68 (0.74)*
2.84 (0.51) 3.01 (0.56)
2.56 (0.42) 2.84 (0.57)*
Marital status
Single (48) Others (52)
2.35 (0.62) 2.59 (0.69)
2.90 (0.53) 2.95 (0.55)
2.62 (0.49) 2.77 (0.54)
1Based on Pearson correlation; *p-value is < 0.01, when compared between groups.
3. Comparison of attitudes toward epilepsy between the Indonesian and Malaysian
cohorts, using PATE scale
The mean score in both personal and general domains of the Indonesian population
were significantly higher than those in the Malaysian population, as shown in Table 11-
3. Indonesian population had a lower mean scores in the all subcategories than the
Malaysian (p<0.01), indicating that Indonesian had a poorer attitudes toward all social
aspects of life in epilepsy. On item analysis (Table 11-4), Indonesian had poorer
attitudes in most items except items 2 and 8.
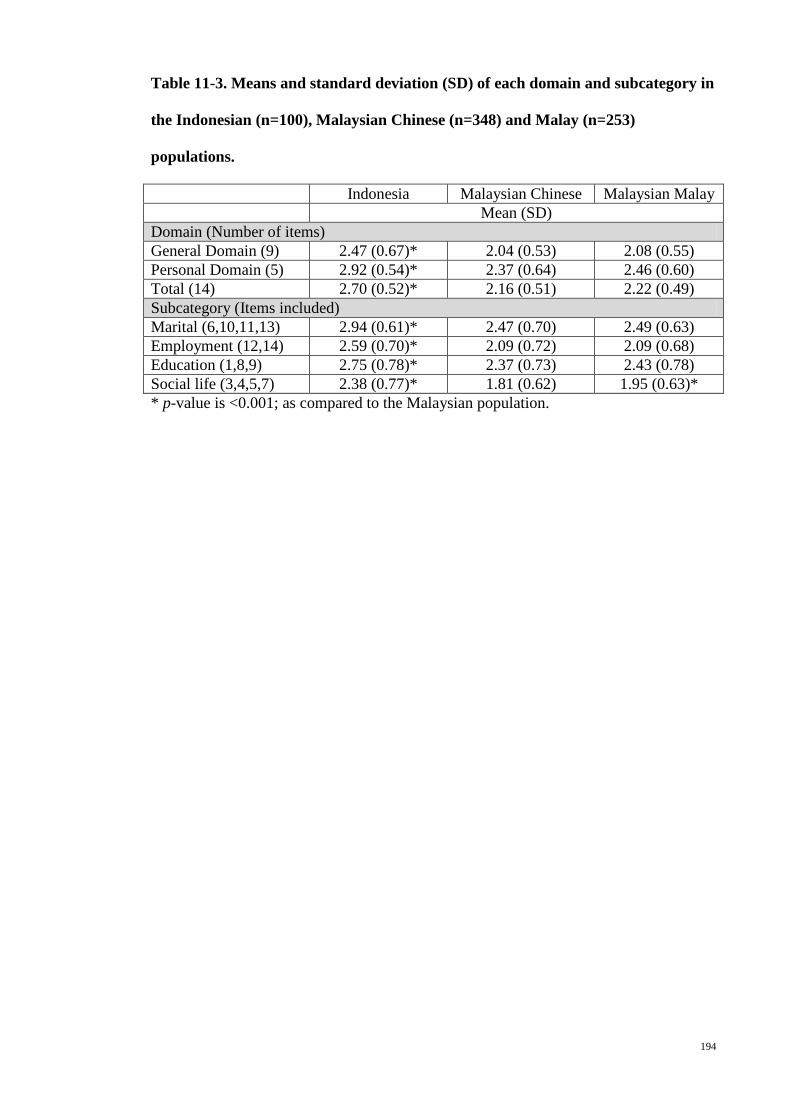
194
Table 11-3. Means and standard deviation (SD) of each domain and subcategory in
the Indonesian (n=100), Malaysian Chinese (n=348) and Malay (n=253)
populations.
Indonesia Malaysian Chinese Malaysian Malay Mean (SD) Domain (Number of items) General Domain (9) 2.47 (0.67)* 2.04 (0.53) 2.08 (0.55) Personal Domain (5) 2.92 (0.54)* 2.37 (0.64) 2.46 (0.60) Total (14) 2.70 (0.52)* 2.16 (0.51) 2.22 (0.49) Subcategory (Items included) Marital (6,10,11,13) 2.94 (0.61)* 2.47 (0.70) 2.49 (0.63) Employment (12,14) 2.59 (0.70)* 2.09 (0.72) 2.09 (0.68) Education (1,8,9) 2.75 (0.78)* 2.37 (0.73) 2.43 (0.78) Social life (3,4,5,7) 2.38 (0.77)* 1.81 (0.62) 1.95 (0.63)* * p-value is <0.001; as compared to the Malaysian population.

195
Table 11-4. Percentage of subjects agree and disagree with the items, comparison
between the Indonesian and the Malaysian Chinese and Malay populations (N=100,
348 and 253 respectively).
Item Agree/Disagree (%) 1
Indonesian Malaysian Chinese
Malaysian Malay
1. People with epilepsy should not study in college or university. 31.0/63.0** 7.5/84.5 9.1/76.7
2. People with epilepsy have the same rights as all people. 81.0/11.0 87.4/7.5 88.9/5.5
3. People with epilepsy should be isolated from others. 15.0/71.0** 2.9/90.2 4.3/83.4
4. People with epilepsy should not participate in social activities. 23.0/60.0** 8.0/84.5 13.4/70.8
5. I will not mind being seen in the company with someone known to have epilepsy.
70.0/19.0** 83.6/10.1 84.2/7.5
6. People with epilepsy should not marry. 14.0/74.0** 7.8/69.0 2.8/83.4 7. I would stay away from a friend if I know she/he has epilepsy. 17.0/75.0** 4.3/91.1 5.5/88.5
8. People with epilepsy should study in a special school. 30.0/44.0 28.7/47.1 26.1/54.2
9. Schools should not place children with epilepsy into regular classrooms. 24.0/51.0* 16.4/62.9 24.5/53.0
10. I would date someone even though he/she has epilepsy. 16.0/36.0** 59.2/10.1 43.1/17.8
11. I would marry someone with epilepsy, even though he/she has epilepsy. 12.0/39.0** 35.1/18.7 32.8/17.0
12. I feel uncomfortable working with someone who has epilepsy. 16.0/58.0** 6.6/79.3 9.1/73.1
13. I will advise my family members against marrying someone with epilepsy. 26.0/34.0** 13.2/55.7 15.4/47.8
14. If I am an employer, I would give employment opportunity to someone with epilepsy.
59.0/23.0** 70.4/8.9 81.8/5.9
1 The percentage is the total of those who answered either 1 and 2 as disagree, or 4 and 5 as agree. * p-value is <0.05; and ** p-value is <0.001 as compared to the Malaysian population.
Discussion
This study showed that there was a significant poorer attitudes among the Indonesian in
Manado toward epilepsy, either in the personal or general domains in the PATE scale,
as well as in all social aspects of life such as employment, education, marriage and
196
social contact. This is the first direct comparison of the attitudes toward epilepsy
between Indonesian and other country.
An indirect comparison of the attitudes toward epilepsy between the Indonesian2 and
other Asian countries was performed in a systematic review8 which showed that there
was more Indonesian who think epilepsy is a mental illness. As compared to the similar
studies in Malaysia9,10, this review also showed that Indonesian had poorer attitudes
toward marriage, employment and social contact.
Those with higher education level was found to have better attitudes toward epilepsy in
the general attitudes (general domain in the PATE scale) but not in the personal
attitudes. This finding is persistently demonstrated in studies using PATE scale.3,4,6
Limitations
This is a preliminary study performed in the Manado, Indonesia, and will not be
representative of the Indonesian population in general, which is ethnically and
religiously very diverse.
Conclusion
This study showed a significant poorer attitudes toward epilepsy among the Indonesian
in Manado, as compared to the Malay in Malaysia as well as the Malaysian Chinese.
197
References
1. Indra B, Sjahrir H. Public awareness, attitude and understanding towards
epilepsy in Medan, Indonesia. Neurol J Southeast Asia 2001;6:42.
2. Rambe AS, Sjahrir H. Awareness, attitudes and understanding towards epilepsy
among school teachers in Medan, Indonesia. Neurology Journal of Southeast Asia
2002;7:77-80.
3. Lim KS, Wu C, Choo WY, Tan CT. Development and validation of a Public
Attitudes Towards Epilepsy (PATE) scale. Epilepsy & Behavior 2012;24:207-12.
4. Lim KS, Choo WY, Hills MD, Tan CT. Attitudes towards epilepsy among
Chinese population in Malaysia, using the Public Attitudes Toward Epilepsy (PATE)
scale. 2013;(unpublished).
5. Wo M, Lim KS, Bhaskar S, Tan CT. Comparison of attitudes towards epilepsy
between rural and urban Malay population in Malaysia, using the Public Attitudes
Toward Epilepsy (PATE) scale. 2013;(unpublished).
6. Lim KS, Choo WY, Wu C, Hills MD, Tan CT. Malay Public Attitudes Toward
Epilepsy (PATE) scale: translation and psychometric evaluation. 2013;(unpublished).
7. Lim KS, Lim CH, Tan CT. Attitudes toward epilepsy, a systematic review.
Neurology Asia 2011;16:269-80.
8. Mac TL, Tran D-S, Quet F, Odermatt P, Preux P-M, Tan CT. Epidemiology,
aetiology, and clinical management of epilepsy in Asia: a systematic review. Lancet
Neurol 2007;6:533-43.
9. Lim KS, Tan LP, Lim KT, Tan CT. Survey of public awareness, understanding,
and attitudes toward epilepsy among Chinese in Malaysia. Neurology Journal of
Southeast Asia 1999;4:31-6.
198
10. Ramasundrum V, Zabidi AMH, Chong TT. Public awareness, attitudes and
understanding towards epilepsy in Kelantan, Malaysia. Neurology Journal of Southeast
Asia 2000;5:55-60.
199
Chapter 12: Cultural and ethnic differences in attitudes toward epilepsy
Abstract
Introduction: No studies had ever compared the percentage of negative responses using
different type of questions and toward various aspects of social life. Method: Data from
the previous studies using PATE scale among 100 Indonesian, 253 Malaysian Malay
and 348 Malaysian Chinese respondents were extracted for analysis. Results: The
percentages with negative response to a general item, i.e. “people with epilepsy should
not marry” were significantly lower than those to items required personal commitment
such as “I would marry someone with epilepsy, even though he/she has epilepsy”. The
percentage with negative response toward dating and marriage did not differ much in
Malaysian Malay (17.8% vs. 17.0%) and in Indonesian (36.0% vs. 39.0%); whereas
among the Malaysian Chinese, there were less respondents with negative response
toward dating as compared with those toward marriage (10.1% vs. 18.7%). The
Malaysian Chinese had a higher percentage of respondents with negative response
toward employing someone with epilepsy than toward working with someone with
epilepsy (20.7% vs. 14.1%), and the percentages were reverse in the other two groups.
The mean scores for the social contact category was lower than the employment
category, followed by the education and marriage categories, in the Indonesian and
Malaysian populations. Conclusion: Attitudes toward epilepsy differ with the type of
questions, as well as the social category. There was also cultural variation in the pattern
of attitudes toward marriage and employment in epilepsy.
(231 words)
200
Introduction
A systematic review by the first author revealed a marked variation in the questions
used to measure the attitudes toward epilepsy.1 Some questions have been phrased in
the form of a general statement; whereas some questions required personal
consideration, for example a marriage involving the participants or their children. A
general statement tended to produce more positive results. Questions which required
personal consideration, were more reflective of the actual stigmatization, and this
tended to skew the results negatively. Comparison between two studies using different
type of questions on the same social issue such as employment, may give us a false
impression of the actual difference between the two studied populations.
The initial survey on attitudes toward epilepsy performed by Caveness in 1949 focused
on three social issues i.e. employment, social contact and marriage.2 These three aspects
of social life had been the main themes of most studies on attitudes toward epilepsy.
People may tend to answer more positively to certain social issues such as having a
social contact with a person with epilepsy. Reversely, more may answer negatively
toward marrying or working with someone with epilepsy. However, none of the studies
had ever compared the percentage of negative responses toward various aspects of
social life.
This study aimed to determine (1) whether the attitudes toward an aspect of social life,
i.e. marriage or employment, changed with the way how the questions are asked, and (2)
whether there were differences in the magnitude of negative attitudes toward various
aspects of social life, including social contact, education, employment and marriage.
201
Methodology
Data of the previous studies3-5 using PATE scale among 100 Indonesian, 253
Malaysian Malay and 348 Malaysian Chinese respondents were extracted for analysis.
The Public Attitudes Toward Epilepsy (PATE) scale is a 14-item scale measuring the
public attitudes toward epilepsy (Lim, 2012)6. A 1-5 Likert scale was used for scoring
with 1 being strongly disagree and 5 being strongly agree. Some items were reverse
scored so that a higher score would indicate a more negative attitude.
The results of selective items related to marriage (items 6, 10, 11 and 13) and
employment (items 12 and 14) were used for comparison between groups. Recoding of
the item answers to agree (4 and 5 in the Likert’s scale) or disagree (1 and 2 in the
Likert’s scale) was performed, similarly to previous study.3 In addition, the
categorization of the items into various socio-economic subgroups was performed
according to previous publication1, for example, question of “I will advise my family
members against marrying someone with epilepsy” was categorized into marriage
category.
Results
1. Attitudes toward marriage
The percentages with negative response to item 6 in the PATE scale, i.e. agree with
“people with epilepsy should not marry” were significantly lower than to items 10, 11
and 13, in both Malaysian and Indonesian cohorts, as shown in Figure 1. (Note: Item 10

202
is “I would date someone even though he/she has epilepsy”, 11 “I would marry
someone with epilepsy, even though he/she has epilepsy” and 13 “I will advise my
family members against marrying someone with epilepsy”.)
Among the Malaysian Malay and Indonesian populations, the percentage with negative
response to item 10 and 11, i.e. attitudes toward dating and marriage, did not differ
much (17.8% vs. 17.0% in Malaysian Malay and 36.0% vs. 39.0% in Indonesian);
whereas among the Malaysian Chinese, there were less respondents with negative
response toward dating (10.1%) as compared with those toward marriage (18.7%).
Among the Indonesian and Malaysian Chinese, the percentages of those against their
family members marrying someone with epilepsy were lower than the percentages of
those would not marry with someone with epilepsy themselves (26.0% vs. 39.0% in
Indonesian, and 13.2% vs. 18.7% in Chinese cohorts). However, the difference in
percentages of these two items was not much in Malaysian Malay (15.4% vs. 17.0%).
Figure 12-1: The percentages of responses to items related to marriage in
Malaysian Malay (n=253) and Chinese (n=348), and in Indonesian (n=100) cohorts.
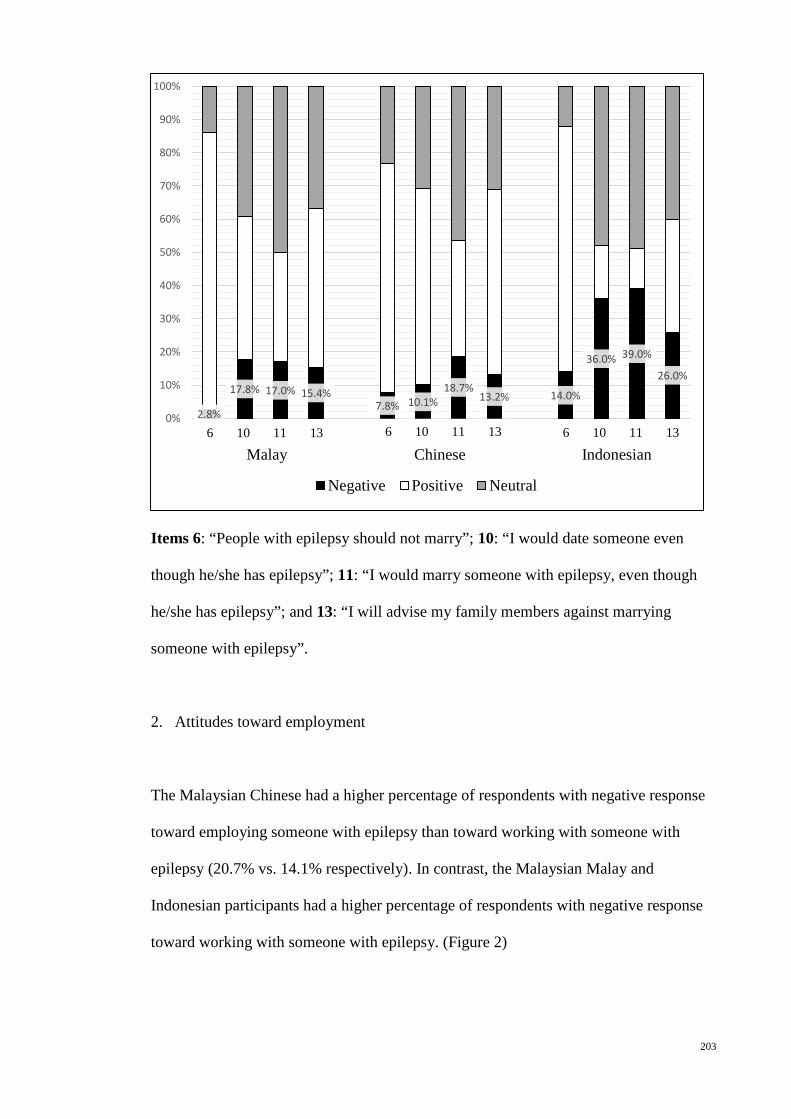
203
Items 6: “People with epilepsy should not marry”; 10: “I would date someone even
though he/she has epilepsy”; 11: “I would marry someone with epilepsy, even though
he/she has epilepsy”; and 13: “I will advise my family members against marrying
someone with epilepsy”.
2. Attitudes toward employment
The Malaysian Chinese had a higher percentage of respondents with negative response
toward employing someone with epilepsy than toward working with someone with
epilepsy (20.7% vs. 14.1% respectively). In contrast, the Malaysian Malay and
Indonesian participants had a higher percentage of respondents with negative response
toward working with someone with epilepsy. (Figure 2)
2.8%
17.8% 17.0% 15.4% 7.8% 10.1%
18.7% 13.2% 14.0%
36.0% 39.0%
26.0%
0%
10%
20%
30%
40%
50%
60%
70%
80%
90%
100%
Negative Positive Neutral
6 10 11 13 6 10 11 13
6 10 11 13 Malay Chinese Indonesian

204
Figure 12-2: The percentages of responses to items related to employment in
Malaysian Malay (n=253) and Chinese (n=348), and in Indonesian (n=100) cohorts.
Items 12: “I feel uncomfortable working with someone who has epilepsy”, and 14: “If I
am an employer, I would give equal employment opportunities to someone with
epilepsy”.
3. Attitudes toward various social categories
Figure 3 showed that the mean scores for the social contact category was lower than the
employment category, followed by the education and marriage categories, in the
Indonesian and Malaysian populations.
17.8% 12.3% 14.1%
20.7% 26.0% 18.0%
0%
10%
20%
30%
40%
50%
60%
70%
80%
90%
100%
Neutral Positive Negative
12 14 12 14
12 14 Malay Chinese Indonesian
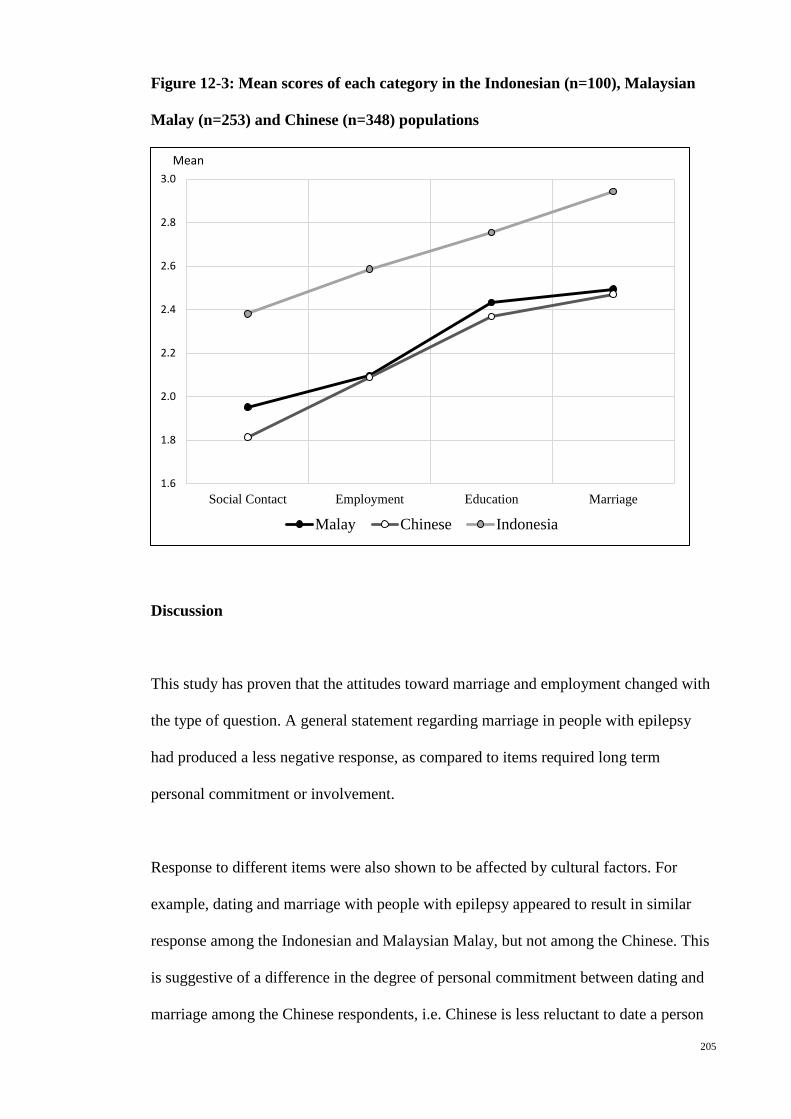
205
Figure 12-3: Mean scores of each category in the Indonesian (n=100), Malaysian
Malay (n=253) and Chinese (n=348) populations
Discussion
This study has proven that the attitudes toward marriage and employment changed with
the type of question. A general statement regarding marriage in people with epilepsy
had produced a less negative response, as compared to items required long term
personal commitment or involvement.
Response to different items were also shown to be affected by cultural factors. For
example, dating and marriage with people with epilepsy appeared to result in similar
response among the Indonesian and Malaysian Malay, but not among the Chinese. This
is suggestive of a difference in the degree of personal commitment between dating and
marriage among the Chinese respondents, i.e. Chinese is less reluctant to date a person
1.6
1.8
2.0
2.2
2.4
2.6
2.8
3.0
Social Contact Employment Education Marriage
Malay Chinese Indonesia
Mean

206
with epilepsy but not marrying them. Whereas among the Malaysian Malay and the
Indonesian in Manado, the results suggested that dating and marrying a person with
epilepsy might require the same degree of commitment, which is probably influenced
by the Muslim beliefs.
More Chinese respondents were against employing someone with epilepsy than
working together with them. This can be understood as employer will experience a
higher direct loss if employed someone with epilepsy, as compared with a worker
having a colleague with epilepsy. However, unexpectedly, more Malaysian Malay and
the Indonesian were against working with someone with epilepsy, rather than
employing them.
Figure 3 demonstrated that the negativity of the attitudes toward epilepsy increased
gradually from social contact to marriage. This indicated that the resistance to have
social contact among people with epilepsy is lower comparing to finding a job,
completing a basic education and engaging in a marital relationship.
Future implications
This study implied that study on questions or scales used in study on attitudes toward
epilepsy shall be standardized to enable useful and valid cross-sectional and
longitudinal comparison.
The perceptions of each items and various social aspects of life were also affected by
the ethnicity or cultural factors. Thus, cultural comparison of the attitudes toward
epilepsy is essential to guide understanding of the variation in social stigma in different
207
culture, ethnicity, or geographical region. This will form the basis of a more effective
strategy against social stigma in different cultures or regions.
Conclusion
Attitudes toward epilepsy differ with the type of questions, as well as the social
category. There was also cultural variation in the pattern of attitudes toward marriage
and employment in epilepsy.
References
1. Lim KS, Lim CH, Tan CT. Attitudes toward epilepsy, a systemic review.
Neurology Asia 2011;16:269-80.
2. Caveness W. A survey of public attitudes toward epilepsy. Epilepsia 1949;4:19-
26.
3. Lim KS, Choo WY, Hills MD, Tan CT. Attitudes towards epilepsy among
Chinese population in Malaysia, using the Public Attitudes Toward Epilepsy (PATE)
scale. 2013;(unpublished).
4. Wo M, Lim KS, Bhaskar S, Tan CT. Comparison of attitudes towards epilepsy
between rural and urban Malay population in Malaysia, using the Public Attitudes
Toward Epilepsy (PATE) scale. 2013;(unpublished).
5. Lim KS, Khosama H, Wo M, Ahmad S, Tan CT. Public attitudes toward
epilepsy among the Indonesian, a preliminary study in Manado. 2013;(unpublished).
6. Lim KS, Wu C, Choo WY, Tan CT. Development and validation of a Public
Attitudes Towards Epilepsy (PATE) scale. Epilepsy & Behavior 2012;24:207-12.
208
Chapter 13: Knowledge and public attitudes toward epilepsy, using EKQ and PATE
scale
(Submitted to Neurology Asia on 7 December 2013)
Abstract
Introduction: None of the identified studies employed a quantitative scale in
understanding the correlation between the knowledge and attitudes toward epilepsy.
Method: This study aimed to study the relationship between the knowledge and
attitudes toward epilepsy, using the Epilepsy Knowledge Questionnaire (EKQ) and the
Public Attitudes Toward Epilepsy (PATE) scale, via a convenient sampling during a
health fair in Kuala Lumpur, Malaysia, as part of a research project by the Malaysian
Society of Epilepsy. Results: A total 279 publics with a mean aged of 36.55±14.65
years (ranged from 15-77 years), 50.8% female with majority (63.0%) Chinese, 49.5%
with tertiary education level, were recruited. The mean score of epilepsy knowledge
questionnaire (EKQ) was 21.05±3.92 (95% confidence interval, CI: 20.57-21.48). Most
(78.8%) of the respondents scored <25 and only 1.3% respondents scored ≥30. Almost
60% of the items were incorrectly answered by more than 25% of the respondents.
Higher score in EKQ was associated with higher education level, and Chinese and
Indian ethnicity (p<0.01). The total score in the EKQ was correlated negatively with the
mean scores in the PATE scale (p<0.001), as well as the mean scores in both the
personal domain and general domains in the PATE scale (p<0.001). Eight items (1, 4, 5,
6, 8, 11, 15 and 32) were associated significantly with the mean scores in the personal
domain, and 4 items (3, 14, 25 and 26) were with the general domain of the PATE scale.
Conclusion: This study showed that the knowledge toward epilepsy is significantly

209
associated with better attitudes toward epilepsy. On item analysis, only certain aspects
of knowledge in epilepsy affected the attitudes toward epilepsy significantly.
(271 words)
Keywords: knowledge, attitudes, epilepsy, scale
Introduction
Knowledge about epilepsy is an important factor associated with the attitudes toward
epilepsy. Studies show that people with less knowledge about epilepsy, or without
personal contact with someone with epilepsy, have poorer attitudes.1-9 The magnitude of
the negative attitudes seems to be aggravated by the presence of misconception of
epilepsy, which include the perception of epilepsy as a form of insanity1,3,4, being
untreatable2,10, contagious11, hereditary10, or a form of mental retardation.4
Intervention studies using educational programs or material about epilepsy showed that
there was significant improvement in the attitudes towards epilepsy together with the
improvement in knowledge.2,12-16 However, none of the studies employed a quantitative
scale of the knowledge and attitudes toward epilepsy.
The Epilepsy Knowledge Questionnaire (EKQ) is a 55-item questionnaire17 assessing
the knowledge of epilepsy, of which 34 items were on the medical aspects of epilepsy.
These included the causes, manifestations, diagnosis, treatment and prognosis of
epilepsy. Higher score in the knowledge on the medical aspects of epilepsy in EKQ was
210
significantly associated with better psychological adjustment to epilepsy but also more
perceived stigma among people with epilepsy.18
The Public Attitudes Toward Epilepsy (PATE) scale is a 14-item scale measuring the
public attitudes toward epilepsy.19 It was developed to be applied cross-culturally and is
factored into two domains, i.e. a general domain (nine items) which requires minimal or
no consideration of respondents’ involvement, and a personal domain (five items)
which requires a long-term personal commitment or involvement such as marrying a
person with epilepsy, working with them or employing them.
This study aimed to study the relationship between the knowledge and attitudes toward
epilepsy, using EKQ and PATE scale.
Methodology
1. Sample Recruitment
A total 279 general populations were included in the survey via a convenient sampling
during a health fair in Kuala Lumpur, Malaysia, as part of a research project by the
Malaysian Society of Epilepsy. Consent is regarded as automatically given by the public
when they agreed to answer the questionnaire. All questionnaires were administered
anonymously. The survey was only performed in English. Ethical approval was
obtained from the ethics committee at University Malaya Medical Center (MREC no.:
878.10).
211
2. Measures
The Epilepsy Knowledge Questionnaire (EKQ) is a 55-item questionnaire17, with 34
items on knowledge about medical aspects of epilepsy and 21 on knowledge of social
aspects of epilepsy. Informants are asked to answer “true” or “false” to each statement.
In this study, only the 34 items relating to medical aspects of epilepsy were used, so that
possible scores ranged from 0 to 34. Higher score indicating better knowledge in
epilepsy. The respondents were also categorized into low scorers as defined as those
scoring <25, medium scorers as those scoring ≥25 but <30, and high scorers, as those
scoring ≥30, for comparison with other countries. The 21 “social” aspects items were
not included because of the limitation in cross-cultural application. This questionnaire
has been standardised on a U.K. population,17,20 but not in the Asian population.
The Public Attitudes Toward Epilepsy (PATE) scale is a 14-item scale measuring the
public attitudes toward epilepsy.19 A 5-point Likert scale was used for scoring with 1
being strongly disagree and 5 being strongly agree. Positively stated items were
reversely scored so that a higher score would indicate a more negative attitude. This
scale was performed in a general population and factored into two domains, i.e. a
general domain (nine items) that required minimal or no consideration of respondents’
involvement, and a personal domain (five items) that required a long-term personal
commitment or involvement such as marrying a person with epilepsy, working with
them or employing them. This is a validated scale with good internal consistency
(Cronbach’s alpha of 0.868 and 0.633, in the general and personal domains
respectively).
212
3. Statistical analysis
Statistical Package for Social Sciences version 19 (SPSS 19.0) was employed for data
analyses. Descriptive analyses were depicted using mean, standard deviation with 95%
confidence interval and simple percentages as appropriate. The score of EKQ in our
study was compared with those reported previously.18 Student T-test and one-way
analysis of variance (ANOVA) was conducted for mean scores comparison. Non-
parametric correlation analyses were performed between the scores in the EKQ and the
mean scores of the PATE and its domains to determine how the variables correlated
with others. Spearman’s rho > 0.5 was considered to have a strong correlation, 0.3-0.5
as moderate, and <0.3 as weak.
Results
A total of 297 participants with a mean aged of 36.55±14.65 years (ranged from 15-77
years) were recruited, 50.8% female with majority (63.0%) Chinese, 49.5% with tertiary
education level and 56.9% with full time employed and 45.1% married and 6.7% of the
participants had family member who is diagnosed with epilepsy. (Table 1)
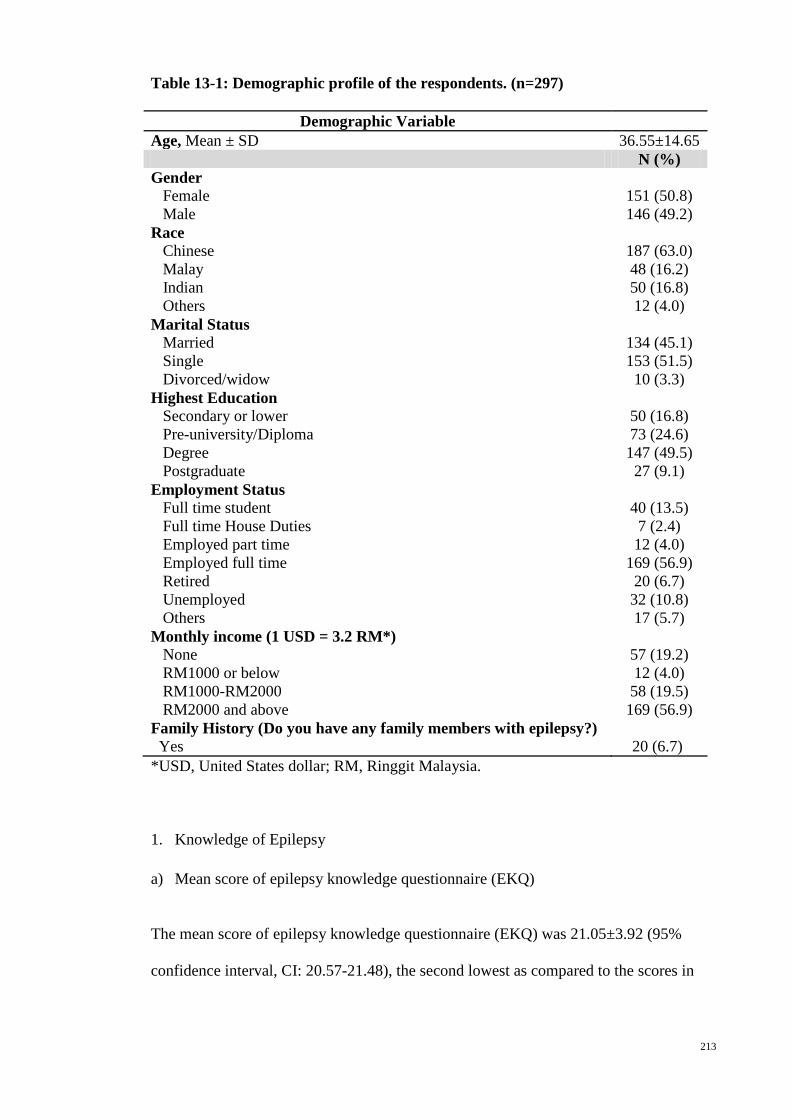
213
Table 13-1: Demographic profile of the respondents. (n=297)
Demographic Variable Age, Mean ± SD 36.55±14.65 N (%) Gender Female Male
151 (50.8) 146 (49.2)
Race Chinese Malay Indian Others
187 (63.0) 48 (16.2) 50 (16.8) 12 (4.0)
Marital Status Married Single Divorced/widow
134 (45.1) 153 (51.5)
10 (3.3) Highest Education Secondary or lower Pre-university/Diploma Degree Postgraduate
50 (16.8) 73 (24.6) 147 (49.5)
27 (9.1) Employment Status Full time student Full time House Duties Employed part time Employed full time Retired Unemployed Others
40 (13.5) 7 (2.4) 12 (4.0)
169 (56.9) 20 (6.7) 32 (10.8) 17 (5.7)
Monthly income (1 USD = 3.2 RM*) None RM1000 or below RM1000-RM2000 RM2000 and above
57 (19.2) 12 (4.0) 58 (19.5) 169 (56.9)
Family History (Do you have any family members with epilepsy?) Yes
20 (6.7)
*USD, United States dollar; RM, Ringgit Malaysia.
1. Knowledge of Epilepsy
a) Mean score of epilepsy knowledge questionnaire (EKQ)
The mean score of epilepsy knowledge questionnaire (EKQ) was 21.05±3.92 (95%
confidence interval, CI: 20.57-21.48), the second lowest as compared to the scores in

214
other countries. Most (78.8%) of the respondents scored <25 and only 1.3% respondents
scored ≥30.
Table 13-2: Mean score of EKQ (34 items) by country
Country Mean score (95% CI)
High Scorer (scoring ≥30),
%
Medium Scorer (≥25 and <30), %
Low Scorer (<25), %
Malaysia 21.05 (20.57-21.48) 1.3 19.9 78.8 Published Results18
Turkey 20.81 (20.53–21.09) 0.9 11.6 87.5 Portugal 21.44 (21.15–21.74) 0.9 19.7 79.4 Poland 22.67 (22.41–22.94) 0.9 28.8 70.3 Belgium 24.12 (23.69–24.55) 1.7 41.7 56.6 Spain 23.60 (22.97–24.24) 2.9 39.1 58.0 France 25.75 (25.40–26.10) 7.7 56.6 35.7 Italy 25.69 (25.31–26.08) 7.4 57.0 35.6 Netherlands
26.65 (26.38–26.92) 11.3 60.1 28.6
Germany 27.49 (27.17–27.81) 17.5 64.1 18.4 U.K. 27.88 (27.66–28.10) 21.1 61.9 17.0
b) EKQ and the demographic variables
One way ANOVA showed that there were significant association between the EKQ
score and the ethnic group and education level (p<0.01) and monthly income (p<0.05).
Chinese and Indian had same EKQ mean score (21.22), significantly higher than Malay
subgroup (19.77), indicated a better knowledge in epilepsy among the Chinese and
Indian. The mean EKQ score increased gradually with the level of education. There was
no significant association between the other demographic variables and the EKQ score.
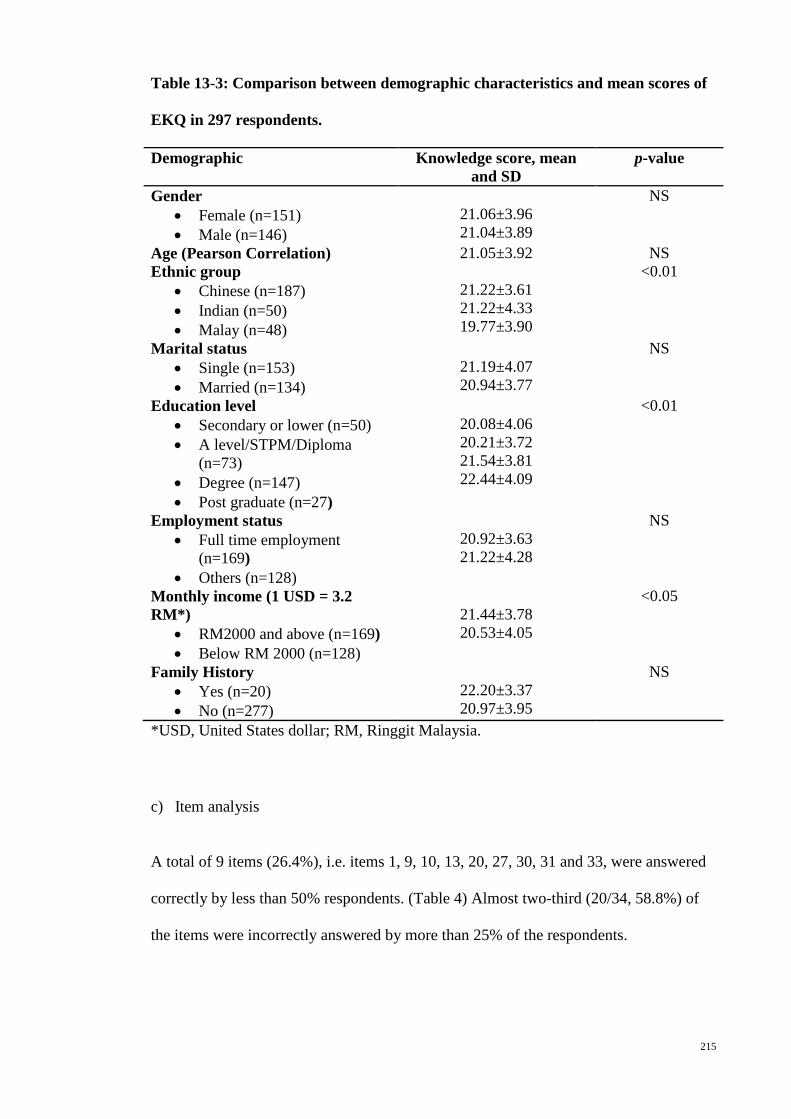
215
Table 13-3: Comparison between demographic characteristics and mean scores of
EKQ in 297 respondents.
Demographic Knowledge score, mean and SD
p-value
Gender • Female (n=151) • Male (n=146)
21.06±3.96 21.04±3.89
NS
Age (Pearson Correlation) 21.05±3.92 NS Ethnic group
• Chinese (n=187) • Indian (n=50) • Malay (n=48)
21.22±3.61 21.22±4.33 19.77±3.90
<0.01
Marital status • Single (n=153) • Married (n=134)
21.19±4.07 20.94±3.77
NS
Education level • Secondary or lower (n=50) • A level/STPM/Diploma
(n=73) • Degree (n=147) • Post graduate (n=27)
20.08±4.06 20.21±3.72 21.54±3.81 22.44±4.09
<0.01
Employment status • Full time employment
(n=169) • Others (n=128)
20.92±3.63 21.22±4.28
NS
Monthly income (1 USD = 3.2 RM*)
• RM2000 and above (n=169) • Below RM 2000 (n=128)
21.44±3.78 20.53±4.05
<0.05
Family History • Yes (n=20) • No (n=277)
22.20±3.37 20.97±3.95
NS
*USD, United States dollar; RM, Ringgit Malaysia.
c) Item analysis
A total of 9 items (26.4%), i.e. items 1, 9, 10, 13, 20, 27, 30, 31 and 33, were answered
correctly by less than 50% respondents. (Table 4) Almost two-third (20/34, 58.8%) of
the items were incorrectly answered by more than 25% of the respondents.
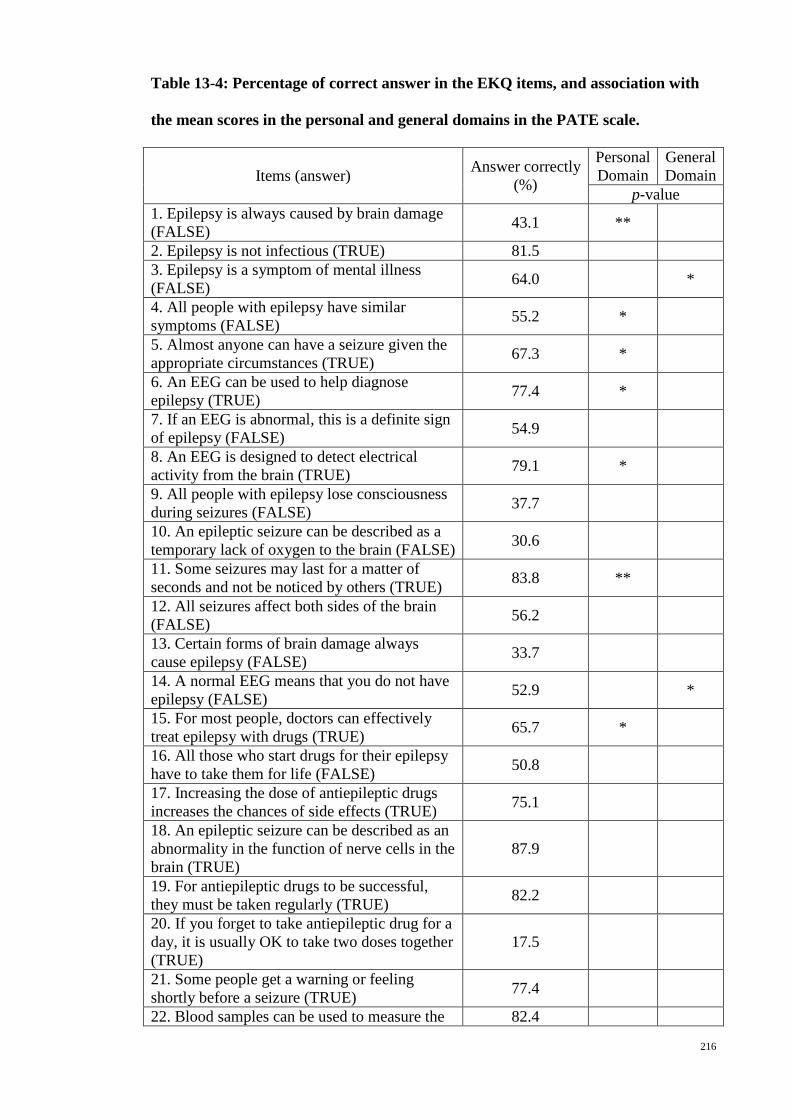
216
Table 13-4: Percentage of correct answer in the EKQ items, and association with
the mean scores in the personal and general domains in the PATE scale.
Items (answer) Answer correctly (%)
Personal Domain
General Domain
p-value 1. Epilepsy is always caused by brain damage (FALSE) 43.1 **
2. Epilepsy is not infectious (TRUE) 81.5 3. Epilepsy is a symptom of mental illness (FALSE) 64.0 *
4. All people with epilepsy have similar symptoms (FALSE) 55.2 *
5. Almost anyone can have a seizure given the appropriate circumstances (TRUE) 67.3 *
6. An EEG can be used to help diagnose epilepsy (TRUE) 77.4 *
7. If an EEG is abnormal, this is a definite sign of epilepsy (FALSE) 54.9
8. An EEG is designed to detect electrical activity from the brain (TRUE) 79.1 *
9. All people with epilepsy lose consciousness during seizures (FALSE) 37.7
10. An epileptic seizure can be described as a temporary lack of oxygen to the brain (FALSE) 30.6
11. Some seizures may last for a matter of seconds and not be noticed by others (TRUE) 83.8 **
12. All seizures affect both sides of the brain (FALSE) 56.2
13. Certain forms of brain damage always cause epilepsy (FALSE) 33.7
14. A normal EEG means that you do not have epilepsy (FALSE) 52.9 *
15. For most people, doctors can effectively treat epilepsy with drugs (TRUE) 65.7 *
16. All those who start drugs for their epilepsy have to take them for life (FALSE) 50.8
17. Increasing the dose of antiepileptic drugs increases the chances of side effects (TRUE) 75.1
18. An epileptic seizure can be described as an abnormality in the function of nerve cells in the brain (TRUE)
87.9
19. For antiepileptic drugs to be successful, they must be taken regularly (TRUE) 82.2
20. If you forget to take antiepileptic drug for a day, it is usually OK to take two doses together (TRUE)
17.5
21. Some people get a warning or feeling shortly before a seizure (TRUE) 77.4
22. Blood samples can be used to measure the 82.4
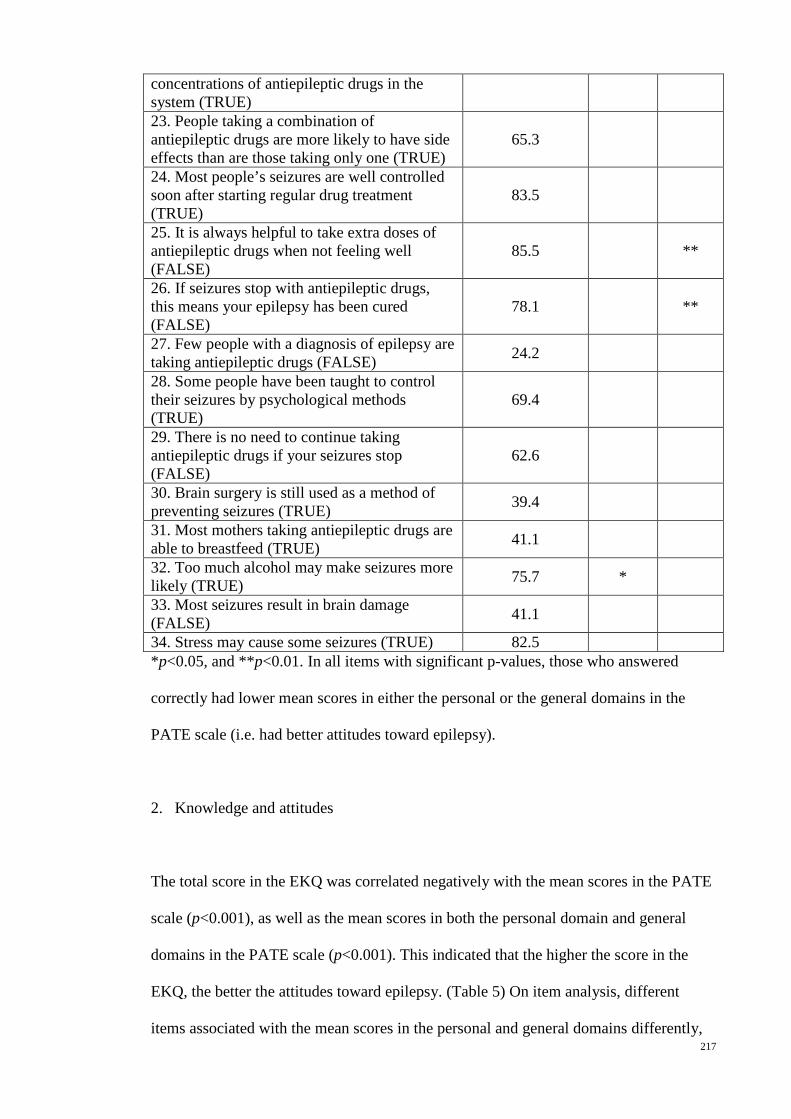
217
concentrations of antiepileptic drugs in the system (TRUE) 23. People taking a combination of antiepileptic drugs are more likely to have side effects than are those taking only one (TRUE)
65.3
24. Most people’s seizures are well controlled soon after starting regular drug treatment (TRUE)
83.5
25. It is always helpful to take extra doses of antiepileptic drugs when not feeling well (FALSE)
85.5 **
26. If seizures stop with antiepileptic drugs, this means your epilepsy has been cured (FALSE)
78.1 **
27. Few people with a diagnosis of epilepsy are taking antiepileptic drugs (FALSE) 24.2
28. Some people have been taught to control their seizures by psychological methods (TRUE)
69.4
29. There is no need to continue taking antiepileptic drugs if your seizures stop (FALSE)
62.6
30. Brain surgery is still used as a method of preventing seizures (TRUE) 39.4
31. Most mothers taking antiepileptic drugs are able to breastfeed (TRUE) 41.1
32. Too much alcohol may make seizures more likely (TRUE) 75.7 *
33. Most seizures result in brain damage (FALSE) 41.1
34. Stress may cause some seizures (TRUE) 82.5 *p<0.05, and **p<0.01. In all items with significant p-values, those who answered
correctly had lower mean scores in either the personal or the general domains in the
PATE scale (i.e. had better attitudes toward epilepsy).
2. Knowledge and attitudes
The total score in the EKQ was correlated negatively with the mean scores in the PATE
scale (p<0.001), as well as the mean scores in both the personal domain and general
domains in the PATE scale (p<0.001). This indicated that the higher the score in the
EKQ, the better the attitudes toward epilepsy. (Table 5) On item analysis, different
items associated with the mean scores in the personal and general domains differently,

218
as shown in Table 4. There were only eight items (1, 4, 5, 6, 8, 11, 15 and 32)
associated significantly with the mean scores in the personal domain, and 4 items (3, 14,
25 and 26) were with the general domain.
Table 13-5: Correlations between the total score in the EKQ and the mean score in
the PATE scale (n=297).
EKQ (34 items) PATE (14 items) -0.299* Personal Domain (5 items) -0.248* General Domain (9 items) -0.265* * p-value is <0.001
Discussion
This study correlating the knowledge and attitudes toward epilepsy using a quantitative
scale, i.e. the Epilepsy Knowledge Questionnaire (EKQ) and the Public Attitudes
Toward Epilepsy (PATE) scale, showed that the overall knowledge toward epilepsy is
significantly associated with a better attitudes toward epilepsy. This is consistent with
the previous studies.1-9 However, not all items in the knowledge questionnaire were
correlated with the attitudes.
On item analysis, only 8 out of 34 items (23.5%) associated significantly with the mean
scores in personal domain and 4 (11.8%) with those in general domain. These include
items on causes of epilepsy such as brain damage (item 1) and mental illness (item 3),
consistent with the studies testing the perception of epilepsy as a form of insanity.1,3,4 In
contrary to the previous study11, item 2, which assessed whether epilepsy is contagious,
was not associated with attitudes toward epilepsy. This is likely because in our cohort,
majority knew that epilepsy is not infectious.
219
Knowing that epilepsy can be treated effectively for most people (item 15) was
associated with better attitudes toward epilepsy, compatible with previous results
correlating epilepsy being untreatable with poorer attitudes.2,10 In addition, the
association between knowing seizures can present differently (item 4), and can be brief
(item 11) with better attitudes toward epilepsy was not previously described.
Nonetheless, knowledge on most other medical aspects of epilepsy (22 out of 34 items
in EKQ), such as diagnosis methods especially EEG, the medical and surgical treatment,
and underlying pathophysiology and precipitating factors, was not proven to affect the
attitudes in this study significantly.
There were more items correlated with the attitudes in the personal domain than in the
general domain, and items correlated with attitudes in one domain were not correlated
with the other. This implied that different aspects of knowledge in epilepsy affected the
attitudes toward epilepsy differently. It is postulated that knowledge plays a more
important role when a personal involvement such as marrying a person with epilepsy or
employing someone with the condition. However, this postulation is not proven in this
study using EKQ.
The recruitment was performed in a health fair in the capital city in Malaysia and only
involved the English speaking publics. We assume that this group of people has
relatively higher healthcare awareness and higher education level, of which more than
50% of them have graduate or postgraduate qualifications. Despite being in a higher
educated group, the mean score of EKQ was lower than most of the reported results in

220
the European countries, indicating that there is a significant knowledge gap in epilepsy
in Malaysia.
The level of knowledge, as measured by EKQ, improved gradually with the level of
education, compatible with the previous reports in the Europe18, as well as the Thai
population21. Malaysian education system has tried to improve the standard of
healthcare awareness by integrating this subject in their standard curriculum. However,
this effort only covers basic hygiene, improving lifestyle and adopting healthy diet.
There was no emphasis given on more detailed subjects such as epilepsy. This result
indicated that the level of formal education has an impact on the knowledge on health.
This is likely related to better recognition and improved learning behavior in the
educated group. This is supported by a study conducted in Kuwait which showed that
respondents with high educational levels often stated willingness for more information
about epilepsy.22 The level of knowledge also differed with ethnicity. In this study, the
Chinese and Indian ethnic group had better knowledge in epilepsy, as compared with
the Malay, suggesting that there might be a variation in the degree or scope of health
awareness in different ethnic groups. This will thus guide the emphasis of health
awareness campaign especially on special ethnic subgroup.
The questions in the EKQ were relatively difficult for the Malaysian participants.
Majority of the respondents were low scorer with scoring <25. Almost two-third (20/34,
58.8%) of the items were incorrectly answered by more than 25% of the respondents.
However, there are some variation in answering the questions between the Malaysian
population and the European. A good example of this would be from item 28 “Some
people have been taught to control their seizures by psychological methods”. There
were more respondents who answered correctly, as compared with those in Europe (69%

221
vs. 44%), suggesting that it may be a common practice in Malaysia or even in Asia to
use alternative method in stopping or controlling the seizures. For item 27, the answer
can be true in countries with wider treatment gap, and for item 20, the answer can be
false if the patient is taking an older generation of antiepileptic drug with narrow
therapeutic index, such as phenytoin.
No specific area of knowledge can be identified in this study that the respondents were
in particularly poor or better in. However, there were 9 items with more than 50%
incorrectly answered by our respondents, especially only 37.7% of respondents were
aware that seizures can occur despite retained awareness, and only 39.4% know that
brain surgery is another treatment option.
1. Limitation
This study was performed using a convenient sampling in a health fair and only in
English, and thus not representative of the general population in Malaysia. Nonetheless,
this group of participants represented a group with higher health consciousness and a
better education level. Adaptation of the EKQ to cultural factors or regional practice
was not performed to allow direct comparison of the results of this and the previous
studies. Though the validity of the EKQ to be applied in the Malaysian or Asian
population was not previously tested, the significant correlation between the knowledge
and the attitude will support the construct validity of this questionnaire.
2. Implications

222
Intervention studies showed that there was significant improvement in the attitudes
towards epilepsy together with the improvement in knowledge.2,12-16 However, different
aspect of knowledge affected the attitudes differently. This study supports the need to
have a more comprehensive review in understanding how various aspects of knowledge
affect the attitudes toward epilepsy, thus develop an attitude-specific epilepsy
knowledge scale. This will then determine which aspect of knowledge to be emphasized
in the awareness campaign or reading material, and allow the measurement of
improvement in knowledge that will affect attitudes toward epilepsy.
Conclusion
This study showed that the knowledge toward epilepsy is significantly associated with
better attitudes toward epilepsy. On item analysis, only certain aspects of knowledge in
epilepsy affected the attitudes toward epilepsy significantly.
References
1. Saengpattrachai M, Srinualta D, Lorlertratna N, Pradermduzzadeeporn E,
Poonpol F. Public familiarity with, knowledge of, and predictors of negative attitudes
toward epilepsy in Thailand. Epilepsy & Behavior 2010;17:497-505.
2. Kim MK, Kim IK, Kim BC, Cho KH, Kim SJ, Moon JD. Positive trends of
public attitudes toward epilepsy after public education campaign among rural korean
residents. J Korean Med Sci 2003;18:248-54.
3. Spatt J, Bauer G, Baumgartner C, et al. Predictors for negative attitudes toward
subjects with epilepsy: a representative survey in the general public in Austria.
Epilepsia 2005;46:736-42.

223
4. Hasan SS, Alen YKS, Wayne WGW, Ahmadi K, Anwar M, Goh GK.
Understanding of and attitudes toward epilepsy among the urban Chinese population in
Malaysia. Singapore Medical Journal 2010;51:290-9.
5. Mecarelli O, Capovilla G, Romeo A, Rubboli G, Tinuper P, Beghi E. Past and
present public knowledge and attitudes toward epilepsy in Italy. Epilepsy & Behavior
2010;18:110-5.
6. Neni SW, Latif AZA, Wong SY, Lua PL. Awareness, knowledge and attitudes
towards epilepsy among rural populations in East Coast Peninsular Malaysia: a
preliminary exploration. Seizure 2010;19:280-90.
7. McEwan L, Taylor J, Casswell M, et al. Knowledge of and attitudes expressed
toward epilepsy by carers of people with epilepsy: a UK perspective. Epilepsy &
Behavior 2007;11:13-9.
8. Santos IC, Guerreiro MM, Mata A, et al. Public awareness and attitudes toward
epilepsy in different social segments in Brazil. Arquivos De Neuro-Psiquiatria
1998;56:32-8.
9. Saengsuwan J, Laohasiriwong W, Boonyaleepan S, Sawanyawisuth K, Tiamkao
S, Integrated Epilepsy Research G. Knowledge, attitudes, and care techniques of
caregivers of PWE in northeastern Thailand. Epilepsy & Behavior 2013;27:257-63.
10. Choi-Kwon S, Park KA, Lee HJ, et al. Familiarity with, knowledge of, and
attitudes toward epilepsy in residents of Seoul, South Korea. Acta Neurol Scand
2004;110:39-45.
11. Shafiq M, Tanwir M, Tariq A, et al. Epilepsy: public knowledge and attitude in
a slum area of Karachi, Pakistan. Seizure 2007;16:330-7.
12. Bozkaya IO, Arhan E, Serdaroglu A, Soysal AS, Ozkan S, Gucuyener K.
Knowledge of, perception of, and attitudes toward epilepsy of schoolchildren in Ankara
and the effect of an educational program. Epilepsy & Behavior 2010;17:56-63.
224
13. Wang W, Zhao D, Wu J, et al. Changes in knowledge, attitude, and practice of
people with epilepsy and their families after an intervention in rural China. Epilepsy &
Behavior 2009;16:76-9.
14. Tedrus GMAS, Fonseca LC, Vieira ALdC. Knowledge and attitudes toward
epilepsy amongst students in the health area: intervention aimed at enlightenment. Arq
Neuropsiquiatr 2007;65:1181-5.
15. Matovu HL. Changing community attitudes towards epilepsy in Uganda. Soc
Sci Med 1974;8:47-50.
16. Bielen I, Zobic I, Sruk A, Ivakovic A, Dogan D. Changes of attitudes toward
epilepsy in college-preparatory high school students population: an indicator of global
campaign successfulness? Seizure 2012;21:775-9.
17. Jarvie S, Espie CA, Brodie MJ. The development of a questionnaire to assess
knowledge of epilepsy: 1--General knowledge of epilepsy. Seizure 1993;2:179-85.
18. Doughty J, Baker GA, Jacoby A, Lavaud V. Cross-cultural differences in levels
of knowledge about epilepsy. Epilepsia 2003;44:115-23.
19. Lim KS, Wu C, Choo WY, Tan CT. Development and validation of a Public
Attitudes Towards Epilepsy (PATE) scale. Epilepsy & Behavior 2012;24:207-12.
20. Jarvie S, Espie CA, Brodie MJ. The development of a questionnaire to assess
knowledge of epilepsy: 2--Knowledge of own condition. Seizure 1993;2:187-93.
21. Saengsuwan J, Boonyaleepan S, Srijakkot J, Sawanyawisuth K, Tiamkao S,
Integrated Epilepsy Research G. Factors associated with knowledge and attitudes in
persons with epilepsy. Epilepsy & Behavior 2012;24:23-9.
22. Awad A, Sarkhoo F. Public knowledge and attitudes toward epilepsy in Kuwait.
Epilepsia 2008;49:564-72.

225
Chapter 14: Conclusion: conceptual changes and future implications
It is essential to study the public attitudes toward epilepsy as supported by a significant
unemployment rate and lower income among the people with epilepsy. Systematic
review revealed a need to develop a cross-culturally applicable quantitative scale in
measuring the public attitudes toward epilepsy. The PATE was developed, validated
and translated, and applied in various specific and general populations.
Key findings
The study on students showed that the scale is easily applied among a homogenous
group and can be used in a web-based design. Attitudes of students were only better
than the general population in the general domain but not in the personal domain,
indicating that a significant discrepancy between the personal and general attitudes
toward epilepsy. The study on teachers which showed a significant better attitudes
among teachers as compared to the general population with tertiary education,
suggesting that attitudes toward epilepsy may be job specific.
Population studies showed that there was no significant differences in attitudes toward
epilepsy between the Chinese and Malay populations. Despite having cultural
similarities, the Indonesian demonstrated a significantly poorer attitudes toward
epilepsy as compared to the Malaysian. On subcategory analysis, Chinese had better
attitudes toward social contact with people with epilepsy, indicating that Chinese
patients with epilepsy might have less social restriction as compared with the Malay. In
addition, the studies also demonstrated a unique urban-rural as well as cultural and
ethnic differences in attitudes toward epilepsy.
226
Conceptual changes
The development and application of the 14-item PATE scale in various specific and
general populations has led to changes in the concept of attitudes toward epilepsy.
1. Attitudes shall be understood from both personal and general perspectives
Attitudes toward epilepsy had been previously understood and studied as a general
concept. The attitude was classified as positive or negative as a whole. The division of
PATE scale into personal and general domains has led to the understanding of the
attitudes toward epilepsy in two different perspectives, based on the degree of personal
commitment. A person will show a more positive attitude toward a general statement
when a personal commitment is less required. However, what affects the people with
epilepsy directly especially on their marriage and employment might be the personal
attitudes, as measured by the personal domain in the PATE scale. In a community with
a relatively more positive attitude toward epilepsy, there may be still people with
epilepsy who are unemployed as a result of some employers with negative personal
attitude; and vice versa. The scoring system in the PATE scale allows us to determine
the overall attitudes toward epilepsy, but at the same time, the mean score of the
domains allows us to understand the attitudes from two different perspectives.
2. Attitudes vary in different social aspects of life
A person with a very negative attitude toward marriage and employment in people with
epilepsy can have an open attitude being friend with people with epilepsy or accepting

227
them to be in the same class in school. The attitudes toward epilepsy are also vary from
community to community. A community with positive attitudes toward social
participation of people with epilepsy may have a negative attitudes on them studying in
a normal class or employing them. The division of attitudes toward epilepsy according
to social category allows us to understand the challenges of people with epilepsy
according to the aspects of social life.
3. Better knowledge does not equivalent to better attitude
People with higher education level may have a more positive attitude in the general
domain, but not in the personal domain. People in the urban may have higher education
level but not have a better attitude toward marriage. The sub-study correlating
knowledge and attitude indicates that only certain aspect of epilepsy knowledge has
direct correlation with the attitudes toward epilepsy.
Future implications
The PATE scale allows us to measure the public attitudes toward epilepsy from
different aspects, i.e. (1) the overall attitude toward epilepsy by measuring the total
mean score, (2) the personal and general attitudes by measuring the mean scores in each
domains, (3) the attitudes toward different aspects of life by measuring the mean scores
of the social subcategories, and (4) the attitudes according to the degree of personal
commitment by measuring the score in the individual items. This enables the PATE
scale as an effective measure of specific attitudes toward epilepsy.

228
1. Factors affecting attitudes toward epilepsy
Cross-sectional comparison between different nations, ethnicities or geographical
regions, as well as longitudinal study, will enable us to understand how socio-cultural or
socio-economic factors affecting the attitudes toward epilepsy. In addition, it is also
important to determine how various aspects of epilepsy knowledge and perceptions
toward epilepsy affect the various types of attitudes. The design of the PATE scale
enables it to be applied cross-culturally and also enables us to determine which types of
attitudes that correlate with these factors. It is essential to identify factors that not only
change the general attitudes, but also the personal attitudes. If a certain psychosocial
aspect such as employment is studied, it is important to apply a specific and relevant
measure such as the employment subscale in the PATE scale.
2. Designing an effective and specific intervention program
It has been difficult to design an effective intervention program aiming to improve the
public attitudes and awareness because there is lack of an objective and specific
attitudes scale previously. Certain awareness campaign may result in an improvement in
the general attitudes but not the personal attitudes. For a population with more negative
attitudes toward a certain aspect of social life such as marriage, the emphasis of the
intervention should also be specific aiming to change the attitudes related to marriage.
In addition, for a specific group such as teachers, emphasis will therefore be on the
change of attitudes toward education. Application of the PATE scale is therefore
essential to measure the effectiveness of these intervention programs in changing the
specific attitude.
229
Conclusion
Shifting from the era of understanding attitude as only one aspect, this research has led
us to understand attitude toward epilepsy from multiple aspects. Therefore, it is
important not only to study the factors affecting attitude in general, but also factors
related to a specific type of attitude such as attitude toward employment. This will then
allow us to design a specific and effective intervention targeting on certain type of
attitude.