Embed Size (px)
Citation preview
Socialbakers Analytics User Guide
Statistics Social Media Resources CompanyBlogProduct & Solutions
02ANALYTICS GUIDE BY SOCIALBAKERS
Getting Started 03
Multiplatform Dashboard 04
Pages/Profiles/Channels Overview 05
Comparative Analytics & Benchmarking 06
Visualization of data 17
Analyzing Facebook 18
- Promoted Post Detection 25
- Community Analysis 31
- Facebook Insights 33
Analyzing Twitter 47
Analyzing YouTube 52
Analyzing VK 54
Analyzing Instagram 56
Content Newsfeed 60
Reporting 63
Settings section 65
Numbers & Time 66
General setting 67
User Rights Management 69
Teams 71
Social Visit 74
Table of Contents
Statistics Social Media Resources CompanyBlogProduct & Solutions
03ANALYTICS GUIDE BY SOCIALBAKERS
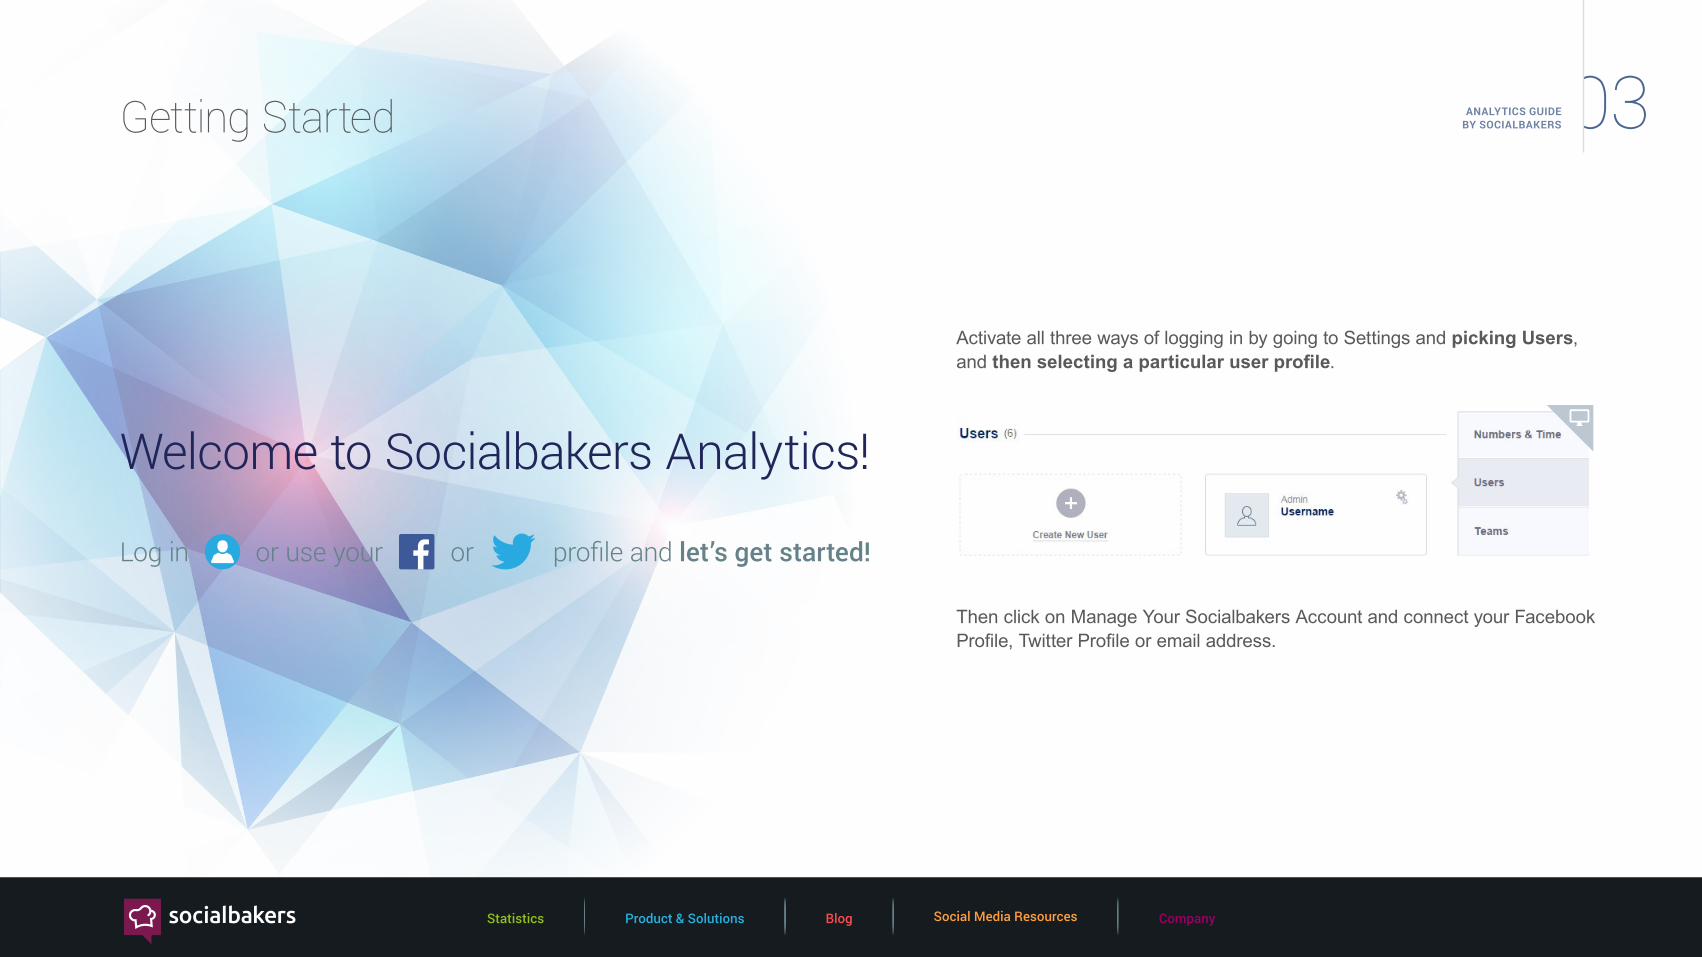
Welcome to Socialbakers Analytics!
Activate all three ways of logging in by going to Settings and picking Users, and then selecting a particular user profile.
Log in or use your profile and let’s get started!or
Then click on Manage Your Socialbakers Account and connect your Facebook Profile, Twitter Profile or email address.
Getting Started
Statistics Social Media Resources CompanyBlogProduct & Solutions
04ANALYTICS GUIDE BY SOCIALBAKERS
Multiplatform Dashboard
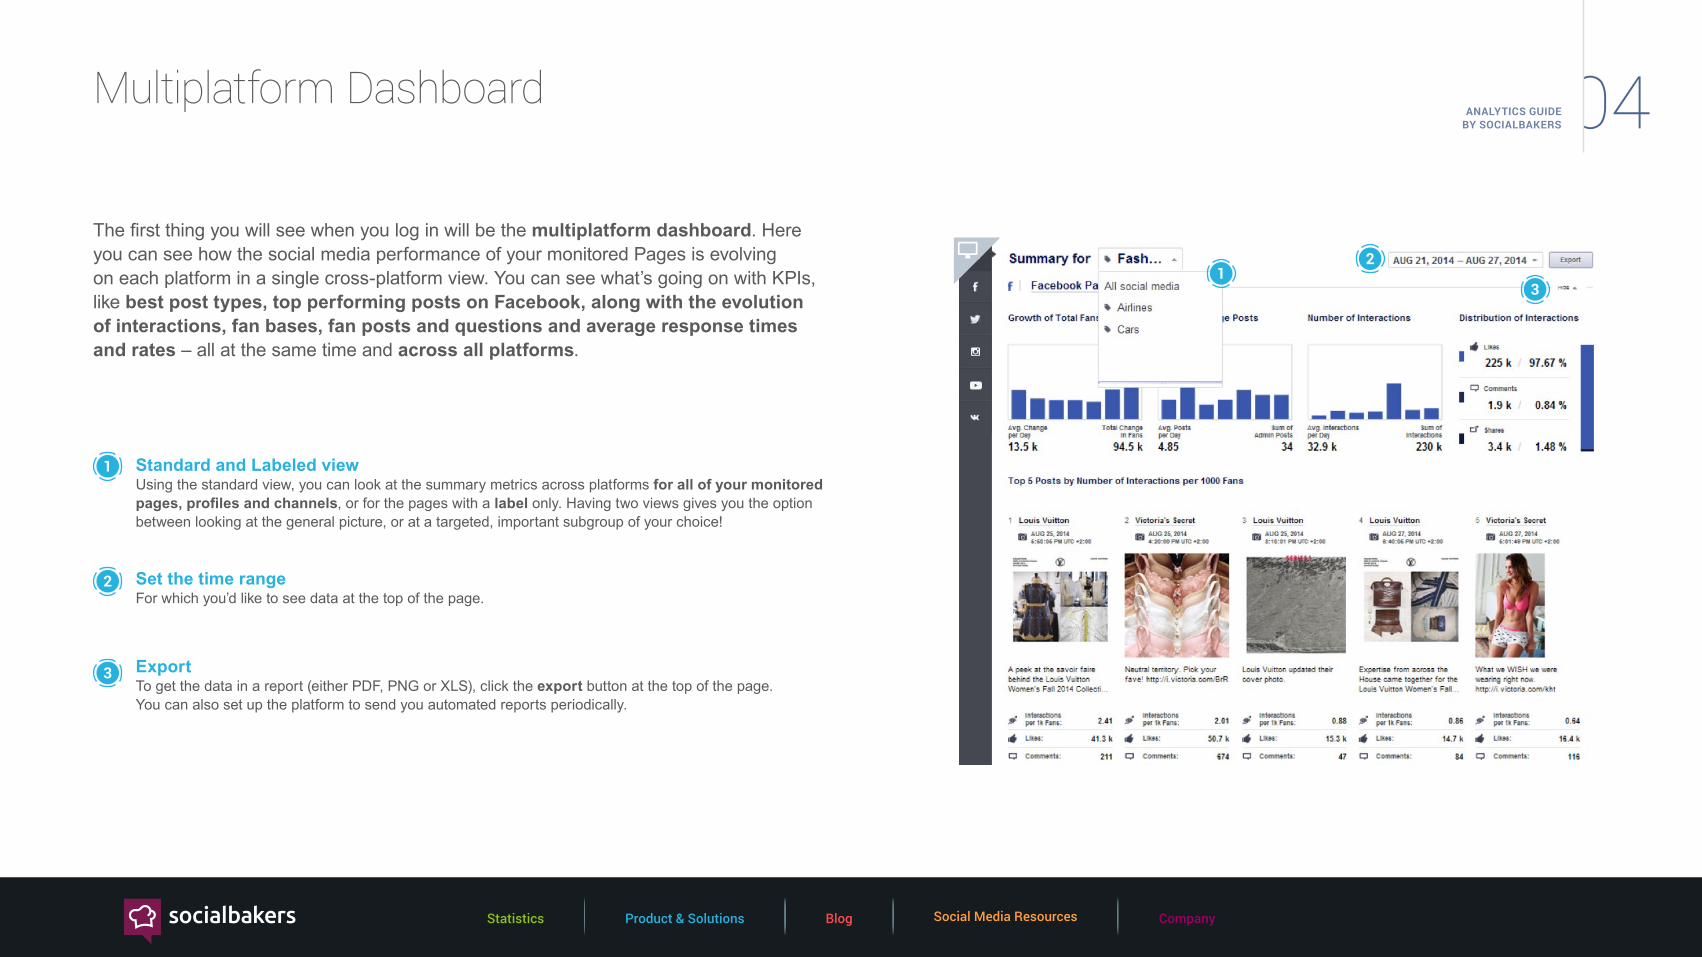
The first thing you will see when you log in will be the multiplatform dashboard. Here you can see how the social media performance of your monitored Pages is evolving on each platform in a single cross-platform view. You can see what’s going on with KPIs, like best post types, top performing posts on Facebook, along with the evolution of interactions, fan bases, fan posts and questions and average response times and rates – all at the same time and across all platforms.
Standard and Labeled viewUsing the standard view, you can look at the summary metrics across platforms for all of your monitored pages, profiles and channels, or for the pages with a label only. Having two views gives you the option between looking at the general picture, or at a targeted, important subgroup of your choice!
Set the time rangeFor which you’d like to see data at the top of the page.
ExportTo get the data in a report (either PDF, PNG or XLS), click the export button at the top of the page. You can also set up the platform to send you automated reports periodically.
1
2
3
2
31
Statistics Social Media Resources CompanyBlogProduct & Solutions
05ANALYTICS GUIDE BY SOCIALBAKERS
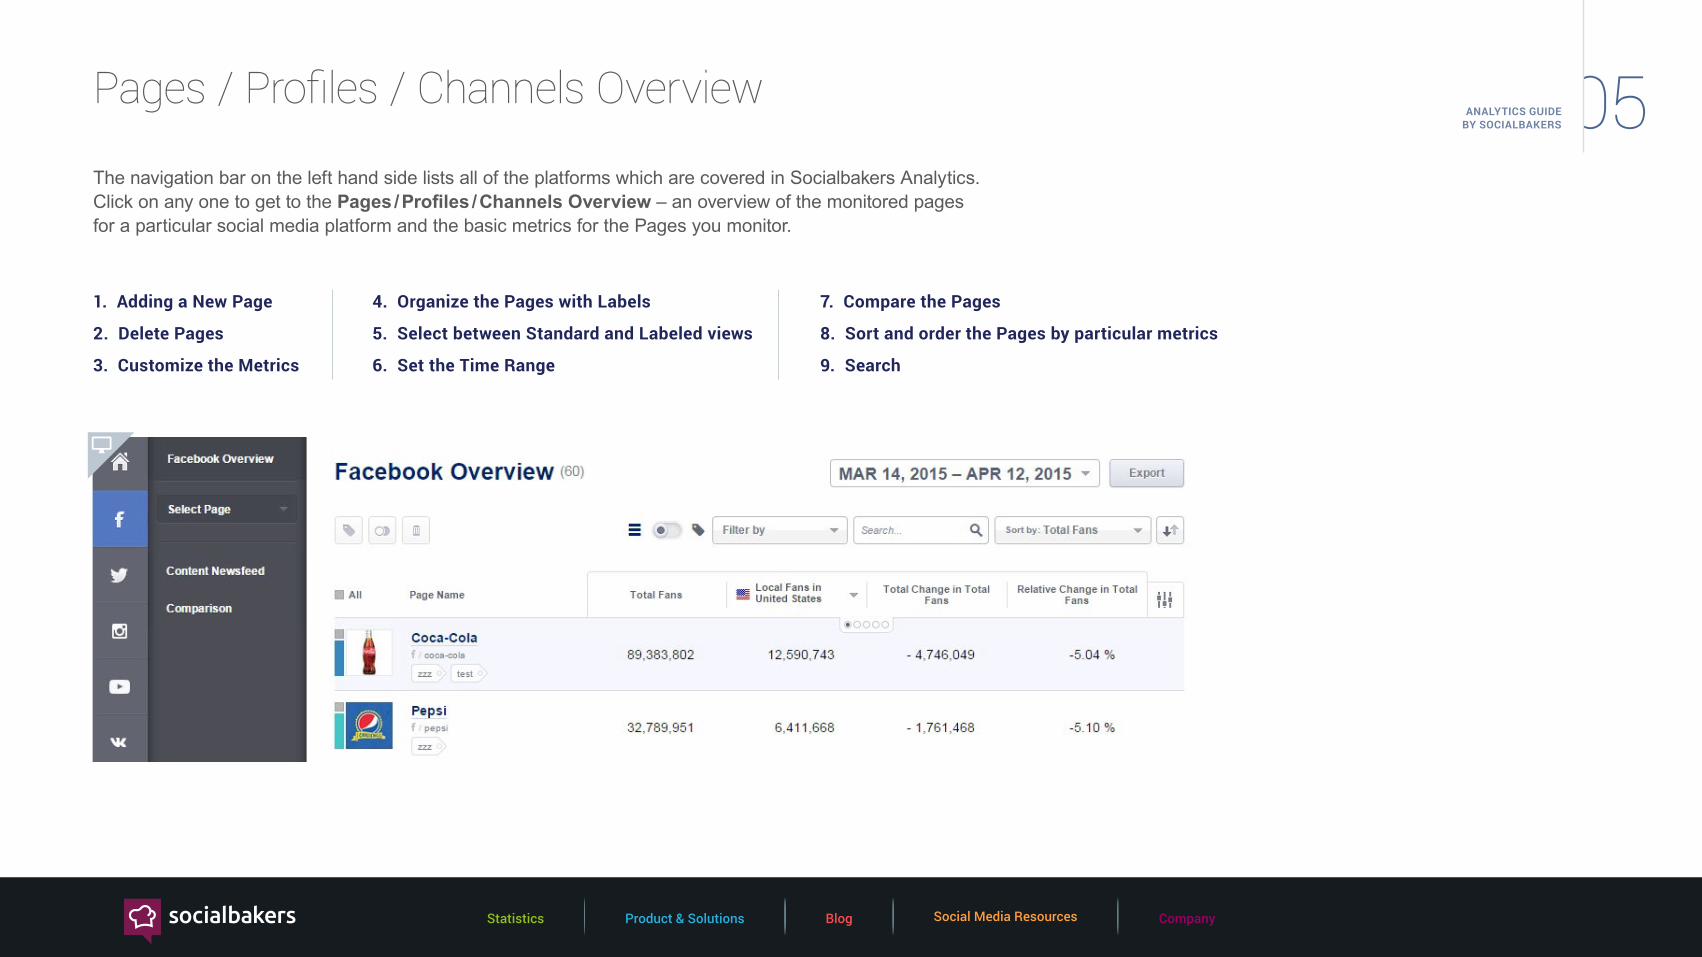
The navigation bar on the left hand side lists all of the platforms which are covered in Socialbakers Analytics. Click on any one to get to the Pages / Profiles / Channels Overview – an overview of the monitored pages for a particular social media platform and the basic metrics for the Pages you monitor.
Pages / Profiles / Channels Overview
1. Adding a New Page
2. Delete Pages
3. Customize the Metrics
4. Organize the Pages with Labels
5. Select between Standard and Labeled views
6. Set the Time Range
7. Compare the Pages
8. Sort and order the Pages by particular metrics
9. Search
Statistics Social Media Resources CompanyBlogProduct & Solutions
06ANALYTICS GUIDE BY SOCIALBAKERS
1. Adding a New Page
Pages / Profiles / Channels Overview
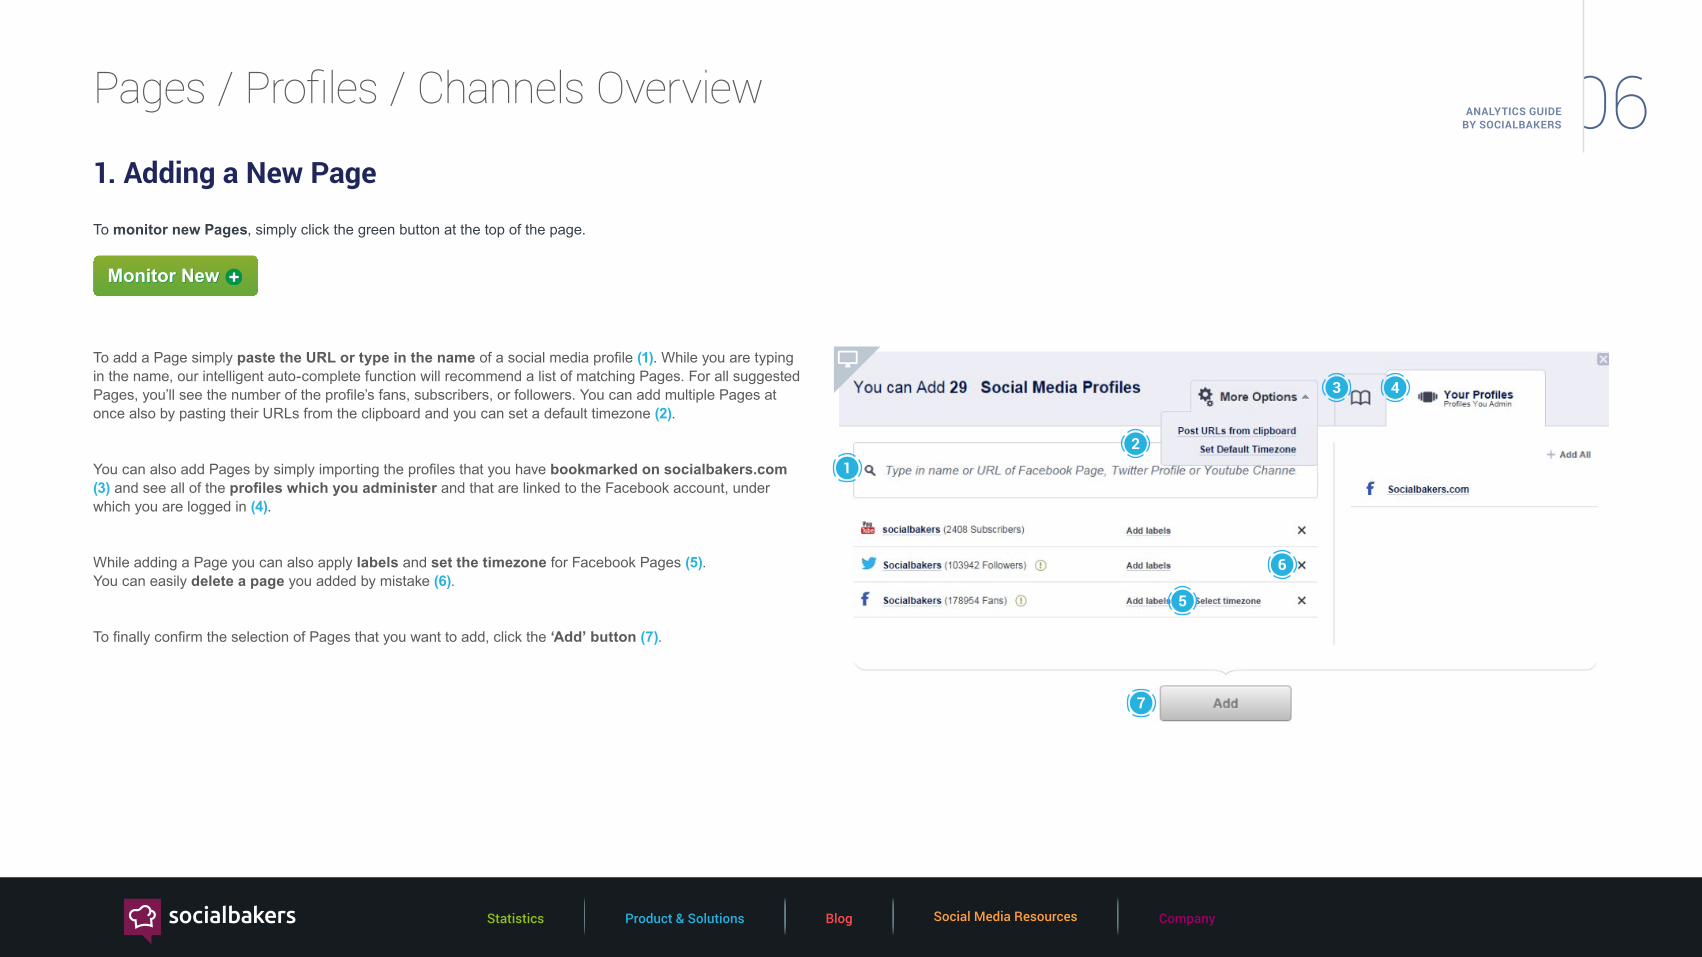
To monitor new Pages, simply click the green button at the top of the page.
To add a Page simply paste the URL or type in the name of a social media profile (1). While you are typing in the name, our intelligent auto-complete function will recommend a list of matching Pages. For all suggested Pages, you’ll see the number of the profile’s fans, subscribers, or followers. You can add multiple Pages at once also by pasting their URLs from the clipboard and you can set a default timezone (2).
You can also add Pages by simply importing the profiles that you have bookmarked on socialbakers.com (3) and see all of the profiles which you administer and that are linked to the Facebook account, under which you are logged in (4).
While adding a Page you can also apply labels and set the timezone for Facebook Pages (5). You can easily delete a page you added by mistake (6).
To finally confirm the selection of Pages that you want to add, click the ‘Add’ button (7).
12
3 4
5
7
6
Statistics Social Media Resources CompanyBlogProduct & Solutions
07ANALYTICS GUIDE BY SOCIALBAKERS
2. Delete Pages
3. Customize the Metrics
Delete your Pages by simply selecting one or more profiles and clicking on Delete button. Contact your Account owner or our Support at [email protected] and request more Delete credits.
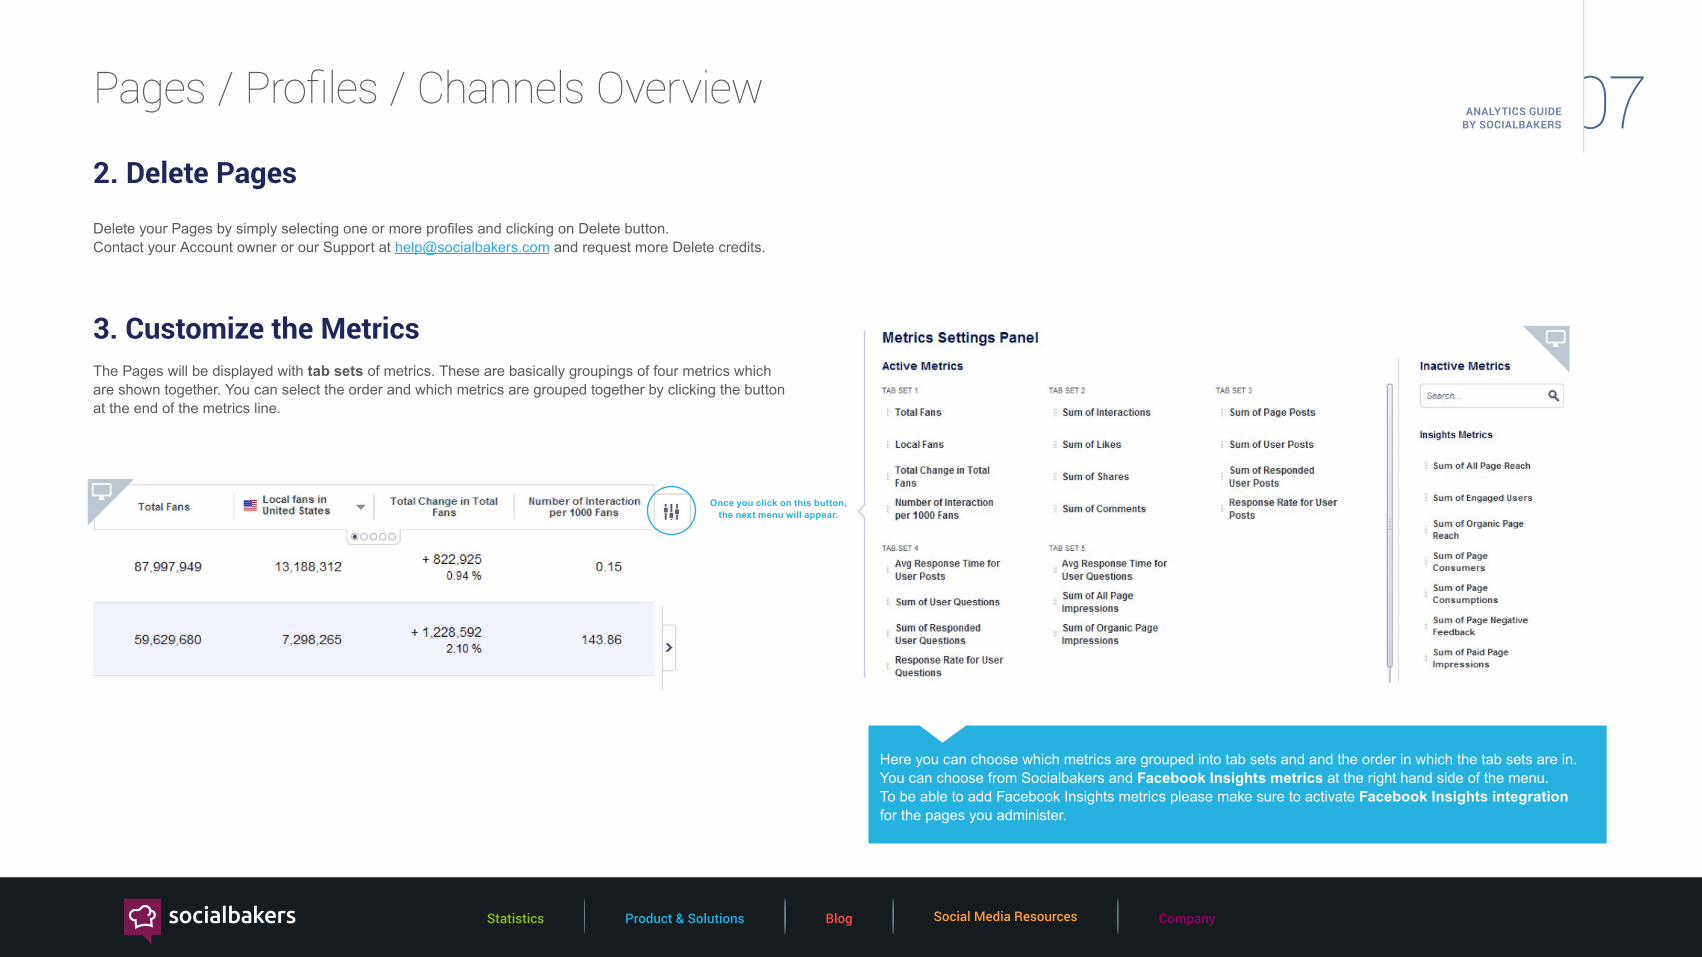
The Pages will be displayed with tab sets of metrics. These are basically groupings of four metrics which are shown together. You can select the order and which metrics are grouped together by clicking the button at the end of the metrics line.
Here you can choose which metrics are grouped into tab sets and and the order in which the tab sets are in. You can choose from Socialbakers and Facebook Insights metrics at the right hand side of the menu. To be able to add Facebook Insights metrics please make sure to activate Facebook Insights integration for the pages you administer.
Once you click on this button, the next menu will appear.
Pages / Profiles / Channels Overview
Statistics Social Media Resources CompanyBlogProduct & Solutions
08ANALYTICS GUIDE BY SOCIALBAKERS
4. Organize the Pages with Label
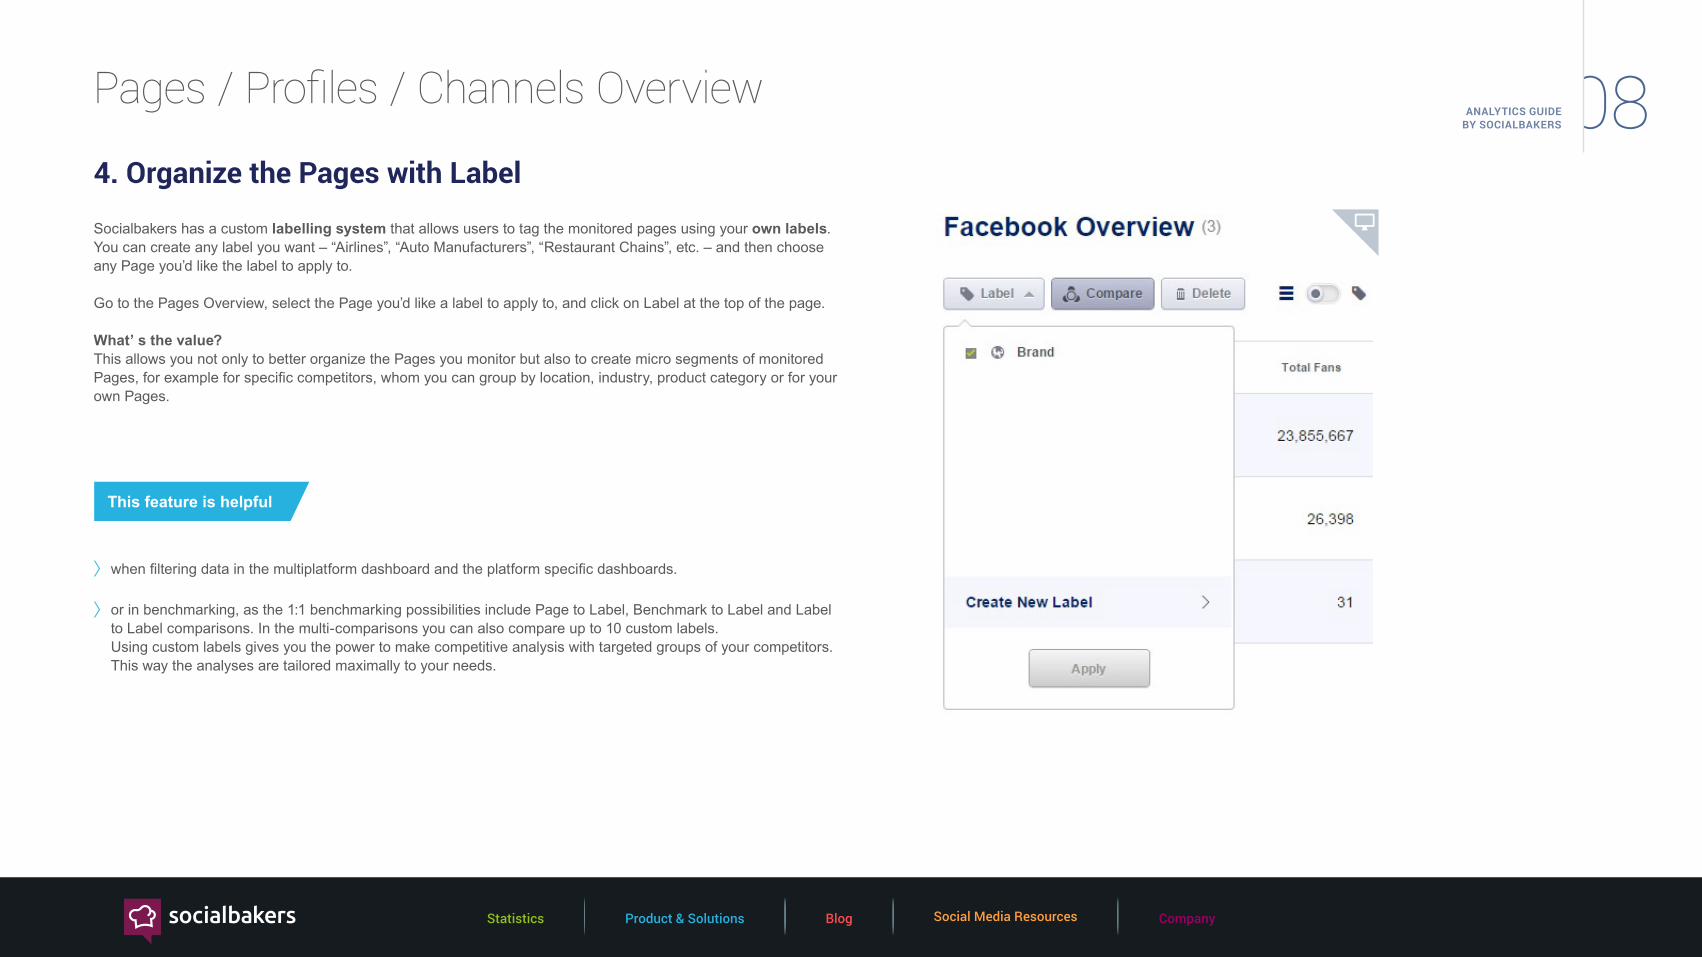
Socialbakers has a custom labelling system that allows users to tag the monitored pages using your own labels. You can create any label you want – “Airlines”, “Auto Manufacturers”, “Restaurant Chains”, etc. – and then choose any Page you’d like the label to apply to.
Go to the Pages Overview, select the Page you’d like a label to apply to, and click on Label at the top of the page.
What’ s the value?This allows you not only to better organize the Pages you monitor but also to create micro segments of monitored Pages, for example for specific competitors, whom you can group by location, industry, product category or for your own Pages.
This feature is helpful
when filtering data in the multiplatform dashboard and the platform specific dashboards.
or in benchmarking, as the 1:1 benchmarking possibilities include Page to Label, Benchmark to Label and Label to Label comparisons. In the multi-comparisons you can also compare up to 10 custom labels. Using custom labels gives you the power to make competitive analysis with targeted groups of your competitors. This way the analyses are tailored maximally to your needs.
Pages / Profiles / Channels Overview
Statistics Social Media Resources CompanyBlogProduct & Solutions
09ANALYTICS GUIDE BY SOCIALBAKERS
5. Select between Standard and Labeled view
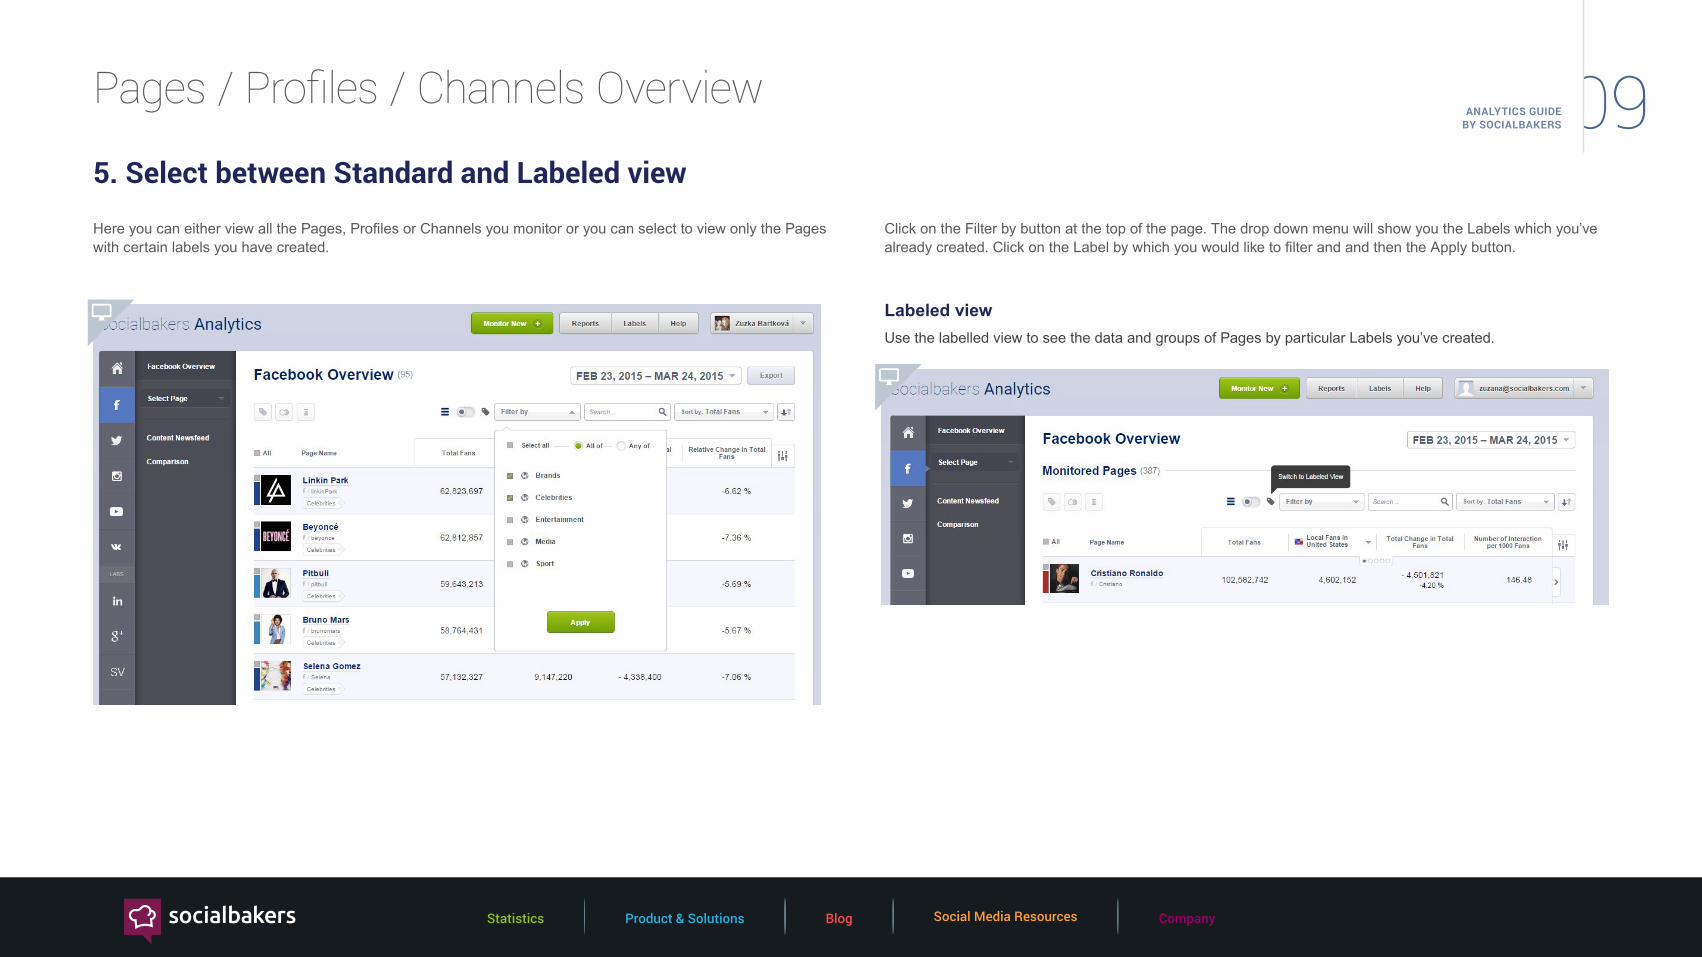
Here you can either view all the Pages, Profiles or Channels you monitor or you can select to view only the Pages with certain labels you have created.
Click on the Filter by button at the top of the page. The drop down menu will show you the Labels which you’ve already created. Click on the Label by which you would like to filter and and then the Apply button.
Labeled viewUse the labelled view to see the data and groups of Pages by particular Labels you’ve created.
Pages / Profiles / Channels Overview
10ANALYTICS GUIDE BY SOCIALBAKERS
Statistics Social Media Resources CompanyBlogProduct & Solutions
6. Setting the Time Range
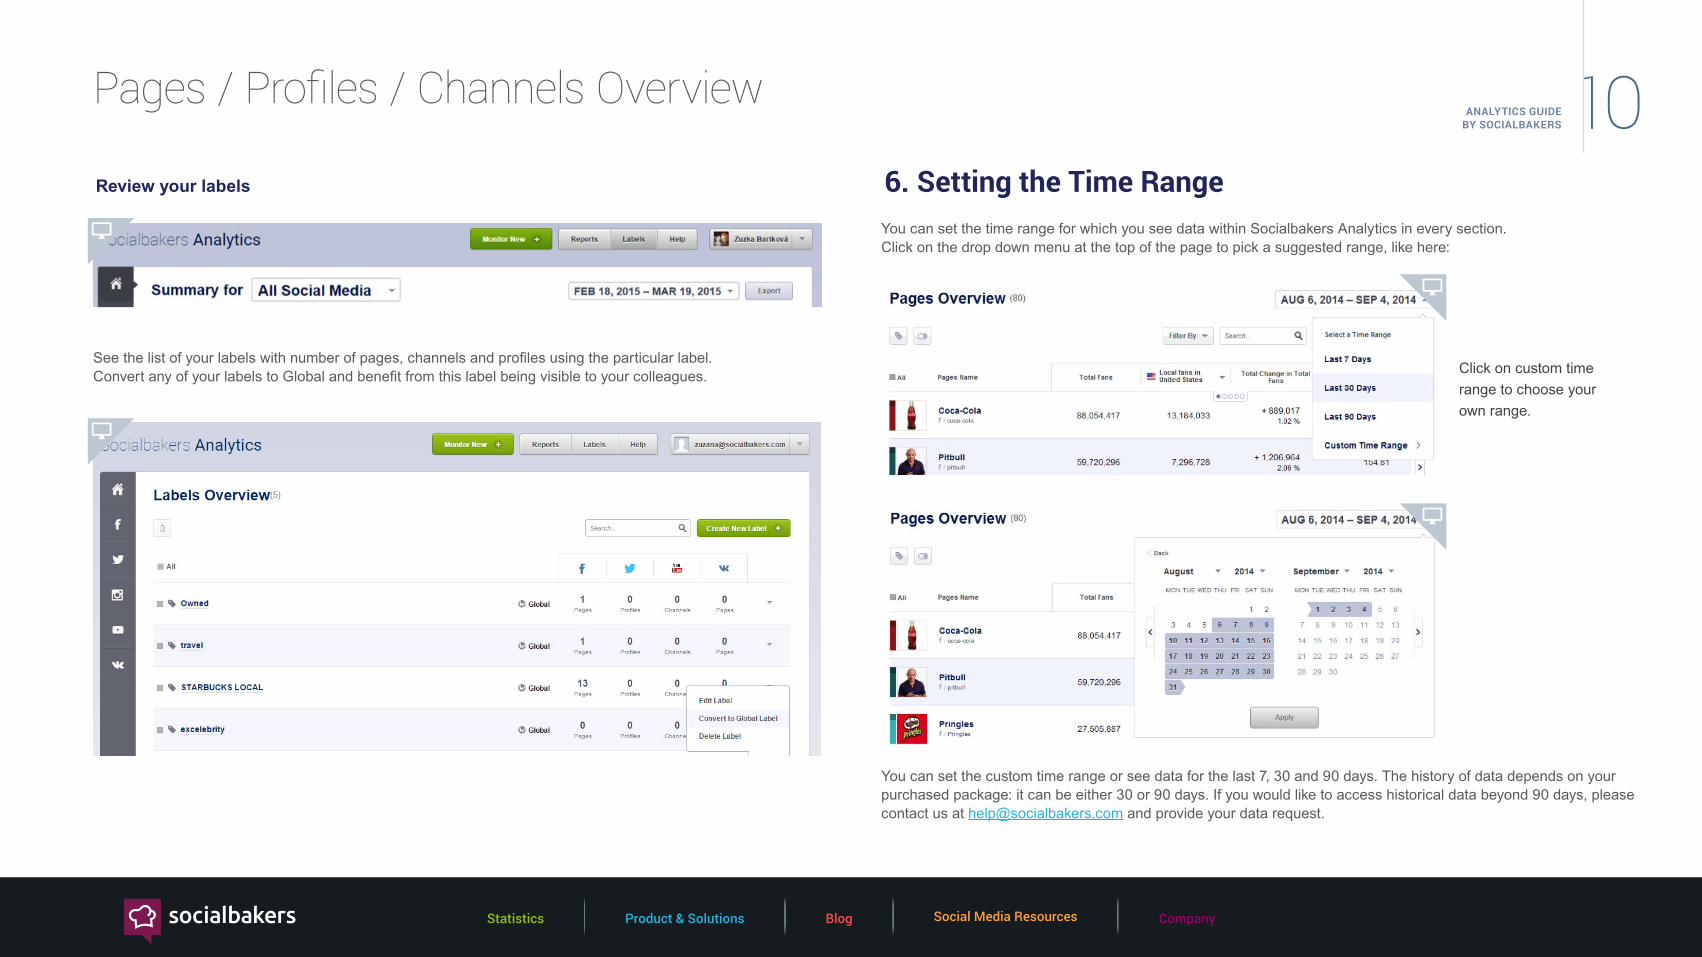
See the list of your labels with number of pages, channels and profiles using the particular label. Convert any of your labels to Global and benefit from this label being visible to your colleagues.
You can set the time range for which you see data within Socialbakers Analytics in every section. Click on the drop down menu at the top of the page to pick a suggested range, like here:
You can set the custom time range or see data for the last 7, 30 and 90 days. The history of data depends on your purchased package: it can be either 30 or 90 days. If you would like to access historical data beyond 90 days, please contact us at [email protected] and provide your data request.
Click on custom time range to choose your own range.
Pages / Profiles / Channels Overview
Review your labels
11ANALYTICS GUIDE BY SOCIALBAKERS
Statistics Social Media Resources CompanyBlogProduct & Solutions
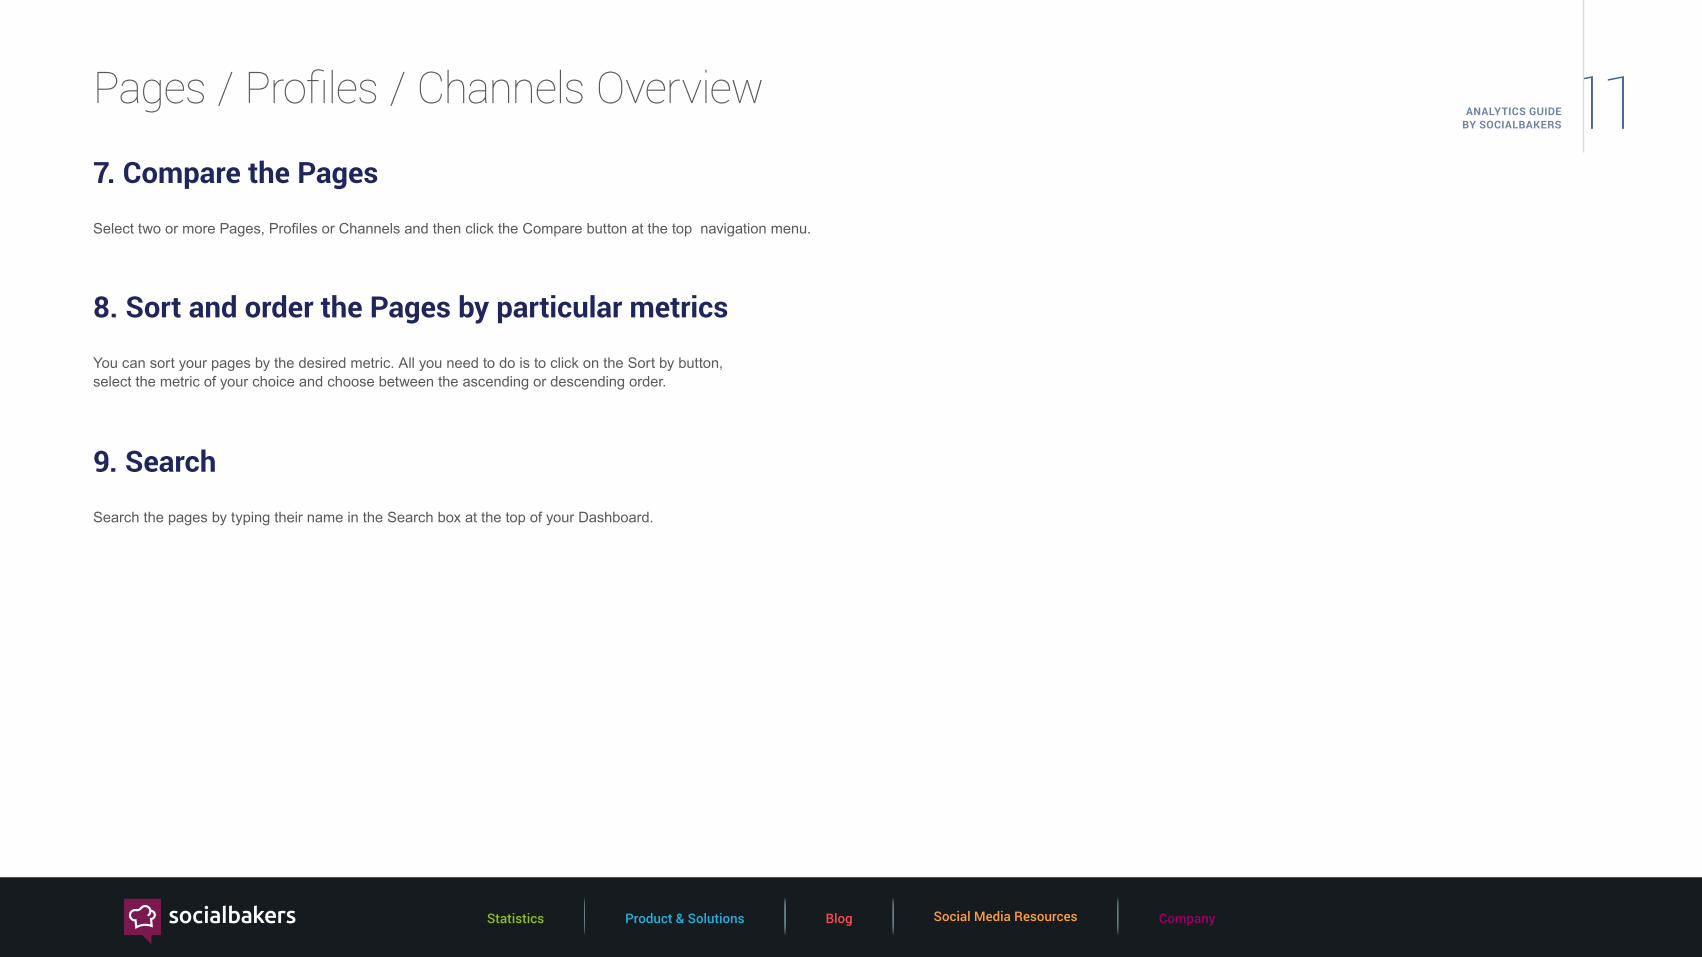
7. Compare the Pages
8. Sort and order the Pages by particular metrics
9. Search
Select two or more Pages, Profiles or Channels and then click the Compare button at the top navigation menu.
You can sort your pages by the desired metric. All you need to do is to click on the Sort by button, select the metric of your choice and choose between the ascending or descending order.
Search the pages by typing their name in the Search box at the top of your Dashboard.
Pages / Profiles / Channels Overview
12ANALYTICS GUIDE BY SOCIALBAKERS
Statistics Social Media Resources CompanyBlogProduct & Solutions
Why is it important? 1:1 Comparisons
What kind of comparisons can I make?
Comparative Analytics & Benchmarking
To fully understand your social media metrics it is essential to benchmark your performance against others. This can be your competitors, any others competing for the attention of your audience, or your industry as a whole.
Without the competitive analysis you are unable to objectively evaluate your performance and know where you are on a spectrum with your competitors. On top of this, it is crucial to be able to optimize, and therefore continually improve your performance over time.
Benchmarking is not only the best practice for measuring performance, it’s one of the most powerful features in Socialbakers Analytics.
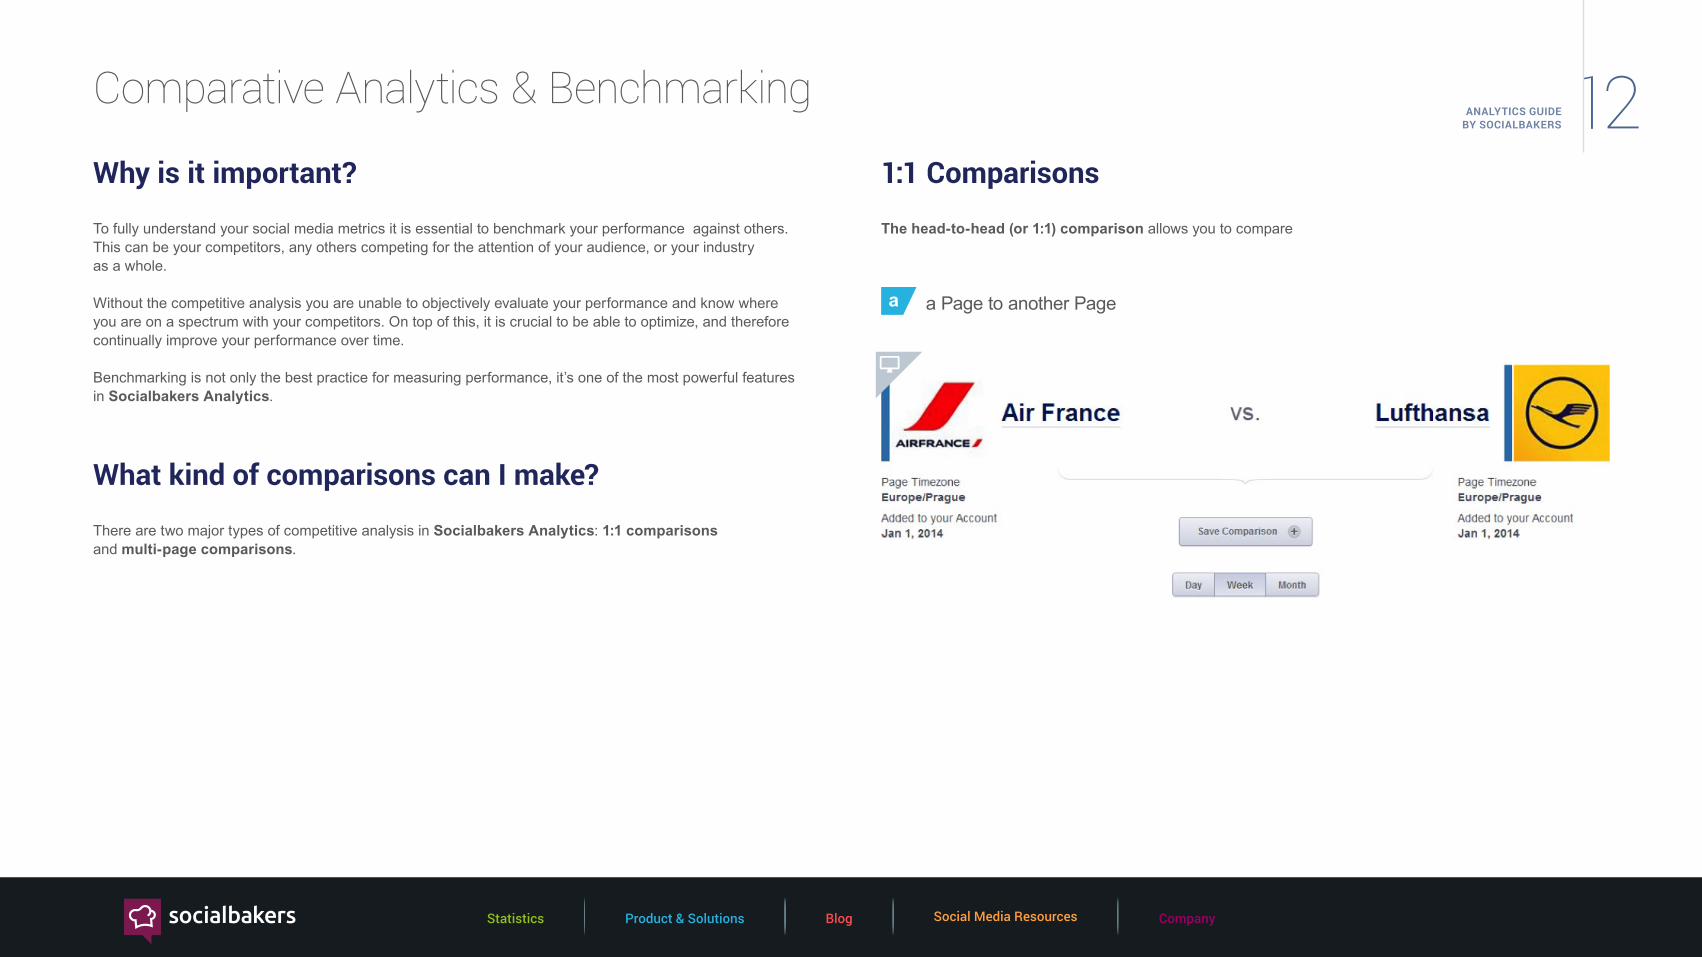
The head-to-head (or 1:1) comparison allows you to compare
There are two major types of competitive analysis in Socialbakers Analytics: 1:1 comparisons and multi-page comparisons.
a a Page to another Page
13ANALYTICS GUIDE BY SOCIALBAKERS
Statistics Social Media Resources CompanyBlogProduct & Solutions
b
d
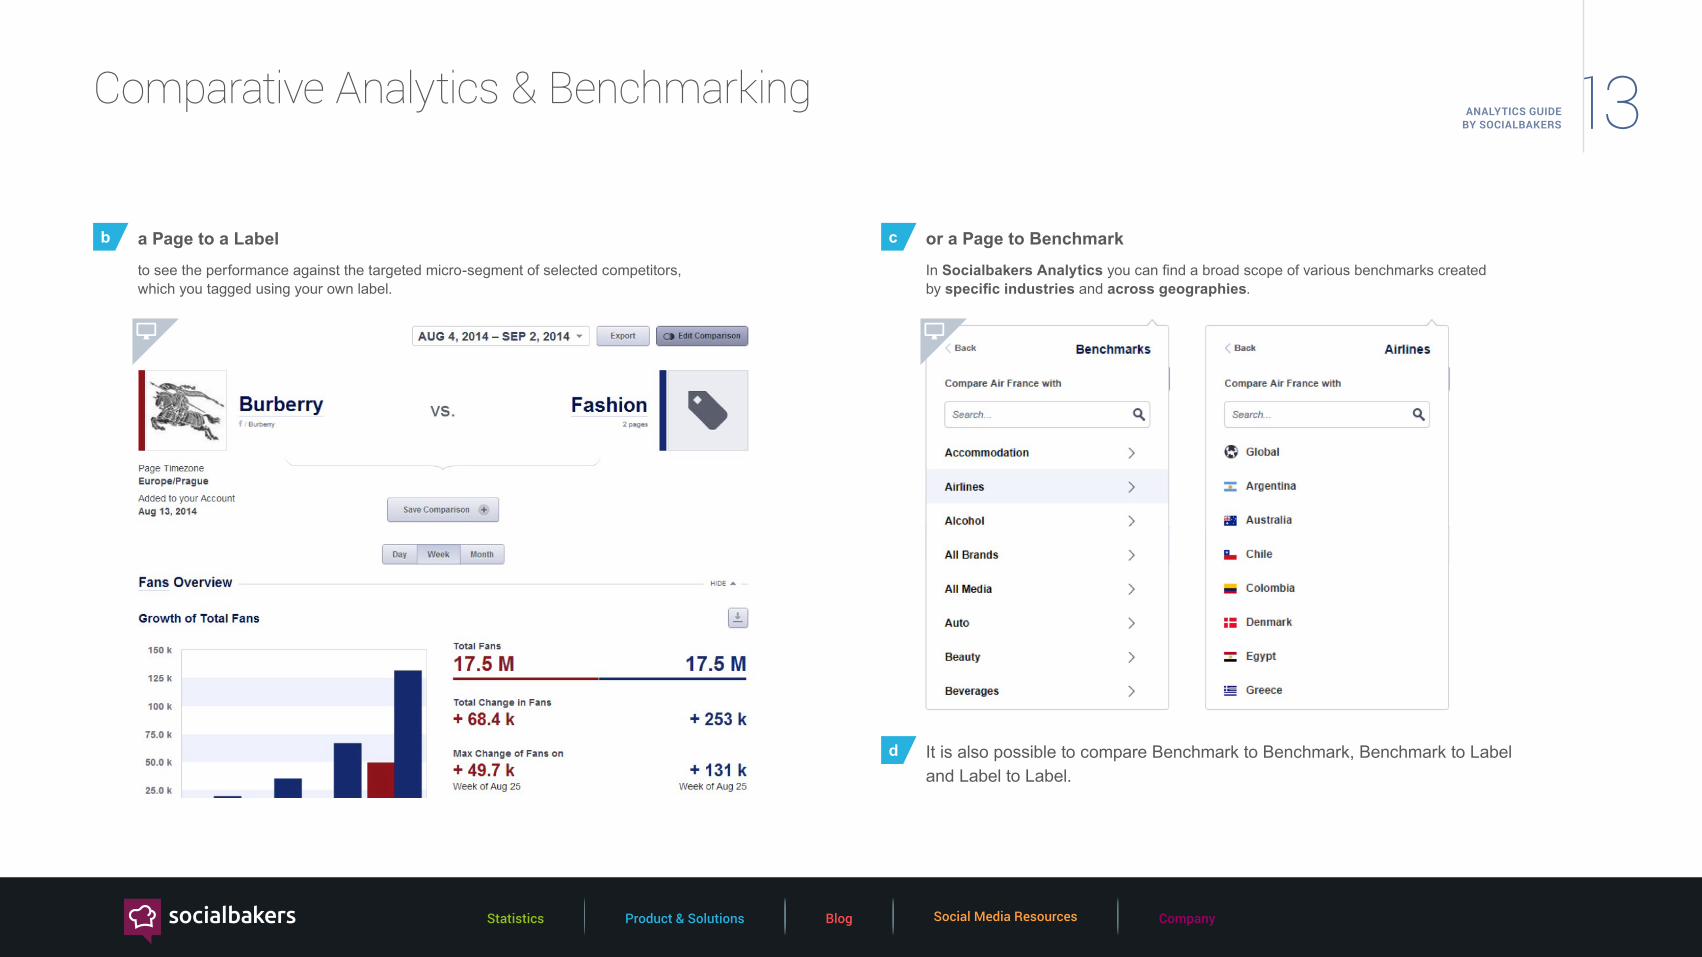
a Page to a Label
It is also possible to compare Benchmark to Benchmark, Benchmark to Label and Label to Label.
to see the performance against the targeted micro-segment of selected competitors, which you tagged using your own label.
c or a Page to Benchmark
In Socialbakers Analytics you can find a broad scope of various benchmarks created by specific industries and across geographies.
Comparative Analytics & Benchmarking
14ANALYTICS GUIDE BY SOCIALBAKERS
Statistics Social Media Resources CompanyBlogProduct & Solutions
Comparative Analytics & Benchmarking
Why use benchmarks?
Multi-Comparisons
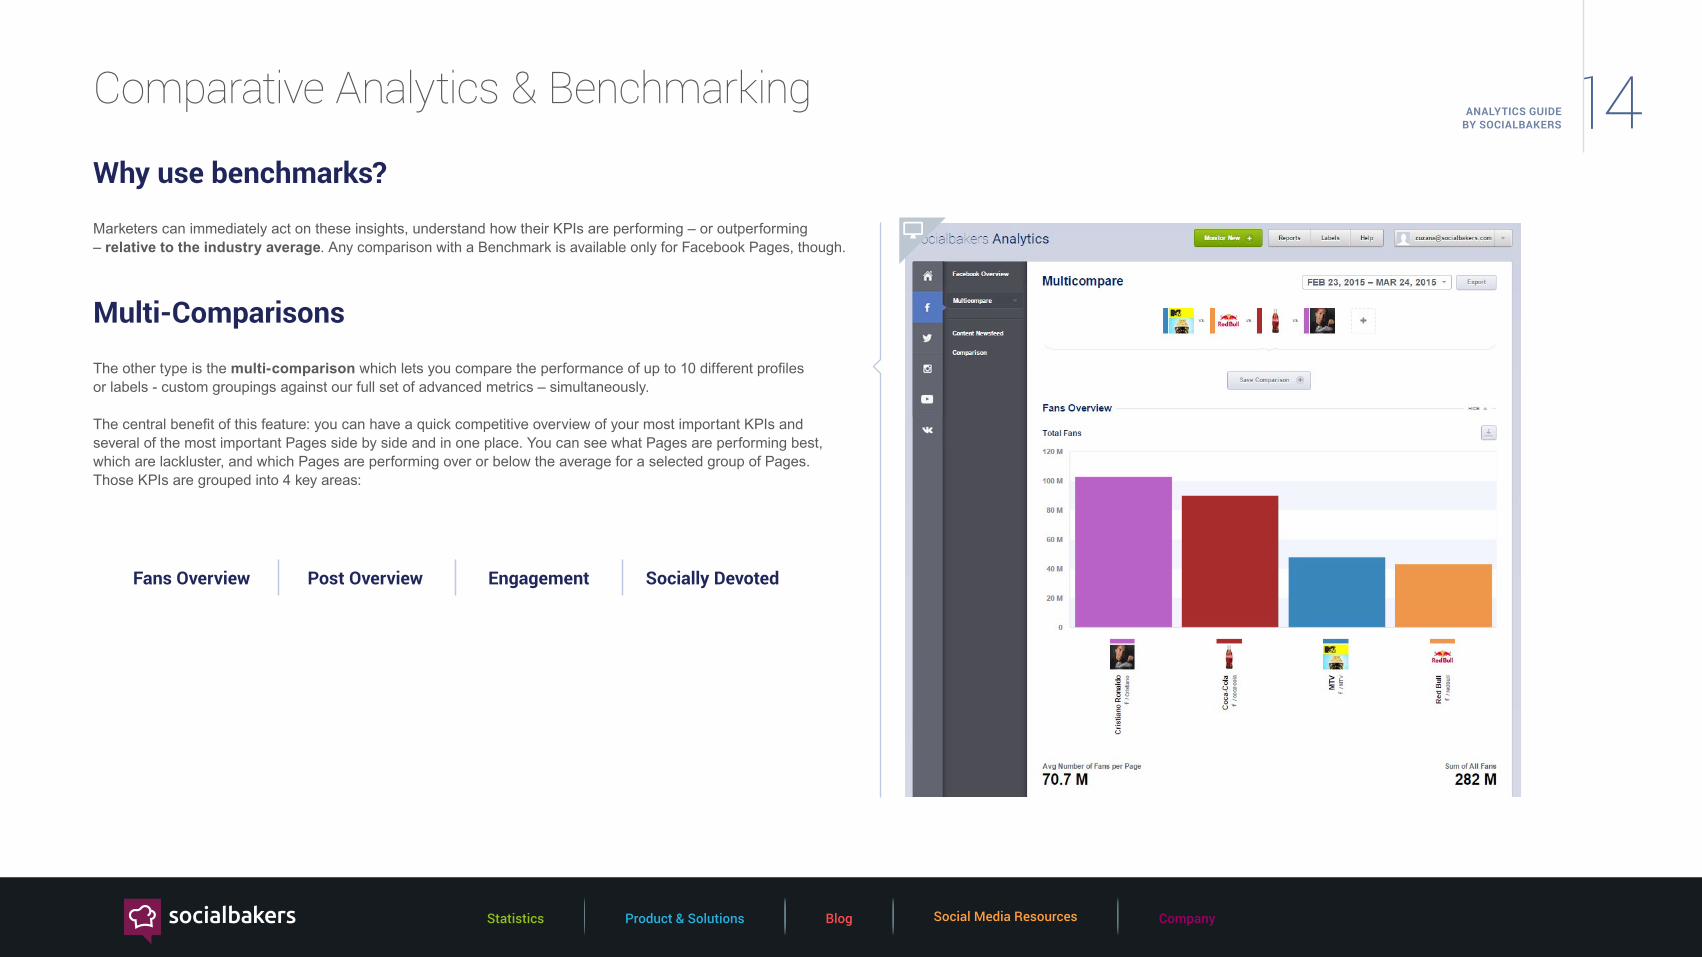
Marketers can immediately act on these insights, understand how their KPIs are performing – or outperforming – relative to the industry average. Any comparison with a Benchmark is available only for Facebook Pages, though.
The other type is the multi-comparison which lets you compare the performance of up to 10 different profiles or labels - custom groupings against our full set of advanced metrics – simultaneously.
The central benefit of this feature: you can have a quick competitive overview of your most important KPIs and several of the most important Pages side by side and in one place. You can see what Pages are performing best, which are lackluster, and which Pages are performing over or below the average for a selected group of Pages. Those KPIs are grouped into 4 key areas:
Fans Overview Post Overview Engagement Socially Devoted
15ANALYTICS GUIDE BY SOCIALBAKERS
Statistics Social Media Resources CompanyBlogProduct & Solutions
Comparative Analytics & Benchmarking
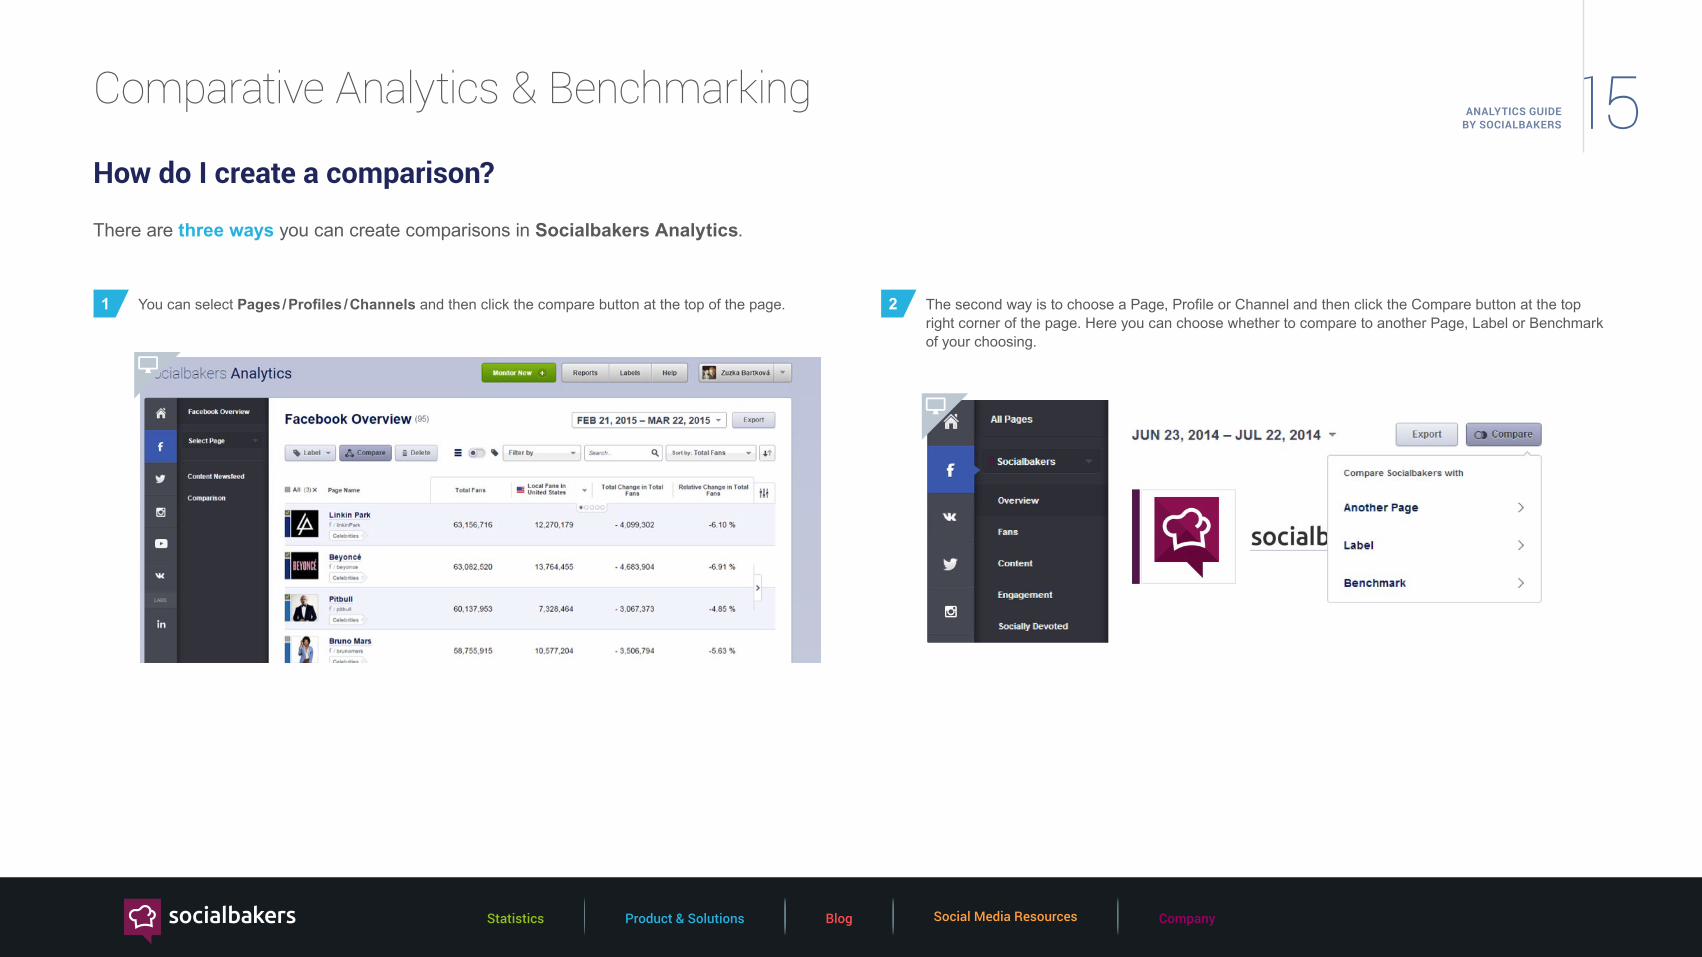
How do I create a comparison?
There are three ways you can create comparisons in Socialbakers Analytics.
1 2You can select Pages / Profiles / Channels and then click the compare button at the top of the page. The second way is to choose a Page, Profile or Channel and then click the Compare button at the top right corner of the page. Here you can choose whether to compare to another Page, Label or Benchmark of your choosing.
16ANALYTICS GUIDE BY SOCIALBAKERS
Statistics Social Media Resources CompanyBlogProduct & Solutions
Comparative Analytics & Benchmarking
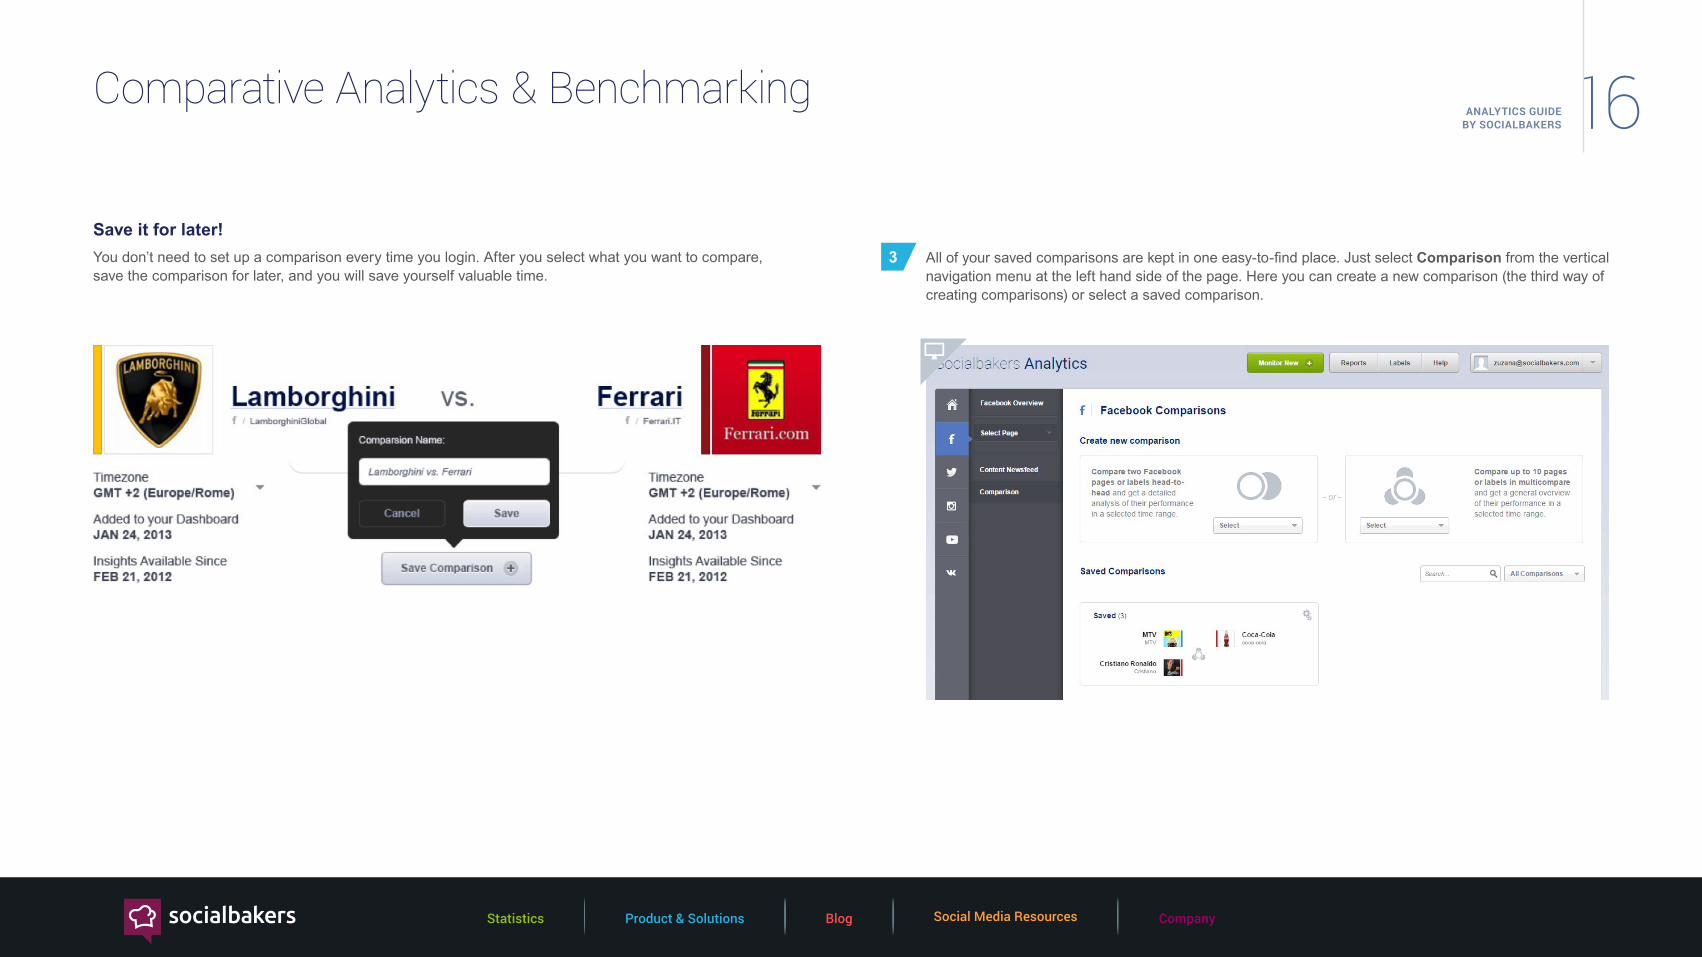
Save it for later!You don’t need to set up a comparison every time you login. After you select what you want to compare, save the comparison for later, and you will save yourself valuable time.
3 All of your saved comparisons are kept in one easy-to-find place. Just select Comparison from the vertical navigation menu at the left hand side of the page. Here you can create a new comparison (the third way of creating comparisons) or select a saved comparison.
17ANALYTICS GUIDE BY SOCIALBAKERS
Statistics Social Media Resources CompanyBlogProduct & Solutions
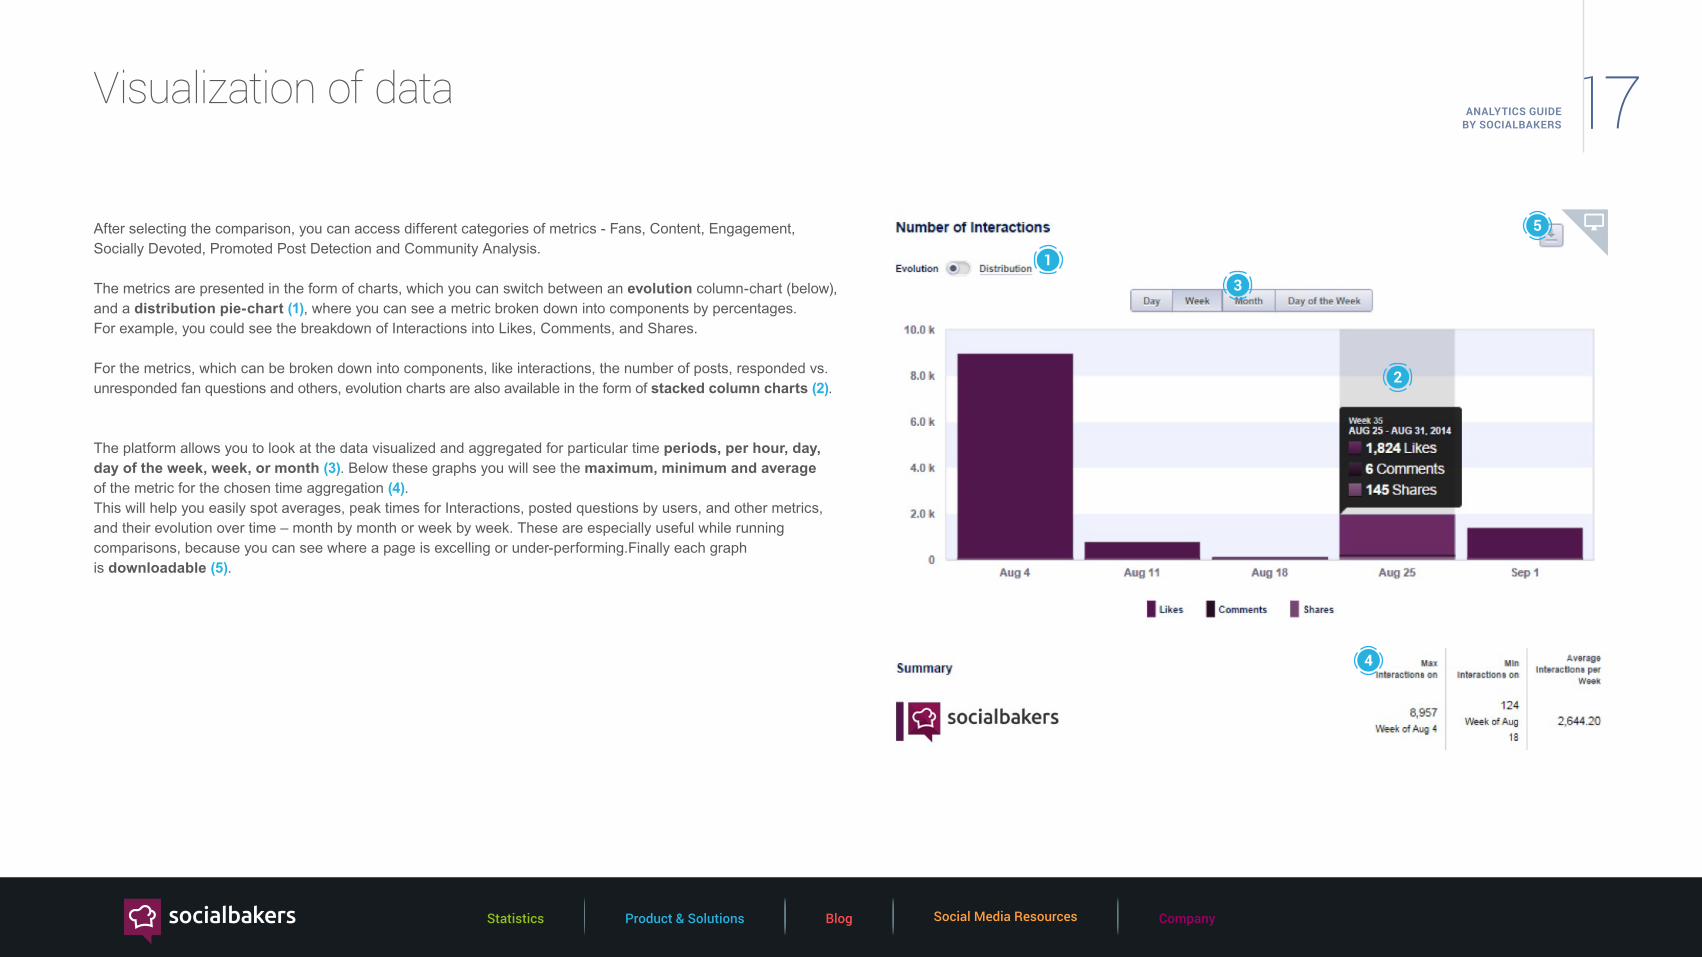
After selecting the comparison, you can access different categories of metrics - Fans, Content, Engagement, Socially Devoted, Promoted Post Detection and Community Analysis.
The metrics are presented in the form of charts, which you can switch between an evolution column-chart (below), and a distribution pie-chart (1), where you can see a metric broken down into components by percentages. For example, you could see the breakdown of Interactions into Likes, Comments, and Shares.
For the metrics, which can be broken down into components, like interactions, the number of posts, responded vs. unresponded fan questions and others, evolution charts are also available in the form of stacked column charts (2).
The platform allows you to look at the data visualized and aggregated for particular time periods, per hour, day, day of the week, week, or month (3). Below these graphs you will see the maximum, minimum and average of the metric for the chosen time aggregation (4).This will help you easily spot averages, peak times for Interactions, posted questions by users, and other metrics, and their evolution over time – month by month or week by week. These are especially useful while running comparisons, because you can see where a page is excelling or under-performing.Finally each graph is downloadable (5).
Visualization of data
13
5
2
4
18ANALYTICS GUIDE BY SOCIALBAKERS
Statistics Social Media Resources CompanyBlogProduct & Solutions
AnalyzingFacebookAnalyzing
Facebookwith
Socialbakers Analytics
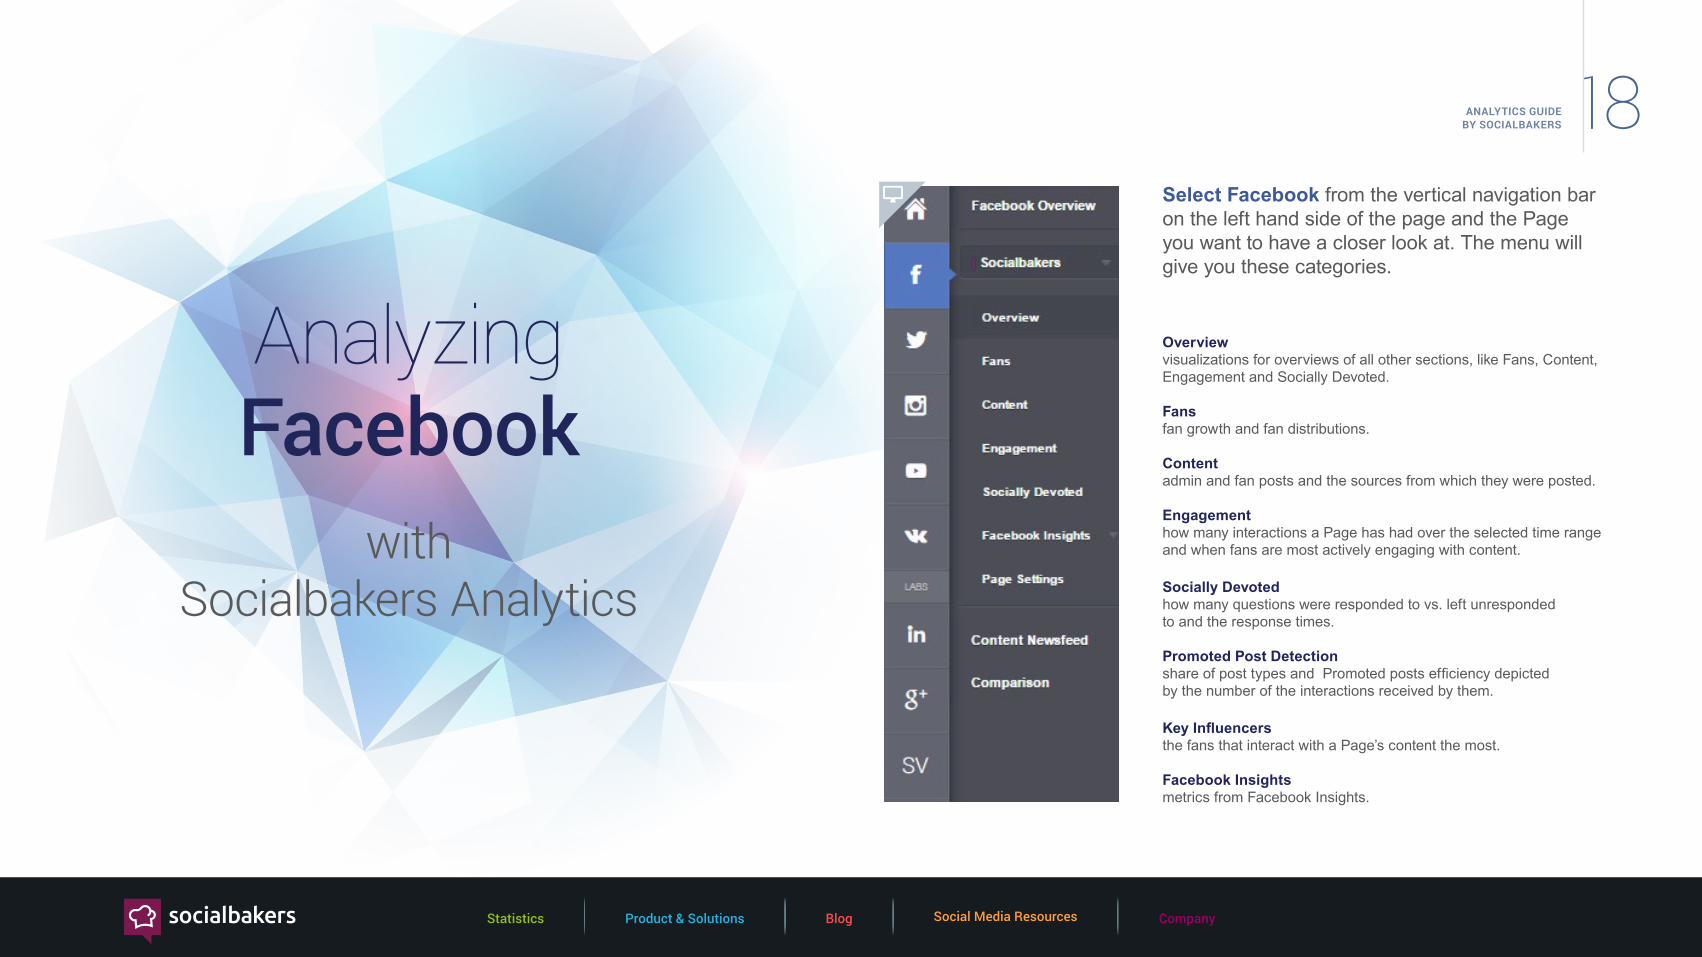
Select Facebook from the vertical navigation bar on the left hand side of the page and the Page you want to have a closer look at. The menu will give you these categories.
Overviewvisualizations for overviews of all other sections, like Fans, Content, Engagement and Socially Devoted.
Fansfan growth and fan distributions.
Contentadmin and fan posts and the sources from which they were posted.
Engagementhow many interactions a Page has had over the selected time range and when fans are most actively engaging with content.
Socially Devotedhow many questions were responded to vs. left unresponded to and the response times.
Promoted Post Detectionshare of post types and Promoted posts efficiency depicted by the number of the interactions received by them.
Key Influencersthe fans that interact with a Page’s content the most.
Facebook Insightsmetrics from Facebook Insights.
19ANALYTICS GUIDE BY SOCIALBAKERS
Statistics Social Media Resources CompanyBlogProduct & Solutions
Fans & Fan Growth Analyzing Posted Content part 1
Use this section to understand how your fanbase has grown over the selected time range, where your fans come from, and to see when a Page has spikes in user growth.
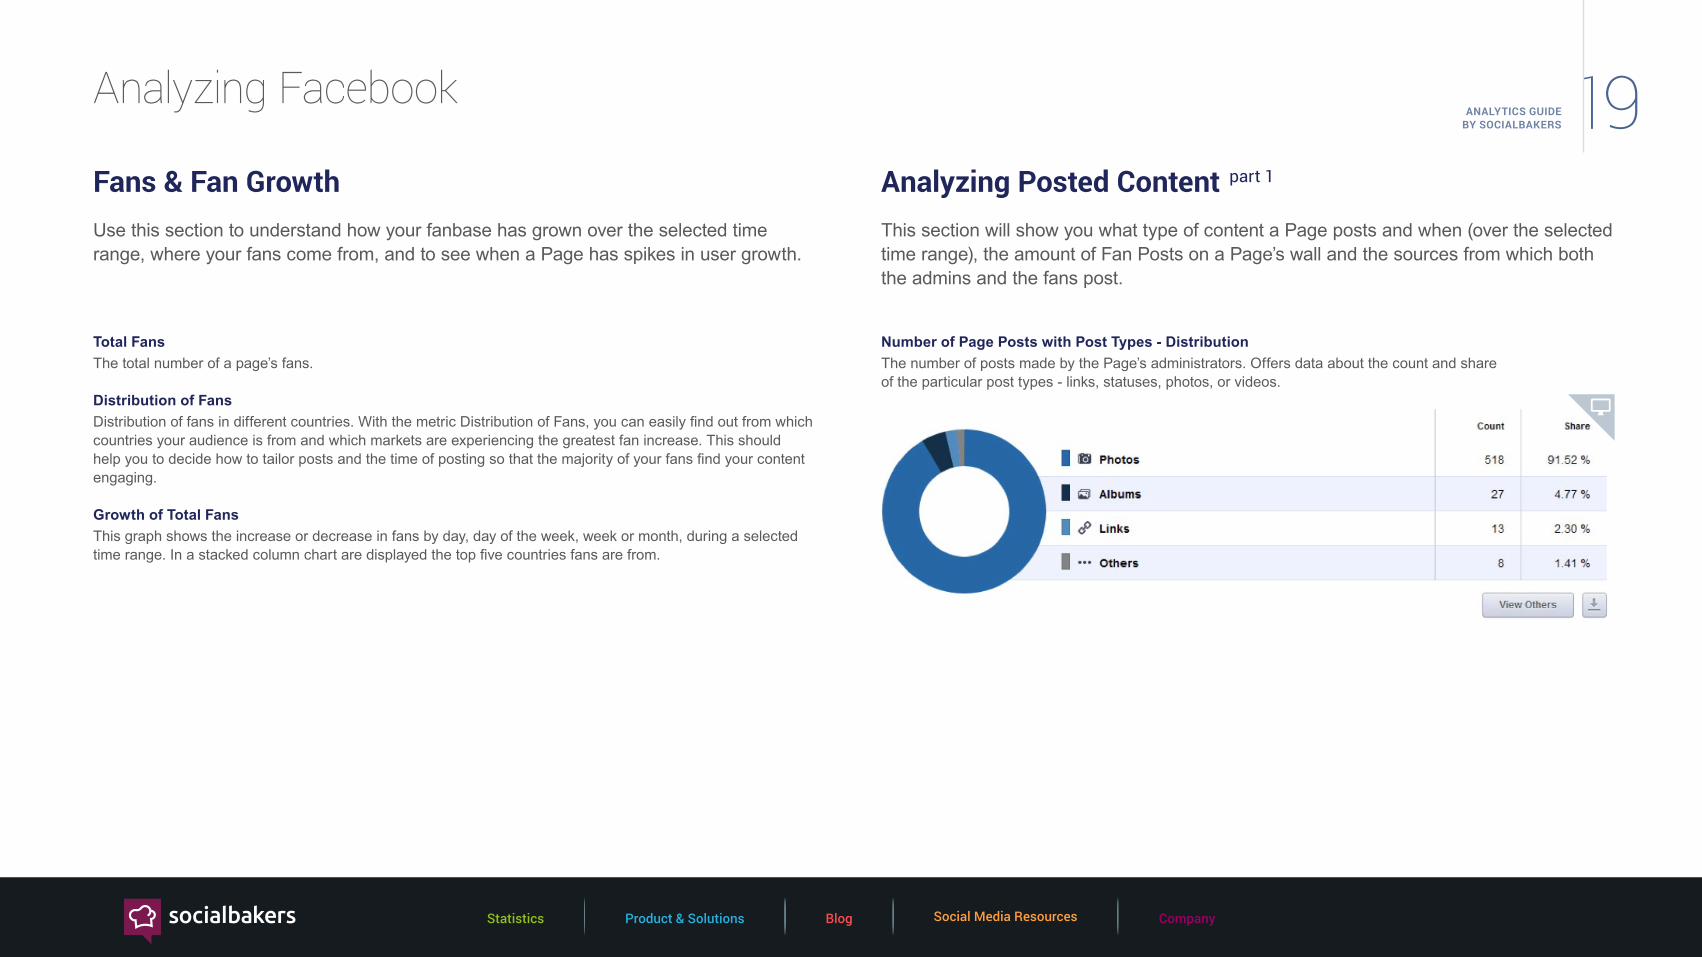
This section will show you what type of content a Page posts and when (over the selected time range), the amount of Fan Posts on a Page’s wall and the sources from which both the admins and the fans post.
Total FansThe total number of a page’s fans.
Distribution of FansDistribution of fans in different countries. With the metric Distribution of Fans, you can easily find out from which countries your audience is from and which markets are experiencing the greatest fan increase. This should help you to decide how to tailor posts and the time of posting so that the majority of your fans find your content engaging.
Growth of Total FansThis graph shows the increase or decrease in fans by day, day of the week, week or month, during a selected time range. In a stacked column chart are displayed the top five countries fans are from.
Number of Page Posts with Post Types - DistributionThe number of posts made by the Page’s administrators. Offers data about the count and share of the particular post types - links, statuses, photos, or videos.
Analyzing Facebook
20ANALYTICS GUIDE BY SOCIALBAKERS
Statistics Social Media Resources CompanyBlogProduct & Solutions
Analyzing Posted Content part 2
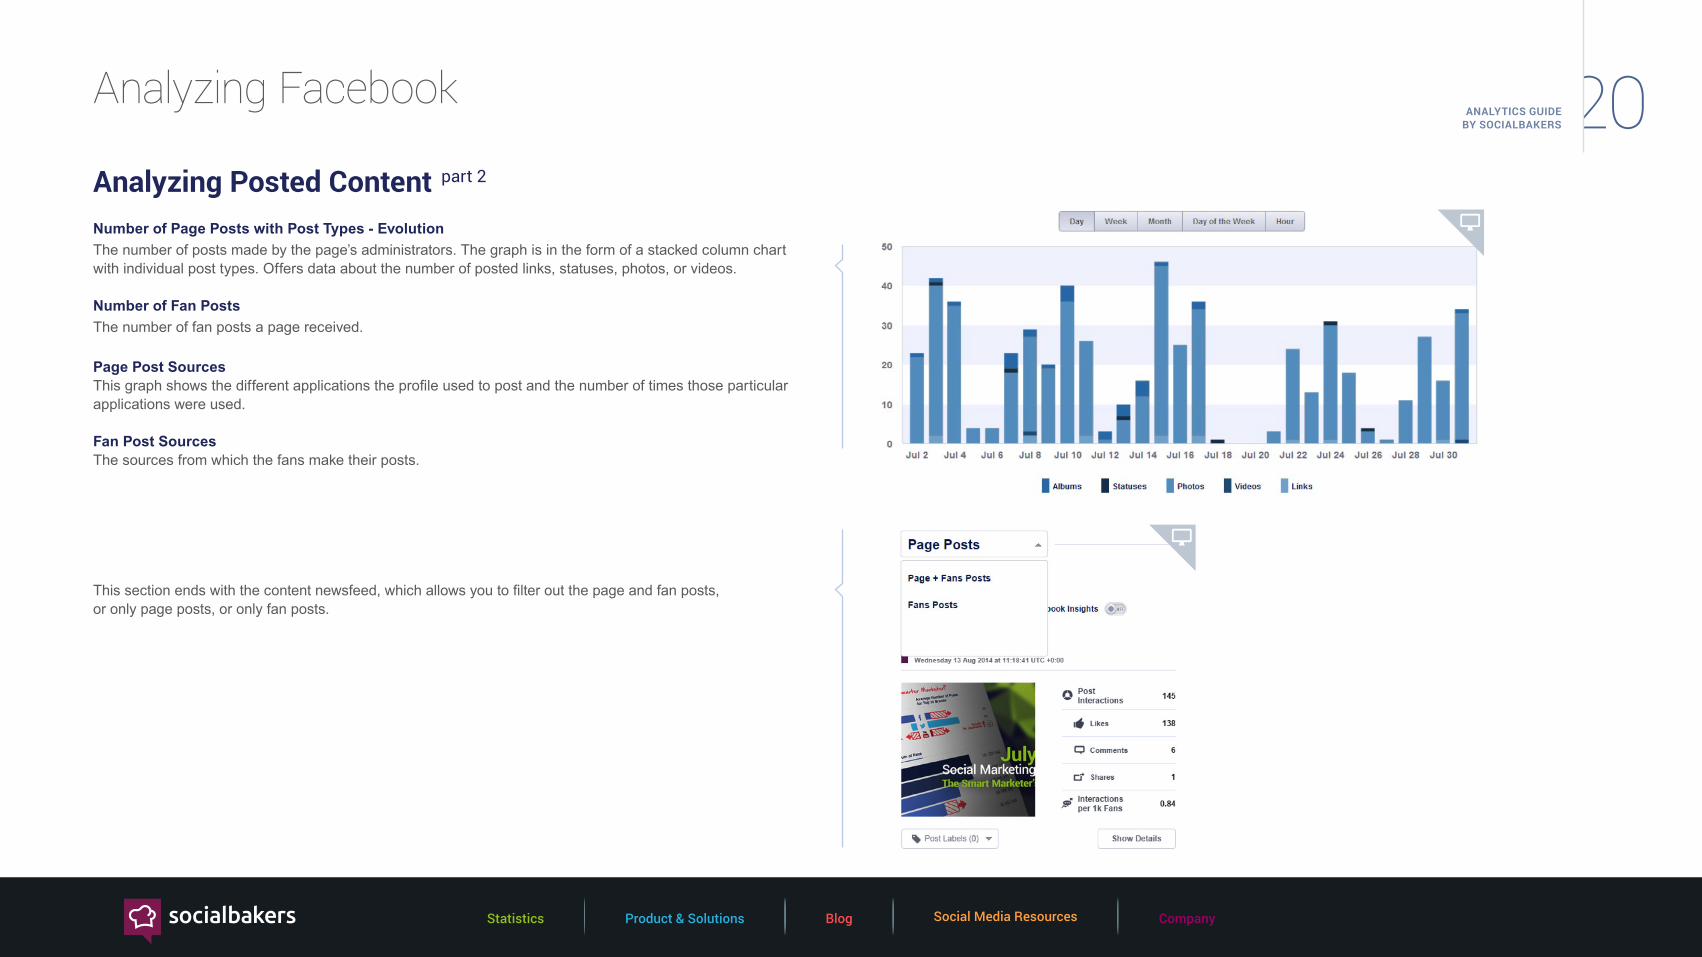
Number of Page Posts with Post Types - EvolutionThe number of posts made by the page’s administrators. The graph is in the form of a stacked column chart with individual post types. Offers data about the number of posted links, statuses, photos, or videos.
Number of Fan PostsThe number of fan posts a page received.
Page Post SourcesThis graph shows the different applications the profile used to post and the number of times those particular applications were used.
Fan Post SourcesThe sources from which the fans make their posts.
This section ends with the content newsfeed, which allows you to filter out the page and fan posts, or only page posts, or only fan posts.
Analyzing Facebook
21ANALYTICS GUIDE BY SOCIALBAKERS
Statistics Social Media Resources CompanyBlogProduct & Solutions
EngagementUse this section to see how many interactions a Page has had over the selected time range, which content types are the most engaging, during which days and times of day users are most active, and more.
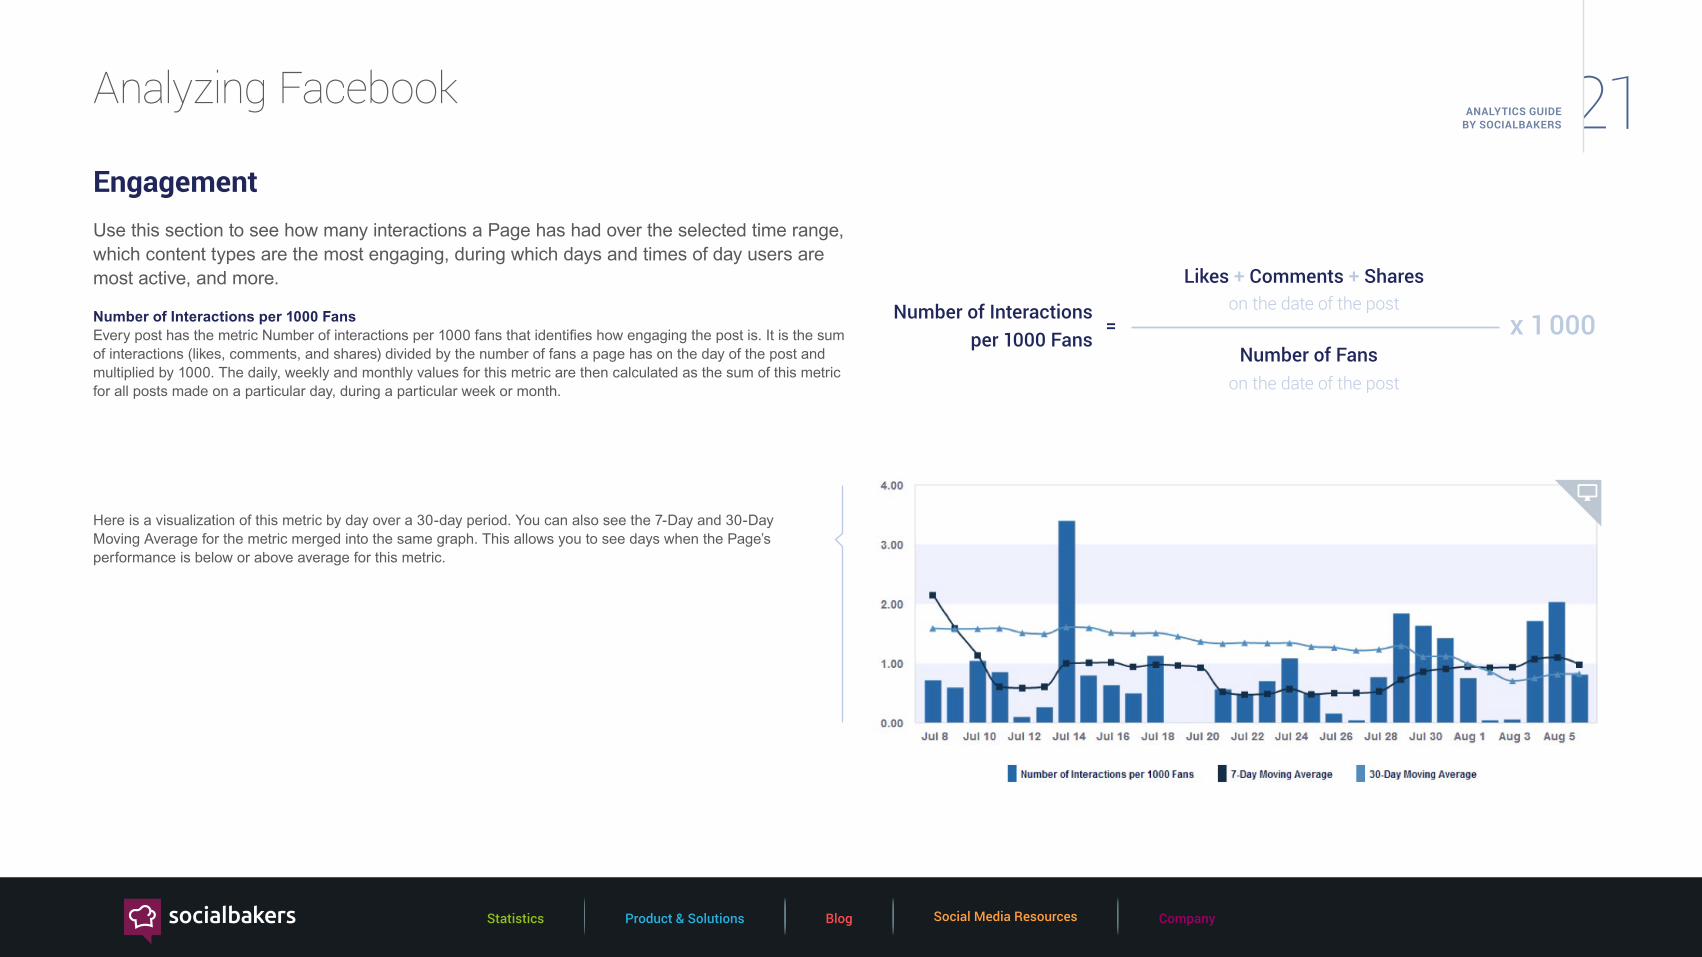
Number of Interactions per 1000 FansEvery post has the metric Number of interactions per 1000 fans that identifies how engaging the post is. It is the sum of interactions (likes, comments, and shares) divided by the number of fans a page has on the day of the post and multiplied by 1000. The daily, weekly and monthly values for this metric are then calculated as the sum of this metric for all posts made on a particular day, during a particular week or month.
Analyzing Facebook
Number of Interactions per 1000 Fans
Likes + Comments + Shares
x 1 000Number of Fans
on the date of the post
on the date of the post
=
Here is a visualization of this metric by day over a 30-day period. You can also see the 7-Day and 30-Day Moving Average for the metric merged into the same graph. This allows you to see days when the Page’s performance is below or above average for this metric.
22ANALYTICS GUIDE BY SOCIALBAKERS
Statistics Social Media Resources CompanyBlogProduct & Solutions
7-Day Moving Average and 30-Day Moving AverageShows the ’Number of Interactions per 1000 Fans’ averages for a 7 or 30 day time range. It is calculated by summing up all daily values for the ’Number of Interactions per 1000 Fans’ in the last 7 or 30 day period. Days with a zero value for the ’Number of Interactions per 1000 Fans’ are excluded.The moving averages are a great way to see the evolution of the metrics’ trends.
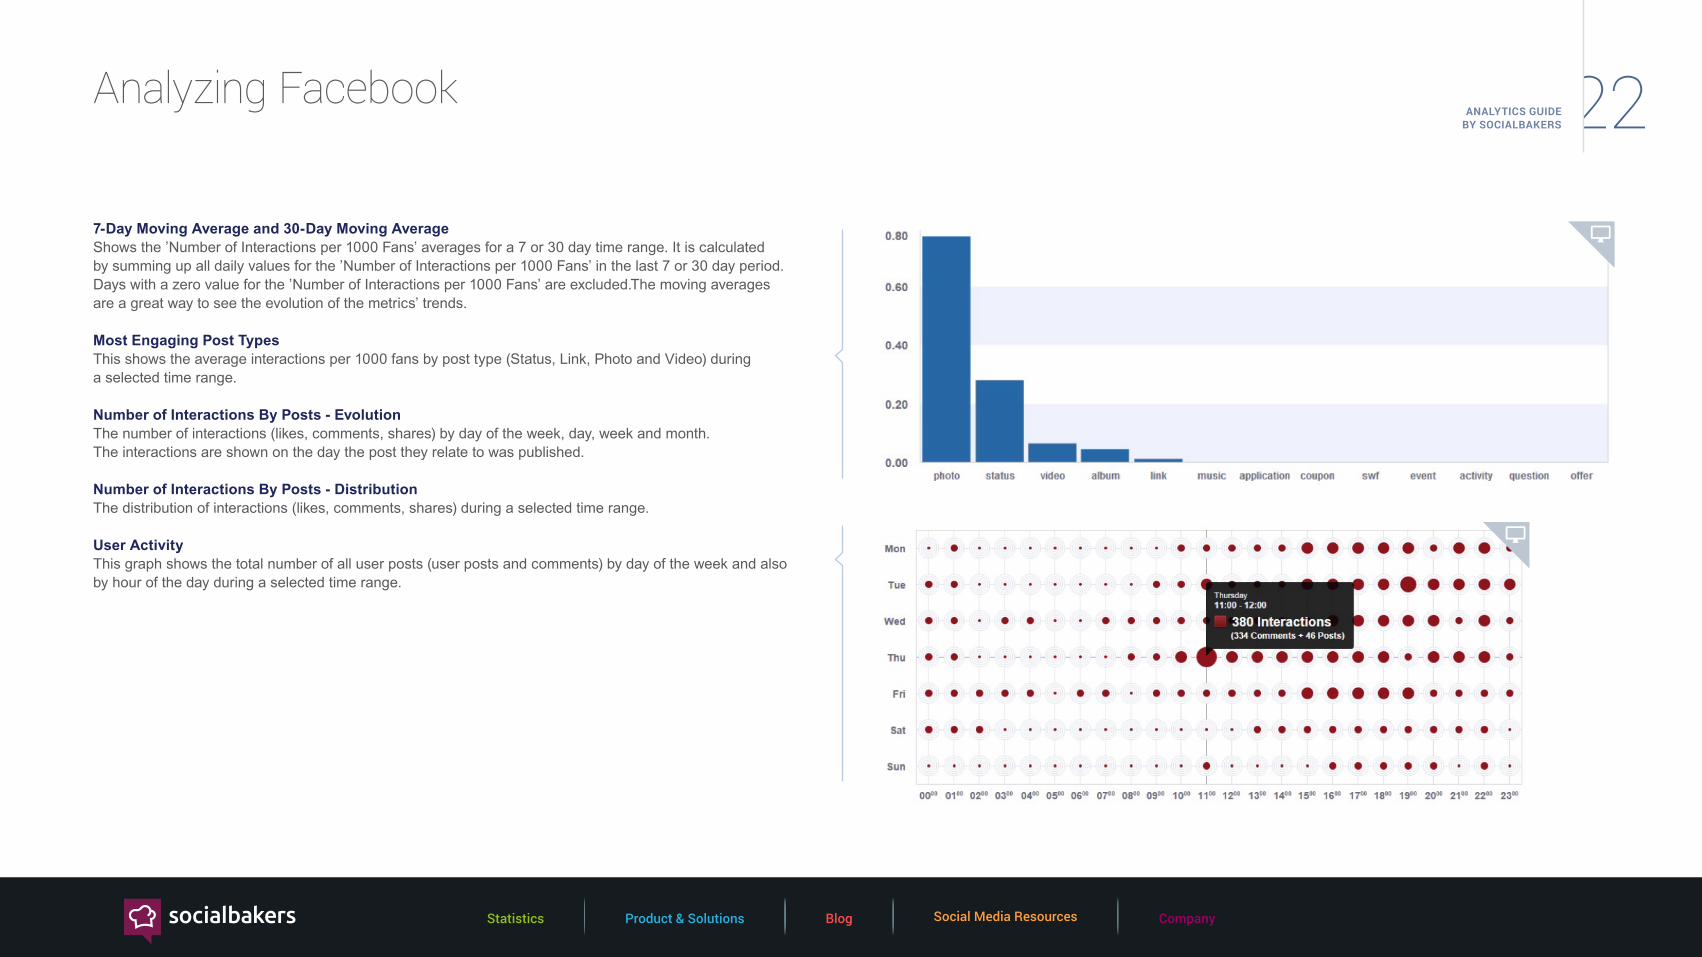
Most Engaging Post TypesThis shows the average interactions per 1000 fans by post type (Status, Link, Photo and Video) during a selected time range.
Number of Interactions By Posts - EvolutionThe number of interactions (likes, comments, shares) by day of the week, day, week and month. The interactions are shown on the day the post they relate to was published.
Number of Interactions By Posts - DistributionThe distribution of interactions (likes, comments, shares) during a selected time range.
User ActivityThis graph shows the total number of all user posts (user posts and comments) by day of the week and also by hour of the day during a selected time range.
Analyzing Facebook
23ANALYTICS GUIDE BY SOCIALBAKERS
Statistics Social Media Resources CompanyBlogProduct & Solutions
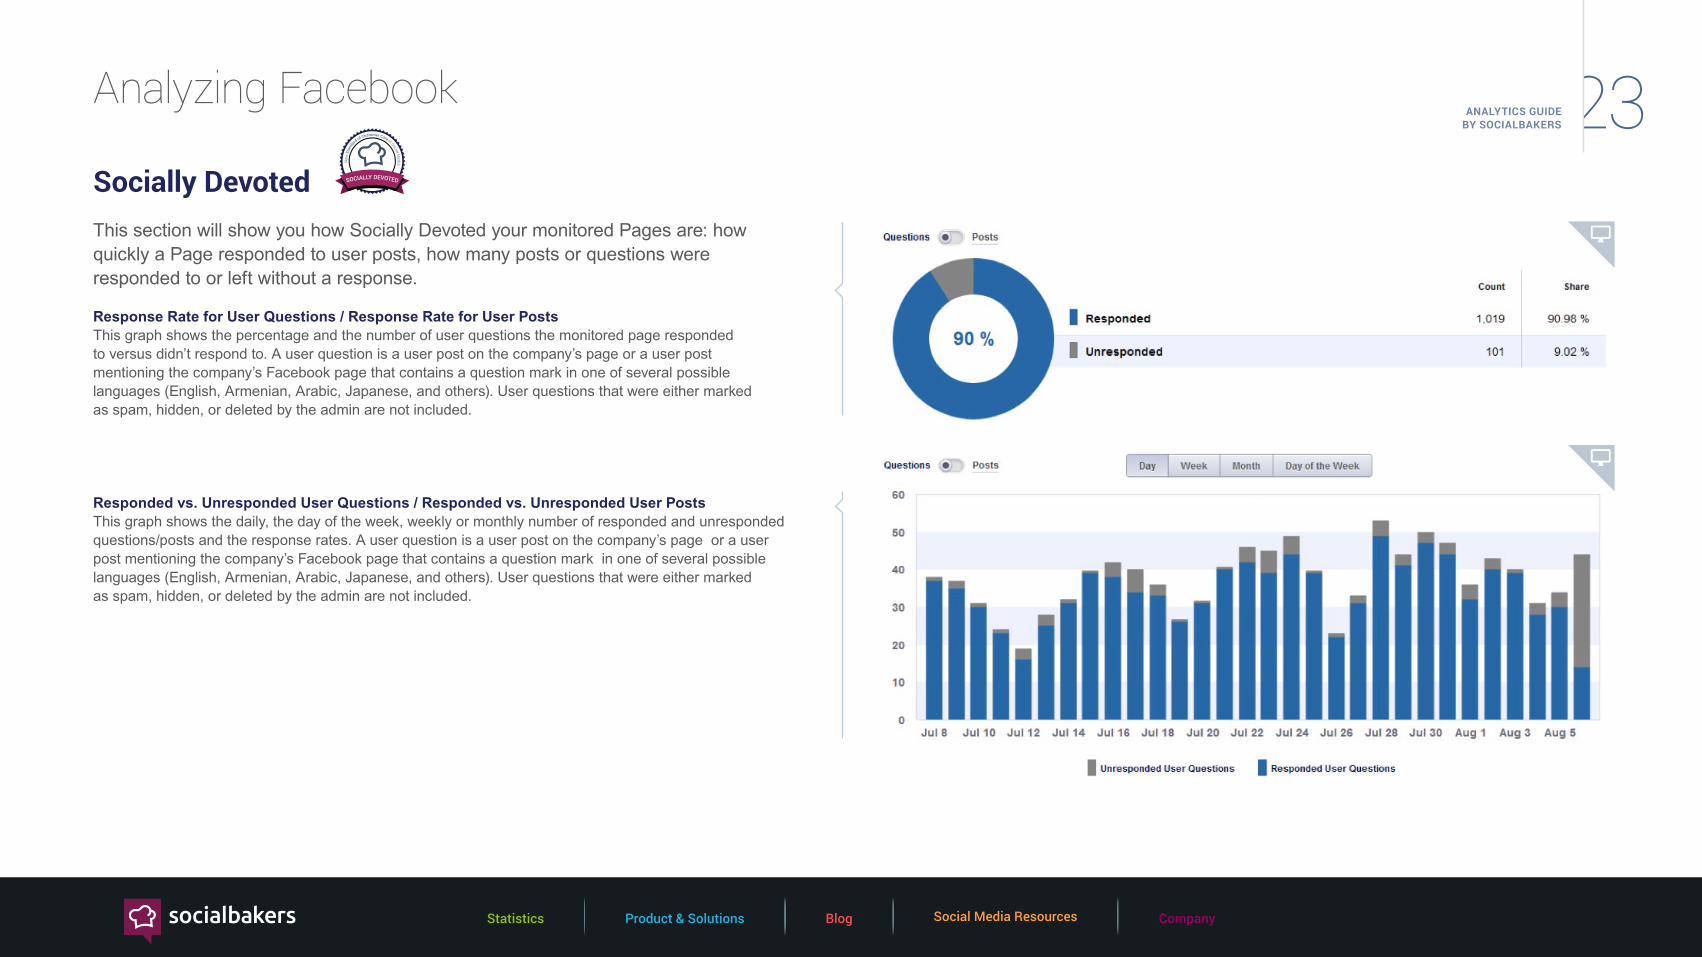
Socially DevotedThis section will show you how Socially Devoted your monitored Pages are: how quickly a Page responded to user posts, how many posts or questions were responded to or left without a response.
Response Rate for User Questions / Response Rate for User PostsThis graph shows the percentage and the number of user questions the monitored page responded to versus didn’t respond to. A user question is a user post on the company’s page or a user post mentioning the company’s Facebook page that contains a question mark in one of several possible languages (English, Armenian, Arabic, Japanese, and others). User questions that were either marked as spam, hidden, or deleted by the admin are not included.
Responded vs. Unresponded User Questions / Responded vs. Unresponded User PostsThis graph shows the daily, the day of the week, weekly or monthly number of responded and unresponded questions/posts and the response rates. A user question is a user post on the company’s page or a user post mentioning the company’s Facebook page that contains a question mark in one of several possible languages (English, Armenian, Arabic, Japanese, and others). User questions that were either marked as spam, hidden, or deleted by the admin are not included.
Analyzing Facebook
New
Sta
ndard
of Customer Care in Social MediaN
ew S
tand
ard of Customer Care in Social M
edia
SOCIALLY DEVOTED
24ANALYTICS GUIDE BY SOCIALBAKERS
Statistics Social Media Resources CompanyBlogProduct & Solutions
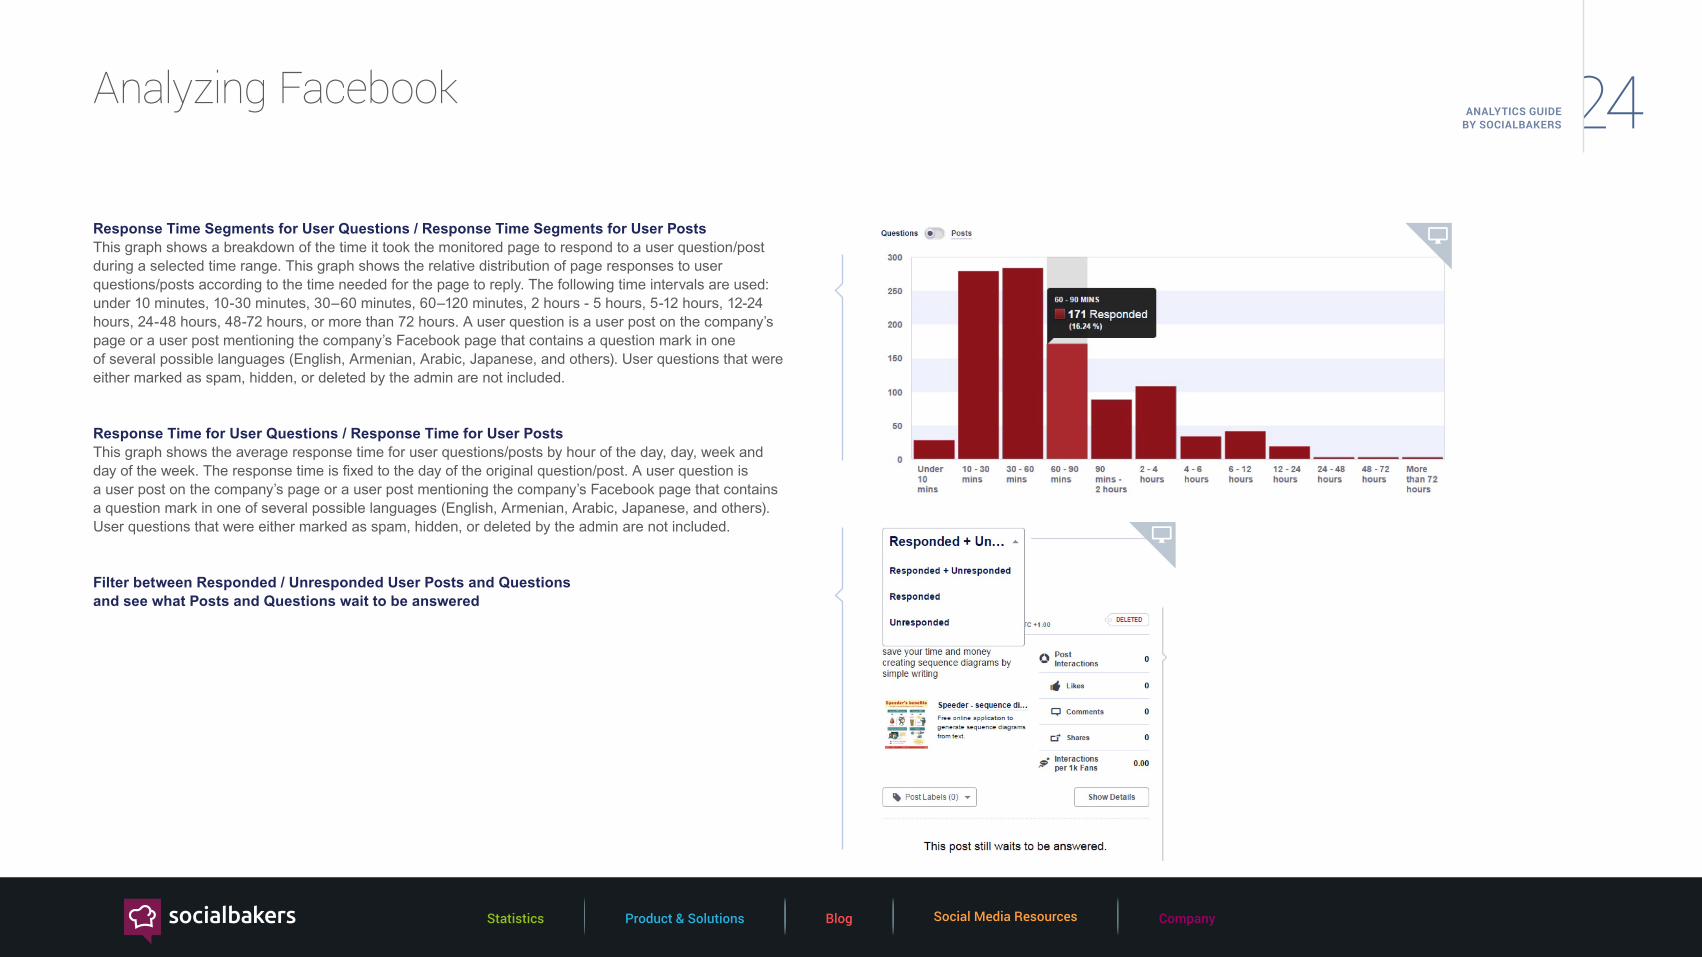
Response Time Segments for User Questions / Response Time Segments for User Posts This graph shows a breakdown of the time it took the monitored page to respond to a user question/post during a selected time range. This graph shows the relative distribution of page responses to user questions/posts according to the time needed for the page to reply. The following time intervals are used: under 10 minutes, 10-30 minutes, 30–60 minutes, 60–120 minutes, 2 hours - 5 hours, 5-12 hours, 12-24 hours, 24-48 hours, 48-72 hours, or more than 72 hours. A user question is a user post on the company’s page or a user post mentioning the company’s Facebook page that contains a question mark in one of several possible languages (English, Armenian, Arabic, Japanese, and others). User questions that were either marked as spam, hidden, or deleted by the admin are not included.
Response Time for User Questions / Response Time for User PostsThis graph shows the average response time for user questions/posts by hour of the day, day, week and day of the week. The response time is fixed to the day of the original question/post. A user question is a user post on the company’s page or a user post mentioning the company’s Facebook page that contains a question mark in one of several possible languages (English, Armenian, Arabic, Japanese, and others). User questions that were either marked as spam, hidden, or deleted by the admin are not included.
Filter between Responded / Unresponded User Posts and Questions and see what Posts and Questions wait to be answered
Analyzing Facebook
25ANALYTICS GUIDE BY SOCIALBAKERS
Statistics Social Media Resources CompanyBlogProduct & Solutions
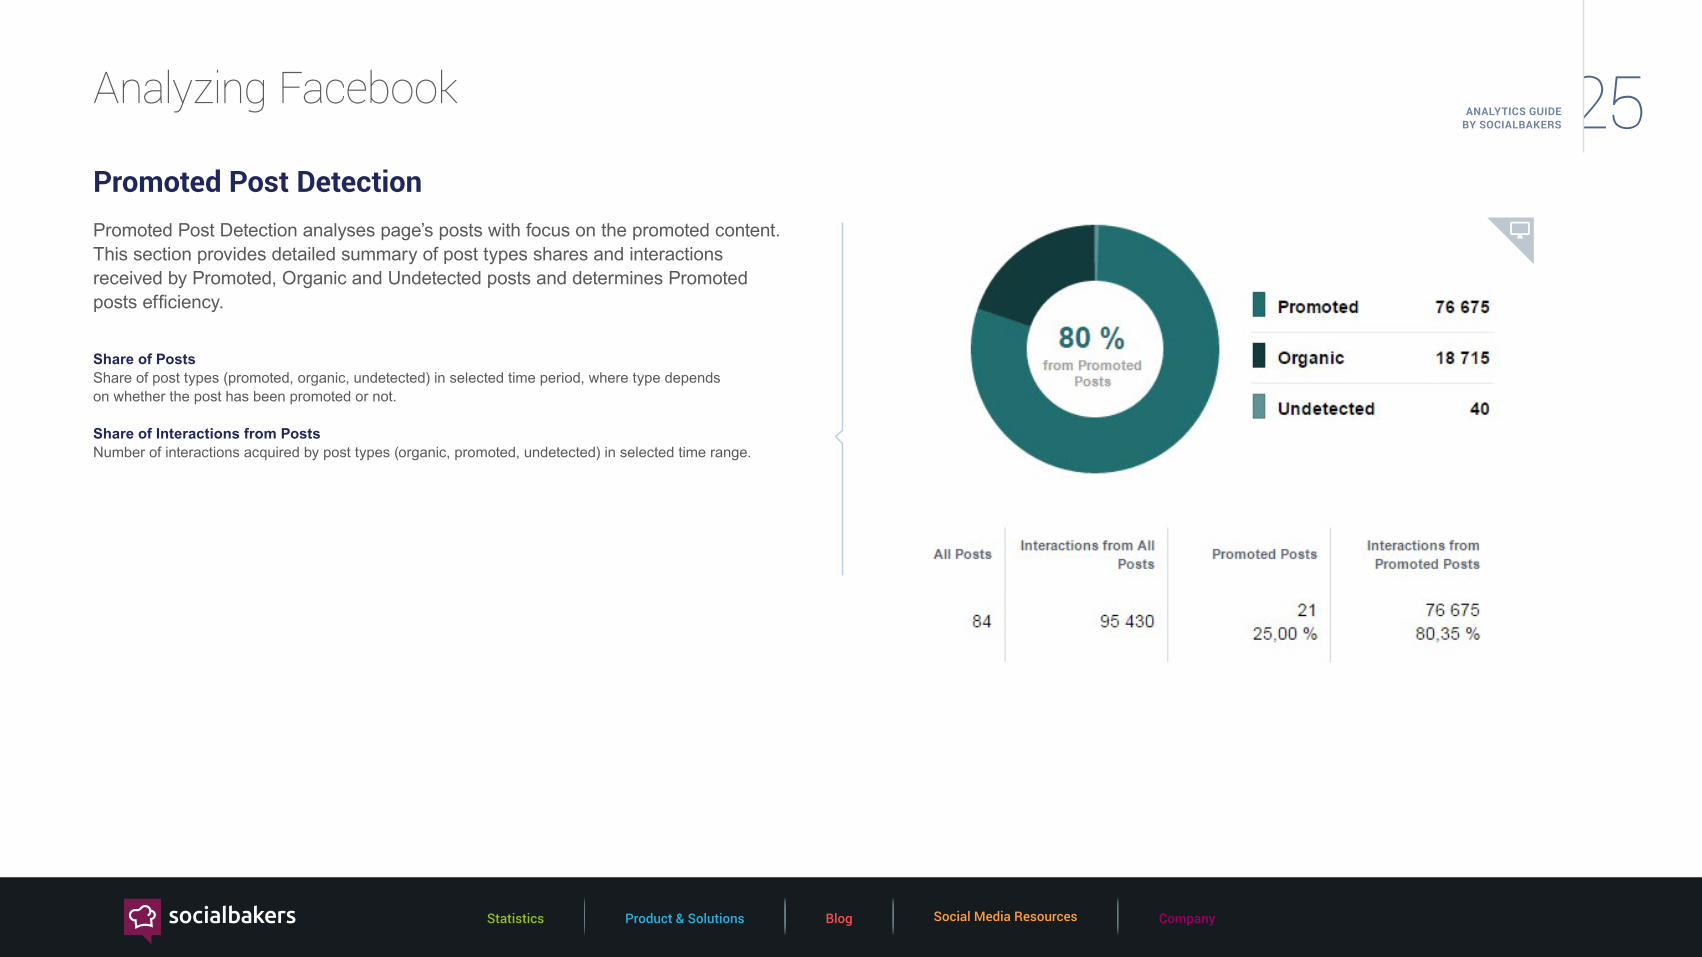
Promoted Post DetectionPromoted Post Detection analyses page’s posts with focus on the promoted content. This section provides detailed summary of post types shares and interactions received by Promoted, Organic and Undetected posts and determines Promoted posts efficiency.
Share of PostsShare of post types (promoted, organic, undetected) in selected time period, where type depends on whether the post has been promoted or not.
Share of Interactions from PostsNumber of interactions acquired by post types (organic, promoted, undetected) in selected time range.
Analyzing Facebook
26ANALYTICS GUIDE BY SOCIALBAKERS
Statistics Social Media Resources CompanyBlogProduct & Solutions
Analyzing Facebook
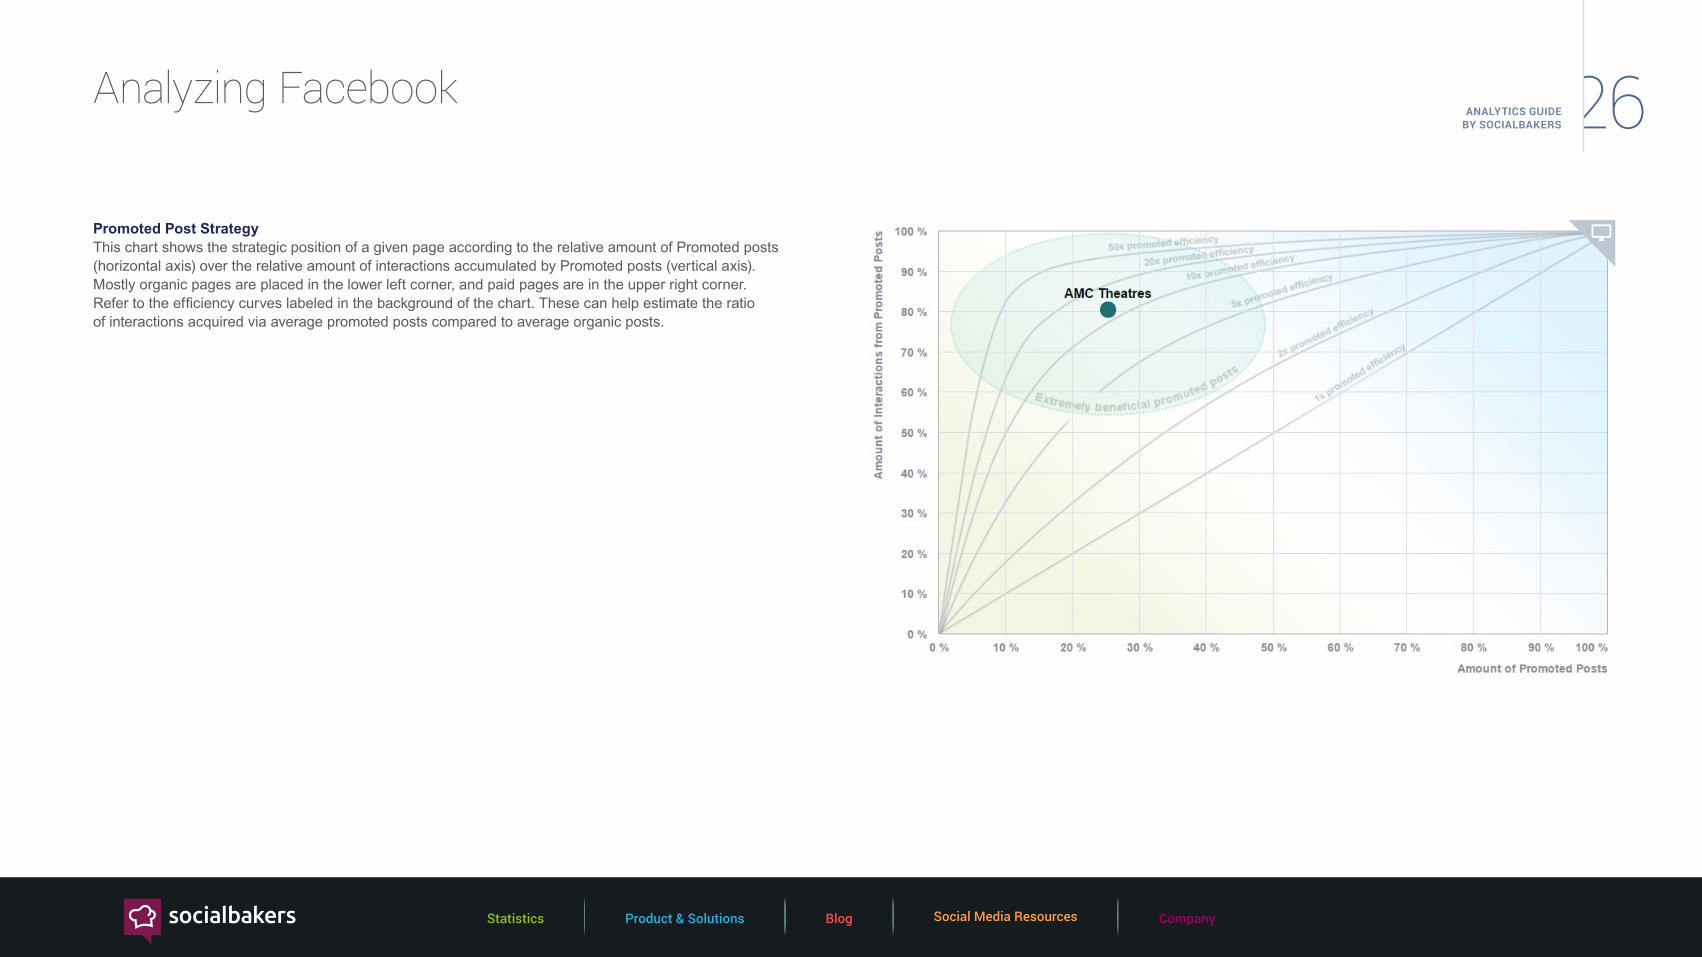
Promoted Post StrategyThis chart shows the strategic position of a given page according to the relative amount of Promoted posts (horizontal axis) over the relative amount of interactions accumulated by Promoted posts (vertical axis). Mostly organic pages are placed in the lower left corner, and paid pages are in the upper right corner. Refer to the efficiency curves labeled in the background of the chart. These can help estimate the ratio of interactions acquired via average promoted posts compared to average organic posts.
27ANALYTICS GUIDE BY SOCIALBAKERS
Statistics Social Media Resources CompanyBlogProduct & Solutions
Analyzing Facebook
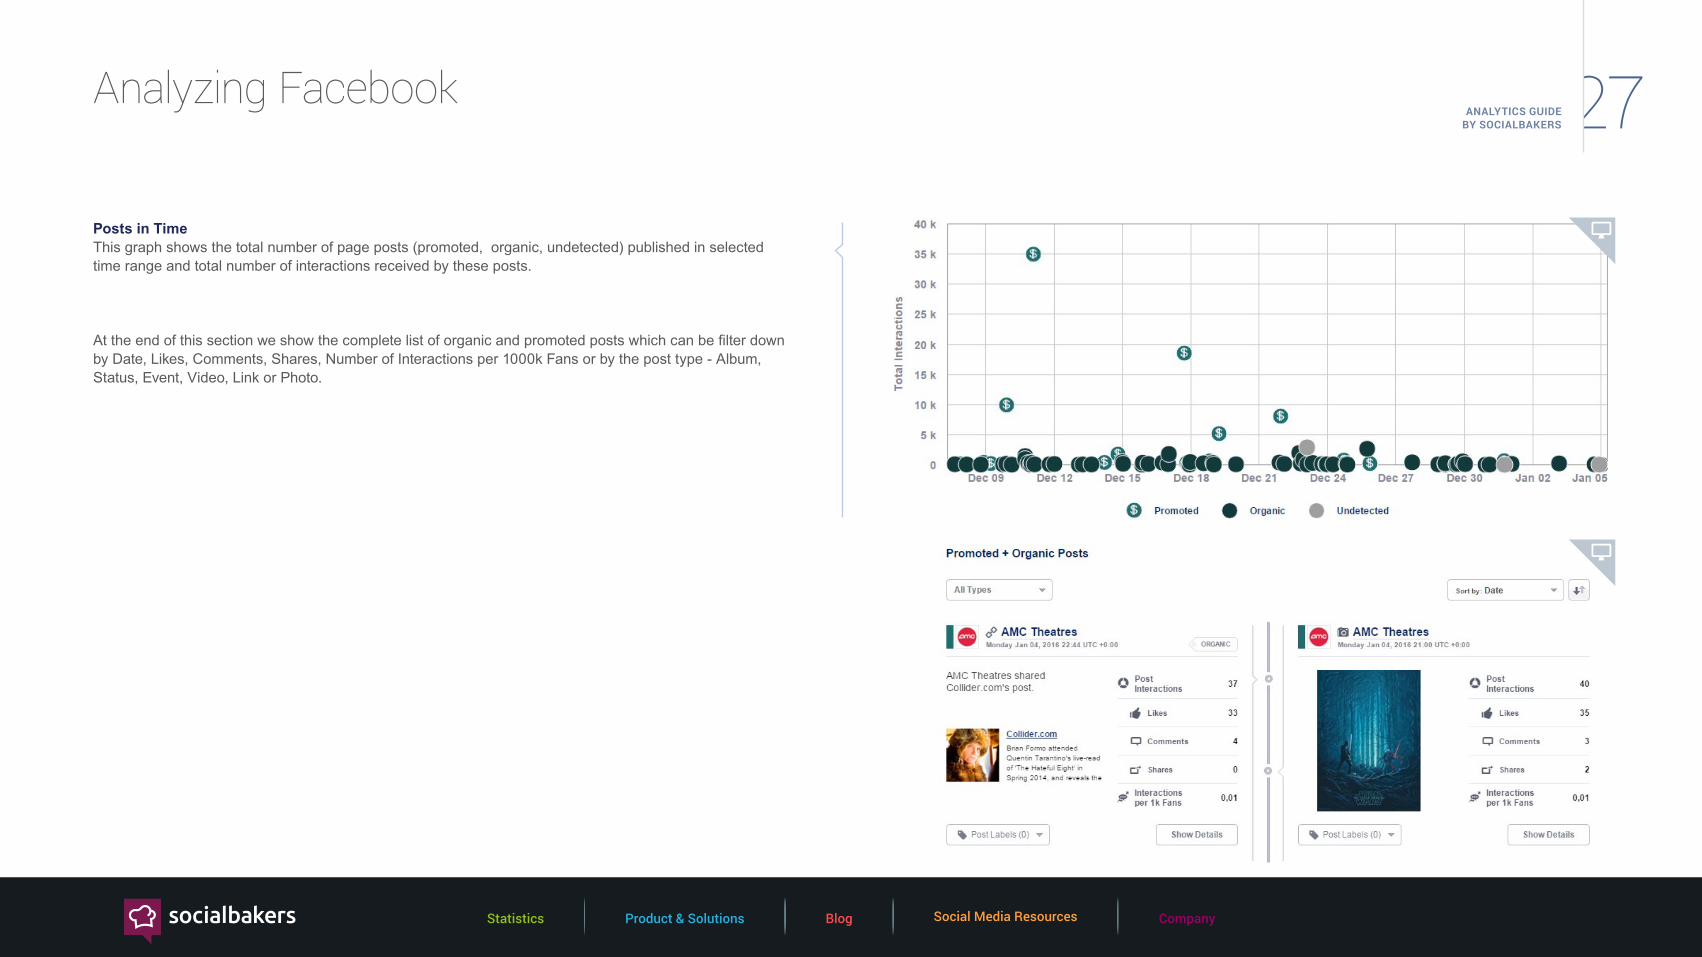
Posts in TimeThis graph shows the total number of page posts (promoted, organic, undetected) published in selected time range and total number of interactions received by these posts.
At the end of this section we show the complete list of organic and promoted posts which can be filter down by Date, Likes, Comments, Shares, Number of Interactions per 1000k Fans or by the post type - Album, Status, Event, Video, Link or Photo.
28ANALYTICS GUIDE BY SOCIALBAKERS
Statistics Social Media Resources CompanyBlogProduct & Solutions
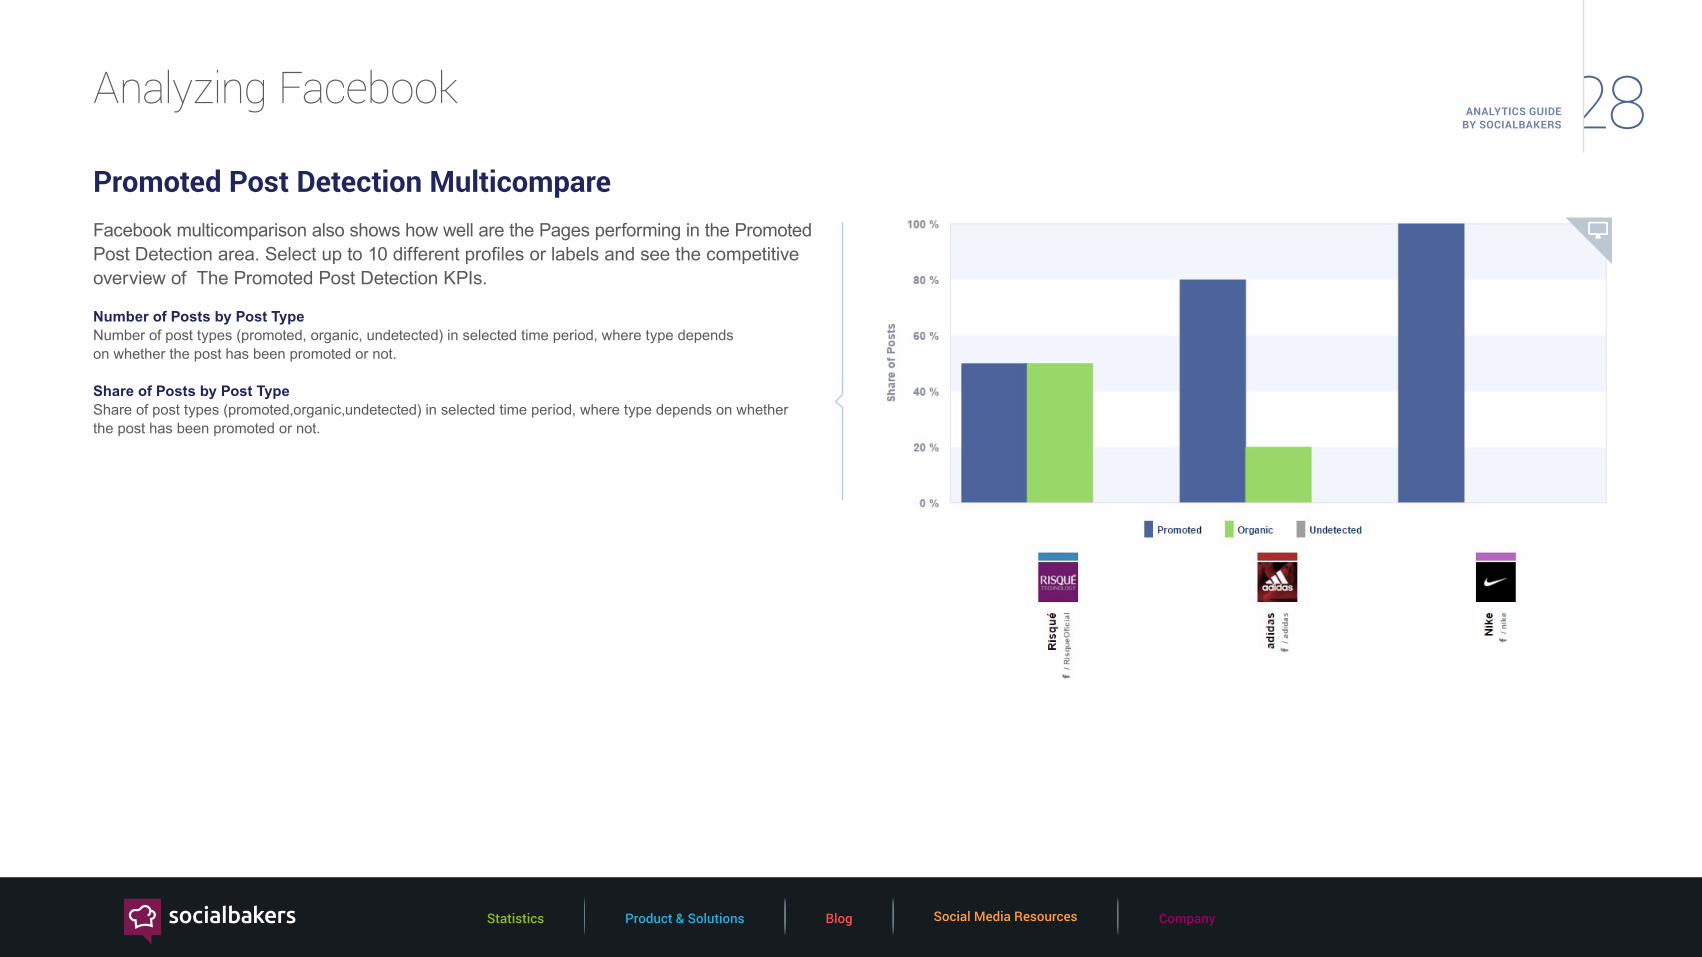
Promoted Post Detection MulticompareFacebook multicomparison also shows how well are the Pages performing in the Promoted Post Detection area. Select up to 10 different profiles or labels and see the competitive overview of The Promoted Post Detection KPIs.
Number of Posts by Post TypeNumber of post types (promoted, organic, undetected) in selected time period, where type depends on whether the post has been promoted or not.
Share of Posts by Post TypeShare of post types (promoted,organic,undetected) in selected time period, where type depends on whether the post has been promoted or not.
Analyzing Facebook
29ANALYTICS GUIDE BY SOCIALBAKERS
Statistics Social Media Resources CompanyBlogProduct & Solutions
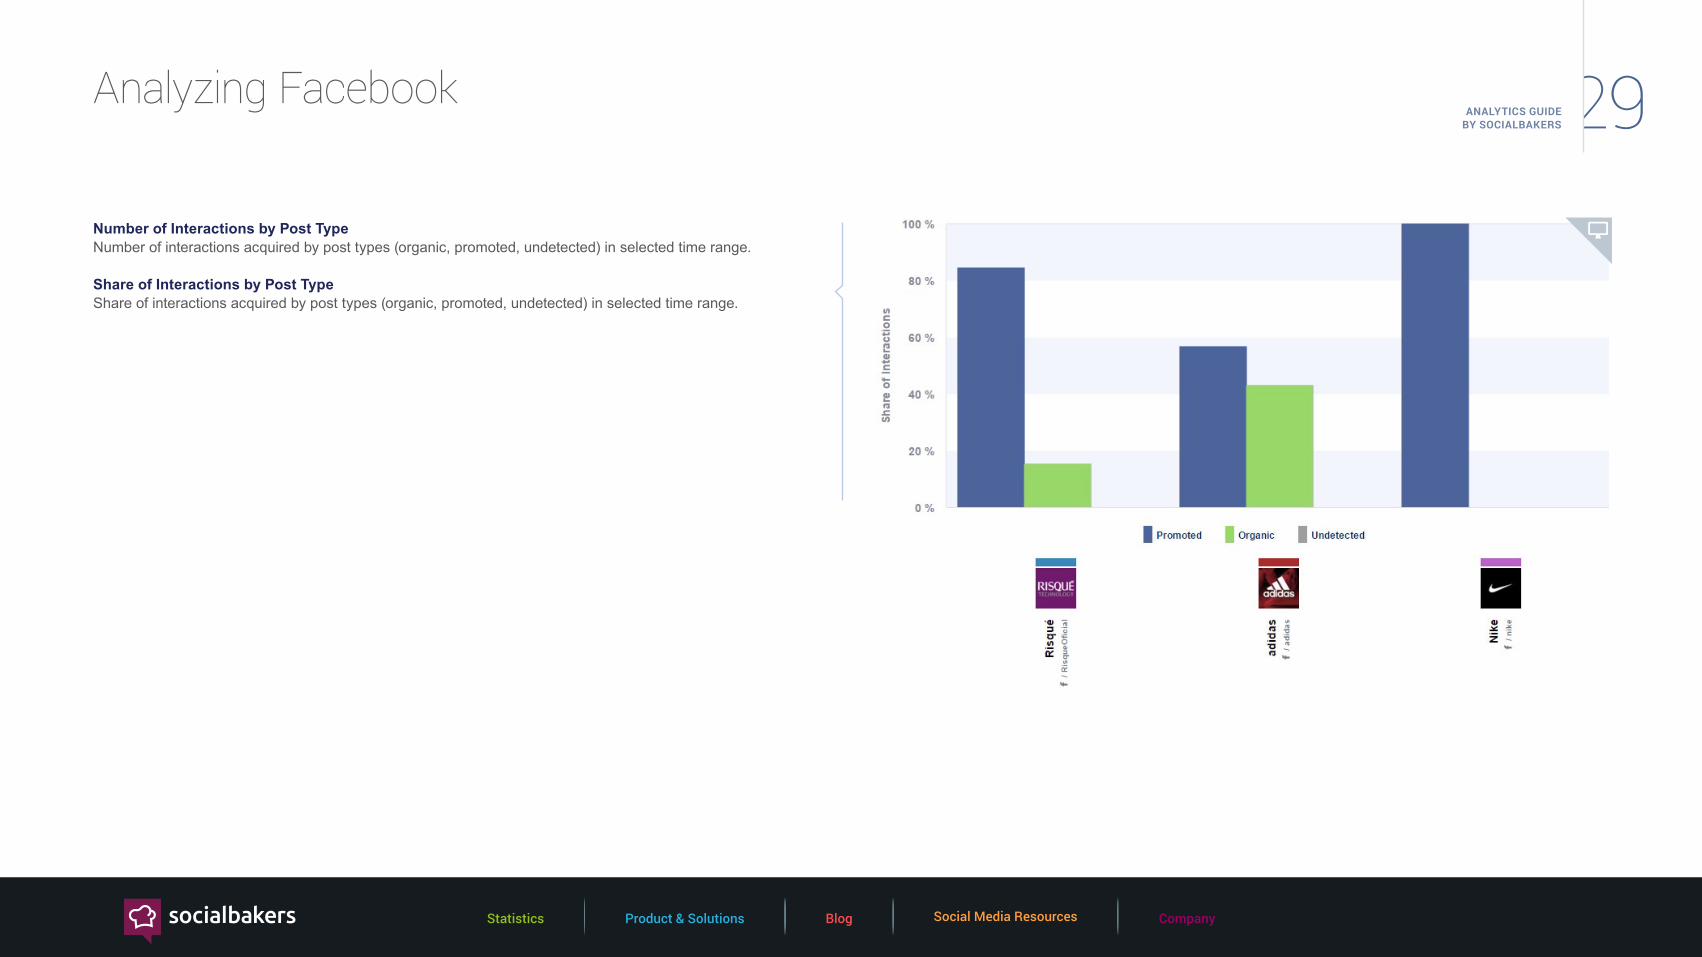
Number of Interactions by Post TypeNumber of interactions acquired by post types (organic, promoted, undetected) in selected time range.
Share of Interactions by Post TypeShare of interactions acquired by post types (organic, promoted, undetected) in selected time range.
Analyzing Facebook
30ANALYTICS GUIDE BY SOCIALBAKERS
Statistics Social Media Resources CompanyBlogProduct & Solutions
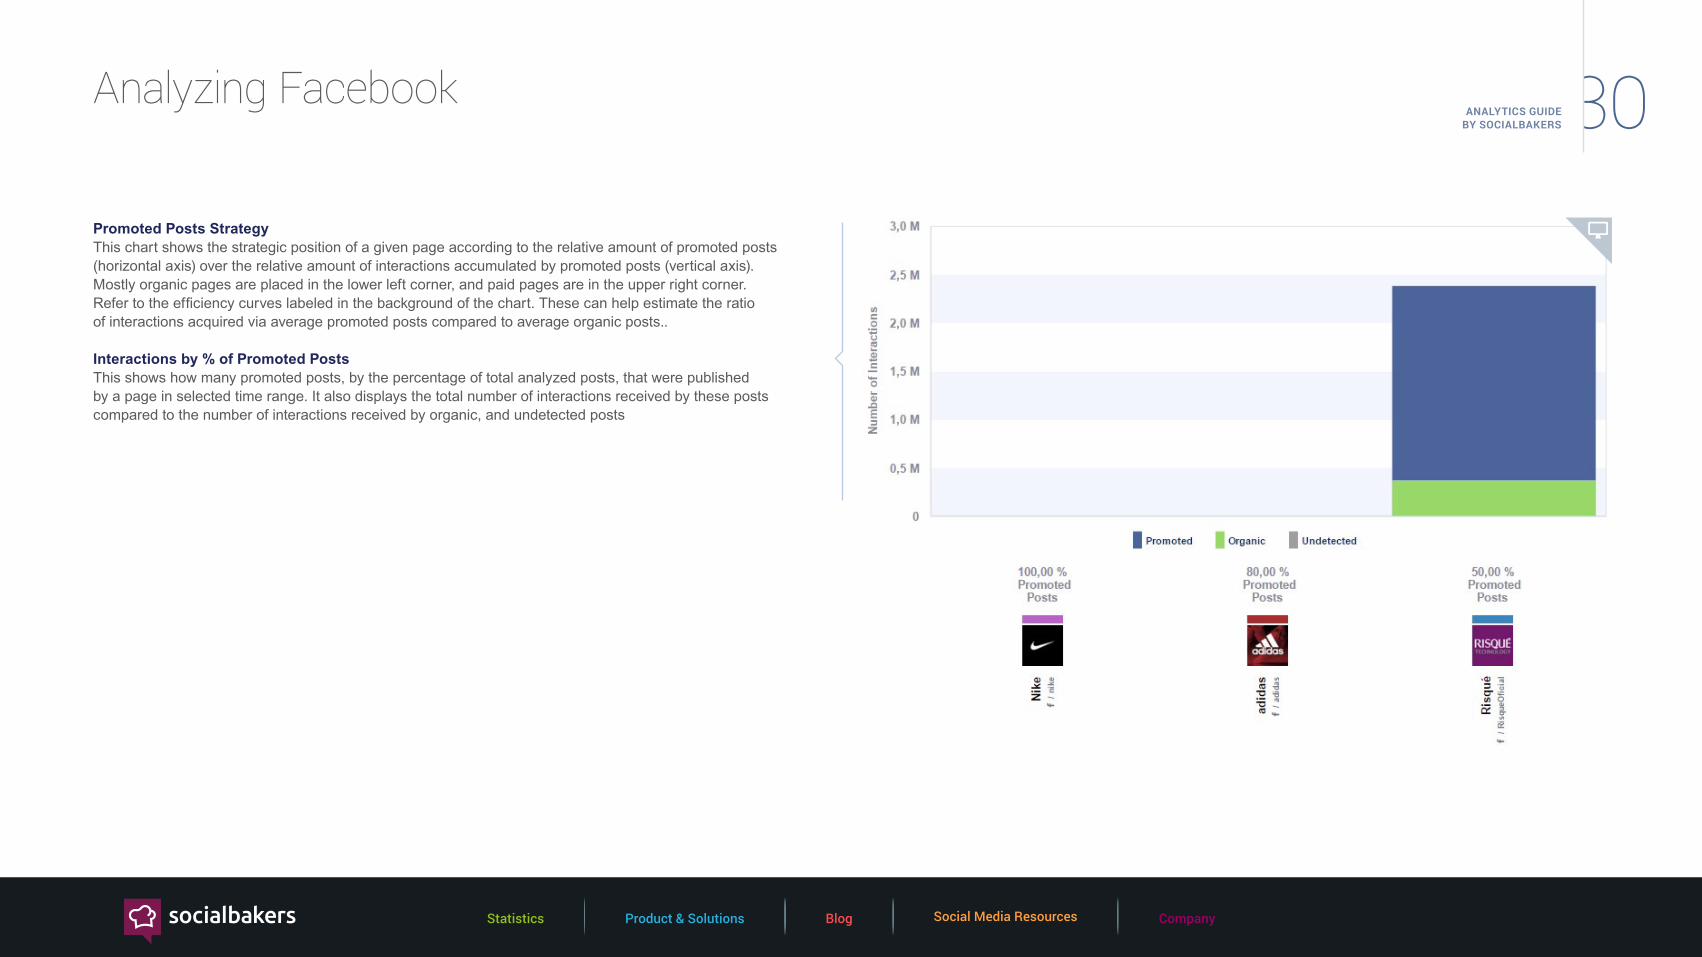
Promoted Posts StrategyThis chart shows the strategic position of a given page according to the relative amount of promoted posts (horizontal axis) over the relative amount of interactions accumulated by promoted posts (vertical axis). Mostly organic pages are placed in the lower left corner, and paid pages are in the upper right corner. Refer to the efficiency curves labeled in the background of the chart. These can help estimate the ratio of interactions acquired via average promoted posts compared to average organic posts..
Interactions by % of Promoted PostsThis shows how many promoted posts, by the percentage of total analyzed posts, that were published by a page in selected time range. It also displays the total number of interactions received by these posts compared to the number of interactions received by organic, and undetected posts
Analyzing Facebook
31ANALYTICS GUIDE BY SOCIALBAKERS
Statistics Social Media Resources CompanyBlogProduct & Solutions
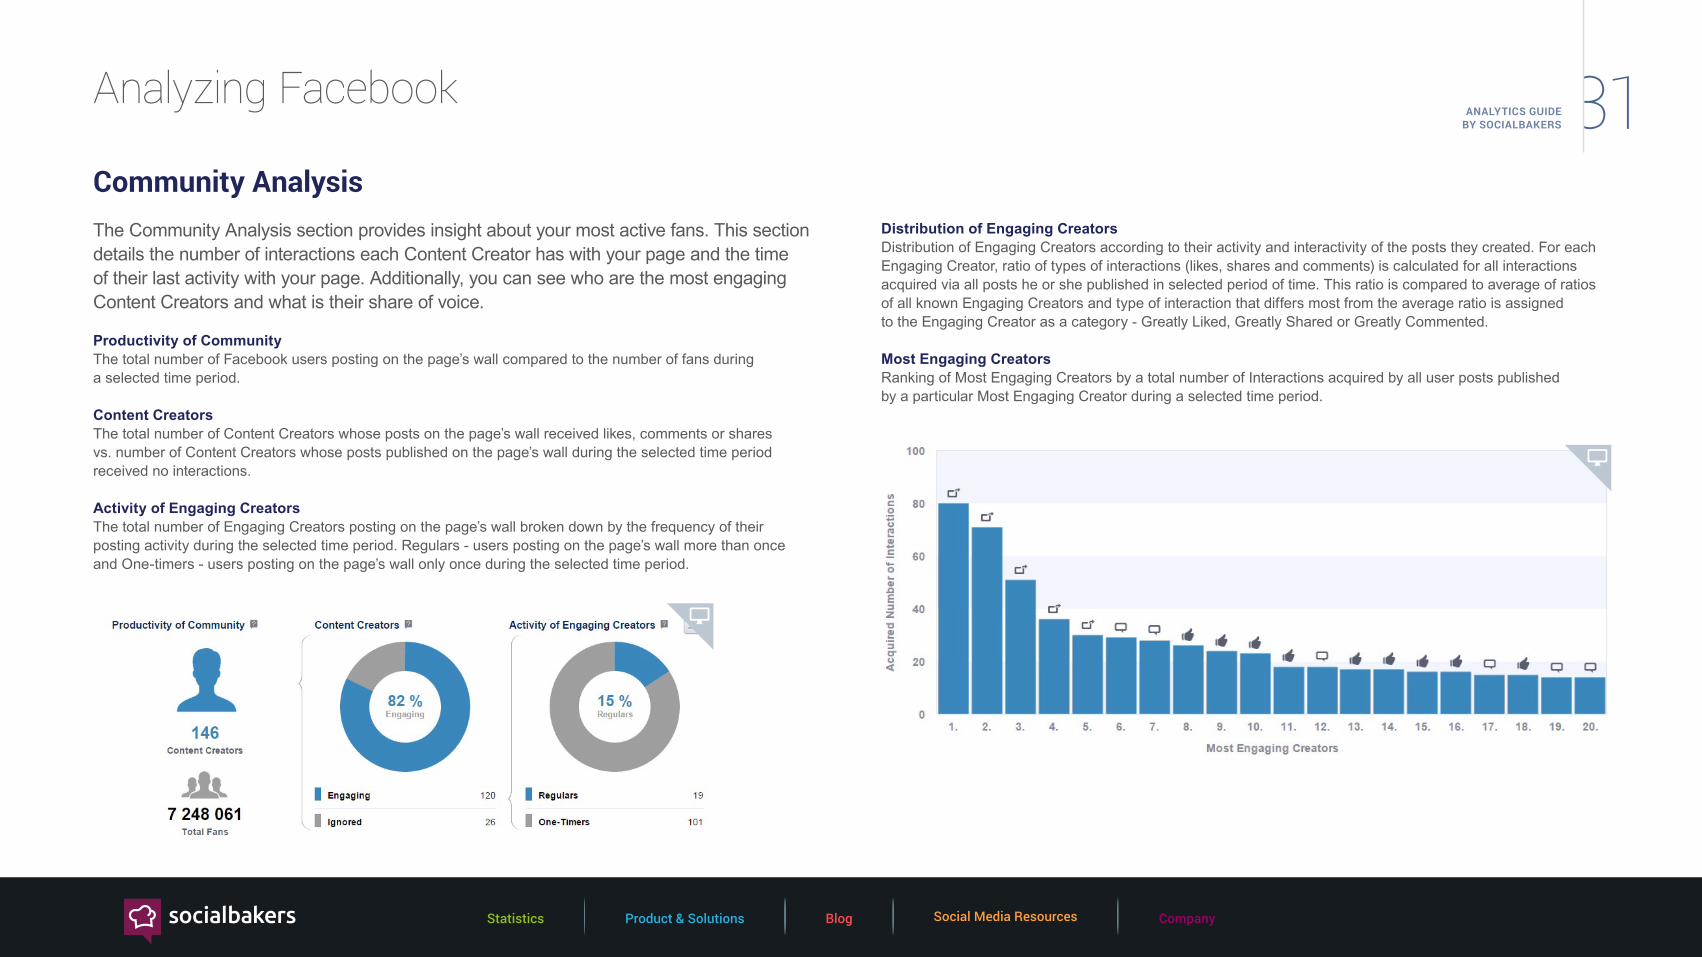
Community AnalysisThe Community Analysis section provides insight about your most active fans. This section details the number of interactions each Content Creator has with your page and the time of their last activity with your page. Additionally, you can see who are the most engaging Content Creators and what is their share of voice.
Productivity of CommunityThe total number of Facebook users posting on the page’s wall compared to the number of fans during a selected time period.
Content CreatorsThe total number of Content Creators whose posts on the page’s wall received likes, comments or shares vs. number of Content Creators whose posts published on the page’s wall during the selected time period received no interactions.
Activity of Engaging Creators The total number of Engaging Creators posting on the page’s wall broken down by the frequency of their posting activity during the selected time period. Regulars - users posting on the page’s wall more than once and One-timers - users posting on the page’s wall only once during the selected time period.
Distribution of Engaging CreatorsDistribution of Engaging Creators according to their activity and interactivity of the posts they created. For each Engaging Creator, ratio of types of interactions (likes, shares and comments) is calculated for all interactions acquired via all posts he or she published in selected period of time. This ratio is compared to average of ratios of all known Engaging Creators and type of interaction that differs most from the average ratio is assigned to the Engaging Creator as a category - Greatly Liked, Greatly Shared or Greatly Commented.
Most Engaging CreatorsRanking of Most Engaging Creators by a total number of Interactions acquired by all user posts published by a particular Most Engaging Creator during a selected time period.
Analyzing Facebook
32ANALYTICS GUIDE BY SOCIALBAKERS
Statistics Social Media Resources CompanyBlogProduct & Solutions
Analyzing Facebook
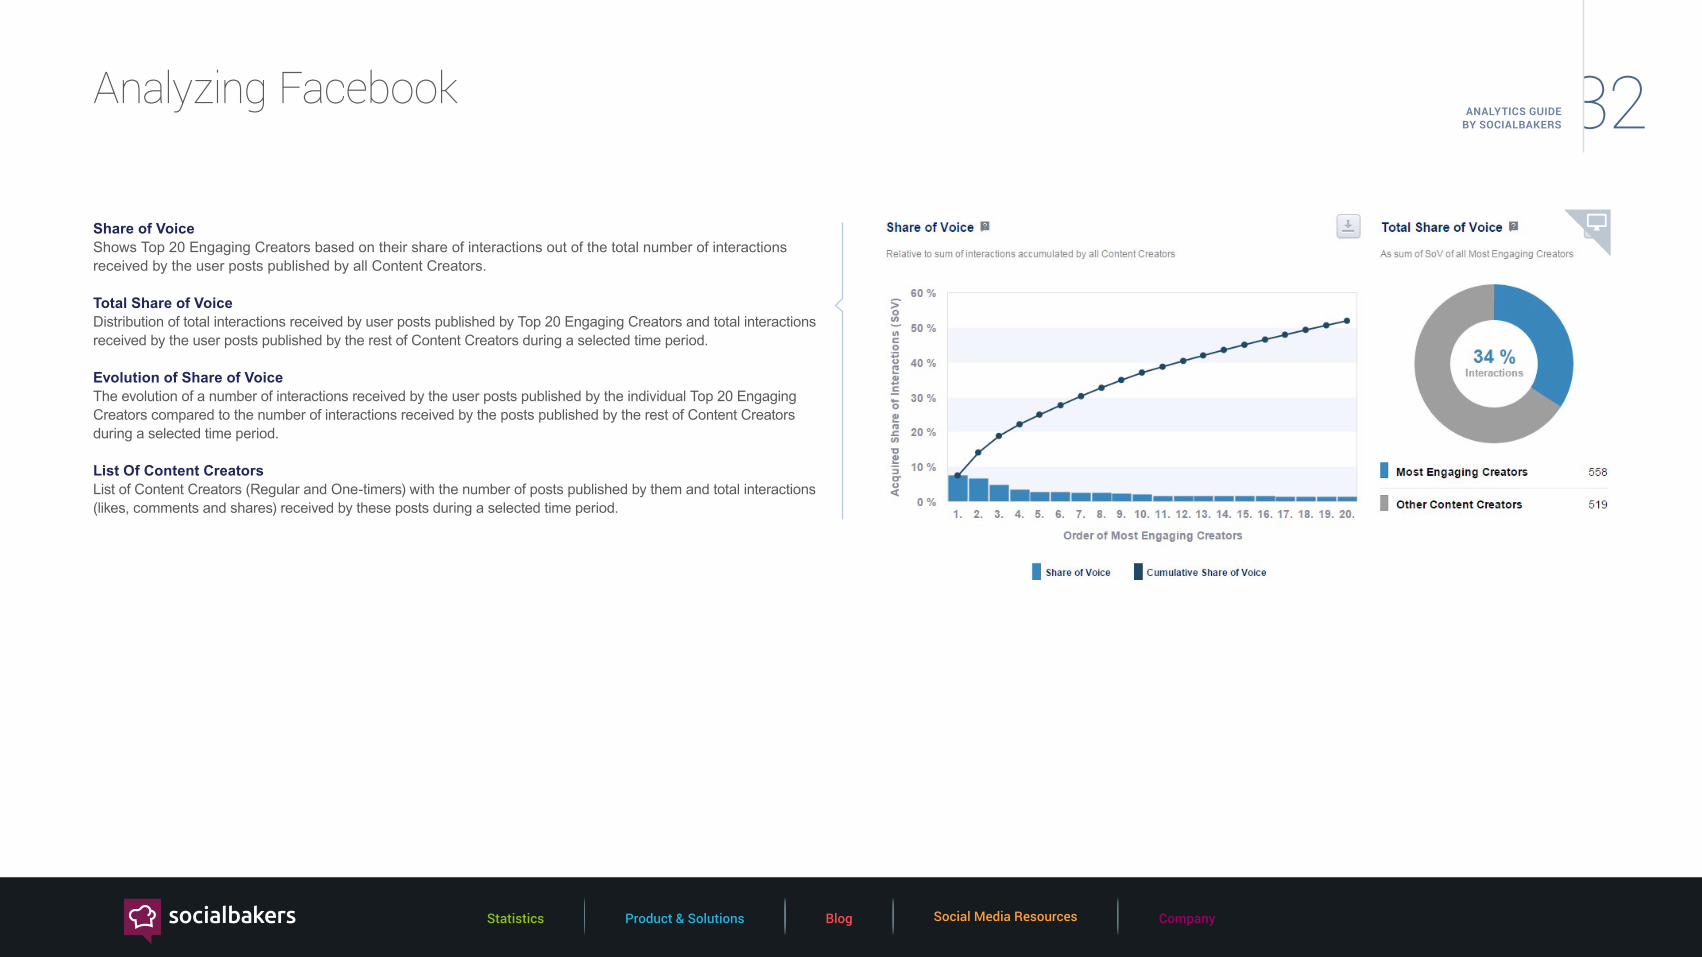
Share of VoiceShows Top 20 Engaging Creators based on their share of interactions out of the total number of interactions received by the user posts published by all Content Creators.
Total Share of VoiceDistribution of total interactions received by user posts published by Top 20 Engaging Creators and total interactions received by the user posts published by the rest of Content Creators during a selected time period.
Evolution of Share of VoiceThe evolution of a number of interactions received by the user posts published by the individual Top 20 Engaging Creators compared to the number of interactions received by the posts published by the rest of Content Creators during a selected time period.
List Of Content CreatorsList of Content Creators (Regular and One-timers) with the number of posts published by them and total interactions (likes, comments and shares) received by these posts during a selected time period.
33ANALYTICS GUIDE BY SOCIALBAKERS
Statistics Social Media Resources CompanyBlogProduct & Solutions
Facebook Insights bring the page administrators valuable perspective on the performance of the Pages they manage. Socialbakers Analytics allows integration of the Insights data to offer greater detail of Page analysis for the Pages you admin.This can be done easily. Select the page you administer and monitor in Socialbakers Analytics and ...
AnalyzingFacebook Insights
withSocialbakers Analytics
34ANALYTICS GUIDE BY SOCIALBAKERS
Statistics Social Media Resources CompanyBlogProduct & Solutions
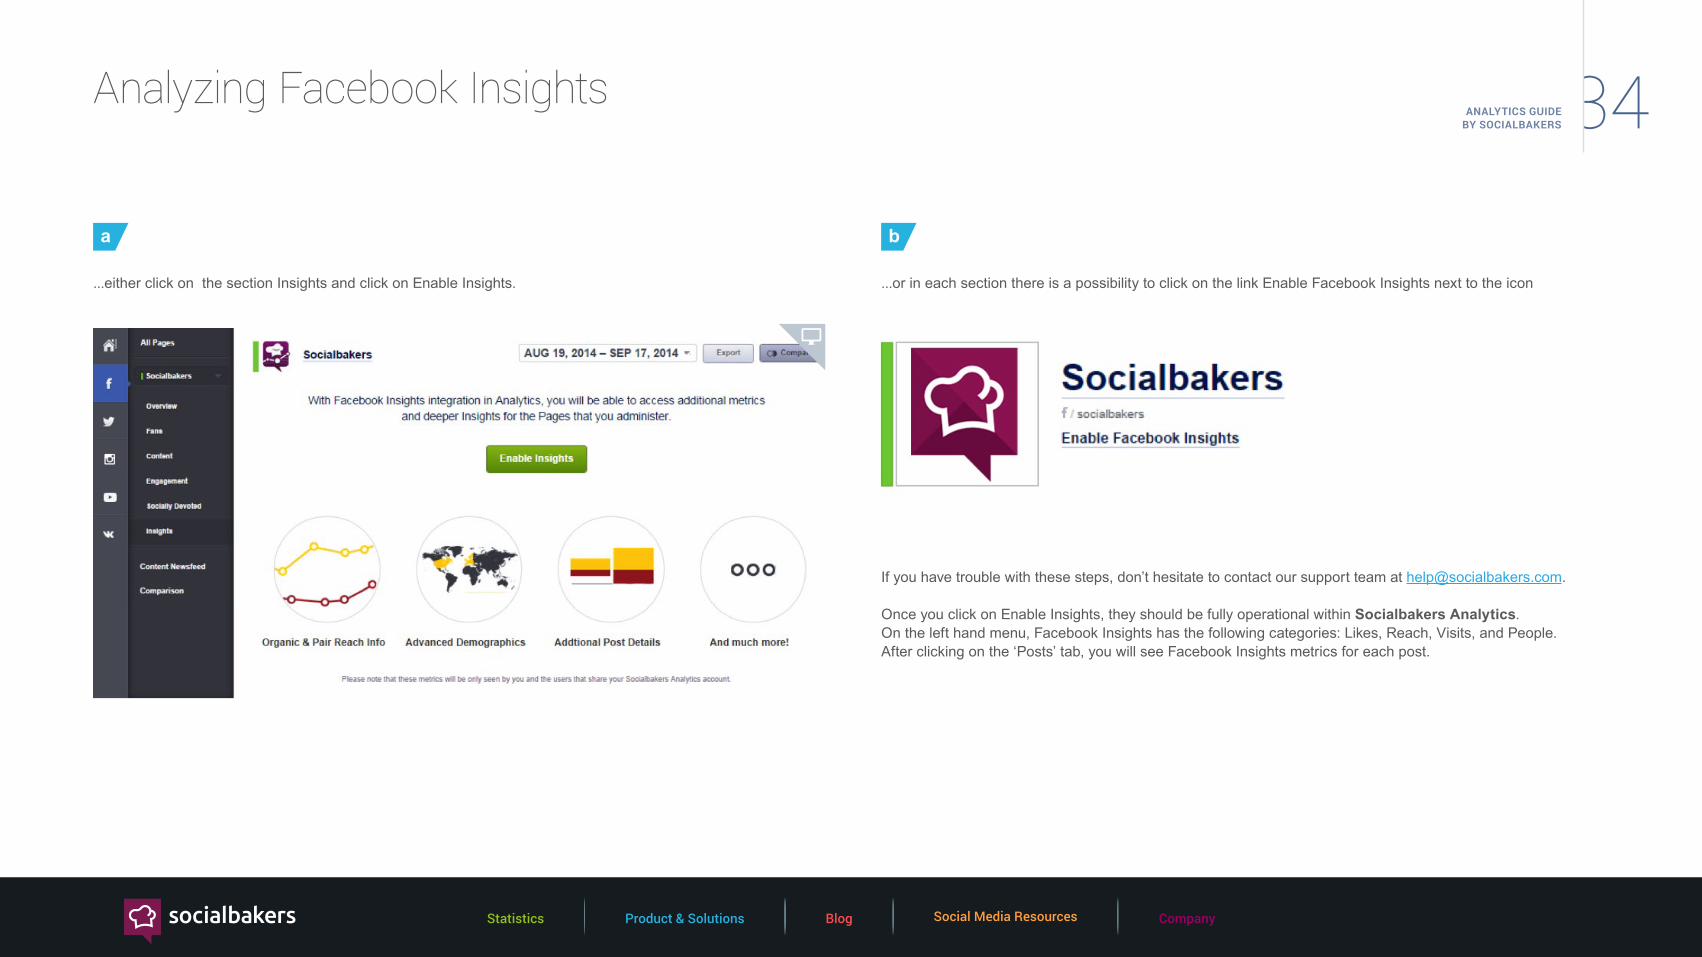
...either click on the section Insights and click on Enable Insights. ...or in each section there is a possibility to click on the link Enable Facebook Insights next to the icon
Analyzing Facebook Insights
a b
If you have trouble with these steps, don’t hesitate to contact our support team at [email protected].
Once you click on Enable Insights, they should be fully operational within Socialbakers Analytics. On the left hand menu, Facebook Insights has the following categories: Likes, Reach, Visits, and People. After clicking on the ‘Posts’ tab, you will see Facebook Insights metrics for each post.
35ANALYTICS GUIDE BY SOCIALBAKERS
Statistics Social Media Resources CompanyBlogProduct & Solutions
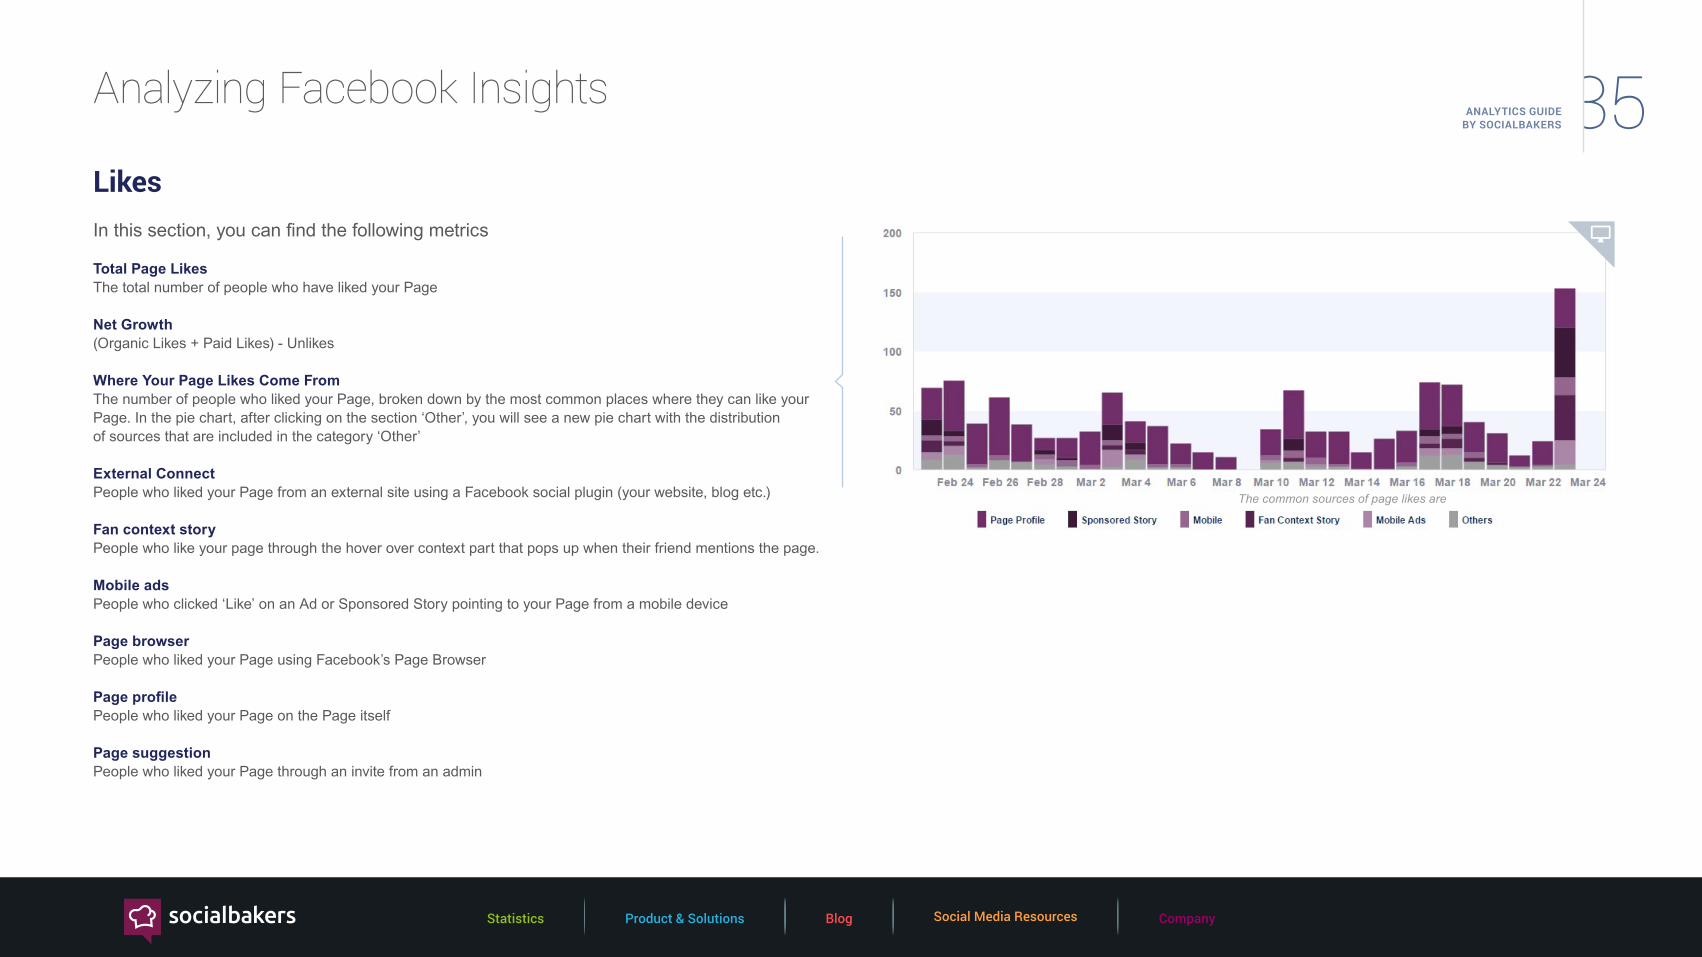
LikesIn this section, you can find the following metrics
Total Page LikesThe total number of people who have liked your Page
Net Growth(Organic Likes + Paid Likes) - Unlikes
Where Your Page Likes Come FromThe number of people who liked your Page, broken down by the most common places where they can like your Page. In the pie chart, after clicking on the section ‘Other’, you will see a new pie chart with the distribution of sources that are included in the category ‘Other’
External ConnectPeople who liked your Page from an external site using a Facebook social plugin (your website, blog etc.)
Fan context storyPeople who like your page through the hover over context part that pops up when their friend mentions the page.
Mobile ads People who clicked ‘Like’ on an Ad or Sponsored Story pointing to your Page from a mobile device
Page browser People who liked your Page using Facebook’s Page Browser
Page profile People who liked your Page on the Page itself
Page suggestion People who liked your Page through an invite from an admin
The common sources of page likes are
Analyzing Facebook Insights
36ANALYTICS GUIDE BY SOCIALBAKERS
Statistics Social Media Resources CompanyBlogProduct & Solutions
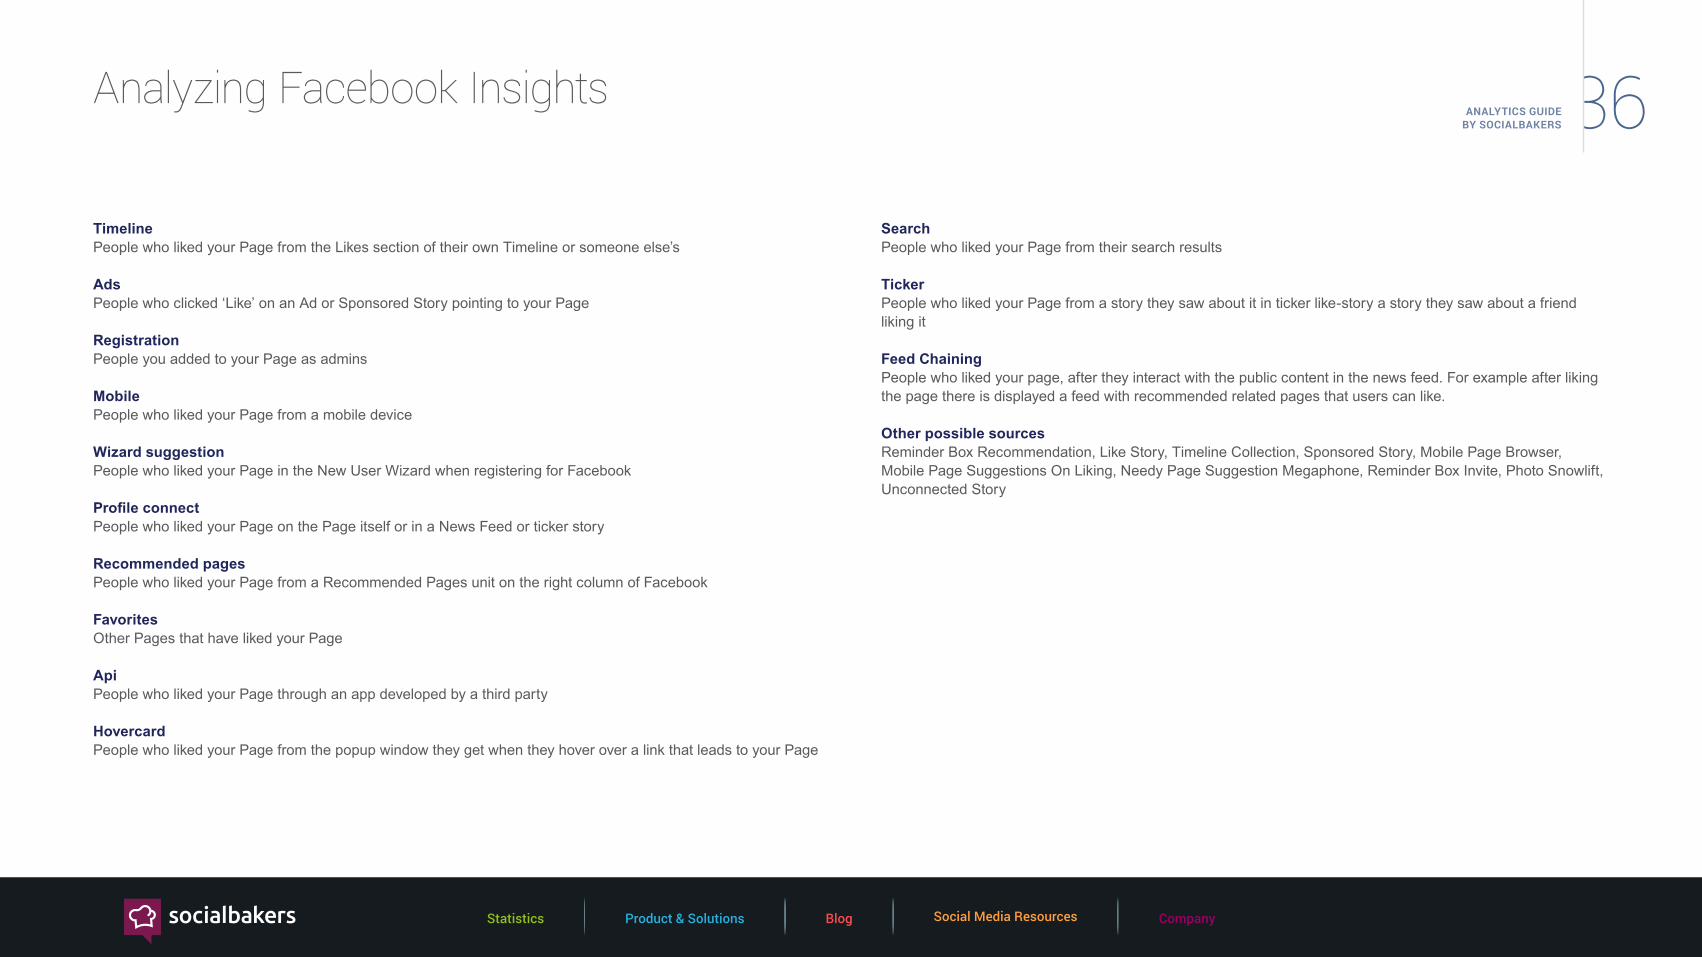
Timeline People who liked your Page from the Likes section of their own Timeline or someone else’s
Ads People who clicked ‘Like’ on an Ad or Sponsored Story pointing to your Page
Registration People you added to your Page as admins
Mobile People who liked your Page from a mobile device
Wizard suggestion People who liked your Page in the New User Wizard when registering for Facebook
Profile connect People who liked your Page on the Page itself or in a News Feed or ticker story
Recommended pages People who liked your Page from a Recommended Pages unit on the right column of Facebook
Favorites Other Pages that have liked your Page
Api People who liked your Page through an app developed by a third party
Hovercard People who liked your Page from the popup window they get when they hover over a link that leads to your Page
Search People who liked your Page from their search results
Ticker People who liked your Page from a story they saw about it in ticker like-story a story they saw about a friend liking it
Feed Chaining People who liked your page, after they interact with the public content in the news feed. For example after liking the page there is displayed a feed with recommended related pages that users can like.
Other possible sources Reminder Box Recommendation, Like Story, Timeline Collection, Sponsored Story, Mobile Page Browser, Mobile Page Suggestions On Liking, Needy Page Suggestion Megaphone, Reminder Box Invite, Photo Snowlift, Unconnected Story
Analyzing Facebook Insights
37ANALYTICS GUIDE BY SOCIALBAKERS
Statistics Social Media Resources CompanyBlogProduct & Solutions
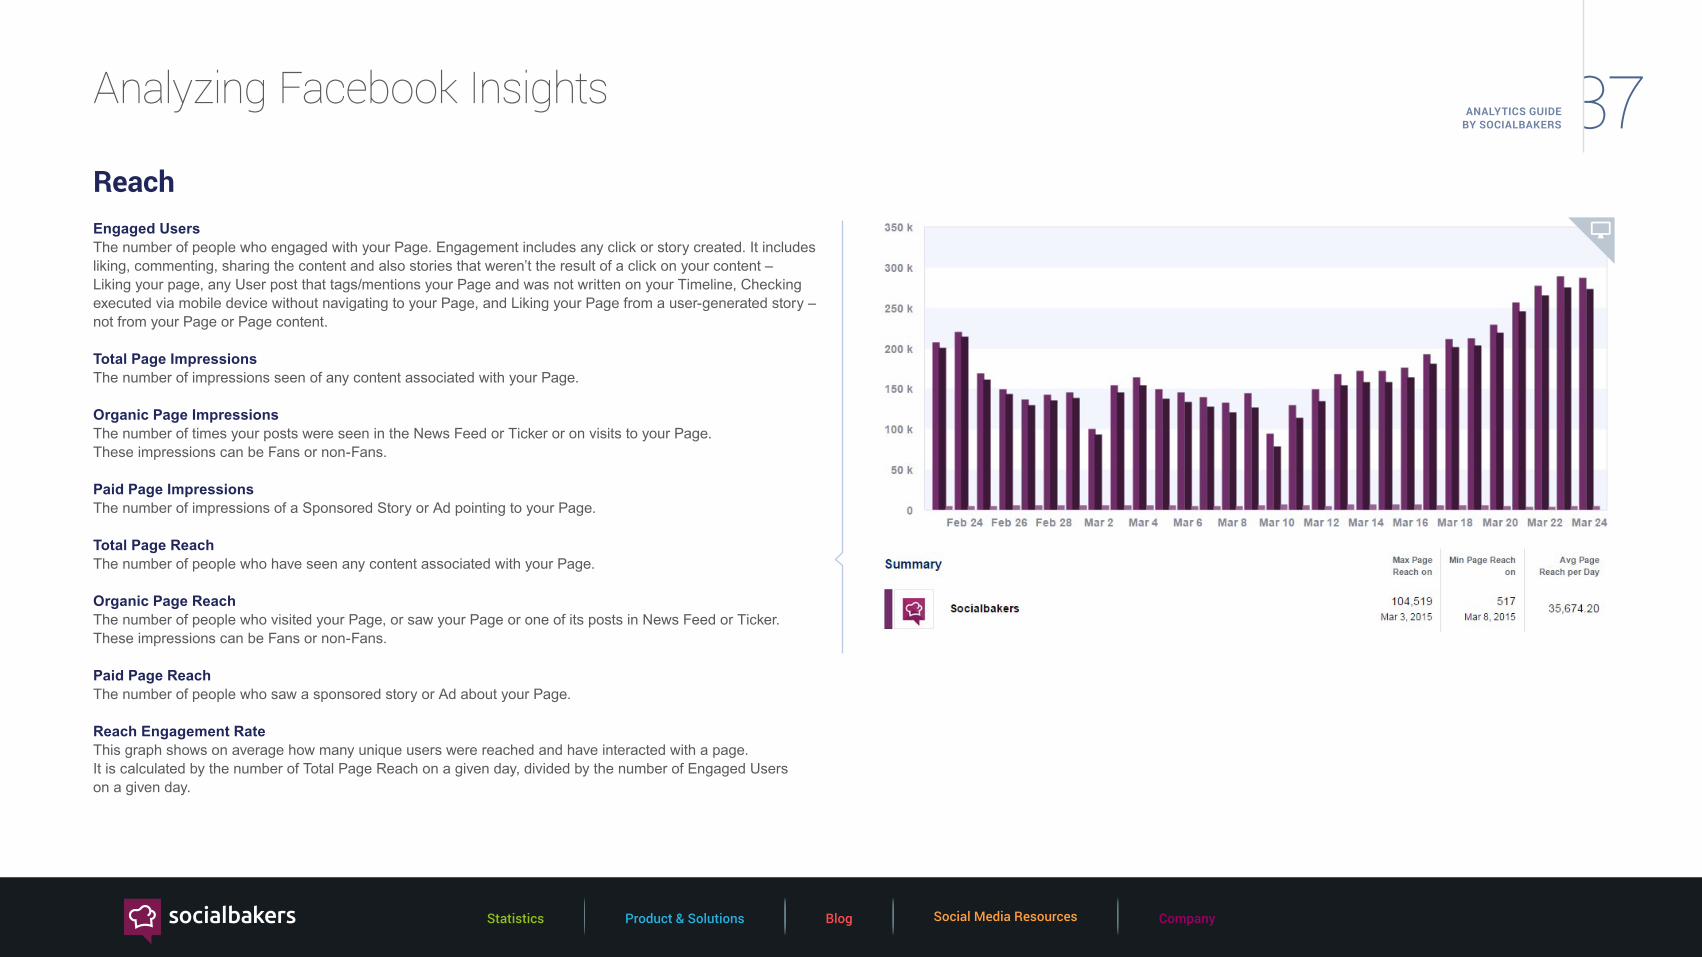
ReachEngaged Users The number of people who engaged with your Page. Engagement includes any click or story created. It includes liking, commenting, sharing the content and also stories that weren’t the result of a click on your content – Liking your page, any User post that tags/mentions your Page and was not written on your Timeline, Checking executed via mobile device without navigating to your Page, and Liking your Page from a user-generated story – not from your Page or Page content. Total Page Impressions The number of impressions seen of any content associated with your Page.
Organic Page Impressions The number of times your posts were seen in the News Feed or Ticker or on visits to your Page. These impressions can be Fans or non-Fans. Paid Page Impressions The number of impressions of a Sponsored Story or Ad pointing to your Page.
Total Page Reach The number of people who have seen any content associated with your Page.
Organic Page Reach The number of people who visited your Page, or saw your Page or one of its posts in News Feed or Ticker. These impressions can be Fans or non-Fans.
Paid Page Reach The number of people who saw a sponsored story or Ad about your Page.
Reach Engagement RateThis graph shows on average how many unique users were reached and have interacted with a page. It is calculated by the number of Total Page Reach on a given day, divided by the number of Engaged Users on a given day.
Analyzing Facebook Insights
38ANALYTICS GUIDE BY SOCIALBAKERS
Statistics Social Media Resources CompanyBlogProduct & Solutions
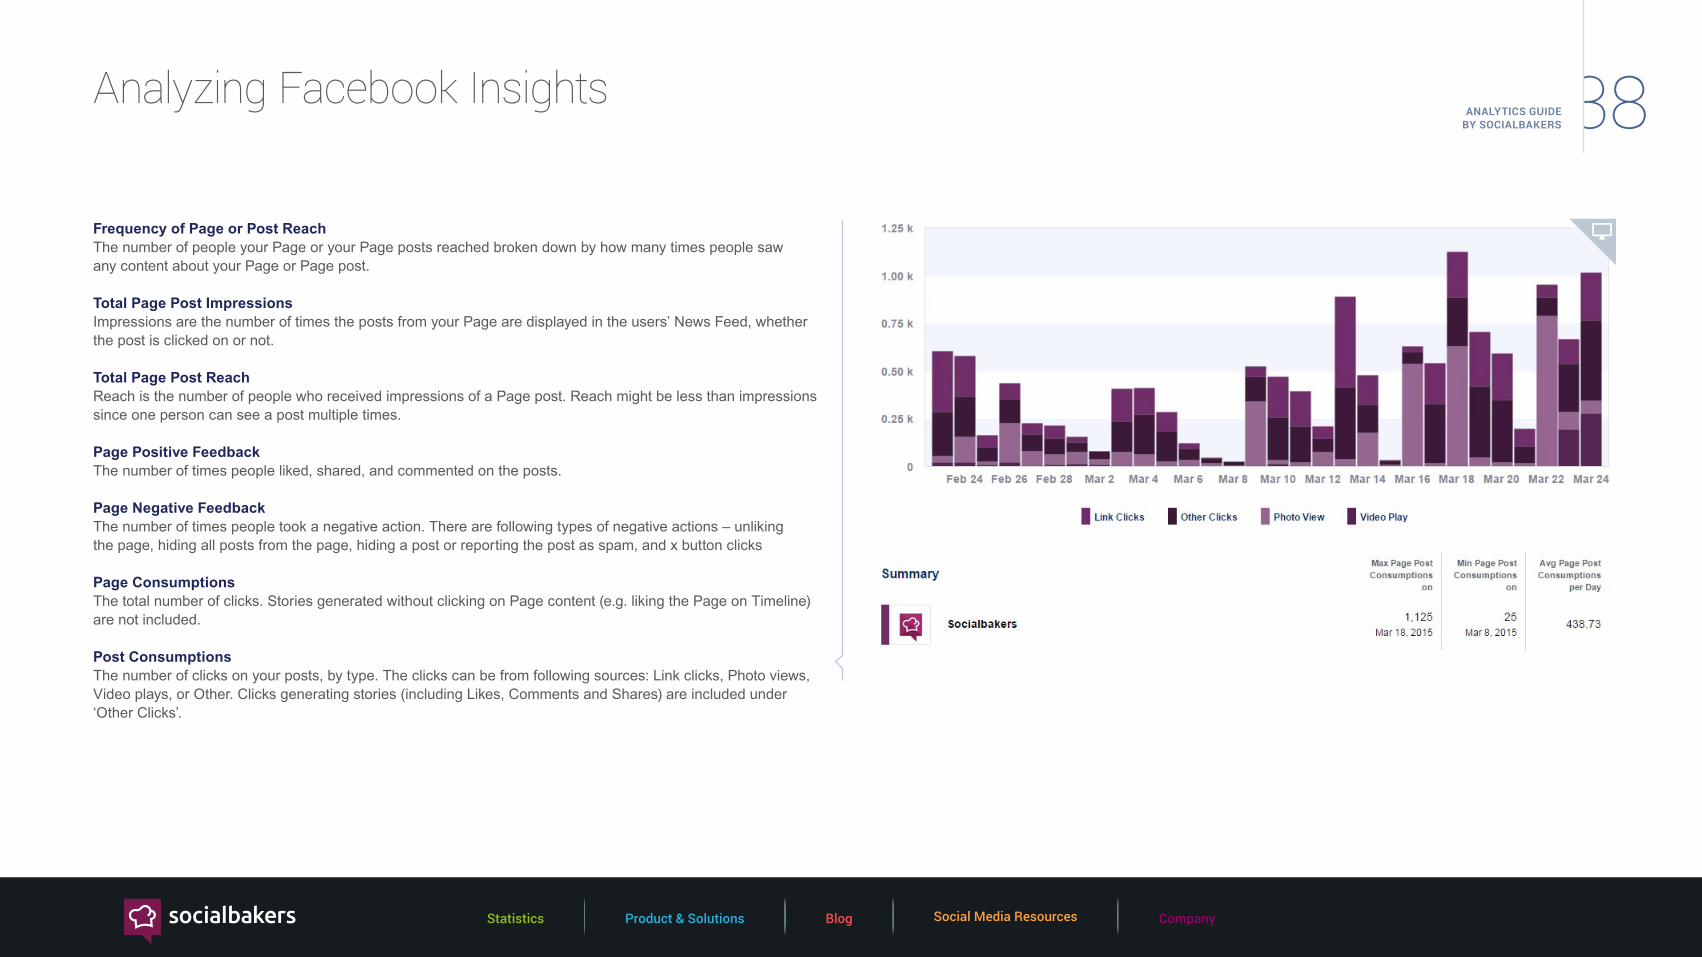
Frequency of Page or Post Reach The number of people your Page or your Page posts reached broken down by how many times people saw any content about your Page or Page post.
Total Page Post Impressions Impressions are the number of times the posts from your Page are displayed in the users’ News Feed, whether the post is clicked on or not.
Total Page Post ReachReach is the number of people who received impressions of a Page post. Reach might be less than impressions since one person can see a post multiple times.
Page Positive Feedback The number of times people liked, shared, and commented on the posts.
Page Negative Feedback The number of times people took a negative action. There are following types of negative actions – unliking the page, hiding all posts from the page, hiding a post or reporting the post as spam, and x button clicks
Page ConsumptionsThe total number of clicks. Stories generated without clicking on Page content (e.g. liking the Page on Timeline) are not included.
Post ConsumptionsThe number of clicks on your posts, by type. The clicks can be from following sources: Link clicks, Photo views, Video plays, or Other. Clicks generating stories (including Likes, Comments and Shares) are included under ‘Other Clicks’.
Analyzing Facebook Insights
39ANALYTICS GUIDE BY SOCIALBAKERS
Statistics Social Media Resources CompanyBlogProduct & Solutions
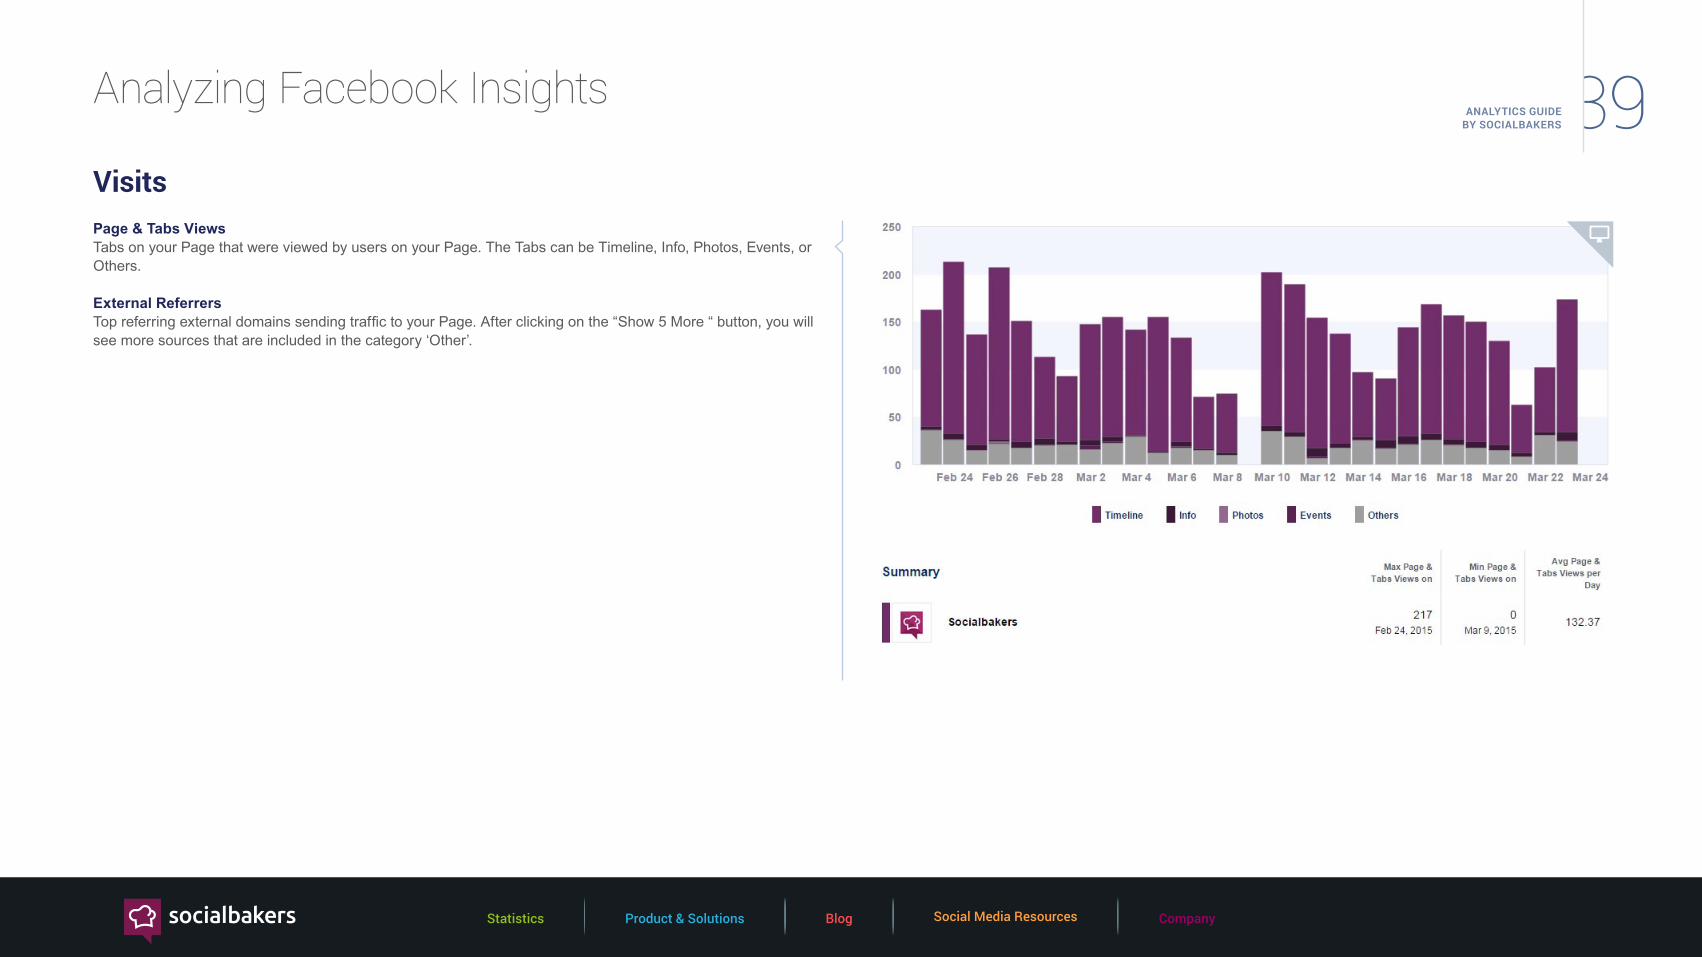
VisitsPage & Tabs Views Tabs on your Page that were viewed by users on your Page. The Tabs can be Timeline, Info, Photos, Events, or Others.
External Referrers Top referring external domains sending traffic to your Page. After clicking on the “Show 5 More “ button, you will see more sources that are included in the category ‘Other’.
Analyzing Facebook Insights
40ANALYTICS GUIDE BY SOCIALBAKERS
Statistics Social Media Resources CompanyBlogProduct & Solutions
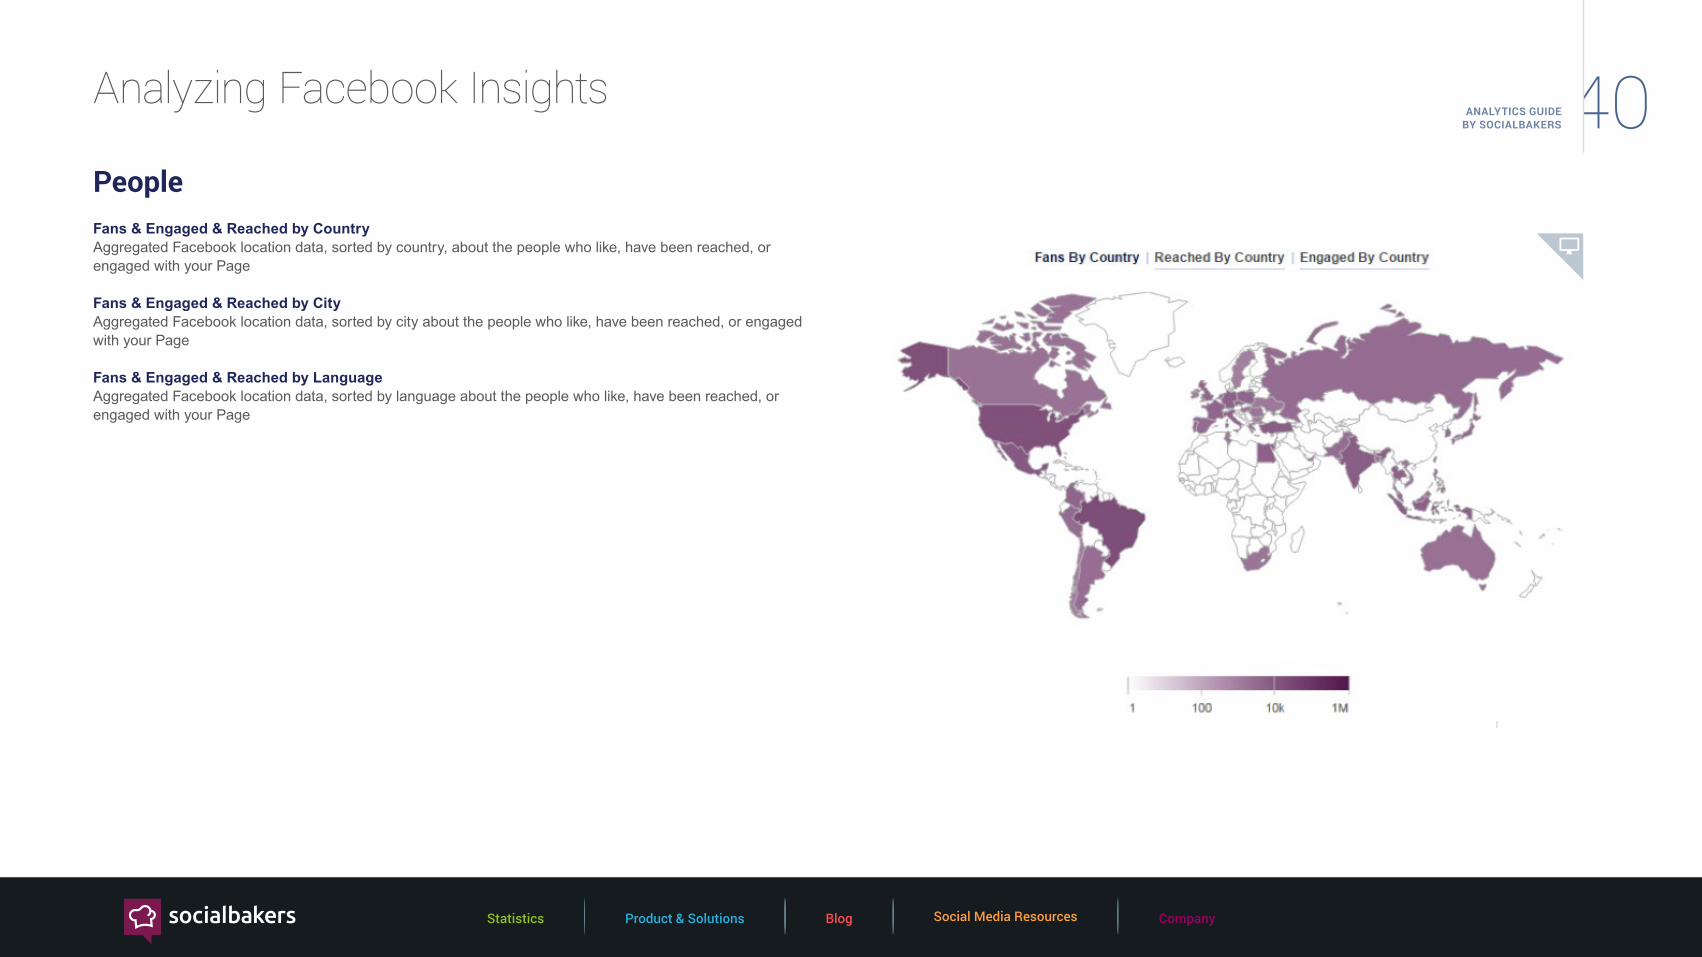
PeopleFans & Engaged & Reached by Country Aggregated Facebook location data, sorted by country, about the people who like, have been reached, or engaged with your Page
Fans & Engaged & Reached by City Aggregated Facebook location data, sorted by city about the people who like, have been reached, or engaged with your Page
Fans & Engaged & Reached by Language Aggregated Facebook location data, sorted by language about the people who like, have been reached, or engaged with your Page
Analyzing Facebook Insights
41ANALYTICS GUIDE BY SOCIALBAKERS
Statistics Social Media Resources CompanyBlogProduct & Solutions
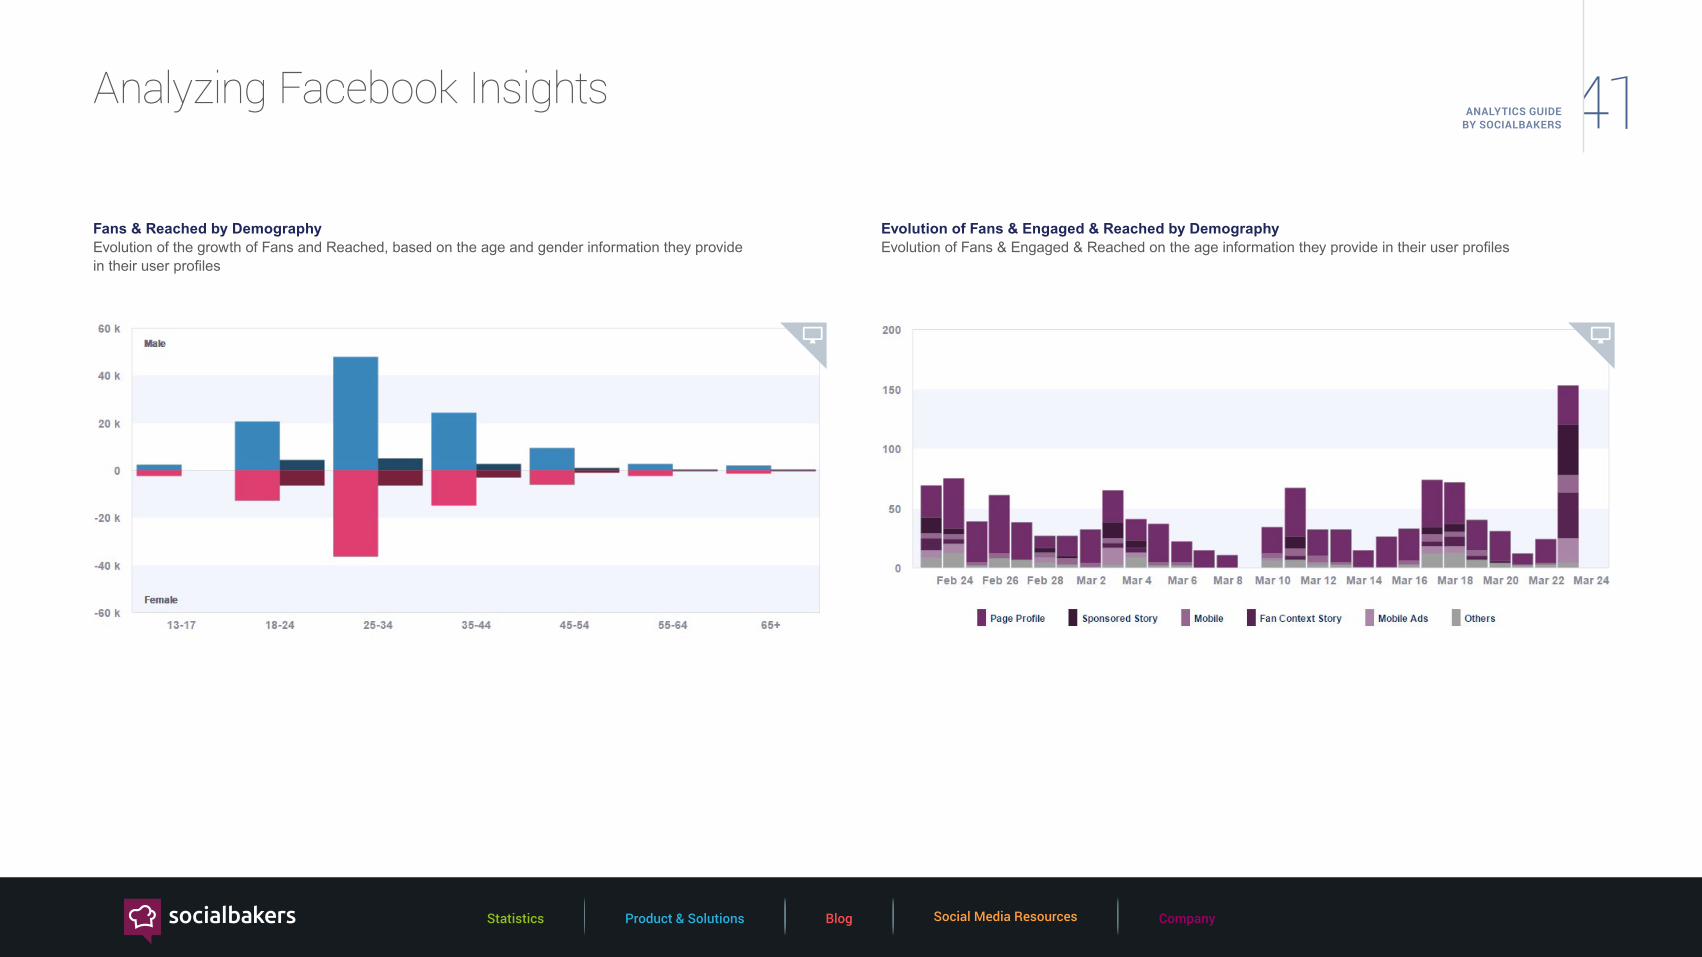
Fans & Reached by DemographyEvolution of the growth of Fans and Reached, based on the age and gender information they provide in their user profiles
Evolution of Fans & Engaged & Reached by Demography Evolution of Fans & Engaged & Reached on the age information they provide in their user profiles
Analyzing Facebook Insights
42ANALYTICS GUIDE BY SOCIALBAKERS
Statistics Social Media Resources CompanyBlogProduct & Solutions
Analyzing Facebook Insights
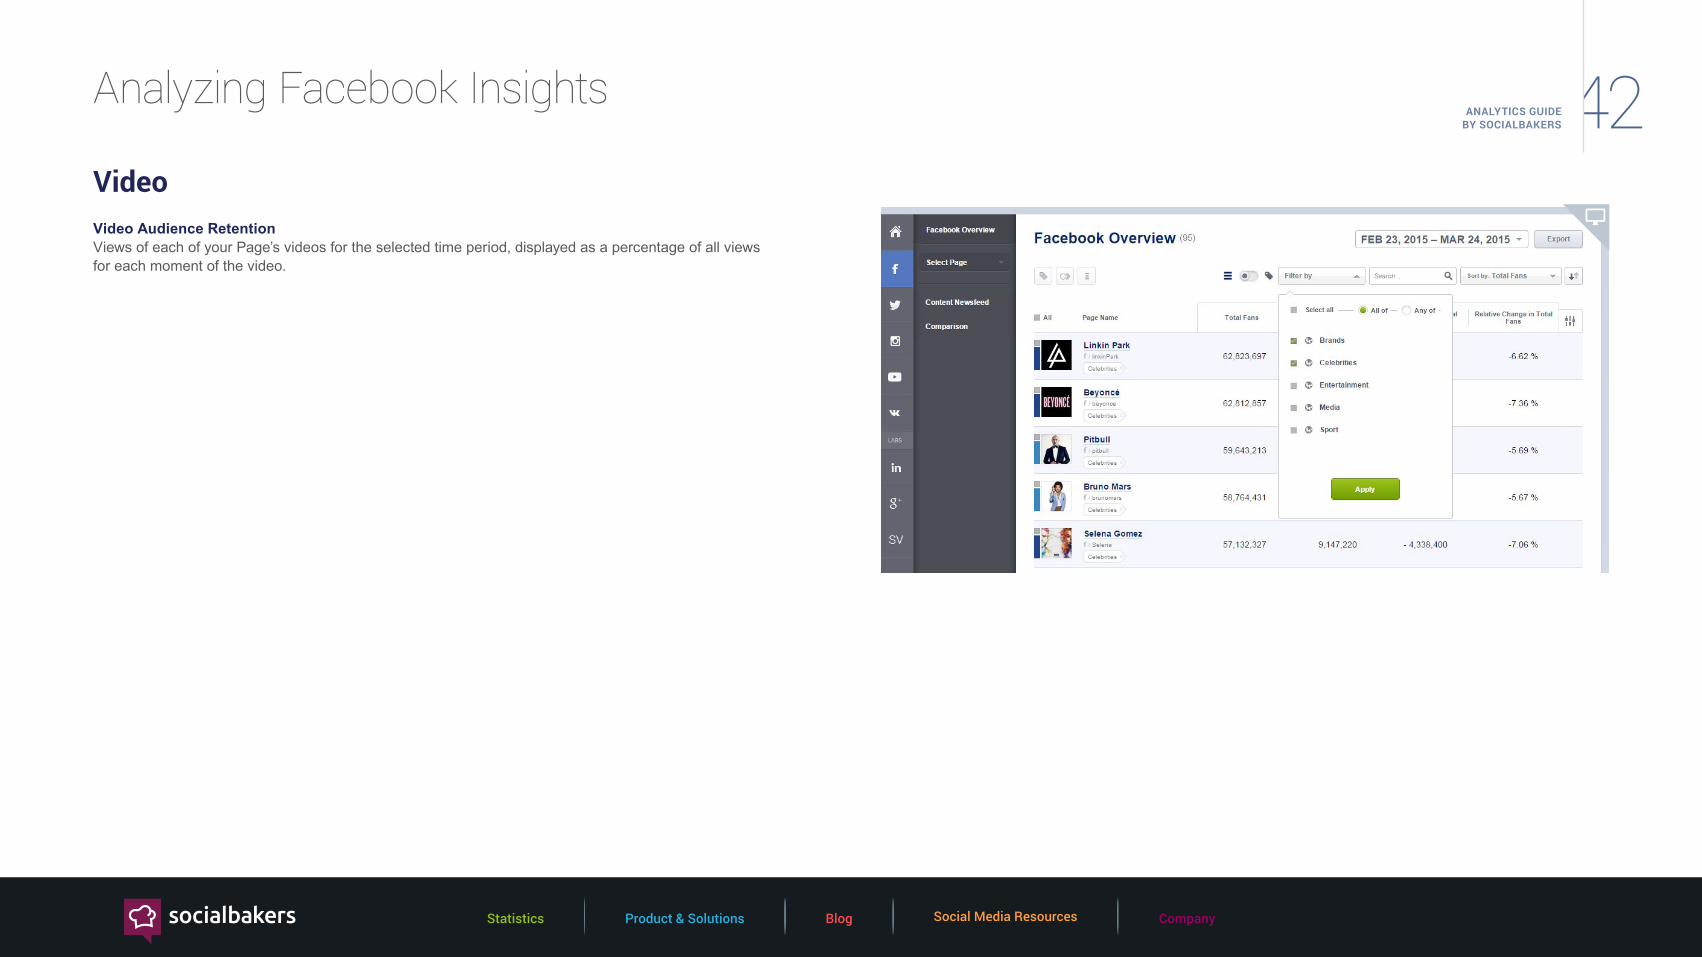
VideoVideo Audience RetentionViews of each of your Page’s videos for the selected time period, displayed as a percentage of all views for each moment of the video.
43ANALYTICS GUIDE BY SOCIALBAKERS
Statistics Social Media Resources CompanyBlogProduct & Solutions
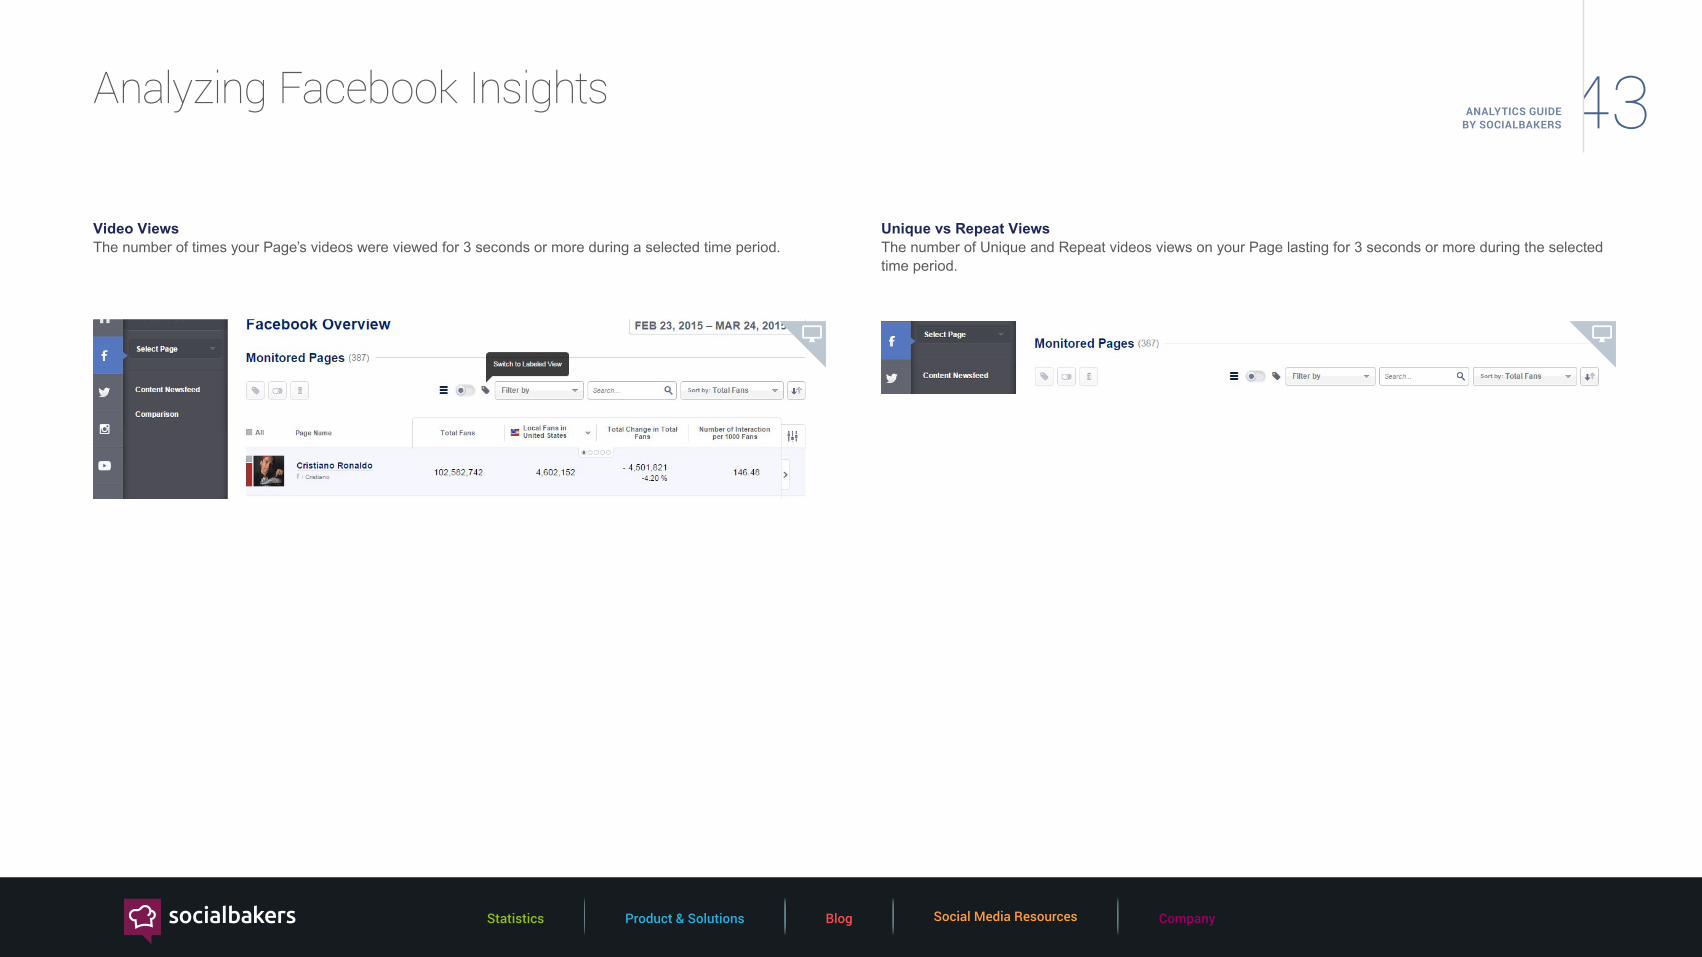
Video ViewsThe number of times your Page’s videos were viewed for 3 seconds or more during a selected time period.
Unique vs Repeat Views The number of Unique and Repeat videos views on your Page lasting for 3 seconds or more during the selected time period.
Analyzing Facebook Insights
44ANALYTICS GUIDE BY SOCIALBAKERS
Statistics Social Media Resources CompanyBlogProduct & Solutions
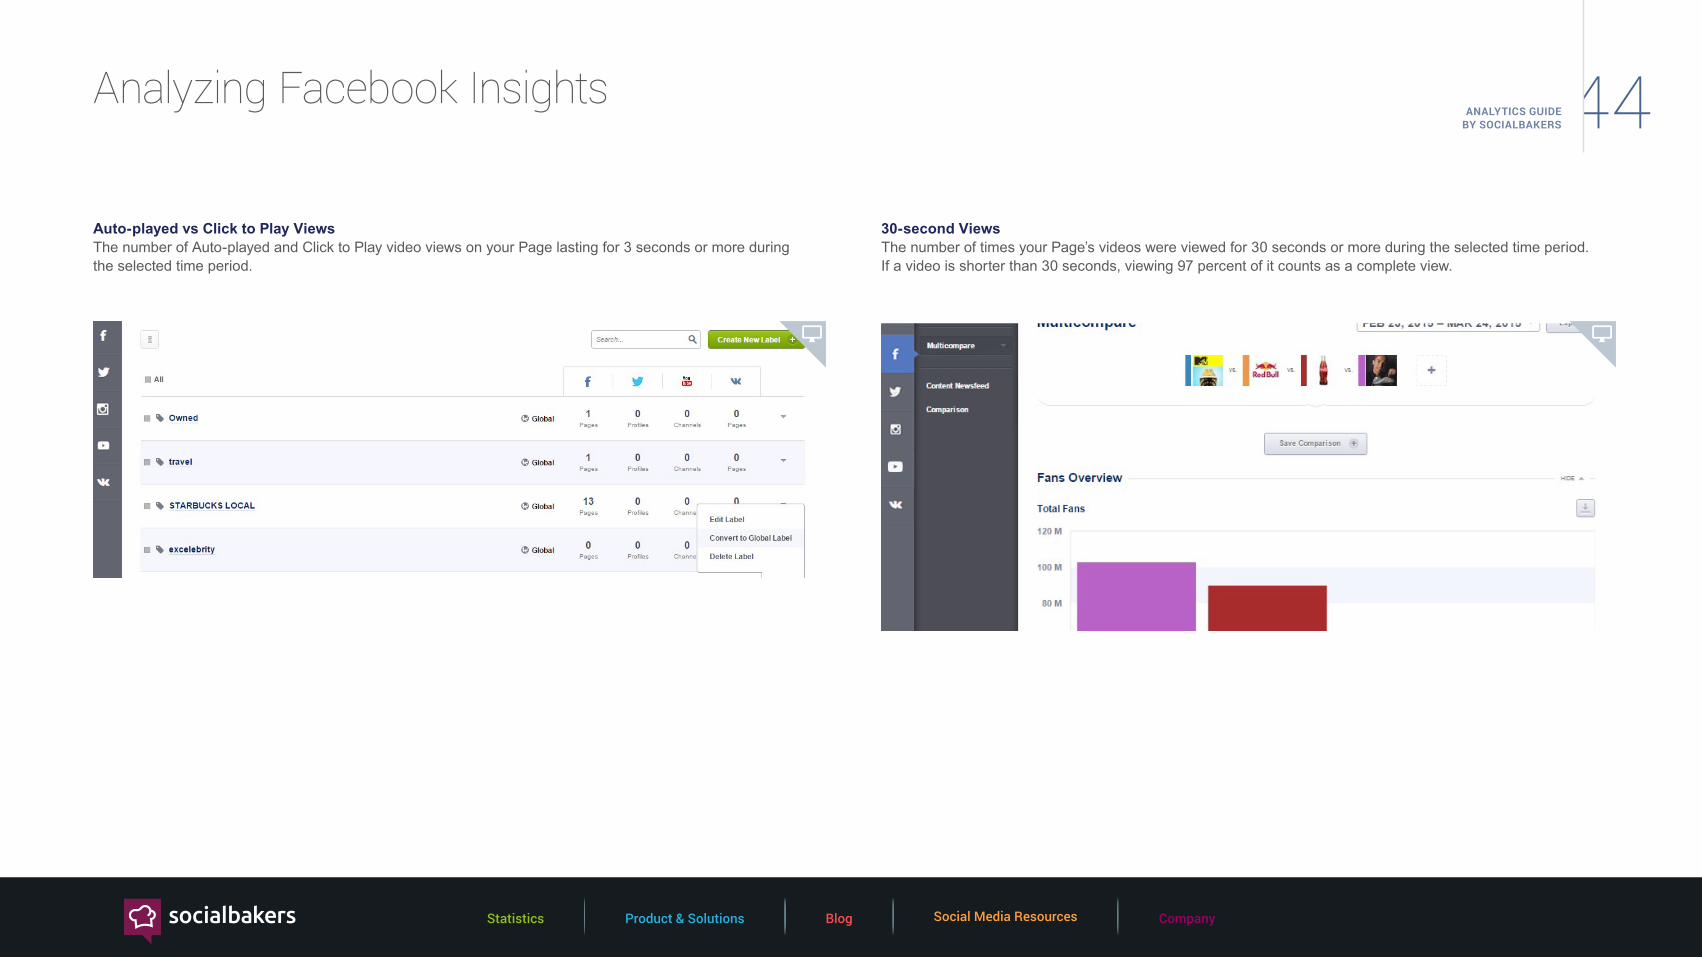
Auto-played vs Click to Play ViewsThe number of Auto-played and Click to Play video views on your Page lasting for 3 seconds or more during the selected time period.
30-second Views The number of times your Page’s videos were viewed for 30 seconds or more during the selected time period. If a video is shorter than 30 seconds, viewing 97 percent of it counts as a complete view.
Analyzing Facebook Insights
45ANALYTICS GUIDE BY SOCIALBAKERS
Statistics Social Media Resources CompanyBlogProduct & Solutions
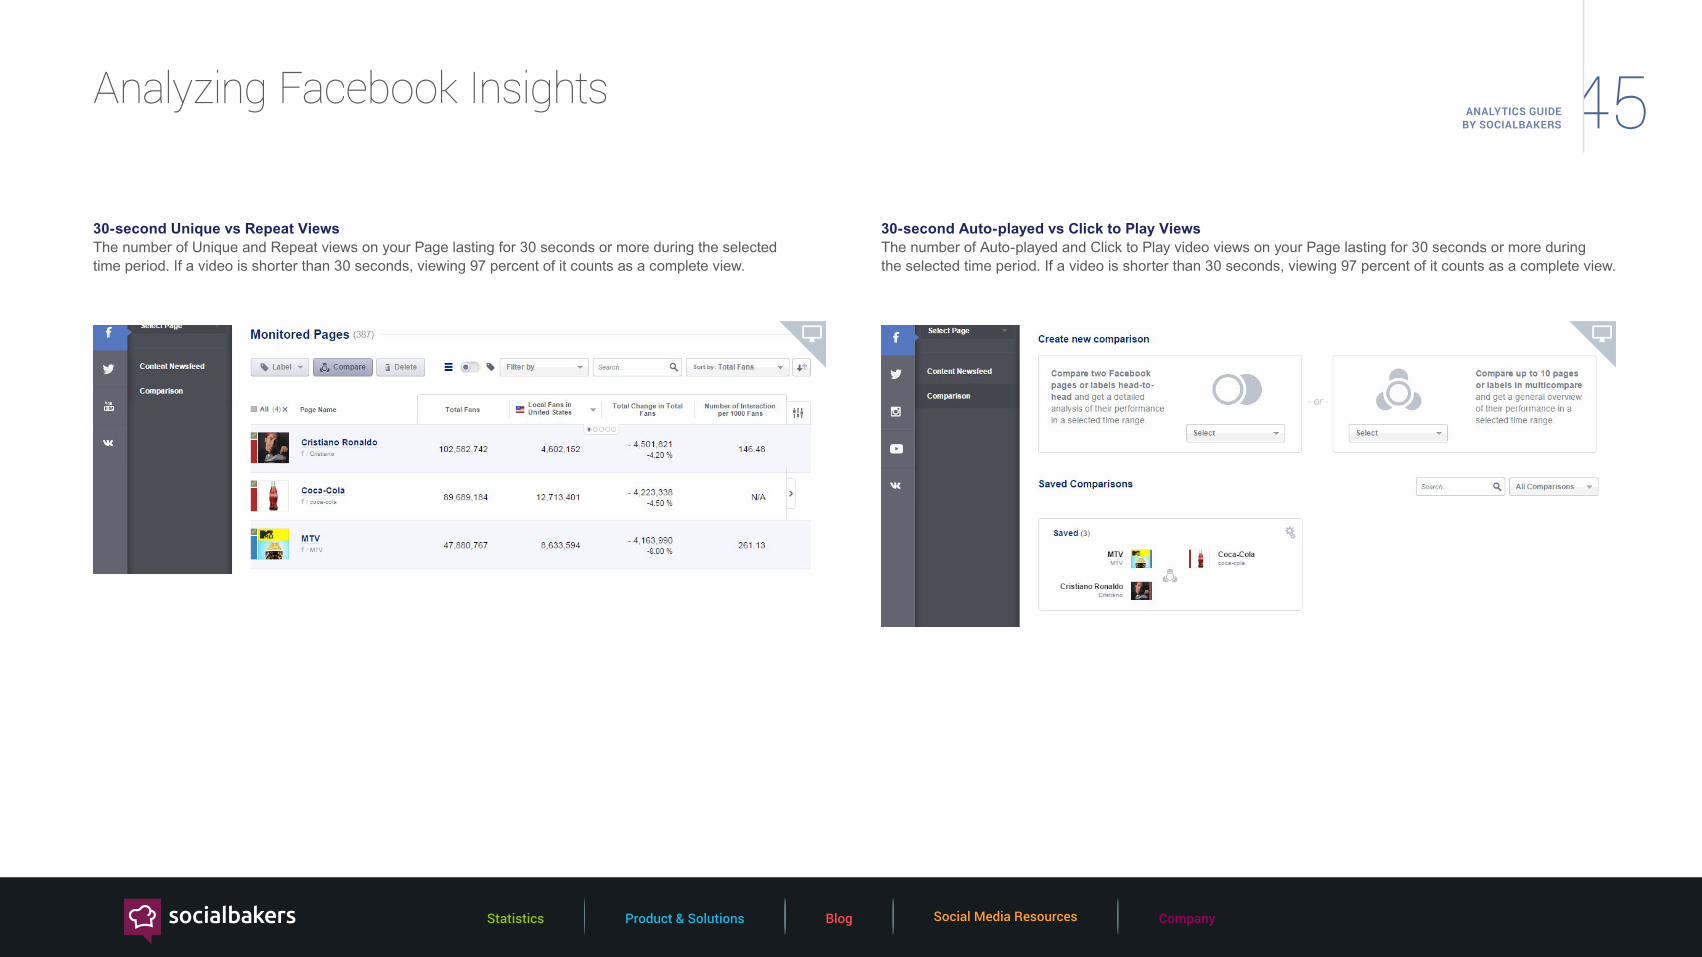
30-second Unique vs Repeat ViewsThe number of Unique and Repeat views on your Page lasting for 30 seconds or more during the selected time period. If a video is shorter than 30 seconds, viewing 97 percent of it counts as a complete view.
30-second Auto-played vs Click to Play ViewsThe number of Auto-played and Click to Play video views on your Page lasting for 30 seconds or more during the selected time period. If a video is shorter than 30 seconds, viewing 97 percent of it counts as a complete view.
Analyzing Facebook Insights
46ANALYTICS GUIDE BY SOCIALBAKERS
Statistics Social Media Resources CompanyBlogProduct & Solutions
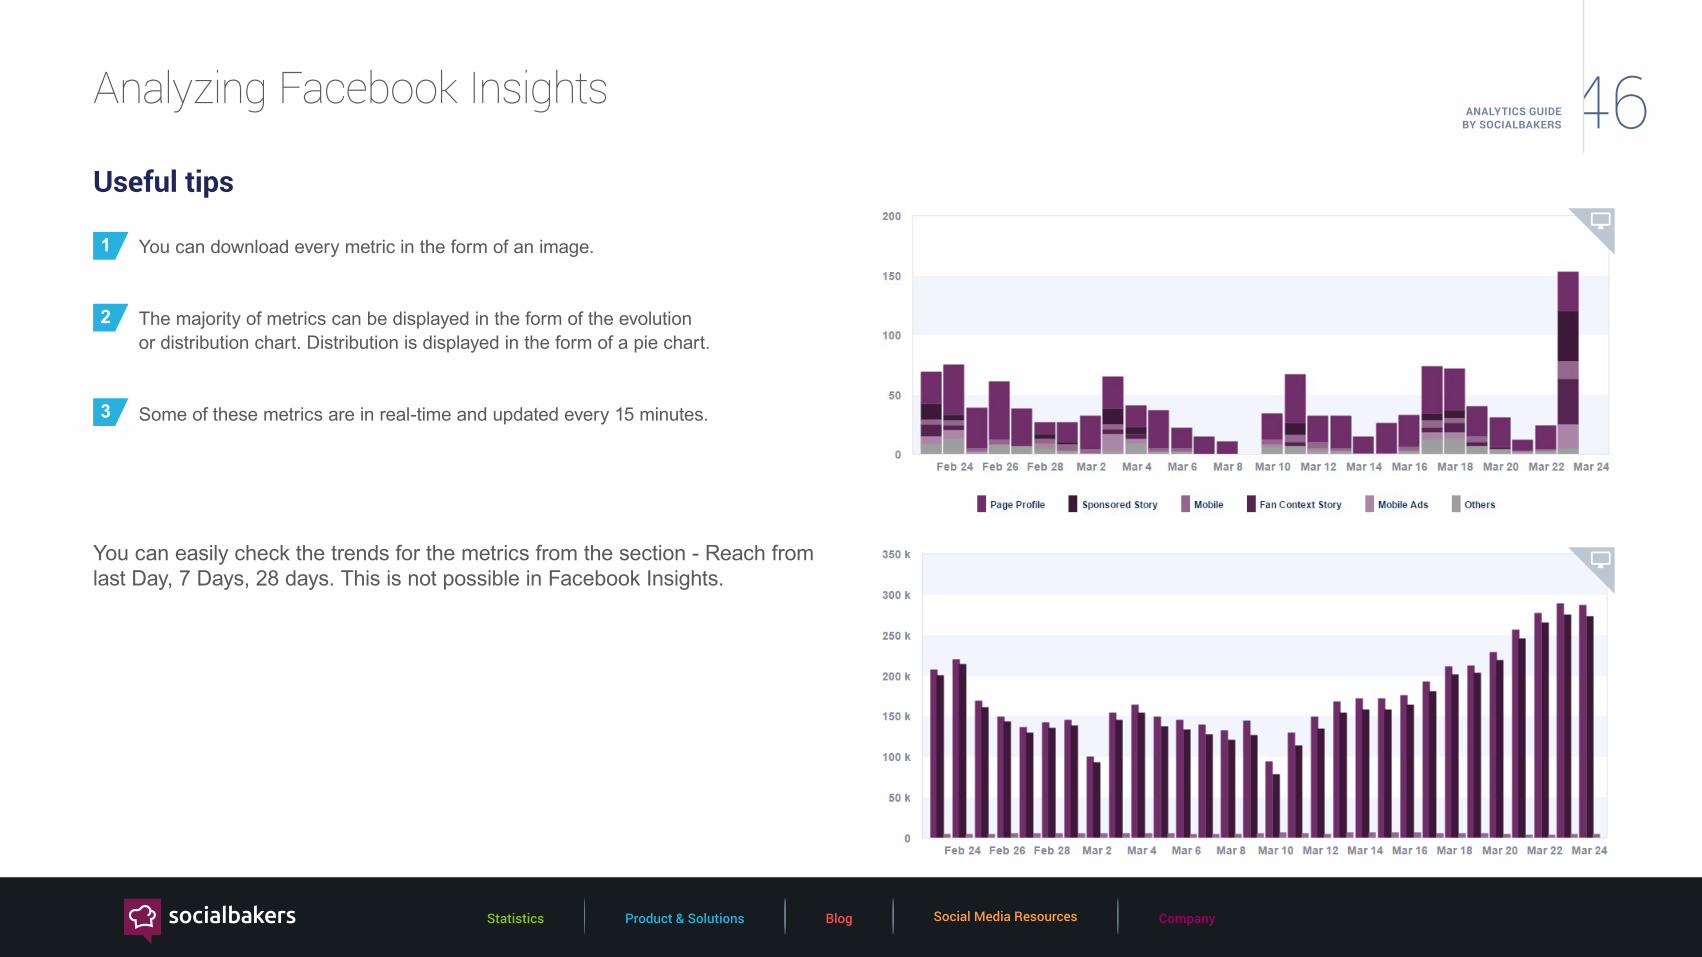
Useful tips
You can download every metric in the form of an image.
The majority of metrics can be displayed in the form of the evolution or distribution chart. Distribution is displayed in the form of a pie chart.
Some of these metrics are in real-time and updated every 15 minutes.
You can easily check the trends for the metrics from the section - Reach from last Day, 7 Days, 28 days. This is not possible in Facebook Insights.
Analyzing Facebook Insights
1
2
3
47ANALYTICS GUIDE BY SOCIALBAKERS
Statistics Social Media Resources CompanyBlogProduct & Solutions
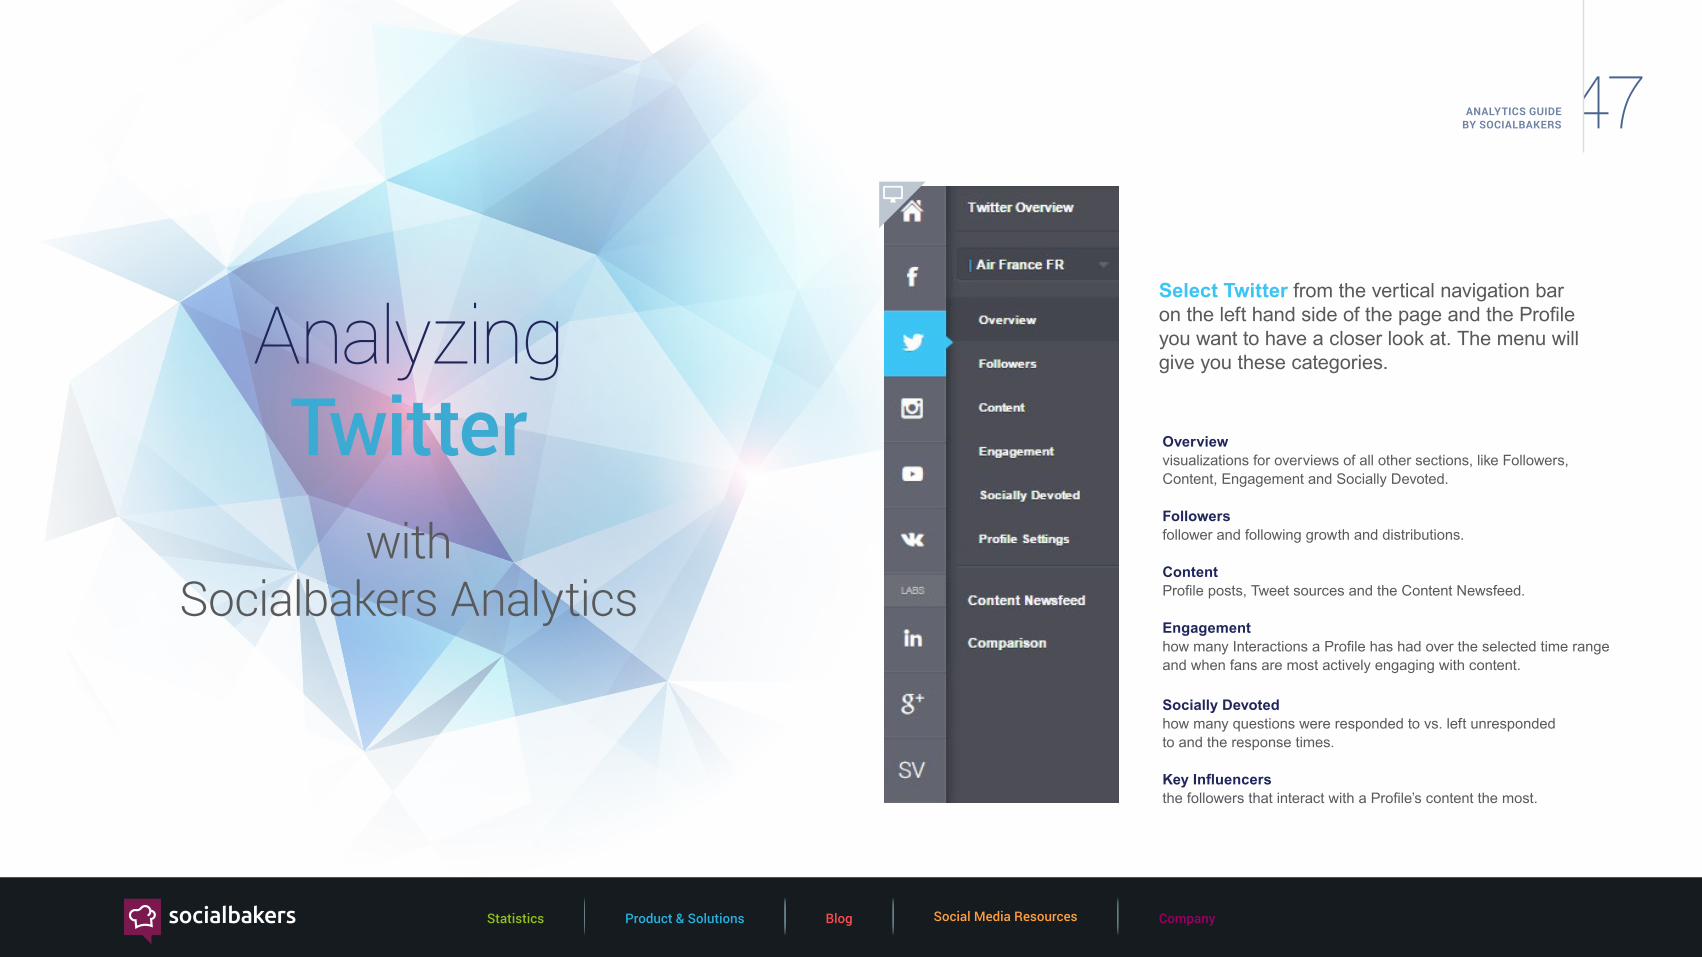
Overviewvisualizations for overviews of all other sections, like Followers, Content, Engagement and Socially Devoted.
Followersfollower and following growth and distributions.
ContentProfile posts, Tweet sources and the Content Newsfeed.
Engagementhow many Interactions a Profile has had over the selected time range and when fans are most actively engaging with content.
Socially Devotedhow many questions were responded to vs. left unresponded to and the response times.
Key Influencersthe followers that interact with a Profile’s content the most.
Select Twitter from the vertical navigation bar on the left hand side of the page and the Profile you want to have a closer look at. The menu will give you these categories.Analyzing
Twitterwith
Socialbakers Analytics
48ANALYTICS GUIDE BY SOCIALBAKERS
Statistics Social Media Resources CompanyBlogProduct & Solutions
Analyzing Twitter
FollowersIn this section you will see data on your Followers and Following: how many total Fans a Profile has, how that number has grown, the amount of public lists a Profile is included in and more.
Total FollowersThe total number of followers on the last day of a selected time range.
Growth of Total FollowersThis graph shows the increase or decrease in followers by the day, the day of the week, the week or the month, during a selected time range.
Total FollowingThe total number of users the profile is following on the last day of a selected time range.Growth of Total Following: This graph shows the increase (or decrease) in the number of users a profile is following by the day, the day of the week ,the week or the month, during a selected time range.
Total ListedThe total number of public lists the profile is a member of during a selected time range.
Growth of Total ListedThis graph shows the increase (or decrease) in the number of public lists the profile is a member of by the day, the day of the week, the week or the month, during a selected time range.
49ANALYTICS GUIDE BY SOCIALBAKERS
Statistics Social Media Resources CompanyBlogProduct & Solutions
Analyzing Twitter
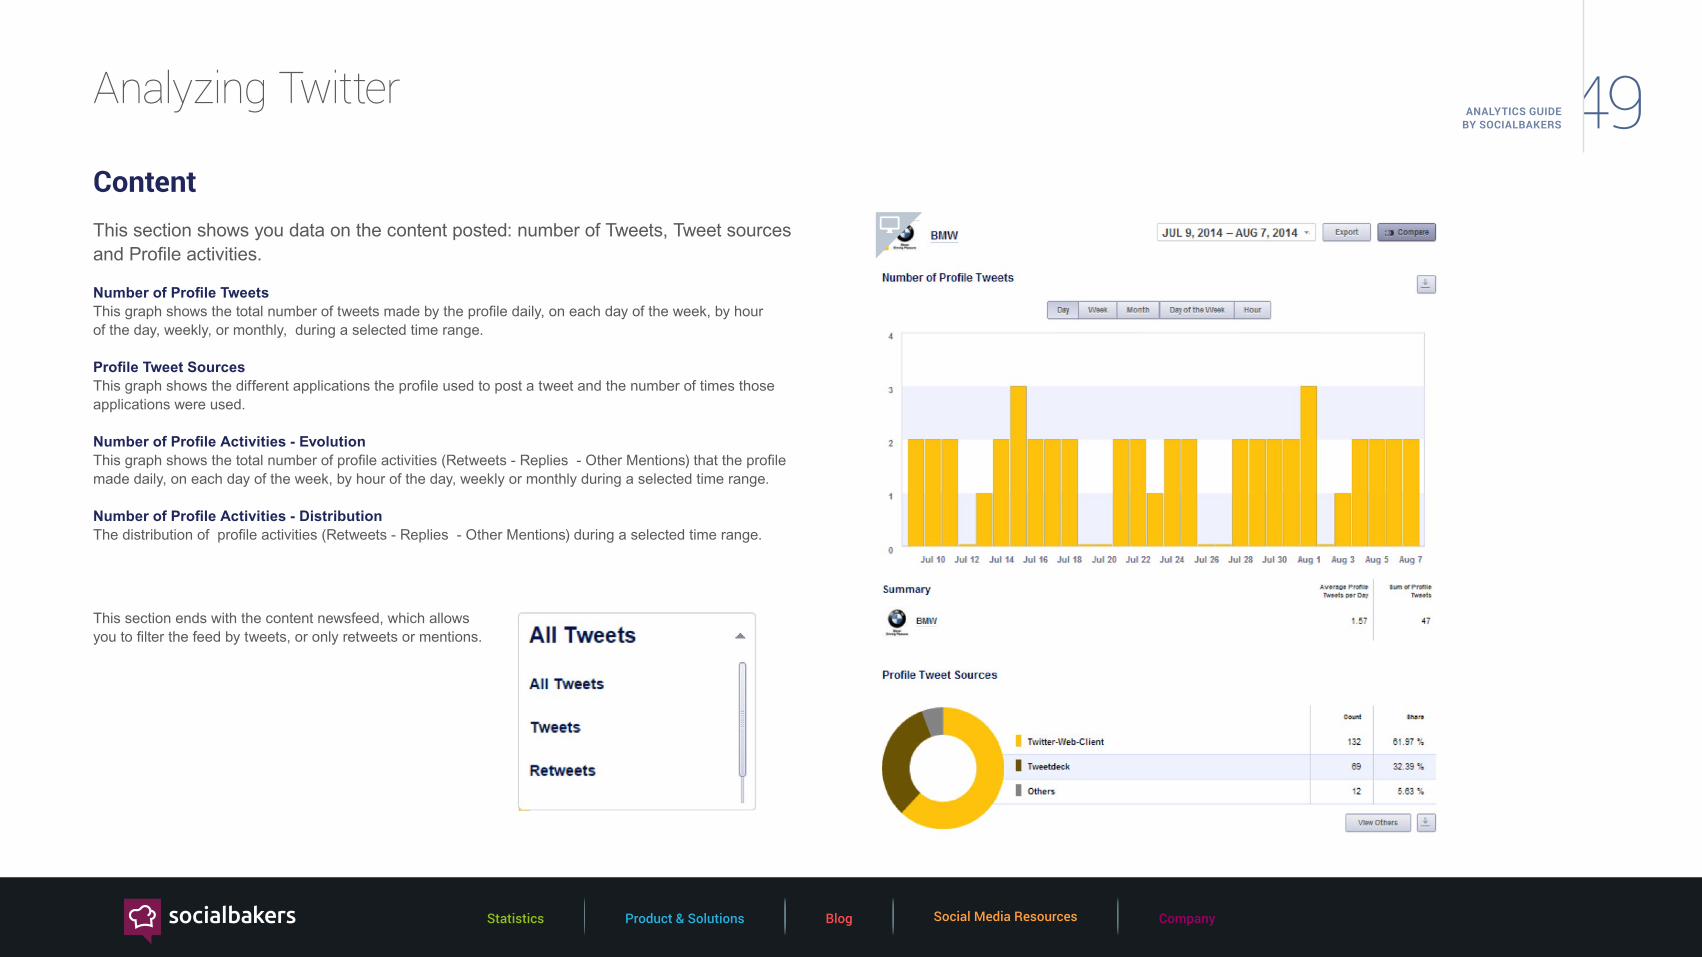
ContentThis section shows you data on the content posted: number of Tweets, Tweet sources and Profile activities.
Number of Profile TweetsThis graph shows the total number of tweets made by the profile daily, on each day of the week, by hour of the day, weekly, or monthly, during a selected time range.
Profile Tweet SourcesThis graph shows the different applications the profile used to post a tweet and the number of times those applications were used.
Number of Profile Activities - Evolution This graph shows the total number of profile activities (Retweets - Replies - Other Mentions) that the profile made daily, on each day of the week, by hour of the day, weekly or monthly during a selected time range.
Number of Profile Activities - DistributionThe distribution of profile activities (Retweets - Replies - Other Mentions) during a selected time range.
This section ends with the content newsfeed, which allows you to filter the feed by tweets, or only retweets or mentions.
50ANALYTICS GUIDE BY SOCIALBAKERS
Statistics Social Media Resources CompanyBlogProduct & Solutions
Analyzing Twitter
EngagementHere you will see information about engagement of Followers, calculated by the metrics Number of Interactions (total interactions), Number of Interactions per 1000 fans, user activity and others.
Number of Interactions - Evolution By TweetsThe number of all interactions (replies, retweets, favorites) by day of the week, day, week and month. The interactions are shown for the time of the tweet.
Number of Interactions - Distribution By TweetsThe distribution of followers’ interactions (replies, retweets, favorites) during a selected time range.
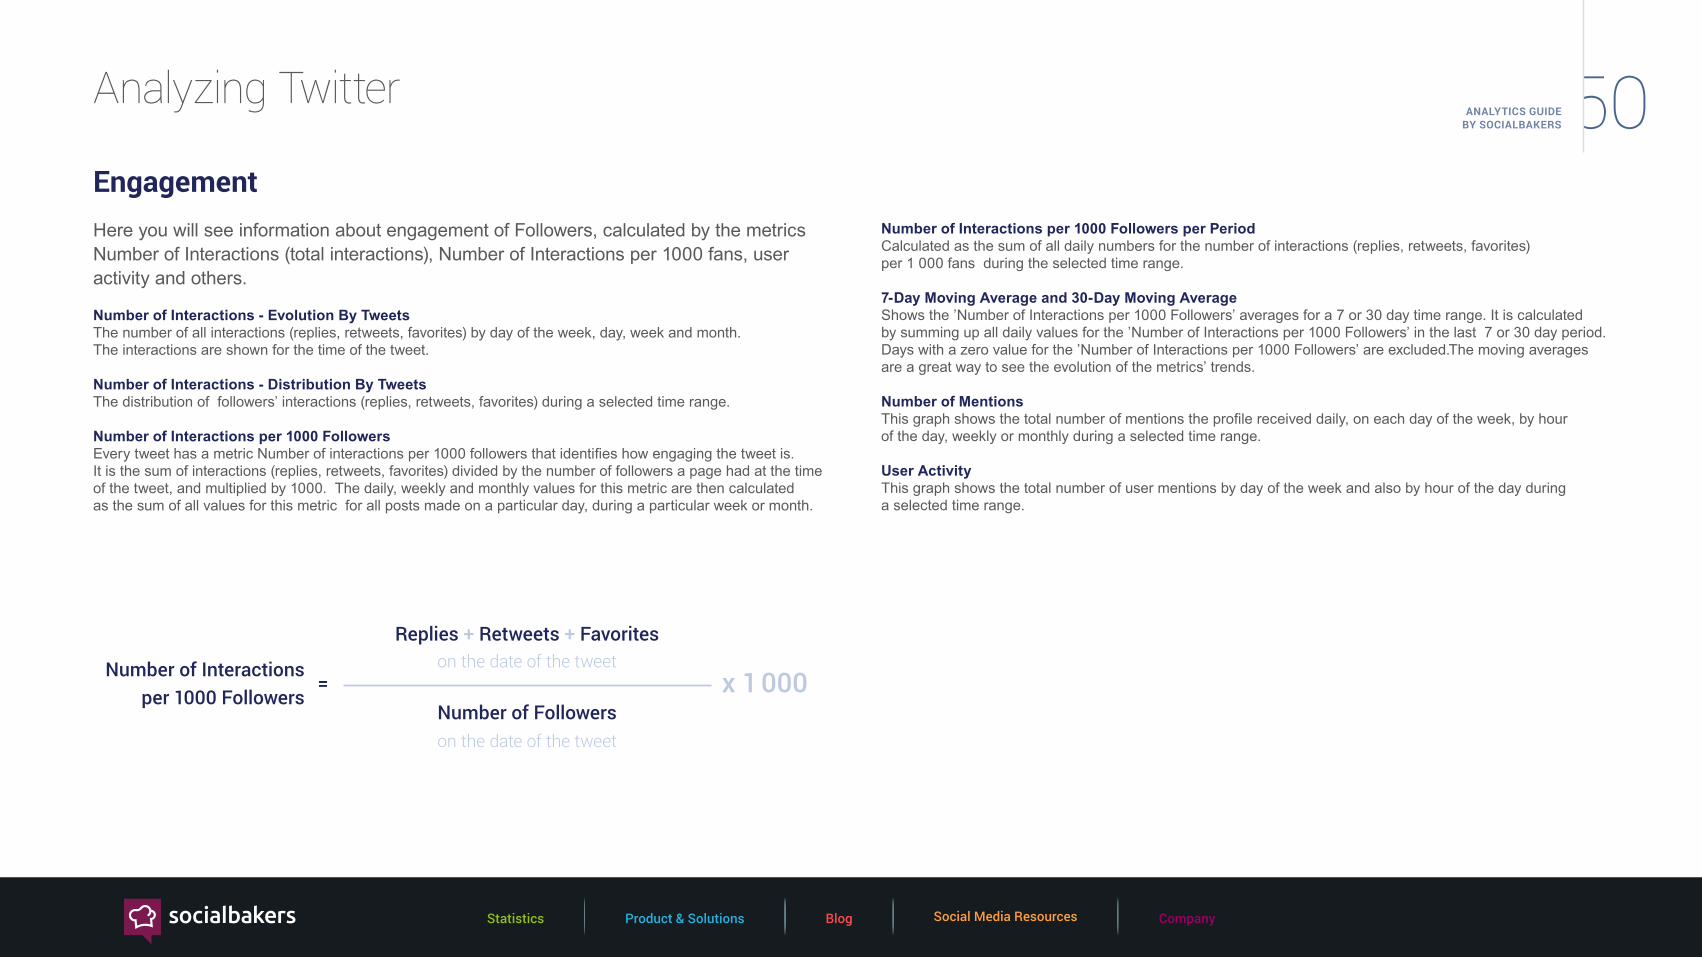
Number of Interactions per 1000 Followers Every tweet has a metric Number of interactions per 1000 followers that identifies how engaging the tweet is. It is the sum of interactions (replies, retweets, favorites) divided by the number of followers a page had at the time of the tweet, and multiplied by 1000. The daily, weekly and monthly values for this metric are then calculated as the sum of all values for this metric for all posts made on a particular day, during a particular week or month.
Number of Interactions per 1000 Followers per PeriodCalculated as the sum of all daily numbers for the number of interactions (replies, retweets, favorites) per 1 000 fans during the selected time range.
7-Day Moving Average and 30-Day Moving AverageShows the ’Number of Interactions per 1000 Followers’ averages for a 7 or 30 day time range. It is calculated by summing up all daily values for the ’Number of Interactions per 1000 Followers’ in the last 7 or 30 day period. Days with a zero value for the ’Number of Interactions per 1000 Followers’ are excluded.The moving averages are a great way to see the evolution of the metrics’ trends.
Number of MentionsThis graph shows the total number of mentions the profile received daily, on each day of the week, by hour of the day, weekly or monthly during a selected time range.
User ActivityThis graph shows the total number of user mentions by day of the week and also by hour of the day during a selected time range.
Number of Interactions per 1000 Followers
Replies + Retweets + Favorites
x 1 000Number of Followers
on the date of the tweet
on the date of the tweet
=
51ANALYTICS GUIDE BY SOCIALBAKERS
Statistics Social Media Resources CompanyBlogProduct & Solutions
Analyzing Twitter
Socially DevotedThis section will show you how Socially Devoted your monitored Profiles are: how quickly a Profile responded to user posts, how many posts or questions were responded to or left without a response.
Response Rate for User Questions/Response Rate for User MentionsThis graph shows the percentage and the number of user questions/user mentions the monitored profile responded to versus the percentage and the number of user questions/mentions that did not receive a response during the selected time range. A user question is identified when a mention contains a question mark in one of several possible languages (English, Armenian, Arabic, Japanese, and others). A mention is a tweet containing another user’s Twitter username, preceded by the “”@”” symbol. How do I become a user?@Socialbakers,’ would be considered a mention and a question, as well.
Responded vs. Unresponded User Questions/Responded vs. Unresponded User TweetsThis graph shows the daily, by the day of the week, weekly or monthly number of responded and unresponded questions/mentions and the response rates. A user question is identified when a mention contains a question mark in one of several possible languages (English, Armenian, Arabic, Japanese, and others). A mention is a tweet containing another user’s Twitter username, preceded by the “”@”” symbol. How do I become a user? @Socialbakers,’ would be considered a mention and a question, as well.
Response Time Segments for User Questions / Response Time Segments for User MentionsThis graph shows a breakdown of the time it took the monitored profile to respond to a user question/mention during a selected time range. This graph shows the relative distribution of page responses to user questions/mentions according to the time needed for the page to reply. The following time intervals are used: under 10 minutes, 10-30 minutes, 30–60 minutes, 60–120 minutes, 2 hours - 5 hours, 5-12 hours, 12-24 hours, 24-48 hours, 48-72 hours, or more than 72 hours. A user question is identified when a mention contains a question mark in one of several possible languages (English, Armenian, Arabic, Japanese, and others). A mention is a tweet containing another user’s Twitter username, preceded by the “”@”” symbol. How do I become a user?@Socialbakers,’ would be considered a mention and a question, as well.
Response Time for User Questions / Response Time for User MentionsThis graph shows the average response time for user questions/mentions by hour of the day, day, week, day of the week and month. A user question is identified when a mention contains a question mark in one of several possible languages (English, Armenian, Arabic, Japanese, and others). A mention is a tweet containing another user’s Twitter username, preceded by the “”@”” symbol. How do I become a user?@Socialbakers,’ would be considered a mention and a question, as well.
New
Sta
ndard
of Customer Care in Social MediaNew
Sta
ndard
of Customer Care in Social Media
SOCIALLY DEVOTED
AnalyzingYouTube
withSocialbakers Analytics
52ANALYTICS GUIDE BY SOCIALBAKERS
Statistics Social Media Resources CompanyBlogProduct & Solutions
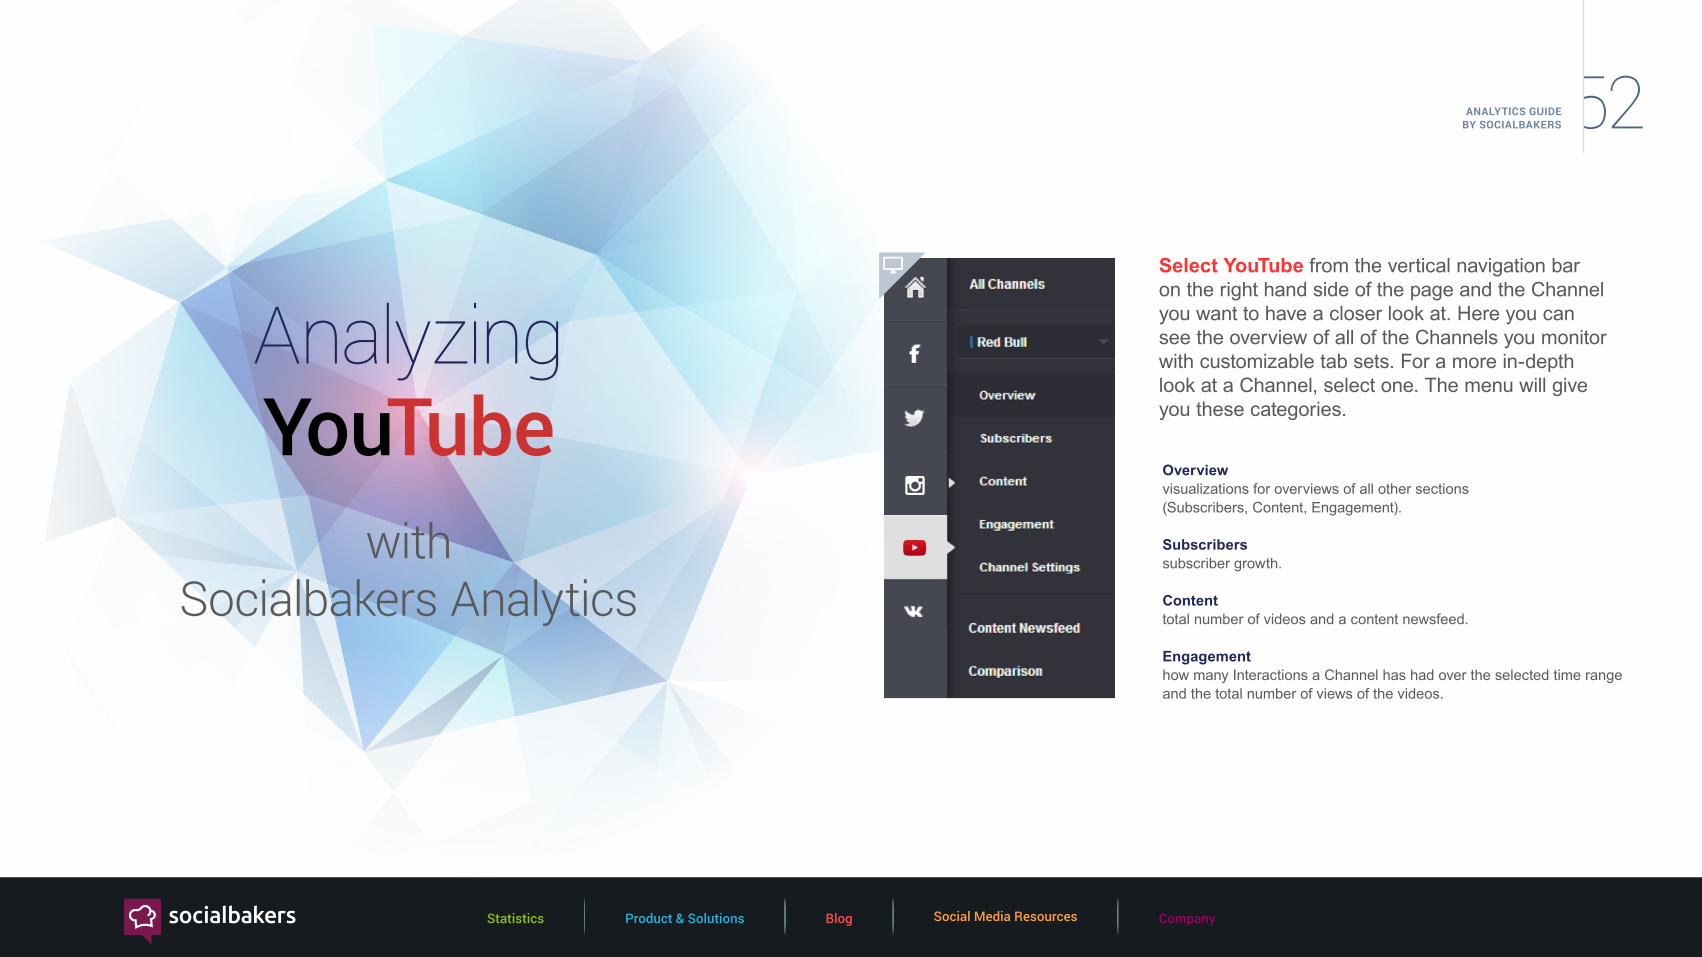
Overviewvisualizations for overviews of all other sections (Subscribers, Content, Engagement).
Subscriberssubscriber growth.
Contenttotal number of videos and a content newsfeed.
Engagementhow many Interactions a Channel has had over the selected time range and the total number of views of the videos.
Select YouTube from the vertical navigation bar on the right hand side of the page and the Channel you want to have a closer look at. Here you can see the overview of all of the Channels you monitor with customizable tab sets. For a more in-depth look at a Channel, select one. The menu will give you these categories.
53ANALYTICS GUIDE BY SOCIALBAKERS
Statistics Social Media Resources CompanyBlogProduct & Solutions
Analyzing YouTube
Subscribers
Content
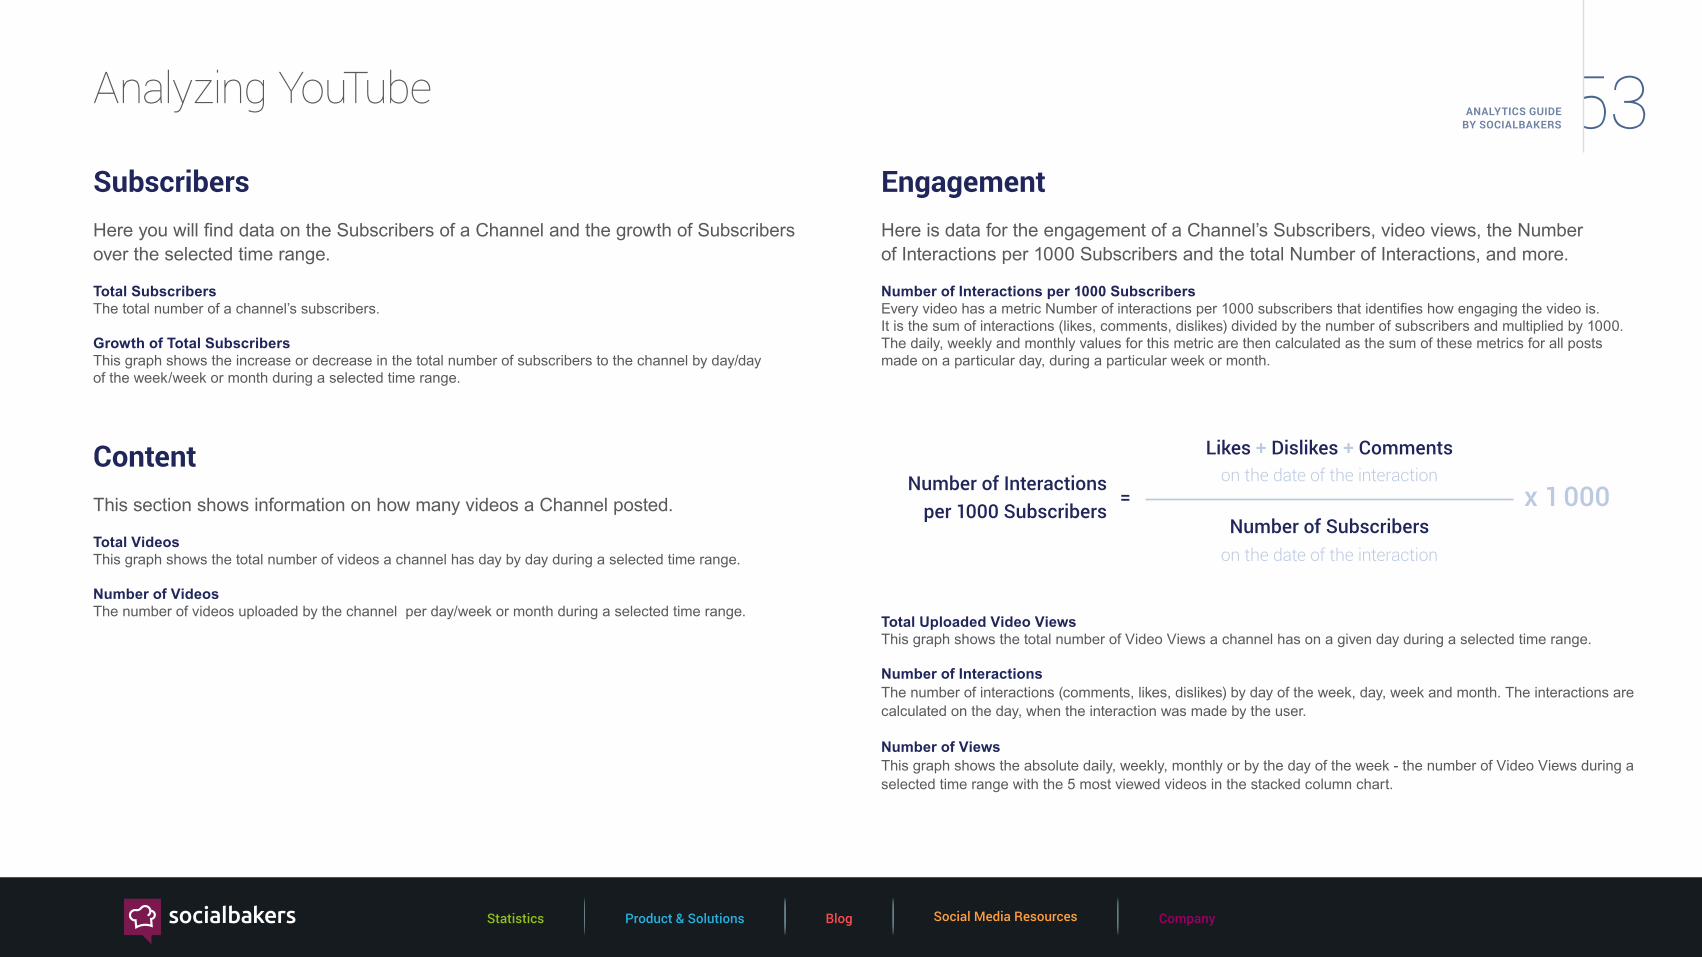
Here you will find data on the Subscribers of a Channel and the growth of Subscribers over the selected time range.
Total SubscribersThe total number of a channel’s subscribers.
Growth of Total SubscribersThis graph shows the increase or decrease in the total number of subscribers to the channel by day/day of the week/week or month during a selected time range.
This section shows information on how many videos a Channel posted.
Total VideosThis graph shows the total number of videos a channel has day by day during a selected time range.
Number of VideosThe number of videos uploaded by the channel per day/week or month during a selected time range.
EngagementHere is data for the engagement of a Channel’s Subscribers, video views, the Number of Interactions per 1000 Subscribers and the total Number of Interactions, and more.
Number of Interactions per 1000 SubscribersEvery video has a metric Number of interactions per 1000 subscribers that identifies how engaging the video is. It is the sum of interactions (likes, comments, dislikes) divided by the number of subscribers and multiplied by 1000. The daily, weekly and monthly values for this metric are then calculated as the sum of these metrics for all posts made on a particular day, during a particular week or month.
Total Uploaded Video ViewsThis graph shows the total number of Video Views a channel has on a given day during a selected time range.
Number of Interactions The number of interactions (comments, likes, dislikes) by day of the week, day, week and month. The interactions are calculated on the day, when the interaction was made by the user.
Number of ViewsThis graph shows the absolute daily, weekly, monthly or by the day of the week - the number of Video Views during a selected time range with the 5 most viewed videos in the stacked column chart.
Number of Interactions per 1000 Subscribers
Likes + Dislikes + Comments
x 1 000Number of Subscribers
on the date of the interaction
on the date of the interaction
=
54ANALYTICS GUIDE BY SOCIALBAKERS
Statistics Social Media Resources CompanyBlogProduct & Solutions
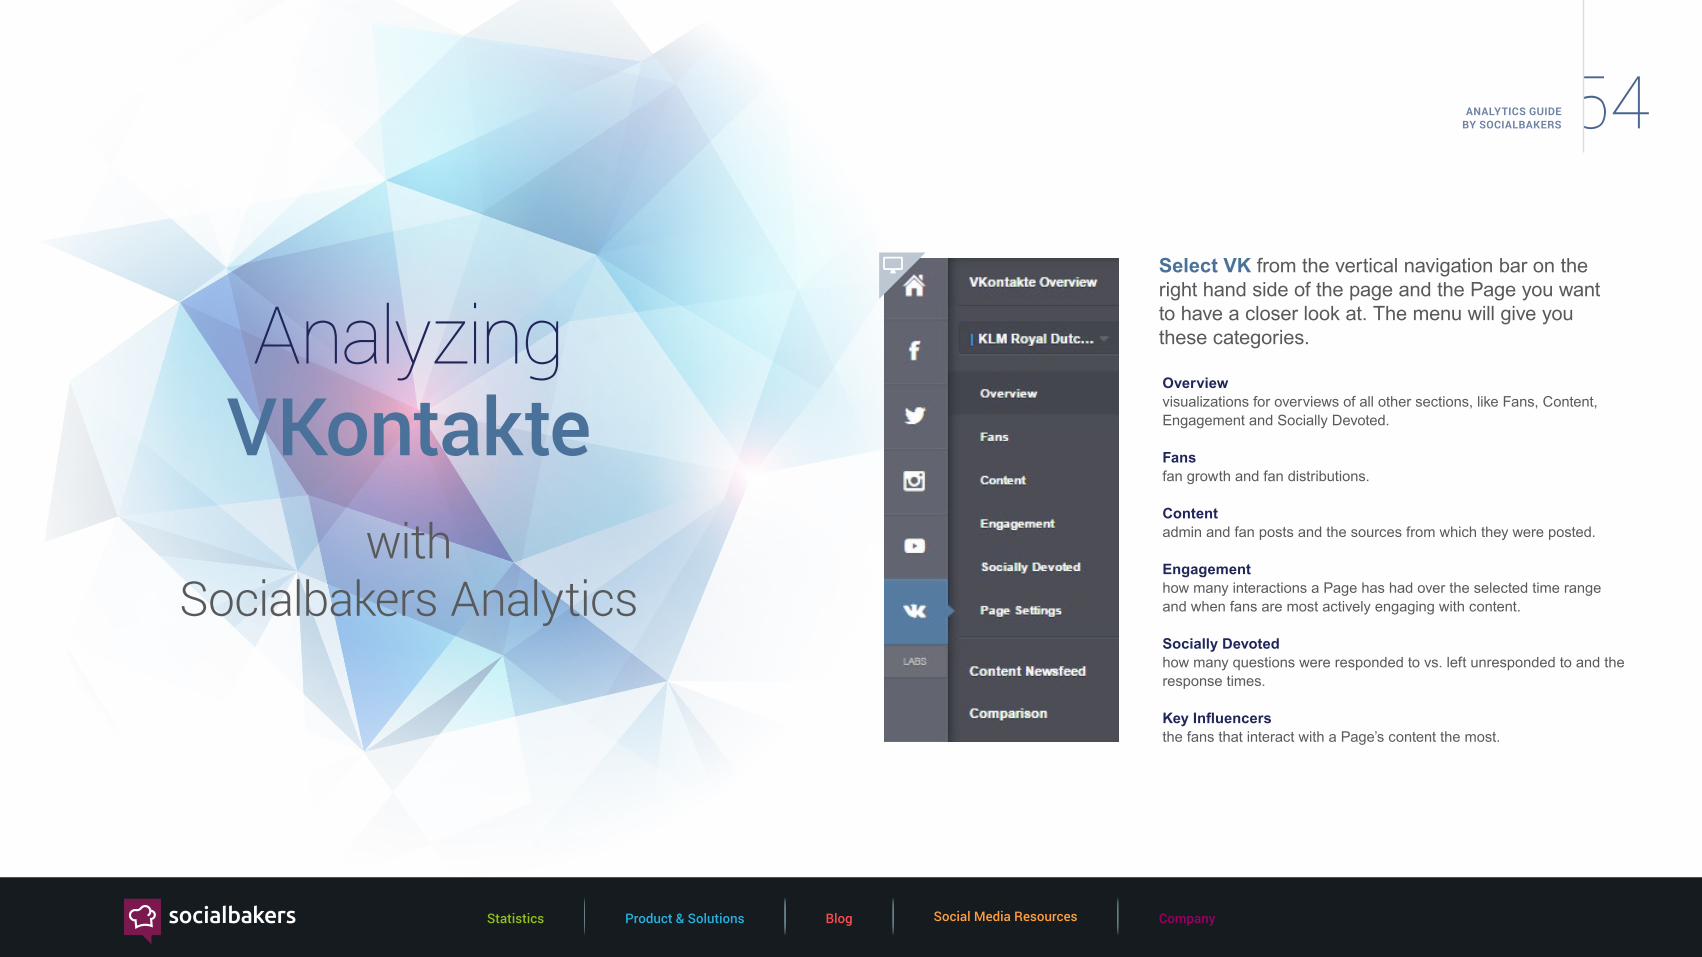
Overviewvisualizations for overviews of all other sections, like Fans, Content, Engagement and Socially Devoted.
Fansfan growth and fan distributions.
Contentadmin and fan posts and the sources from which they were posted.
Engagementhow many interactions a Page has had over the selected time range and when fans are most actively engaging with content.
Socially Devotedhow many questions were responded to vs. left unresponded to and the response times.
Key Influencersthe fans that interact with a Page’s content the most.
Select VK from the vertical navigation bar on the right hand side of the page and the Page you want to have a closer look at. The menu will give you these categories.Analyzing
VKontaktewith
Socialbakers Analytics
55ANALYTICS GUIDE BY SOCIALBAKERS
Statistics Social Media Resources CompanyBlogProduct & Solutions
Analyzing VK
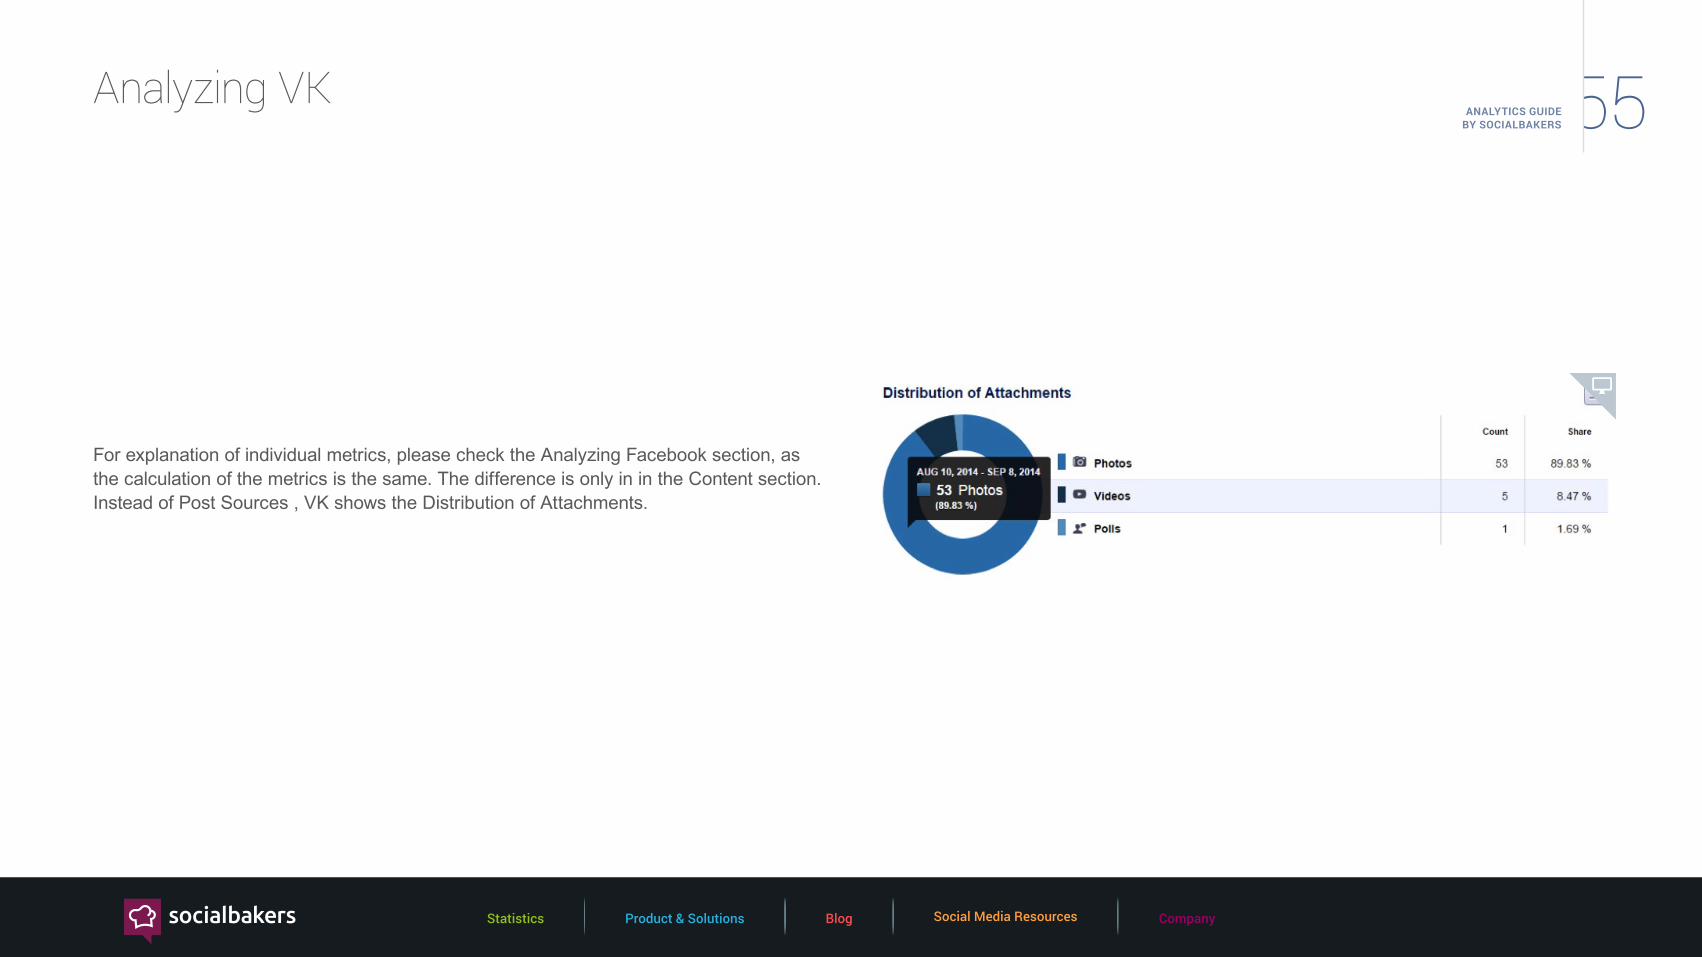
For explanation of individual metrics, please check the Analyzing Facebook section, as the calculation of the metrics is the same. The difference is only in in the Content section. Instead of Post Sources , VK shows the Distribution of Attachments.
56ANALYTICS GUIDE BY SOCIALBAKERS
Statistics Social Media Resources CompanyBlogProduct & Solutions
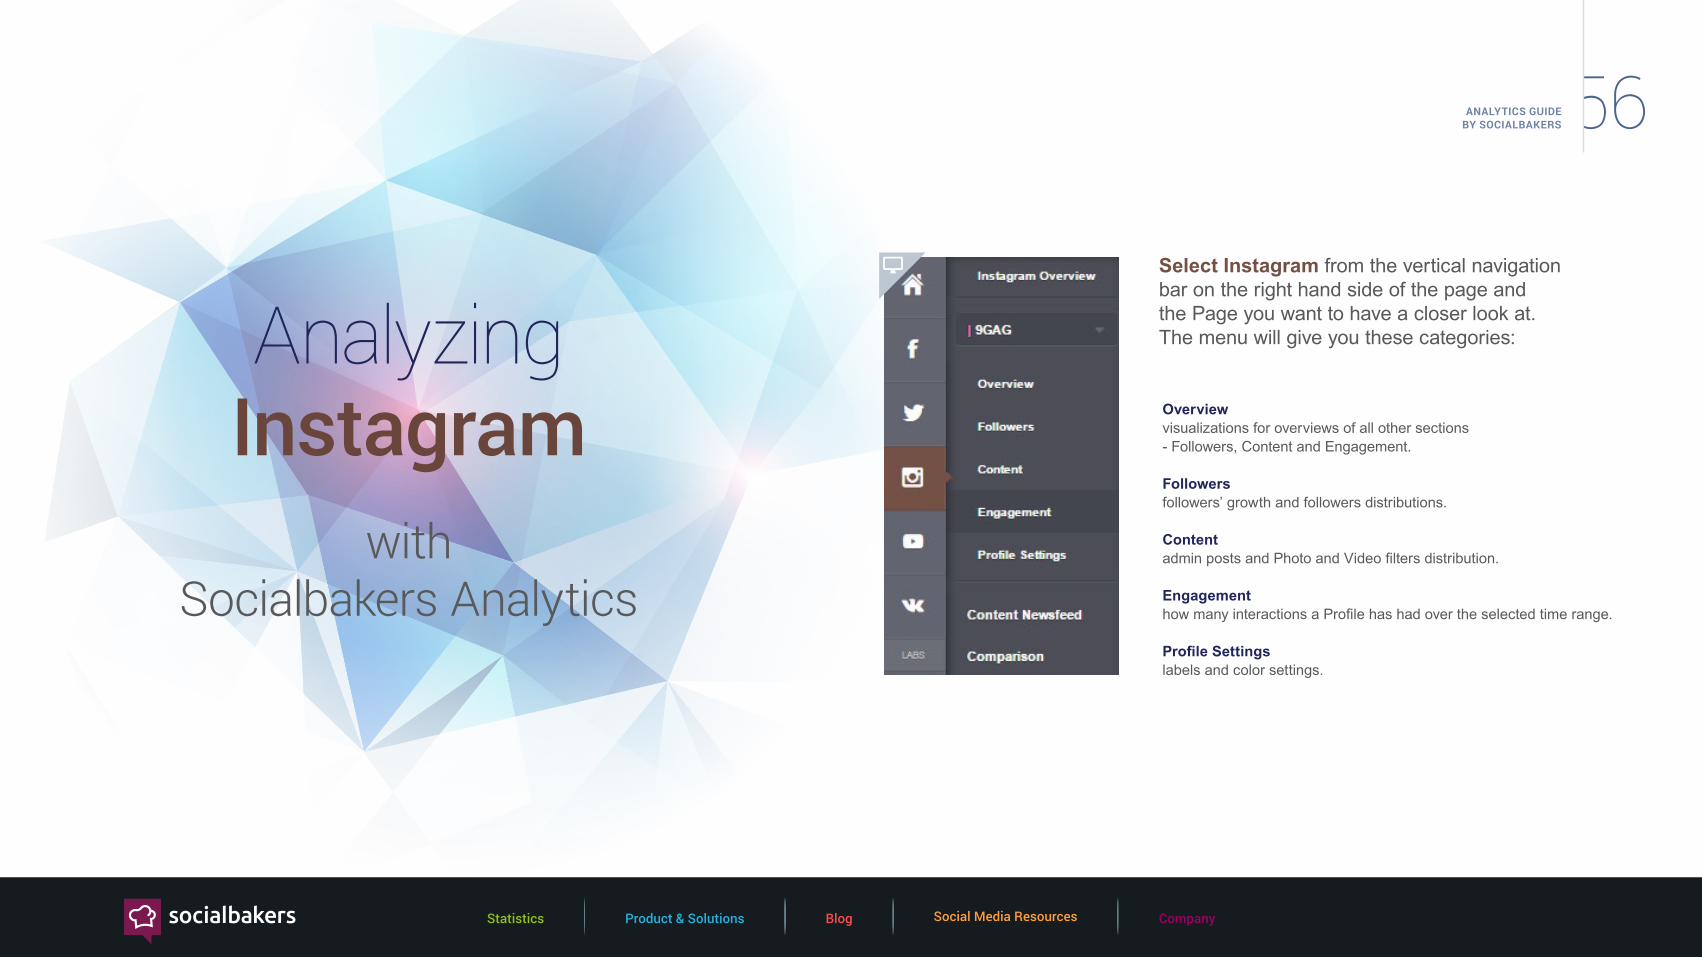
Overviewvisualizations for overviews of all other sections - Followers, Content and Engagement.
Followersfollowers’ growth and followers distributions.
Contentadmin posts and Photo and Video filters distribution.
Engagementhow many interactions a Profile has had over the selected time range.
Profile Settingslabels and color settings.
Select Instagram from the vertical navigation bar on the right hand side of the page and the Page you want to have a closer look at. The menu will give you these categories:Analyzing
Instagramwith
Socialbakers Analytics
57ANALYTICS GUIDE BY SOCIALBAKERS
Statistics Social Media Resources CompanyBlogProduct & Solutions
Analyzing Instagram
FollowersIn this section you will see data on your Followers and Following:how many total Followers a Profile has, how that number has grown and more.
Total FollowersThe total number of followers on the last day of a selected time range.
Growth of Total Followers This graph shows the increase or decrease in followers during a selected time range. The data is aggregated and can be visualized per day, day of the week, week, or month during a selected time range.
Total FollowingThe total number of users the profile is following on the last day of a selected time range.
Growth of Total FollowingThis graph shows the increase (or decrease) in the number of users a profile is following during a selected time range. The data is aggregated and can be visualized per day, day of the week, week, or month during a selected time range.
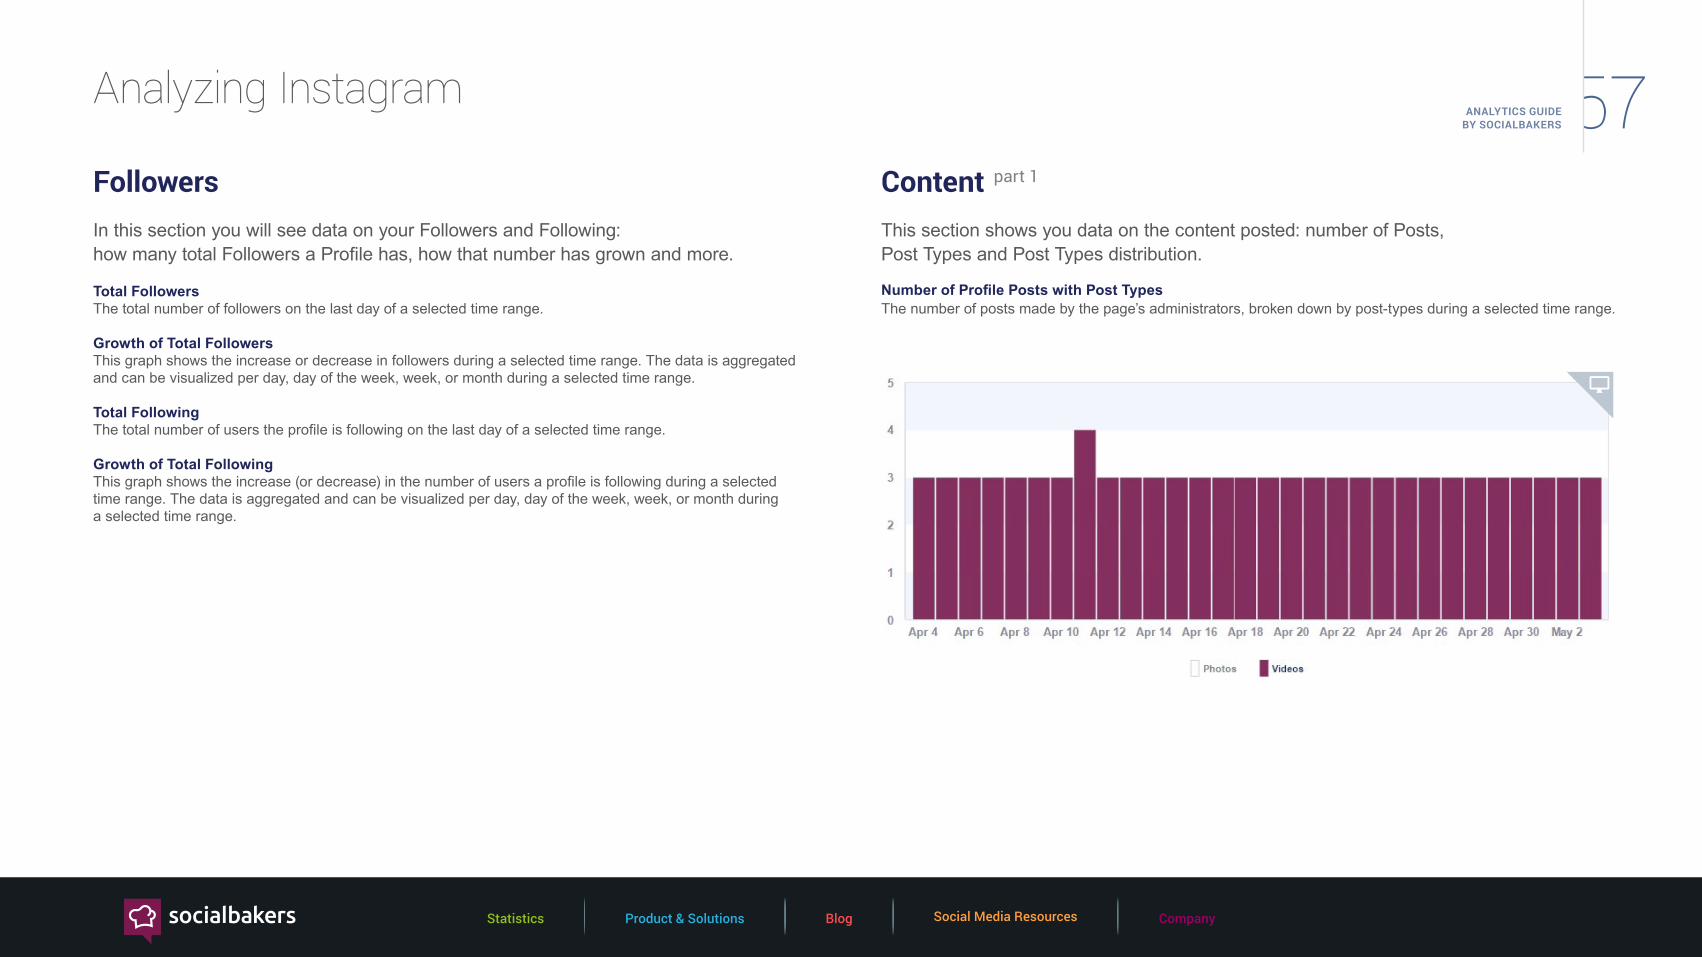
Content part 1
This section shows you data on the content posted: number of Posts, Post Types and Post Types distribution.
Number of Profile Posts with Post TypesThe number of posts made by the page’s administrators, broken down by post-types during a selected time range.

58ANALYTICS GUIDE BY SOCIALBAKERS
Statistics Social Media Resources CompanyBlogProduct & Solutions
Analyzing Instagram
Content part 2
Distribution of Photo FiltersShows the distribution of Photo filters of published Posts during the selected time period.
Distribution of Video FiltersShows the distribution of Video filters of published Posts during the selected time period.
This section ends with the content newsfeed, which allows you to filter the feed by Photo or Video.
59ANALYTICS GUIDE BY SOCIALBAKERS
Statistics Social Media Resources CompanyBlogProduct & Solutions
Analyzing Instagram
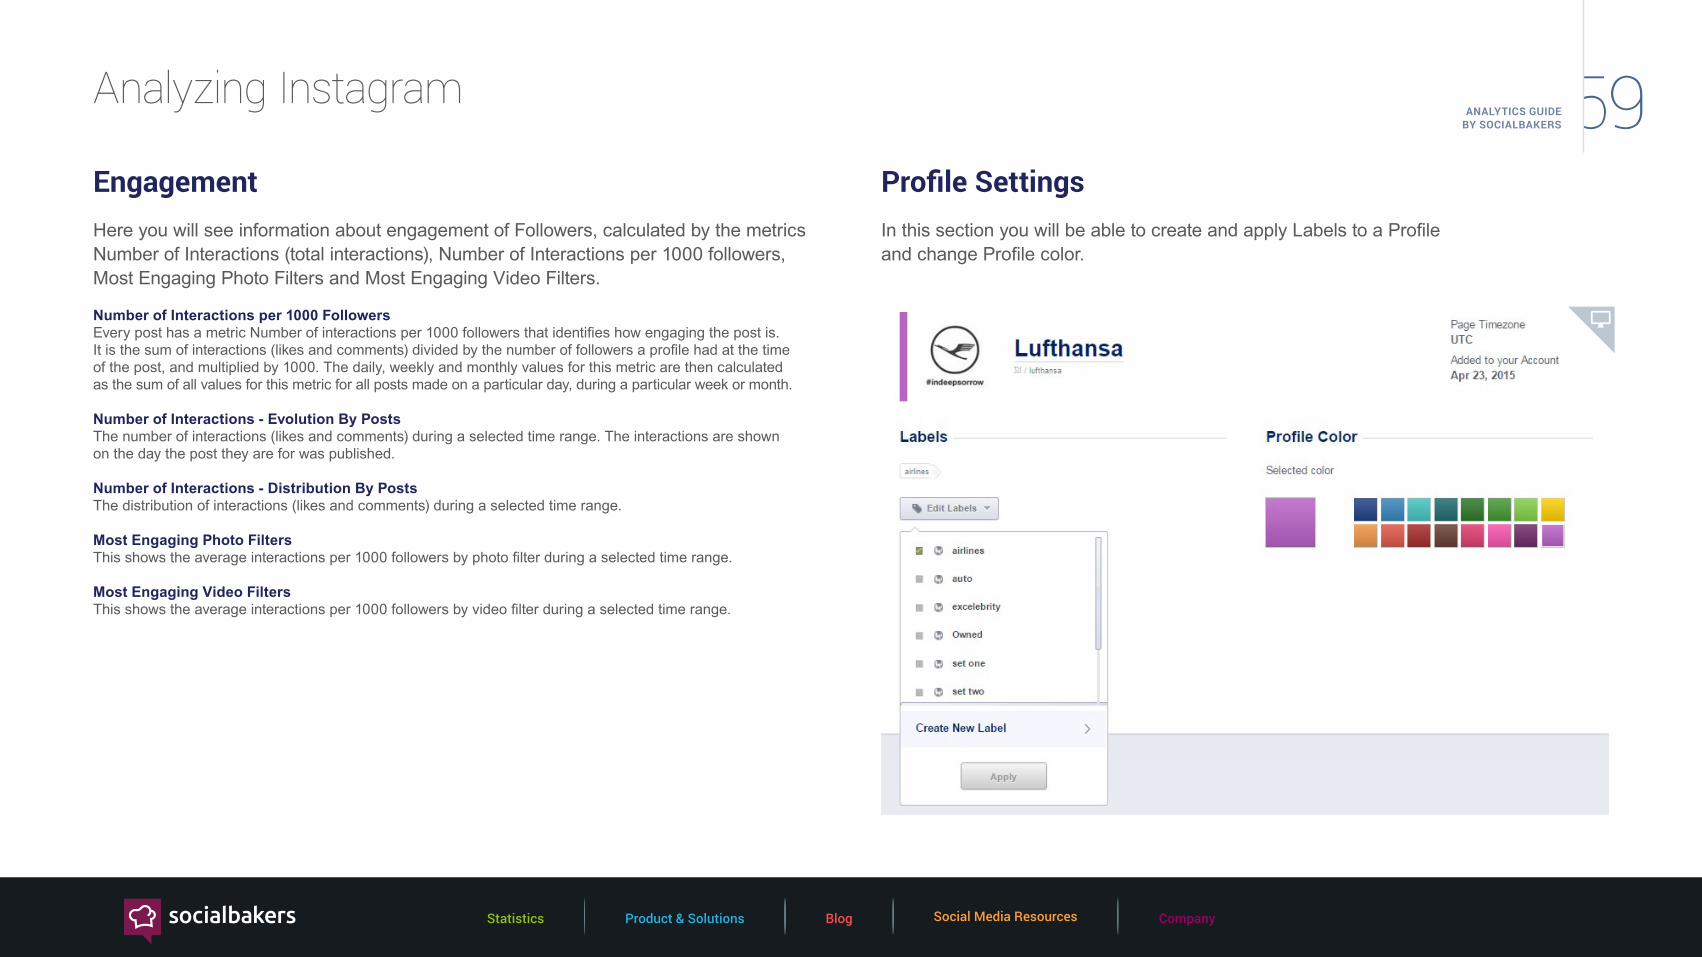
EngagementHere you will see information about engagement of Followers, calculated by the metrics Number of Interactions (total interactions), Number of Interactions per 1000 followers, Most Engaging Photo Filters and Most Engaging Video Filters.
Number of Interactions per 1000 FollowersEvery post has a metric Number of interactions per 1000 followers that identifies how engaging the post is. It is the sum of interactions (likes and comments) divided by the number of followers a profile had at the time of the post, and multiplied by 1000. The daily, weekly and monthly values for this metric are then calculated as the sum of all values for this metric for all posts made on a particular day, during a particular week or month.
Number of Interactions - Evolution By PostsThe number of interactions (likes and comments) during a selected time range. The interactions are shown on the day the post they are for was published.
Number of Interactions - Distribution By PostsThe distribution of interactions (likes and comments) during a selected time range.
Most Engaging Photo Filters This shows the average interactions per 1000 followers by photo filter during a selected time range.
Most Engaging Video FiltersThis shows the average interactions per 1000 followers by video filter during a selected time range.
Profile SettingsIn this section you will be able to create and apply Labels to a Profile and change Profile color.
60ANALYTICS GUIDE BY SOCIALBAKERS
Statistics Social Media Resources CompanyBlogProduct & Solutions
Content Newsfeed
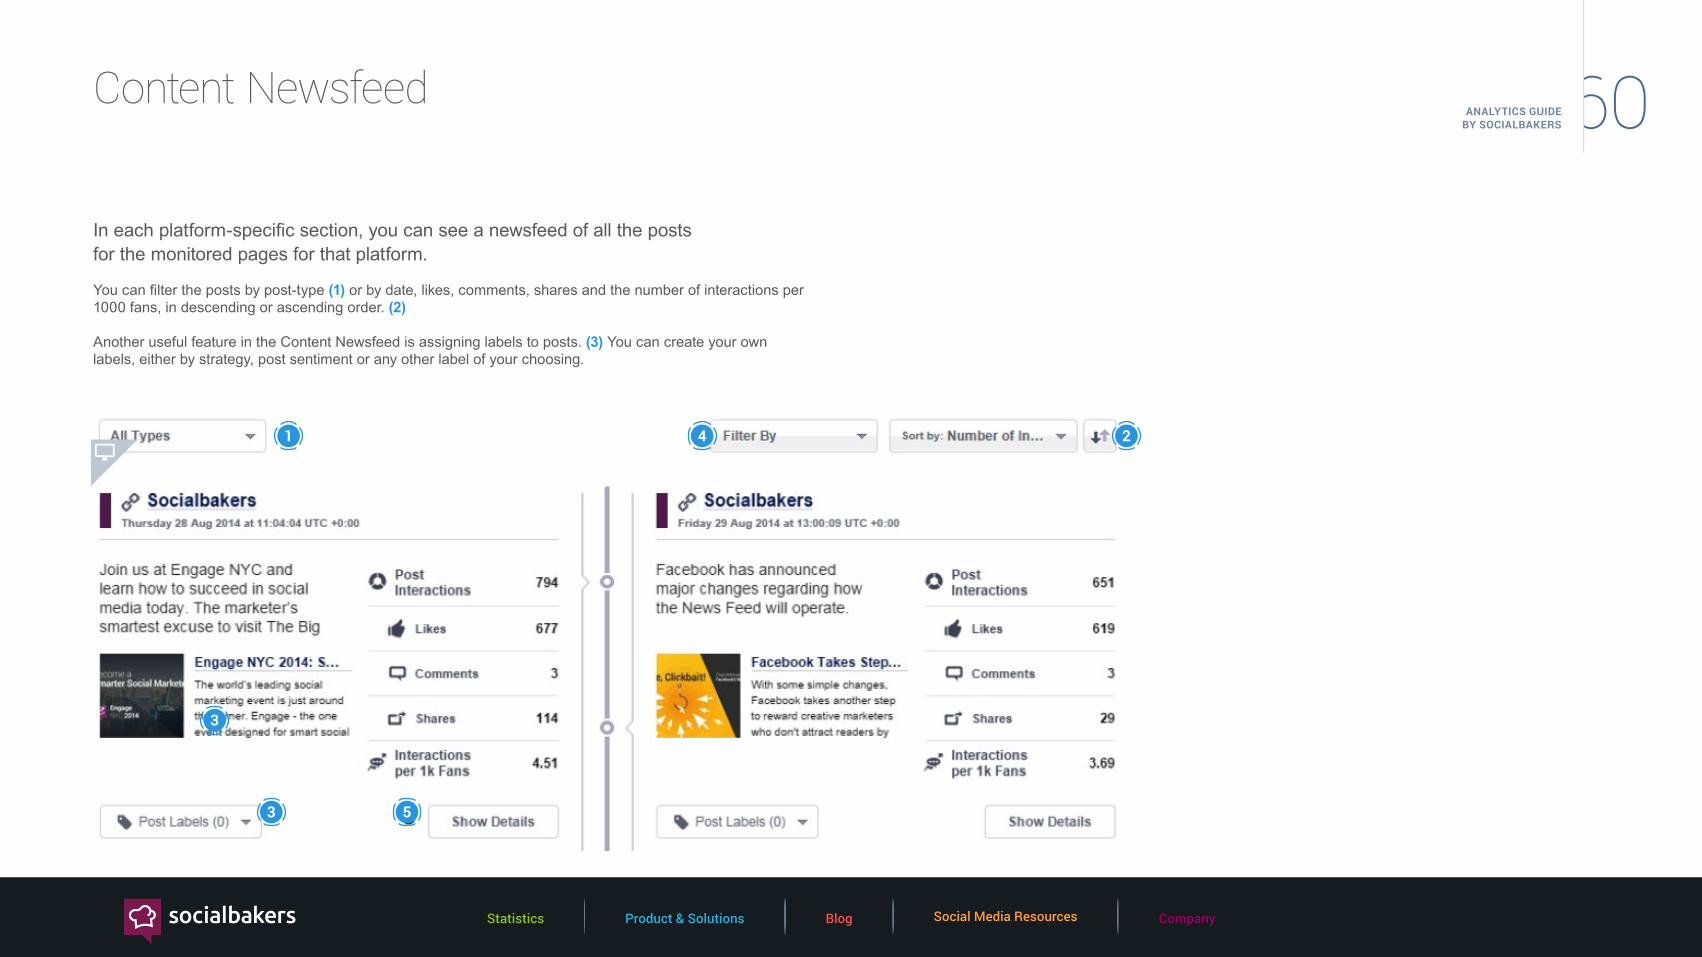
In each platform-specific section, you can see a newsfeed of all the posts for the monitored pages for that platform.
You can filter the posts by post-type (1) or by date, likes, comments, shares and the number of interactions per 1000 fans, in descending or ascending order. (2)
Another useful feature in the Content Newsfeed is assigning labels to posts. (3) You can create your own labels, either by strategy, post sentiment or any other label of your choosing.
1 24
3
3 5
61ANALYTICS GUIDE BY SOCIALBAKERS
Statistics Social Media Resources CompanyBlogProduct & Solutions
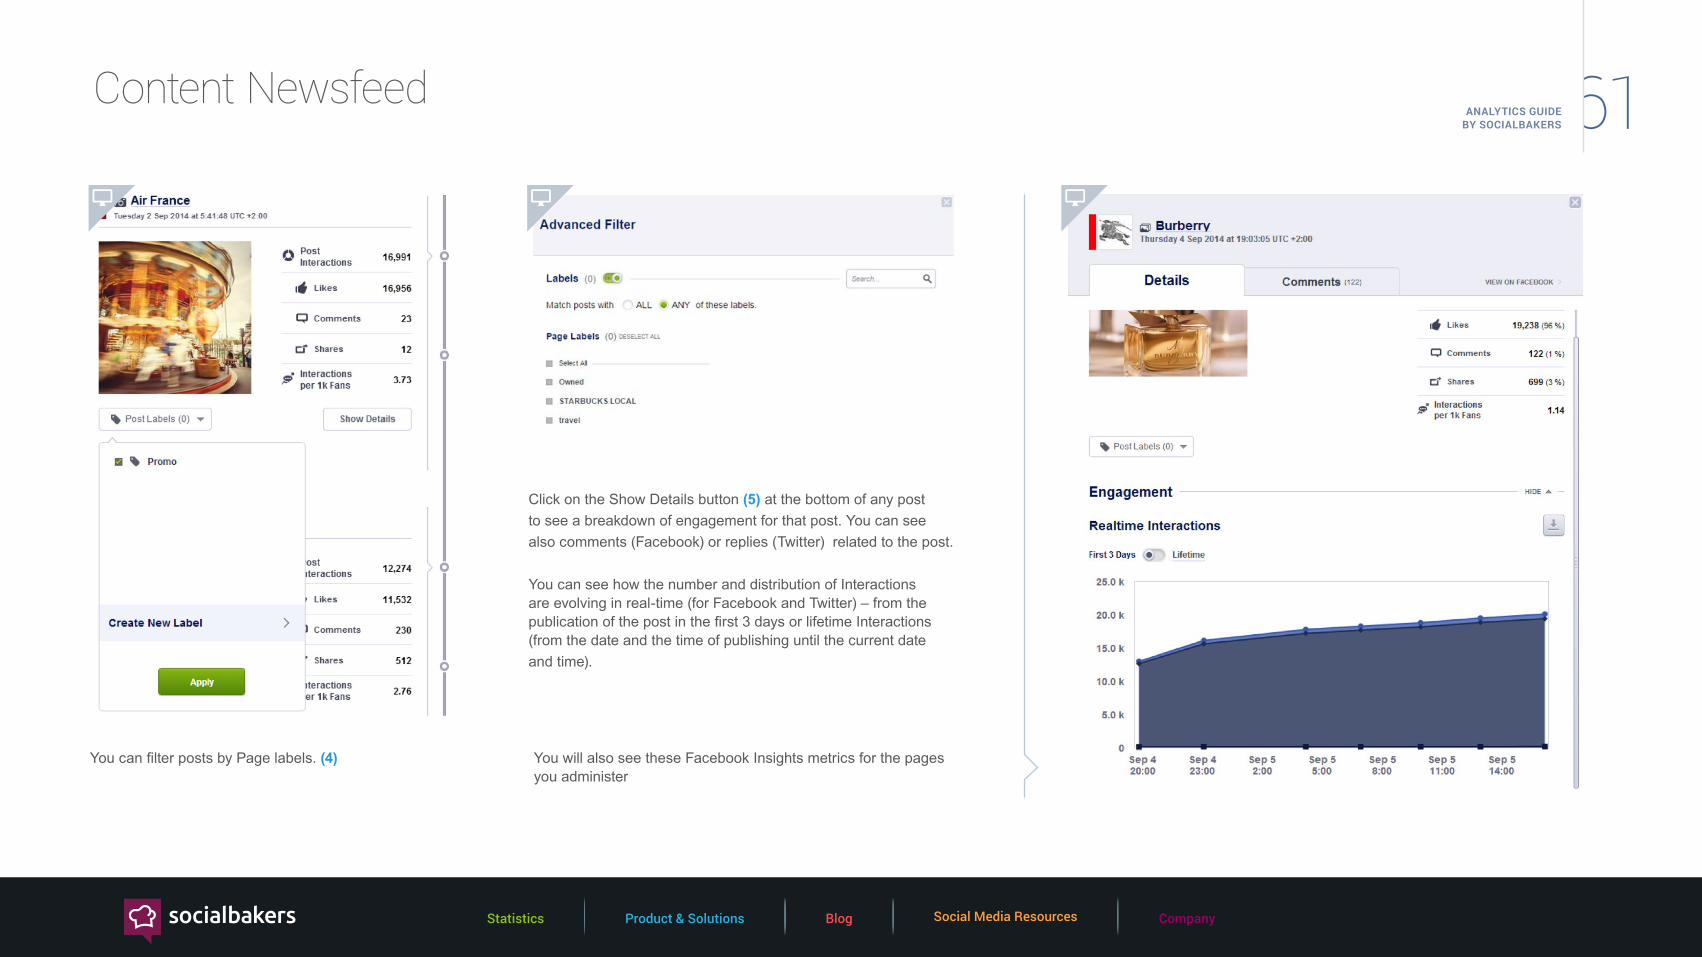
Click on the Show Details button (5) at the bottom of any post to see a breakdown of engagement for that post. You can see also comments (Facebook) or replies (Twitter) related to the post.
You can see how the number and distribution of Interactions are evolving in real-time (for Facebook and Twitter) – from the publication of the post in the first 3 days or lifetime Interactions (from the date and the time of publishing until the current date and time).
You can filter posts by Page labels. (4) You will also see these Facebook Insights metrics for the pages you administer
Content Newsfeed
62ANALYTICS GUIDE BY SOCIALBAKERS
Statistics Social Media Resources CompanyBlogProduct & Solutions
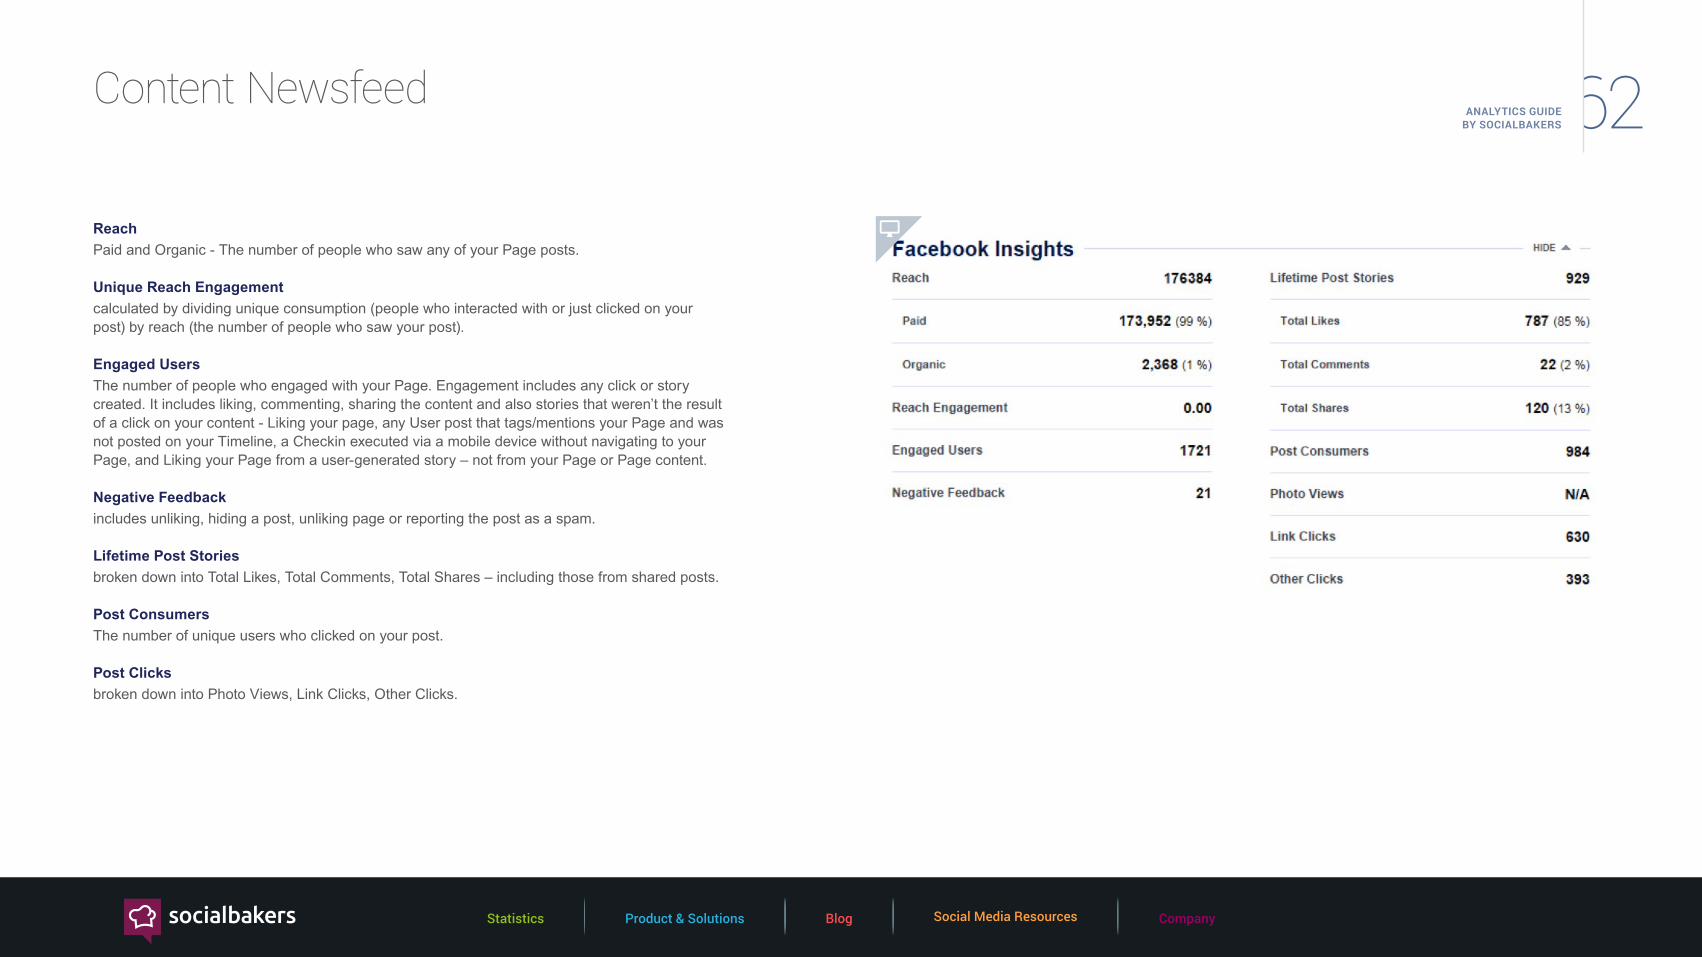
ReachPaid and Organic - The number of people who saw any of your Page posts.
Unique Reach Engagementcalculated by dividing unique consumption (people who interacted with or just clicked on your post) by reach (the number of people who saw your post).
Engaged UsersThe number of people who engaged with your Page. Engagement includes any click or story created. It includes liking, commenting, sharing the content and also stories that weren’t the result of a click on your content - Liking your page, any User post that tags/mentions your Page and was not posted on your Timeline, a Checkin executed via a mobile device without navigating to your Page, and Liking your Page from a user-generated story – not from your Page or Page content.
Negative Feedbackincludes unliking, hiding a post, unliking page or reporting the post as a spam.
Lifetime Post Storiesbroken down into Total Likes, Total Comments, Total Shares – including those from shared posts.
Post ConsumersThe number of unique users who clicked on your post.
Post Clicksbroken down into Photo Views, Link Clicks, Other Clicks.
Content Newsfeed
63ANALYTICS GUIDE BY SOCIALBAKERS
Statistics Social Media Resources CompanyBlogProduct & Solutions
Reporting
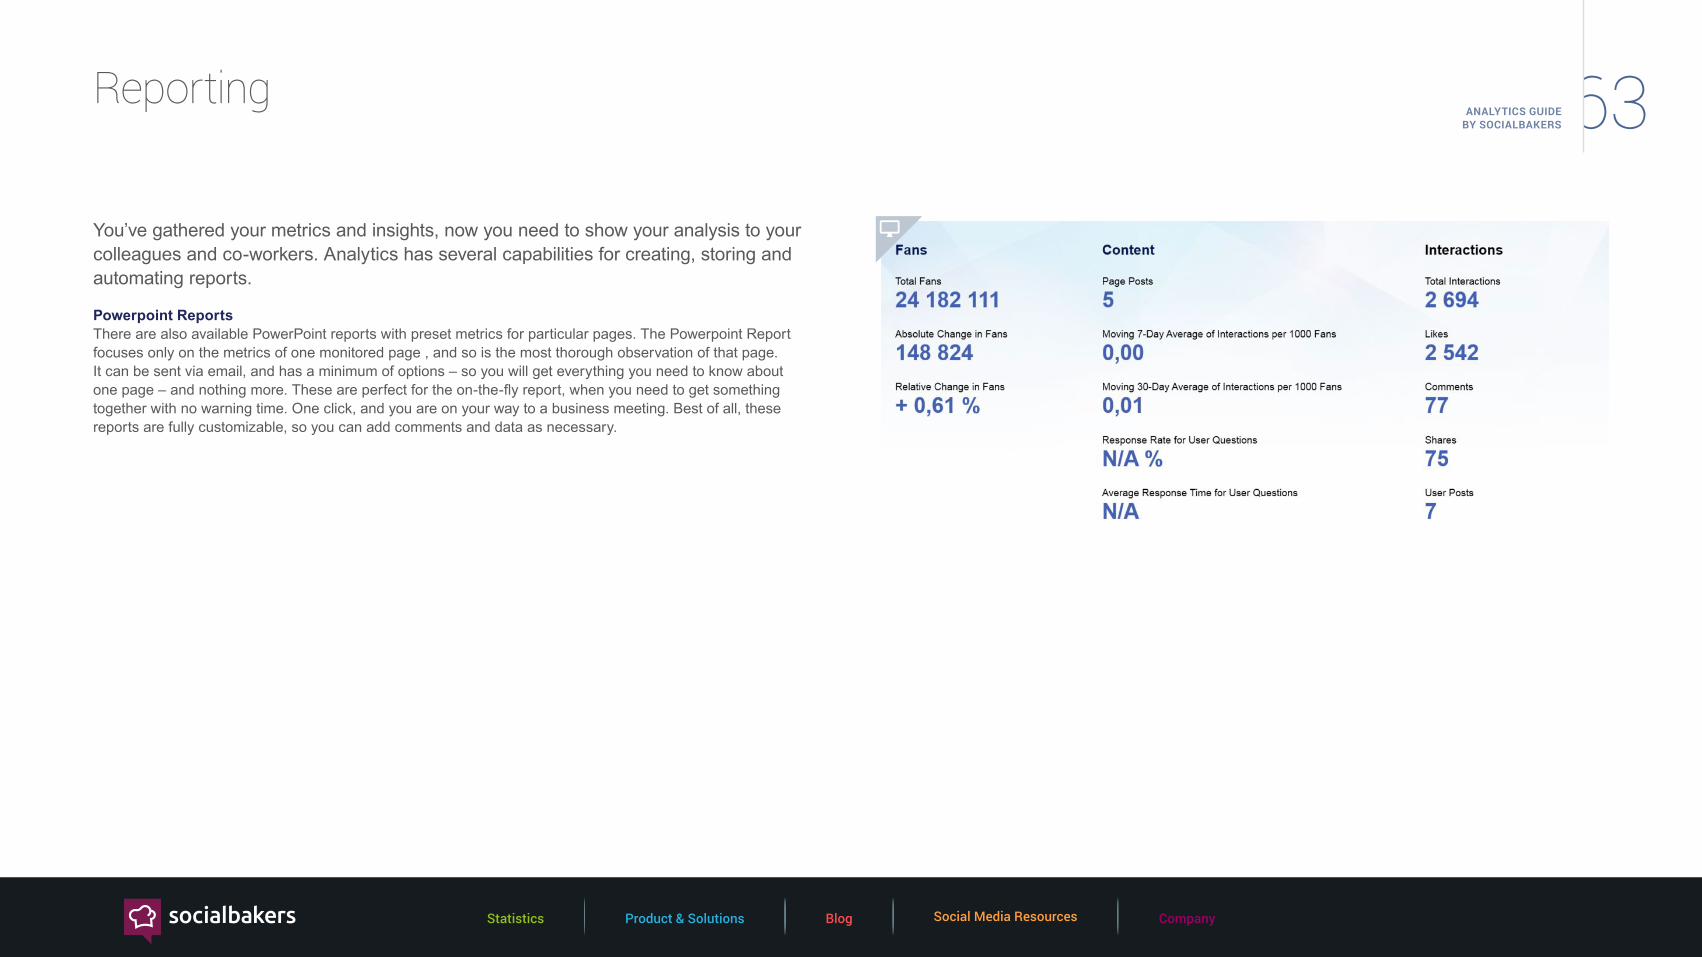
You’ve gathered your metrics and insights, now you need to show your analysis to your colleagues and co-workers. Analytics has several capabilities for creating, storing and automating reports.
Powerpoint ReportsThere are also available PowerPoint reports with preset metrics for particular pages. The Powerpoint Report focuses only on the metrics of one monitored page , and so is the most thorough observation of that page. It can be sent via email, and has a minimum of options – so you will get everything you need to know about one page – and nothing more. These are perfect for the on-the-fly report, when you need to get something together with no warning time. One click, and you are on your way to a business meeting. Best of all, these reports are fully customizable, so you can add comments and data as necessary.
64ANALYTICS GUIDE BY SOCIALBAKERS
Statistics Social Media Resources CompanyBlogProduct & Solutions
Reporting
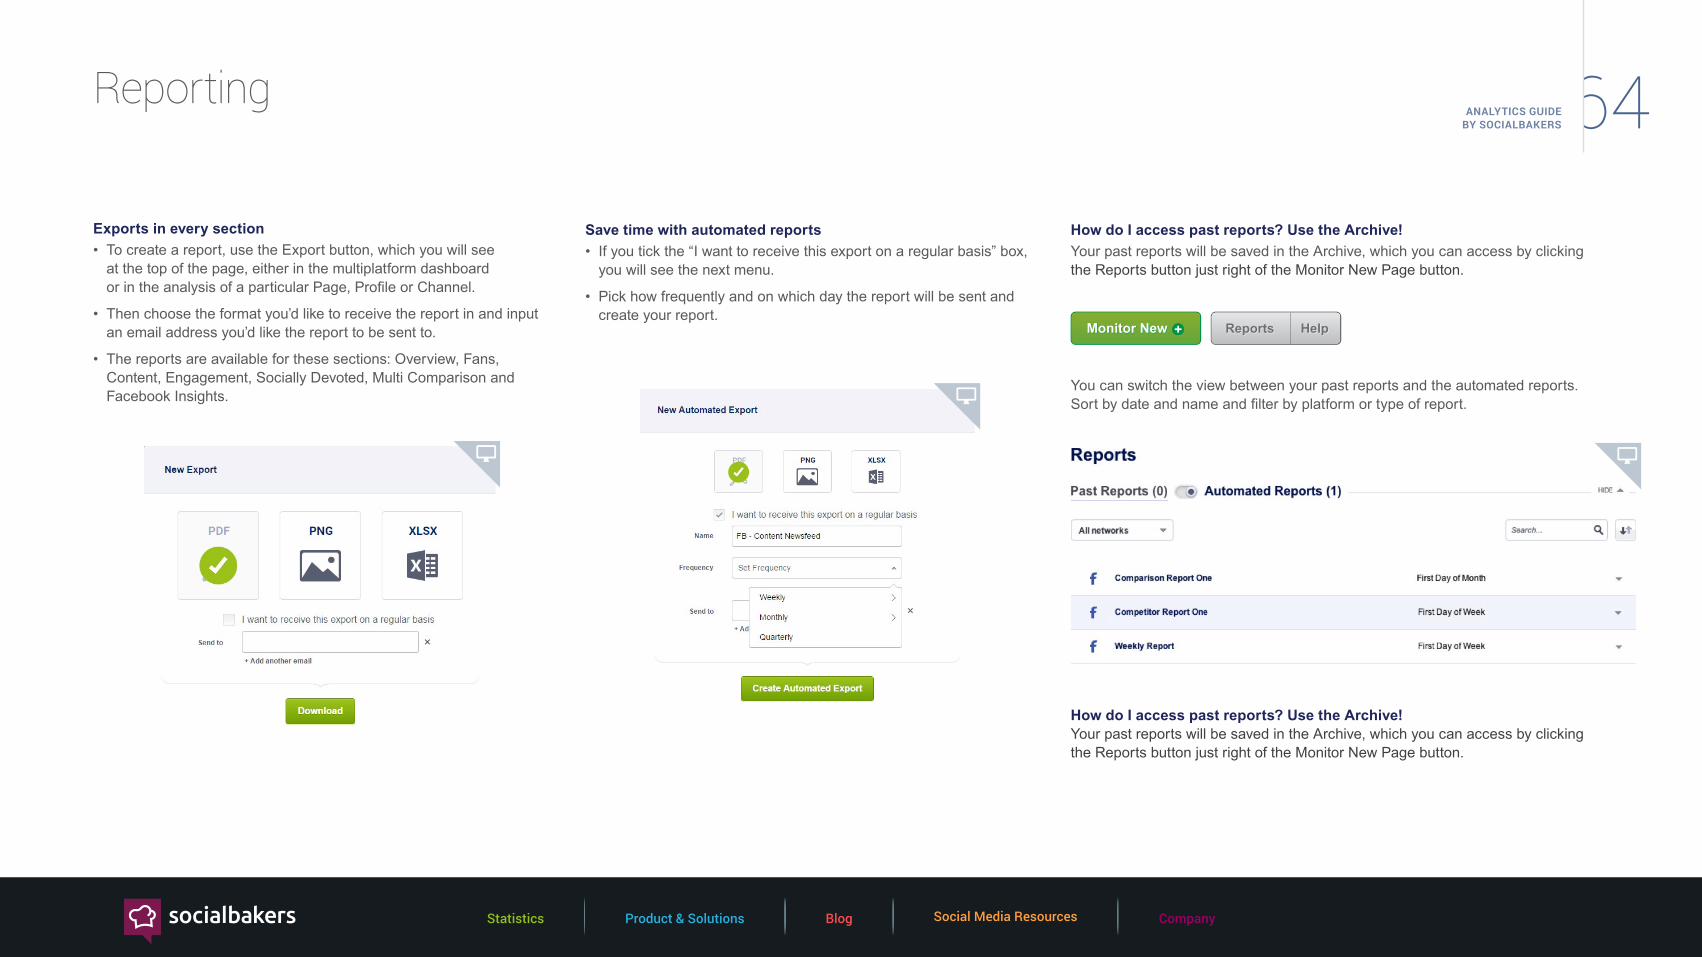
Exports in every section• To create a report, use the Export button, which you will see
at the top of the page, either in the multiplatform dashboard or in the analysis of a particular Page, Profile or Channel.
• Then choose the format you’d like to receive the report in and input an email address you’d like the report to be sent to.
• The reports are available for these sections: Overview, Fans, Content, Engagement, Socially Devoted, Multi Comparison and Facebook Insights.
Save time with automated reports• If you tick the “I want to receive this export on a regular basis” box,
you will see the next menu.
• Pick how frequently and on which day the report will be sent and create your report.
How do I access past reports? Use the Archive!Your past reports will be saved in the Archive, which you can access by clicking the Reports button just right of the Monitor New Page button.
You can switch the view between your past reports and the automated reports. Sort by date and name and filter by platform or type of report.
ReportsReports HelpHelp
How do I access past reports? Use the Archive!Your past reports will be saved in the Archive, which you can access by clicking the Reports button just right of the Monitor New Page button.
65ANALYTICS GUIDE BY SOCIALBAKERS
Statistics Social Media Resources CompanyBlogProduct & Solutions
Settings section
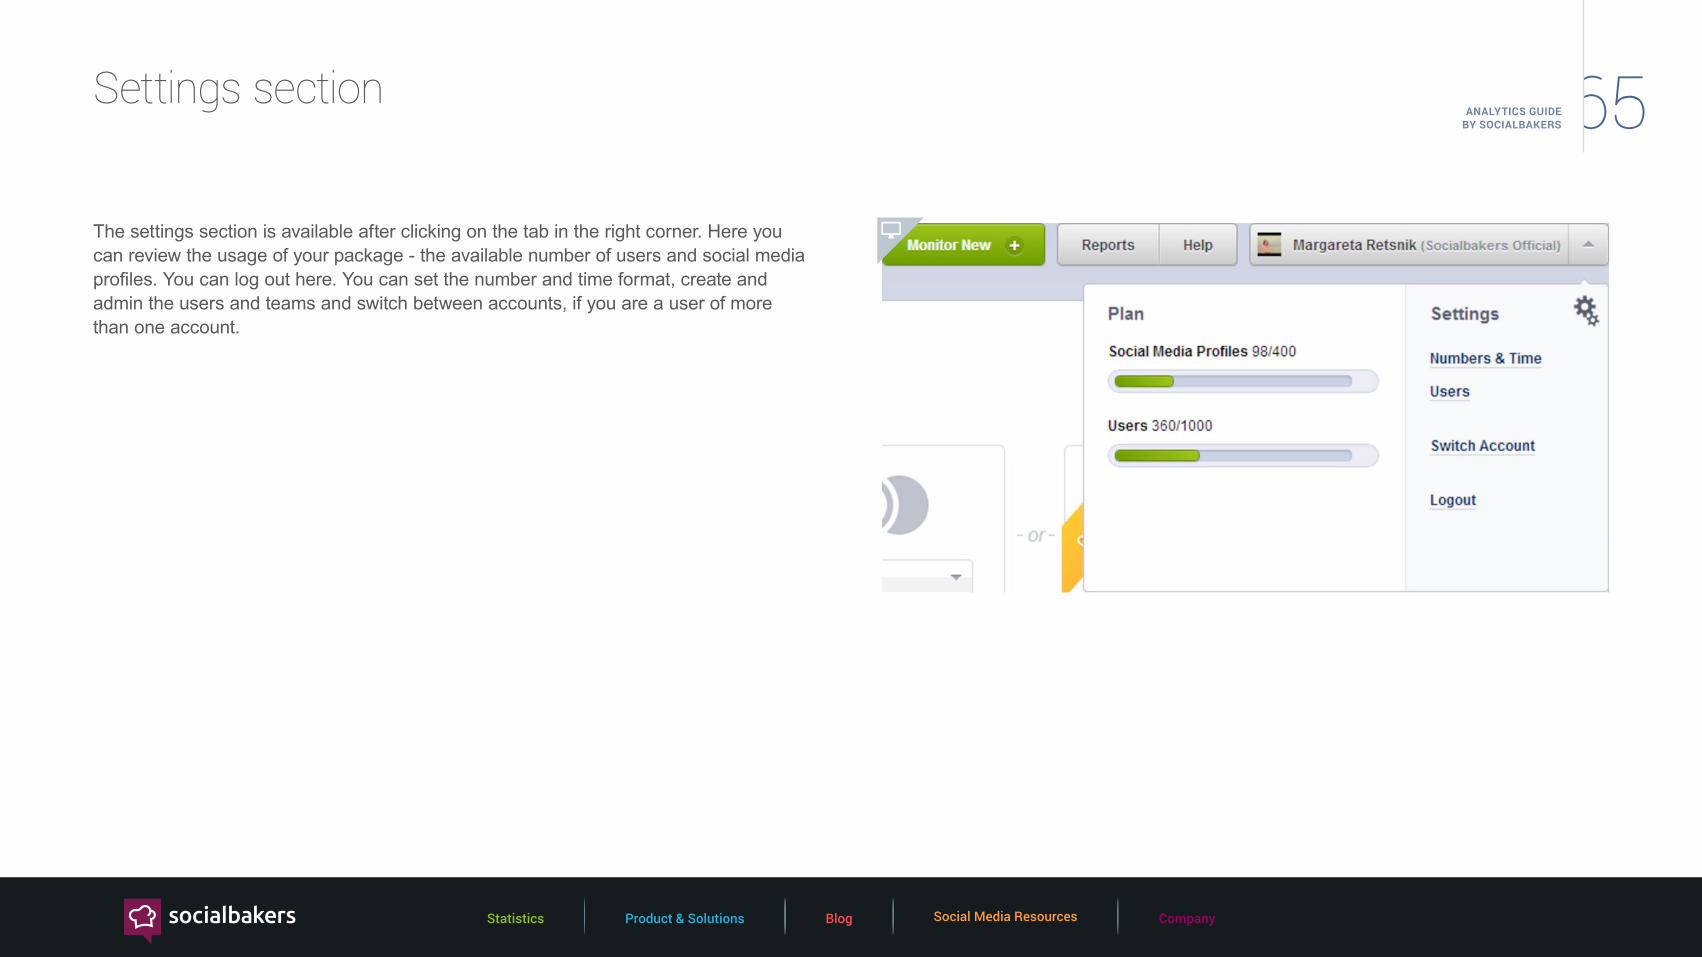
The settings section is available after clicking on the tab in the right corner. Here you can review the usage of your package - the available number of users and social media profiles. You can log out here. You can set the number and time format, create and admin the users and teams and switch between accounts, if you are a user of more than one account.
66ANALYTICS GUIDE BY SOCIALBAKERS
Statistics Social Media Resources CompanyBlogProduct & Solutions
Numbers & Time
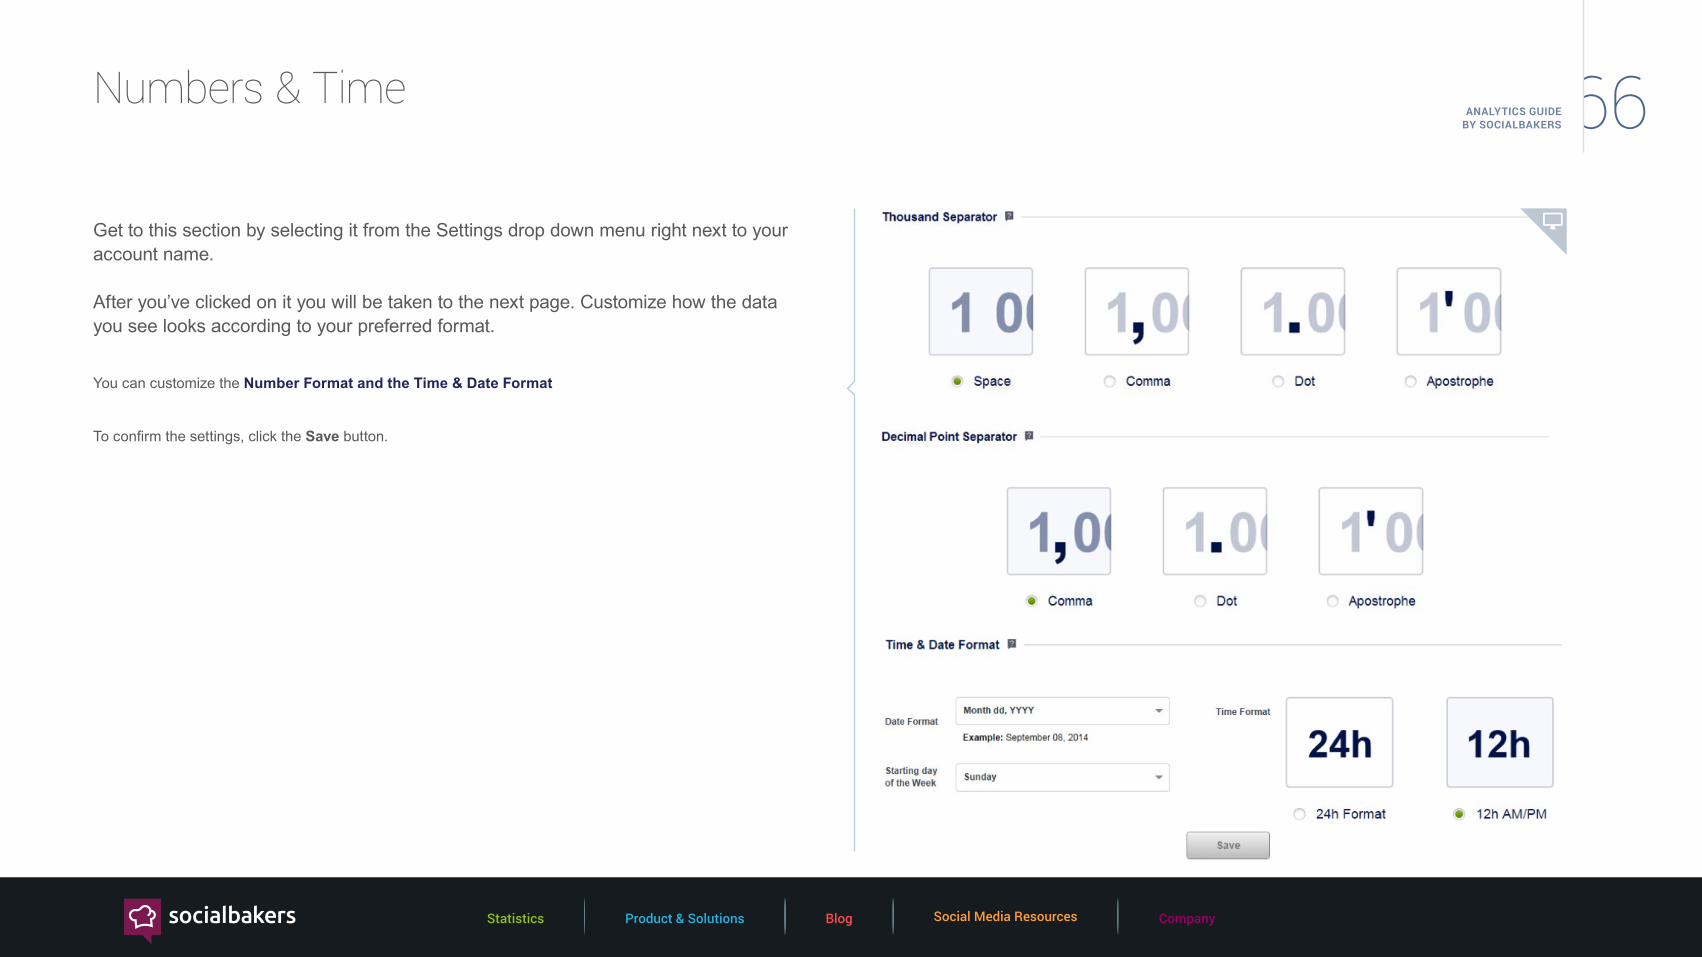
Get to this section by selecting it from the Settings drop down menu right next to your account name.
After you’ve clicked on it you will be taken to the next page. Customize how the data you see looks according to your preferred format.
You can customize the Number Format and the Time & Date Format
To confirm the settings, click the Save button.
67ANALYTICS GUIDE BY SOCIALBAKERS
Statistics Social Media Resources CompanyBlogProduct & Solutions
General settings
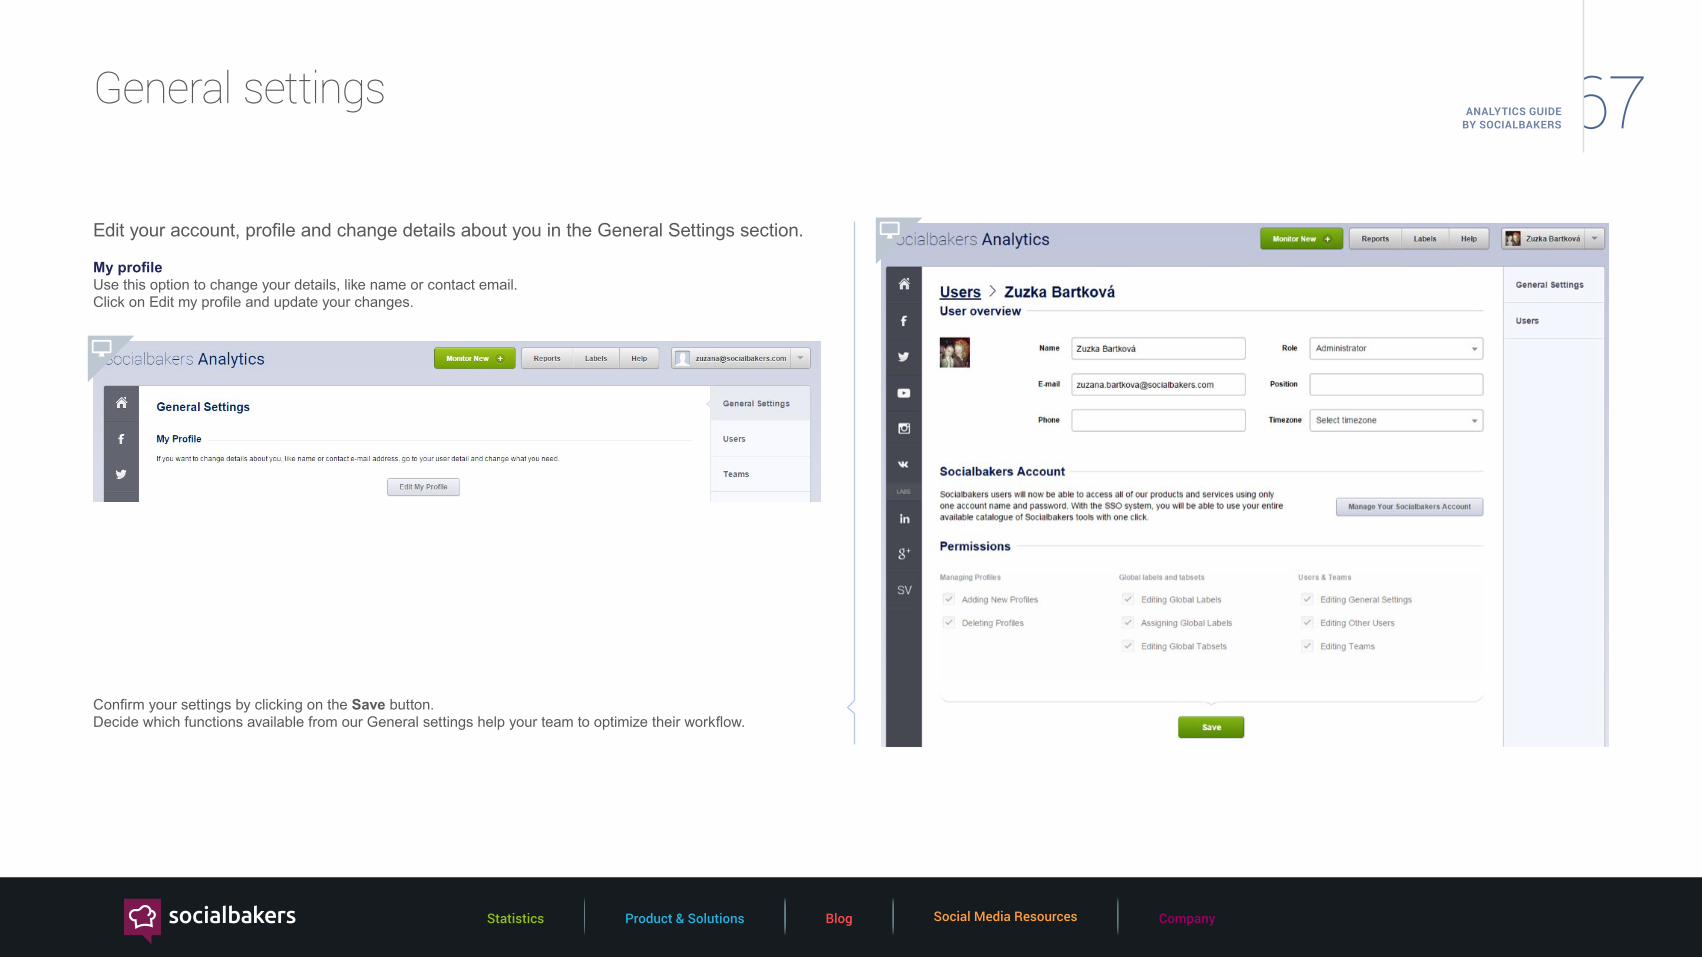
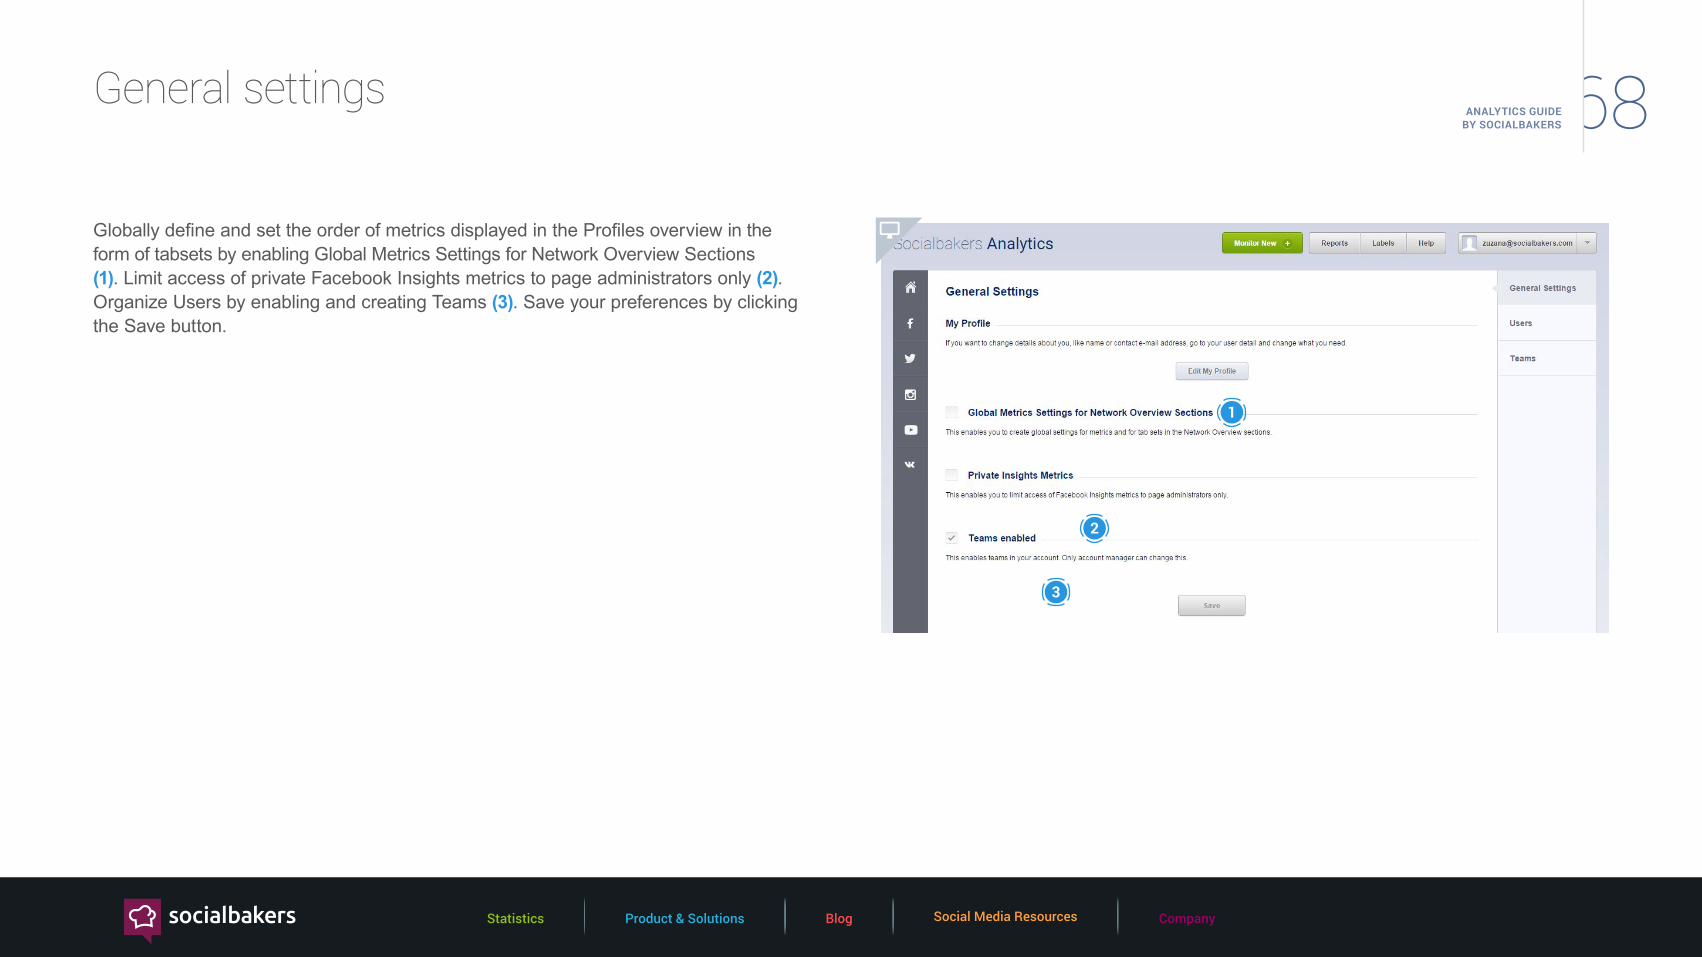
Edit your account, profile and change details about you in the General Settings section.
My profileUse this option to change your details, like name or contact email. Click on Edit my profile and update your changes.
Confirm your settings by clicking on the Save button.Decide which functions available from our General settings help your team to optimize their workflow.
68ANALYTICS GUIDE BY SOCIALBAKERS
Statistics Social Media Resources CompanyBlogProduct & Solutions
General settings
Globally define and set the order of metrics displayed in the Profiles overview in the form of tabsets by enabling Global Metrics Settings for Network Overview Sections (1). Limit access of private Facebook Insights metrics to page administrators only (2). Organize Users by enabling and creating Teams (3). Save your preferences by clicking the Save button.
1
2
3
69ANALYTICS GUIDE BY SOCIALBAKERS
Statistics Social Media Resources CompanyBlogProduct & Solutions
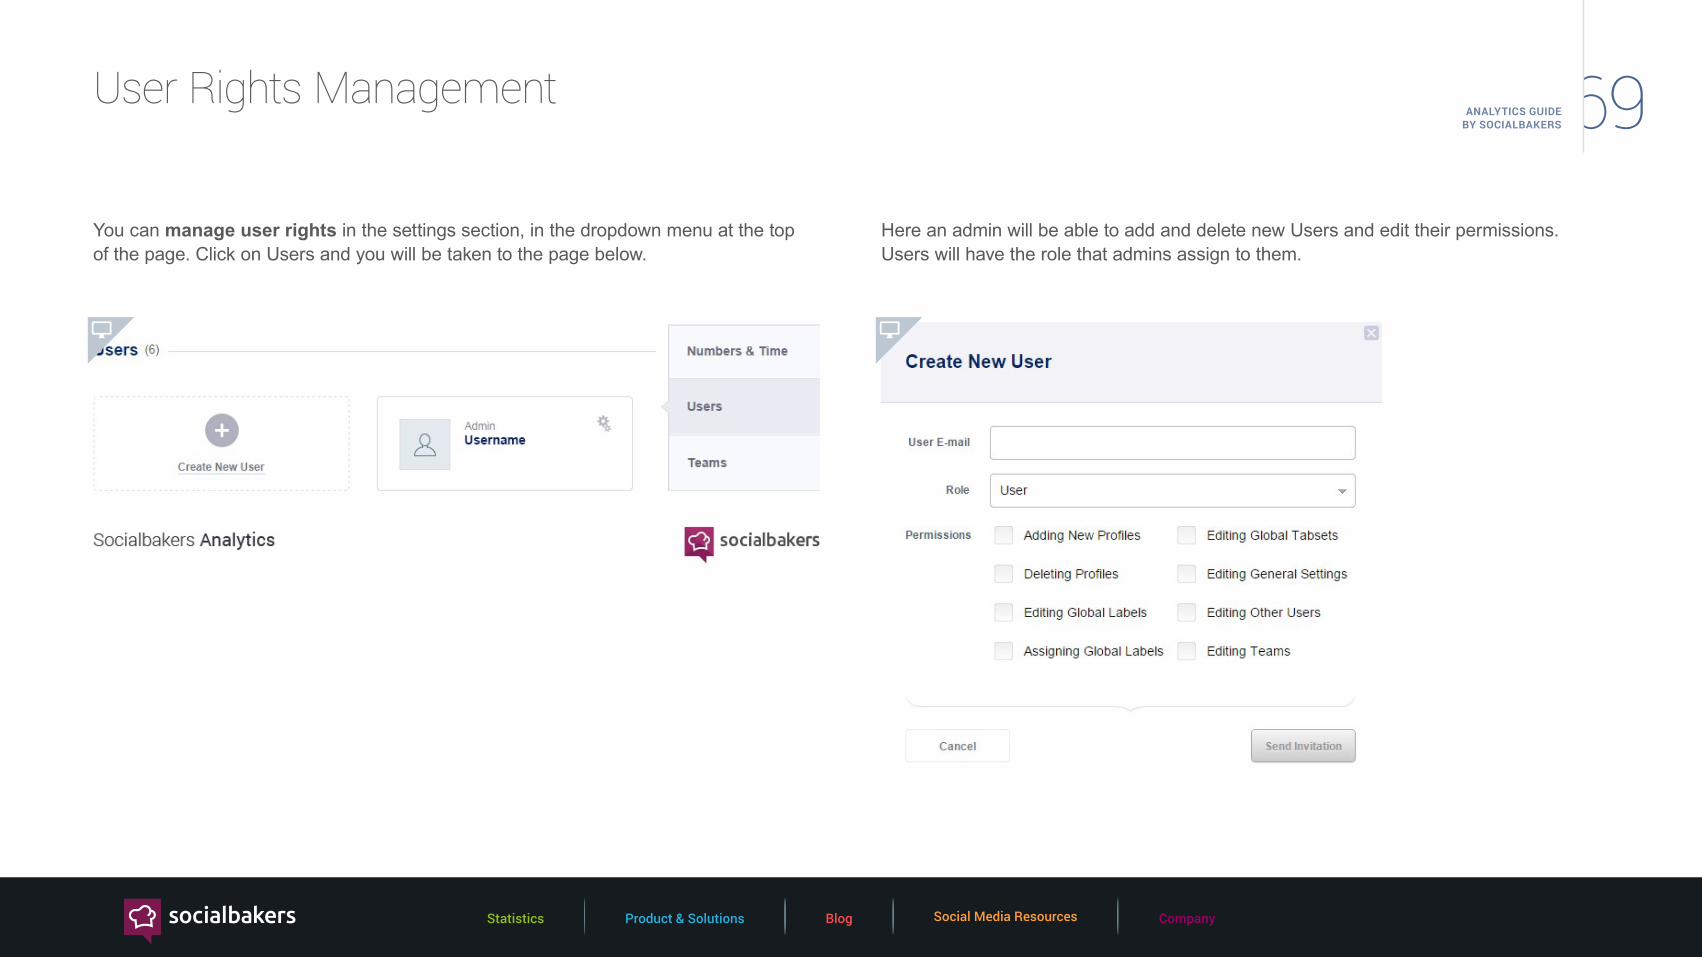
User Rights Management
You can manage user rights in the settings section, in the dropdown menu at the top of the page. Click on Users and you will be taken to the page below.
Here an admin will be able to add and delete new Users and edit their permissions. Users will have the role that admins assign to them.
70ANALYTICS GUIDE BY SOCIALBAKERS
Statistics Social Media Resources CompanyBlogProduct & Solutions
User Rights Management
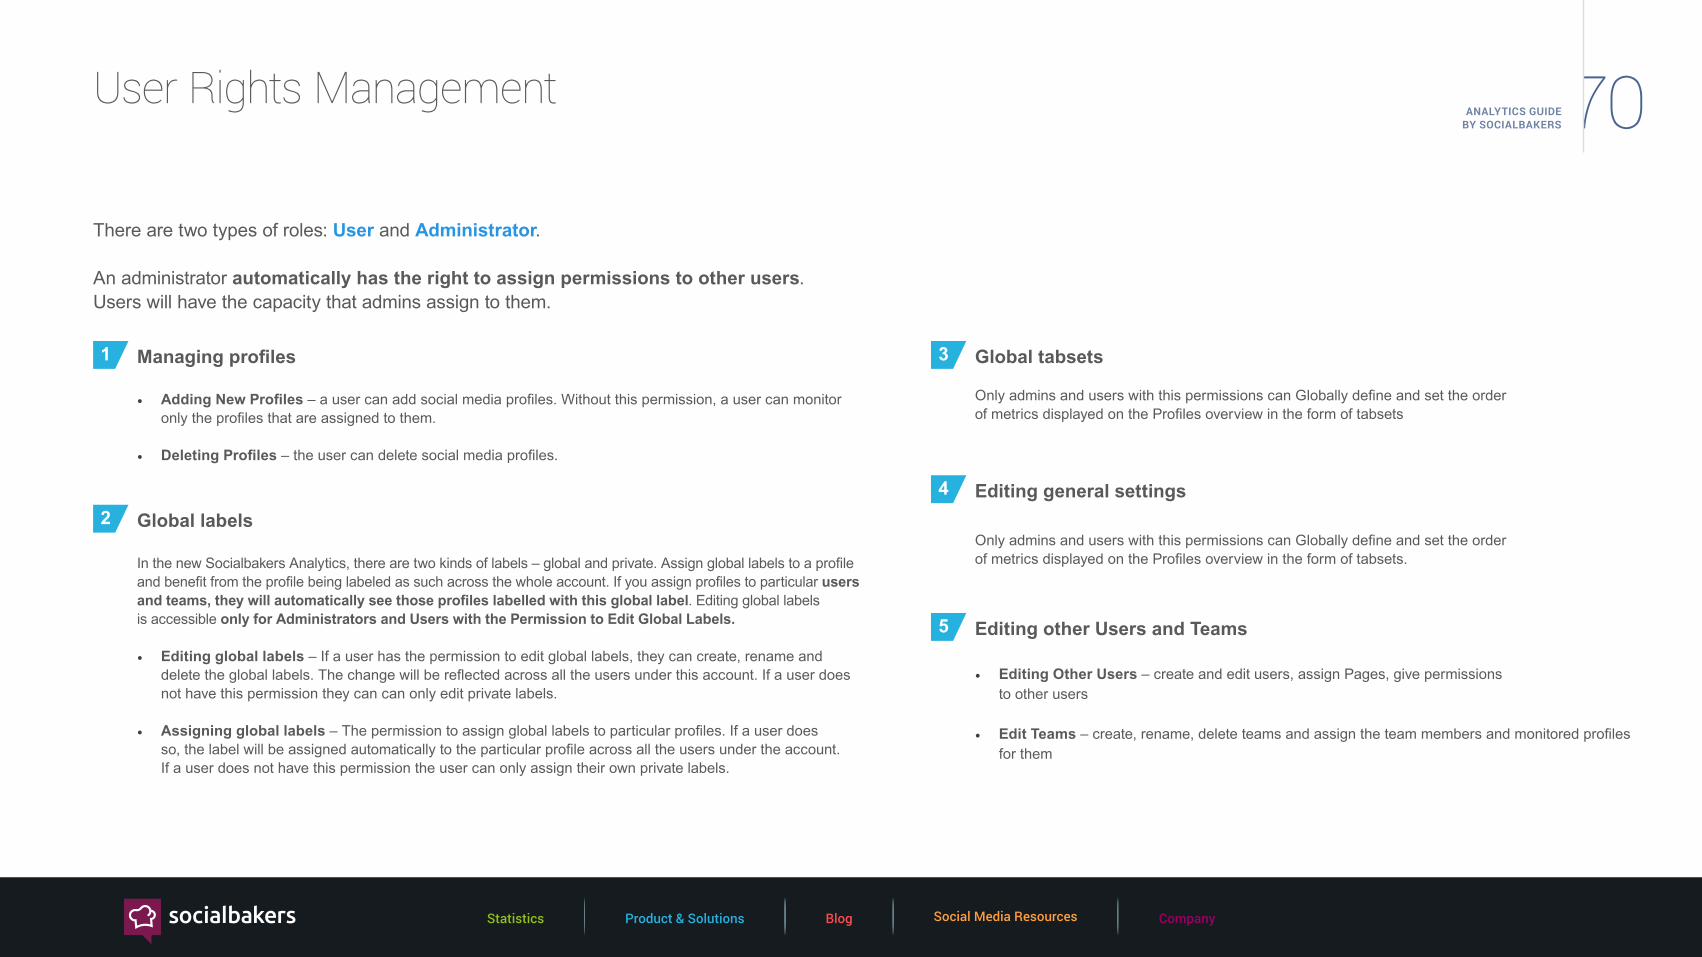
There are two types of roles: User and Administrator.
An administrator automatically has the right to assign permissions to other users. Users will have the capacity that admins assign to them.
Managing profiles
• Adding New Profiles – a user can add social media profiles. Without this permission, a user can monitor only the profiles that are assigned to them.
• Deleting Profiles – the user can delete social media profiles.
Global labels
In the new Socialbakers Analytics, there are two kinds of labels – global and private. Assign global labels to a profile and benefit from the profile being labeled as such across the whole account. If you assign profiles to particular users and teams, they will automatically see those profiles labelled with this global label. Editing global labels is accessible only for Administrators and Users with the Permission to Edit Global Labels.
• Editing global labels – If a user has the permission to edit global labels, they can create, rename and delete the global labels. The change will be reflected across all the users under this account. If a user does not have this permission they can can only edit private labels.
• Assigning global labels – The permission to assign global labels to particular profiles. If a user does so, the label will be assigned automatically to the particular profile across all the users under the account. If a user does not have this permission the user can only assign their own private labels.
1
2
Global tabsets
Only admins and users with this permissions can Globally define and set the order of metrics displayed on the Profiles overview in the form of tabsets
Editing general settings
Only admins and users with this permissions can Globally define and set the order of metrics displayed on the Profiles overview in the form of tabsets.
Editing other Users and Teams
• Editing Other Users – create and edit users, assign Pages, give permissions to other users
• Edit Teams – create, rename, delete teams and assign the team members and monitored profiles for them
3
4
5
71ANALYTICS GUIDE BY SOCIALBAKERS
Statistics Social Media Resources CompanyBlogProduct & Solutions
Teams
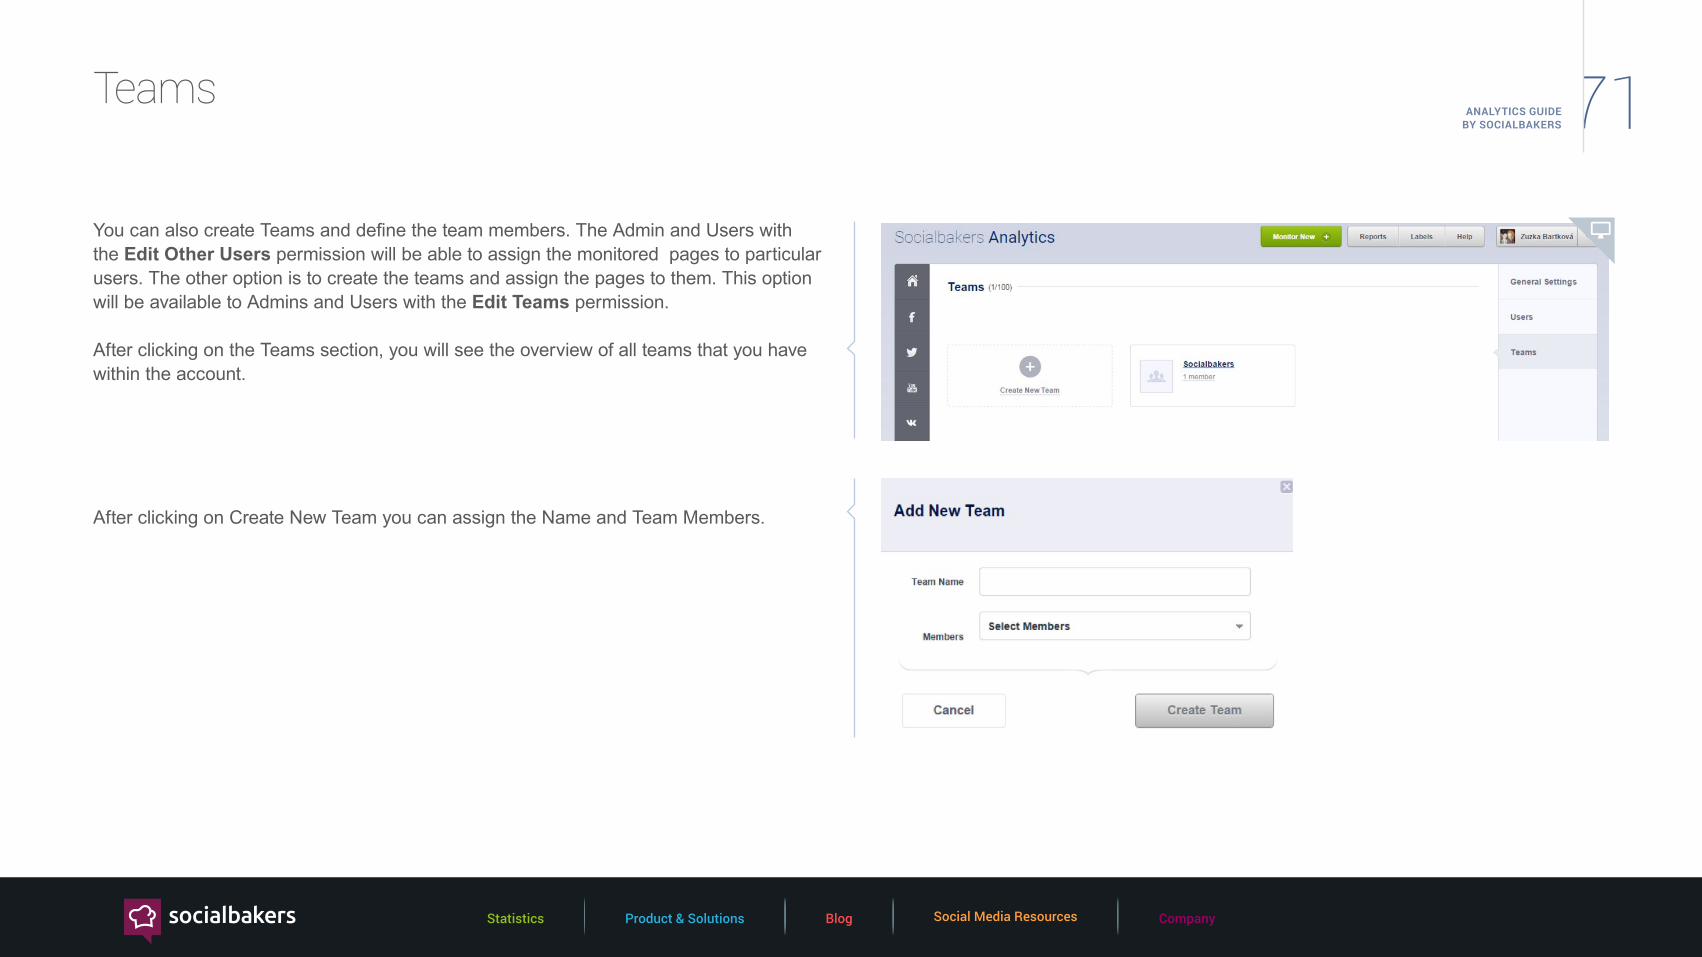
You can also create Teams and define the team members. The Admin and Users with the Edit Other Users permission will be able to assign the monitored pages to particular users. The other option is to create the teams and assign the pages to them. This option will be available to Admins and Users with the Edit Teams permission.
After clicking on the Teams section, you will see the overview of all teams that you have within the account.
After clicking on Create New Team you can assign the Name and Team Members.
72ANALYTICS GUIDE BY SOCIALBAKERS
Statistics Social Media Resources CompanyBlogProduct & Solutions
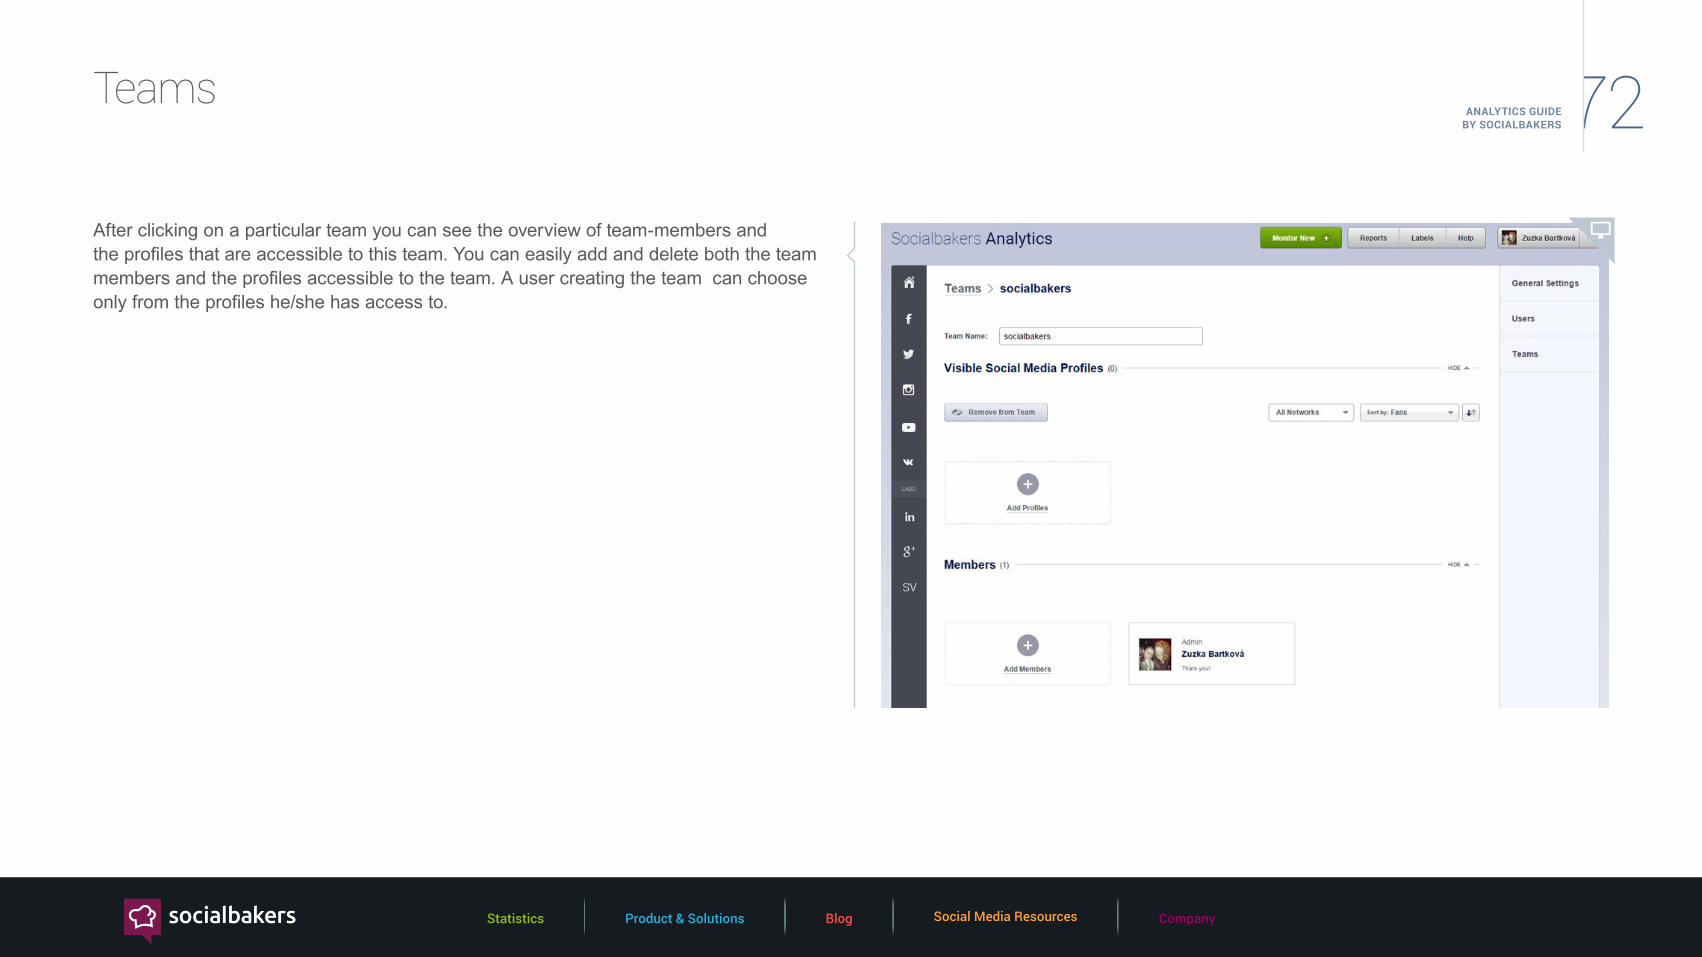
Teams
After clicking on a particular team you can see the overview of team-members and the profiles that are accessible to this team. You can easily add and delete both the team members and the profiles accessible to the team. A user creating the team can choose only from the profiles he/she has access to.
73ANALYTICS GUIDE BY SOCIALBAKERS
Statistics Social Media Resources CompanyBlogProduct & Solutions
By clicking on the icon of LinkedIn or G+, you will be redirected to a landing page where you can access the application for monitoring these 2 platforms. You just need to add the company social profiles you desire. After that, you will be able to receive visually appealing PowerPoint reports with powerful social media metrics.
If you are interested in accessing either of these applications, please contact your account manager or [email protected].
74ANALYTICS GUIDE BY SOCIALBAKERS
Statistics Social Media Resources CompanyBlogProduct & Solutions
Social Visits
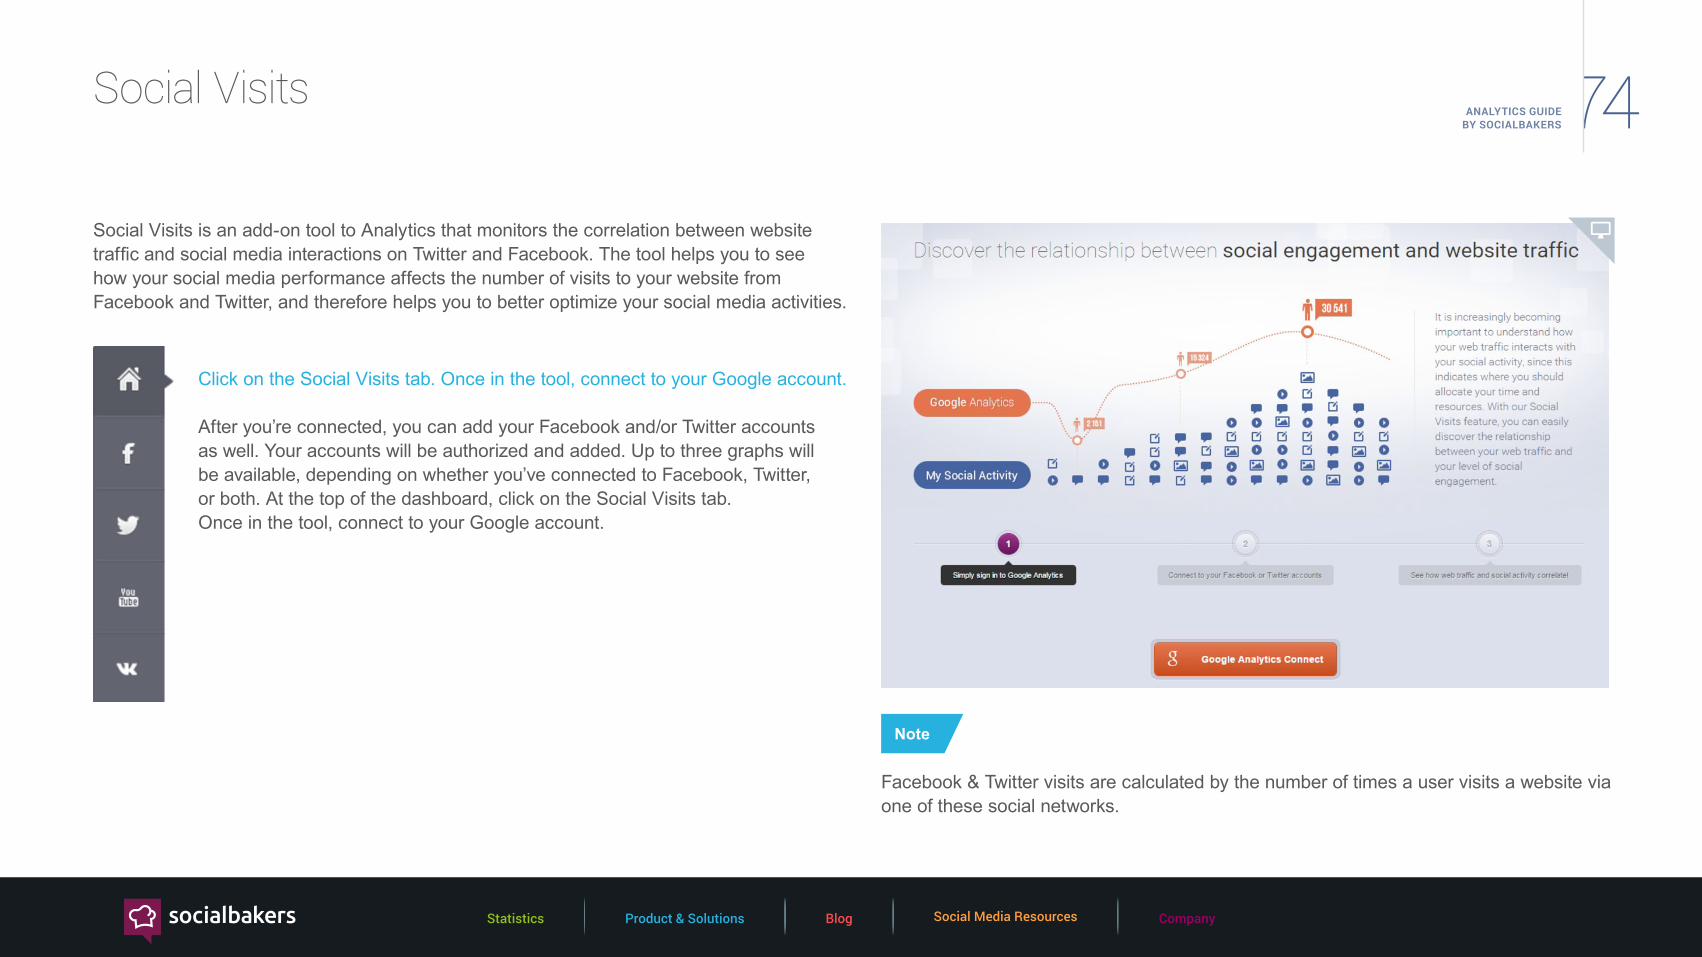
Social Visits is an add-on tool to Analytics that monitors the correlation between website traffic and social media interactions on Twitter and Facebook. The tool helps you to see how your social media performance affects the number of visits to your website from Facebook and Twitter, and therefore helps you to better optimize your social media activities.
Facebook & Twitter visits are calculated by the number of times a user visits a website via one of these social networks.
Click on the Social Visits tab. Once in the tool, connect to your Google account.
After you’re connected, you can add your Facebook and/or Twitter accounts as well. Your accounts will be authorized and added. Up to three graphs will be available, depending on whether you’ve connected to Facebook, Twitter, or both. At the top of the dashboard, click on the Social Visits tab. Once in the tool, connect to your Google account.
Note
We trust you found this guide useful. Don’t hesitate to reach out to us if you have any further questions.
analytics.socialbakers.com
You can reach our support team at
Get more information at
Contact Social Media Experts