Embed Size (px)
Citation preview

VIETNAM - THE NETHERLANDS PROJECT ON
DEVELOPMENT ECONOMICS
Socio-Economic Analysis of Shifting Cultivation versus Agroforestry System in
The Upper Stream of Lower Mekong Watershed in Dak Lak Province
by
PHAM TO MAI
A thesis submitted in partial fulfillment of the requirements for the degree of
MASTER OF ARTS IN ECONOMICS OF DEVELOPMENT
HO CHI MINH CITY, November 1999
CERTIFICATION
" I certify that the substance of this dissertation has not already been submitted for any degree and is not being currently submitted for any other degree.
I certify that to the best of my knowledge any help received in preparing this dissertation, and all sources used, have been acknowledged in this dissertation."
Pham To Mai
Date: ............................................
ABSTRACT
Deforestation in the Central Highlands of Viet Nam, especially in Dak Lak Province, has reached an alarming rate in recent years. Shifting cultivation, which is still prevalent among ethnic minority groups in the province despite great efforts of government in order to fix it, significantly contributes to the forest losses. Shifting cultivation is also a main cause of land degradation in the highlands. To ensure the success of the transition from shifting to fixed cultivation, the features of shifting cultivation in the region as well as its driving forces
NATIONAL UNIVERSITY- HCMC COLLEGE OF ECONOMICS
VIET NAM
INSTITUTE OF SOCIAL STUDY THE HAGUE
THE NETHERLANDS
Page 1 of 11

should be well understood and a feasible cultivation alternative should be introduced. This study is focused on analysis of characteristics, causes and consequences of shifting cultivation among M'Nong ethnic group, a major ethnic group in Lak District of Dak Lak Province. The analysis is mainly qualitative with a supplementary quantitative analysis of the causes by logistic regression. A cost-benefit analysis of an agroforestry system versus shifting cultivation is also included in the study in order to verify whether agroforestry system can be a profitable alternative of shifting cultivation or not.
The results of the study show that poverty associated with permanent food shortages is the main cause of shifting cultivation continuation. The population pressure, inadequate land for cultivation, limited access to credit and extension services, low education level, policy planning and implementation without people participation, incoordination in actions between government organizations and poor infrastructure are all influence farmers' decision to continue shifting cultivation. Agroforestry system is proved a potential alternative of shifting cultivation since it is more profitable and less risky. However, its application requires initial supports.
ABBREVIATIONS AND ACRONYMS
CARE : Cooperative for Assistance and Relief Everywhere.
CSAEHT : Committee on Sustainable Agriculture and Environment in the Humid Tropics.
CSSNFI : Central Steering Section on Natural Forest Inventory.
DDARD : Dak Lak Department for Agriculture and Rural Development.
DFCS : Department of Fixed Cultivation and Sedentarization.
DFCS- NEZSD
: Dak Lak Fix Cultivation, Sedentarization and New Economic Zone Sub-Department.
EDI : Economic Development Institute of The World Bank.
EEPSEA : Economy and Environment Program for Southeast Asia.
FAO : Food and Agriculture Organization of the United Nations.
FIPI : Forest inventory and Planning Institute.
FTPP : Forest, Trees and People Project.
GLASOS : Global Land Assessment of Degradation.
GSO : General Statistics Office.
GSO-AFFD : Agriculture, Forestry and Fishery Department of GSO.
GSO-ISID : Integrated Statistics and Information Department of GSO.
HEPR : Hungry Eradication and Poverty Reduction.
ICRAFT : International Council for Research in Agroforestry.
IIED : International Institute for Environment and Development.
IRRI : International Rice Research Institute.
JOFCA : Japan Overseas Forestry Consultants Association.
LUC : Land-Use Certificate.
MARD : Ministry of Agriculture and Rural Development.
MOLISA : Ministry of Labour, War-lnvalids and Social Affairs.
NEZ : New Economic Zone.
NTFP : Non-Timber Forest Products.
SFE : State Forest Enterprise.
SMRP : Sustainable Management of Resources in the Lower Mekong Basin Project.
SRV : Socialist Republic of Viet Nam.
Page 2 of 11

ACKNOWLEDGEMENTS
The author gratefully acknowledges the support and efforts of a number of individuals and institutions in making this study possible.
The most sincere gratitude and deepest appreciation goes to my teachers and supervisors, Mr. Tran Vo Hung Son, Dean of Economic Faculty, Mr. Nguyen Huu Dung, Deputy Head of Environmental Economic Section, and Mr. Nguyen Van Ngai, Ph.D. in Development Economic for their precious suggestion, counsel and guidance, their invaluable support and generous encouragement during the course of this dissertation.
Thanks are also due to all teachers and staff members of Vietnam-The Netherlands Project on Development Economics for their valuable teaching and kind help during my study. Special thanks go to Dr. Haroon Akram-Lodhi for his valuable advices and guidance during the preparation of this study.
I am greatly indebted to Mr. Y Wel Ksor, the teacher of Agricultural and Forestry Faculty, Tay Nguyen University for his assistance in introducing me to local people and arranging my accommodation during the field survey. His patience and dedication in answering my long questions on agricultural and agroforestry techniques, and on local status of agricultural production are gratefully recognized. His enthusiastic help immeasurably facilitates my survey and greatly contributes to the fulfillment of this study.
My gratitude is devoted to Mr. Y Tek H'Dok, Vice Chairman of Dak Lak Fatherland Front, and Mrs. Mai Hoa Nie Kdam, Deputy Director of DFCS-NEZSD. Without their help many valuable information and data using in this dissertation would not be obtained. I am also thankful to DDARD, DFCS-NEZSD, Dak Lak Forest Protection Sub-Department, Lak Forest Protection Unit, Dak Phoi People Committee and Forest Science Institute of Viet Nam for their generous data and information provision. Particular acknowledgement goes to SMRP for allowing me to use the Project Library. I am particular grateful to Tran Huu Nghi, project forestry officer, for his help in searching sources for data and information collection.
My appreciation also goes to the SMRP staff members and the officers of Lak District Agricultural Department who frankly help me during the field trip. Special thanks are extended to Tha Thi Tham and Vu Van Manh, SMRP staff members, and Huynh Ngoc Mai, Deputy Head of Lak District Agricultural Department (LDAD) who have generously helped me in data collection as well as in accommodation. Their warm relation made my survey time pleasant and unforgettable. The helpful guidance and
assistance of LDAD officers, whose names cannot be listed all here, during my field survey are too much to be neglected.
I am also indebted to villagers, village headmen and local authorities at the sites where field survey was undertaken, who share their precious time, thought and concerns, and even their scarce meals with me.
Many thanks are also given to my classmates and friends in Vietnam-The Netherlands Project for their warm relation and helps.
Last but not least, I would like to express my warm thanks to all members of my family, my friends and colleagues who have given me constant encouragement, cooperation and sympathy, and shared with me my housework as well as obligations during the whole time of my study.
HCMC, Nov. 2nd, 1999
Pham To Mai
UNCED : United Nations Conference on Environment and Development.
UNDP : United Nations Development Programme.
UNRISD : United Nations Research Institute for Social Development.
Page 3 of 11

TABLE OF CONTENTS
Chapter 1 INTRODUCTION
1.1 Background
1.2 Problem statement
1.3 Research objectives
1.4 Rationale
1.5 Scope of the study
1.6 Research methodology
1.7 Hypothesis
1.8 Organization of the study
Chapter 2 LITERATURE REVIEW
2.1 Sustainable development
2.2 Forest and deforestation
2.3 Land degradation
2.4 Shifting cultivation
2.5 Agroforestry systems
2.6 Conclusion
Chapter 3 SOCIO-ECONOMIC AND ENVIRONMENTAL SITUATION AT RESEARCH SITE
3.1 Site description
3.2 Socio-economic situation
3.3 Environmental situation
3.4 Government programmed and policies related to the sustainable development in the highlands
3.5 Conclusion
Chapter 4 CAUSES AND CONSEQUENCES OF SHIFTING CULTIVATION
4.1 The profile of shifting cultivation of the M'Nong in Lak District, Dak Lak Province
4.2 Causes and consequences of shifting cultivation
4.3 Conclusion
Chapter 5 COST-BENEFIT ANALYSIS OF AGROFORESTRY SYSTEM VERSUS SHIFTING CULTIVATION
5.1 Agroforestry models in Lak district, Dak Lak province
5.2 Cost-benefit analysis of agroforestry system versus shifting cultivation
5.3 Unquantifiable costs and benefits
5.4 Limitations of study and further research
5.5 Conclusion
Chapter 6 CONCLUSIONS AND RECOMMENDATIONS
6.1 Conclusions
6.2 Recommendations
Appendix
Page 4 of 11

CHAPTER 1: INTRODUCTION
1.1. Background
In recent years, there are increasing evidence of the inverse impacts of forest depletion on environment such as global warming, climate change due to the release of carbon, loss of biodiversity, higher intensity and frequency of natural disasters, increased soil erosion, watershed degradation and consequent downstream effects. Therefore, forests in general and tropical forests in particular have been receiving increased attention from the world community. The Agenda 21 of United Nations Conference on Environment and Development (UNCED) at Rio de Janeiro (1992) has even devoted a full chapter to the issues of forest conservation and development. A challenge for the world community today is to achieve a balance between development and maintenance of natural systems and thereby to ensure the integrity and stability of forest ecosystems (Sharma, 1992).
Despite the worldwide increasing demand on protection of natural forests, the intensity and scale of the forest use that modified the forest environment have significantly increased in recent years, mainly in the developing countries. According to the Food and Agriculture Organization of the United Nations (FAO, 1993), the loss of the forest area of the developing region during period 1980-1990 amounts to 163 million ha, of which 154 million ha in the tropics. Tropical forests are being lost at the rate of 10 million hectares annually, 60 percent of that due to agriculture (shifting cultivation) (Serageldin, 1993).
The rural land use challenges in developing countries include not only deforestation but also environmental degradation on fragile agricultural lands. Increasing population pressure, rural poverty, improper or mismanaged crop and animal production systems, agricultural expansion into marginal lands all contribute to serious environmental degradation in this part of the world. United Nations (1994) stated that about 70,000 km2 of farmlands were abandoned due to soil degradation each year and other 200,000 km2 suffered from reduced productivity. Furthermore, soil erosion claimed 24 billion tons of topsoil a year. Overall, land degradation of various types was estimated to cause an annual loss of 12 million tons of grain output, which is equivalent to almost half of all the grain output each year.
The risk of deforestation and environmental degradation in the developing. countries still remains very high since the population of mentioned countries grew from 2 to 4 billions during 1960-1990 and is expected to grow further by about 3 billions during 1990-2020 (FAO, 1993). As a result, food and shelter will be the first priorities of people and government of these countries over the environmental protection. Viet Nam is not an exception in the common picture of the developing world.
1.2 Problem statement
1.2.1 The seriousness of deforestation in Viet Nam
The inventory data in 1995 indicate the decrease of forest cover from 43.2% to 28.1% between 1943 and 1995, which includes the loss of more than 5 million ha of forests. The forest area sharply declined during the period 1976-1990 with average annual forest loss of more than 142 thousands ha (Table 1.1). From 1991 onward, the forest cover has slightly increased thank to forest plantation, but the loss of natural forests was still high with an average of 35,640 ha/year in the period 1990-1995. Except for the Southern Highlands and the border areas with Laos, there are no more large forests in Viet Nam (MOP, 1991).
Bibliography
Page 5 of 11

Table 1.1 Change of forest area over time
Source: FIPI (1995).
The deforestation and its consequences will result in high social and economic costs for the society that the benefits from the forest destruction cannot compensate for. Especially, the forest loss and degradation in the upper streams of watersheds do not only inversely affect the socio-economic activities of local people, but also negatively influence the downstream life and production.
1.2.2. The importance of sustainable land use in the upstream watershed of the Lower Mekong Basin for the development of Mekong Delta
The Mekong Delta is the biggest agrarian-based production center of Viet Nam whose development plays a critical role in the development of the whole country. The nature of its agricultural expansion has been largely in accordance with the seasonal variations in rainfall and waterflow of the Mekong. Meanwhile, the high mountains of West Truong Son cover 48 percent of the watershed but supplies 70 percent of the waterflow (UNDP/FAO, 1992). The development in this region, therefore, could easily upset the delicate balance of Mekong Delta and cause disturbance to downstream water flows, devastating floods, unparalleled droughts and sedimentation of downstream reservoirs, which would negatively affect its agricultural production. Hence, the sustainable land use in the upper streams of the Lower Mekong Basin is required to mitigate these inverse effects.
1.2.3. The significant contribution of shifting cultivation to environmental degradation
Viet Nam's population consists of 54 ethnic groups, of which 50 practice shifting cultivation. It was estimated that 7% of Tay, 16% of Nung, 45% of Thai and 100% of almost all the remaining ethnic minority groups have involved in slash-and-burn activities (Do Dinh Sam, 1994, p.7). The MOF inventory roughly estimated that 50% from 110,000 ha of annual forest loss was due to shifting cultivation (Gammelgaard, 1990; MOP, 1991; Do Dinh Sam, 1994). The swidden agriculture is also blamed for most of the forest fires since uncontrolled flames during the field burning often burn 10 to 20 times the intended area. The fires do not only destroy protective vegetative cover, but also cause the loss of soil organic matter and associated soil structure decline (World Bank, 1995).
Shifting cultivation also causes serious land degradation problems and prevents natural forest regeneration. The depletion of soil nutrients was due to over-cultivation of the shifting cultivation practice. Sedentary shifting cultivation with the rotating lands that annually cover up to one million ha is the most extensive cause of the evolution of barren lands and land degradation in Viet Nam. The itinerant cultivators further contribute to the damage, but.less severe. According to the inventory data of FIPI in 1995, 51.25 % from the 19080.8 ha of land that is classified as forestland was without forest cover.
1.2.4 Shifting cultivation in lower Mekong basin watershed in Dak Lak province
A large part of Dak Lak province belongs to the watershed of Srepok River- a tributary of the Mekong. The watershed protection area in Dak Lak is about 200,000 ha.
The majority of population in the region is subsistence farmers of ethnic minority groups. Shifting cultivation is still dominant and commonly practiced amongst them. Many other farmers with settled cultivation are still practicing primary varieties with no fertilizer application. This poor land-use practice and environmental
Items Year
1943 1976 1990 1995
Forest area (milt ha): 14304.2 11169.3 9175.6 9302.2
Natural forests na. 11076.7 8430.7 8252.5
Planted forest na. 92.6 744.9 1047.7
Forest cover (%) 43.2 33.7 27.7 28.1
Per caput(mil. ha/cap.) 0.23 0.14 0.13 na.
Page 6 of 11

degradation due to population pressure lead to low productivity of cultivated land. Hence, the production is not enough even to serve their subsistence and causes their poverty and unsustainable life.
1.2.5 Agroforestry as an alternative issue
An another agricultural practice is required in the region in order to reduce deforestation, protect watershed, create sustainable land-use systems and improve farm households' living standard. Agroforestry with the intentional integration of tree growing into farming system is a potential alternative. Agroforestry system can help to reduce pressure on natural forest, convert degraded lands, protect sensitive lands, diversify farm production systems by increasing crop production and providing multiple crops, sequester and biodegrade excess nutrients and pesticides, moderate microclimates, diversify habitats for wildlife and people, and thus maintain ecosystem diversity and processes. Therefore, agroforestry system can combine short-term and long-term benefits of the farm households with the aim of watershed protection and sustainability of resource use.
1.3 Research objectives
1.3.1 General objective
This study has two main objectives:
� The first is to determine socio-economic factors that force ethnic minorities in the highlands to continue practicing shifting cultivation and the impacts of this cultivation practice on the environment and the society.
� The second is to evaluate the economic value of Agroforestry model versus shifting cultivation for farmers in the Lower Mekong Basin in Dak Lak Province, in order to verify if agroforestry system is a promising alternative for shifting cultivation or not.
1.3.2 Specific objectives
The specific objectives of the study include:
� To study the actual sacio-economic and environmental situation in Dak Lak Province and at study site; � To identify the main causes of deforestation in the province, specifically in the Lower Mekong Basin
area, the contribution of shifting cultivation to deforestation, and the economic and social issues which have been applied to mitigate the problems;
� To study the changes in tradition and current situation of shifting cultivation at the research site as well as its causes and consequences;
� To compare the costs and benefits of the agroforestry system, which has been applied and shifting cultivation to the farmers at the research site in order to check whether agroforestry system is actually more profitable and more attractive for the farmers.
� To suggest policy recommendations on socio-economicmitigation initiatives for watershed protection and sustainable land use to government and local authorities.
1.4 Rationale
Policy makers have often neglected positive values of shifting cultivation system and tended to assume that shifting agriculture is detrimental to the environment, particularly as a cause of deforestation and soil erosion. Many efforts have been put on the promotion of fixed cultivation and sedentarisation for ethnic minorities in high mountainous areas. However, the results were limited due to insufficient information on shifting cultivation and absence of analysis of its relation with highland development problems. Hence, information and analysis are needed for more practicable policy responses to the problems.
Furthermore, policy executors in the regions, where shifting cultivation is in disequilibrium and causes detrimental effects, are anxious to know about a more productive and environment-friendly land use system that can help the transition from shifting to fixed cultivation. Agroforestry may be such a system and its analysis is necessary in order to give a better insight into the profitability of agroforestry system over shifting
Page 7 of 11

cultivation.
All the mentioned points form the rationale for the selected objectives of the study.
1.5 Scope of the study
The study on shifting cultivation is focused on household level analysis of M'Nong ethnic group, which is the majority of inhabitants in the area of Mekong watershed in Dak Lak Province. Their farming system is subsistence with permanent food shortage and prevalence of shifting cultivation practice.
The analysis of agroforestry system versus shifting cultivation is centered on farmers' perspective due to two reasons. First, the success of any agroforestry system promotion will depend on how the farmers perceive the benefits. If the system does not meet their own objectives and production possibilities, they will not adopt it. Second, the environmental effects and externalities of the agroforestry system are difficult to quantify due to lack of technical documentation and research.
1.6 Research methodology
1.6.1 Selection of the study site
Lak district in Dak Lak province is selected because of the following reasons:
� The location is in the watershed area of Lower Mekong Basin (see Figure 1A in Appendix); � Mainly inhabited by ethnic minority people; � Upland shifting cultivation is dominant in the district, especially amongst M'Nong group whose
population is majority in the district; � The local environment is threatened by overall poverty with low crop productivity, low income and poor
infrastructure development.
Then, Dak Phoi commune is chosen because more than 90 percent of its inhabitants belong to an ethnic minority, the M'Nong, group, both shifting cultivation and agroforestry are practiced there, and it is accessible. Finally, the survey is focused on seven M'Nong villages in the commune where people still practice shifting cultivation.
1.6.2 Data collection
Both primary and secondary data are used.
a. Primary data
The primary data were collected by a household survey using survey questionnaire and direct interviews. The data collected include:
� Information and data on shifting cultivation and agricultural production: land size, household's land use patterns, cultivation time on the same plot and fallow period for shifting cultivation, varieties used and time for first use, total production and output prices, fertilizer and agrochemical application.
� Data on non-timber forest product (NTFP)collection: products and amount collected, selling prices, labour requirement for collection and distance to forests.
� Information and data on patterns of agroforestry system adoption: reasons for agroforestry system adoption or no adoption, available associated assistance suggested and received if agroforestry is applied.
� Information on environment: reasons for yield decrease or increase, knowledge on soil conservation methods, natural and planted forests allocated and methods for preservation, local market condition for products.
� Household data: family size, age structure of the household, working force of the household, education level of the fancily members, family income and assets, time of food shortage and survival sources during this time, reasons for livelihood improvement or impoverishment, credit availability.
Page 8 of 11

The personal communication and interviews with the traditional and modern village headmen, technical officials and local authorities were also implemented in order to obtain the additional information and data on traditional social life and shifting cultivation practice of M'Nong people and on the operation of governmental organizations at research site.
b. Secondary data
The secondary data from statistical year books and local administrative system on natural, socio-economic and environmental conditions, shifting cultivation practice, land use distribution and socio-economic aspects of households in the region and study site are used. The technical data of agroforestry model implemented at research site are taken from the reports of the Project for Sustainable Management of Resources in the Lower Mekong Basin (SMRP) in Dak Lak.
1.6.3 Data analysis
Both qualitative and quantitative methods are used for the analysis in this research.
a. For analyzing causes and consequences of shifting cultivation
� General method
The qualitative analysis with descriptive statistics is applied to clarify the factors that affect the farmers' decision on slash-and-burn practice as well as the consequences of this choice. A chart will be developed to illustrate the causal relation of shifting cultivation in present situation. In order to concretize the qualitative analysis of causes of shifting cultivation, a quantitative analysis by logistic regression is also utilized.
� Logit model
The logit model is based on the a cumulative distribution function which show the conditional probability that an event will occur given the value of a set of independent influential factors. The logistic distribution function is specified as follows:
(1.1)
where P' is the probability that the event Y will occur (Y' = 1) in observation i for given value of the affecting factors, and Z' is the linear combination of these factors:
(1.2)
Logit is simply the natural log of the odd ratio in favour of event Y - the ratio of the probability that the event Y will occur to the probability that it will not occur:
The interpretation of the logit model is as follows: the slope pk measures the change in L' for a unit change in Xki. The interpretation of the intercepts may not have any physical meaning. Once the coefficients β k are estimated, the probability of the occurrence of event Yi can be obtained directly from (1. 1).
Page 9 of 11

b. For analyzing agroforestry system versus shifting cultivation
� Cost-benefit analysis
Cost-benefit analysis is applied to appraise the agroforestry option versus shifting cultivation. The net present value, the internal rate of return, the benefit-cost ratio, the pay back period and the return to labour of shifting cultivation and of agroforestry system are calculated and compared. The sensitivity analysis is also carried out to study the effects of the change in mutable factors such as input and output prices, yields of products and discount rate on farmers' benefit.
The net present value (NPV) determines the present value of net benefits by discounting the streams of benefits and costs back to the beginning of the base year. The NPV of each cultivation practice is calculated by the following formula:
where: Bt - the benefits of production by a cultivation practice.
(1 .5) Ct - the costs of production by a cultivation practice. t - the year time. r - the discount rate.
The intemal rate of retum (IRR) is defined as the rate of return on an investment, which will equate the present value of benefits and costs. A project will be financially attractive if the IRR is greater than the opportunity cost of project finance. The IRR can be obtained by solving the following equation:
(1.6)
The benefit-cost ratio (B/C) compares the discounted benefits to discounted costs.
A B/C of greater than 1 means the project is profitable and vise versa, a B/C of less than 1 means the project generates losses. The B/C is calculated as follows:
The pay back period measures the number of years it will take for the undiscounted net benefits to repay the investment. An investment can be acceptable only if its benefits can offset all investment costs within a limited arbitrary period.
Smallholder households may seek to maximize returns to family labour as long as it is their main production input. Therefore, return to labour is also used to compare the two land use systems. It is calculated as the ratio of discounted net benefits, excluding family labours from the costs, to discounted workdays spent.
In sensitivity analysis the results of economic analysis are checked by considering the effects of changes in the value of key variables. Each project always faces risks and uncertainty. The collapse of the variation of benefit and cost items into a single NPV does not provide a thorough view of the problem. Sensitivity analysis then, is employed to estimate the "switching value" of important variables needed for reducing NPV to zero (Winpenny, 1993).
� Qualitative analysis
Page 10 of 11

The qualitative analysis is also applied to assess the intangible environmental and social benefits and costs of the two land use options that can not yet be quantifiable.
1.7 Hypothesis
This study attempts to test the following hypotheses.
� The shifting cultivation in the present condition may cause inverse consequences on the environment and the society.
� The households decision on shifting cultivation practice is affected by socio-economic factors. � The agroforestry system will be more profitable and less risky than traditional shifting cultivation.
Therefore, the former can be a potential alternative for the later.
1.8 Organization of the study
The study consists of six chapters. The first chapter states the problems that the highland watershed faces and the reasons for the topic selection. The research objectives, methodology and hypothesis of the study are also introduced in this chapter. Chapter 2 reviews the theories and literature related to the research problems. The present socio-economic and environmental situation at study sites, and the implemented governmental policies related to sustainable development in the highland are stated and analyzed in chapter 3. Chapter 4 focuses on the socioeconomic analysis of shifting cultivation as well as its causes and consequences in present conditions. Chapter 5 analyses the costs and benefits of agroforestry system in comparison with shifting cultivation to the farm households. The last chapter finally gives the conclusion and policy recommendation.
Go to Next Chapter Back the Table of Contents
Page 11 of 11
CHAPTER 2
LITERATURE REVIEW
2.1 Sustainable development
2.1.1 Concept
The principle of sustainability has appeared in the development theory in the late 1960s and early 1970s since there was mounting evidence of negative impact of environmental degradation on economic development and thus, growing concern about environmental problems. There is increasing awareness of the fact that current development is unsustainable because it is depleting some critical, non-substitutable components of the capital base on which it depends.
Though the concept of sustainable development is widely accepted, its precise content is elusive and is being interpreted in different ways. The most popular definition of sustainable development is of World Commission on Environment and Development (WCED) in 1987. By this definition, sustainable development is the 'development that meets the needs of the present without compromising the ability of future generation to meet their own needs' (Turner et al., 1994:54). More precisely, the WCED's definition say that 'sustainable development is a process of change in which the exploitation of resources, the direction of investments, the orientation of technological development, and institutional change are all in harmony and enhance both current and future potential to meet human needs and aspirations' (Hediger, 1997).
The later definition attaches the ecological based concept of sustainability to the social and economic development and hence, more meaningful than most other definition. However, more specific or localized development goals within different environmental, sectoral and cultural context should be derived from this general definition.
2.1.2 Degrees of sustainability
Depending on the thinking on the degree of substitutability among different types of capital: human-made, natural, human and social, sustainability can be divided into weak, strong and superstrong (Goodland, 1997).
Under strong sustainability, different forms of capital are complements to a great extent rather than ferfect substitutes. Therefore, it requires maintaining different kinds of capital intact separately (Goodland, 1997).
Under superstrong sustainability, every asset should be preserved and nothing should ever been depleted. However, it is not sufficient for sustainable development since ‘it neglects both complexity and dynamics of ecosystems and fundamental requirements of economic efficiency; that is, to avoid wasteful use of scarce resources’ (Hediger, 1997)
Weak sustainability is not enough for sustainable development either. First of all, natural and man-made capitals are far below perfect substitutable. Natural capital fulfills many life support functions that can not be replaced. In addition, natural capital is subject to irreversibilities and uncertainties. We are uncertain about the inverse consequences of natural capital loss, and once they are realized, the process is irreversible. The uncertainly about environmental costs and benifits make it difficult to decide the trade off between man-made and natural capitals. Moreover, natural capital is less vulnerable and more resilient in comparition with man-made capital. Furthermore, man-made capital and natural capital are interdependent: the later is often needed to make the former (Turner et al., 1994; Munasingle and McNeely, 1995).
Therefore, strong sustainability is most rational for the interpretation of sustainable development since it can avoid the extremes and oversimplifications of the two other concepts.
2.1.3 Dimensions of sustainable development
The strong sense of sustainable development emphasizes the sustainability of the inter-relationship between economic, ecological and sociocultural systems, rather than that of the component parts (Redclift, 1994). Munasinhe (1993 and 1995) has generalized these three dimensions of sustainable development.
The economic sustainable development, according to Munasinghe, is based on the Hicks-Lindahl concept of maximizing the flow of net benefits from a stock of resources without compromising the flow of future benefits.
The ecological view of sustainable development focuses on the stability of natural (biophysical) systems. However, it is not conservation of some 'ideal' static state, but preservation of resilience and dynamic ability of natural systems to resist shocks and adapt to change.
Page 1 of 9

The sociocultural concept of sustainability emphasizes the protection of all social and cultural systems, particularly those of indigenous peoples. Main objectives of socio-cultural development include poverty reduction, preservation of cultural diversity, ensuring intra- and inter-generational equity and empowerment of less dominant groups in societies.
The reconcilement and effective operationalization of all three concepts are essential for achieving sustainable development. It is the task of maximizing the net benefits from economic and social development under the constraint of maintaining the stability of services from, and the quality of, natural resources over time (Munasinghe,1993 and 1995).
2.1.4 Challenges to sustainable development in developing countries
Most developing countries are characterized by a strong connection between low per capita incomes, high population growth rates and a dependence upon agricultural production. Therefore, their foremost challenge to sustainable development is rural poverty because the poor will continue to destroy their immediate environment in order to survive.
The perspective of the poor is at variance with that of most economists and biologists, placing the immediate satisfaction of needs and the avoidance of risks before sustainability or higher productivity....What poor people pursue through the development process and their use of the environment, is simply a better livelihood (Redclift, 1992: 35-36).
Another issue that closely links with the poverty in developing countries is high population growth rate. Rural poor are generally characterized by high fertility preferences because of two main reasons. First, family labour is their only production input that they can effectively control over facing limited access to capital, improved technology and other production inputs. To them, the costs of raising children are small in comparison with the value of their labour. Second, high fertility is required to compensate high risks of child mortality due to poor living standard.
Cruz (United Nations, 1994:144) has stated two main mechanisms wherein greater stress can be put on environment by rapid population growth and poverty. The first is by overuse of resources such as overfishing or prolonged cultivation on depleted land in shifting cultivation under the pressures exerted by the growing proportions of dependent population. The second is through expansion of agricultural land. Sage (1995) has expressed the relation between population growth and agricultural land expansion through a simple equation:
Based on this expression, population growth will directly translate into land conversion for agriculture if technology and food consumption is unchanged.
Poverty and population growth is thus real challenges to sustainable development for developing world. Therefore, governments of developing countries are often largely preoccupied with rectifying social problems at the expense of environmental degradation.
However, the environmental degradation also has reverse effects on the livelihood of the poor. Since nearly three quarters of the poor are located in the most ecologically fragile areas characterized by limited arable land of low potential and lack of appropriate infrastructure and technology (United Nation, 1994:31), they are very vulnerable to natural hazards and environmental degradation. Hence, the spirals of impoverishment and degradation are formed under the combined action of some driving forces, which are both external to the locality (natural hazards, development and commercialization) and internal to the community (population growth and poverty) (Sage, 1995). Therefore, the question is not whether to preserve the nature, but how.
Sustainable development can be visualized in terms of a water tank having two leaks, one leak being "poverty" and the other "environmental degradation". Sustainable development will thus remain a dream unless problems of poverty alleviation and control of environmental degradation are dealt with simultaneously (Jalal, 1993:7).
In order to get best results, it is important to understand the different combination of driving forces acting in concert according to local specific circumstances and dynamics, and then to develop appropriate policy responses.
The principle areas where poverty and population has been treated as the major driving forces of environmental degradation in developing countries are in relation to deforestation and land degradation.
2.2 Forest and deforestation
2.2.1 Role of forests
Farm area = Population x Food consumption per person x Area per unit of food production
Page 2 of 9

Forest is of particular concern because of its implication for the sustainable development in both ecological and economical aspects. The role of forests has been intensively discussed in Sharma (1992), CSAEHT (1993) and Kramer et al. (1995).
a) Role of forests in ecological sustainability
First of all, forests play a vital role in the global carbon cycle. Forests and their soils act as important carbon sinks, which contain about three times as much carbon as is currently held in the atmosphere. Through photosynthesis of forest trees, carbon dioxide is absorbed and oxygen is emitted into the atmosphere.
Forests also play an important role in biodiversity preservation, both in species and in gene. More than half of all known surviving species exists in forests. Genetic diversity helps to increase the resilience of species to environmental changes and reduce their susceptibility to diseases).
Forests have a significant role in watershed protection. Forests reduce reservoir and riverbed siltation by restricting erosion, and mitigate floods downstream. Other roles of forests in nature systems include stabilizing regional climate and hydrological systems, protecting crops from wind damage, improving air quality, minimizing nutrient loss through nutrient cycling and enriching soils through nitrogen fixation.
b) Role of forests in economic and social development
Forests provide a wide range of timber and non-timber products. They serve as income sources as well as fuelwood and consumption goods, such as food, shelter and even clothing for indigenous people and communities. By serving the basic needs of numerous indigenous and tribal groups, forests play the role in sociocultural development as well. At the national level, forest resources can help earning foreign exchange through exportation of forest products, in which roundwood is the most valuable.
Munasinghe has summarized all the functions of forests as shown in the Table 2.1.
Table.1 Functions of forests
Source: Munashinghe and McNeely (1995)
2.2.2 Causes of deforestation
Sharma (1992) has divided the causes of deforestation into direct and underlying causes. The direct causes include agricultural expansion, overgrazing, fuelwood gathering, commercial logging, and infrastructure and industrial development. Agricultural expansion consists of crop and livestock expansion, shifting cultivation on logged-over areas and fires set by shifting cultivators and other forest dwellers. Another factor that can be considered direct cause of deforestation is wars (Humphreys, 1996). The forest destruction and defoliation in Viet Nam war is a good example (World Bank, 1995:232).
The first underlying cause of deforestation is population pressures combined with rural poverty. It is required to deplete forest resources and convert forest land into agricultural use just for meeting increasing demands of growing poor population for food, fuelwood, and other commodities and services from forests (Sharma, 1992; CSAEHT, 1993; Kramer et al., 1995; Humphreys, 1996). Market and policy failures also significantly affect the sustainability of forest management. Amongst market failures, the divergence between the private and social costs of non-forest land uses and timber harvesting is of particular threat. Policy failures include incentives and policies, such as taxes, subsidies or pricing etc. that distort prices of forest-related goods or exclude local communities and indigenous people from the planning process for long-term forest management (Sharma, 1992; Kramer et al., 1995). State of the economy may
Source of materials and services Sink for wastes General and life support
Timber
Fuelwood
Other business products Non-wood product
Genetic resource
Recreation and tourism
Absorption of waste
Recycling nutrients
Watershed protection
Protection of soil quality and resistance to erosion Scientific data
Genetic pool
Climate regulation Carbon fixing
Habitat for people, flora and fauna
Aesthetic, cultural, and spiritual source
Page 3 of 9

contribute to deforestation as well. Poor economic performance and high external debts pushes countries to speed up forest exploitation in order to generate income and foreign currency (Sharma, 1992 and Humphreys, 1996).
2.2.3 Effects of deforestation on sustainable development
The impacts of deforestation may be extremely detrimental and can be divided into environmental, social and economical, although this division is an Arbitrary oversimplification as all three systems mutually interact.
a) Environmental impacts
The contribution of deforestation to environmental degradation is often first and the most concern in a wide range of literature. The most common ways that deforestation may give inverse effects on environment include loss of biodiversity, climate changes, desertification, soil erosion and watershed degradation (Sharma, 1992; Gupta, 1993; Barraclough and Ghimire, 1995; Humphreys, 1996).
� Loss of biodiversity
As a role of forests is storehouses of biodiversity, the destruction of flora and fauna habitats through deforestation causes danger and, eventually, extinction for countless species. Many of threaten species are essential for scientific advances and serve as important sources of food, medicine, genetic material for crop hybridization and other market products (Sharma, 1992).
� Climate chances
Deforestation may influence global and regional climate since forests help to regulate atmospheric temperature and the distribution of moisture. The moisture in the soil is decreased and the regional rainfall is expected to fall down due to the forest loss, leading to changes in the flow patterns of local rivers and ground water. Large-scale deforestation may lead to changes in global atmospheric heat flux and rainfall pattern (Sharma, 1992; Gupta, 1993; Barraclough and Ghimire, 1995).
Widespread deforestation contribute significantly to global warming since atmospheric functions of forests as carbon sinks is deteriorated. Estimated carbon emissions due to deforestation recently accounts for 1.4 billion tons per annum, that is equivalent to about 20 per cent of the build-up of carbon dioxide in the atmosphere (United Nation, 1994:47).
� Desertification
Deforestation is an important factor contributing to desertification, especially in arid and semi-arid region. The process of desertification is well described by Munasinghe:
Loss of forest cover affects the capacity of land to retain water and may also cause changes in rainfall patterns. This results in changing patterns of vegetation. Less dense shrubs and bushes may replace the rich biomass, which required more moisture. If the pressure on land due to human activity continues unchecked, the surviving vegetation may gradually disappear until the surface is virtually bare (Kramer et al., 1995: 13).
� Soil erosion
Deforestation is associated with increased run-off of rainfall and intensified soil erosion due to land surface exposure to rainfall and wind, and loss of root systems of forest trees, which may help in soil moisture absorption and soil retention. The erosion of fertile topsoil will affect agriculture production by reducing productivity. Soil erosion in watershed significantly contributes to the watershed degradation.
� Watershed degradation
Deforestation in watershed causes downstream effects such as riverbed siltation, reservoir sedimentation due to soil erosion, and destructive flooding. Locally, deforestation results in extensive flooding and increasing landslides along riverbeds due to the loss of soil and water retention capacity of denuded mountain slopes.
b) Social impacts
Deforestation creates serious social consequences, especially for indigenous communities and the rural poor, by disrupting delicately maintained livelihood systems. Traditional livelihoods have lost, but '...the new systems are often less productive, and even more frequently they are less sustainable...' (Barraclough and Ghimire, 1995).
Page 4 of 9

First of all, the available supplies of forest products, particularly food and fuelwoods, for local people reduce. This often results in poor eating habits, malnutrition and even less time for school because children have to spend more time gathering forest products. The situation is exaggerated by decrease in crop yields and increase in costs of traditional agricultural systems due to calamities, soil erosion and degradation, and shorten fallow crop rotations. Hydrological and micro-climatic changes create additional problems. Large-scale flooding as consequence of deforestation is often associated with displacement of people and spread of diseases. One more social concern at local level is the cultural survival of indigenous groups and the loss of traditional knowledge of forest species and genetic resources (Sharma, 1992; Barraclough and Ghimire, 1995).
At national level, deforestation may cause spontaneous migration of the poor whose traditional livelihoods are disrupted and for whom no other cultivation land or employment opportunity is available. Migration stream, hence, transfers unemployment and other social and environmental problems to urban or other areas (Barraclough and Ghimire, 1995).
c) Economic impacts
Deforestation may cause substantial economic losses at local and national levels. Hugh expenses are required to solve the consequences of soil erosion, flooding and downstream effects. Firstly, it is the damages and losses of crops, livestock, human dwellings, infrastructure and other assets associated with soil erosion and flooding. Secondly, sedimentation downstream impedes the operation of hydroelectric projects and irrigation systems. The conversion of forests into other land use may result in the destruction of valuable forest products, and thus threatens foreign exchange earning, and industrial and fuelwood production as well (Sharma, 1992; Kramer et al., 1995).
2.3 Land degradation
Apart from deforestation, land degradation is another serious problem in developing countries since most of them highly depend on agricultural production. According to Global Land Assessment of Degradation (GLASOS) estimation, about 27 percent of total Asian agriculture land, permanent pastures, and forest and wooded areas are under the effects of soil degradation, amongst which agricultural land is most affected. In Southeast Asia, approximately one-forth of total land appears to be degraded (Sherr and Yadav, 1996).
Sherr and Yadav have defined "land degradation" as 'a temporary or permanent decline in the productive capacity of the land, or its potential for environmental management'. Types of land degradation include water and wind erosion, chemical degradation, and physical degradation. The chief form of land degradation is water erosion. Important cause of land degradation in dryland and coastal areas is wind erosion. Chemical degradation, such as salinization and fertility decline, is relatively small, but its consequences are high, as it accounts for more than 40 percent of cropland degradation and concentrates in areas with high population density and intensive crop cultivation. Some types of land degradation are irreversible, while most of them can be prevented or reversed by technical measures (Sherr and Yadav, 1996).
Annual loss in grain output due to land degradation is roughly estimated at 12 million tons. Nine million tons from this figure is due to soil erosion, one million is due to salinization and waterlogging of irrigated land, and other two million is due to loss of soil organic matter, shortened fallow rotation in shifting cultivation and soil compaction in combination (United Nation, 1994:55). Soil erosion in watersheds may causes externalities downstream as mentioned above. The social and economical concerns of land degradation are very similar of deforestation.
The causes of land degradation include improper cultivation technique, overgrazing and deforestation. However, the principal underlying cause of land degradation, as in the case of deforestation, is poverty accompanying with high population pressure. Population growth induces farmers to overuse and even exhaust the soil, expand agriculture land into marginal lands, especially into hillside areas, and encroach upon natural forests. Meanwhile, poverty status impedes them to afford necessary conservation measures to protect soil cover (Kelley, 1992; United Nation, 1994; Gupta, 1993; Sherr and Yadav, 1996).
2.4 Shifting cultivation
Shifting cultivation in developing countries closely relates to both deforestation and land degradation as their cause as well as the affected object. The estimated shifting cultivators are about 250 to 300 million people, which constitute only 5 percent of the worlds population, but extend to 30 percent of the world's exploitable land (Warner, 1991).
2.4.1 Definition
Shifting cultivation is a traditional agricultural system, where a patch of forest is cleared, burnt and cultivated for a few
Page 5 of 9

seasons, then abandoned for several years following soil fertility decline and weed proliferation, and allowed for natural vegetation regeneration before being cleared and used again (FAO, 1984; Gil, 1985; Gupta, 1993).
However, as stated in FAO (1984), the shifting cultivation is differently defined by different people in differing ways and noted by different terms. Shifting cultivation sometimes is called swidden farming or agriculture. The FAO/ University of Ibadan Workshop on Shifting Cultivation in 1982 recommended the use of the term "long fallow agriculture" as equivalent to shifting cultivation. This term arises following the adoption of the most acceptable definition of shifting cultivation as 'a system in which relatively short periods of continuous cultivation are followed by relatively long periods of fallow' (FAO, 1984;). Since the most prevalent method of land clearing in shining is slash-and-burn, it is referred to as slash-and-burn cultivation as well.
2.4.2 Classification
Greenland and Okigbo (1985) mentioned the FAO Classification of Cultivation Systems, in which shifting cultivation is divided into normal and accelerated (or degraded) systems based on the relative length of crop and fallow and the nature of the fallow vegetation. Normal systems are characterized by unrestricted land availability, while in accelerated systems, the length of the fallow period is less than would be voluntarily chosen because of population pressure or other factors.
In Viet Nam, shifting cultivation is divided into three groups according to characteristics of cultivators' settlement and cultivation practice (MOP, 1991; WB, 1995):
� Itinerant shifting cultivation is associated with the shin of cultivators' homes following the shin of the cultivation plots.
� Sedentary shifting cultivation is characterized by fixed households and shin cultivation sites. � Supplementary shifting cultivation is the system, where shining cultivation is practiced on surrounding steep
slopes in supplementation to cultivation on permanent plots.
Do Dinh Sam (1994) have provided a little different classification with two main types of shining cultivation:
� Pioneer shifting cultivation is referred to as the full use of soil fertility following by land abandonment without intention of further use by the same cultivators.
� Rotational shifting cultivation, in reverse, is characterized by land reuse aver a fallow period of several years.
Do Dinh Sam also mentioned the supplementary shining cultivation as an additional type to the above two.
2.4.3 Characteristics of shifting cultivation
First feature of the system is the rotation between short cultivation and long fallow periods. AKer some crops, when soil fertility is depleted by repeated crop removals, leaching and erosion, and production is no longer labour-effective, the cultivation is shined to new site with original site led to fallow growth (MacDicken and Vergara, 1990).
The length of fallow period is the most critical factor for the long-term sustainability of shining systems. The recovered vegetation help nutrient cycling and serve as major buffer against leaching losses, hence, enhance restoration of soil fertility (Courter, 1972). This characteristic defines the viability of shifting cultivation over permanent agriculture in marginal areas of poor soil but with abundant tropical vegetation (Grandstaff, 1978).
Second characteristic of shining cultivation is in slash-and-burn methods for vegetation clearance. The use of fire helps to save labours and enrich soil with ashes and the increase in leaching effect. 'Fire also plays an important role in removing foci of fungal diseases and noxious insects' (FAO, 1984). With the purpose of saving labour, cultivators open prefer clearing secondary than high forests. The precaution measures are open applied to prevent forest fires and protect useful species from damaging effects of fire.
Shining cultivation is known as a subsistence-based system with low inputs and low productivity that requires a large amount of land per family and relatively low densities of population for acquiring long enough fallow rotation. If these basic requirements for sustainability are met, shining cultivation can be ecological sound. The provision of human needs, in this case, is integrated with the natural environment, and species composition and diversities in the natural forest are preserved by unmanipulated natural regrowth during fallow. This cultivation system occupies a distinct place in the indigenous economy and constitutes a vital part of livelihood and socio-economic set up of the majority of the highland population. Despite its low-income nature, shining cultivation may not be replaced by other production system since few alternatives are proved both ecologically and economically feasible for many marginal lands (Grandstaff, 1978; CSAEHT, 1993).
However, as long as the fallow periods is forced to be shortened under population and poverty pressure, productivity declines following the decrease in soil fertility and land degradation. The accelerated shining cultivation, thus, may cause a lot of social problems such as hungry and malnutrition, concentration on food crops at the expense of cash crops to ensure survival, displacement of indigenous community, outward migration to urban areas, primary forest
Page 6 of 9

encroachment and so on. Under this condition, alternative ecologically sound systems should be developed for solving the problems.
2.5 Agroforestry systems
Given the trends in population pressure and deforestation that cause such dramatic biophysicaland socioeconomic effects, it is possible to cushion the impact or reverse the degradative processes? Agroforestry systems can potentially help protect or rejuvenate "wasted lands" by utilization of the beneficial attributes of trees in farming systems and moving land use systems from a purely production orientation or purely conservation orientation toward an integrated productive-protective system... (MacDicken and Vergara, 1990:210).
Agroforestry has the potential to contribute directly to sustainable improvements in rural income and welfare, to reclamation of degraded agricultural lands, and to the conservation of tropical forests, through a role in expanding sustainable agroforestry alternatives to slash and burn farming (Sullivan et al.,
1992:ix).
These two quotations make it clear how potential agroforestry systems are as an alternative to accelerate shining cultivation.
2 5.1 Definition
There are variations of the definition of agroforestry system, but the most widely accepted definition is of the International Council for Research in Agroforestry (ICRAF), which was cited by Nair (1990):
Agroforestry is a collective name for land-use systems and technologies where woody perennials are deliberately used on the same land-management units as agricultural crops and/or animals, in some form of spatial arrangement or temporal sequence. In agroforestry systems there are both ecological and economical interactions between the different components.
There are two main components in this definition. The first is the deliberate integration of trees with agricultural crops and/or animals on the same piece of land, and the second is the ecological and economical interactions between woody and non-woody components. The systems that lack of one from these two components cannot be classified as agroforestry (Gregesen et al., 1989)
Based on the ICRAF's definition, shining cultivation itself, thus, is the oldest and most widespread form of agroforestry.
2.5.2 Classification
Agroforestry systems can be classified into three basic categories based on their structure and functions (Nair, 1990; CSAEHT, 1993):
� Agrisilvicultural systems are combination of crops and trees. They include shifting cultivation, alley cropping, taungya, multilayer tree gardens, multipurpose trees and shrubs on farmlands, homegardens, windbreaks and shelterbelts, live-hedges, fuelwood production and integrated multistory mixtures of plantation crops.
� Silvopastoral systems are combinations of pastures and/or animals and trees. They include protein bank (multipurpose fodder trees on or around farmlands), live-fences of fodder hedges and shrubs, trees and shrubs on pastures as well as integrated production of animals and wood products.
� Agrosilvopastoral systems are combinations of crops, pastures and/or animals and trees. They include homegarden with animals, multipurpose woody hedgerows and integrated production of crops, animals and wood.
Other agroforestry systems include apiculture with trees, multipurpose woodlots and aquaculture in mangrove areas.
2.5.3 Benefits from agroforestry systems
Page 7 of 9

Source: MacDicken and Vergara (1990)
Figure 2.1: Conflicts between agriculture and forestry have led to the evolution of multiple-use agroforestry systems.
As mentioned above, agroforestry systems can integrate into themselves both production and conservation objectives, which help to improve production, and agronomic and ecological sustainability of resource-poor farmers. This integration process is well illustrated in Figure 2.1.
Furthermore, Gregesen et al. (1989), Nair (1990) and CSAEHT (1993) have noted the following benefits from woody and herbaceous perennials to agricultural crops in agroforestry systems:
� Trees help to reduce losses from the soil by protection from erosion and nutrient retrieval from the sub soil to the surface by deep root systems.
� Fertilizer requirement for agricultural crops is reduced due to nitrogen-fixation trees and green manure in agroforestry systems.
� More soil moisture is available under the protection of shelterbelts from wind. Allelopathic compounds produced by some perennials can suppress weeds.
� Under ideal systems, competition for water and nutrient is minimal due to different rooting structure and depth of trees and crops. Competition for light and solar radiation is restricted as well with multistory canopy.
In addition, agroforestry systems can provide tree products for on-farm consumption or sale such as wood, fuelwood, foods, medicine, etc. Livestock production and control is improved in silvipastoral systems due to fodder trees and living fences.
Looking at social aspect, agroforestry systems lead to improvement in incomes and creation of jobs for rural poor. The inclusion of trees in farming systems in the upper parts of watersheds can mitigate the damaging effects of soil erosion for local as well as downstream residents, and provide a more regular flow of ground water.
Agroforestry systems provide environmental services such as sequestering and biodegrading excess nutrient and pesticides, microclimate moderation, and diversification of habitats for wildlife and human (University of Minnesota, 1996).
2.5 4 Financial and economic analysis of agroforestry systems
In order to make rational decisions on whether an agroforestry system should be promoted or not, the financial and economic analysis is needed. The analysis may be at different times or different scales. Therefore, there are several variations of analysis (MacDicken and Vergara, 1990; Sullivan et al., 1992).
a. Analysis at different times:
In the relation with time, the analysis divided into ex-ante (or prior) and ex-post (or subsequent). Ex-ante analysis is carried out before the start of a project or before developing technologies with new products. It helps to assess the economical viability of a technically feasible agroforestry system, its capability of meeting specified targets, or the
Page 8 of 9

priority of various technology options available.
Ex-post analysis is applied for already existed agroforestry technology. its main aim is to determine whether the system should be readjusted or adapted, and to suggest available for follow-up measures.
As noted in Sullivan et al. (1992), 'emphasis is placed on both ex-ante and ex-post analysis. Ex-post data is needed to make ex-ante analysis credible'.
b. Analysis at different scales:
At household or farm level, the analysis focuses on the evaluation of net benefits of a new agroforestry system versus alternative land uses, management regimes or nonfarm activities. Key social and economic factors that affect farmers' use and management of agroforestry practices and their effects on household resource use should also be clarified.
At community level, the emphasis is on net benefits from agroforestry systems accrued to various social groups.
At watershed or regional level, the analysis should include the effects of agroforestry application on regional demand for products and their prices, input prices or access, aggregate income and environmental externalities to non-project households, etc.
2.6 Conclusion
The literature review shows that in spite of different views on the way toward sustainable development, it is commonly agreed that pursuing the aim of sustainable and ecological sound development is necessary. However, poverty and population are two main constrains for developing countries to reach this objective. The principal environment problems in the third world under poverty and population pressures are deforestation and land degradation. Shifting cultivation, a popular cultivation practice in tropical highland, significantly contributes to these environmental issues. Given poverty and population status, normal shifting cultivation changes to accelerate one with shortened fallow periods. A potential alternative for environmental unsound accelerate shifting cultivation is agroforestry systems, which can combine production and protection objectives, and can provide a range of economical, social as well as ecological benefits. The economic analysis of an agroforestry system is used for assessment of its economic viability and feasibility in order to make decision on its application.
Go to Next Chapter Back the Table of Contents
Page 9 of 9
CHAPTER 3
SOCIO-ECONOMIC AND ENVIRONMENTAL SITUATION
AT RESEARCH SITE
The farmers' decision on land use practice is always affected by social, economic and environmental factors. The knowledge of local status will help to understand why farmers still practice shifting cultivation or select agroforestry systems. Therefore, general socio-economic conditions, deforestation and its main causes, contribution of shifting cultivation to deforestation, and government policy and programmes for mitigating environmental degradation at research site are analyzed in this chapter.
3.1 Site description
3.1.1 Dak Lak province
Dak Lak is situated in the middle of the Central Highlands (Tay Nguyen) - a region with high potential for economic development. The province is the largest and most populous in the country with the total area of 1,953,545 ha and the population of 1,515,367 people. The forest cover accounts for about 62% of the total provincial area. The two most common from 27 types of soil in the province are basalt (713,508 ha) and alluvium (60,000 ha) which are suitable for perennial industrial as well as annual crops.
Dak Lak province is characterized by tropical monsoon climate. The average annual temperature is 23.7°C, the annual average air humidity is 82% and the annual average rainfall is 1,800 mm. There are two distinct seasons: rainy season (from May to November) and dry season (from December to April). The rainfall intensity is highest in July, August and September.
Dak Lak's topography is relatively flat and variety with the alternation between hills, mountains, plains and valleys. The average altitude is 400 to 800 m. Two main rivers in Dak Lak are Srepok, which drains into the Mekong Basin in Cambodia and Ba, which flows towards the Chinese Sea. Srepok river has two branches: Krong Ana and Krong Kno that originate in Chu Yang Sin mountain range in the Southeast of the province.
The provincial capital is Buon Ma Thuot City. The National Highway No. 14 connects Dak Lak with Da Nang through Gia Lai and Kon Tum to the North and with Ho Chi Minh City through Binh Phuoc and Binh Duong to the South. The province is also connected to Khanh Hoa by the National Road No. 26 and to Lam Dong and Binh Thuan by the National Road No. 27.
3.1.2 Lak District
Lak district lies in the Southeast of Dak Lak province, 60 km from Buon Ma Thuot City on the national road No. 27. The district is located between Buon Ma Thuot plateau and Chu Yang Sin mountain-range with total area of 110,730 ha.
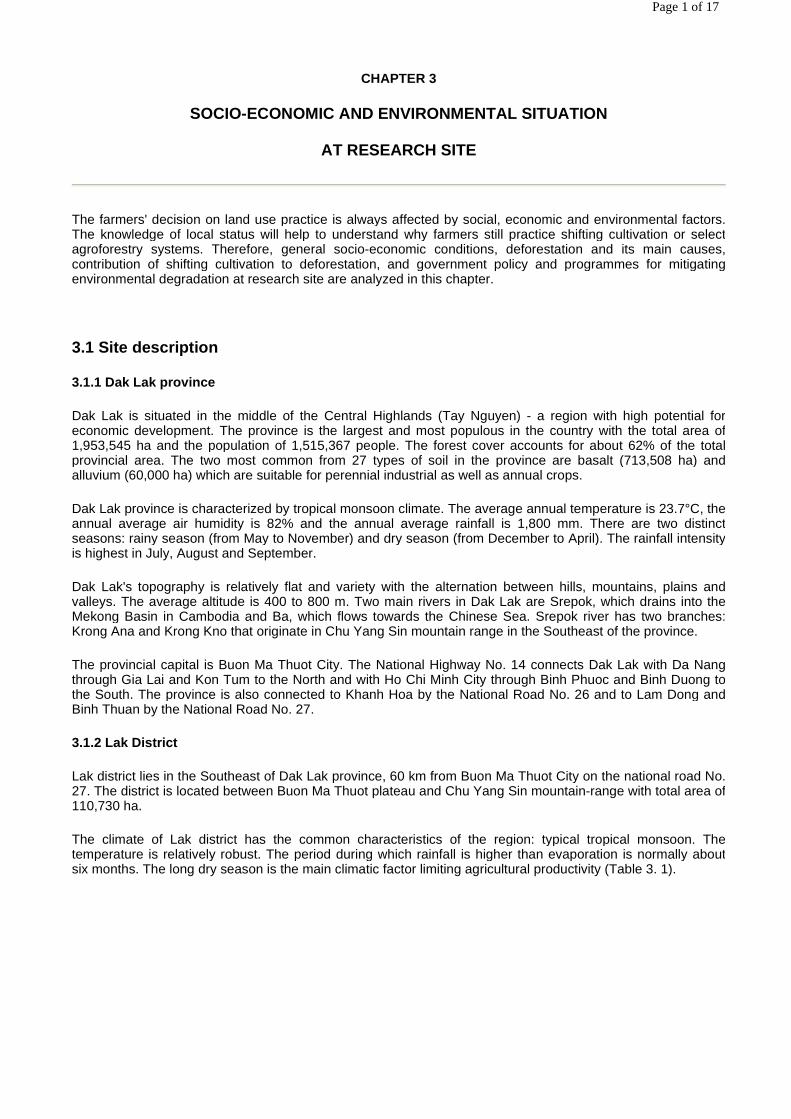
The climate of Lak district has the common characteristics of the region: typical tropical monsoon. The temperature is relatively robust. The period during which rainfall is higher than evaporation is normally about six months. The long dry season is the main climatic factor limiting agricultural productivity (Table 3. 1).
Page 1 of 17
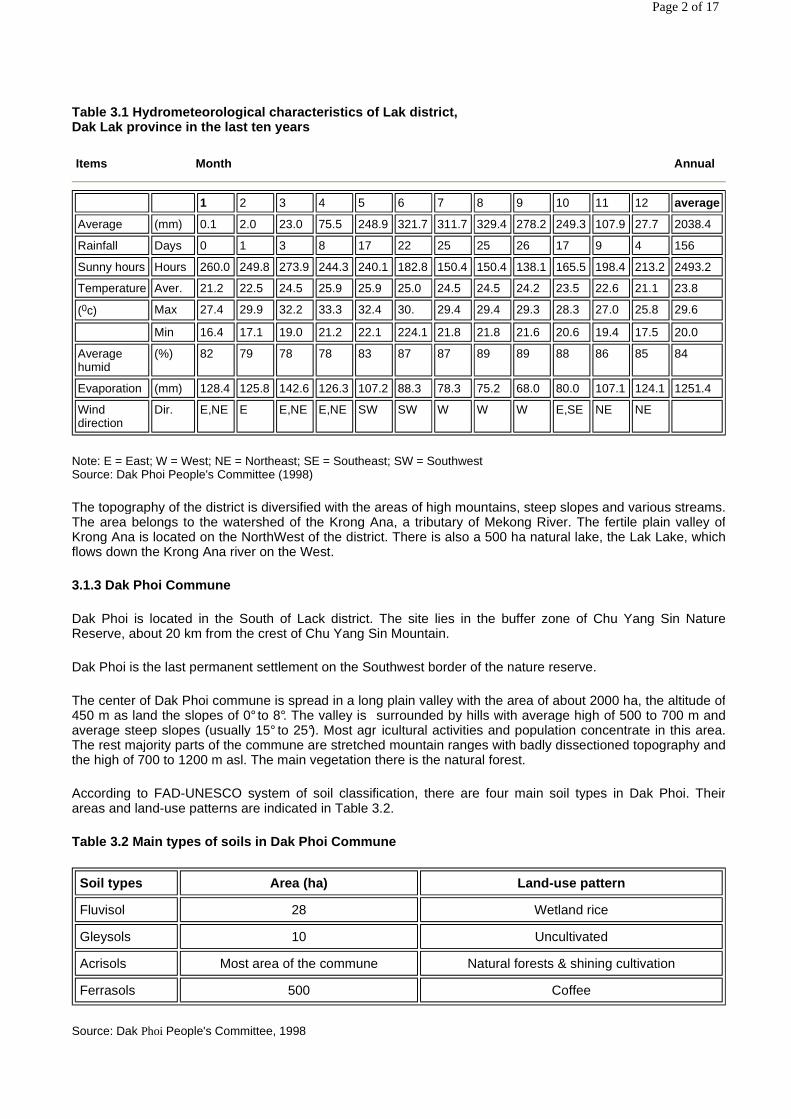
Table 3.1 Hydrometeorological characteristics of La k district, Dak Lak province in the last ten years
Note: E = East; W = West; NE = Northeast; SE = Southeast; SW = Southwest Source: Dak Phoi People's Committee (1998)
The topography of the district is diversified with the areas of high mountains, steep slopes and various streams. The area belongs to the watershed of the Krong Ana, a tributary of Mekong River. The fertile plain valley of Krong Ana is located on the NorthWest of the district. There is also a 500 ha natural lake, the Lak Lake, which flows down the Krong Ana river on the West.
3.1.3 Dak Phoi Commune
Dak Phoi is located in the South of Lack district. The site lies in the buffer zone of Chu Yang Sin Nature Reserve, about 20 km from the crest of Chu Yang Sin Mountain.
Dak Phoi is the last permanent settlement on the Southwest border of the nature reserve.
The center of Dak Phoi commune is spread in a long plain valley with the area of about 2000 ha, the altitude of 450 m as land the slopes of 0° to 8°. The valley is surrounded by hills with average high of 500 to 700 m and average steep slopes (usually 15° to 25°). Most agr icultural activities and population concentrate in this area. The rest majority parts of the commune are stretched mountain ranges with badly dissectioned topography and the high of 700 to 1200 m asl. The main vegetation there is the natural forest.
According to FAD-UNESCO system of soil classification, there are four main soil types in Dak Phoi. Their areas and land-use patterns are indicated in Table 3.2.
Table 3.2 Main types of soils in Dak Phoi Commune
Source: Dak Phoi People's Committee, 1998
Items Month Annual
1 2 3 4 5 6 7 8 9 10 11 12 average
Average (mm) 0.1 2.0 23.0 75.5 248.9 321.7 311.7 329.4 278.2 249.3 107.9 27.7 2038.4
Rainfall Days 0 1 3 8 17 22 25 25 26 17 9 4 156
Sunny hours Hours 260.0 249.8 273.9 244.3 240.1 182.8 150.4 150.4 138.1 165.5 198.4 213.2 2493.2
Temperature Aver. 21.2 22.5 24.5 25.9 25.9 25.0 24.5 24.5 24.2 23.5 22.6 21.1 23.8
(0c) Max 27.4 29.9 32.2 33.3 32.4 30. 29.4 29.4 29.3 28.3 27.0 25.8 29.6
Min 16.4 17.1 19.0 21.2 22.1 224.1 21.8 21.8 21.6 20.6 19.4 17.5 20.0
Average humid
(%) 82 79 78 78 83 87 87 89 89 88 86 85 84
Evaporation (mm) 128.4 125.8 142.6 126.3 107.2 88.3 78.3 75.2 68.0 80.0 107.1 124.1 1251.4
Wind direction
Dir. E,NE E E,NE E,NE SW SW W W W E,SE NE NE
Soil types Area (ha) Land-use pattern
Fluvisol 28 Wetland rice
Gleysols 10 Uncultivated
Acrisols Most area of the commune Natural forests & shining cultivation
Ferrasols 500 Coffee
Page 2 of 17

The two small rivers, Dak Phoi and Dak Lieng, flow along the valley and drains in the Krong Ana before joining Srepok river. With the location in the watershed of the Mekong and buffer zone of Chu Yang Sin Nature Reserve, the socio-economic activities in Dak Phoi commune will have the effects on the ecological environment of the region as well as of the Lower Mekong Basin.
3.2 Socio-economic situation
3.2.1 Demographic and ethnic features
Dak Lak population consists of 38 ethnic groups. The most populous are Kinh, Ede and M'Nong groups.
Lak district has 8 communes and Lien Son town with the total of 41,089 inhabitants. The majority of the district population belongs to M'Nong group which comprises of 23,807 persons (57.9%) (Lak District Statistical Office, 1998).
Dak Phoi commune consists of 11 villages with total population of 3779 persons, living in 687 households. On average, there are 5.5 persons per household. The population density of 26.7 personsikm2 is low in the provincial context (Table 3.3). The population growth rate is very high (estimated at 3.1 percent) which will become the main threat to sustainable natural resource management in the long term, although it is not yet a pressing problem given the current population density.
Table 3.3 Demographic condition
Source: (*) Dak Lak Statistical Office). (**) Lak Statistical Office (1998). (***)Dak Phoi People's Committee (1998).
98 percent of the communal population (3726 persons) belong to ethnic minority groups. The vast majority of households are M'Nong which comprises of 3406 persons, accounting for 90.1 percent. The other 8.5 percent are Tay and 1.4 percent are Kinh (Table 3.4).
Table 3.4 Ethnic composition of Dak Phoi commune
Source: Dak Phoi People' Committee (1998)
3.2.2 Livelihood
a) Living standard
Administration Unit Area (km 2) Population (persons)
Population density
(persons/km 2)
Population growth rate
(%)
Dak Lak province (*) 19,535 1,515,367 77.57 2.93
Lak district (**) 1,077 41,692 38.71 2.98
Dak Phoi commune (***) 141.3 3,779 26.74 3.10
Ethnic groups Households Household heads Proportion (% of household heads)
M'Nong 614 3406 90.1
Tay 59 320 8.5
Kinh 14 53 1.4
TOTAL 687 3779 100
Page 3 of 17

Most inhabitants of Lak district, including Dak Phoi commune, are subsistence farmers with very low standard of living. The GDP per capita of Lak District in 1997 is about 110 USD, compared with 300 USD for Dak Lak Province (Ksor, 1998b).
Dak Phoi is not distinct from the district condition, especially while it is classified by the national standards as a remote area of category lil (the area with poorest infrastructure, production and social conditions, and living standards). According to an official survey in 1997-1998, there are 119 hungry households, 298 poor and 270 medium and better off households in the commune. Thus, the hungry and poor households still account for quite big proportion (60.7%) (Figure 3.1). The people in the commune are usually faced with food shortages during several months of the year (Table 3.5).
Data Source: Dak Phoi People's Committee, 1998.
Figure 3.1 Household classification of Dak Phoi com mune
During the time with food shortages, most households use bamboo shoots, vegetables and other forest products (63.9%), borrow rice and foods from their relatives or neighbours (51.4%) or go to work as hired labours (34.7%) for survival. The government's subsidies are modest. Only four interviewed households, have received inkind subsidies in the time they were hungry (Table 3.6).
Table 3.5 Food shortages in a year
Note: HH = household. Source: Survey Data (1999).
Village No. of HHs HH with food shortages Duration with food shortages in a year (months)
No. % Mean Max
1. Bujuk 20 19 95.0 4.5 8
2. Nam 10 9 90.0 3.5 10
3. Dung 10 8 80.0 4 7
4. Lieng Keh 12 7 58.3 4 6
5. Jie Juk 14 12 85.7 3.5 5
6. T’Long 15 12 80.0 3 5
7. Chieng Kao 8 5 62.5 3 5
Dak Phoi 89 72 80.9 4 10
Page 4 of 17

Table 3.6 Sources for survival during the period of food shortages
Sources for survival
Source: Survey Data (1999).
b) Agricultural production
The main source of income of ethnic minority groups in Lak district is from agricultural production. 8283.3 ha of district land is classified as agricultural land. The main annual crops in the region are wet rice, upland rice, maize and cassava. The beans and groundnuts are also intercroped in the fields. The perennial crops include coffee,cashew and rubber. However, the planting area of coffee rapidly increases while the area of cashew sharply dropped from 916 ha in 1996 to 254 ha in 1997 (Lak Statistical Office, 1 998). There are only 1 50 ha of rubber in the district.
Table 3.7 Areas and outputs of main annual crops, L ak District, 1997
Source: Lak Statistical Office, 1998.
The upland rice plays an important role in the agricultural production of the inhabitants in Dak Phoi commune. The areas as well as the outputs of upland rice and other upland crops are dominant in comparison with other communes in the district, while its wet rice land and yield are the second smallest (Table 3.7). The limited low
Village Forest products
Government’ s sussidies
Borrowing Hiring out labour
Basket making for
food exchange
pension Cattle & poultry selling
No. of
HHs
% N. of HHs
% No. of
HHs
% No. of HHs
% No. of
HHs
% No. of
HHs
% No. of
HHs
%
1. Bujuk 14 73.7 1 5.3 10 52.6 7 36.8 0 0.0 2 10.5 0 0.0
2. Nam 7 77.8 0 0.0 6 66.7 5 55.6 1 11.1 0 0.0 0 0.0
3. Dung 6 75.0 1 12.5 4 50.0 3 37.5 0 0.0 0 0.0 0 0.0
4. Lieng Keh 7 100 0 0.0 5 71.4 2 28.6 1 14.3 1 14.3 0 0.0
5. Jie Juk 2 16.7 0 0.0 7 58.3 2 16.7 4 33.3 0 0.0 1 8.3
6. T’Long 7 58.3 2 16.7 2 16.7 6 50.0 4 33.3 0 0.0 1 8.3
7. Chieng Kao 3 60.0 0 0.0 3 60.0 0 0.0 0 0.0 0 0.0 0 0.0
Total 46 63.9 4 5.6 37 51.4 25 34.7 10 13.9 3 4.2 2 2.8
Wetland rice Upland rice Maize Cassava
Communes Area (ha) Output (ton)
Area (ha) Output (ton)
Area (ha) Output (ton)
Area (ha) Output (ton)
1. Lien Son town 170 717 10 20 15.0 84 6.7 50
2. Yang Tao 414 1400 8 15 42.5 104 35.0 259
3. Bong Krang 395 1405 87 178 106.5 455 50.0 370
4. Dak Lieng 564 2465 23 46 132.7 661 9.0 68
5. Dak Phoi 120 398 537 1182 154.5 722 79.5 604
6. Dak Nue 240 864 191 401 120.6 574 16.7 127
7. Buon Tria 1201 5120 - - 28.5 180 - -
8. Buon Triet 1316 5708 - - 60.0 124 20 150
9. Krong Kno 116 378 300 690 153.0 555 10 75
TOTAL 4536 18455 1156 2532 813.3 3459 226.9 1703
Page 5 of 17

land areas which can not meet the food requirement is a reason for the prevalence of shifting cultivation in Dak Phoi, especially amongst M'Nong group. The shifting cultivation, its causes and impacts on the farmers' living condition will be explained in the next chapter.
The most prevalent perennial cash crop in Dak Phoi is coffee. Many cashews have been planted by 327 Programme, but its area has significantly reduced in recent years because of low productivity due to inappropriate weather condition. Rubber is not planted in Dak Phoi since the farm size is too small to make rubber plantirig efficient.
c) Agroforestry adoption
Agroforestry is not very popular in Lak district. The most widespread application is home garden, which the households have spontaneously adopted. There are only two systematic agroforestry models are in implementation under the support of Sustainable Management of Resources in the Lower Mekong Basin Project (SRMP) in two villages of Dak Phoi commune: the 4 ha agroforestry model in Bu Juk and the home garden model in T'Long. The details of the agroforestry systems in Lak district will be considered later in Chapter 5.
There were 6 households taking part in the first phase of the project in Bu Juk village in 1998, and other 7 households are going to participate in the phase 11 in this year, 1999. In T'Long village, 14 households just started the home garden project in May 1 999.
The main incentives for agroforestry adoption in the two pilot villages are the prospect of high income earning and the presence of assistance (Table 3.8). All the participants in the two projects are provided with the knowledge of the systems, the technique of cultivation on slope land, planting and raising the trees and crops, the seedlings of forest and fruit trees, and fertilizers by the SMRP. The spillover effect is also an important factor since five out of seven households taking part in the phase 11 of the project in Bu Juk (71.4%) have considered the good results in the phase I as the reason for their agroforestry adoption.
Table 3.8 Reasons for Agroforestry Adoption
Source: Survey Data, 1999
Most households who do not practice agroforestry system (75.8% of survey sample) have never heard about and have no single knowledge of agroforestry systems (Table 3.9). This is the main cause of non-agroforestry adoption in the five villages under the survey, excluding the two pilot ones. The lacks of capital and of technical assistance are the two main reasons for not practicing agroforestry amongst farmers who have known about the system.
Reasons Interviewed HHs with agroforestry adoption
%
1. High income 20 87.0
2. Erosion control and soil protection 13 56.5
3. Crop diversification and risk reduction 1 4.3
4. Presence of information and technical assistance 20 87.0
5. Impression on the results of previous phase 5 21.7
6. More stable settlement life 1 4.3
Total 23 100
Page 6 of 17

Table 3.9 Reasons for Non -Agroforestry System Adoption
Source: Survey Data, 1999.
d. Forest product collection
Non-timber forest products (NTFPs) play an important role in the life of indigenous minority groups in Lack district as well as of M'Nong group in Dak Phoi commune. The bamboo shoots and forest vegetables are the main foodstuffs of M'Nong daily meals, especially during the time of food shortages. A 100% of M'Nong households collect the fuel wood, the only fuel they use, from the forest. The other NTFPs such as bamboo poles, Litsea bark, ginger and alpinia, rattan and wildlife also provide indigenous people with additional sources of income (Table 3.10)
Table 3.10 NTFPs collection in Dak Phoi commune
Source: Survey Data, 1999
Besides NTFPs, timbers for house construction and for other uses are also collected from the forest. In Ute Bartels' study (1999), she has calculated the yearly requirement for timber of an average household in Dak Phoi commune (Table 3.11). However, it is difficult to know the exact quantity of collected timber in a year by the households since tree cutting from the forest is now considered as illegal.
Table 3.11 Average household's requirement for timb er
Reasons Interviewed HH with non-AF adoption %
1. No knowledge 50 75.8
2. Lack of capital 17 25.8
3. Delay in profit earning 1 1.5
4. No technique 1 1.5
5. Lack of assistance 12 18.2
6. Shortage of labour 4 6.1
7. Unstable product price 1 1.5
8. High risk 1 1.5
TOTAL 66 100
NTFPs No. % Unit Total Mean/HH Max/HH Min/HH
1. Bamboo shoots 82 92.1 Kg 12,733 143.1 900 0
2. Bamboo poses 56 62.9 Stem 2,366 26.6 288 0
3. Litsea bark 9 10.1 Kg 2,969 33.4 960 0
4. Ginger/Alpinia 7 7.9 Kg 1,165 13.1 750 0
5. Rattan 3 3.4 Stem 280 3.1 140 0
6. Fueiwoods 89 100 ma 482.1 5.4 19.6 1.6
7. Wildlife 2 2.2 Kg 164 1.8 150 0
Purpose of use Calculation basis Requirement (m 3/HH/year)
Timber for house construction a) Traditional house: 20 m3/HH/20 years
b) Modern house: 5m3/HH/20 years
a) 1
b) 0.25
Timber for coffins 0.3 m3/coffin, 1 coffin in 25 years based on the death rate of 7.8 per million
0.012
Page 7 of 17

Source: Ute Bartels, 1999.
e) Infrastructure and Market
Lak district is connected with Buon Ma Thuot by the national road No. 27 and is easily accessible in both seasons. Dak Phoi commune has a ground road, which connects the villages in the commune with the national road No. 27 and with the other communes in the district. It is a favourable condition in transportation and goods exchanges for Dak Phoi inhabitants. However, the intercommunal road is in bad condition and this heavily obstructs the travailing in rainy season. Two villages in the commune: T'Long and Du Mah, are separated by Dak Phoi river where there are no bridges. Therefore, the only way for approaching them is to wade across the streams.
No formal market structures have been established in the area since subsistence farming is practiced. The M'Nong inhabitants normally barter with other people within their village for the needs. In some villages, there are stalls, which are owned by Kinh people. The cash crops are bought at households' doors by coming Kinh traders. The M'Nong have no bargaining ability and usually have to accept any prices that are offered to them. The absence of logistics and processing facilities at the place limits the cultivation of industrial crops.
The only local market is situated in the district capital, about 8 to 12 km from the villages. Most villagers normally go to the market only when they have money and want to buy durable goods. It is in average once a month, but some people even never go to the market (Table 3.12).
Table 3.12 Inhabitants' accessibility to the local market in Dak Phoi
Source: Survey Data, 1999.
3.2.3 Education and Healthcare
Source: Survey Data, 1999.
Figure 3.2 Education level of Dak Phoi Commune
Villages Distance to market (km) Annual average times of going to market
1. Bujuk 10 16
2. Nam 9 7
3. Dung 12 11
4. Lieng Keh 12 10
5. Jie Juk 7 19
6. T’Long 12 11
7. Chieng Kao 6 33
Dak Phoi 10 15
Page 8 of 17
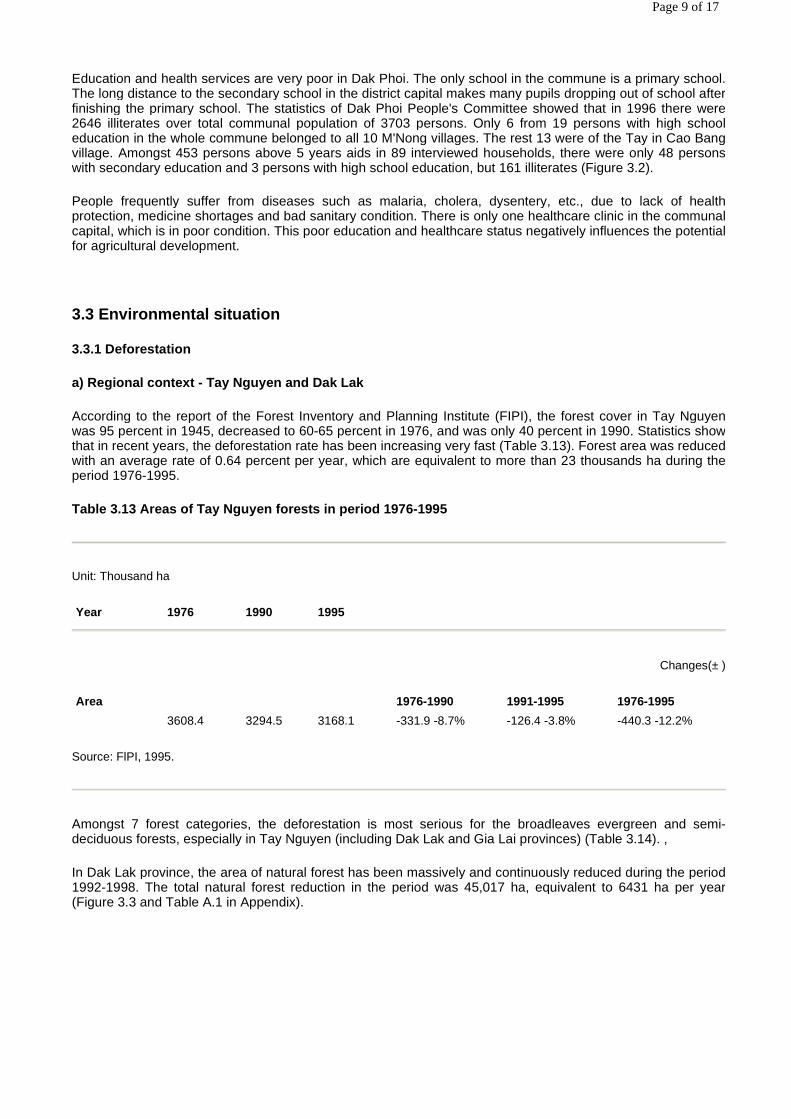
Education and health services are very poor in Dak Phoi. The only school in the commune is a primary school. The long distance to the secondary school in the district capital makes many pupils dropping out of school after finishing the primary school. The statistics of Dak Phoi People's Committee showed that in 1996 there were 2646 illiterates over total communal population of 3703 persons. Only 6 from 19 persons with high school education in the whole commune belonged to all 10 M'Nong villages. The rest 13 were of the Tay in Cao Bang village. Amongst 453 persons above 5 years aids in 89 interviewed households, there were only 48 persons with secondary education and 3 persons with high school education, but 161 illiterates (Figure 3.2).
People frequently suffer from diseases such as malaria, cholera, dysentery, etc., due to lack of health protection, medicine shortages and bad sanitary condition. There is only one healthcare clinic in the communal capital, which is in poor condition. This poor education and healthcare status negatively influences the potential for agricultural development.
3.3 Environmental situation
3.3.1 Deforestation
a) Regional context - Tay Nguyen and Dak Lak
According to the report of the Forest Inventory and Planning Institute (FIPI), the forest cover in Tay Nguyen was 95 percent in 1945, decreased to 60-65 percent in 1976, and was only 40 percent in 1990. Statistics show that in recent years, the deforestation rate has been increasing very fast (Table 3.13). Forest area was reduced with an average rate of 0.64 percent per year, which are equivalent to more than 23 thousands ha during the period 1976-1995.
Table 3.13 Areas of Tay Nguyen forests in period 19 76-1995
Unit: Thousand ha
Changes(± )
Source: FlPI, 1995.
Amongst 7 forest categories, the deforestation is most serious for the broadleaves evergreen and semi-deciduous forests, especially in Tay Nguyen (including Dak Lak and Gia Lai provinces) (Table 3.14). ,
In Dak Lak province, the area of natural forest has been massively and continuously reduced during the period 1992-1998. The total natural forest reduction in the period was 45,017 ha, equivalent to 6431 ha per year (Figure 3.3 and Table A.1 in Appendix).
Year 1976 1990 1995
Area 1976-1990 1991-1995 1976-1995
3608.4 3294.5 3168.1 -331.9 -8.7% -126.4 -3.8% -440.3 -12.2%
Page 9 of 17

Table 3.14 Areas of broad-leaves evergreen and semi -deciduous forests in some critical regions
Data Source: Dak Lak Forest Protection Sub-Department, 1999.
Figure 3.3 Change in forest area of Dak Lak provinc e in period 1992-1999
The forest fire and illegal destruction is recently in an alarming situation, especially since 1994 (Table 3.15). The destroyers are both spontaneous migrants (11,672 ha) and local inhabitants (7782 ha). The purpose of forest destruction is obtaining lands for industrial tree plantation (5836 ha), annual crop plantation (11,672 ha) and settlement (1947 ha). Most of forest fires are due to slash-and-burn practices.
Region Year Changes in period ( ±±±± )
1976 1990 1995 76-90 91-95 76-95
Tay Nguyen 2342.6 1786.6 1710.4 -556.0 -76.2 -632.2
Northern Central 1400.9 1150.2 1211.1 -250.7 +60.9 -189.8
Central 538.1 324.5 403.6 -213.6 +79.1 -134.5
South-West 467.8 216.6 166.5 -251.2 -50.1 -301.3
Page 10 of 17

Table 3.15 Area of fired and destroyed forests in D ak Lak (1992 - March 1999)
Unit: thousands ha.
Note: Data recorded at the end of reported period. Source: Dak Lak Forest Protection Sub-Department, 1999.
b) Local context - Lak district and Dak Phoi commune
The forest cover of Lak district have reduced from 66.4% (73,476 ha) in 1995 to 65.7% (72,481 ha) in 1998 (Lak Forest Protection Unit, 1999). The statistics of forest destruction and- fire in Lak district and Dak Phoi commune since 1995 are shown in Table 3.16.
Most the losses are of natural forest. During the first 4 months of 1999! 0.5 ha of protected pine forest, which was planted in 1998, has been fired. Most seriously, 10 ha, including 3 ha of nine-year-old Acacia auriculiformis forest, have been lost in Dak Phoi by shifting cultivators.
Table 3.16 Area of fired and destroyed forests in L ak and Dak Phoi, 1995-1999
Source: Lak Forest Protection Unit, 1999.
3.3.2 Causes of deforestation
According to the Dak Lak Forest Protection Sub-Department, the main causes of deforestation in the province include slash-and-burn for arable land, commercial logging, presence of wood processing factories that encourages illegal logging in the area and forest fires caused mostly by slash-and-burn activity (WWF, 1998). Apart from the logging, the increasing migration into the province in recent years is the main factor that has put a population pressure on land and as a consequence, forest trees are slashed to acquire lands for shifting cultivation and perennial industrial crop plantation.
a) Migration
Due to the province's potential for economic development, Dak Lak is one of the most attractive destinations
Year TOTAL Forest fired Forests destroyed
Total Planted Natural Total Planted Natural
1992 1,790 358 58 300 1,432 1,432
1993 1,979 1,000 235 765 979 979
1994 3,577 550 143 407 3,027 38 2,989
1995 3,258 28 28 3,230 3,230
1996 4,928 28 28 4,900 200 4,700
1997 3,277 3,277 200 3,077
1998 2,265 428 428 1,837 121 1,716
Mar-1999 772 772 4 768
Location Forest destroyed (ha) Forest fired (ha)
1995-1996 1997 1998 1-4/1999 1998 1-4/1999
Lak district 200 114.8 77.35 24.85 112.5 0.5
Dak Phoi commune - 20 9 10 7
Page 11 of 17

for migrants. There are two main types of migration into Dak Lak: planned migration through official redistribution programmes and spontaneous migration.
Up to September 1997 Dak Lak had received 52,544 planned migrant households with 311,764 migrants and 71,985 spontaneous migrant households with 350,828 migrants. The statistics show the increasing tendency of spontaneous migration to Dak Lak while planned migration has been continuously decreased (Figure 3.4). In average, there are more than 3000 spontaneous migrant households came to Dak Lak each year which account for about 1.5 times of the planned migration. This number was highest for the period 1991-1996: 6799 households with 32,124 migrants per year (Table 3.17).
Table 3.17 Spontaneous migration in Dak Lak, period 1976-March 1999
Source: Dak Lak Sub-Department of Fixed Cultivation, Permanent Settlement and NEZ, 1997 and 1999.
The violent spontaneous migration in recent years has caused a lot of socioeconomic as well as environmental problems for Dak Lak province. The spontaneous migrants, due to the lack of close control, freely clear good quality forests and convert them to arable land. A report of the Sub-Department of Fixed Cultivation, Permanent Settlement and NEZs has stated that an average migrant household clears 1,256 ha forest for arable land (WWF, 1998). The presence of migrants also encourages land trading in the region. Nowadays, many poor indigenous families use this way of trading as a means to make living, although at first they sold the land to the migrants just in emergency cases. In addition, 30% of spontaneous migrant households belongs to more than 30 minority groups whose traditional cultivation method is slash-and-burn. Most of them go deeply into the forest to practice shifting cultivation, even into the nature reserve areas, protected and special use forests at the borders with neighbour provinces.
b) Shifting cultivation
As we have known, traditional shifting cultivation in condition of low population density with an adequately long fallow period is a sustainable land use system. However, with rapidly increased population due to both migration and unawareness of family planning, especially in the community of ethnic minorities, shifting cultivation became one of the main causes of forest loss in Dak Lak. Shifting cultivation is practiced by both migrants and local inhabitants belonging to ethnic minority groups.
According to a report of the Department of Agriculture and Rural Development (DARD) of Dak Lak Province, the total area of forest destruction because of shifting cultivation during the period 1992-1997 was 11,845 ha, accounted for 70.3 percent of total illegally destroyed forests (Table 3.18). The slash-and-burn habit of shifting cultivators is also blamed for most of the forest fire damage because of its uncontrolled fire (see Table 3.15).
Table 3.18 Forest destruction and its causes in Dak Lak, 1992-1997, in hectare
Source: Dak Lak Department of Agnculture and Rural Development, 1998.
c) Land expansion for Industrial crop plantation
The soils in Dak Lak, especially the basalt soil, are extremely appropriate for perennial industrial tree development. The area of perennial industrial crops in the province have been expanding rapidly: from 87,148 ha in 1990 to 205,900 ha in 1998 (DDARD, 1998). The expansion of perennial crop was accompanied by the increase in forest destruction for this purpose' mainly for coffee plantation (Table 3.18).
1976-1980 1981-1985 1986-1990 1991-1995 1996-3/1999
HHs Heads HHs Heads HHs Heads HHs Heads HHs Heads
2,656 14,693 7,602 40,689 18,338 91,658 35,580 166,277 8,459 41,298
Causes Year
Total1992 1993 1994 1995 1996 1997
Shifting cultivation 978 628 2,110 2,365 3,900 1,864 11,845
Perennial plantation 454 351 917 865 1,000 1,164 4,751
Total forest destruction 1,432 979 3,027 3,230 4,900 3,277 16,845
Page 12 of 17

In 1975, there were only 7000 ha of coffee in Dak Lak and the area reached 169,500 ha in 1998. The coffee yield in Dak Lak is one of the highest in the world: 2.2 to 2.5 tons/ha while the world average is only less than 1 ton/ha. Moreover, the price of coffee in the international market was high in recent years. Coffee plantation became very promising and attractive for farmers and also for migrants to Dak Lak. Just in 1995, 23,600 ha of coffee was newly planted (DDARD, 1998).
A dangerous phenomenon has appeared: ethnic minority people clear the forest land, sell the land to more experienced Kinhfarmers for coffee plantation and go further into the forests practicing shifting cultivation.
3.4 Government programmed and policies related to t he sustainable development in the highlands
3.4.1 National policies and programmes
a) Land allocation process
The land allocation process started in the country after the promulgation of new Land Law in 1993 and subsequent implementation Degrees No. 64/CP dated September 27th, 1993 and No. 02/CP dated January 15th, 1994 (allocation of agricultural and forestry land, respectively). The Law provides farm family with stable and long term rights to use land by giving them Land Use Certificates (LUCs).It also stated that the land-use right may be transferred, mortgaged, rented, exchanged or inherited. The new policy aims at creating more incentives for farm households to invest in production and business activities in their land, and thus improve their life.
The land allocation process started in Lak district in 1994. The communal cadastral units are responsible for land survey, measuring and mapping. The District People's Committee in coordination with District Cadastral Department has issued temporary LUCs (the White Book Certificates). The actual Red Book Certificates are in the process of issuance.
The forest land allocation was implemented in Lak district in 1994-1995 under 327 Programme (see part d) in this section). About 25,000 ha of forest land has been allocated to farm households under signed forest protection contract.
In Dak Phoi Commune, Lak State Forest Enterprise (SFE) is the only organization who is responsible in controlling all forest land. In two year 1994-1995, Lak SFE allocated 2409.1 ha of forest to farm household groups (Table 3.19). Each forest protection group consists of 4-10 households with about 10 ha of allocated forests per household in average. Households were paid 40,000 VNDlha/year from 327 Fund in the first year. This amount reduced to 20j000-30,000 VND in the second year and to only 10,000-15,000 in the following years.
Table 3.19 Forest land allocation in Dak Phoi Commu ne
Source: Dak Phoi People's Commiffee, 1998.
Due to unclear definition of rights and obligations of both sides in the forest protection contracts, the delay and
Total Area (ha) No. of No. of Allocation
Villages (ha) Planted forests Natural forests groups HHs year
1. Lieng Keh 259.5 259.5 8 36 1994
2. Bu Juk 131.2 131.2 4 33 1994
3. Du Mah 574.5 574.5 16 46 1994
4. Jie Juk 72.1 72.1 2 2 1994
5. Dung 492.8 183.0 309.8 14 63 1994
6. T'Long 515.0 515.0 15 57 1995
7. Nam 364.0 364.0 10 65 1995
TOTAL 2409.1 183.0 2226.1 69 302
Page 13 of 17

decreasing pattern of payments, and limited controlling capability of SFE, part of allocated forests was also deforested. During the survey, people in three forest protection groups realized that their assigned forests were encroached, in which forests of two groups were totally cleared! Particularly, 50 ha of forest under the responsibility of one from these two groups were destroyed by the very group members in this year. The reason was explained by no more payments for forest protection (the 327 Programme closed at the end of 1998), hence the forest was cleared for shifting cultivation.
b) Fixed Cultivation and Sedentarization Programme
The Programme was initiated in 1968 by the creation of the Department of Fixed Cultivation and Sedentarization (DFCS) under the Ministry of Forestry. Its responsibility was to stop shifting cultivation of ethnic minorities living in the mountainous areas by creation of permanent, fixed cultivation followed by Sedentarization of the population. Since 1990 DFCS reports directly to the office for Ethnic Minorities and Mountainous Areas, under the Government Office.
During the first 20 years the emphasis was on Sedentarization with the distribution of rice ration through the cooperatives. Since 1988, more attention has been paid to facilitating fixed cultivation and food production through supply of inputs. However, large investments were distributed evenly over the programme's target area with very limited results, as shifting cultivators were not given any new options for the livelihood. After 25 years, less than half of the over 2 million shifting cultivators of 1968 have been settled, and even fewer have abandoned shifting cultivation (Le Trong Cuc and Tran Duc Vien, 1995).
Since 1991, a project approach was as follows: The funds would be allocated only to the projects approved by government. The provided funds under the Programme and also 327 Programme (see below) have been used for land reclamation, improvement of rice fields, irrigation and drinking water supply, and building of small hydropower stations, roads, schools, clinics, etc. These activities are carried out by the district authorities or nearby Forest Enterprise. The role of DFCS is rather to identify potential areas, assist in preparing the projects and supervise the operations.
The Fix Cultivation and Sedentarization Programme has been implemented in Dak Lak since 1983. During the period 1991-1998, the central government has invested 39.11 milliard Dong in the province under this Programme. This fund has been used for reclamation of 1328 ha of land, construction of 66 irrigation projects, 77.3 km of roads, 10 drainage, 2 bridges, 3555 m2 of schools and clinics and 10 electric stations. The fund allocated to Dak Lak in 1999 for Fix Cultivation and Sedentarization Programme is 4.63 milliard Dong (DFCS-NEZSD, 1999).
Despite high investment, the impact of the Programme has been unsatisfactory. The public funds were mainly invested in buildings and infrastructure rather than transfer of knowledge, assistance in increasing production and environment protection. Shifting cultivation is still widespread among ethnic minorities in Dak Lak. The official statistics show that there are 3173 households with 17,983 people in the whole province still practicing shifting cultivation (Table 3.20). These figures for Lak district are 423 households with 2217 people, in which 288 households are sedentary shifting cultivators and other 135 are itinerant shifting cultivators.
Table 3.20 Results of Fixed Cultivation and Permane nt Settlement in Dak Lak
Source: Dak Lak Sub-Department of Fixed Cultivation, Penmanent Settlement and NEZ, 1999.
Since shifting cultivation is considered as illegal, many people secretly practice it. Hence, the above statistics are surely underestimated.
c) Programme for Hunger Eradication and Poverty Reduction (HEPR)
HEPR is a nation-wide programme, which aims at elimination of chronic hunger and cut of the overall poverty rate (as measured by GSO in 1993) in half by the year 2000, eradication of poverty by the year 2010, and
Location
Total Fixed culticators Sedentary shifting cultivators
Itinerant shifting cultivators
HHs Heads HHs Heads HHs Heads HHs Heads
Dak Lak 52,908 319,858 49,735 301,875 1,753 9,788 1,420 8,195
Lak 4,504 25,579 4,081 23,362 288 1,434 135 783
Page 14 of 17

increase of real incomes per capita by 8 to 10 folds by the year 2020. The Ministry Labour, War-lnvalids and Social Affairs (MOLISA) has the mandate to provide guidelines for the programme implementation. Management Boards for HEPR programme have been established in most provinces with the main tasks of:
� Assessment of poverty status based on standard criteria and setting priority sequence of poor households
� Foundation of HEPR Fund � Carrying out lending operations in combination with technical transfer.
In Dak Lak province, HEPR programmeimplementation resulted in the reduction in the number of hungry and poor households from 80,000 in 1994 to 70,616 in 1996 (accounted for 26.44 percent of the total provincial households). In 1995 and first 5 months of 1996, a HEPR fund of more than 51 billiards Dong was established. The loans of about 32.5 milliards Dong had been provided to 24,155 hungry and poor households in the same period. However, in the remote mountainous areas hungry and poor households still occupy 60 to 70 percent of total number of households.
Table 3.21 Loans to households in Dak Phoi since 19 96
Source: Lak People's Committee, 1999.
Dak Phoi commune in Lak district is a poor remote commune of category lit and is former revolution base. The HEPR Programme began to be implemented there in 1996. Since then, 370 million-song of loans have been provided to 228 hungry and poor households (Table 3.21). Nevertheless, as shown in section 3.2.2, the hungry and the poor in Dak Phoi still occupy 60.7 percent of total number of households in the commune.
d) "Barren Lands" Regreening (Decree 32i) Programme
The programme was launched in 1993 to implement the Council of Ministers' Degree 327 promulgated in September 1992. Regarding households as production units, the programme focused on the development of underutilized barren uplands and improvement of reserved forest and head watershed protection, in order to sedentarize itinerant shifting agricultural population and create a sustainable life for inhabitants of settlement villages.
In Lak district of Dak Lak province, the implementation of 327 Programme focused on forest plantations, forest protection, natural conservation and development of industrial crops (cashew, coffee and fruit trees), food crops (wet rice, maize and upland rice) and animal husbandry. More than 300 ha of barren hills was reforested by the M'Nonggroups in the period 1993-1994.
Up to the end of 1997, 315 ha of cashews and about 90 ha of Acacia mangium and Cassia siamea have been planted under the 327 Programme. However, most of these planted forests have been damaged. Only 38 ha of planted cashews is left, other 107 ha was destroyed for coffee plantation (62 ha) or sale to Kinh people (45 ha), and the rest 170 ha was fired or died. In just the first three months of 1999, the destruction of planted forests of 327 Programme was 17.74 ha (Table 3. 22). Most of these areas were for shifting cultivation and sale to Kinh people.
Source of funds Amount (VND) Borrower HHs Purposes of borrowings
1. 120 Fund 30,000,000 10 � Coffee plantation & tending � Sprinkler machine purchase
2. VBP 217,500,000 161 Crop plantation and tending
3. 327 Fund 42,500,000 17 Coffee plantation & sprinkler machine purchase.
4. Red Cross (Swiss) Fund 80,000,000 40 � Cow husbandry � Coffee plantation & tending
Total 370,000,000 228
Page 15 of 17

Table 3.22 Destruction of 327 planted forests in 1s t quarter of 1999 in Dak Phoi
Unit: ha.
Source: Lak people's Committee, 1999.
The 327 Programme also provides funds for forest allocation, but this process was not very successful neither (as shown in part a) above).
e) Five-million hectare afforestation programme
In 1998, the budget for investments in 327 Programme became limited due to the huge difficulties that the country has to face: the calamities and on-going regional financial crisis. Therefore, the Decision 661/QD-TTg on 5 million ha afforestation programme was promulgated by Prime Minister in July 29'h, 1998. In fact, it is the continuation of the 327 Programme.The programme aims at planting and rehabilitating 5 million ha of new forests and protecting 9.3 ha of existing forests in order to raise the forest cover to 43 percent in 2010.
The 5 million ha of afforestation consists of:
� 2 million ha of protection and special use forests (plantation of 1 million ha and regeneration-oriented nourishment of 1 million ha), and
� 3 million ha of production forests (2 million ha with forest species and 1 million ha with perennial industrial and fruit species).
The final objective of the programme is the contribution to stabilize and improve living condition of people in the mountainous areas, particularly the people of ethnic minority groups. However, the experiences in implementation of the 327 programme should be carefully studied and necessary lessons should be drawn in order to ensure the success of the programme. Otherwise, the outcome will be just good on paper, but generally not as good in practice like the case of 327 Programme.
3.4.2. Local government policies
In addition to implementation of all national programmes, the Dak Lak People's Committee has promulgated its own measures in order to mitigate the severe deforestation in the province. The most notable was the Direction No. 13/CT-UB dated April 22nd, 1999 on "Several measures to settle and surmount illegal deforestation for plantation of coffee, pepper and annual crops". The specific measures are as follows:
� All the coffee, peppers and annual crops planted on the areas of illegal destroyed forests in 1998 and 1999 must be decisively cleared off for reforestation.
� All above mentioned crops planted on deforested areas with the slope of 30° upward in the period 1995-1997 must be cleared off 100 m from the top of the hills. The rest and other lowland areas must be committed by the farmers to inter-plant with forest species following a specified pattern. If the commitments are not fulfilled or inter-planted forest trees die, the whole areas will be cleared off in the end of 1999.
� For planted crops in 1995-1997 on the illegally destroyed production forests, the land rental for production can be obtained if the natural conditions and water resources are favourable for already planted crops and the commitments are completed.
These decisive measures are timely and necessary, but not sufficient. The administrative measures only may
Special in planted forests
Causes of destruction Cashew Acacia mangiun+ Cassia siamea
Acacia mangium
Total
1. Sale to Kinh people 2.9 1.96 0.97 5.83
2. Land for settlement 0.37 0.20 0.57
3. Shifting cultivation 5.30 3.53 8.83
4. Plantation of coffee 2.5 2.50
Total 5.4 7.64 4.70
Page 16 of 17

make ethnic minority life become more marginal. The capital and technical assistance in coordination with the land allocation process is needed to provide them with means for improving and stabilizing their life. Otherwise, they will continue to destroy forests for swidden agriculture since there is no other choice for them.
3.5 Conclusion
The majority of inhabitants at researched site belong to M'Nong ethnic group. Most of them are poor farmers who are usually faced with permanent food shortages. Their main agricultural crops are upland rice, maize and coffee. NTFPs play an important role in M'Nong livelihood. Agroforestry systems are still unfamiliar to local residents, and there are only few households with agroforestry adoption under the support of the SRMP. The infrastructure in the area is underdeveloped with poor road network, poor healthcare system and lack of higher than primary schools.
The deforestation in the region is serious. The main causes of deforestation in recent years are agricultural expansion for shifting cultivation and perennial cash crop plantation. Shifting cultivation significantly contributes to deforestation, especially in Lak District. Many national and local programmes and policies have been implemented in order to stabilize the ethnic minorities' life and mitigate the problem, but the results are still limited.
Go to Next Chapter Back the Table of Contents
Page 17 of 17

CHAPTER 4
CAUSES AND CONSEQUENCES OF SHIFTING CULTIVATION
Since shifting cultivation is one of the main causes of environmental degradation in the region' measures should be taken in order to change this cultivation practice. However, the effective measures can be provided only if the factors affected households' decision on practicing shifting cultivation are well understood. Therefore, this chapter focuses on exploring the causes of shifting cultivation and the consequences of this cultivation practice as well.
Before discussing these problems, the traditional shifting cultivation and the pattern of its changes to present status is studied because it will help to better understand the causes and consequences of shifting cultivation.
4.1 The profile of shifting cultivation of the M'No ng in Lak District, Dak Lak Province
4.1.1 Traditional shifting cultivation
a) Social life
In the traditional M'Nong society, each village had its own territory which was never encroached by outsiders without agreement of village residents. This inviolability of the village territory was respected by all people in adjacent villages and any violation would be punished. All the residential and cultivation activities were taken place within that territory. The residential land in the village was community owned, while the shifting cultivation fields in the forest are owned by each clan or family, even in the fallow period.
The M'Nong life is characterized by village community base and matrilineality. However, men play most important role in decision making inside the village. The most powerful and respected person in the village was traditional village headman: the village elder. He was in charge of maintaining the interior peace of the village, protecting the traditional culture, settling cases of traditional rule violation, land claims and conflicts, organizing and steering all community activities and dealing with other villages and outsiders. The other traditional leader was the "village founder", who was the descendent of the founder of the village. He was responsible for all activities regarding the management of natural resources (Luu Hung and Vorpahl, 1997).
b) Cultivation practice
The M'Nong rely on subsistence economy of rotational shifting cultivation over centuries. They cut forest to clear land for cultivation and plant upland rice, sometimes in combination with traditional maize, cassava and vegetables on steep slopes. The fields of M'Nong families of one village normally concentrated on one site for more efficient maintenance and management: less forests cleared and fired, lower weed pressure, easier protection of crop from animals and more efficient cooperation in cultivation works.
The M'Nong has a custom of using only one upland plot per agricultural season. The size of cultivation plot depends on food requirement and labours available of each family. In the past, it was 2-3 ha per household in average. This plot is used for only one year. Then it is left in fallow and another plot will be cleared for cultivation in the following year. The fallow period in the M'Nong traditional system of cultivation was 10 to 25 years, depending on the land available. The average was 12 years.
The schedule of cultivation work during a year is as follows:
January and February: Land clearance
March: Field burning (at the end of the month)
April: Maize and early rice plantation
May: Main rice plantation
Page 1 of 14

The vegetable seeds are usually mixed with the rice seeds and both are planted together. Sometimes, a small plot of cassava is planted and it is harvested only gradually when there is the need for immediate consumption. No other inputs than labours are applied for all crops.
In the former time, each family had a live stock of buffaloes, cows, pigs and chickens. The livestock was mainly used for sacrifice. Its size was the sign of the family's wealth and power.
c) Measures for resource conservation
First of all, the traditional rotational shifting cultivation itself under the condition of low population pressure and little external intervention seems to be ecologically sustainable. The village elder in cooperation with the village founder, based on their experiences, decided which forest was appropriate for shifting cultivation and which one was needed for preservation. The fallow period of more than 10 years is enough for forest regeneration and for fertility of the soil to be recovered in the next cultivation.
Secondly, the M'Nong livelihood strongly depends on the forests. The forests provide them with land for cultivation, timber for house construction, fuel woods and a range of other NTFPs. Therefore, the M'Nong were very conscious of forest protection and have always taken the measures for forest fire prevention during the field burning. The trees and leaves were cleared to create a path of about 3 m wide around the field in order to prevent the fire from jumping out to the forest. The starting points for field burning were selected according to the wind direction so that the fire would be blew into but not out of the field. Any negligence that caused the forest fire would be severely punished by the traditional rules.
Thirdly, the M'Nong in former time used to spare the trees of good quality or even the whole patches of forest in their cultivation field far future utilization, although timber was available in the forest. This fact shows the M'Nong consciousness in natural resource preservation.
4.1.2 Changes end present statue of shifting cultiv ation
a) Change in social life
The changes for the M'Nong people in the area started in the time of French colonization. For the first time they integrated in an administrative structure above village level, joined the army, had to register and pay tax. From the beginning of 1960s, the villages had to change their residence due to the war. Some moved into the forest to cooperate with the Resistance while others were concentrated into "strategic hamlet" (Luu Hung and Vorpahl, 1997).
Since 1975, the villages have been settled in the valley, far from their ancestral territory by the government settlement policy. The traditional village headman is still powerful people; but beside him there is a modern head of the village and his deputy. The traditional and modern village headmen coordinate with each other to decide the affairs of the community in accordance with the modern laws and customary rules.
The role of M'Nong women in the modern society is limited. Although they still have the influential voice in the family, but normally men are the household heads. Their role in social activities and outside relations is more confined because M'Nong women do not understand Kinh language very well.
b) Change in cultivation practice
Together with the social changes, the plants cultivated, livestock and farming methods of M'Nong in Lak district have also changed. In the scope of the settlement programme, each family has been provided with a small piece of land for residence and homegarden in the valley..They started getting accustomed to new varieties and new methods of wet rice and other crop cultivation. Their fields became scattered. Each family now has in
June: Weeding
July: Weeding and maize harvest
August: Weeding
September: Early rice harvest
October and November: Main rice harvest
Page 2 of 14

average 3-4 cultivation plots at different sites (Table 4.1).
Table 4.1 Number of cultivation plots per household in Dak Phoi commune
Source: Survey Data, 1999.
The most prevalent new plants cultivated are wetland rice, hybrid maize, mungbeen and coffee. As mentioned in the previous chapter, cashew was outspreadly introduced in the region by 327 Programme, but now not much is left. There are only five among 89 interviewed households still keep their cashew plots and only three of these plots could give yields in the previous year.
Wetland rice has been planted since 1975-1976, but at first local variety was mostly used. The modern varieties gradually became popular only after 1994 (Figure 4.1). There are only six interviewed households in Lieng Keh village have been applied modern varieties since 1975-1976. The low yield local variety is still in use by six out of 78 households in survey samples who have paddy fields.
Maize is the second important upland crop after rice. The traditional maize is still planted by most farmers for consumption only. The new hybrid maize with high yield is a cash crop for sale. Some households keep a part of hybrid maize for livestock breeding. This modern variety has been widespreadly introduced and applied since 1997 in a hybrid maize programme" conducted by Lak Department of Agriculture, although some households already first applied it in 1994.
Mungbeen and peanut are usually intercroped in maize fields or coffee garden with the purpose of soil fertility improvement and additional income. However, they are still not very popular to M'Nong in Dak Phoi.
Most households have established a coffee garden since 1994 when coffee price fever swept the region. Nevertheless, the coffee planted by M'Nong does not grow very well and give low yields because of low inputs and improper tending methods.
Beside new plants and varieties, traditional upland rice is still a main crop for subsistence of M'Nong people. No modern variety application of upland rice was observed at the site during the survey. Traditional upland rice and maize are planted both in permanent plots in plain land and by shifting cultivation on steep slopes.
All livestock were lost during the war and now the new ones are built up. Cows are more suitable in the present condition than buffaloes, hence very few buffaloes are raised. 64 from 89 interviewed households have livestock, but among them only 25 breed totally 52 cows and one breeds a buffalo. The livestock, especially cows, are important capital assets for M'Nong families. The livestock sales are main source to finance the house construction of most households in Dak Phoi commune.
c) Present status of shifting cultivation
The statistics of Dak Phoi People's Committee shows that in the whole commune, there are 130 households who are still practicing shifting cultivation (Table 4.2). These figures are certainly underestimated as shifting cultivation is now considered illegal, and thus many families try to conceal it. During the survey, some interviewed households denied the fact that they were practicing shifting cultivation at first, but then recognized it after some more talks.
Plots Villages
HH Bu Juk Nam Dung Lieng Keh Jie Juk T'Long Chieng Kao TOTAL
Average 3.65 3.6 3.4 3.58 3.21 3.27 3.75 3.64
Max 5 5 5 5 6 5 5 6
Min 2 2 2 2 3 2 3 2
Page 3 of 14

Table 4.2 Present status of shifting cultivation in Dak Phoi Commune
Total No. of Households with shifting cultivation p ractice
Source: Dak Phoi People's Committee, 1999.
According to a report of Dak Phoi People's Committee in April 1999 the actual area of upland rice in the commune is 472 ha. Another report of communal People's Committee in November 1998 stated that the up land rice areas in plain land amounted
only 65.4 ha. Therefore, the rests (more than 400 ha) are areas for slash-and-burn cultivation on steep slopes. The report also emphasized that these areas might be much larger in reality.
Now the shifting cultivation plots of M'Nong in Dak Phoi commune are no longer close to their residence nor concentrated in one site. They are scattered out of the village territory with the distance of 1 to 30 km (about 5 km in average). Particularly, shifting cultivators in Chieng Kao village have to go no less than 10 km to reach their swiddenfields (Table 4.3).
The M'Nong in Dak Phoi still keep the custom of only one-year cultivation on a plot before its abandonment for fallow. In general the fallow rotation have significantly shortened to only five to six years, although several households still manage to keep a fairly long one of 10 to 11 years. For some families in die Juk and Chieng Kao villages, the lands in fallow are for just two years (Table 4.3).
Villages Households Total Sedentary shifting cultivation
Itinerant shifting cultivation
1. Chieng Kao 105 22 22 0
2. Lieng Ong 59 0 0 0
3. Pai Ar 71 0 0 0
4. Cao Bang 59 0 0 0
5. Nam 65 8 6 2
6. T’Long 57 46 34 12
7. Dung 71 4 4 0
8. Bu Juk 33 8 8 0
9. Jie Juk 85 26 18 8
10. Lieng Keh 36 6 6 0
11. Du Mah 46 10 10 0
Dak Phoi 687 130 108 22
Page 4 of 14

Table 4.3 Some features of shifting cultivation in Dak Phoi Commune
Note: SC = shifting cultivation; HH = household. Source: Survey Data, 1999.
A big change in the shifting cultivation of M'Nong in Lak district is the appearance of itineral shifting cultivation. In traditional life, M'Nong rarely shifted their settlements. This happened only after epidemics causing the death of many people or in some very scared case if the way to the fields was too long, but in any case, the movement was within the village territory. Nowadays, some M'Nong families sell their permanent cultivation lands or land in fallow and go deep into the forest to live a nomadic life, changing from relatively sustainable rotational shifting cultivation to destructive pioneer shifting cultivation practice.
4.2 Causes and consequences of shifting cultivation
Despite the government's effort and big investment on fixed cultivation and sedentarization for ethnic minorities, majority of M'Nong in Lak still practice shifting cultivation. Why does this happen and what consequences may shifting cultivation create in present condition? These questions will be endeavoured to answer in this section. The causal relation of shifting cultivation can be summarized in Figure 4.2. This chart is used specifically only for studied sites. The application for other are should be adjusted according to local situation.
4.2.1 Causes of shifting cultivation
a) Underlying causes
Poverty
The first principal cause of the shifting cultivation is the poverty. The M'Nong in Dak Phoi commune are subsistence farmers. The first priority of their agricultural production is to produce enough foods for family's survival. Nevertheless, most of them are very poor and normally suffer with food shortages for 3-5 months a year (see Section 3.2.2). The incomes from the sources other than agricultural production are very limited (Figure 4.3). Amongst the ways to seek more foods for the family, shifting cultivation is the easiest and most habitual for the M'Nong in Lak district.
Therefore, the factors that contribute to the impoverishment of the farmers in the region are also the motive for the continuation of the shifting cultivation.
Limitation of Permanent agricultural land
In section 3.2.2 we have seen the limitation of the low lands for permanent cultivation in Dak Phoi. The
HHs Distance to SC lands (km) Fallow rotation (year)
Villages with SC Average Max Min Average Max Min
1. Bu Juk 8 1.3 3 1 6-7 10 3
2. Nam 5 9 10 5 6-7 10 5
3. Dung 3 1.5 2 1 6 8 3
4. Lieng Keh 3 1.7 3 1 5-6 7 4
5. Jie Juk 9 6.9 30 2 6 11 2
6. T’Long 10 2.9 4 2 4 5 3
7. Chieng Kao 6 11.2 15 10 3 5 2
Total 44 5.1 30 1 5-6 11 2
Page 5 of 14

insufficient of cultivation land causes low agricultural outputs and thus unsatisfaction of the family's needs. The reclamation of unused land requires huge capital that goes beyond the capacity of the M'Nong families who are already in poverty. Therefore, they go to cut forests and practice shifting cultivation in order to acquire enough foods that are required.
Population pressure on land
There are some factors that put pressure on the agricultural land, which has already been limited. Firstly, it is the unawareness of family planning especially among M'Nong people. The populatiori growth rate in the region is quite high: about 3% (Table 3.2) and for M'Nong group it is 3.5%.
Table 4.4 Dak Phoi agricultural land cultivated by outside Kinhpeople
In which, divided by land use
Source: Dak Phoi People's Committee, 1999.
Second factor is migration. The government's policy of NEZ establishment has created a huge stream of guided immigrants to Dak Lak province since 1976 and together with them, an increasing requirement for agricultural land for their subsistence. The situation become more serious with the growing spontaneous migration in recent years (see Section 3.3.2 in Chapter 3). Even in a remote small commune like Dak Phoi there is Cao Bang village of 59 Tay households with 320 persons who have come from Cao Bang province since 1984. A big part of total communal agricultural land (384 ha out of 1335 ha, or 28.8%) is now cultivated by Kinh people out of the commune (Table 4.4). That is mainly coffee lands and fallow land, which are compatible for coffee plantation.
� Lack of capital
The land shortage can be overcome by increase in land productivity. This can be obtained by increasing the investment in the production inputs or in the development of more intensive farming systems. However, most M'Nong people are in poverty and do not have enough money even for their subsistence, while the access to credit is not easy. Most of the interviewers complained about the difficulties in procedures for credit application and the short term for repayment. 74 from 89 households who have been asked desired to get the credit for investment in agricultural production, but they could not. Among them, 35 households had never accessed to any kind of credit.
With the lack of capital, most of M'Nong farmers never apply fertilizers and other agrochemical for annual crops and some even do not use for coffee planting and tending. It results in very low productivity of their crops. The yields of main crops at the researched site in comparison with the ones of the country, the province and the district are shown in Table 4.5.
Table 4.5 Yields of main annual and perennial crops (kg/ha)
Notes: (I) & (a) 1997 data; (2) 1995 data; (4) 1999 data
Land use type Total Wetland rice Other cereals Coffee Other lands
Agricultural land (ha) 1335 123 209 383 620
Lands cultivated (ha) 384 17 10 169 188
By outsider Kinh (%) 28.8 13.8 4.8 44.1 30.3
Products Whole country(1) Dak Lak province(2) Lak District(3) M’Nong in Dak Phoi(4)
Upland rice - - 2191 898
Paddy 3880 3487 3646 2316
Hybrid maize 2489 3057 3502 2660
Coffee 1352 1286 453 627
Cashew 548(2) 349 271 140
Page 6 of 14

Source: (I) GSO-ISID (1998); (2) GSO-AFFD (1996); (3) Dak Lak statisfica/ office (1998); (4) Survey Data (1999).
� Lack of technical knowledge
Another way to improve the land productivity is to use proper techniques of planting, growing and tending for each tree and crop species. Nevertheless, the only popular cultivation technique of M'Nong is slash-and-burn cultivation of upland rice and traditional maize with no fertilizer application. They are not familiar with the cultivation technique of wetland rice, coffee and other new crop species. They do not know how to grow and select the seeds and seedlings, to apply fertilizers and agrochemical with right amount and in time, to prune and tender coffee, etc.
At the same time, extension service is very poor. The whole staff of Lak district extension staff consists of only three persons. All three extension workers are the Kinh who have little knowledge of M'Nong way of living and cultivation practice, are lack of facilities and are paid with low salaries. As a result, the most popular extension work is to deliver prescriptive messages. All the demonstration plots have been made in the fields of Kinh people in Lien Son town for easy management and ensuring the success. The extension workshops are seldom organized for ethnic minorities. Hence, M'Nong can rarely touch to the extension services.
� Poor education and health care systems
The education level is low in Dak Phoi, as the education system has not been developed yet (see Section 3.2.3). It is the constraint to the farmers' capability of perceiving new cultivation techniques and adapting to the change in the way of living which undermines the productivity of agricultural production. Low education also accompanies the lack of awareness of family planning, which put more population pressure on land. It also means low environmental consciousness. The studies of SMRP show that M'Nong in Lak district do not know the relation between the forest loss and natural calamities as well as soil erosion (Luu Hung and Vorpahl, 1997; Tu Quang Hien, 1998; Ksor, 1998a). There is no evidence of the application of erosion control measures by shifting cultivators.
The poor health means the low productivity of labours and thus, the low crop yields. Due to all above mentioned reasons, low education and poor health are indirect motive for people to continue shifting cultivation in searching for their subsistence satisfaction.
� Land tenure insecurity
In principle, the insecurity of land tenure systems undermines farmers to invest in sustainable farming systems and conservation measures, which will cost them time, money and effort. However, only few M'Nong can understand the consequences and importance of the official land title. In M'Nong traditional life, land ownership of an individual is known and respected by everybody, whether a legal title exists or not (Luu Hung and Vorpahl, 1997). During the survey, only 13 over 89 interviewed households (14.6%) have considered LUCs as a condition for their investment on land conservation measures. Therefore, the absence of official land title does not affect the M'Nong's decision on cultivation practice much at present. However, it may become increasing decisive factor, once the M'Nong gradually aware of its importance.
� Construction and implementation of government development policies without people's participation
As described in Section 3.4, the government has conducted a series of programmes in order to stabilize and improve the life for ethnic minorities in the highlands. However, all these programmes are just the imposition without any concern about tradition, cultural features and cultivation practice of each ethnic group. Therefore, ethnic minorities passively participate in the change of their life, as if they are objects of exterior interference but not actors.
The Lak Forest Enterprise, for instance, selected areas for protection based on its own maps and information, without studying people's traditional land use boundaries. Hence, they chose only the forests surrounding the villages for easy control. As a result, people lost the fallow lands close to the villages that previously belonged to them. The fallow rotation was shortened, the soil was degraded and the productivity decreased which forced people to find more land for cultivation to meet their subsistence. Therefore, the shifting cultivation are not stopped for that reason, but merely encouraged to practice in deeper forests where there is no control.
� Incoordination between government organizations
One of the main reasons for limited success of government efforts for establishment of fixed cultivation and
Page 7 of 14

improvement of the ethnic minorities' living standard is the incoordination in action between different organizations. Huge investment has been spent on land reclamation for ethnic minorities in Lak. However, without accompanying credit and extension services the farmers did not know the technique for permanent cultivation on allocated lands, and if it was known they did not have money to invest in the application. Most of them, therefore, applied the traditional technique of upland rice plantation with no agrochemical application that they used to use in shifting cultivation on their permanent lands. After about three years, the soil fertility was depleted, plantation on these lands gave extremely law yields. Then the M'Nong sold their lands to the Kinh for money and went into the forests to continue slash-and-burn cultivation.
During 1997-1998, there is 133 M'Nong households in Dak Phoi commune who illegally sold 51.42 ha of land to Kinh people (Table 4.6).
Table 4.6 Illegal land transfer in Dak Phoi Commune in 1997-1998
Note: ‘327" cashews are the cashews planted under 327 Programme. Source: Dak Phoi People's Committee, 1999.
� Underdeveloped markets
As described in section 3.2.2, the market structure for permanent agricultural products is very underdeveloped in the area. Hence, M'Nong farmers usually have to sell their crops with low and unstable prices which undermine their incomes. The low prices are also caused by the low quality of the products because of the absence of logistics and processing facilities in the region.
The absence of the formal market also enhances subsistence agriculture because of the two reasons. First, there are no other sources of food supply than the production by farmers themselves. Second, there are very few opportunities for off-farm jobs, hence the sources of incomes are restricted in their own fields. The subsistence farming has to face the risk of food shortages. In the condition of low incomes from the sources other than agriculture, shifting cultivation becomes a solution to ensure food security.
� Traditional cultivation customs
Shifting cultivation is a part of M'Nong culture. It is not easy to leave a cultivation habit that has already been practiced by generations. M'Nong also used to live amidst forests, with the forests surrounding their fields and settlement. Therefore, they have the tendency to retreat further to be near the forests and practice shifting cultivation.
The customs and habits also restrict the effort to apply the modern varieties, species and cultivation techniques and hence, undermine the intensive farming.
b) Empirical test by logit model
The logit model (1.4) is applied here to provide a deeper insight into the causes of shifting cultivation. What we
Villages No. of transferors Areas (ha) Land use types Transferees
1. Pai Ar 28 7.89 Coffee
2. Chieng Kao 37 15.10 "327" cashews People
3. Lieng Ong 17 10.30 Coffee From
4. Jie Juk 28 6.89 "327" cashews outside
5. Bu Juk 5 1.64 Coffee of
6. T’Long 8 2.90 Cereals the
7. Nam 3 1.50 Cereals commune
8. Du Mah 4 3.00 Cereals
9. Dung 2 1.50 Coffee
10. Lieng Keh 1 0.70 Cereals within village
Total 133 51.42
Page 8 of 14

are interested in is the probability of the i-th farmer to practice shifting cultivation (P' in expression (1.1)) under the given state of farm households, their cultivation practice, environment and government policies. Unfortunately, the environmental and policy variables are uncontrollable. Therefore, only variables related to decision maker's features and the household's economic conditions and cultivation practice are present in the model. The environmental and policy factors are assumed to affect equally to all farmers' decision. The more the Pj changes following the unit Change of one among these influenced factors Xk', the more decisive this factor is the reason for the farmers practicing slash-and-burn cultivation.
The dependent variable in our case is binary which takes the value "1" if the farmer practices shifting cultivation and "O" if otherwise. The definition and expected signs of the explanatory variables are described in the Table 4.7.
It is expected that the older farmers more closely relate to the shifting cultivation tradition and have greater tendency to practice it. The exclusion of shifting cultivation land from the land variable is based on the supposition that with less permanent cultivation land the farmer will more incline to shifting cultivation. The households with more productive assets may be more productive in production and may easier access to credit since the assets can be provided as collateral, hence will have more inclination to permanent cultivation. More off-farm incomes help households to cover their basic needs that the farm production cannot fully provide, therefore reduce their possibility of swidden agriculture. The probability of permanent agriculture may increase if higher yields can be obtained by fertilizer application or by more investment with available credits. The application of fertilizer for annual crops is emphasized here because many households in Dak Phoi have been applied fertilizer for their young coffee only which have not give any impact on the yields of their production yet and thus, on their choice of agricultural practice neither.
Table 4.7 Definition and expected signs of independ ent variables in logit model
The expression (1.4) is utilized for estimation of the coefficients. The specification of the logit model in this case after transformation for normality of the explanatory variables is as follows:
L1=ln<~_p) ~ ~ ~ +~4L~+~msD+4lrl(Ass~+pin(~+~n+~a~T ( 4.1)
The results of the regression are illustrated in Table 4.8. The first unrestricted regression on all single independent variables indicates the insignificance and wrong signs of age and asset variables. The constant term is not significant either. The chisquare test allows us to drop both variables as well as the intercept from the model. After the rejection all the estimated coefficients become statistically significant at 5% level or better and have the priori expected signs (Regression (2) in Table 4.8).
The regression results can be interpreted as follows:
� AGE and ASSET: The insignificance of age variable can be explained by the fact that after some decades of social changes, nowadays tradition and customs are not a decisive factor influencing the M'Nong's choice of shifting cultivation. The assets of the majority of M'Nong in Dak Phoi are too small for collateral, and the small and scattered cultivation plots restrict the efficiency of the productive assets. Therefore, the household's assets have limited effect on agricultural production and hence on the farmers' probability of shifting cultivation.
Variables Definition Expected signs
AGE Decision maker’s age in years +
EDU Decision maker’s year of schooling -
LANDNS Household’s non-shifting-cultivation land, in hectares -
HEAD Total number of people in the household, in person +
ASSET Household’s major assest, excluding land, in VND millions -
INCOMNA Household’s non-agricultural incomes, in VND millions -
FERTI = 1 if fertilizer has been applied for annual crops by the farmer, and 0 otherwise -
CREDIT = 1 if the farmer has got credit from any sources, and 0 otherwise -
Page 9 of 14

Table 4.8 Logistic regression results of the causes of shifting cultivation
Note: *, **, *** indicate statisticalsigniRcance at 10%, 5% and 1% level, respectively.
� LANDNS, HEAD and INCOMNA: As expected-and alike the above qualitative analysis, the insufficiency of permanent cultivation land, the unawareness of the family planning which results in big family size and the lack of the opportunities of off-farm earnings all significantly increase the farmer's possibility to go for shifting cultivation.
� EDU, FERTI and CREDIT: The regression coefficients of these variables once again prove that the higher education, the application of fertilizers for annual crops and the availability of credit for investment in agricultural production play important roles in the decrease of the swidden agriculture probability.
The probability of an average household to go practicing shifting cultivation can be calculated by the following equation, which is obtained after replacing the explanatory variables in the regression (2) into expression (1.1):
1 + e-<a2EDu+~3 ~n`~ANDNS>+p`HEAD+~6 ~n<~NcoMNA'+~, FERr~+p8cRED~T' (4.2)
In Table 4.9, the base case is obtained by replacing mean values of the variables in expression (4.2). The selected cases are chosen by changing one of the variables, while the others are fixed at their base case values. As we can see, the fertilizer use and the access to credit can significantly reduce the probability of an average household to go practicing slash-and-burn cultivation from 58.74% to 18.81% and 15.39% respectively. The changes in other continuous variables in the model also significantily affect farmer decision. Clearer relation between the probability of a farmer to practice shifting cultivation and continuous variables in regression is shown in Table 4.10.
Explanation Regression Coefficients
Variables (1) (2)
Coefficients Std. errors Coefficients Std. errors
CONSTANT -2.4554 (2.348)
AGE -0.0188 (0.049)
EDU -0.2829* (0.150) -0.3998*** (0.139)
In(LANDS) -4.0338*** (1.101) -3.2212*** (0.921)
HEAD 0.5606** (0.229) 0.2984*** (0.104)
In(ASSET) 0.5657 (0.442)
In(INCOMMA) -1.0464*** (0.471) -09084** ((0.375)
FERTI -1.8907** (0.947) -1.8154** (0.853)
CREDIT -2.6591*** (0.995) -2.0573** (0.819)
Included Observations 89 89
Log likelihood -21.8595 -23.6740
x2 (H0: Coefficients=0) 79.65*** 76.02***
Page 10 of 14
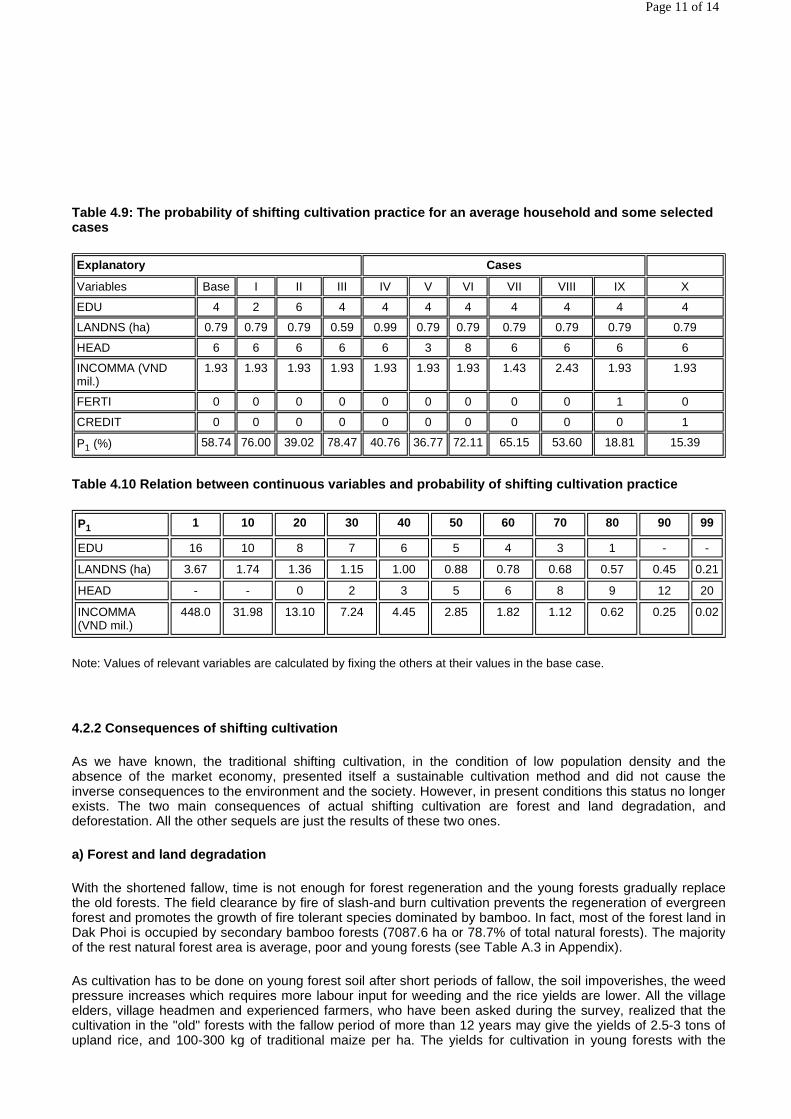
Table 4.9: The probability of shifting cultivation practice for an average household and some selected cases
Table 4.10 Relation between continuous variables an d probability of shifting cultivation practice
Note: Values of relevant variables are calculated by fixing the others at their values in the base case.
4.2.2 Consequences of shifting cultivation
As we have known, the traditional shifting cultivation, in the condition of low population density and the absence of the market economy, presented itself a sustainable cultivation method and did not cause the inverse consequences to the environment and the society. However, in present conditions this status no longer exists. The two main consequences of actual shifting cultivation are forest and land degradation, and deforestation. All the other sequels are just the results of these two ones.
a) Forest and land degradation
With the shortened fallow, time is not enough for forest regeneration and the young forests gradually replace the old forests. The field clearance by fire of slash-and burn cultivation prevents the regeneration of evergreen forest and promotes the growth of fire tolerant species dominated by bamboo. In fact, most of the forest land in Dak Phoi is occupied by secondary bamboo forests (7087.6 ha or 78.7% of total natural forests). The majority of the rest natural forest area is average, poor and young forests (see Table A.3 in Appendix).
As cultivation has to be done on young forest soil after short periods of fallow, the soil impoverishes, the weed pressure increases which requires more labour input for weeding and the rice yields are lower. All the village elders, village headmen and experienced farmers, who have been asked during the survey, realized that thecultivation in the "old" forests with the fallow period of more than 12 years may give the yields of 2.5-3 tons of upland rice, and 100-300 kg of traditional maize per ha. The yields for cultivation in young forests with the
Explanatory Cases
Variables Base I II III IV V VI VII VIII IX X
EDU 4 2 6 4 4 4 4 4 4 4 4
LANDNS (ha) 0.79 0.79 0.79 0.59 0.99 0.79 0.79 0.79 0.79 0.79 0.79
HEAD 6 6 6 6 6 3 8 6 6 6 6
INCOMMA (VND mil.)
1.93 1.93 1.93 1.93 1.93 1.93 1.93 1.43 2.43 1.93 1.93
FERTI 0 0 0 0 0 0 0 0 0 1 0
CREDIT 0 0 0 0 0 0 0 0 0 0 1
P1 (%) 58.74 76.00 39.02 78.47 40.76 36.77 72.11 65.15 53.60 18.81 15.39
P1 1 10 20 30 40 50 60 70 80 90 99
EDU 16 10 8 7 6 5 4 3 1 - -
LANDNS (ha) 3.67 1.74 1.36 1.15 1.00 0.88 0.78 0.68 0.57 0.45 0.21
HEAD - - 0 2 3 5 6 8 9 12 20
INCOMMA (VND mil.)
448.0 31.98 13.10 7.24 4.45 2.85 1.82 1.12 0.62 0.25 0.02
Page 11 of 14

lower than 6-7 years of fallow are only 0.5-1 ton and 50-60 kg per ha respectively. Therefore, the shifting cultivation has become unsustainable and inefficient. It drives the cultivators into the interminable poverty with regular food shortage.
b) Deforestation
The most severe deforestation by shifting cultivation can be happened by two ways. Firstly, the new appeared pioneer shifting cultivators who transfer the land under fallow to Kinh people for money and then continue clearing forests for further cultivation. Secondly, the forest fires are caused by uncontrolled flames during land clearance for shifting cultivation. Together with the social changes, the prevention measures against forest fire have been fallen into oblivion. The lands for shifting cultivation now are scattered, the forest land is no longer the ancestral property of the village, therefore no punishment is applied for deliberate forest fires by the community. As a result, forest fires occur more frequently. According to the Lak Forest Protection Unit, shifting cultivation is nearly the only cause of all forest loss (see Table 3.15) in Dak Phoi commune.
c) Forest product impoverishment
Forest degradation and deforestation bring about the impoverishment of the forest products. Some forest products such as litsea barks, forest ginger and alpinia can be found just at more than 10 km from the villages. The rattan almost no longer can be collected. According to the Bu Juk traditional village headman, nowadays the villagers can trap only one beast a year for the whole village, in stead of at least 5-6 ones in the past. Therefore, they have to spend more time and more labour to collect even standard forest product such as bamboo shoots or fuel woods. As the result, the life of the villagers has been directly impoverished and their living standard has been lowered.
d) Soil erosion
The loss of vegetation cover emphasizes the soil erosion because the soil is frequently affected by rain drops. The maximum land coverage of upland rice is only 20 to 30 percent. Therefore, the land with shifting cultivation is also eroded. According to Do Dinh Sam (1994), the soil loss in surrounding open slash-and-burn areas is rather great: 115-130 tons/ha with the slope of 15° to 25°, and 250 t o 350 tons/ha with light soil structure. In the past, the thick forests around shifting cultivation fields helped to restrain the erosion. Nowadays, with the decrease in forest cover soil erosion has become increasingly threaten.
The soil fertility is markedly reduced due to erosion because a large amount of nutrient is transported. The relation of soil quality and vegetation is shown in Table 4.11. It can be seen that the soil fertility in swidden rice fields and in barren land declines rapidly in comparison with that of the land under thick forests.
Table 4.11 Relation of soil quality and vegetation
Source: Le Trong Cuc, Tan Duc Vien (1995).
Hence, the soil erosion becomes one of the causes of low productivity in agricultural production, which results in vicious circle of poverty for the shifting cultivators.
e) Hydrological regime disruption
The forests in the upstream of a watershed contribute to the regulation of the hydrological regime in the region
Fertility Thick forest Long term Coffee
Swidden rice Barren land
1. pH H2O 5.1 4.9 4.5 4.0
2. Organic matter (%) 8.3 7.2 2.1 1.3
3. N (%) 0.31 0.29 0.11 0.06
4. P2O2 0.21 0.25 0.09 0.03
5. Ca++Mg++ 3.1 3.2 1.0 0.7
6. Ratio of clay at 0-10 cm layer (%) 4.8 48 41 32
Page 12 of 14

as the trees can help to increase the water retention of the soil in raining season and reduce the evaporation in dry season. It has been well established that the forest loss increases the flood peaks and decreases discharges of the streamflow during dry period. According to the assess of people in Dak Phoi, the water flows of Dak Phoi and Dak Lieng rivers have been significantly decreased in comparison with the period before the 1980s. Now they can wade across the streams whenever they want.
Table 4.12 Agricultural losses due to calamity in D ak Lak in recent years
Source: Steering Section for Defense against Calamities, Dak Lak Department of Agriculture and Rural Development, 1999.
The floods and droughts have been increased in recent years in both quantity and intensity. The calamities have been caused a lot of losses in agricultural production (see Table 4.12) as well as in social and individual life and wealth. The total losses caused by floods in 1998 were estimated at 103,193 million Dong for Dak LakProvince and 7,260 million Dong for Lak District. Although not all these hydrological changes are due to deforestation, but it is believed that the loss of forest cover plays an important role.
f) Local farmers' impoverishment
The reduction in forest products by the forest loss and degradation, lower productivity of agricultural production by decrease in soil fertility due to soil erosion and shorten fallow, and increasing frequency and intensity of natural disasters make the life of already poor ethnic minorities more miserable. The prolonged drought in 1997 caused food shortage for more than 90% of the households in T'Long village of Dak Phoi commune and forced more than 25 households of this village to go clearing the secondary protection forests in Chu Yang Sin region for slash-and-burn cultivation (Ksor, 1998a).
In short, the poverty is the first direct motive for shifting cultivation of the M'Nong in Lak district which results in negative impacts on the environment in actual condition. Apart from the downstream effects, the environmental degradation in turn exaggerates the shifting cultivators' miserable and puts them into a vicious circle of poverty as shown in Figure 4.4.
Calamities Due to floods (ha) Due to drought (ha)
Period 1998 1999 (up to May 15th ) 1995-1996 1997-1998
Location Dak Lak Lak Dak Lak Lak Dak Lak Dak Lak Lak
1. Rice:
- Areas affected
- Complete lost areas
1550.3
1154.8
522
274
2330.5
857.0
935
785
-
-
18168
3591
255
41
2. Coffee:
- Areas affected
- Complete lost areas
1771.3
58
-
-
-
-
-
54066
-
47802
11357
79
-
3. Sugar cane 1068.5 - - - - 2244 -
- Cotton 225.0 - - - - - -
- Other cereals 2553.0 142 676.0 40 - 23121 20
Total affected areas 7198.1 722 3006.5 975 54066 91335 354
Page 13 of 14

Figure 4.4 Shifting cultivators' vicious circle of poverty
g) Downstream effects
The soil erosion and hydrological regime disruption in the upper watershed are going to result in a range of downstream effects for its lowland and coastal region. More frequent and more serious flooding, more rapid siltation of irrigation channels and deposits of gravel (as well as silt) in delta areas have the effects on agricultural productivity and outputs of the lowland farmers, and thus on their standard of living as well. Unfortunately there is no systematic documentation of soil erosion, changes of hydrological regime and downstream damages, that prevent the quantification of the relationship to watershed degradation. Presently, the siltation of the Mekong river is relatively little (757g/m3) (UNDP/FAO, 1992). However, the increasingly vulnerable situation of agricultural production in the upper watershed will cause adverse downstream effects in the future if there is no immediate measures to improve it. The problem is that the silt accumulates en route and, in large watershed, it may be years before the full downstream damage is felt.
h) Loss of biodiversity
Chu Yang Sin Nature Reserve has been classified as one of the world's 211 centers of bird endemism (Deturck, 1997). The shifting cultivation at the fringe of the reserve, hence, threatens the big loss of this invaluable treasure of the country.
4.3 Conclusion
M'Nong community used to have a sustainable shifting cultivation practice that was well organized, ecological sound, and could provide enough food for their subsistence. Due to the social disturbances in the last several decades, their cultivation practice has changed. Permanent cultivation, modern varieties and cash crop species are gradually applied. However, the traditional varieties and cultivation methods with low input application are still dominant even among farmers with fixed cultivation. Shifting cultivation becomes increasingly unsustainable due to the shortening of fallow periods and the loss of traditional conservation methods.
M'Nong people still practice shifting cultivation mainly because of the poverty with persistent food shortage. Shifting cultivation is their way to ensure food supply for the families. The factors that contribute to the farmers' impoverishment are also the causes of shifting cultivation. They include shortage of cultivation land, population pressure due to both inward migration and unawareness of the family planning, poor access to credit and technical knowledge, low education, poor healthcare, and underdeveloped market for farmers' products. Land security is not very influential factor at present. Policy planning and implementation without people's participation, and incoordination between government organization also drive M'Nong residents to continue practicing shifting cultivation. The customs and habits are another reason for shifting cultivation continuation.
The actual unsustainable shifting cultivation in the watershed upper stream creates and has potential for creating a lot of inverse consequences. The environmental effects include forest and land degradation and deforestation, followed by forest product impoverishment, soil erosion, hydrological regime disruption, downstream effects and loss of biodiversity. The environmental degradation drives M'Nong shifting cultivators into a vicious circle of poverty and may deteriorate the social and economical life of downstream people as well. Therefore, effective measures should be taken to fix shifting cultivation.
Go to Next Chapter Back the Table of Contents
Page 14 of 14

CHAPTER 5
COST-BENEFIT ANALYSIS OF AGROFORESTRY SYSTEM VERSUS SHIFTING CULTIVATION
As we have seen in previous chapter, the shifting cultivation in Lower Mekong watershed becomes more and more unsustainable, and the main reason for the continuation of shifting cultivation is the poverty. Another land use practice is required in order not only to improve the farmers' income but also to protect the environment. The agroforestry is an option. However, an agroforestry model that is successful in one region may fail in an another. Therefore, this chapter will verify whether the agroforestry is profitable for farm households at research site in comparison with shifting cultivation or not by using cost-benefit analysis method.
5.1 Agroforestry models in Lak district, Dak Lak pr ovince
5.1.1 Home garden
The use of home garden can be seen in the flat upland areas of Lak district. The farmers plant value perennial (cashew and coffee) and/or fruit trees (mango, jackfruit, durian, rambutan, etc.) in combination with annual crops and multipurpose forest tree species. The shade-tolerant local pineapple is commonly planted under fruit tree with the purpose of income raising, rational utilization of sunlight and improvement of soil protection and erosion control. Acacia mangium or Cassia siamea are usually planted surrounding garden as live-fences which break the strong wind in dry season and create microclimate for coffee and other fruit trees in the garden (Ksor, 1 998b).
However, home garden is widespread mainly among Kinh people and the farmers apply it in a spontaneous manner. These are not typical models with rational structure of species combination. A systematical home garden model for M'Nong farmers, which is supported by SMRP, has just started in May 1999 in T'Long village, Dak Phoi commune. The total area of the model is 2.4 ha with 14 participated households. The fruit trees in the model include mango, rambutant, longan and avocado. Upland rice and maize will be intercropped in the first 3 years in order to provide foods for farm households. Mungbeans and black beans will be intercropped in the first 5 years as cash crops.
Pineapples are suggested planting under the shade of fruit trees. The live-fences consist of Acacia mangium or Cassia siamea (Ksor, 1 998a).
5.1.2 The 4 ha agroforestry model in Bu Juk village , Dak Phoi commune
The model is supported by the SMRP and started in May 1998 with six households-participants. It is classified as agrosilvicultural system with the mixture of crops and trees. The species applied in the model were selected by the discussion between project officials and local farmers. The selection was made with the consideration of the suitability of species to the former slash-and-burn fields, their intercrop and multipurpose capability, and the availability of seeds and seedlings and of the market for products.
Page 1 of 9

Source: Adapted from Tu Quang Hien, 1998.
Figure 5.1 Design of the agroforestry model in Bu J uk village
The structure of the model is shown in'Figure 5.1. The natural forest species (Dipterocarp trees, Litsea sp., shrubs and bamboo) are preserved on top of the hill that form a mini-forest with hydrological functions. Acacia mangium, and following it, Litsea sp. are planted next to the natural forest. The bark of Litsea sp. is easy to sell and can give high economic effectiveness. Acacia timber may be used for house fixing or sold to processing factory in Buon Ma Thuot. The remaining area is for fruit tree plantation.
For the purpose of food security, upland rice is intercropped with Litsea sp. and upper part of fruit tree area for the first 3 years. Mungbean (the first crop) and black beans (the second crop) are intercropped with fruit trees at the foot of the hill where soil is fertile and moist for the first 5 years. These cash crops can generate high income as well as improve soil fertility. Shade-tolerant pineapple planted under the forest trees can give harvest after a year and increase the ability of soil conservation. The legume contour hedgerows (Cassia siamea) are established in fruit tree area for soil erosion prevention and green manure supply. In addition, the branches of Cassia siamea as well as Litsea sp. and Acacia mangium can be used as fuel woods (Tu Quang Hien, 1998; Ksor, 1998c).
5.2 Cost-benefit analysis of agroforestry system ve rsus shifting cultivation
5.2.1 Selection of models for analysts
The 4 ha model in Bu Juk village is chosen since it is the only agroforestry model applied in the region that is appropriate for the shifting cultivation fields. Furthermore, this model can be expanded to the hills surrounding villages, where local residents plant upland rice or practice shifting cultivation and where Acrisols soil is not suitable for coffee plantation.
For the analysis of shifting cultivation, the monoculture of traditional upland rice is selected because it is the most valuable and the most popular species in this cultivation practice.
5.2.2 The differences between the design and actua/ implementation of the agroforestry model, and the selection of data used
The main differences between the expected and actual figures in the first implementation year of the model include:
Page 2 of 9

� The area of forest clearance for plantation: In the model design, the area is 4 ha including the natural forest area left. However, it actually do not include the latter, i.e. total plantation area is 4 ha.
� The areas or number of trees planted for each species. � The yields of the annual crops: The differences between the expected and actual yields of upland rice,
mungbean and black bean as well as their reasons are given in Table 5.1. � The selling prices of annual crops.
Table 5.1 Differences between the expected and actu al yields of annual crops
Hence, the technical data used in the analysis are mainly taken from Tu Quang Hien (1998) and will be corrected for the actual situation as reported in Ksor (1998c). The requirement data that are not available from these sources were obtained from the survey or personal communication with the experts in the fields.
5.2.3 Assumptions
a) Land
The estate market is underdeveloped in the region, especially for the upland rice cultivation land. Therefore, the price of land is difficult to identify. However, as mentioned in MacDicken (1990), there is no need to value the land if farmers want to change existing land use to an agroforestry land use because it would be canceled out in a "with" and "without" comparison. Thus, for simplicity and with the assumption that the value of land is the same and does not change over time for both cultivation practices, it is neglected from the calculation.
b) Yields
If we take the actual fallow of seven years for shining cultivation, there are 2 ways to compare agroforestry system with shifting cultivation by cost-benefit analysis. Firstly, shifting cultivation is supposed to be cultivated in the first year on the whole plot where agroforestry system is applied. The next 7 years will be the fallow period, i.e. there will be no yield from shifting cultivation on this plot, and the cultivation will come back in the ninth year. Secondly, the whole area of agroforestry implementation is divided into 8 small plots and shifting cultivation is supposed to practice on one of these plots each year by rotation.
Since subsistence shifting cultivators need to cultivate and harvest something each year, the second way of analysis gives a better look on the situation. The yield of upland rice in the agroforestry system, then, is assumed to be lower than the one in shifting cultivation and equals to 700 kg/ha (the yield in the case of 34 fallow years). The reason is that the small plot has different time in fallow, hence, different yields. 700 kg/ha is the approximate average yield for the whole area. For convenience, the analysis is applied for the whole 4 ha with 8 plots of 0.5 ha each for shifting cultivation.
c) Labours
The labours used in farm works in Dak Phoi are mainly family labours. A cultivation practice that requires hired labours is not likely to be accepted by M'Nong in the area. Meanwhile, family labours are not cash expenditure in farmers' perspective. Therefore, all calculations will be carried out for two variants: with and without inclusion of family labour in the production costs. The scenarios with the exclusion of family labour cost seem more meaningful for poor farmers. The opportunity cost of labour used in the case of family labour cost included is 15,000 VND/workday, which is the common price of hired labour in the region.
5.2.4 Time horizon for analysis
Once the forest trees are included in the agroforestry system, its life can be considered infinite. However, the seedlings of fruit trees in the model are grafting, hence, their yields fall off rapidly after 10 years and the area should be cleared and replanted. Accacia mangium is also planned for full exploitation within 10 years since
Yields (kg/ha)
Species Expected Actual Average Reasons for differences
1. Upland rice 700 1,575 Expectation based on shorter fallow period (3-4 years) than the actual one at the plot (7-8 years).
2. Mungbean 1,000 825 Heavy rain during the harvest
3. Black bean 900 578 Late planting
Page 3 of 9
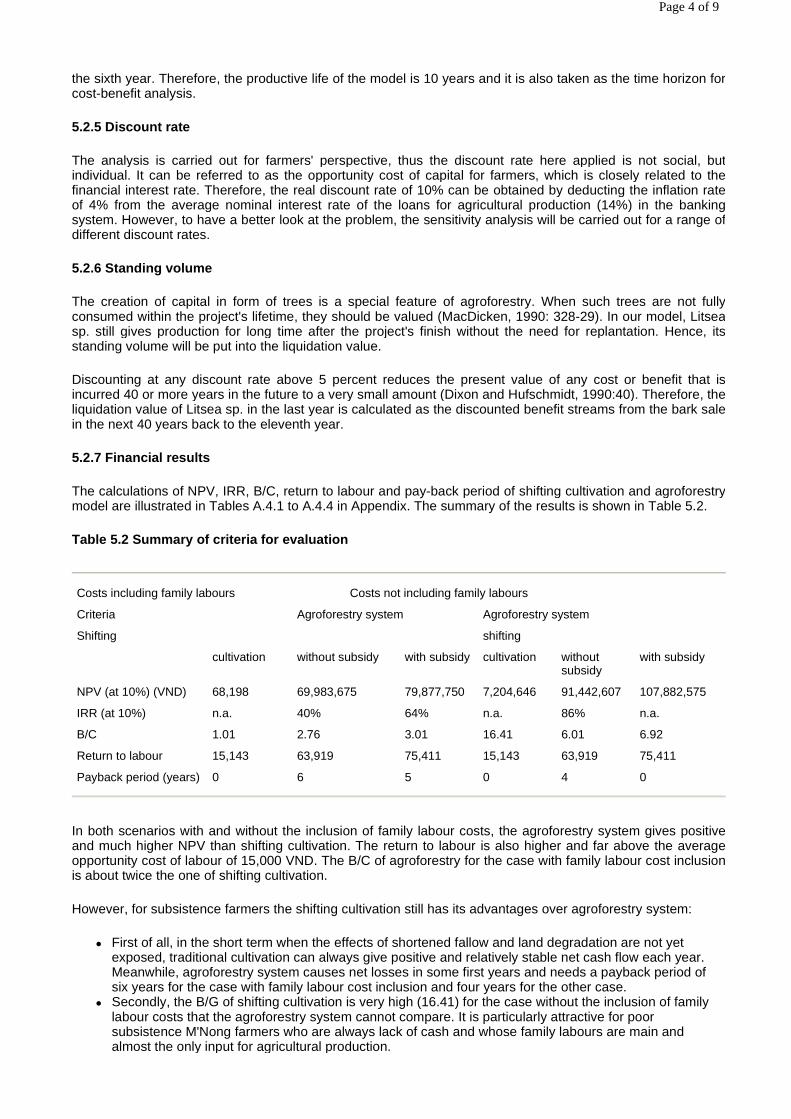
the sixth year. Therefore, the productive life of the model is 10 years and it is also taken as the time horizon for cost-benefit analysis.
5.2.5 Discount rate
The analysis is carried out for farmers' perspective, thus the discount rate here applied is not social, but individual. It can be referred to as the opportunity cost of capital for farmers, which is closely related to the financial interest rate. Therefore, the real discount rate of 10% can be obtained by deducting the inflation rate of 4% from the average nominal interest rate of the loans for agricultural production (14%) in the banking system. However, to have a better look at the problem, the sensitivity analysis will be carried out for a range of different discount rates.
5.2.6 Standing volume
The creation of capital in form of trees is a special feature of agroforestry. When such trees are not fully consumed within the project's lifetime, they should be valued (MacDicken, 1990: 328-29). In our model, Litsea sp. still gives production for long time after the project's finish without the need for replantation. Hence, its standing volume will be put into the liquidation value.
Discounting at any discount rate above 5 percent reduces the present value of any cost or benefit that is incurred 40 or more years in the future to a very small amount (Dixon and Hufschmidt, 1990:40). Therefore, the liquidation value of Litsea sp. in the last year is calculated as the discounted benefit streams from the bark sale in the next 40 years back to the eleventh year.
5.2.7 Financial results
The calculations of NPV, IRR, B/C, return to labour and pay-back period of shifting cultivation and agroforestry model are illustrated in Tables A.4.1 to A.4.4 in Appendix. The summary of the results is shown in Table 5.2.
Table 5.2 Summary of criteria for evaluation
In both scenarios with and without the inclusion of family labour costs, the agroforestry system gives positive and much higher NPV than shifting cultivation. The return to labour is also higher and far above the average opportunity cost of labour of 15,000 VND. The B/C of agroforestry for the case with family labour cost inclusion is about twice the one of shifting cultivation.
However, for subsistence farmers the shifting cultivation still has its advantages over agroforestry system:
� First of all, in the short term when the effects of shortened fallow and land degradation are not yet exposed, traditional cultivation can always give positive and relatively stable net cash flow each year. Meanwhile, agroforestry system causes net losses in some first years and needs a payback period of six years for the case with family labour cost inclusion and four years for the other case.
� Secondly, the B/G of shifting cultivation is very high (16.41) for the case without the inclusion of family labour costs that the agroforestry system cannot compare. It is particularly attractive for poor subsistence M'Nong farmers who are always lack of cash and whose family labours are main and almost the only input for agricultural production.
Costs including family labours Costs not including family labours
Criteria Agroforestry system Agroforestry system
Shifting shifting
cultivation without subsidy with subsidy cultivation without subsidy
with subsidy
NPV (at 10%) (VND) 68,198 69,983,675 79,877,750 7,204,646 91,442,607 107,882,575
IRR (at 10%) n.a. 40% 64% n.a. 86% n.a.
B/C 1.01 2.76 3.01 16.41 6.01 6.92
Return to labour 15,143 63,919 75,411 15,143 63,919 75,411
Payback period (years) 0 6 5 0 4 0
Page 4 of 9

� Thirdly, the total cash requirement for seeds, seedlings and fertilizers for one ha of agroforestry in the first two years (about three millions VND) is too much for poor farmers without subsidy.
The two scenarios with the subsidy of seeds, seedlings and fertilizers are calculated in Tables A.4.5 and A.4.6 in Appendix. The subsidy clearly makes the agroforestry more attractive, especially for the case without family labour cost inclusion, which gives well higher positive yearly net cash flows than the one of shifting cultivation. However, subsidy is just a transfer from the government to farmers. Therefore, what and to which extend is to subsidy should be under consideration.
5.2.8 Sensitivity analysis
The prices can fluctuate significantly over long time period, especially if overall output increases due to increase in agroforestry system adoption, thus reduce the farmers' benefits. Farmers' benefits are also declined if the opportunity cost of resource use increases. Therefore, sensitivity analysis is conducted for the reduction in the selling prices of perennial crops and increase in discount rate. The yields of annual crops and fruit trees are susceptible to the weather, calamities, pests and diseases. The risks of output losses due to these reasons are considered by a sensitivity analysis of decrease in yields. The analysis is also carried out for the increase in prices of fertilizers, which may also affect the farmers' benefits.
All sensitivity analysis is shown up in Tables 5.3 to 5.6.
The increase in NPK fertilizer price does not seem to affect the profitability of the agroforestry system much. With the double NPK price, the NPV of the system decrease by only about 13 percent.
The system is more sensitive to the change in prices of perennial crops and in yields of annual crops and fruit trees. However, the negative NPV appears only with zero
prices of perennial crops for the case with the inclusion of family labour costs that are not likely to occur. In all other cases, NPVs are always positive and higher than the ones of shifting cultivation.
Table 5.3 Sensitivity analysis of shifting cultivat ion, costs including family labour
Sensitivity to decrease in yields Sensitivity to change in discount rate
Decrease in yields NPV Discount rate NPV
0% 68,198 5% 87,217
1% (8,525) 10% 68,198
2% (85,248) 20% 45,434
3% 161,971) 30% 33,047
4% (238,693) 40% 25,602
5% (315,416) 50% 20,757
6% (392,139) 60% 17,401
7% (468,862) 70% 14,965
8% (545,585) 80% 13,105
9% (622,308) 90% 11,657
10% (699,031) 100% 10,495
Page 5 of 9

Table 5.5 Sensitivity analysis of shifting cultivat ion, costs not including family labours
Table 5.6 Sensitivity analysis of agroforestry syst em, costs not including family labours
Sensitivity to decrease in yields Sensitivity to change in discount rate
Decrease in yields NPV Discount rate NPV
0% 7,204,646 5% 9,213,890
10% 6,437,417 10% 7,204,646
20% 5,670,188 20% 4,799,791
30% 4,902,959 30% 3,491,185
40% 4,135,730 40% 2,704,645
50% 3,368,501 50% 2,192,852
60% 2,601,272 60% 1,838,241
70% 1,834,043 70% 1,580,019
80% 1,066,814 80% 1,384,405
90% 299,585 90% 1,231,442
100% (467,644) 100% 1,108,708
Sensitivily to decrease in selling prices of perennial
products
Sensitivily to decrease in yields of annual crops and
fruit trees
Sensitivily to increase in NPK price
Sensitivily to change in discount rate
Decrease in price
NPV Decrease in yields
NPV Increase in price
NPV Discount rate NPV145,291,794
0% 69,983,675 0% 69,983,675 0% 69,983,675 5% 69,983,675
10% 62,952,398 10% 64,469,411 10% 69,153,039 10% 38,320,342
20% 55,921,121 20% 58,955,147 20% 68,322,403 15% 21,670,999
30% 48,889,844 30% 53,440,883 30% 67,491,767 20% 11,813,867
40% 41,858,567 40% 47,926,619 40% 66,661,131 25% 5,579,396
50% 34,827,290 50% 42,412,354 50% 65,830,495 30% 595
60% 27,796,013 60% 36,898,090 60% 64,999,859 35% 1,475
70% 20,764,735 70% 31,383,826 70% 64,169,223 36% 833,105
80% 13,733,458 80% 25,869,562 80% 63,338,587 37% 238,,559
90% 6,702,181 90% 20,355,297 90% 62,507,951 38% (311,996)
100% (329,096) 100% 14,841,033 100% 61,677,315 40% (1,295,066)
Page 6 of 9

Table 5.6 Sensitivily analysis of agoforestry syste m, costs not including family labours
shifting cultivation is more sensitive to the decrease in yields of annual crops than agroforestry system, especially in the case with family labour cost inclusion. The diversification of planted species contributes to the reduction of the risk of output losses for agroforestry system.
In the relation to discount rate, NPV of agroforestry system is positive and higher than NPV of shifting cultivation with the rate up to 37%. With the family labour cost exclusion, this upper rate is much higher and amounts to 60%. Normally, the discount rate is not likely to go up to this high and hence, agroforestry system is generally more profitable than shifting cultivation.
The benefits that agroforestry system can bring to farmers are still underestimated. The benefits of green manure and fuelwood supply are not included due to lack of technical data. In addition, some tangible benefits that will be discussed below are not included in the calculation yet.
5.3 Unquantifiable costs and benefits
Due to the lack of systematical technical documentation, some costs and benefits of agroforestry system versus shifting cultivation cannot be quantified and included in the cost-benefit analysis. They include the costs and benefits from both farmers' and watershed perspectives.
5.3.1 Farmers' perspective
The intangible costs and benefits from farmers' perspective are mainly environmental effects on farm households' agricultural production.
a) Soil erosion control
The agroforestry system can bring more benefit to farmers over shifting cultivation due to better soil protection. Soil erosion declines with the increase in vegetative cover. In the early year of the agroforestry system, the intercrop of annual crops helps to raise the cover over land. Green hedgerows and pineapples since second year planted along contour lines are very effective protective barriers against soil erosion. Since fifth yea! the canopy of fruit and forest trees will be closed and play critical role in soil conservation. These soil erosion control measures will increase land productivity through maintaining soil depth and quality (Tu Quang Hien, 1998).
Sensitivily to decrease in selling prices of perennial
products
Sensitivily to decrease in yields of annual crops and
fruit trees
Sensitivily to increase in NPK price
Sensitivily to change in discount rate
Decrease in price
NPV Decrease in yields
NPV Increase in price
NPV Discount rate NPV145,291,794
0% 91,442,607 0% 91,442,607 0% 91,442,607 5% 170,423,687
10% 84,411,330 10% 85,928,343 10% 90,611,971 10% 91,442,607
20% 77,380,053 20% 80,414,079 20% 89,781,335 15% 57,039,743
30% 70,384,776 30% 74,899,814 30% 88,950,699 20% 38,248,081
40% 63,317,498 40% 69,385,550 40% 88,120,063 30% 19,184,938
50% 56,286,221 50% 63,871,286 50% 87,289,427 40% 10,271,568
60% 49,254,944 60% 58,357,022 60% 86,458,791 50% 5,579,896
70% 42,223,667 70% 52,842,758 70% 85,628,155 60% 2,918,286
80% 35,192,390 80% 47,328,493 80% 84,797,519 70% 1,326,358
90% 28,161,113 90% 41,814,229 90% 83,966,883 80% 336,400
100% 21,129,836 100% 36,299,965 100% 83,136,247 85% (14,593)
Page 7 of 9

If there is available data on the amount of reduction in soil loss by agroforestry system in comparison with shifting cultivation and on nutrient composition of the soil, the increase in nutrient amount due to this reduction can be calculated. The benefit from soil
protection then can be estimated by the value of equivalent inorganic fertilizer required for obtaining this increase in nutrient. This approach is called replacement cost technique and has been used in Norse and Saigal (1993).
b) Effects on soil fertility
The agroforestry system can improve the soil fertility by the restriction of soil erosion and the presence of the nitrogen fixing species such as mungbean, black bean and Cassia siamea in the model. Hence, they can improve the land productivity and the crop yields.
The estimation of benefits from nitrogen fixation could be made by replacement cost method if rates of nitrogen fixation by species were known. However, these data are not available since there have been few direct measurements of nitrogen fixation by trees due to the shortcomings of nitrogen-fixation measurement methods (Nair, 1990).
c) Water retention
The fruit and forest trees in the agroforestry system play an important role in water conservation. The water retention capability of trees can maintain soil moisture, therefore raise productivity of the land.
5.3.2 Wafershed perspective
Widespread changes in land use practices at the farm level usually have economic effects beyond the farm household. The benefits and costs of the change from shifting cultivation into agroforestry practice in upper watershed to downstream region may include:
� Benefits of reduction in siltation downstream, which help to improve the serving capacity of downstream irrigation systems and thus, the agricultural output in the lowlands.
� Benefits of mitigating flood damage to agriculture and infrastructure downstream. � Costs of intensive fertilizer use in the agroforestry system that may cause the downstream water
pollution. Though fertilizer overuse is not the problem at present since M'Nong farmers do not have the habit of fertIiizer application and much money for fertilizer purchase, it is worth paying attention in long term.
However, these effects will appear only when the agroforestry model is expanded to a large area and their quantification requires reliable technical data that are rarely available.
5.4 Limitations of study and further research
The cost-benefit analysis in this research has some limitations that require further research to surmount.
The analysis is limited in only one agroforestry system. More technical and economic research should be carried out to find other suitable models for the site and compare them with each other in order to provide farmers with more options.
Since the project just started a year ago, the analysis is ex-ante with mainly estimated figures. Therefore, after each year expected input and output figures have to be compared with the-actual ones and the economic indicators have to be revised accordingly. Finally, an ex-post analysis after a production cycle will be needed to check for the real profitability of the system.
� As mentioned above, the analysis can not include some unquantifiable environmental costs and benefits to farmers. More effort is required in order to quantify and put them into the analysis.
� The analysis is refers to the farm households' view, therefore includes only costs and benefits for local farmers. The macroeconomic effects have not yet been analyzed. Further research is needed to study the impacts of the agroforestry system on reduction in shifting cultivation and deforestation, increase in gross domestic product and mitigation of downstream effects, etc.
Page 8 of 9

5.5 Conclusion
The financial analysis shows that in farmers' perspective, agroforestry system is more profitable and less risky than shifting cultivation. Therefore, the former can be an alternative for the latter. However agroforestry system requires higher investment, generates net losses in the first several years, and gives lower B/C in the most meaningful case for poor farmers: the case without the inclusion of family labour cost in production costs. In order to make it more feasible, initial subsidy is necessary.
The costs and benefits of agroforestry system are underestimated since some of them are not quantifiable due to the lack of available technical data. Further research hence is required in order to quantify them and to overcome other limitations of the study.
Go to Next Chapter Back the Table of Contents
Page 9 of 9

CHAPTER 6
CONCLUSIONS AND RECOMMENDATIONS
6.1 Conclusions
Three main conclusions can be drawn from this study. Firstly, the shifting cultivation in the upper part of lower Mekong watershed in Dak Lak Province is increasingly unsustainable and significantly contributes to the deforestation in the area, given present socioeconomic status. Therefore, transition from shining cultivation to permanent agriculture is necessary process.
Secondly, the main cause driving people to practice shifting cultivation is poverty, which is reinforced by population pressure and constraint on agricultural land. Hence, poverty alleviation is prerequisite in the process of transition to fixed cultivation. The other important causes of shifting cultivation include limited access to credit and extension services, low education level, lack of people participation in planning and management processes, inadequate interaction between government organizations in policy implementation and underdeveloped market.
Lastly, agroforestry system is proved more profitable to local farmers in comparison with shifting cultivation, beside its other economic and social benefits. Thus, it can be a potential alternative cultivation practice that helps to enhance poverty reduction and transition to permanent cultivation. However, initial capital and technical supports are needed as the majority of ethnic farmers are poor, and the high initial investments required by unfamiliar to them agroforestry system undermine their decision on system adoption.
6.2 Recommendations
Fixed cultivation, poverty alleviation and environment protection are mingled programmes that must be implemented simultaneously, and agroforestry application is a mean to reach their aims. To better meet the objectives of these programmes, the following principal recommendations are suggested:
.The continuation of government programmes on land allocation, fixed cultivation and sedentarization, hunger eradication and poverty reduction, and five million hectare afforestation should be implemented with the concern of lessons drawn from the field experience in previous stages of programme implementation. The investment should be allocated more to knowledge and technical transfer rather than just concentrated on construction of infrastructure.
� Transition to fixed cultivation is a gradual process, and the stimulation of voluntary abandonment of shifting cultivation by initiatives is preferable to the enforcement.
� The people participatory and self-help approaches should be followed during policy and programme planning and implementation since no programme can function without local goodwill and support. Traditional indigenous knowledge and experiences in resource management should be maximally utilized, and management responsibilities should be assigned to local institutions.
� The emphasis should be on providing people with "rods rather than fishes". That means government should provide means, such as creation of favorable condition, giving initial push, or suggestion of options for sustainable resource management, etc., for people to solve problems by themselves, rather than inkind subsidies.
� The land use planning, land allocation and Land Use Certificate issuance process should be sped up to ensure people's tenure security. The process should be based on participatory approach as well.
� The credit system should be more flexible with simpler forms and procedures for credit application, longer term for repayment and closer monitoring and follow-up. The repayment schedules should be ensured to match the household crop cycle so that repayments are due when money is available.
� The extension services should be improved by strengthening extension system, enhancing extension staff's qualification, recruiting additional officers with priority to persons of local ethnic groups, equipping the staff with working facilities, and expanding the network so that ethnic minorities can get better access to extension service.
� The infrastructure should be improved in order to get better people's access to the market, narrow the disparity between the market and farmgate prices, and improve the people's living condition. The construction of logistic system and processing facilities for forest and agricultural products at the site
Page 1 of 2

should be considered. The school and health care systems should also be strengthened. � The effective coordination in activities between governmental organizations, especially between land
allocation process, credit and extension services, is essential. The reason is that, as stated in United Nations (1996), 'poorer families typically need the help not just with a title, but with extension packages, long-term credit, and sometimes improved infrastructure in the regions where land is available'.
� Since people are both the means and the aims of the development process, human resources development and capacity building are priorities. Special attention should be paid on education since it can help the poor to better manage their production as well as their life. Higher technical perception and awareness of family planning both can be obtained with higher education.
� Since women's education, health and time allocation has a decisive role in fertility, children care and family's nutrient pattern, the gender issues should be drawn more social attention.
� People should be provided with all necessary information so that they can maximize self-help. � The roles of environment and the need for forest and environmental protection should be widely
propagandized and put in the teaching programmes of schools in order to raise people's awareness of environmental protection.
� In order to promote agroforestry adoption, initial subsidy is necessary to create the attractiveness of the system over shifting cultivation. The success of pilot projects is very important for spillover effect. Therefore, the initial investment should be concentrated in few potential pilot projects with periodic review and constant monitoring to ensure the success.
� Technical assistance in fruit and forestry tree plantation, tending and harvesting is essential, as new agroforestry system is still alien to local people. Technologies of tree nursery and graftage should be provided in order to reduce expenditure on seedlings.
� The coordination between research institutes, universities, and other governmental, non-governmental and international institutions, organizations and programmes in further research is necessary in order to provide farmers with more agroforestry options.
Go to Next Chapter Back the Table of Contents
Page 2 of 2
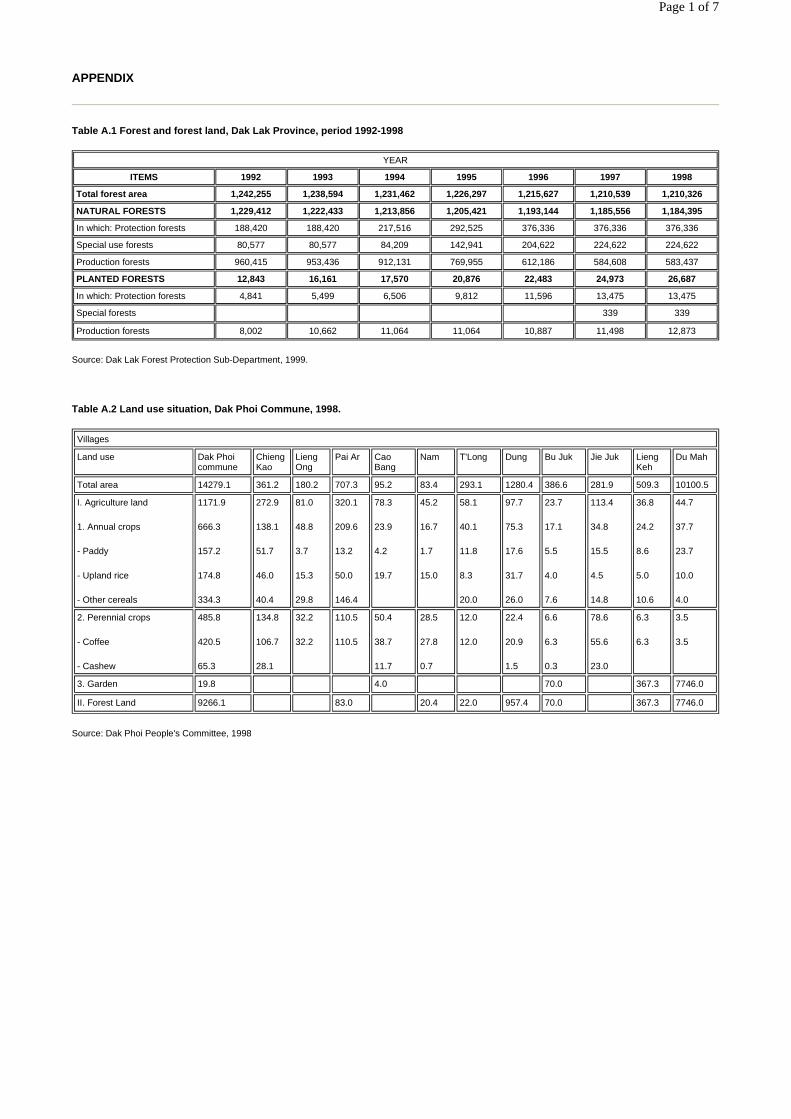
APPENDIX
Table A.1 Forest and forest land, Dak Lak Province, period 1992-1998
Source: Dak Lak Forest Protection Sub-Department, 1999.
Table A.2 Land use situation, Dak Phoi Commune, 1998.
Source: Dak Phoi People's Committee, 1998
YEAR
ITEMS 1992 1993 1994 1995 1996 1997 1998
Total forest area 1,242,255 1,238,594 1,231,462 1,226,297 1,215,627 1,210,539 1,210,326
NATURAL FORESTS 1,229,412 1,222,433 1,213,856 1,205,421 1,193,144 1,185,556 1,184,395
In which: Protection forests 188,420 188,420 217,516 292,525 376,336 376,336 376,336
Special use forests 80,577 80,577 84,209 142,941 204,622 224,622 224,622
Production forests 960,415 953,436 912,131 769,955 612,186 584,608 583,437
PLANTED FORESTS 12,843 16,161 17,570 20,876 22,483 24,973 26,687
In which: Protection forests 4,841 5,499 6,506 9,812 11,596 13,475 13,475
Special forests 339 339
Production forests 8,002 10,662 11,064 11,064 10,887 11,498 12,873
Villages
Land use Dak Phoi commune
Chieng Kao
Lieng Ong
Pai Ar Cao Bang
Nam T'Long Dung Bu Juk Jie Juk Lieng Keh
Du Mah
Total area 14279.1 361.2 180.2 707.3 95.2 83.4 293.1 1280.4 386.6 281.9 509.3 10100.5
I. Agriculture land
1. Annual crops
- Paddy
- Upland rice
- Other cereals
1171.9
666.3
157.2
174.8
334.3
272.9
138.1
51.7
46.0
40.4
81.0
48.8
3.7
15.3
29.8
320.1
209.6
13.2
50.0
146.4
78.3
23.9
4.2
19.7
45.2
16.7
1.7
15.0
58.1
40.1
11.8
8.3
20.0
97.7
75.3
17.6
31.7
26.0
23.7
17.1
5.5
4.0
7.6
113.4
34.8
15.5
4.5
14.8
36.8
24.2
8.6
5.0
10.6
44.7
37.7
23.7
10.0
4.0
2. Perennial crops
- Coffee
- Cashew
485.8
420.5
65.3
134.8
106.7
28.1
32.2
32.2
110.5
110.5
50.4
38.7
11.7
28.5
27.8
0.7
12.0
12.0
22.4
20.9
1.5
6.6
6.3
0.3
78.6
55.6
23.0
6.3
6.3
3.5
3.5
3. Garden 19.8 4.0 70.0 367.3 7746.0
II. Forest Land 9266.1 83.0 20.4 22.0 957.4 70.0 367.3 7746.0
Page 1 of 7

Table A.3 Forest status statistics, Dak Phoi commune, 1998
Unit: ha
Source: Dak Phoi People's Committee, 1998.
Table A.4.1 Financial analysis of shifting cultivation with upland rice monoculture, costs including family labours
Unit: VND
No. Blocks Area Average Forests
Poor forests
Young forests
Coniferous forests
Bamboo forests
Wood & bamboo mixed forests
Planted forests
Bared lands
Agricultural lands
Other lands
1 1445 1023 16.8 39.5 321.7 355.3 161.0 128.7
2 1444 1399 621.4 284.4 267.0 132.0 66.2 28.0
3 1446 948 56.1 402.7 393.7 78.1 17.1
4 1448 1188 21.3 96.0 324.1 430.7 307.4 8.5
5 1457 1410 155.1 604.9 297.5 341.9 10.6
6 1456 904 52.0 6.6 34.1 266.9 417.9 119.7 6.8
7 1458 1003 67 746.8 183.0 6.2
8 1462 1806 96.0 117.0 157.1 160.0 448.9 407.7 415.6 3.7
9 1427 780 35.3 106.7 50.0 480.4 107.3 0.3
10 1441 268 7.5 96.8 96.3 112.9 50.8 0.5
11 1443 734 276.2 83.9 198.1 38.7 40.3
12 1428 1699 20.0 490.3 1017 171.7
13 1447 1096 82.0 554.3 402.4 57.3
Total 14258 303.1 265.2 1093.3 256.0 4433.9 2653.7 231.0 3390.5 1280.0 351.0
Items Year
1 2 3 4 5 6 7 8 9 10 11
Benifits:
Gross output (kg) 787.5 787.5 787.5 787.5 787.5 787.5 787.5 787.5 787.5 787.5 787.5
Price of rice(VND/kg) 1,500 1,500 1,500 1,500 1,500 1,500 1,500 1,500 1,500 1,500 1,500
Total benifits 1,181,250 1,181,250 1,181,250 1,181,250 1,181,250 1,181,250 1,181,250 1,181,250 1,181,250 1,181,250 1,181,250
Costs
Seeds 72,000 72,000 72,000 72,000 72,000 72,000 72,000 72,000 72,000 72,000 72,000
Labours: 1,098,750 1,098,750 1,098,750 1,098,750 1,098,750 1,098,750 1,098,750 1,098,750 1,098,750 1,098,750 1,098,750
� Land clearance
273,750 273,750 273,750 273,750 273,750 273,750 273,750 273,750 273,750 273,750 273,750
� Plantation 300,000 300,000 300,000 300,000 300,000 300,000 300,000 300,000 300,000 300,000 300,000
� Weeding 225,000 225,000 225,000 225,000 225,000 225,000 225,000 225,000 225,000 225,000 225,000
� Harvesting 300,000 300,000 300,000 300,000 300,000 300,000 300,000 300,000 300,000 300,000 300,000
Total costs 1,170,750 1,170,750 1,170,750 1,170,750 1,170,750 1,170,750 1,170,750 1,170,750 1,170,750 1,170,750 1,170,750
Net benifits 10,500 10,500 10,500 10,500 10,500 10,500 10,500 10,500 10,500 10,500 10,500
NPV (at 10%)
B/C (at 10%)
Return to labour
68,198 VND
1.01
15,143 VND/workday
Page 2 of 7

Table A.4.2 Financial analysis of shifting cultivation with upland rice monoculture, costs not including family labours
Unit: VND.
Items Year
1 2 3 4 5 6 7 8 9 10 11
Benifits:
Gross output (kg) 787.5 787.5 787.5 787.5 787.5 787.5 787.5 787.5 787.5 787.5 787.5
Price of rice (VND/kg) 1,500 1,500 1,500 1,500 1,500 1,500 1,500 1,500 1,500 1,500 1,500
Total benifits 1,181,250 1,181,250 1,181,250 1,181,250 1,181,250 1,181,250 1,181,250 1,181,250 1,181,250 1,181,250 1,181,250
Costs:
Seeds 72,000 72,000 72,000 72,000 72,000 72,000 72,000 72,000 72,000 72,000 72,000
Total costs 72,000 72,000 72,000 72,000 72,000 72,000 72,000 72,000 72,000 72,000 72,000
Net benifits 1,109,250 1,109,250 1,109,250 1,109,250 1,109,250 1,109,250 1,109,250 1,109,250 1,109,250 1,109,250 1,109,250
NPV (at 10%) 7,204,646 VND
B/C (at 10%) 16.41
Return to labour 15,143 VND/workday
Page 3 of 7

Table A.4.3 Financial analysis of agroforestry project without subsidy, costs including family labours
Items Year
1 2 3 4 5 6 7 8 9 10 11
Benefits 4,354,900 4,668,365 4,232,875 9,813,585 13,209,585 17,424,200 20,289,200 25,390,000 28,740,000 27,340,000 82,613,420
1. Gross returns:
4,354,900 4,668,365 4,232,875 9,813,585 13,209,585 17,424,200 20,289,200 25,390,000 28,740,000 27,340,000 82,613,420
- From upland rice
3,150,000 2,625,000 2,310,000 - - - - - - - -
- From annual cash crops
1,204,900 2,043,365 1,922,875 2,821,585 4,221,585 3,819,200 3,819,200 3,850,000 2,450,000 1,050,000 -
- From fruit trees
- - - 6,992,000 8,988,000 10,475,000 12,380,000 15,530,000 18,360,000 18,360,000 -
- From forest trees
- - - - - 3,130,000 4,090,000 6,010,000 7,930,000 7,930,000 -
2. Liquidation - - - - - - - - - - 82,613,420
Costs: 18,667,430 7,501,700 7,220,400 3,042,025 3,318,775 2,617,013 3,004,575 3,063,000 3,176,250 3,026,250 -
1. Investment on perennial trees
7,724,980 - - - - - - - - - -
- Fruit trees 5,075,000 - - - - - - - - - -
- Forest trees 1,810,000 - - - - - - - - - -
- Green hedgerows
98,000 - - - - - - - - - -
- Seedling reserves
741,980 - - - - - - - - - -
2. Seeds and seedlings for annual crop
1,028,800 496,000 436,800 104,000 104,000 - - - - - -
- Upland rice 432,000 360,000 316,800 - - - - - - - -
- Annual cash crops
596,800 136,000 120,000 104,000 104,000 - - - - - -
3. Fertilizers: 1,179,500 2,407,000 2,470,500 1,394,000 1,394,000 1,134,000 1,134,000 1,134,000 1,134,000 1,134,000 -
- Manure 836,000 136,000 120,000 104,000 104,000 - - - - - -
- NPK 343,500 2,271,000 2,350,000 1,290,000 1,290,000 1,134,000 1,134,000 1,134,000 1,134,000 1,134,000 -
4. Labours: 8,734,150 4,598,000 4,313,100 1,544,025 1,820,775 1,483,013 1,870,575 1,929,000 2,042,250 1,892,250 -
- Land clearance
2,190,000 - - - - - - - - - -
- Digging 718,500 - - - - - - - - - -
- Plantation 2,485,150 1,653,000 1,673,400 417,000 417,000 - 225,000 - - - -
- Tending and weeding
1,810,500 1,558,500 1,405,500 397,500 397,500 280,500 280,500 280,500 280,500 280,500 -
- Harvesting 1,530,000 1,387,200 1,234,200 729,525 1,006,275 1,202,513 1,365,075 1,648,500 1,761,750 1,611,750 -
Net benifits 14,312,530 2,833,335 2,987,525 96,771,560 9,890,810 14,807,188 17,284,625 22,327,000 25,563,750 24,313,750 82,613,420
Accumulated net benifits
14,312,530 17,145,865 20,133,390 13,361,830 3,471,020 11,336,168 28,620,793 50,947,793 76,511,543 100,825,293 183,438,713
NPV (at 10%) 69,983,675 VND
IRR 40%
B/C (at 10%) 2.76
Return to labour 63,919 VND/workday
Page 4 of 7

Table A.4.4 Financial analysis of agroforestry project without subsidy, costs not including family labours
Items Year
1 2 3 4 5 6 7 8 9 10 11
Benefits: 4,354,900 4,668,365 4,232,875 9,813,585 13,209,585 17,424,200 20,289,200 25,390,000 28,740,000 27,340,000 82,613,420
1. Gross returns: 4,354,900 4,668,365 4,232,875 9,813,585 13,209,585 17,424,200 20,289,200 25,390,000 28,740,000 27,340,000 -
- From upland rice
3,150,000 2,625,000 2,310,000 - - - - - - - -
- From annual cash crops
1,204,900 2,043,365 1,922,875 2,821,585 4,221,585 3,819,200 3,819,200 3,850,000 2,450,000 1,050,000 -
- From fruit trees - - - 6,992,000 8,988,000 10,475,000 12,380,000 15,530,000 18,360,000 18,360,000 -
- From forest trees
- - - - - 3,130,000 4,090,000 6,010,000 7,930,000 7,930,000
2. Liquidation - - - - - - - - - - 82,613,420
Costs: 9,933,280 2,903,000 2,907,300 1,498,000 1,498,000 1,134,000 1,134,000 1,134,000 1,134,000 1,134,000 -
1. Investment on perennial trees
7,724,980 - - - - - - - - - -
- Fruit trees 5,075,000 - - - - - - - - - -
- Forest trees 1,810,000 - - - - - - - - - -
- Green hedgerows
98,000 - - - - - - - - - -
- Seeding reserves
741,980 - - - - - - - - - -
2. Seeds and seedlings for annual crops:
1,028,800 496,000 436,800 104,000 104,000 - - - - - -
- Upland rice 432,000 360,000 316,800 - - - - - - - -
- Annual cash crops
596,800 136,000 120,000 104,000 104,000 - - - - - -
3. Fertilizers: 1,179,500 2,407,000 2,407,500 1,394,000 1,394,000 1,134,000 1,134,000 1,134,000 1,134,000 1,134,000 -
- Manure 836,000 136,000 120,000 104,000 104,000 - - - - - -
- NPK 343,500 2,271,000 2,350,500 1,290,000 1,290,000 1,134,000 1,134,000 1,134,000 1,134,000 1,134,000 -
Net benefits 5,578,380 1,765,365 1,325,575 8,315,585 11,711,585 16,290,200 19,155,200 24,256,000 27,606,000 26,206,000 82,613,420
Accumulated net benefits
5,578,380 3,813,015 2,487,440 5,828,145 17,539,730 33,829,930 52,985,130 77,241,130 104,847,130 131,053,130 213,666,550
NPV (at10%) 91,442,607
IRR 86%
B/C (at 10%) 6.01
Return to labour 63,919 VND/workday
Page 5 of 7

Table A.4.5 Financial analysis of agroforestry project with subsidy, costs including family labours
Year
Items 1 2 3 4 5 6 7 8 9 10 11
Benefits: 13,050,200 7,075,365 4,232,875 9,813,585 13,209,585 17,424,200 20,289,200 25,390,000 28,740,000 27,340,000 82,613,420
1. Gross returns
4,354,900 4,668,365 4,232,875 9,813,585 13,209,585 17,424,200 20,289,200 25,390,000 28,740,000 27,340,000 -
- From upland rice
3,150,000 2,625,000 2,310,000 - - - - - - - -
- From annual cash crops
1,204,900 2,043,365 1,922,875 2,821,585 4,221,585 3,819,200 3,819,200 3,850,000 2,450,000 1,050,000 -
- From fruit trees
- - - 6,992,000 8,988,000 10,475,000 12,380,000 15,530,000 18,360,000 18,360,000 -
- From forest trees
- - - - - 3,130,000 4,090,000 6,010,000 7,930,000 7,930,000 -
2. Subsidy 8,695,300 2,407,000 - - - - - - - - -
- Seeds and seedlings
7,515,800 - - - - - - - - - -
- Fertilizers 1,179,500 2,407,000 - - - - - - - - 82,613,420
3. Liquidation - - - - - - - - - - -
Costs: 18,667,430 7,501,700 7,220,400 3,042,025 3,318,775 2,617,013 3,004,575 3,063,000 3,176,250 3,026,250 -
1. Investment on perennial trees
7,724,980 - - - - - - - - - -
- Fruit trees 5,075,000 - - - - - - - - - -
- Forest trees 1,810,000 - - - - - - - - - -
- Green hedgerows
98,000 - - - - - - - - - -
- Seedling reserves
741,980 - - - - - - - - - -
2. Seeds and seedlings for annual crops:
1,028,800 496,000 436,800 104,000 104,000 - - - - - -
- Upland rice 432,000 360,000 316,800 - - - - - - - -
- Annual cash crops
596,800 136,000 120,000 104,000 104,000 - - - - - -
3. Fertilizers: 1,179,500 2,407,000 2,470,500 1,394,000 1,394,000 1,134,000 1,134,000 1,134,000 1,134,000 1,134,000 -
- Manure 836,000 136,000 120,000 104,000 104,000 - - - - - -
- NPK 343,500 2,271,000 2,350,500 1,290,000 1,290,000 1,134,000 1,134,000 1,134,000 1,134,000 1,134,000 -
4. Labours 8,734,150 4,598,700 4,313,100 1,544,025 1,820,775 1,483,013 1,870,575 1,929,000 2,042,250 1,892,250 -
- Land clearance
2,190,000 - - - - - - - - - -
- Digging 718,500 - - - - - - - - - -
- Plantation 2,485,150 1,653,000 1,673,400 417,000 417,000 - 225,000 - - - -
- Tending and weeding
1,810,500 1,558,500 1,405,500 397,500 397,500 280,500 280,500 280,500 280,500 280,500 -
- Harvesting 1,530,000 1,387,200 1,234,200 729,525 1,006,275 1,202,513 1,365,075 1,648,500 1,761,750 1,611,750 -
Net benifits 5,617,230 426,335 2,987,525 6,771,560 9,890,810 14,807,188 17,284,625 22,327,000 25,563,750 24,313,750 82,613,420
Accumulated net benifits
5,617,230 6,043,565 9,031,090 2,259,530 7,631,280 22,438,468 39,723,093 62,050,093 87,613,843 111,927,593 194,541,013
NPV (at 10%) 79,877,750
IRR 64%
B/C (at 10%) 3.01
Return to labour 75,411 VND/workday
Page 6 of 7

Table A.4.6 Financial analysis of agroforestry project with subsidy, costs not including family labours
Year
Items 1 2 3 4 5 6 7 8 9 10 11
Benefits: 13,050,200 7,156,965 6,775,375 11,269,985 14,665,985 18,558,200 21,423,200 26,524,000 29,874,000 28,474,000 82,613,420
1. Gross returns:
4,354,900 4,668,365 4,232,875 9,813,585 13,209,585 17,424,200 20,289,200 25,390,000 28,740,000 27,340,000 -
- From upland rice
3,150,000 2,625,000 2,310,000 - - - - - - - -
- From annual cash crops
1,204,900 2,043,365 1,922,875 2,821,585 4,221,585 3,819,200 3,819,200 3,850,000 2,450,000 1,050,000 -
- From fruit trees
- - - 6,992,000 8,988,000 10,475,000 12,380,000 15,530,000 18,360,000 18,360,000 -
- From forest trees
- - - - - 3,130,000 4,090,000 6,010,000 7,930,000 7,930,000 -
2. Subsidy 8,695,300 2,488,600 2,542,500 1,456,400 1,456,400 1,134,000 1,134,000 1,134,000 1,134,000 1,134,000 -
- Seeds and seedlings
7,515,800 81,600 72,000 62,400 62,400 - - - - - -
- Fertilizers 1,179,500 2,407,000 2,470,500 1,394,000 1,394,000 1,134,000 1,134,000 1,134,000 1,134,000 1,134,000 -
3. Liquidation - - - - - - - - - - 82,613,420
Costs: 9,933,280 2,903,000 2,907,300 1,498,000 1,498,000 1,134,000 1,134,000 1,134,000 1,134,000 1,134,000 -
1. Investment on perennial trees
7,724,980 - - - - - - - - - -
- Fruit trees 5,075,000 - - - - - - - - - -
- Forest trees 1,810,000 - - - - - - - - - -
- Green hedgerows
98,000 - - - - - - - - - -
- Seeding reserves
741,980 - - - - - - - - - -
2. Seeds and seedlings for annual crops:
1,028,800 496,000 436,800 104,000 104,000 - - - - - -
- Upland rice 432,000 360,000 318,800 - - - - - - - -
- Annual cash crops
596,800 136,000 120,000 104,000 104,000 - - - - - -
3. Fertilizers: 1,179,500 2,407,000 2,470,500 1,394,000 1,394,000 1,134,000 1,134,000 1,134,000 1,134,000 1,134,000 -
- Manure 836,000 136,000 120,000 104,000 104,000 - - - - - -
- NPK 343,500 2,271,000 2,350,500 1,290,000 1,290,000 1,134,000 1,134,000 1,134,000 1,134,000 1,134,000 -
Net benefits 3,116,920 4,253,965 3,868,075 9,771,985 13,167,985 17,424,200 25,390,000 25,390,000 28,740,000 27,340,000 82,613,420
NPV (at10%) 107,882,575 VND
IRR n.a.
B/C (at 10%) 6.92
Return to labour 75,441 VND/workday
Go to Next Chapter Back the Table of Contents
Page 7 of 7

BIBLIOGRAPHY
Angelsen, A. (1995) 'Shifting Cultivation and Deforestation": A Study from Indonesia', World Development vol 23 no 10: 1713-1729.
Bann, C. (1998) The Economic Valuation of Tropical Forest Land Use Options: A Manual for Researchers. Singapore: EEPSEA.
Barraclough, S.L. and K.B. Ghimire (1995) Forests and Livelihoods: The Social Dvnamics of Deforestation in Developing Countries, International Political Series. London and New York: UNRISD.
Bartels, U. (1999) 'The potential contribution of land allocation to the livelihood of farm families: Case study from Dak Phoi Commune, Lak District, Dak Lak Province, Vietnam'. Unpublished study on behalf of SMRP, MRC/GTZ, Dak Lak, Viet Nam.
Bass, S. and E. Morrison (1994) Shifting Cultivation in Thailand, Laos and Viet Nam: Renional Overview and Policy Recommendations, IIED Forestry and Land Use Series No. 2. London, UK: International Institute for Environment and Development.
Be Viet Dang, Chu Thai Son, Vu Thi Hong, Vu Dinh Loi (1982) §¹i c¬ng vÒ c¸c d©n téc £®ª, MN«ng ë §¨k L¾k (The outline of Ede and M'Nong ethnic minorities in Dak Lak, in Vietnamese). Hanoi, Viet Nam: Social Sience Publishing House.
CARE (1994) Review of Farmer Perspectives and Assessment of Smalihoider ForestrY Systems, in relation to World Food Programme Project 4304 on Reforestation in Coastal Viet Nam. Unpublished document prepared for MOF and FAO Project VIE/92/022, CARE International in Viet Nam, Ha Noi.
Central Steering Section on Natural Forest Inventory (1993) KÕt qu¶ kiÓm kª rõng tù nhiªn (Results of Natural Forest Inventory, in Vietnamese). Ha Noi, Viet Nam: CSSNFI.
Chun, K.L. and D.P. Garrity (1998) 'People's Participation in Mountainous Agroforestry Systems in Asia: Toward community-based landscape approaches', paper prepared for International Symposium on Highland Ecosystem Management, Royal Angkhang Agricultural Station, Chiangmai, Thailand, 26-31 May.
Committee on Sustainable Agriculture and Environment in the Humid Tropics (CSAEHT) (1993) Sustainable Agriculture and the Environment in the Humid Tropics. Washington D.C., USA: National Academy Press.
Cook, C.C. and M. Grut (1989) Aqroforestry in Sub-Saharan Africa: A Farmer's Perspective, World Bank Technical Paper no. 112. Washington, D.C., USA: The World Bank.
Coulter, J.K. (1972) 'Soil Management Systems' in Committee on Tropical Soils/ Agricultural Board/ National Research Council Soils of the Humid Tropics, pp. 189197. Washington D.C., USA: National Academy of Sciences.
Current, D., E. Lutz and S.J. Scherr (1995) Costs. Benefits, and Farmer Adoption of -Aqroforestry: Project Experience in Central America and the Caribbean, World Bank Environment Paper no. 14. Washing ton, D.C., USA: The World Bank.
Current, D., E. Lutz and S.J. Scherr (1995) 'The costs and benefits of agroforestry to farmers', The World Bank Research Observer vol 10 no 2: 151-180.
Dak Lak Department for Agriculture and Rural Development (DDARD) (1998) 'B¸o c¸o vÒ ph¸t triÓn n«ng nghiÖp cña tØnh §ak Lak ®Õn n¨m 2000 & 2010' (Report on Dak Lak Agricultural Development up to 2000 & 2010, in Vietnamese), unpublished paper presented at workshop on Land Assessment for Land Use Planning and Sustainable Agricultural Development in Dak Lak Province, Viet Nam, 22-27 November.
Dak Lak Fix Cultivation, Sedentarization and NEZ Sub-Department (DFCS-NEZSD) (1999) 'B¸o c¸o kh¸i qu¸t t×nh h×nh d©n di c tù do ®Õn tØnh §ak Lak thêi kú 1976-1998 vµ quý I/1999' (Report on general situation of spontaneous migration to Dak Lak, period 1976-1998 and the first quarter 1999, in Vietnamese). Unpublished
Page 1 of 6

document, Dak Lak, Viet Nam.
DFCS-NEZSD (1999) 'B¸o c¸o tãm t¾t kÕt qu¶ c«ng t¸c ®Þnh canh ®Þnh c ®ång bµo d©n téc t¹i chç tØnh §ak Lak trong nh÷ng n¨m qua' (Summary report on results of fixed cultivation and sedentarization programme for local ethnic residents of Dak Lak Province in recent years, in Vietnamese). Unpublished document, Dak Lak, Viet Nam.
Dak Lak People's Committee (1996) 'Project for Poverty Alleviation, Dak Lak Province, Period 1996-2000'. Unpublished document, Dak Lak, Viet Nam.
Dak Lak People's Committee (1997) 'Ph¬ng ¸n ph©n bè lao ®éng - d©n di c tØnh §ak Lak (1998-2000-2010)' (Project for labour and residential distribution, Dak Lak Province, period 1998-2000-2010, in Vietnamese), Unpublished document, Dak Lak, Viet Nam.
Dak Lak People's Committee (1999) 'ChØ thÞ sè 13/CTUB ngµy 22/4/1999 cña UBND tØnh §ak Lak vÒ mét sè biÖn ph¸p sö lý vµ kh¾c phôc viÖc chÆt ph¸ rõng tr¸i phÐp ®Ó trång cµ phª, tiªu vµ c©y ng¾n ngµy' (Direction No. 13/CT-UB of Dak Lak People's Committee dated 22 April 1999 on some measures for settlement and mitigation of illegal forest destruction for coffee, pepper and annual crop plantation, in Vietnamese). Unpublished document, Dak Lak, Viet Nam.
Dak Lak Statistical Offfice (1998) Niªn gi¸m thèng kª 1997 (Yearly Statistical Book, 1997, in Vietnamese), Dak Lak, Viet Nam.
Dak Lak Steering Section for Defense against Calamities (1999), 'Statistics on Losses due to Calamities, 1995 to 17 May 1999'. Unpublished data, Dak Lak Department for Agriculture and Rural Development, Dak Lak, Viet Nam.
Dak Phoi People's Committee (1996) 'B¶ng thèng kª tæng hîp di c tù do ®Õn x· §ak Phoi tõ n¨m 1986 ®Õn th¸ng 9/1996' (Summary statistics on spontaneous migration to Dak Phoi Commune from 1986 to September 1996, in Vietnamese), Unpublished document, Dak Lak, Viet Nam.
Dak Phoi People's Committee (1998) 'B¸o c¸o quy ho¹ch sö dông ®Êt ®ai x· §ak Phoi – HuyÖn Lak, thêi kú 1998-2010' (Report on Land Use Master Plan of Dak Phoi Commune, Lak District, period 1998-2010, in Vietnamese), Unpublished document, Dak Lak, Viet Nam.
Depturck, P. (1997) 'Preliminary assessment of present and potential land use system in Dak Phoi Commune, Dak Lak Province'. Unpublished Short-term Mission Report, SMRP, MRC/GTZ, Dak Lak, Viet Nam.
Dixon, J.A. and M.M. Hufschmidt (1990) Economic Valuation Techniques for the Environment: A Case StudY Workbook. Baltimore and London, UK: The Johns Hopkins University Press.
Dixon, J.A., L.F. Scura, R.A. Carpenter, P.B. Sherman (1997) Economic AnalYsis of Environmental Impacts. London, UK: Earthscan Publications Ltd. published in Association with the Asian Development Bank and the World Bank.
Do Dinh Sam (1994) Shifting Cultivation in Viet Nam: Its social, economic and environmental values relative to alternative land use, llED Forestry and Land Use Series No. 3. London, UK: Intemational Institute for Environment and Development.
Do Dinh Sam, Hoang Xuan Ty, Tran Van Con, An Van Bay (1998) 'Shifting cultivation in some provinces of Viet Nam and community collaboration in forest conservation'. Unpublished research following JOFCA's order, Forest Science Institute of Viet Nam, Ha Noi, Viet Nam.
FAO (1984) Chances in Shifting Cultivation in Africa. Rome: FAO, Forestry Department.
FAO (1993) 'Forest Resource Assessment 1990 - Global Synthesis',
http://www.fao.orc accessed on 21 December 1998.
Forest Inventory and Planning Institute (FIPI) (1995) 'B¸o c¸o tæng kÕt ch¬ng tr×nh ®iÒu tra ®¸nh gi¸ vµ theo dâi diÔn biÕn tµi nguyªn rõng toµn quèc giai ®o¹n 1991-1995' (Summing up report, National Programme on Forest Resource Inventory, Assessment and Monitoring, Period 1991 -1995, in Vietnamese). Unpublished document,
Page 2 of 6

Ministry of Agriculture and Rural Development, Ha Noi, Viet Nam.
Fisher R. J., S. Srimongkontip, C. Veer (1997) People and Forests in Asia and the Pacific: Situation and Prospects, FAO Working Paper No: APFSOS/WP/27. Rome:
Forestry Policy and Planning Division, Bangkok: Regional Office for Asia and the Pacific.
Gammelgaard, J. (1990) 'Ethnic Minority in Vietnam'. Unpublished Report on a Mission to Vietnam, 12-14 December 1990, FAO, Ha Noi, Viet Nam.
Gil N. (1985) Watershed development with special reference to soil and water conservation, FAO Soils Bulletin no 44. Rome: FAO.
Gilmour, D. (1998) 'Options and Approaches for Community Participation in the Management of Watershed/Forest Resources in Dak Lak Province'. Unpublished Consultancy Report, SRMP,MRC/GTZ, Dak Lak, Viet Nam.
Goodland, R. (1997) 'Biophysical and Objective Environmental Sustainability' in Dragun A. K. and K.M . Jakobsson (eds) Sustainability and Global Environmental Policy, New Perspectives, pp.63-95.Cheltenham, UK; Lyme, US: Edward Elgar Publishing Limited.
Grandstaff, T. (1978) 'The Development of Swidden Agriculture (Shifting Cultivation)', Development and Change vol 9, no 4: 547-579.
Greenland D. J. and B.N. Okigbo (1985) 'Crop Production under Shifting Cultivation and Maintenance of Soil Fertility' in IRRI Potential Productivity of Field Crops under Different Environments, pp. 505-524. Manila: IRRI.
Gregersen, H., S. Draper, D. Elz (1989) PeonIe and Trees: The Role of Social Forestry in Sustainable Development, EDI Seminar Series. Washington, D.C., USA: The World Bank.
GSO-AFFD (1996) Statistical Data of Agriculture, Forestry and Fishery 1985-1995. Ha Noi, Viet Nam: Statistical Publishing House.
GSO-ISID (1998) Socio-economic Statistical Data of 61 Provinces and Cities in Vietnam, Ha Noi, Viet Nam: Statistical Publishing House.
Gupta, A. (1993) Ecolonv and Development in the Third World. London and New York,: Routledge.
Hediger, W. (1997) 'Towards an Ecological Economics of Sustainable Development', Sustainable Development vol 5 no 3: 101-109.
Humphreys, D. (1996) Forest Politics, The Evolution of International Cooperation. London, UK: Earthscan Publication Ltd.
Hyde, W.F., G.S. Amacher, W. Magrath (1996, 'Deforestation and Forest Land Use: Theory, Evidence, and Policy implications', The World Bank Research Observer vol 11 no 2: 223-248.
Jalal, K.F. (1993) Sustainable Development, Environment and Poverty Nexus, Occasional Papers no. 7. Manila, Philippine: Asian Development Bank, Economic and Development Resource Center.
Kelley, H.W. (1992) Keeping the land alive, Soil erosion - its causes and cures (in Vietnamese), FAO Soil Bulletin no. 50. Ha Noi, Viet Nam: Agricultural Publication.
Koninck, R.D. (1998) 'Deforestation in Viet Nam', http://www.idrc.ca/al/docum, accessed on 1 February 1999.
Kramer, FLA., N. Sharma, and M. Munasinghe (1995) Valuing Tropical Forests, Methodolouv and Case Study of Madagascar, World Bank Environment Paper no. 13, Washington D.C, USA: The World Bank.
Ksor, Y.W. (1998a) 'Phèi hîp x©y dùng c¸c m« h×nh vên nhµ ë bu«n T'Long, x· §ak Phoi, huyÖn Lak' (Coordination in construction of homegarden model in T'Long village, Dak Phoi Commune, Lak District, in Vietnamese). Unpublished document of SRMP, MRC/GTZ, Dak Lak, Viet Nam.
Page 3 of 6

Ksor, Y.W. (1998b) 'Base-line study on existing agroforestry systems in Lak district'. Unpublished document of SRMP, MRC/GTZ, Dak Lak, Viet Nam.
Ksor, Y.W. (1998c) 'Report on Agro-Forestry Program Implemented in Bu Juk Hamlet, Dak Phoi Commune, Lak District, Dak Lak Province'. Unpublished report of SRMP, DARD/MRC/GTZ, Dak Lak, Viet Nam.
Lak Statistical Office (1998) Niªn gi¸m thèng kª n¨m 1997 (Yearly statistical book 1997, in Vietnamese). Lak district, Dak Lak, Viet Nam.
Le Trong Cuc, Tran Duc Vien (1995) Farming System Adjustment to Natural Resources Degradation in the Mountainous Areas of Vietnam. Ha Noi, Viet Nam: Center for Natural Resources and Environmental Studies, Hanoi National University/ FAO.
Luu Hung and M. Vorpahl (1997), 'Traditional Natural Resources Management Strategies of the M'Nong in Lak District, Dak Lak Province'. Unpublished document of SRMP, MRC/GTZ, Dak Lak, Viet Nam.
Luu Trong Hieu and Hoang Huu Cal (1997) 'Community-Based Natural Resource Management in Kado Village, Lam Dong Province, Viet Nam',
http:/lwww.idrc.ca/cbnrm/documents/publications/hieucai.htm, accessed on 27 December 1998.
MacDicken, K. G. and N.T. Vergara (1990) Agroforestry: Classification and Management. New York/ Chichester/ Brisbane/ Toronto/ Singapore: John Wiley & Sons.
Ministry of Agriculture and Rural Development (1996) 'Summary Report on Allocation of Labour Force, Implementation of Fixed Cultivation and Sedentarization Programme and Establishment of New Economic Zones in Central Highlands, period 1996-2000-2010'. Unpublished document, MARD, Hanoi, Viet Nam.
Ministry of Forestry (MOF) (1991) 'Viet Nam Forestry Sector Review - Tropical Forestry Action Programme'. Unpublished Main Report, MOF, Hanoi, Viet Nam.
Mittelman, A. (1997) 'Agro-and Community Forestry in Viet Nam: Recommendations for Development Support'. Unpublished document of The Forests and Biodiversity Program, Royal Netherlands Embassy, Ha Noi, Viet Nam.
Munasinghe, M. (1993) 'Environmental Issues and Economic Decisions in Developing Countries', World Development vol21 no44: 1729-1748.
Munasinghe, M. (1995) 'Tropical Forests and Sustainable Development: A Framework for Analysis' in Kramer, R.A., N. Sharma and M. Munasinghe (eds) Valuing Tropical Forests, Methodology and Case Study of Madagascar, World Bank Environment Paper no. 13, pp. 11 -18. Washington D.C, USA: The World Bank.
Munasinghe, M. and J. McNeely (1995) 'Key Concepts and Terminology of Sustainable Development' in Munashinghe, M. and W. Shearer (eds) Defining and Measuring Sustainability: The Bioqeophysical Foundations, on. 19-56. Washington D.C, USA: The United Nations University and The World Bank.
Nair P.K.R. (1990) The Prospects for Aqroforestry in the Tropics, World Bank Technical Paper no. 131. Washington, D.C, USA: The World Bank.
Neef, A. (1998) 'Sustainable agriculture in the uplands of Viet Nam and Thailand
Attitudes, constraints and priorities of ethnic minorities', paper presented at conference on Environmental Change and Vulnerability: Lessons from Viet Nam and the Indochina Region, Ha Noi, Viet Nam, 3-6 April.
Nguyen Minh Ha (1997j 'Determinants of agroforestry system adoption in Binh Phuoc Province - Viet Nam'. Unpublished M.A. dissertation, Vietnam - The Netherlands Project on Development Economics, Ho Chi Minh City, Viet Nam.
Nguyen Tuong Van (1997) Country Report - Viet Nam, FAO Working Paper no: APFSOSNVP/31. Rome: Forestry Policy and Planning Division, Bangkok: Regional Office for Asia and the Pacific.
Page 4 of 6

Ninan K. N. (19903 'Economics of shifting cultivation' in Ramachandran (eds) Environmental issues in agricultural development, pp. 163-176. New Delhi: Concept Publishing Company.
Norse, D. and R. Saigal (1993) 'National Economic Cost of Soil Erosion in Zimbabwe' in Mohan Munasinghe (ed) Environmental Economics and Natural Resource Management in Developing Countries, pp. 229-240. Washington D.C, USA: CIDIE.
Pearce, D., E. Barbier and A. Markandya (1994) Sustainable Development Economics and Environment in The Third World. Londen: Earthscan Publication Limited.
Rao Y. S. (1994) Asia-Pasific Tropical Forestry: Ecological Disaster or Sustainable growth? Bangkok, Thailand: FAO, Regional Office for Asia and the Pacific.
Redclift, M. (1992) Sustainable Development: Exploring the Contradictions. London and New York: Routledge.
Redclift, M. (1995) 'Sustainable Development: Economics and the Environment' in Redclift, M. and C. Sage (1995) Strategies for Sustainable Development, Local Agendas the South. on. 17-34. Chichester, New York, Brisbane, Toronto, Singapore: John Wiley & Sons.
Rudel, T and J. Poper, (1997) 'The Paths to Rain Forest Destruction: Crossnational Patterns of Tropical Deforestation, 1975-90', World Develooment vol 25 no. 1: 5365.
Sage, C. (1995)'Population, Consumption and Sustainable Development' in Redclift, M. and C. Sage (eds) Stratenies for Sustainable Development, Local Agendas for the South, pp. 35-59. Chichester, New York, Brisbane, Toronto, Singapore: John Wiley & Sons.
Serageldin, I. (1993) 'Agriculture and Environmentally Sustainable Development' in Srivastava, J.P. and H. Alderman (eds) Agriculture and Environmental Challennes, pp. 5-16. Washington D.C: The World Bank.
Sharma, N.P. (1992) Managing the World's Forests - Looking for Balance between Conservation and Development. Dubuque, Iowa: Kendall/Hunt Publishing Company.
Snell T. (1998) 'Agroforestry Practices', from Internet, accessed on 8 December 1998.
Sullivan, G.M., S.M. Huke, J.M. Fox (1992) Financial and Economic Analysis of Auroforestrv Systems, Proceeding of a workshop held in Honolulu, Hawaii, USA, July 1991. Paia, Hi: Nitrogen Fixing Tree Association.
Tran Duc Vien (1996) 'Canh t¸c n¬ng rÉy víi vÊn ®Ò m«i trêng vµ ph¸t triÓn n«ng nghiÖp bÒn v÷ng trªn ®Êt dèc' (Shifting cultivation: environmental issues and sustainable agricultural development in slopes) in Agricultural University I (1996) TuyÓn tËp c«ng tr×nh nghiªn cøu khoa häc kü thuËt n«ng nghiÖp 1956-1996(Selection of agricultural scientific and technological researches 1956-1996, in Vietnamese), pp. 87-93. Ha Noi: Agricultural Publishing House.
Tu Quang Hien (1998) 'Final Report on the Joint Development of Agroforestry Models in Bu Juk hamlet, Dak Phoi commune, Lak district, Dak Lak province'. Unpublished Short-term Mission Report of SUMP, MRC/GTZ, Dak Lak, Viet Nam.
Turner, R.K., D. Pearce and 1. Bateman (1994), Environmental Economics, An elementary introduction. New York, London, Toronto, Sydney, Tokyo, Singapore: Harvester Wheatsheaf.
UNDP (1995) Incornoratinn Environmental Considerations into Investment DecisionMakinn in Viet Nam, A Special Report fog the Government of SRV. Hanoi, Viet Nam: UNDP.
UNDP/FAO (1992) 'Viet Nam: Watershed Management and Ethnic Minorities - Main Report', Unpublished Report No: VIE/92/TO3, TSS-1 Technical Support Services at Programme Level. Rome: FAO.
United Nations (1994) Population. Environment and Development, Proceedings of the United Nations Expert Group Meeting on Population, Environment and
Development, United Nations Headquarters, 20-24 January 1992. New York: Department for Economic and
Page 5 of 6

Social Information and Policy Analysis.
United Nations (1996) Catching Up. Capacity Development for Poverty Elimination in Viet Nam. Hanoi, Viet Nam: UNDP/UNICEF.
University of Minnesota (1996) 'Documents of Workshop on Develop a Framework for a Coordinated National Agroforestry Program, 29-30 June 1994, Nebraska City,
Nebraska, http://gis.umn.edu/~hperrv/agrofores.,,t,rv.html, accessed on 8 December 1998.
Vu Biet Linh, Nguyen Ngoc Binh (1995) Agroforestry Systems in Viet Nam. Ha Noi: Agricultural Publishing House.
Warner, K. (1991) Shifting Cultivators - Local Technical Knowledge and Natural Resource Management in Humid Tropics, FTPP Community Forestry Note no. 8. Rome: FAO.
Winpenny J. T. (1993) Value for the Environment: A Guide to Economic Appraisal. London: Overseas Development Institute, HMSO.
Witter, S. (1993) 'Working with Ethnic Minorities in Viet Nam: An Introduction to the Issues'. Unpublished paper, Save the Children Fund, UK.
World Bank (1995) Viet Nam environmental Program and PolicY Priorities for a Socialist Economy in Transition, Report No. 13200-VN, Volume l: Executive Summary and Main Report. Washington D.C.: The World Bank.
World Wide Fund for Nature (WWF) (1998) 'Human Migration and Resource Utilization A research project of the population dynamics in Yokdon National Park and the surrounding region - Dak Lak Province', Draft. Ha Noi: WWF.
Back the Table of Contents
Page 6 of 6

![Shifting Cultivation[Date] Today I will: -Be introduced to the main characteristics of shifting cultivation Higher Rural](https://img.pdfslide.net/doc/110x75/56649cac5503460f9496d359/shifting-cultivationdate-today-i-will-be-introduced-to-the-main-characteristics.jpg)