Embed Size (px)
Citation preview
SURVEY ON EFFETS OF 2015 FLOODING AND
CAUSES AND CONSEQUENCES OF FLOOD WATER
STAGNATION
Sindh Development Studies Centre, University of Sindh
SURVEY ON EFFETS OF 2015 FLOODING AND
CAUSES AND CONSEQUENCES OF FLOOD WATER
STAGNATION
Research Supervisor: Professor Dr Shahab Mughal
Course
Livestock Development
BS (Part 3) Rural Development Studies
University of Sindh
COPYRIGHT
University of Sindh is authorized to distribute, reproduce or translate this academic
research. No part of this research report may be copied or referred to without proper
citations. Any reference must be fully acknowledged.
CERTIFICATE
This is to certify that Mr. Irfan Hussain, Mr. Mukesh Kumar, Mr. Akhtar Hussain, Mr. Taj
Muhammad, Mr. Lal Girdhari, Ms. Shama Shah, Ms. Saba Baloach, Mr. Sanaullah
Junego, Mr. Liquat Ali Mastoi and Mr. Fahad Bughio have carried out necessary research
work during the course Livestock Development in BS (Honors) Rural Development
Studies .Their survey entitled “SURVEY ON EFFECTS OF 2015 FLOOD AND CAUSES
AND CONSEQUENCES OF FLOOD WATER STAGNATION” under the supervision of
Prof. Dr. Shahab Mughal was conducted during Oct 20, 2015 to Nov 03, 2015. The
students were able to complete and defend the research.
SIGNATURE________________________
DIRECTOR SDSC
PROF. DR Ghulam Ali Jhariko
SIGNATURE________________________
RESEARCH SUPERVISOR
PROF. DR. SHAHAB MUGHAL
ACKNOWLEDGEMENT
We would like to express our deepest appreciation to Prof. Dr. Shahab Mughal,
research supervisor, for his kind support and in-depth guidance during the development
of various components of this study.
Special thanks are due to Prof, Dr. Ghulam Ali Jhariko, Chairperson, Sindh
Development Studies Center, and to other teachers of the department who remained
instrumental through their constructive criticism.
We would like to dedicate the research to the students at Sindh Development Studies
Centre.
Note: This study was initiated by the group of students of BS Part 3 Rural Development
Studies as an assignment. Information presented in his paper doesn’t reflect the
viewpoint of the SDSC and Teachers.
Study Group
1. Irfan Hussain Shaikh
2. Mukesh Kumar
3. Lal Girdhari
4. Shama Shah
5. Saba Baloach
6. Akhtar Hussain
7. Taj Muhammad
8. Sanaullah Junego
9. Liquat Ai Mastoi
10. Fahad Bhughio
Acronyms
UOS University of Sindh (Main Campus)
SDSC Sindh Development Studies Center
RDS Rural Development Studies Center
PRA Participatory Rural Appraisal
DRR Disaster Risk Reduction
NDMA National Disaster Management Authority
PDMA Provincial Disaster Management Authority
RBOD Right Bank Outfall Drainage
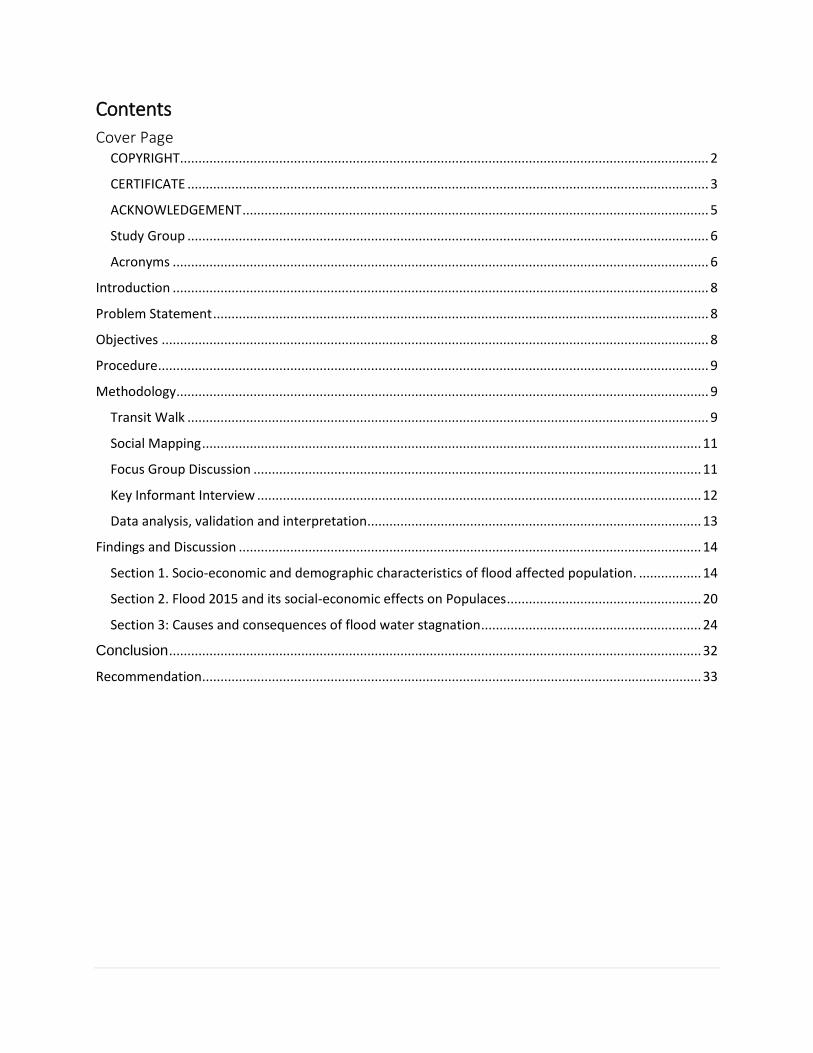
Contents
Cover Page COPYRIGHT ................................................................................................................................................ 2
CERTIFICATE .............................................................................................................................................. 3
ACKNOWLEDGEMENT ............................................................................................................................... 5
Study Group .............................................................................................................................................. 6
Acronyms .................................................................................................................................................. 6
Introduction .................................................................................................................................................. 8
Problem Statement ....................................................................................................................................... 8
Objectives ..................................................................................................................................................... 8
Procedure ...................................................................................................................................................... 9
Methodology ................................................................................................................................................. 9
Transit Walk .............................................................................................................................................. 9
Social Mapping ........................................................................................................................................ 11
Focus Group Discussion .......................................................................................................................... 11
Key Informant Interview ......................................................................................................................... 12
Data analysis, validation and interpretation ........................................................................................... 13
Findings and Discussion .............................................................................................................................. 14
Section 1. Socio-economic and demographic characteristics of flood affected population. ................. 14
Section 2. Flood 2015 and its social-economic effects on Populaces ..................................................... 20
Section 3: Causes and consequences of flood water stagnation ............................................................ 24
Conclusion ................................................................................................................................................. 32
Recommendation ........................................................................................................................................ 33
Introduction
This Survey study was assigned by Prof. Dr. Shahab Mughal Asst. Professor Sindh
Development Studies Center (UOS) University of Sindh (Main Campus) to the students
of BS (Hones). Part 3 Rural Development Studies (RDS) in line with his subject Livestock
Development. In his viewpoint he assigned this task to the students so they may apply
the learned tools and techniques and may in large their knowledge of the field. In this
regards, a group of ten students was formed with the major objective of assessing the
effects of 2015 flash flood, identifying the causes of flood water stagnation in the target
area and obtain suggestion about their solution by applying mix of formal and participatory
rural appraisal (PRA) tools and techniques.
Problem Statement
The settlement are located on right hand side of Jamshoro to Hyderabd Highway near
Toll Plaza. It locates on the ride side of khanpur road. The livelihood of these people is
mainly dependent upon agriculture and livestock. Cropping is done on agricultural
land/plots within the area. They have been living on the river delta for long time and
settlements have spread throughout with increase in population. During flood of 2015, the
villagers suffered significant losses including displacement and destruction of crops,
damage to houses and livelihood. The flood water although receded when water-levels
lowered in the Indus River however it has been witnessed that the flood water is stagnant
on their agricultural land and houses. This stagnant water has post devastating impact on
the socio-economic aspects of villagers. Therefore this survey study aims at (a) assessing
the effects of 2015 flood on the key socio-economic variables, (b) identifying the causes
of stagnation of flood water and (c) infer solutions in light of the viewpoint of flood affected
community. The study also highlights demographic characteristics of people living in the
target area. To achieve these objectives, combination of formal survey and participatory
methodology was designed and implemented.
Objectives
The assignment seeks to:
1. Examine the causes of water stagnation and suggest appropriate solution
2. Analyze the effects of 2015 flood on villagers
3. Assess the socio-economic and demographic characteristics of the people
Procedure
1. Initial observation of the area
2. Identification of focal person FP (orientation session to FP about intervention)
3. Community mobilization with team and FP
4. Social mapping
5. Orientation of intervention to participants (during FGD)
6. Transit walk with community to observe the overall environment
7. Interviews with individual villagers
8. Data analysis
9. Report writing
Methodology
In total, five villages were surveyed namely Haji Muhammad Baladi Shoro, Qasim Shoro,
Khamiso Shoro, Allahwhario Shoro and Waruchawro. These villages are located around
3-4 km away from University of Sindh Jamshoro. The exact population and households
settled on the Indus delta is not known.
For data requirements, as per the objectives, mix of qualitative and quantitative research
approaches were utilized. Participatory rural appraisal tools and techniques including
transit walk, social mapping and focus group discussions, and key informant interviews
collectively are applied to collect the data on key variables. The structured questionnaire
was also administered and analyzed to draw conclusions in light of the objectives of the
study.
Transit Walk
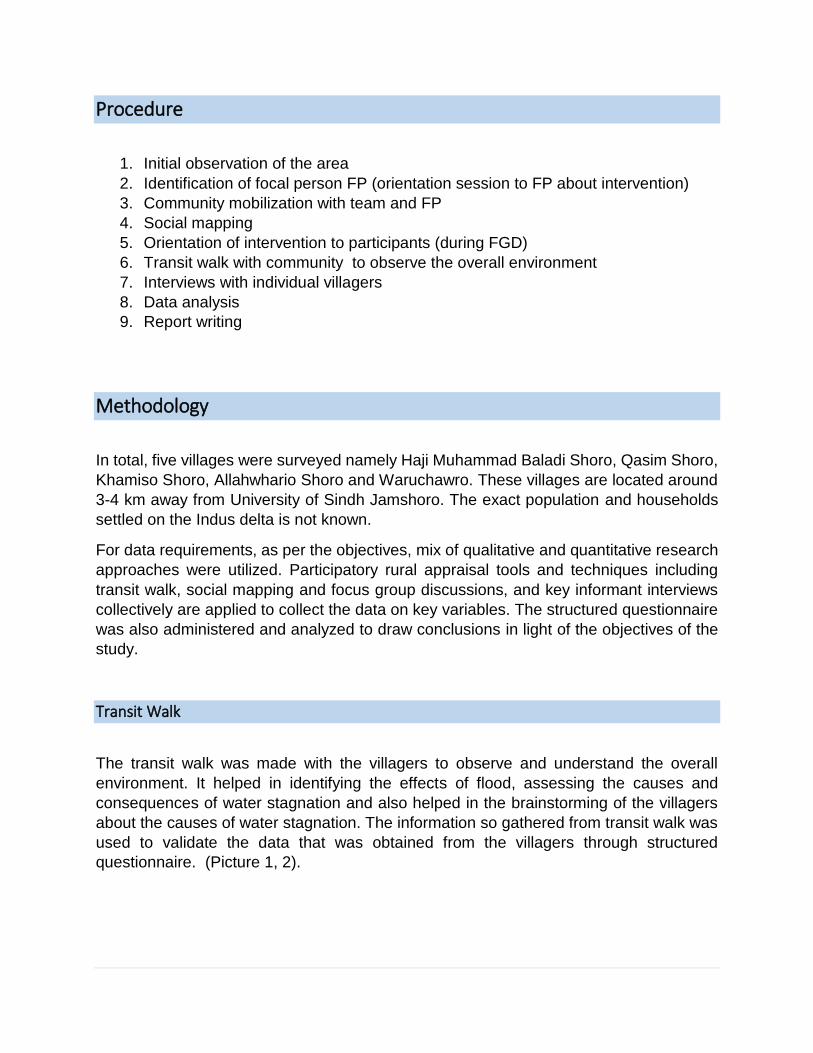
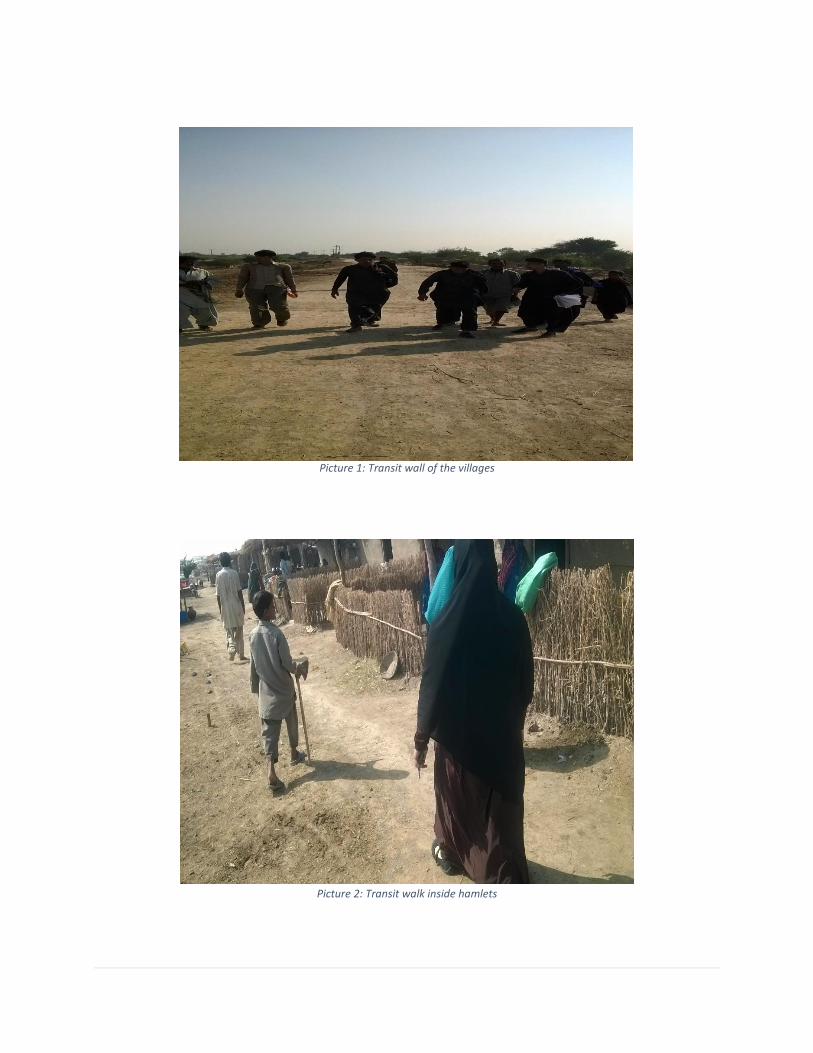
The transit walk was made with the villagers to observe and understand the overall
environment. It helped in identifying the effects of flood, assessing the causes and
consequences of water stagnation and also helped in the brainstorming of the villagers
about the causes of water stagnation. The information so gathered from transit walk was
used to validate the data that was obtained from the villagers through structured
questionnaire. (Picture 1, 2).
Picture 1: Transit wall of the villages
Picture 2: Transit walk inside hamlets
Social Mapping
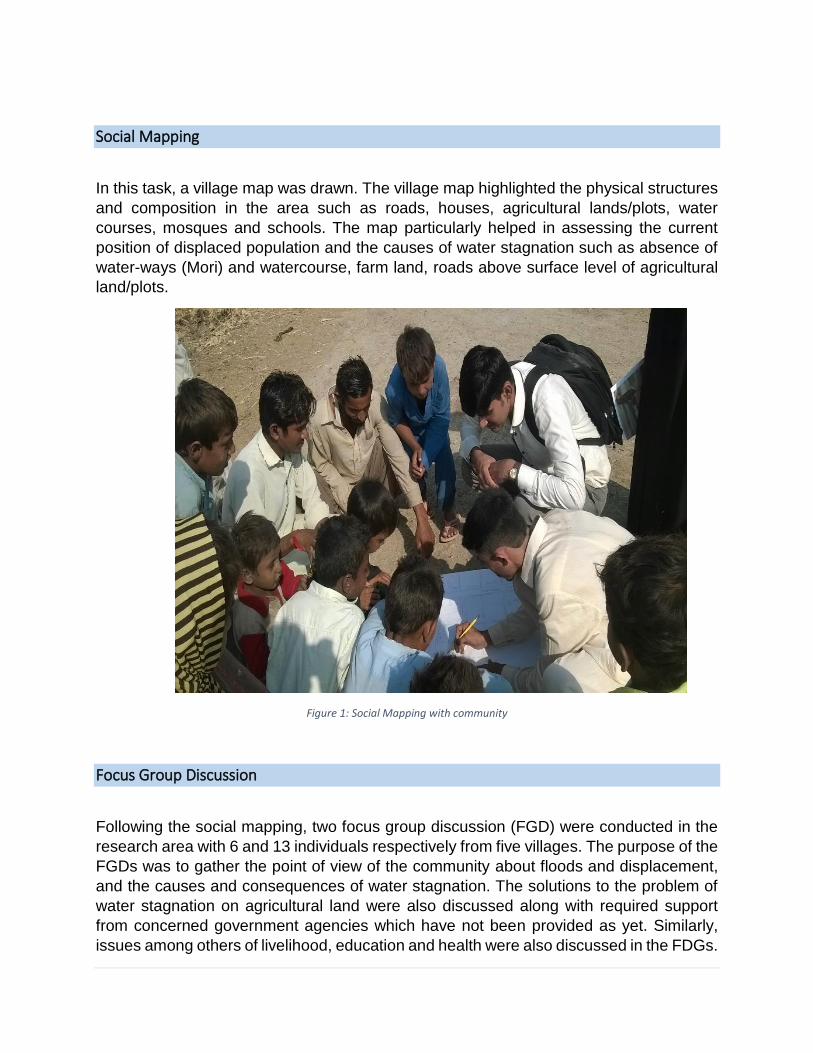
In this task, a village map was drawn. The village map highlighted the physical structures
and composition in the area such as roads, houses, agricultural lands/plots, water
courses, mosques and schools. The map particularly helped in assessing the current
position of displaced population and the causes of water stagnation such as absence of
water-ways (Mori) and watercourse, farm land, roads above surface level of agricultural
land/plots.
Figure 1: Social Mapping with community
Focus Group Discussion
Following the social mapping, two focus group discussion (FGD) were conducted in the
research area with 6 and 13 individuals respectively from five villages. The purpose of the
FGDs was to gather the point of view of the community about floods and displacement,
and the causes and consequences of water stagnation. The solutions to the problem of
water stagnation on agricultural land were also discussed along with required support
from concerned government agencies which have not been provided as yet. Similarly,
issues among others of livelihood, education and health were also discussed in the FDGs.
The responses of the groups were corroborated in light of the prevailing conditions as
observed during transit walk and social mapping.
Figure 2: Focus Group Discussion
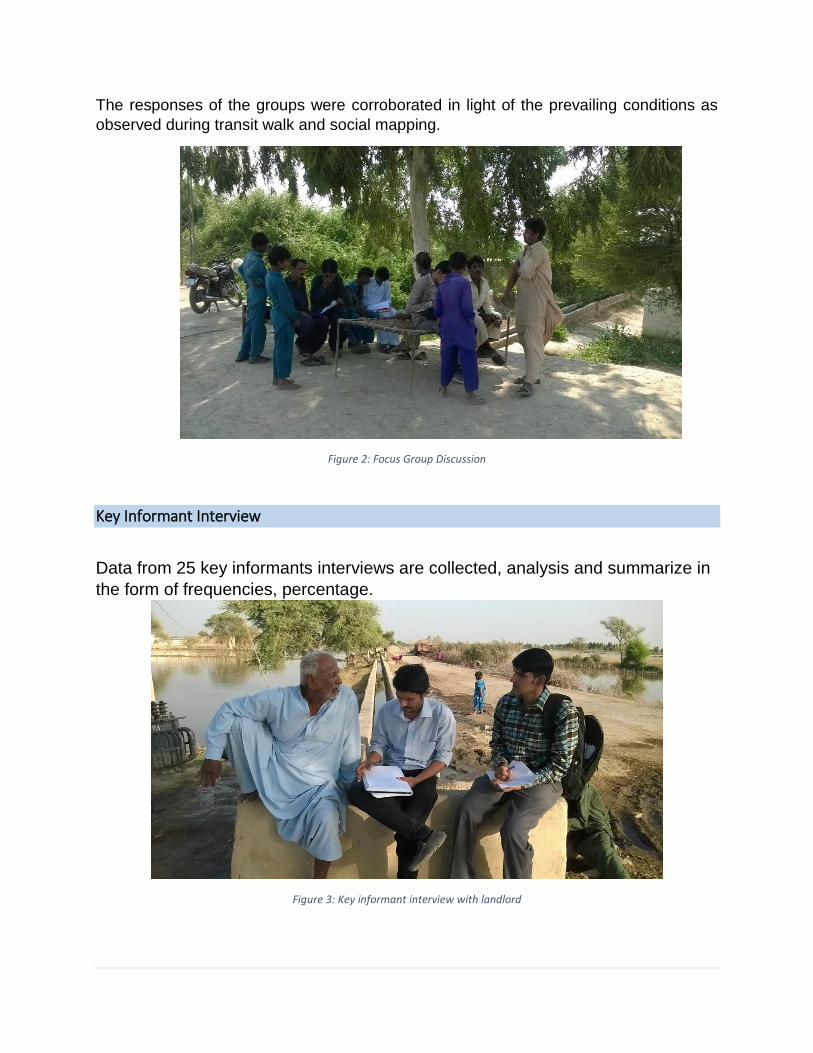
Key Informant Interview
Data from 25 key informants interviews are collected, analysis and summarize in
the form of frequencies, percentage.
Figure 3: Key informant interview with landlord
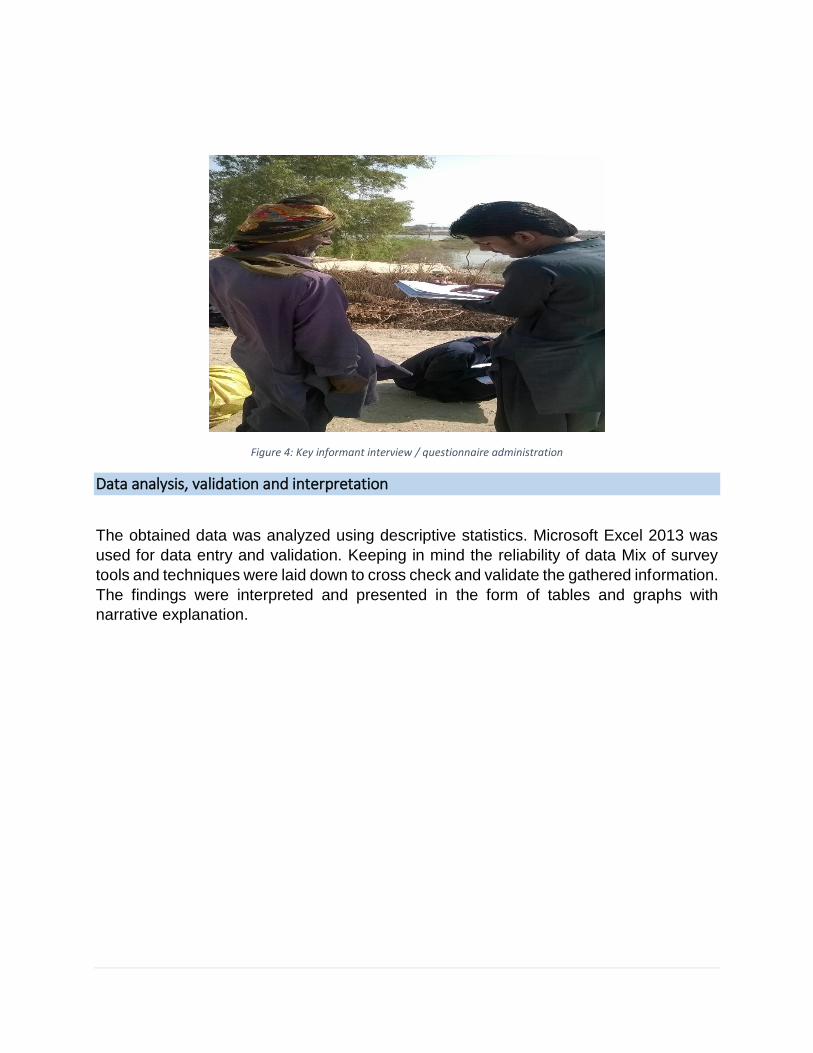
Figure 4: Key informant interview / questionnaire administration
Data analysis, validation and interpretation
The obtained data was analyzed using descriptive statistics. Microsoft Excel 2013 was
used for data entry and validation. Keeping in mind the reliability of data Mix of survey
tools and techniques were laid down to cross check and validate the gathered information.
The findings were interpreted and presented in the form of tables and graphs with
narrative explanation.
Findings and Discussion
Section 1. Socio-economic and demographic characteristics of flood affected population.
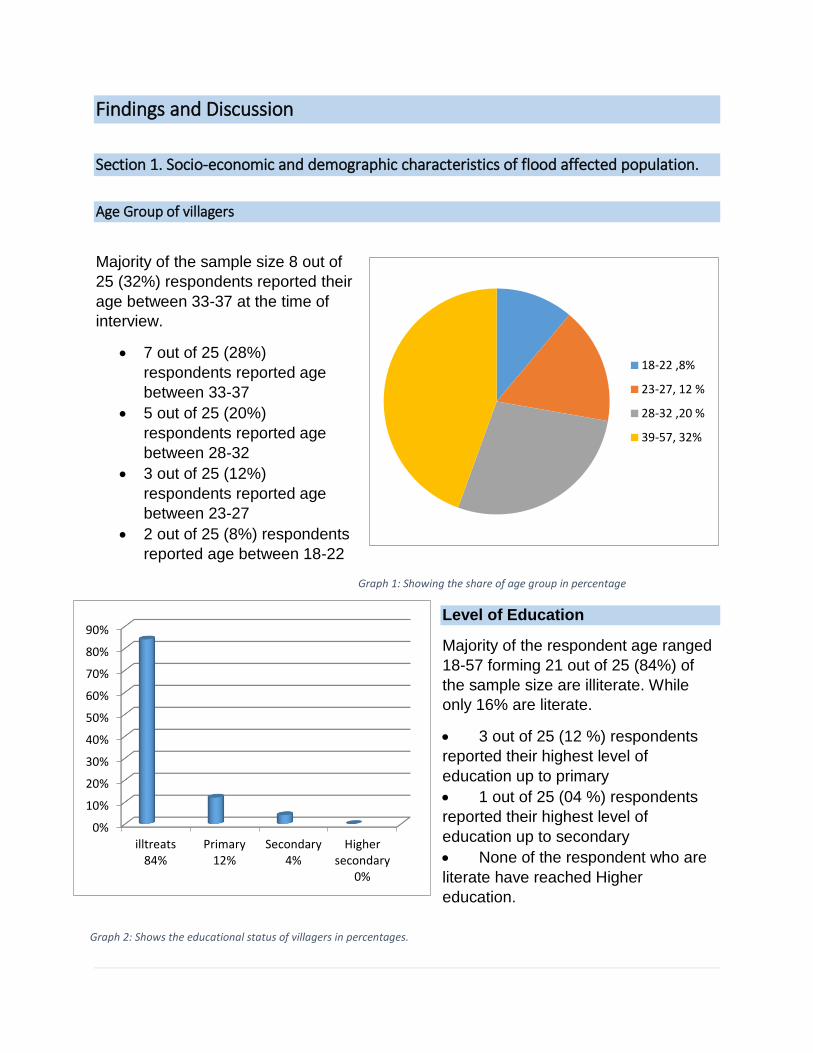
Age Group of villagers
Majority of the sample size 8 out of
25 (32%) respondents reported their
age between 33-37 at the time of
interview.
7 out of 25 (28%)
respondents reported age
between 33-37
5 out of 25 (20%)
respondents reported age
between 28-32
3 out of 25 (12%)
respondents reported age
between 23-27
2 out of 25 (8%) respondents
reported age between 18-22
Level of Education
Majority of the respondent age ranged
18-57 forming 21 out of 25 (84%) of
the sample size are illiterate. While
only 16% are literate.
3 out of 25 (12 %) respondents
reported their highest level of
education up to primary
1 out of 25 (04 %) respondents
reported their highest level of
education up to secondary
None of the respondent who are
literate have reached Higher
education.
18-22 ,8%
23-27, 12 %
28-32 ,20 %
39-57, 32%
Graph 1: Showing the share of age group in percentage
0%
10%
20%
30%
40%
50%
60%
70%
80%
90%
illtreats84%
Primary12%
Secondary4%
Highersecondary
0%
Graph 2: Shows the educational status of villagers in percentages.
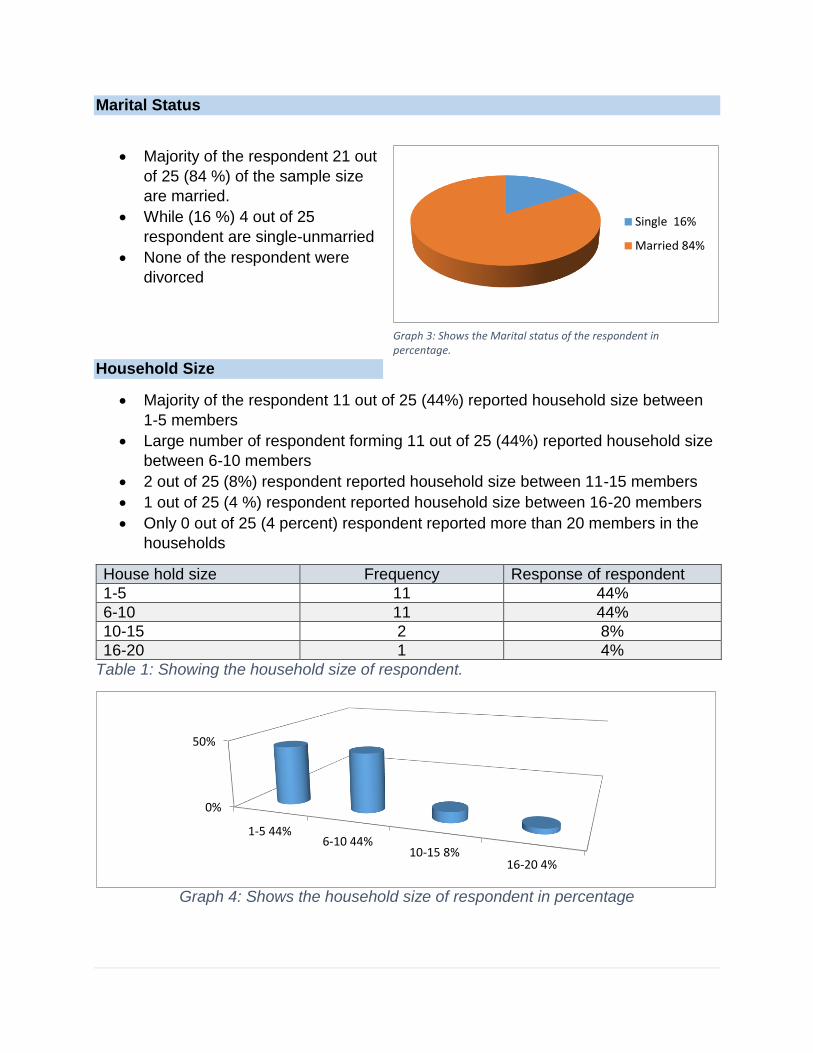
Marital Status
Majority of the respondent 21 out
of 25 (84 %) of the sample size
are married.
While (16 %) 4 out of 25
respondent are single-unmarried
None of the respondent were
divorced
Household Size
Majority of the respondent 11 out of 25 (44%) reported household size between
1-5 members
Large number of respondent forming 11 out of 25 (44%) reported household size
between 6-10 members
2 out of 25 (8%) respondent reported household size between 11-15 members
1 out of 25 (4 %) respondent reported household size between 16-20 members
Only 0 out of 25 (4 percent) respondent reported more than 20 members in the
households
House hold size Frequency Response of respondent
1-5 11 44%
6-10 11 44%
10-15 2 8%
16-20 1 4%
Table 1: Showing the household size of respondent.
Graph 4: Shows the household size of respondent in percentage
0%
50%
1-5 44%6-10 44%
10-15 8%16-20 4%
Single 16%
Married 84%
Graph 3: Shows the Marital status of the respondent in percentage.
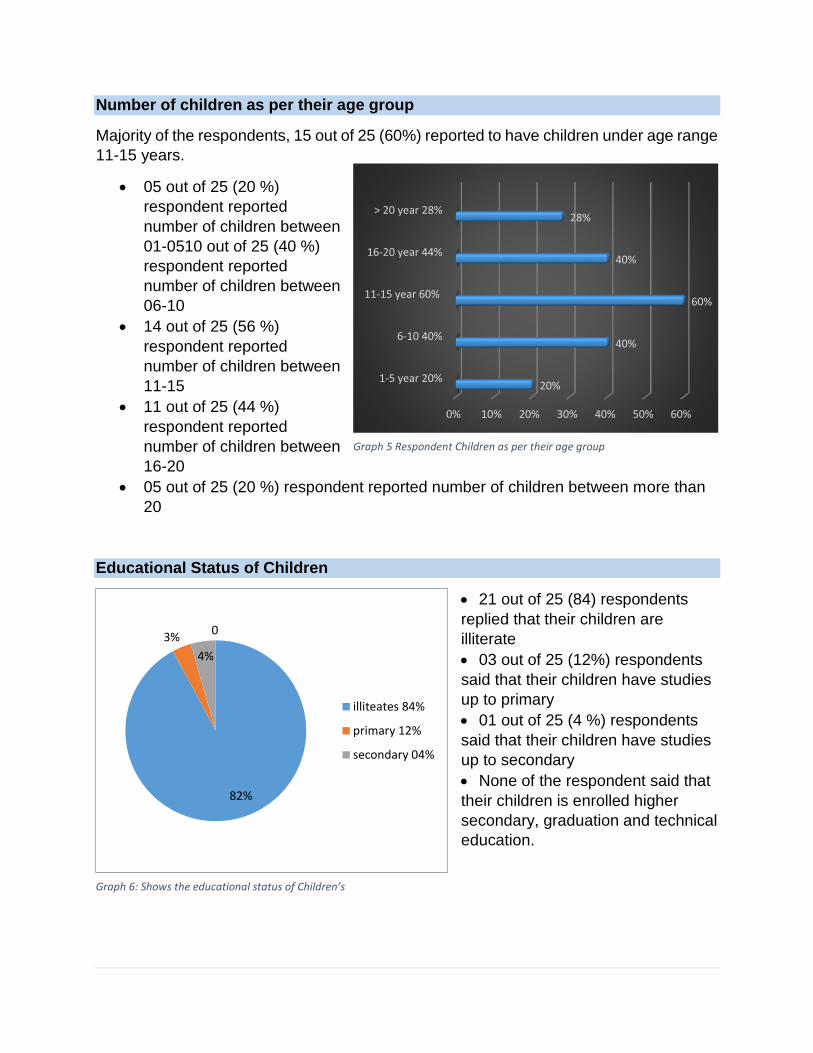
Number of children as per their age group
Majority of the respondents, 15 out of 25 (60%) reported to have children under age range
11-15 years.
05 out of 25 (20 %)
respondent reported
number of children between
01-0510 out of 25 (40 %)
respondent reported
number of children between
06-10
14 out of 25 (56 %)
respondent reported
number of children between
11-15
11 out of 25 (44 %)
respondent reported
number of children between
16-20
05 out of 25 (20 %) respondent reported number of children between more than
20
Educational Status of Children
21 out of 25 (84) respondents
replied that their children are
illiterate
03 out of 25 (12%) respondents
said that their children have studies
up to primary
01 out of 25 (4 %) respondents
said that their children have studies
up to secondary
None of the respondent said that
their children is enrolled higher
secondary, graduation and technical
education.
0% 10% 20% 30% 40% 50% 60%
1-5 year 20%
6-10 40%
11-15 year 60%
16-20 year 44%
> 20 year 28%
20%
40%
60%
40%
28%
Graph 5 Respondent Children as per their age group
82%
3%
4%
0
illiteates 84%
primary 12%
secondary 04%
Graph 6: Shows the educational status of Children’s
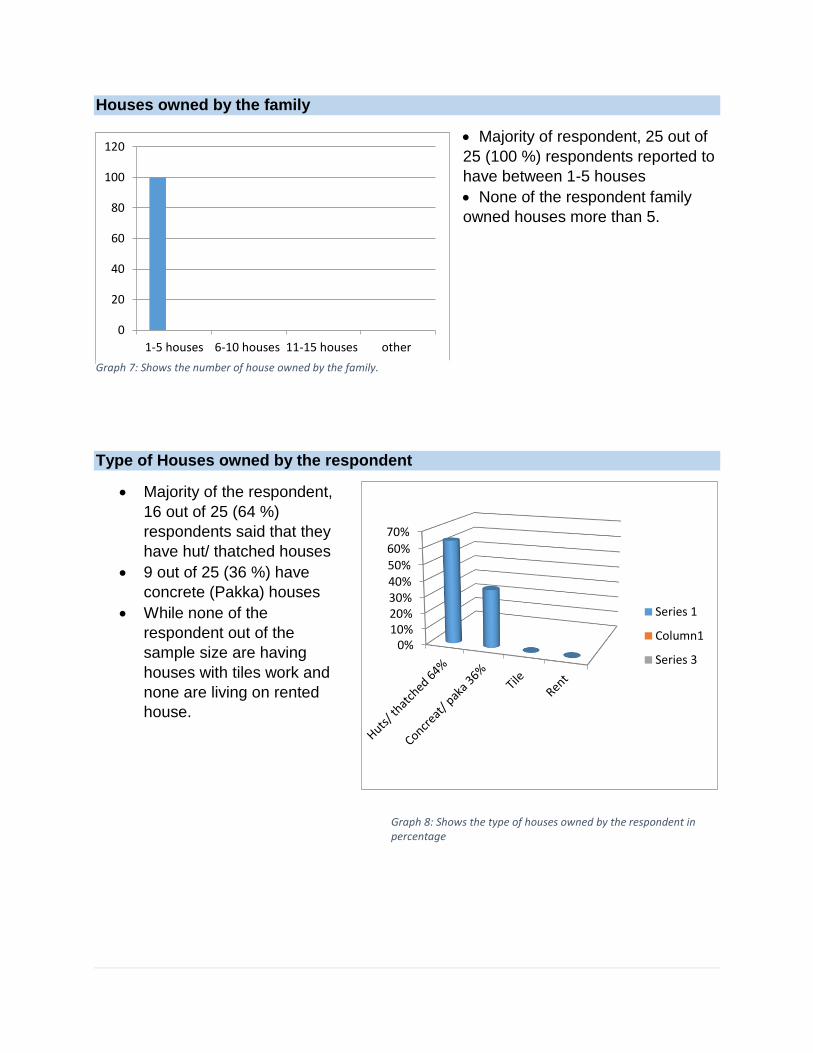
Houses owned by the family
Majority of respondent, 25 out of
25 (100 %) respondents reported to
have between 1-5 houses
None of the respondent family
owned houses more than 5.
Type of Houses owned by the respondent
Majority of the respondent,
16 out of 25 (64 %)
respondents said that they
have hut/ thatched houses
9 out of 25 (36 %) have
concrete (Pakka) houses
While none of the
respondent out of the
sample size are having
houses with tiles work and
none are living on rented
house.
0
20
40
60
80
100
120
1-5 houses 6-10 houses 11-15 houses other
Graph 7: Shows the number of house owned by the family.
0%10%20%30%40%50%60%
70%
Series 1
Column1
Series 3
Graph 8: Shows the type of houses owned by the respondent in percentage
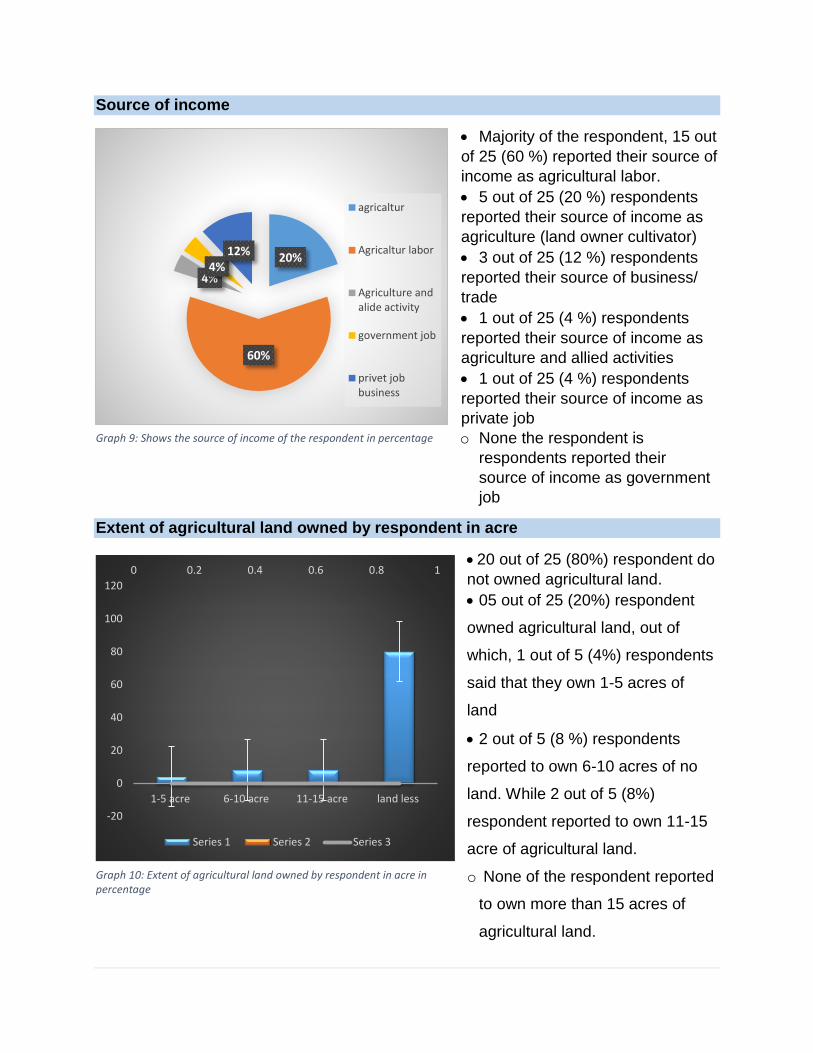
Source of income
Majority of the respondent, 15 out
of 25 (60 %) reported their source of
income as agricultural labor.
5 out of 25 (20 %) respondents
reported their source of income as
agriculture (land owner cultivator)
3 out of 25 (12 %) respondents
reported their source of business/
trade
1 out of 25 (4 %) respondents
reported their source of income as
agriculture and allied activities
1 out of 25 (4 %) respondents
reported their source of income as
private job
o None the respondent is
respondents reported their
source of income as government
job
Extent of agricultural land owned by respondent in acre
20 out of 25 (80%) respondent do
not owned agricultural land.
05 out of 25 (20%) respondent
owned agricultural land, out of
which, 1 out of 5 (4%) respondents
said that they own 1-5 acres of
land
2 out of 5 (8 %) respondents
reported to own 6-10 acres of no
land. While 2 out of 5 (8%)
respondent reported to own 11-15
acre of agricultural land.
o None of the respondent reported
to own more than 15 acres of
agricultural land.
20%
60%
4%4%
12%
agricaltur
Agricaltur labor
Agriculture andalide activity
government job
privet jobbusiness
Graph 9: Shows the source of income of the respondent in percentage
0 0.2 0.4 0.6 0.8 1
-20
0
20
40
60
80
100
120
1-5 acre 6-10 acre 11-15 acre land less
Series 1 Series 2 Series 3
Graph 10: Extent of agricultural land owned by respondent in acre in percentage
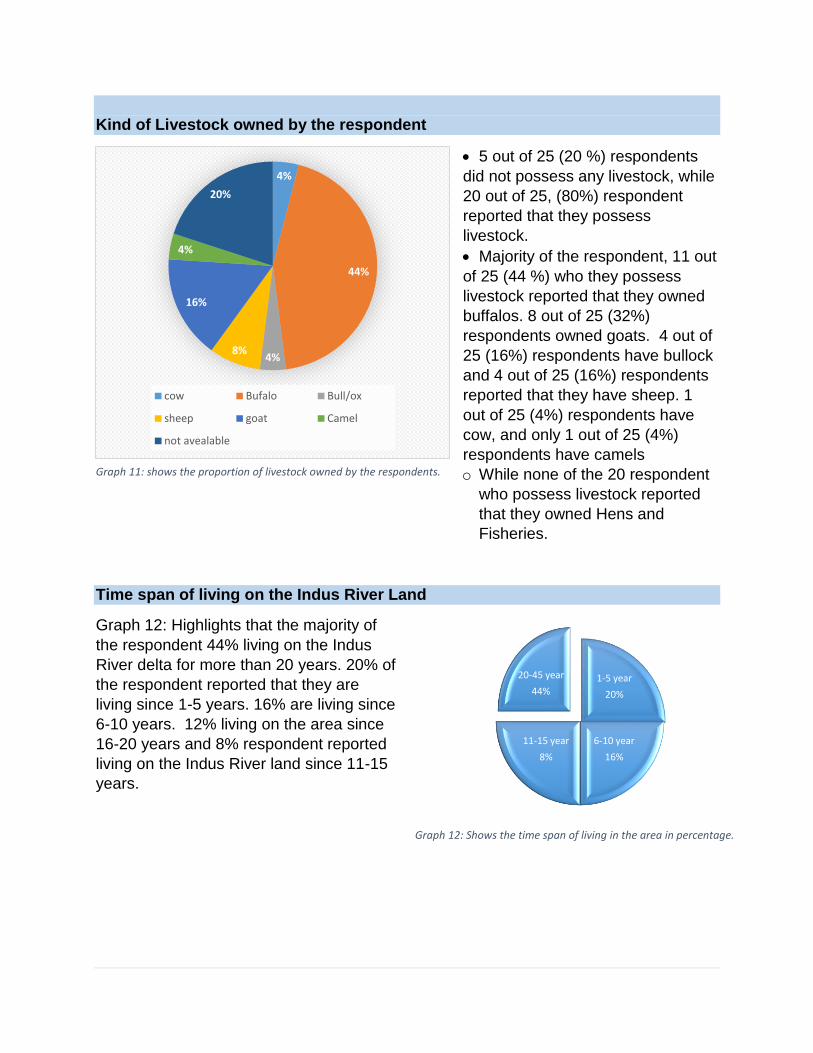
Kind of Livestock owned by the respondent
5 out of 25 (20 %) respondents
did not possess any livestock, while
20 out of 25, (80%) respondent
reported that they possess
livestock.
Majority of the respondent, 11 out
of 25 (44 %) who they possess
livestock reported that they owned
buffalos. 8 out of 25 (32%)
respondents owned goats. 4 out of
25 (16%) respondents have bullock
and 4 out of 25 (16%) respondents
reported that they have sheep. 1
out of 25 (4%) respondents have
cow, and only 1 out of 25 (4%)
respondents have camels
o While none of the 20 respondent
who possess livestock reported
that they owned Hens and
Fisheries.
Time span of living on the Indus River Land
Graph 12: Highlights that the majority of
the respondent 44% living on the Indus
River delta for more than 20 years. 20% of
the respondent reported that they are
living since 1-5 years. 16% are living since
6-10 years. 12% living on the area since
16-20 years and 8% respondent reported
living on the Indus River land since 11-15
years.
4%
44%
4%8%
16%
4%
20%
cow Bufalo Bull/ox
sheep goat Camel
not avealable
1-5 year
20%
6-10 year
16%
11-15 year
8%
20-45 year
44%
Graph 12: Shows the time span of living in the area in percentage.
Graph 11: shows the proportion of livestock owned by the respondents.
Section 2. Flood 2015 and its social-economic effects on Populaces
The villagers have experienced two major floods in last six years including the flood of
2010 and 2015. The flood of 2015 occur in between August to September. The villagers
were unaware of the actual inflow or outflow of flood water. However they said that this
year the volume was between 4.5 to 5.5 thousand cusecs. The flood water came in
August on their lands. As per the villagers water levels gradually increased, if compared
to 2010, the flood of 2015 took much more time to reach to their agricultural land and
houses. The flood water took one month approximately to completely withdraw from the
river Indus.
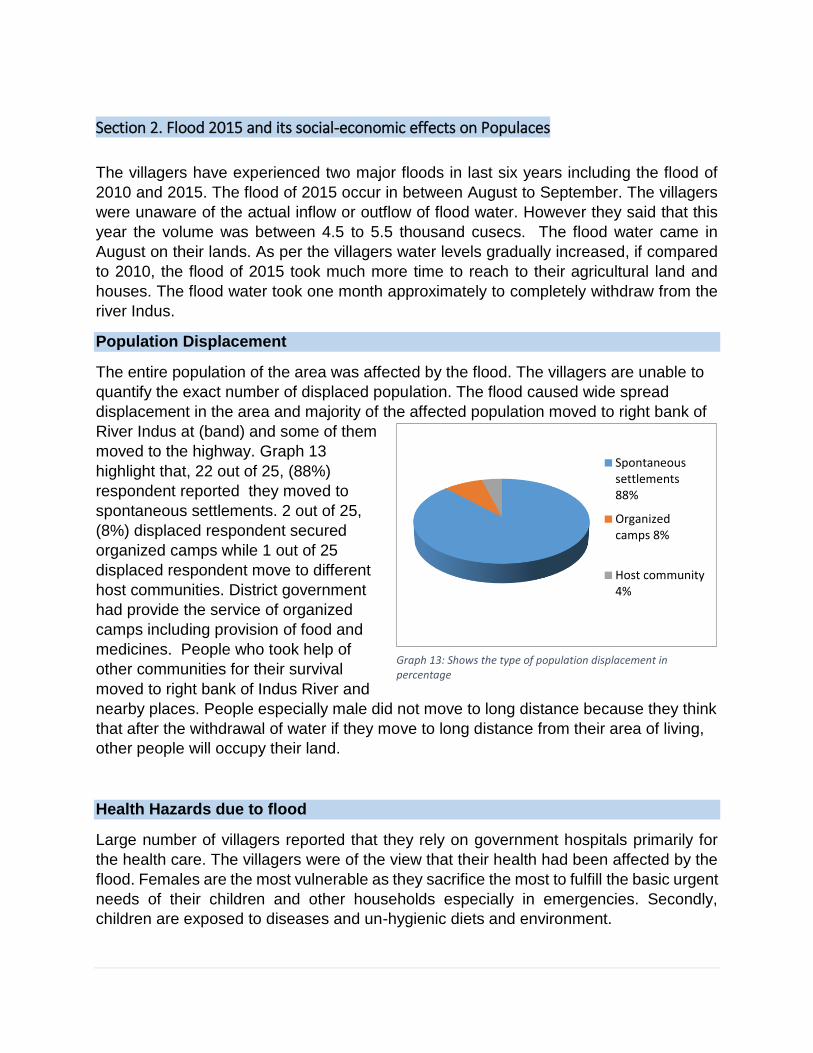
Population Displacement
The entire population of the area was affected by the flood. The villagers are unable to
quantify the exact number of displaced population. The flood caused wide spread
displacement in the area and majority of the affected population moved to right bank of
River Indus at (band) and some of them
moved to the highway. Graph 13
highlight that, 22 out of 25, (88%)
respondent reported they moved to
spontaneous settlements. 2 out of 25,
(8%) displaced respondent secured
organized camps while 1 out of 25
displaced respondent move to different
host communities. District government
had provide the service of organized
camps including provision of food and
medicines. People who took help of
other communities for their survival
moved to right bank of Indus River and
nearby places. People especially male did not move to long distance because they think
that after the withdrawal of water if they move to long distance from their area of living,
other people will occupy their land.
Health Hazards due to flood
Large number of villagers reported that they rely on government hospitals primarily for
the health care. The villagers were of the view that their health had been affected by the
flood. Females are the most vulnerable as they sacrifice the most to fulfill the basic urgent
needs of their children and other households especially in emergencies. Secondly,
children are exposed to diseases and un-hygienic diets and environment.
Spontaneoussettlements88%
Organizedcamps 8%
Host community4%
Graph 13: Shows the type of population displacement in percentage
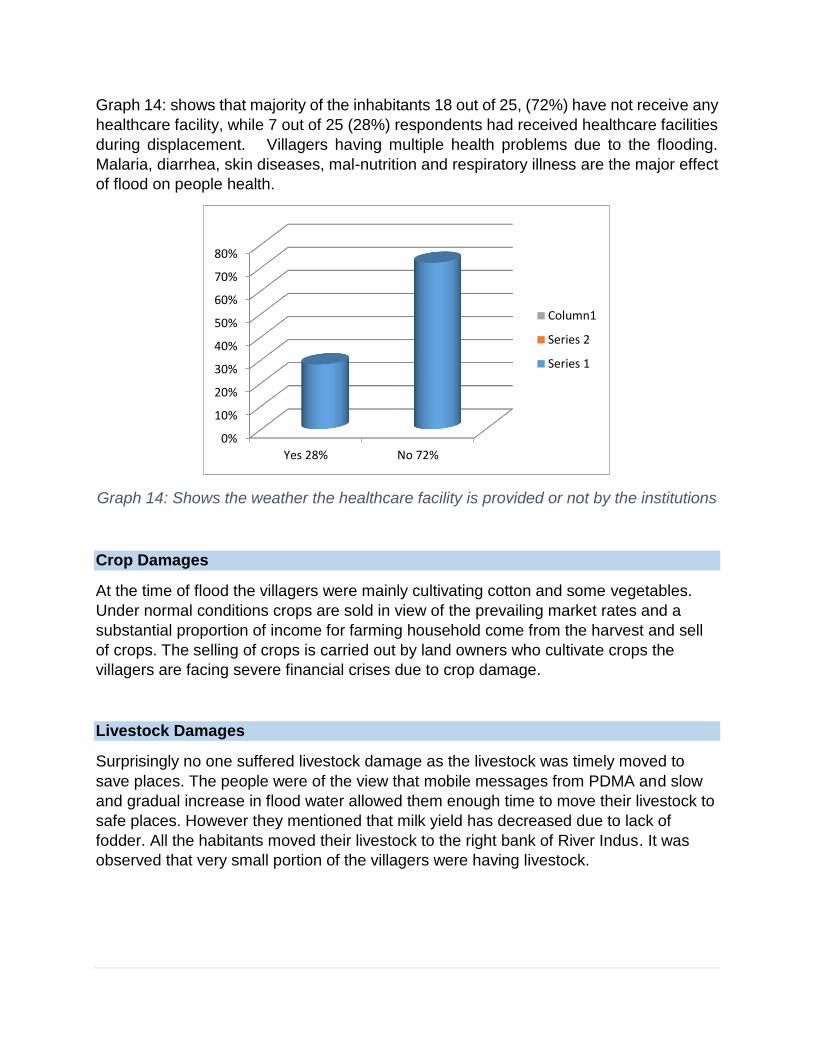
Graph 14: shows that majority of the inhabitants 18 out of 25, (72%) have not receive any
healthcare facility, while 7 out of 25 (28%) respondents had received healthcare facilities
during displacement. Villagers having multiple health problems due to the flooding.
Malaria, diarrhea, skin diseases, mal-nutrition and respiratory illness are the major effect
of flood on people health.
Graph 14: Shows the weather the healthcare facility is provided or not by the institutions
Crop Damages
At the time of flood the villagers were mainly cultivating cotton and some vegetables.
Under normal conditions crops are sold in view of the prevailing market rates and a
substantial proportion of income for farming household come from the harvest and sell
of crops. The selling of crops is carried out by land owners who cultivate crops the
villagers are facing severe financial crises due to crop damage.
Livestock Damages
Surprisingly no one suffered livestock damage as the livestock was timely moved to
save places. The people were of the view that mobile messages from PDMA and slow
and gradual increase in flood water allowed them enough time to move their livestock to
safe places. However they mentioned that milk yield has decreased due to lack of
fodder. All the habitants moved their livestock to the right bank of River Indus. It was
observed that very small portion of the villagers were having livestock.
0%
10%
20%
30%
40%
50%
60%
70%
80%
Yes 28% No 72%
Column1
Series 2
Series 1
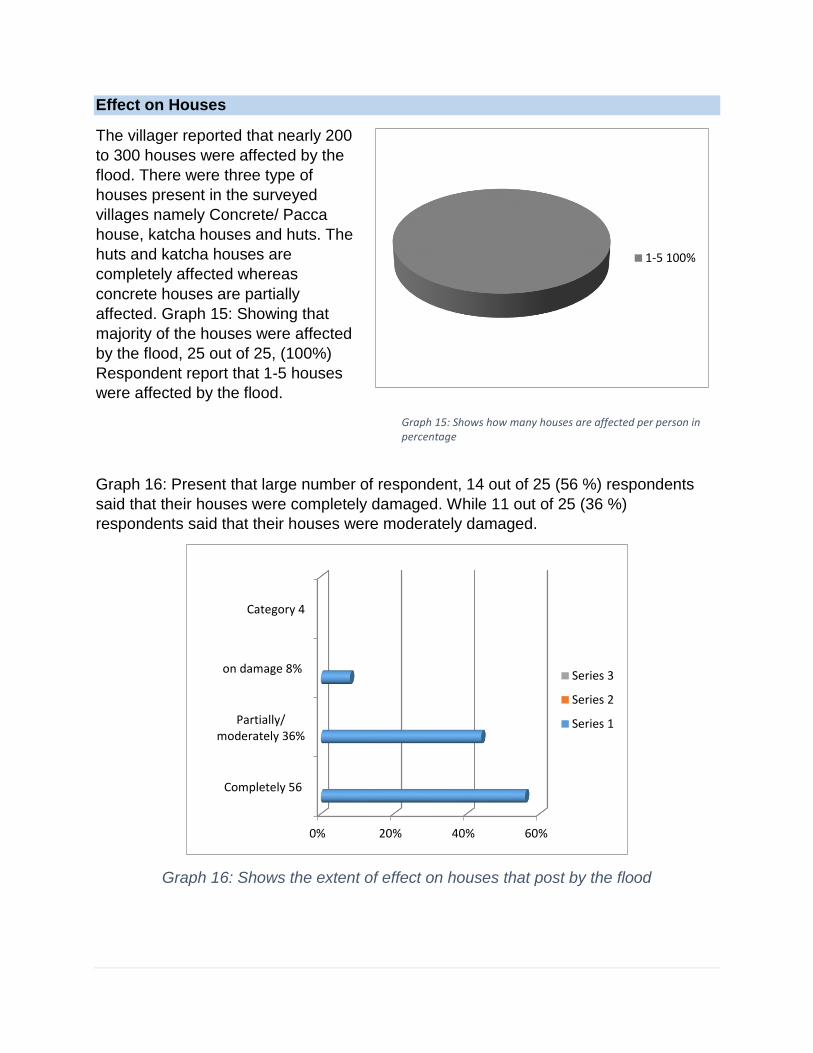
Effect on Houses
The villager reported that nearly 200
to 300 houses were affected by the
flood. There were three type of
houses present in the surveyed
villages namely Concrete/ Pacca
house, katcha houses and huts. The
huts and katcha houses are
completely affected whereas
concrete houses are partially
affected. Graph 15: Showing that
majority of the houses were affected
by the flood, 25 out of 25, (100%)
Respondent report that 1-5 houses
were affected by the flood.
Graph 16: Present that large number of respondent, 14 out of 25 (56 %) respondents
said that their houses were completely damaged. While 11 out of 25 (36 %)
respondents said that their houses were moderately damaged.
Graph 16: Shows the extent of effect on houses that post by the flood
0% 20% 40% 60%
Completely 56
Partially/moderately 36%
on damage 8%
Category 4
Series 3
Series 2
Series 1
1-5 100%
Graph 15: Shows how many houses are affected per person in percentage
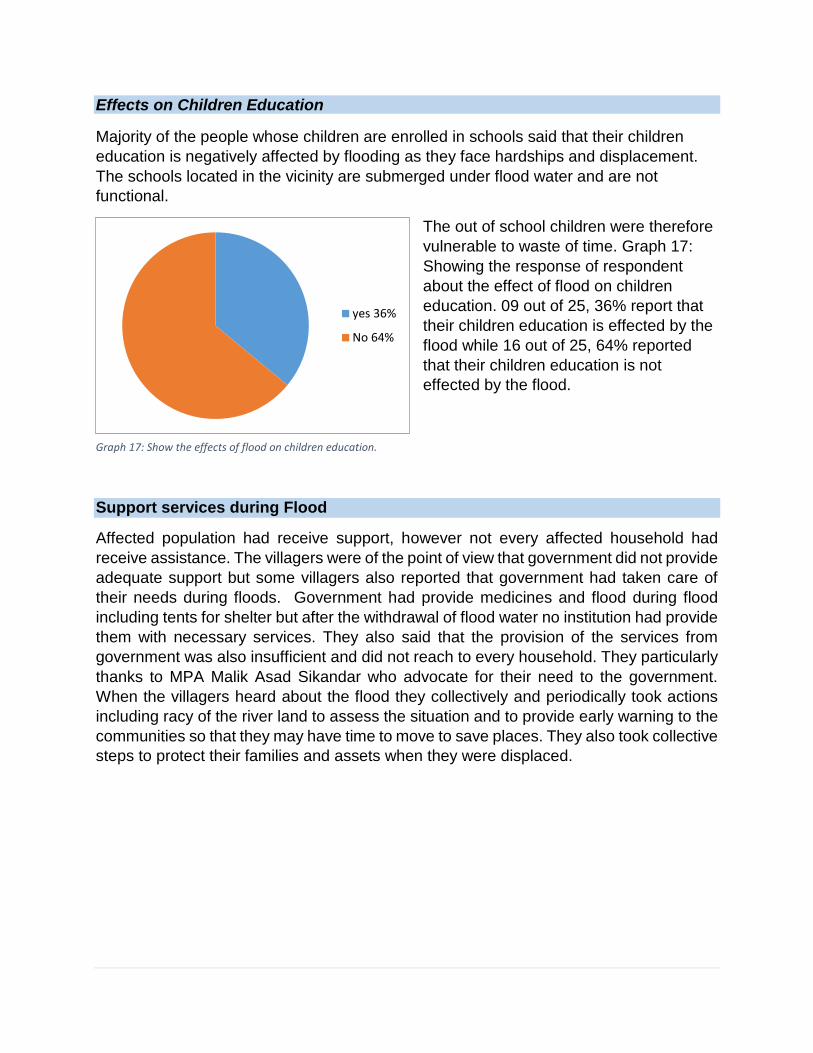
Effects on Children Education
Majority of the people whose children are enrolled in schools said that their children
education is negatively affected by flooding as they face hardships and displacement.
The schools located in the vicinity are submerged under flood water and are not
functional.
The out of school children were therefore
vulnerable to waste of time. Graph 17:
Showing the response of respondent
about the effect of flood on children
education. 09 out of 25, 36% report that
their children education is effected by the
flood while 16 out of 25, 64% reported
that their children education is not
effected by the flood.
Support services during Flood
Affected population had receive support, however not every affected household had
receive assistance. The villagers were of the point of view that government did not provide
adequate support but some villagers also reported that government had taken care of
their needs during floods. Government had provide medicines and flood during flood
including tents for shelter but after the withdrawal of flood water no institution had provide
them with necessary services. They also said that the provision of the services from
government was also insufficient and did not reach to every household. They particularly
thanks to MPA Malik Asad Sikandar who advocate for their need to the government.
When the villagers heard about the flood they collectively and periodically took actions
including racy of the river land to assess the situation and to provide early warning to the
communities so that they may have time to move to save places. They also took collective
steps to protect their families and assets when they were displaced.
yes 36%
No 64%
Graph 17: Show the effects of flood on children education.
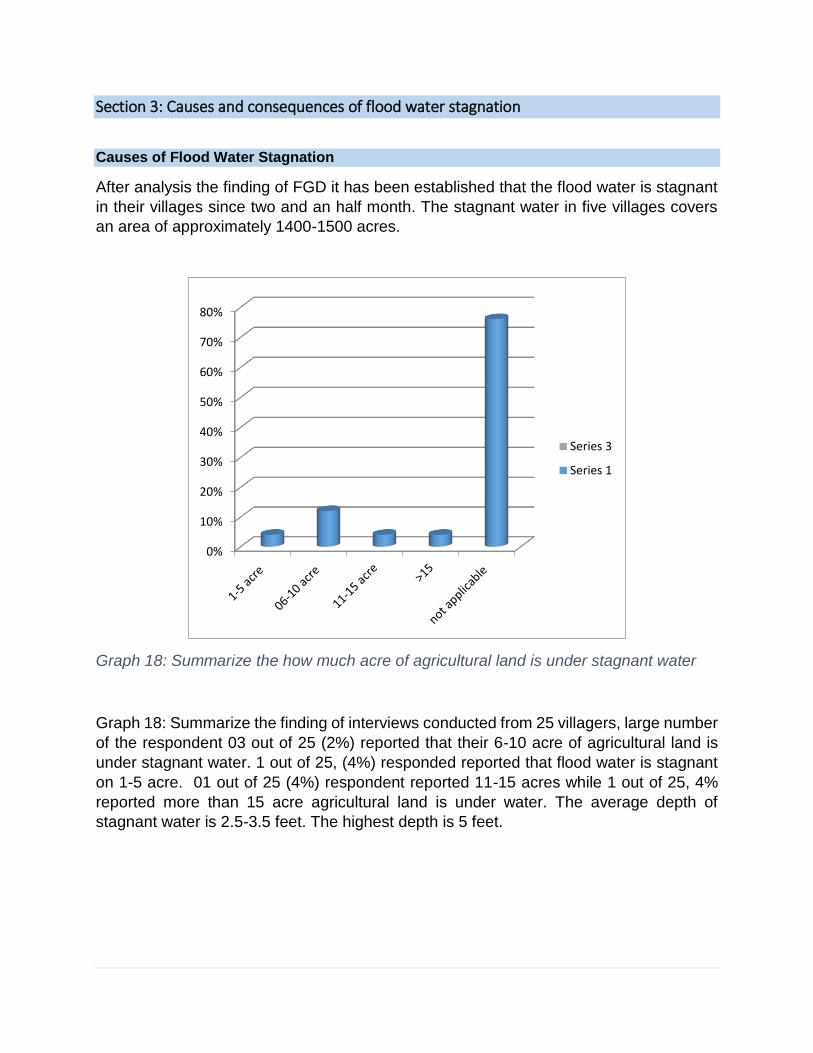
Section 3: Causes and consequences of flood water stagnation
Causes of Flood Water Stagnation
After analysis the finding of FGD it has been established that the flood water is stagnant
in their villages since two and an half month. The stagnant water in five villages covers
an area of approximately 1400-1500 acres.
Graph 18: Summarize the how much acre of agricultural land is under stagnant water
Graph 18: Summarize the finding of interviews conducted from 25 villagers, large number
of the respondent 03 out of 25 (2%) reported that their 6-10 acre of agricultural land is
under stagnant water. 1 out of 25, (4%) responded reported that flood water is stagnant
on 1-5 acre. 01 out of 25 (4%) respondent reported 11-15 acres while 1 out of 25, 4%
reported more than 15 acre agricultural land is under water. The average depth of
stagnant water is 2.5-3.5 feet. The highest depth is 5 feet.
0%
10%
20%
30%
40%
50%
60%
70%
80%
Series 3
Series 1
The target area is located on the right hand side of Karachi to Hyderabad Highway near
Toll plaza. Khanpur road located on the right hand side is reported as the major cause
of water stagnation. Further the cause-ways (Mori), which go through the roads so that
the water can cross the roads, are not present and therefore water flow is blocked in
between plots of agriculture land. Secondly, the height and depth of the surface of land
is uneven. Thirdly the watercourses build on villager’s farm lands are of concrete
(Pacca) which also cause stagnation. It is noticed that communities living on the area
are un-willing and less motivated to undertake self-help actions collectively, it is
because of the fact that these communities having minor conflicts with each other.
Together these three major reasons and other factors contributed to none withdrawal of
water therefore water stagnation in the area.
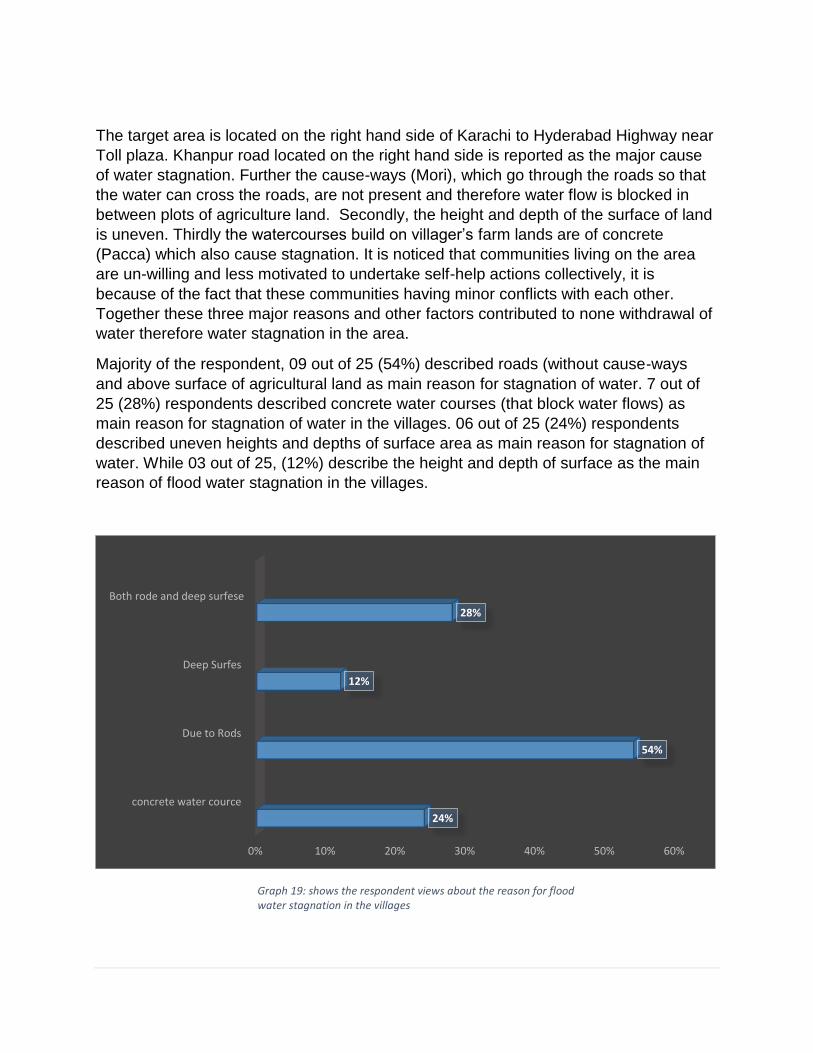
Majority of the respondent, 09 out of 25 (54%) described roads (without cause-ways
and above surface of agricultural land as main reason for stagnation of water. 7 out of
25 (28%) respondents described concrete water courses (that block water flows) as
main reason for stagnation of water in the villages. 06 out of 25 (24%) respondents
described uneven heights and depths of surface area as main reason for stagnation of
water. While 03 out of 25, (12%) describe the height and depth of surface as the main
reason of flood water stagnation in the villages.
0% 10% 20% 30% 40% 50% 60%
concrete water cource
Due to Rods
Deep Surfes
Both rode and deep surfese
24%
54%
12%
28%
Graph 19: shows the respondent views about the reason for flood water stagnation in the villages
It took one month for water to recede from the adjacent land. The water of adjacent land
receded naturally with the decrease in flood. To this question, the villagers said that water
receded naturally from the adjacent land. This was possible because water could not
stand in plots of agricultural residential land and since there were no roads without cause-
ways above the ground level of agricultural land. On the other (left/right) side, where the
survey is conducted, water has submerged most of agricultural land as well as plots. The
water cannot recede or move because roads above the surface have blocked water flow
and there is also no arrangement in form of proper drainage infrastructure in the
concerned land.
According to the villagers, this year water flow was slow and took around one month to
completely go through Kotri Barrage. The height of water gradually increased and
therefore roads and watercourses were not damaged. If compare to previous flood of
2010 the flow of water was high and the height of water was rapidly increase therefore
damaged the road and watercourses due to the damage in roads and watercourse,
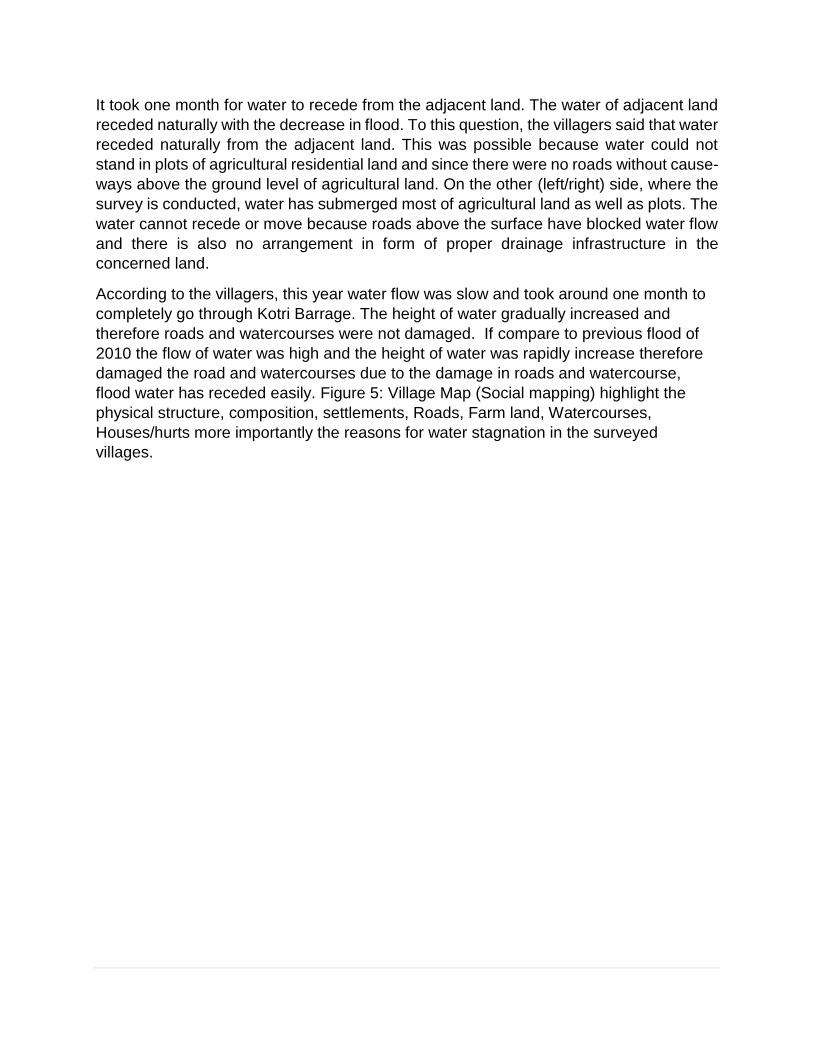
flood water has receded easily. Figure 5: Village Map (Social mapping) highlight the
physical structure, composition, settlements, Roads, Farm land, Watercourses,
Houses/hurts more importantly the reasons for water stagnation in the surveyed
villages.
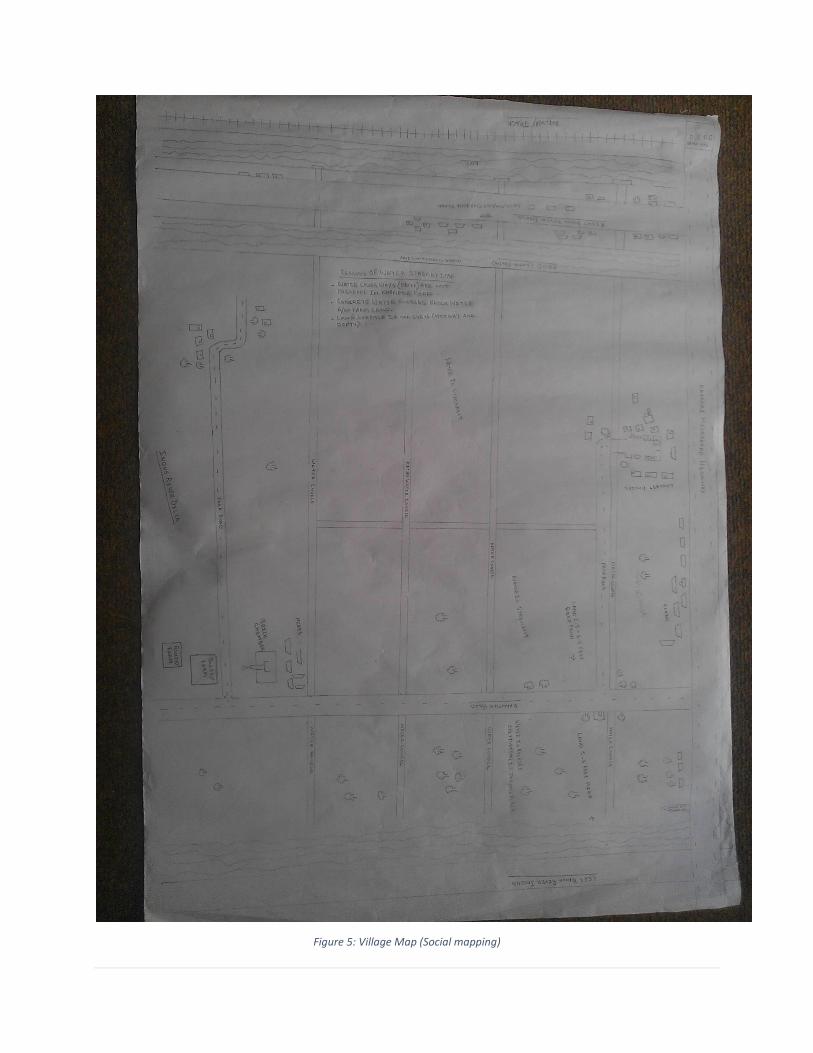
Figure 5: Village Map (Social mapping)
Villager’s response about the occurrence of diseases due to flood water stagnation
The villagers were of the viewpoint that stagnant water on the land has adversely
affected their health condition. Graph 22 out of 25 (88%) respondent said that diseases
occur due to the flood water stagnation. 03 out of 25 (12%) respondent said that none
of the diseases occur due to the flood water stagnation in the area.
Graph 20: Shows the response of respondent about the occurrence of diseases due to flood water stagnation
Type of Disease and health problems that occur due to water stagnation
When asked about the Disease or health problem that accrue due to water stagnation
the respondent give multiple answer, Graph 60% reported malaria and 60% reported
Diarrhea, while 56% report skin diseases, 28% reported Malnutrition and 12% reported
eye soiling.
88%
12%
Yes No
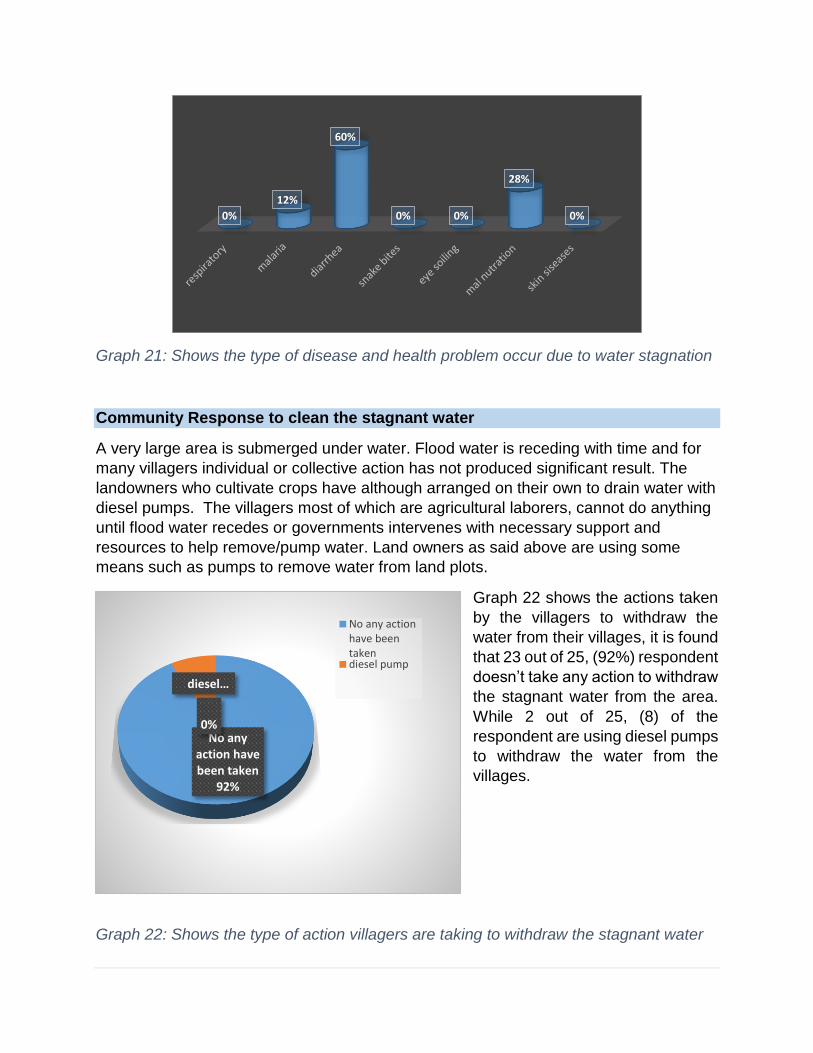
Graph 21: Shows the type of disease and health problem occur due to water stagnation
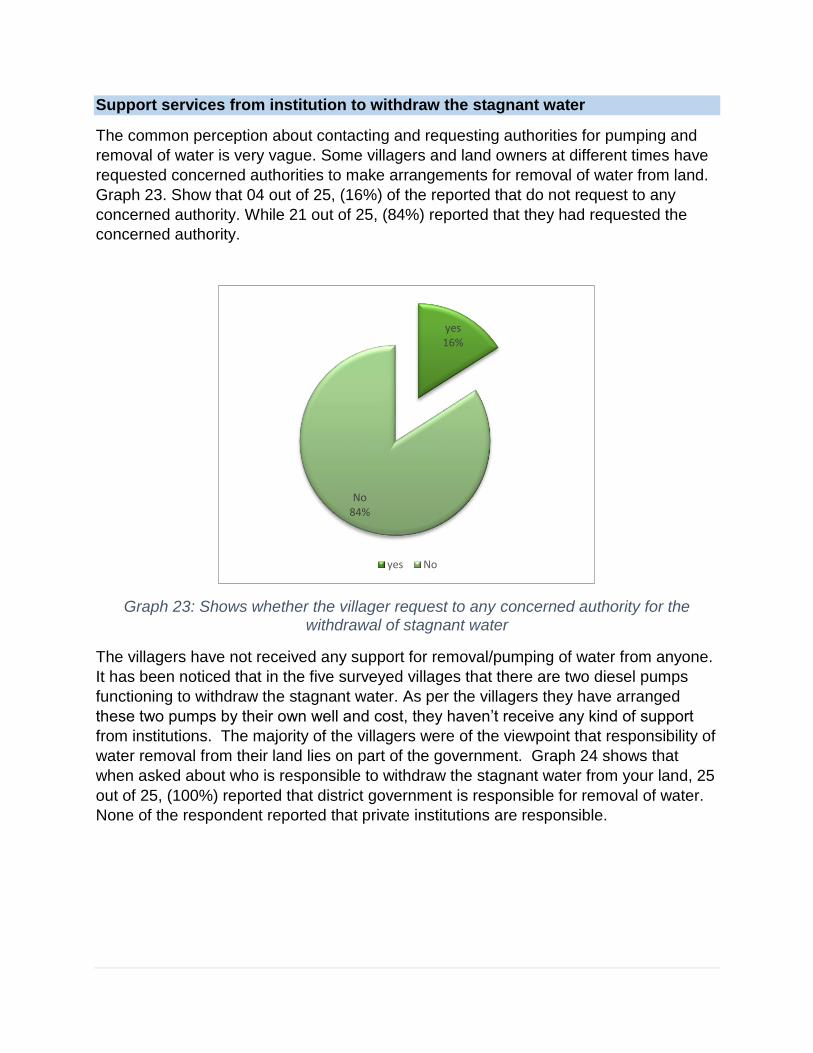
Community Response to clean the stagnant water
A very large area is submerged under water. Flood water is receding with time and for
many villagers individual or collective action has not produced significant result. The
landowners who cultivate crops have although arranged on their own to drain water with
diesel pumps. The villagers most of which are agricultural laborers, cannot do anything
until flood water recedes or governments intervenes with necessary support and
resources to help remove/pump water. Land owners as said above are using some
means such as pumps to remove water from land plots.
Graph 22 shows the actions taken
by the villagers to withdraw the
water from their villages, it is found
that 23 out of 25, (92%) respondent
doesn’t take any action to withdraw
the stagnant water from the area.
While 2 out of 25, (8) of the
respondent are using diesel pumps
to withdraw the water from the
villages.
Graph 22: Shows the type of action villagers are taking to withdraw the stagnant water
0%
12%
60%
0% 0%
28%
0%
No any action have been taken
92%
diesel …
0%
No any actionhave beentakendiesel pump
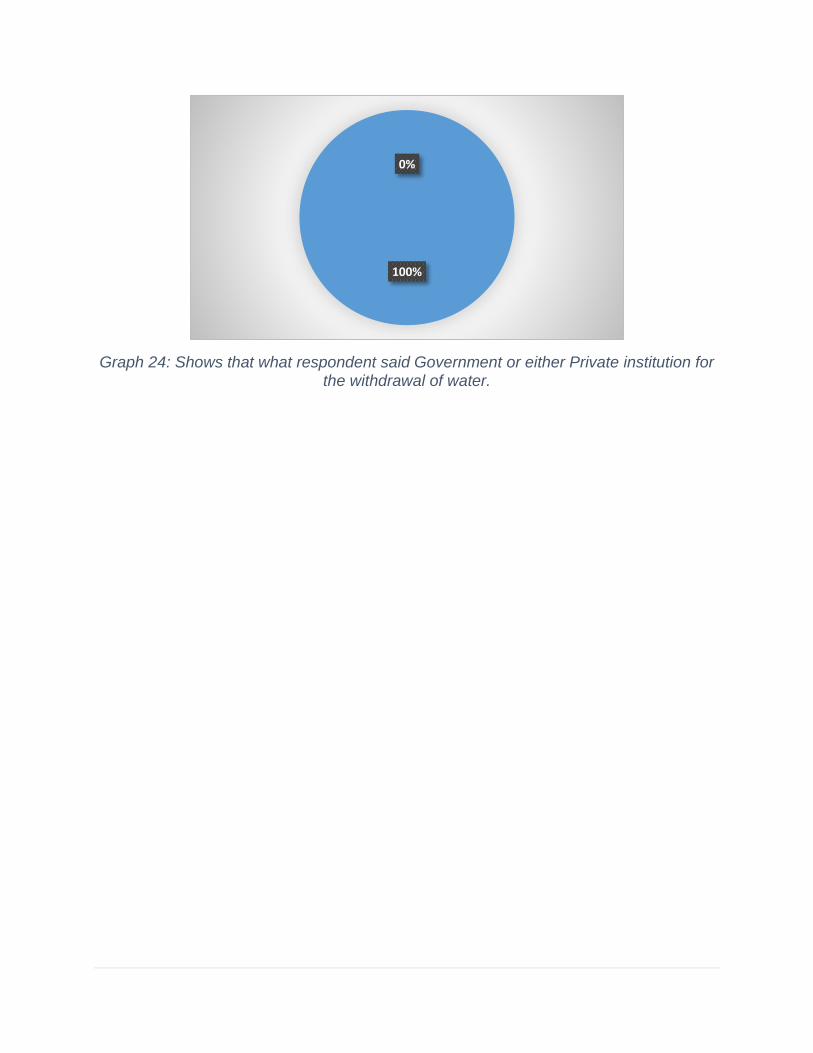
Support services from institution to withdraw the stagnant water
The common perception about contacting and requesting authorities for pumping and
removal of water is very vague. Some villagers and land owners at different times have
requested concerned authorities to make arrangements for removal of water from land.
Graph 23. Show that 04 out of 25, (16%) of the reported that do not request to any
concerned authority. While 21 out of 25, (84%) reported that they had requested the
concerned authority.
Graph 23: Shows whether the villager request to any concerned authority for the withdrawal of stagnant water
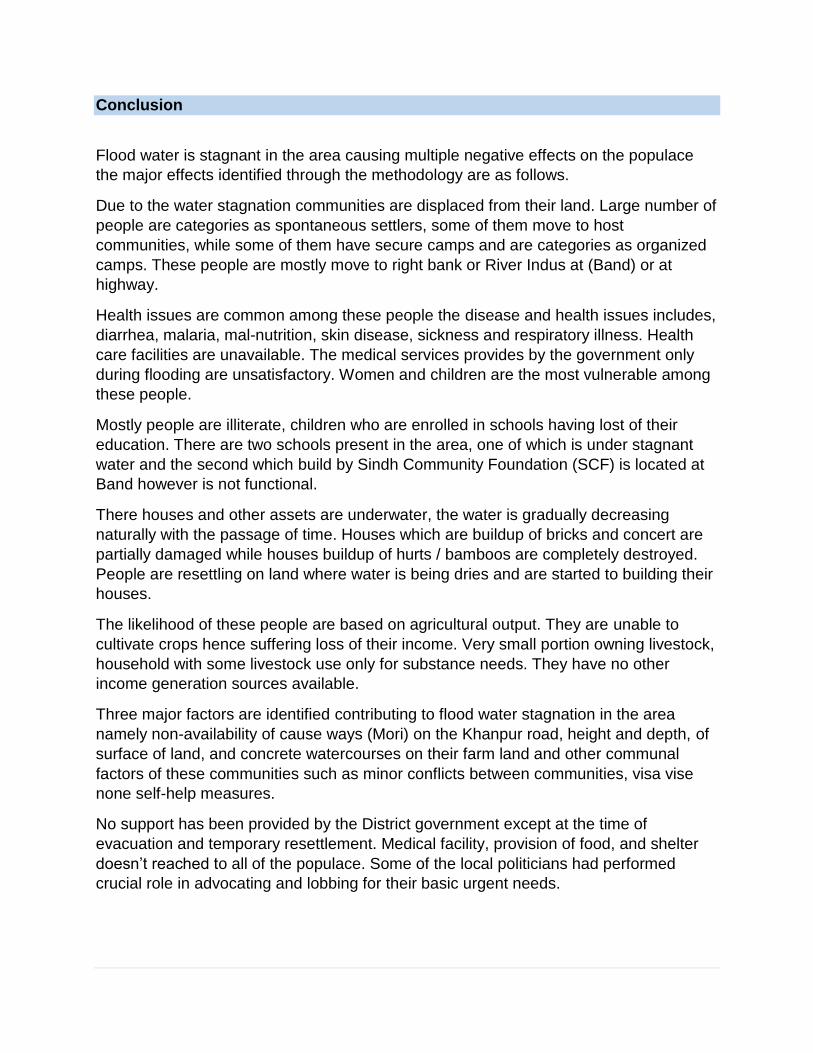
The villagers have not received any support for removal/pumping of water from anyone.
It has been noticed that in the five surveyed villages that there are two diesel pumps
functioning to withdraw the stagnant water. As per the villagers they have arranged
these two pumps by their own well and cost, they haven’t receive any kind of support
from institutions. The majority of the villagers were of the viewpoint that responsibility of
water removal from their land lies on part of the government. Graph 24 shows that
when asked about who is responsible to withdraw the stagnant water from your land, 25
out of 25, (100%) reported that district government is responsible for removal of water.
None of the respondent reported that private institutions are responsible.
yes 16%
No 84%
yes No
Graph 24: Shows that what respondent said Government or either Private institution for the withdrawal of water.
100%
0%
Conclusion
Flood water is stagnant in the area causing multiple negative effects on the populace
the major effects identified through the methodology are as follows.
Due to the water stagnation communities are displaced from their land. Large number of
people are categories as spontaneous settlers, some of them move to host
communities, while some of them have secure camps and are categories as organized
camps. These people are mostly move to right bank or River Indus at (Band) or at
highway.
Health issues are common among these people the disease and health issues includes,
diarrhea, malaria, mal-nutrition, skin disease, sickness and respiratory illness. Health
care facilities are unavailable. The medical services provides by the government only
during flooding are unsatisfactory. Women and children are the most vulnerable among
these people.
Mostly people are illiterate, children who are enrolled in schools having lost of their
education. There are two schools present in the area, one of which is under stagnant
water and the second which build by Sindh Community Foundation (SCF) is located at
Band however is not functional.
There houses and other assets are underwater, the water is gradually decreasing
naturally with the passage of time. Houses which are buildup of bricks and concert are
partially damaged while houses buildup of hurts / bamboos are completely destroyed.
People are resettling on land where water is being dries and are started to building their
houses.
The likelihood of these people are based on agricultural output. They are unable to
cultivate crops hence suffering loss of their income. Very small portion owning livestock,
household with some livestock use only for substance needs. They have no other
income generation sources available.
Three major factors are identified contributing to flood water stagnation in the area
namely non-availability of cause ways (Mori) on the Khanpur road, height and depth, of
surface of land, and concrete watercourses on their farm land and other communal
factors of these communities such as minor conflicts between communities, visa vise
none self-help measures.
No support has been provided by the District government except at the time of
evacuation and temporary resettlement. Medical facility, provision of food, and shelter
doesn’t reached to all of the populace. Some of the local politicians had performed
crucial role in advocating and lobbing for their basic urgent needs.
Recommendation
Keeping in mind the facts and findings from the targeted area of objectives stated, following
recommendation are set forth in light of the survey and findings.
1. It is clear that the area and people affected by flood have special needs and
government should initiate a mechanism for immediate delivery of relief goods until
stagnant flood water dries up. Government and non-government organizations
should provide people with instant-food items, wheat, grain, bottled mineral water,
nutritious supplements, medicines, vaccines and essentials of life in the first place.
2. Complete registration and authentic demographic survey of the population be
conducted to facilitate pro-poor targeting and provision of minimum relief as
mentioned above and to facilitate evacuation and relief action.
3. Livelihood recovery support program / package be provided in support to farming
household for approaching cropping seasons. If the government cannot do this, it
should at least help them to cushion the negative effects of the same with
reasonable financial assistance.
4. All social protection programmers can be utilize for the welfare of the effected
population.
In case if these people are not willing to leave this land, the following intervention might
found beneficial and sustainable;
5. Design and implementation of suitable land re-settlement projects. With funding of
international donors / government with provision of all essential infrastructure and
services particularly.
5.1 If the government and community could reach an understanding over separate
land for residential purpose, the risks to major disaster can be minimized. It is
recommend that government private institution jointly resettle these settlement
to the save places to completely free them from risks of major disaster. Keeping
in mind the socio-economic life of the people which is dependent on cultivation,
it is suggested that the government resettle these people to the nearest zone-
area so they may continue their income generation activity which depends on
Indus river land.
5.2 Construction of cause ways (Nalas-Mori) on Khanpur road and between farm
land and at appropriate place after detail contour survey including designing and
planning of the affected area in particular and considering the entire zone.
5.3 Provincial Disaster Management Authority (PDMA) in coordination with National
Disaster Management Authority (NDMA) should utilize all available means to
facilitate early warning system, developing risk reduction strategies and
coordinated relief for evacuation and temporary settlement / organized camps.
As part of this need assessment should be made by concerned agency.
Bureaucratic delays should be prevented and complete redressal system should
be implemented.
5.4 Waste water drainage infrastructure can help to mitigate the risk of water
stagnation, sewerage wholes can drain water. This water can be pumped to
RBOD (Same Nala).
6. There is a need for mobilizing and sensitizing communities about the importance of
self-help action / collective action.
7. Conflict resolution campaign with public private institutions are needed so they may
undertake self-help measures.