Embed Size (px)
Citation preview

17
CHAPTER – 2
SOCIO- ECONOMIC FABRIC OF RAJASTHAN
STATE
2.1 FORMATION OF RAJASTHAN
2.2 LOCATION
2.3 PHYSICAL OR NATURAL DIVISION OF RAJASTHAN
I. Western sandy plains
II. Aravalli Range And Hilly Region
III. Eastern Pains
IV. South-eastern Rajasthan Pathar (Hadoti or Harauti Plateau)
2.4 POSITION OF RAJASTHAN IN INDIAN ECONOMY
I. Position of Rajasthan in Relation to Population
II. Sex Ratio
III. Density of Population
IV. Literacy Rate
2.5 POSITION OF RAJASTHAN IN RELATION TO AREA
2.6 POSITION OF RAJASTHAN IN RELATION TO
AGRICULTURE
I. Pattern of Land Utilisation
II. Average Size of Operation Holdings
III. Irrigation, Use of Fertilizers, etc.
IV. Production of Main Crops
2.7 INDUSTRIAL POSITION

18
I. Share in Gross Domestic Products ie (GDP)
II. Position of Factory Sector
2.8 SOCIO-ECONOMIC INFRASTRUCTURE
I. Electricity
II. Roads
III. Railways
IV. Education
V. Per Capital Income
2.9 MAIN FACTORS RESPONSIBLE FOR SLOW
ECONOMIC PROGRESS OF RAJASTHAN
I. Weak Economic base
II. Adverse Geographical and Physical Conditions
III. High Growth Rate of Population
IV. Problems Related with Groundwater in the State
V. Social Backwardness
VI. Lack of Financial resources.
VII. Poor Implementation of Plans
2.10 SUMMING UP

19
2.1 FORMATION OF RAJASTHAN
The present state of Rajasthan was formed after a long process of
integration in seven stages which began on March 18, 1948 and
ended on November 1,1956. In the beginning, Matsya Union was
formed by joining together State like Alwar, Bharatpur, Dholpur
and Karauli. Former Rajasthan was formed on March 25, 1948 by
integrating nine States, viz., Banswara, Bundi, Dungarpur,
Jhalawar, Kishangarh, Kota, Pratapgarh, Shahpura and Tonk. On
April 18, 1948, United State of Rajasthan was formed by
including Udaipur State in it. On March 30, 1949 the States of
Bikaner, Jaipur, Jaisalmer and Jodhpur joined it. Matsya was
merged with it on May 15, 1949. In the sixth stage on February 7,
1950, Sirohi State was fully merged with it, and finally in the
seventh stage on November 1,1956, after coming into force of the
State Reorganisation Act, Ajmer-Merwara State, Sunel Tappa
Village of MP were merged with it and Sironj region of Jhalawar
district was transferred to MP. In this way the process of the
formation of Rajasthan was completed in nine years (1948-56) in
seven stages.
Thus, the state of Rajasthan, before its formation consisted
of 19 princely states, the British administered territory of Ajmer-
Merwara and three chiefships (Kushalgarh, Lava and Neemrana).
Before integration it was called Rajputana; after integration it

20
came to be known as Rajasthan. The location of 33 districts is
shown in the map on the next page.
2.2 LOCATION
Rajasthan is situated in the north-western part of India. It lies
between 2303, and 30
012‘ north latitudes and 69
030‘, and 78
017‘,
east longitudes. North Arabia, part of Egypt and Liberia, northern
Sahara and part of Mexico are also located between these
latitudes, but the climatic conditions of Rajasthan are not so
severe as are found in these countries. The southern part of
Rajasthan is about 225 km from the Gulf of Kutch and about 400
km from the Arabian Sea.
Rajasthan is bounded by Pakistan in the west and north-
west; by the state of Punjab in the north; by Haryana in the north-
east by Uttar Pradesh in the east, by Madhya Pradesh in the
south-east and Gujarat in the south-west. As mentioned in the
previous chapter, it is the largest state now in terms of area in
India. The international border with Pakistan is to the extent of
1,040 kilometres. For security and other reasons, the government
has to incur a lot of expenditure on border area development.
From east to west it is about 869 km and from north to south it is
about 826 km long. Due to vast area in the state, it possesses
various types of physical features.
2.3 PHYSICAL OR NATURAL DIVISIONS OF
RAJASTHAN

21
The most notable feature of Rajasthan is the aravalli range of
hills. This is one of the oldest mountain system of the world. It
intersects the state diagonally from one end to the other , and cuts
it into two parts. It runs from north-east to south-west. The area
lying to the west of the Aravallis is known as Western Sandy
Plains and to its east lies the northern part of the Central
Highlands. These two major divisions have a variety of
physiographic and relief features. On the basis of the existing
relief features, the state can be divided into the following physical
or natural divisions:
1. Western Sandy Plains
(a) Sandy –Arid plains ( Marusthali)
(b) Semi-Arid Transitional Plains ( Rajasthan Bagar)
(i) Luni basin (Godwar Tract)
(ii) Plain of Interior Drainage (Shekhawati Tract )
(iii) Ghaggar Plain
2. Aravalli Range and Hilly Region
(a) Aravalli Range and Bhorat Plateau
(b) North –Eastern Hilly Region
3. Eastern Plains
(a) Banas Basin
(b) Chappan Plains
4. South – Eastern Rajasthan Pathar ( Hadoti or Harauti Plateau )
(a) Vindhyan Scarpland
(b) Deccan Lava Plateau.

22
2.4 POSITION OF RAJASTHAN IN INDIAN ECONOMY
Earlier, Rajasthan Was regarded as ―a backward region in a
backward economy‖ of india. Firstly, Indian economy was
regarded as an underdeveloped and Backward economy, and
secondly, Rajasthan economy was also like a Backward region in
it. But, more recently, it would be quite appropriate to designate
Rajasthan as a developing region in the developing economy of
India. Both the national economy and the regional economy are
on development path in the plan period. Much has been achieved.
But much more remain to be achieved. Rajasthan is one of the 17
non-special category state in india. Therefore, under central plan-
assistances, its share was 30 per cent grant and 70 per cent loan;
while 11 Special category states got 10 per cent grant and 10 per
cent loan as their respective shares under the central plan-
assistance. The state has been trying hard to be included in the
group of special –category states but so far 40 success has been
achieved in this regard. However, for Rajasthan it should be
remembered that, it has been included in this regard. However,
for Rajathan it should be remembered that , it has been included
in the category of ‗BIMARU‘ states, along with Bihar, MP and
UP, due to some weak demographic factors like high growth rates
of population, high birth rates, high infant mortality rates, low
literacy rates, particularly for femals, low marriage age for girls,
etc., as per the viewpoint of the famous demographer, Dr. Ashish
Bose. The stae is trying hard to come out of the category of

23
‗BIMARU‘ states. Improvements have taken place in some of the
aforesaid demographic indicators as we shall see in the relevant
chapters, but more sustained efforts are needed in this direction to
achieve the desired goal. In this chapter we would analyses from
the point of view of population, area, agriculture, industry,
infrastructure etc. We would compare the relative position of
Rajasthan with some states also. The position of Rajasthan with
some states also.
Rajasthan state, in its present form, come into existence as a
conglomeration of 19 princely states and 3 chiefships which
varied in size, administrative efficiency and socio-economic
development at the time of the formation of the state. At present
Rajasthan in divided into 7 Divisions, 33 districts which are
further divided into 244 tehsils, 184 municipalities (total no. of
ULBs, including 5 Nagar Nigams), 249 Panchayat1 Samities,
9,175 village panchayats and 41,353 revenue villages. Pratapgarh
district was the latest addition in the category of districts in the
state.
With as are of 3.42 lakh sq. kilometes, Rajasthan is now the
largest state in the country, after the bifurcation of Chattisgarh
from the state of Madhya Pradesh. As per the census of 2011, the
population of the state was 6.86 crore. It has a long international
frontier with Pakistan of 1040 kms. (Annual Plan, Rajasthan,
2011-12, p.1.1), and is adjacent to the staes of Punjab, Haryana,
1 SOME FACTS ABOUT Rajasthan august 2011 PPT-8

24
UP, MP and Gujarat. Aravalli Hill ranges run from south-west to
north-east through the heart of the state. To the west and the
north –west of these hills, there is a region, which comprises 11
districts. It covers about 61 per cent of the total area of the state,
and is widely known as the Great Indian Desert-the Thar. The
state accounts for 2.08 lakh sq. kilometers out of the total 2.40
lakh sq. kms. of hot Deseret area in the country.
Item Year Rajasthan India Rajasthan’s
Share in india or other
comments
1. Population 2011 6.86 crore 121.02 5.67%
2. Area 2001 3.42 lakh sq. km
( 342239 sq. km.
32.87 lakh sq. km
( 3287263 sq. km.)
10.4% ( first place in
india)
3. Decadel growth
rate of
population
2001-
2011
21.44% 17.64% More than india ( about
3.80 percentage points )
4. Total Literacy
rate (aged 7
years and
above )
2011 67.06% 74.04 Less than india
( About 7% points)
5. Density (
Population per
sq. km
2011 201 382 Less than 181 points as
campared to india
6. Proportion of
SC population
2001 17.2% 16.2% Slightly more than in
India
7. Proportion of
ST population
2001 12.6% 8.2% Much more than india
8. Area under
food grains
2009-10
final)
13.23( Million
hectares
121.3 Million
Hectares)
10.9%
9. No. of 2007-08 2.79 lakh 82 lakh 3.4%

25
A few major indicators of Rajasthan economy vis-à-vis
Indian economy are given below. Sector – wise details would
follow later:-
Source : Statistical Outline of India 2009-10 (Tata Services Ltd.), December 2010, Economic
Survey 2010-11 (GOI), and Economic Review 2010-11 (GOR).
employment in
reporting
factories
10. Perhectare
Consumption of
NPK fertilser s
(in kg)
2008-09 48.85 128.80 38% of Indian level
11. Average size of
holdings
2005-06 3.38 (hectares) 1.25( hectares) About 2.75 times that of
india
12. Poverty ratio (
No. of poor as a
ratio of
population )
2004-05 (
mixed
recall
period
( MRP)
method
34.4% ( New
estimate of
Tendulkar
committee)
37.2% Less than the national
averate
13. Per capita
consumption of
electricity (
utilized and
non – utilized )
2008-09 747.07 (kwh) 733.54 (kwh) Alittle more than the
national average
14. Road length
(Per 100sq. km.
area )
2010-11 55.23 (km) 110.17(km) About half of national
average
15. Electrification
of villages
31 mar
2007
67.1% 81.3% Less than the national
average
16. Per capita
income (at
2004-05 prices )
2009-10 23653 33731 About 70% of national
average
26
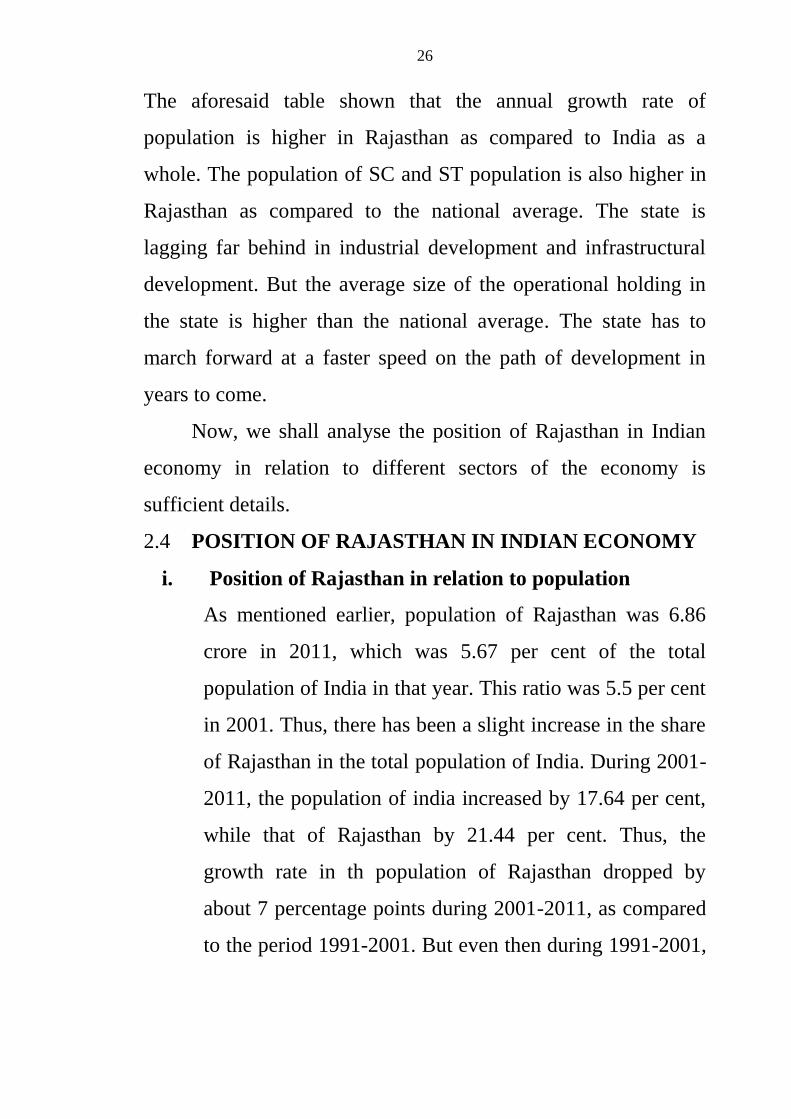
The aforesaid table shown that the annual growth rate of
population is higher in Rajasthan as compared to India as a
whole. The population of SC and ST population is also higher in
Rajasthan as compared to the national average. The state is
lagging far behind in industrial development and infrastructural
development. But the average size of the operational holding in
the state is higher than the national average. The state has to
march forward at a faster speed on the path of development in
years to come.
Now, we shall analyse the position of Rajasthan in Indian
economy in relation to different sectors of the economy is
sufficient details.
2.4 POSITION OF RAJASTHAN IN INDIAN ECONOMY
i. Position of Rajasthan in relation to population
As mentioned earlier, population of Rajasthan was 6.86
crore in 2011, which was 5.67 per cent of the total
population of India in that year. This ratio was 5.5 per cent
in 2001. Thus, there has been a slight increase in the share
of Rajasthan in the total population of India. During 2001-
2011, the population of india increased by 17.64 per cent,
while that of Rajasthan by 21.44 per cent. Thus, the
growth rate in th population of Rajasthan dropped by
about 7 percentage points during 2001-2011, as compared
to the period 1991-2001. But even then during 1991-2001,

27
population increased at a faster rate in Rajasthan as
compared to India , which is a cause of real worry.
Uttar Pradesh had 16.49 per cent share in th total
population of India in 2011 and occupied first rank in this
regard. Rajasthan with a share of 5.67 per cent in the total
population of India occupied eighth place in the
descending order of percentage share in the total
population of India.
ii. Sex Ratio
Sex ratio indicates the number of females per 1,000
males . It was 926 in 2011 for Rajasthan. In 2001 it was
921. Thus, there has been an increase in the sex ratio by
5 points in 2011 as campared to 2001. Sex ratio was 940
in Inida in 2011, which was 14 points higher than
Rajasthan.
Sex ratio for some other states in 2011 was as follows:
India
Kerala
MP
Punjab
UP
Rajasthan
940
1084
930
893
908
926
Thus, the sex ratio in Rajasthan was much lower than
that of kerala in 2011; but it was higher than Punjab and
UP. In kerala the number of females was higher than that
of males. It was 1084 in 2011.
28
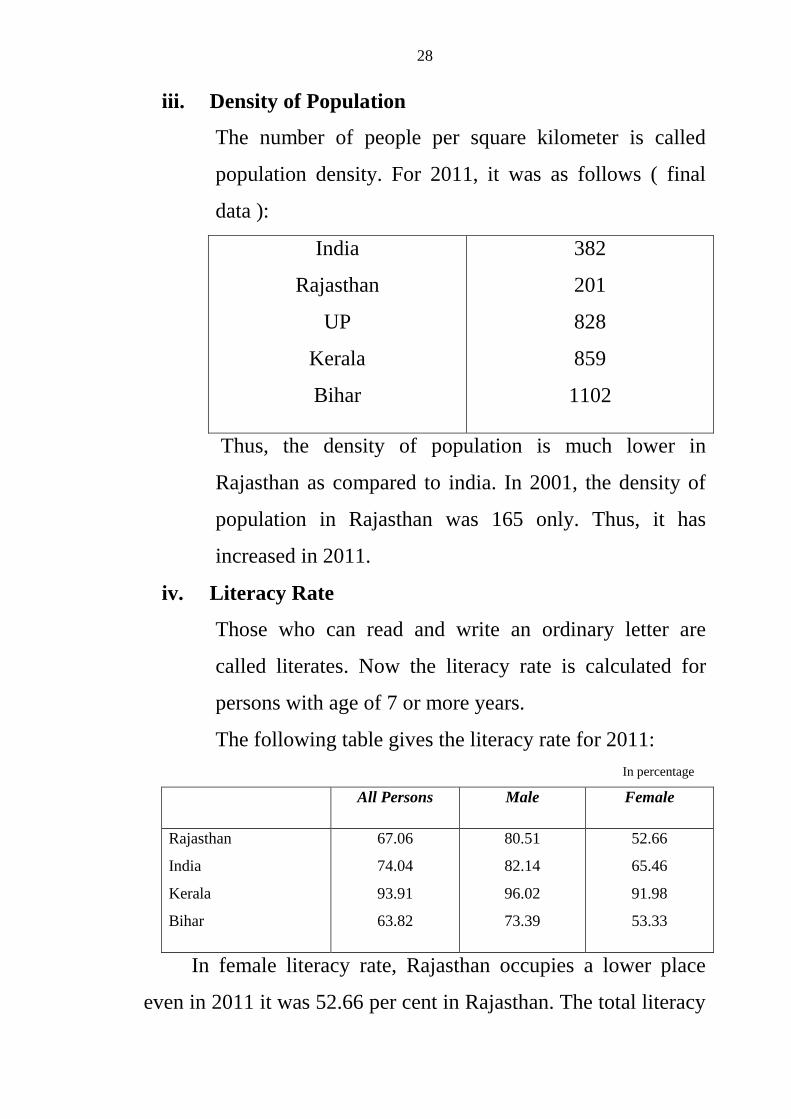
iii. Density of Population
The number of people per square kilometer is called
population density. For 2011, it was as follows ( final
data ):
India
Rajasthan
UP
Kerala
Bihar
382
201
828
859
1102
Thus, the density of population is much lower in
Rajasthan as compared to india. In 2001, the density of
population in Rajasthan was 165 only. Thus, it has
increased in 2011.
iv. Literacy Rate
Those who can read and write an ordinary letter are
called literates. Now the literacy rate is calculated for
persons with age of 7 or more years.
The following table gives the literacy rate for 2011:
In percentage
All Persons Male Female
Rajasthan
India
Kerala
Bihar
67.06
74.04
93.91
63.82
80.51
82.14
96.02
73.39
52.66
65.46
91.98
53.33
In female literacy rate, Rajasthan occupies a lower place
even in 2011 it was 52.66 per cent in Rajasthan. The total literacy

29
rate in Rajasthan 67.06 per cent which lower than 74.04 per cent
for India.
It must be noted that the female literacy rate in rural areas
of some districts of Rajasthan was really very dismal and
disappointing. For example in Banswara district, rural female
literacy rate was 24.43 per cent only, which was the minimum in
2001. This is a shocking state of affairs and presents a
challenging situation for the future. More serious and sustained
attention needs to be given to increase rural female literacy rate in
Rajasthan in general, and for the most backward districts in
particular.
2.5 Position of Rajasthan in Relation to Area
As stated earlier, at present Rajasthan is the largest state in Inida
from the point of view of area. The area of Rajasthan was about
3.42 lakh square kilometers, which was about 10.41 per cent of
the total area of all the state.
The share of some other states and their rank in India are
shown in the following table:2
State % Share in total
Area of All States
Rank in the
State of India
Maharashtra
Andhra Pradesh
Gujarat
Haryana
Uttar Pradesh
9.36
8.37
5.96
1.34
7.33
3
4
7
16
5
2 Economic Review 2010-11, State wise important Economic Indicators (Table 28)

30
Thus with 10.4 per cent share in area, Rajasthan occupied first
place in terms of area in India. Gujarat had about 6 per cent area
and uttar Pradesh had about 7.3 per cent. Due to higher share in
area, Rajasthan has been pleading for including area as a criterion
to be included for the devolution of transfers of tax – revenues
from the centre to the state. The thirteenth finance commission
(2010-15) has given weightage of 10 per cent to area. There is
another important feature of the area in Rajasthan. As 61 per cent
area is spread over 11 desert districts of the state with 40 per cent
population in them, the state has to face vagaries of nature in
terms of droughts and famines quite frequently. Relief works
have to be organized over large areas under these conditions.
Expenditure on infrastructural activities is larger under such
difficult conditions of terrain etc.
Thus , the geographical area of Rajasthan has wider implications
for the economy of the state.
2.6 Position of Rajasthan in relation to Agriculture
(i) Pattern of Land Utilisation – there is a lot of difference in
the pattern of land utilization in Rajasthan and in the country as a
whole.
In 2007-08 gross cropped area ( net cropped area+ area sown
more than once)in Rajasthan was 64.8 per cent ot the total
geographical area in the state. The position of Rajasthan has been
regarded as stisfactroy from the point of view of gross cropped
are in the country. In 2002-03 gross cropped area had reached a

31
lower level of 38.57 per cent of the total geographical area in the
state. It fluctuates from year to year due to uncertain rainfall
conditions.
(ii) Average Size of Operational Holdings – In 2005-06, the
average size of operational holdings was 3.38 hectares in
Rajasthan , while it was only 1.25 hectares for the country as a
whole. Thus, the average size of operational holdings is quite
high in Rajasthan. It had second place amongst 17 sates of India.
While the first place went to Punjab, where the average size of
operational holdings was 3.95 hectares.
The Position for some other states was as follows in 2005-
06 :-
(In hectares)
Gujarat
MP
UP
West Bengal
2.20
2.02
0.80
0.79
Thus, the average size of operational holdings in UP and west
Bengal has sunk below one hectare, while that of Rajasthan is
much higher, at 3.38 hectares.
(iii) Irrigation , use of Fertillisers, etc. - In 2008-09, gross
irrigated area as a ratio of gross cropped area was 34.74 per cent
in Rajsthan, while it was about 42.9 per cent in india in 2005-06.
Thus, there is scarcity of irrigation facilities in the state.

32
Ultimately –irrigation potential in Rajasthan is 52 Lakh hectares,
while for india it is 11.35 crore hectares. Thus it is 4.5 per cent of
the country as a whole.
The per hectare consumption of fertilisers is very low in
Rajasthan. In 2008-09 it was about 48.85 kgs, while it was 128.58
kgs in India. Thus, it was about 1/3rd
of the country as a whole. It
was 221.42 kgs in Punjab, which was the highest in the country.
(iv) Production of Main Crops- Rajasthan has emerged as a
leading producer of oilseeds in recent years. The production of
nine oilseeds was very high in Rajasthan in the whole country .
The state has become a leading producer of rapeseed and mustard
in the country . In 2009-10, production was 29.12 lakh tones,
while it was 64 lakh tones in the entire country . In some other
crops, its share in national output was as follows:
Share of Rajasthan in Agricultural Production in 2008-09
Total food grains
Wheat
Oilseeds
Pulses
Cotton
7.1
9.0
18.4
12.4
3.1
Thus, the state had a greater share in the output of oilseeds and
pulses( Particularly gram) in the country. Its position in the
output of sugarcane was very low. It was rather negligible.
The production of foodgrains varies sharply from year to year.
For example, it was 123.6 lakh tones in 2009-10, which was 5.7
33
per cent of the whole country. Crop output fluctuations cause
serious problem for the economy of Rajasthan. However, the
output of oilseeds has shown a sharp rise in recent years.
2.7 industrial position of Rajasthan in the National Economy
(i) Share in gross Domestic Product and Labor force – If we
include manufacturing ( registered and unregistered),
Construction, electricity, gas and water –supply under the
industrial sector, then the share of industries in GDP in 2009-10
for Rajasthan was 29.7 per cent at 2004-05 prices; while it was
25.8 per cent for India at 2004-05 prices. During this period, for
construction alone, the share was 12 per cent for the state of
Rajasthan . Rajasthan will have to raise its share in manufacturing
from its present low level of about 13.65 per cent to a somewhat
higher level by industrializing the state at a faster rate in future.
Manufacturing includes registered as well as unregistered sectors.
Both need to be developed at a faster rate. More about it will be
discussed under industrial growth of Rajasthan.
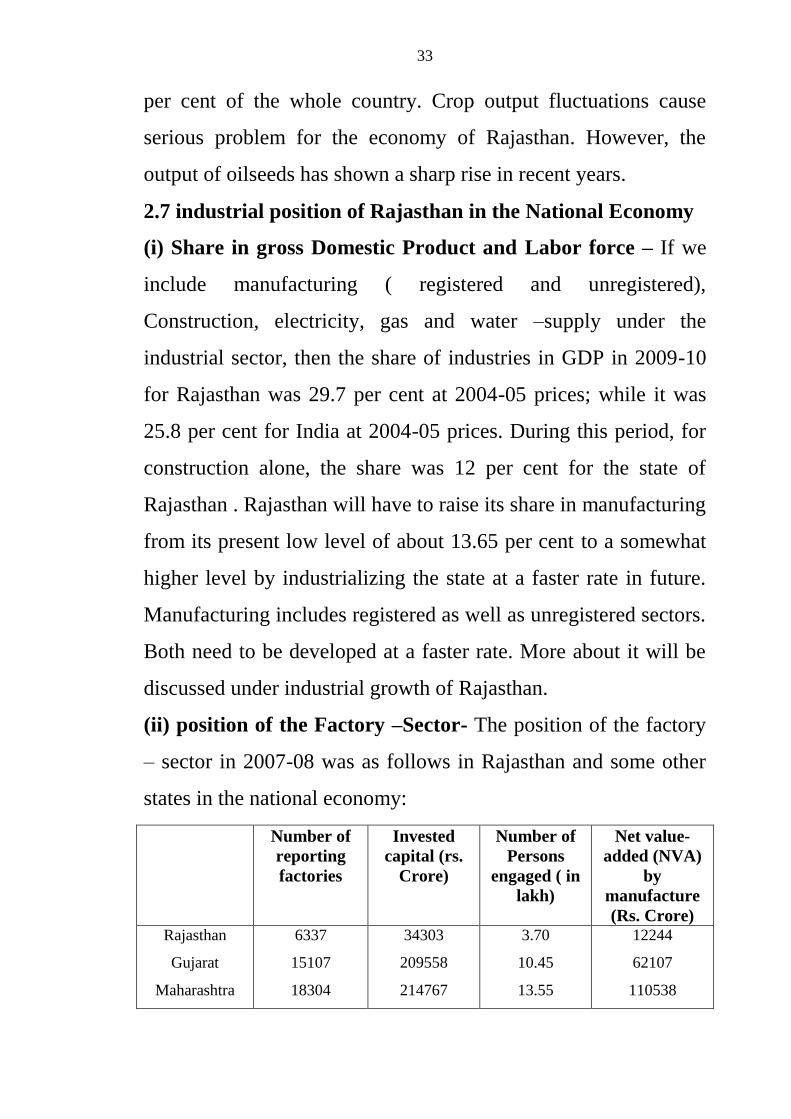
(ii) position of the Factory –Sector- The position of the factory
– sector in 2007-08 was as follows in Rajasthan and some other
states in the national economy:
Number of
reporting
factories
Invested
capital (rs.
Crore)
Number of
Persons
engaged ( in
lakh)
Net value-
added (NVA)
by
manufacture
(Rs. Crore) Rajasthan
Gujarat
Maharashtra
6337
15107
18304
34303
209558
214767
3.70
10.45
13.55
12244
62107
110538

34
All India
Share of
Rajasthan
In all India (%)
146385
4.3
1280126
2.7
104.5
3.5
481593
2.5
Source : AS1 2007-08 CSO, March 2010.
Thus, in number of reporting factories, Rajasthan‘s share was 4.3
per cent, while in other indicators such as invested capital, it was
about 2.7 per cent, and in the number of persons engaged in them
and net value added by manufacture (Value of output – value of
input) it was about 3.5 per cent and 2.5 per cent respectively in
2007-08.
These indicators show that in the factory sector Rajasthan is
industrially backward at present. Gujarat is industrially more
advanced than Rajasthan. In 2007-08, the number of reporting
factors was 15,107 in Gujarat while it was 6,337 only in
Rajasthan. The amount of invested capital and net value-added by
manufacture was much higher in Gujarat and Maharashtra as
compared to Rajasthan. Thus, Rajasthan is industrially lagging
behind other states so far as the factory-sector is concerned. But
Rajasthan occupies a leading position so far as the output of
handicrafts, handlooms gems & jewellery, carpets and other
cottage and household industries are concerned. The exports of
these products from the state help in earning foreign exchange for
the country. More attention should be given to them in future so
that employment income and foreign exchange earning may be

35
increased to a substantial extent from this sector. The factory
sector needs to be developed in the present decade at a rapid rate.
2.8 Social-Economic Infrastructure
(i) Electricity - At the end of March 2010, the installed
capacity for power generation in Rajasthan was 8076.51
MW, which was quite inadequate, looking to the needs of
the state. The per capita consumption of electricity was 747
kwh in Rajasthan in 2008-09 as compared to the national
average of 733.5 kwh. Among 17 states, Rajasthan
occupied 11th
rank in term of per capita consumption of
electricity. Punjab with 1553 kwh, occupied the first
position in thisrespect.
In March 2009, while Gujarat, Haryana. Maharashtra,
Punjab, Tamilnadu, etc. had achieved 100 per cent level in
electrification of villages, Rajasthan had reached a level of
above 91.6 per cent by that time.
(ii) Roads- As stated in the beginning of the chapter, by the
end of 2010-11 the road mileage was 55.23 km. per 100 sq.
km in Rajasthan. The national average was about
110.17km. Thus, the state is backward in the development
of roads at present. Rajasthan has to go a long way to
improve the position in this regard.

36
(iii) Railways- As on 31 March 2008 the railway – mileage
per 1,000 sq. km. area was 16.61 kms. for Rajasthan, which
was less than the national average. The railway milage was
higher in states like Punjab and West Bengal. This shows
the backwardness of Rajasthan in the development of
railways so far. But more recently, a lot of progress has
been made in the conversion of railway track from meter
gauge to broad gauge, which has opened up new avenues
for the economic development of the state for the future.
(iv) Education- We have shown earlier that the literacy
level in Rajasthan is very poor at present. In 2011, there
were 67.1 per cent literate persons in the state as compared
to 74.0 per cent in the entire country. The state has to
improve its literacy rate further in future.
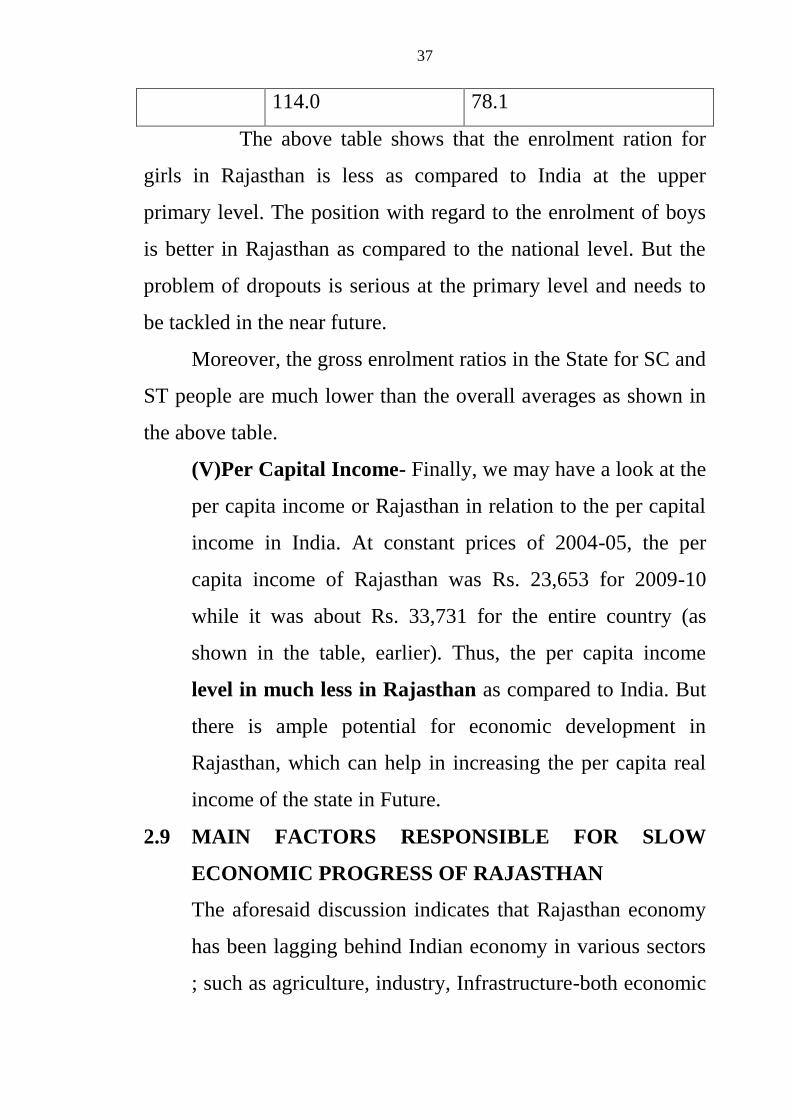
The position of Gross Enrolment Ratio in classes I-V
and VI-VIII for Rajasthan and India is shown in the
following table for 2007-08:3
Primary (I-V)
Boys Girls
Total
Upper Primary (VI-VIII)
(11-13 years)
Boys Girls
Total
Rajasthan
All India
121.4 114.9
118.3
115.3 112.6
92.8 68.7
81.4
81.5 74.4
3 Economic Survey Survey 2010-11. GO1, P.A.- 120
37
114.0 78.1
The above table shows that the enrolment ration for
girls in Rajasthan is less as compared to India at the upper
primary level. The position with regard to the enrolment of boys
is better in Rajasthan as compared to the national level. But the
problem of dropouts is serious at the primary level and needs to
be tackled in the near future.
Moreover, the gross enrolment ratios in the State for SC and
ST people are much lower than the overall averages as shown in
the above table.
(V)Per Capital Income- Finally, we may have a look at the
per capita income or Rajasthan in relation to the per capital
income in India. At constant prices of 2004-05, the per
capita income of Rajasthan was Rs. 23,653 for 2009-10
while it was about Rs. 33,731 for the entire country (as
shown in the table, earlier). Thus, the per capita income
level in much less in Rajasthan as compared to India. But
there is ample potential for economic development in
Rajasthan, which can help in increasing the per capita real
income of the state in Future.
2.9 MAIN FACTORS RESPONSIBLE FOR SLOW
ECONOMIC PROGRESS OF RAJASTHAN
The aforesaid discussion indicates that Rajasthan economy
has been lagging behind Indian economy in various sectors
; such as agriculture, industry, Infrastructure-both economic
38
and social, etc. We must analyse the factors which have
been responsible for this state of affairs so that the state may
bridge up its gap with the national economy in future by
adopting suitable policy measures in this regard.
1 Economic Base of Rajasthan was Very Weak at the
start of Planning in 1951
Economic position of Rajasthan was very dismal in the
initial stages of planning. In 1950-51, the installed
capacity of power was only 13 MW, gross irrigated area
as a ratio of gross cropped area was only 12 per cent,
state had electricity in 42 places only and the road
mileage was 17,399 kms only. Industrial development
was not possible due to lack of roads, water supply and
electricity generation. There was lack of social services
as well, and educational and medical facilities were
lagging far behind the national average in different parts
of the state. In 1950-51, in the age group of 6-11 years,
the percentage of school going children was 16.6 per cent
,while in the age group of 11-14 years it was 5.4 per cent
only. The number of beds in hospitals for patients was
5,720, which was quite inadequate for the purpose.
With such low economic base, it was not possible to
make up the gaps in a short period of time. However,
during the plan-period significant improvements have

39
been made in several directions, which would be
discussed as we proceed further in our study in this book.
2 Adverse Geographical and Physical Conditions
As mentioned earlier, the state has desert area in 61 per
cent of the geographical area of the state, which is
frequently visited by famines and droughts. The surface
water resources of the state constitute 1 per cent of the
total surface water resources of the entire country. The
per capita expenditure on making basic services available
to the people in backward and remote areas is quite high.
Due to lack of adequate funds, development is adversely
affected.
Monsoon is uncertain in India, but it is more so in
Rajasthan. It leads to drastic fluctuations in agricultural
output in the state, more particularly in the output of
khariff foodgrains, which causes hardship to the people
from time to time.
3 High Growth Rate of Population
The growth rate of population in Rajasthan during 1991-
2001 was 28.41 per cent and in 2001-2011 it was 21.4
per cent. These growth rates are higher than the national
averages for the respective periods. The per capita
income and per capita availability of goods and services
have been adversely affected due to this single factor.
40
There is also some correlation between high population
growth rate and social backwardness of the state.
4 Problems Related with Groundwater in the State
Due to droughts water-table have been receding
continuously in the state. In some areas, water is brackish
and unfit for human and cattle consumption, and even for
agricultural purposes. People, particularly women-folk,
have to walk a long distance to fetch potable water in
some parts of the state. Due to excess use of groundwater
in recent years, some parts of the state may face a
situation of severe water-famine in the near future.
5 Social Backwardness
In 2001, the proportion of SC people in the state was
17.2 per cent and that of ST people it was 12.6 per cent.
With other backward class people, the proportion of
socially backward people in the population is likely to
exceed 30 per cent, which poses several problems for
the planners. Massive investments are needed to remove
the social and economic backwardness of these
communities. There are organizational problems too in
implementing the programmes for the upliftment of these
people.
6 Lack of Financial Resources
Although a lot of expenditure has been incurred during
the plan-period for making improvements in various

41
sectors of the economy, particularly in sectors like
power, irrigation and social services; yet further planned
development is constrained due to financial difficulties.
The total debt burden on the state at the end of March
2011 was a sum of Rs. 98,881 crore, which is likely to
cross the level of Rs. One lakh crore by the end of March
2012, this has increased interest burden on the state. We
shall study in the chapter on State Finances that revenue
deficits and fiscal deficits were high in earlier years,
there were revenue surpluses during 2006-07 and 2007-
08. But again revenue deficits and fiscal deficits started
rising from 2008-09 onwards. The state tried to improve
its fiscal situation under Fiscal Responsibility and
Budget Management (FRBM) Act of 2005. It has to
reframe the FRBM Act, again in the light of the changing
fiscal position of the State.
7 Poor Implementation of Plans
Although the Planning Department has been preparing
five year plans and annual plans in the state, yet high
level technical and academic work was not carried out on
state planning process in the past. Moreover,
decentralized planning could not take root in the state,
and there could not be proper coordination between local
resources, local manpower and local requirements of the
people. With the setting up of New Panchyati Raj

42
Institutions after the enactment of 73rd
constitutional
Amendment ACT in the State, a new situation during
1995-96, a new situation emerged in the state for better
planning at the grass-roots level. Time has come to give
a new orientation to the entire planning process in terms
of need-based local planning in the state. Planning at the
state-level need a new face-lift in terms of plan-
formulation, plan-implementation and plan-evaluation.
The state has to tackle issues related with:
(I) Power development in the private sector;
(II) Industrial development of backward regions;
(III) Agricultural development by spreading the use of
drip-irrigation and sprinkler-irrigation, and watershed
development as well as wasteland development
programmes;
(IV) Rapid development of mineral resources, roads
and cattle-wealth; and
(V) Increasing literacy rate, particularly in rural areas
for the women-folk.
The production and productivity need to be improved in
all the sectors of the economy so that problems of poverty,
unemployment and inequality may be tackled more effectively
during the next few decades in Rajasthan. The state possesses
potential for providing full employment to its people in future.
With large external assistance, particularly from the World Bank

43
for large project in agricultural and other sectors the state can
hope to build a bright future for itself, and thereby help in
accelerating the economic growth of the entire country.
2.10 SUMMING UP
The growth rate of population in Rajasthan during 2001-
2011 was 21.44 per cent, which should be reduced to less than 25
per cent in the near future. For this couple protection rate (CPR)
should be increased from the effective level of 46.4 per cent as on
31st March 2007 (as state earlier) to a much higher level in future.
We should reduce infant mortality rate and birth rate in years to
come. The literacy rate, particularly in the case of rural females,
should be increased and mean-age at marriage for girls should be
raised from about 15-16 years to about 21 years.
The birth rate in Rajasthan was 27.2 per thousand in 2009
which should be reduced to 20 per thousand in the next few
years. This level is not beyond our reach because it has already
been achieved in Karnataka (19.8 years), AP (18.4 years), WB
(17.5 years) and Maharashtra (17.9 years), in 2008. ‗ Raj Laxmi
Bond Scheme‘ and ‗Vikalp Scheme‘ should be implemented
quite vigorously to achieve success in the field of family planning
in the state. They should be made more popular through the
NGOs, private agency participation and people‘s participation in
future. They should be run as programmes not merely to control
child-births, but also as programmes for improving the welfare,
health and happiness of the common people in Rajasthan.