Embed Size (px)
Citation preview
8/9/2019 Socio Economic Profile of Farm Households in Polluted and Non Polluted Area in Coimbatore District
http://slidepdf.com/reader/full/socio-economic-profile-of-farm-households-in-polluted-and-non-polluted-area 1/8
IOSR Journal Of Humanities And Social Science (IOSR-JHSS)
Volume 20, Issue 3, Ver. IV (Mar. 2015), PP 26-33e-ISSN: 2279-0837, p-ISSN: 2279-0845.www.iosrjournals.org
DOI: 10.9790/0837-20342633 www.iosrjournals.org 26 | Page
Socio Economic Profile of Farm Households in Polluted and Non
Polluted Area in Coimbatore District
*Priya. K **Dr. S. Gandhimathi*Ph.D Research Scholar, Avinashilingam Institute for Home Science and Higher Education for Women,
Coimbatore-641043.**Assistant professor, Department of Economics, Avinashilingam Institute for Home Science and Higher
Education for Women, Coimbatore-641043.
Abstract: Agriculture and the allied sector is the major source of livelihood in India. It provides employment tomore than 50 percent of the rural population and contributes 14
percent to the Gross Domestic Product (GDP). Low yield per unit area across major crops has become aregular feature of Indian agriculture in recent years. This can be attributed to structural weaknesses of the
agriculture sector reflected in low level of public investment, environmental degradation, exhaustion of the yield potential of new high yielding varieties of wheat and rice, unbalanced fertiliser use, low seed replacement rate,an inadequate incentive system and post harvest value addition. Some of the other reasons that can be attributedto the low agricultural productivity in India are (i) Lack of irrigation facilities in major part of the cultivated
land; (ii) Small and fragmented land holding with the cultivators; (iii) Lack of timely availability of quality seeds, fertilizers for providing all major and minor nutrients for the crops and insecticides in many parts of thecountry; (iv) Lesser availability of photo period as compared to countries like those in Mediterranean sea areas
(Chakrabarty, 2011)
According to the National Agricultural Policy, India must achieve a growth rate of 3 – 4% per annum in
the agricultural sector and food grains production of 400 million tonnes by 2020. The question that is rarelyasked is: how will these growth rates and targets be achieved? The past strategies which ushered the greenrevolution of the 70s and 80s are no longer working. Thus, there is a need to identify and focus on new
strategies to achieve these goals. In areas that witnessed green revolution, the productivity levels are high, butover the past decade yields have been stagnating and in some cases even declining. Past sources of growth productivity (expansion in irrigation, increased use of fertilizers and chemicals for pest control) are no longerrelevant. Policy regimes which helped achieve increased productivity are now not only irrelevant but are alsocontributing negatively to resource quality. Any efforts to enhance and even maintain productivity of theseregions is totally linked to concerns of resource conservation. Evidence from several long-term experimentalsituational studies reveals that the quality of soil is declining. This is owing to declining soil organic matter
content due to intensive cultivation, which in turn adversely affects and limits the capacity of the soil to performvital functions, including maintenance of good physical properties, ability to retain and regulate supply of water
and nutrients, etc. Current nutrient management practices result in inefficient use of nutrients applied throughchemical fertilizers, resulting in increasing environmental problems, decline in the quality of groundwater,increasing emission of GHGs, etc. Current cropping patterns (rice – wheat) are also causing exploitation ofgroundwater resources, reinforcing that current agricultural practices and policies are contributing to fast
degradation of resource base and un sustainability of production systems.In this background, the environmental degradation is one of the most pronounced problem in
agriculture. The industrial pollution is a major cause of environmental degradation. The number of industries
had increased over a period of time which aggravates the environmental degradation. The study of socioeconomic profile of farm households is pre requirement for the study of impact of environmental pollution on
agriculture in Coimbatore district.
I. Introduction Agriculture and the allied sector is the major source of livelihood in India. It provides employment to
more than 50 percent of the rural population and contributes 14 percent to the Gross Domestic Product (GDP). Low yield per unit area across major crops has become
a regular feature of Indian agriculture in recent years. This can be attributed to structural weaknesses of theagriculture sector reflected in low level of public investment, environmental degradation, exhaustion of the yield potential of new high yielding varieties of wheat and rice, unbalanced fertiliser use, low seed replacement rate,
an inadequate incentive system and post harvest value addition. Some of the other reasons that can be attributed
8/9/2019 Socio Economic Profile of Farm Households in Polluted and Non Polluted Area in Coimbatore District
http://slidepdf.com/reader/full/socio-economic-profile-of-farm-households-in-polluted-and-non-polluted-area 2/8
Socio Economic Profile of Farm Households in Polluted and Non Polluted Area...
DOI: 10.9790/0837-20342633 www.iosrjournals.org 27 | Page
to the low agricultural productivity in India are (i) Lack of irrigation facilities in major part of the cultivatedland; (ii) Small and fragmented land holding with the cultivators; (iii) Lack of timely availability of qualityseeds, fertilizers for providing all major and minor nutrients for the crops and insecticides in many parts of thecountry; (iv) Lesser availability of photo period as compared to countries like those in Mediterranean sea areas(Chakrabarty, 2011)
According to the National Agricultural Policy, India must achieve a growth rate of 3 – 4% per annum inthe agricultural sector and food grains production of 400 million tonnes by 2020. The question that is rarelyasked is: how will these growth rates and targets be achieved? The past strategies which ushered the greenrevolution of the 70s and 80s are no longer working. Thus, there is a need to identify and focus on new
strategies to achieve these goals. In areas that witnessed green revolution, the productivity levels are high, butover the past decade yields have been stagnating and in some cases even declining. Past sources of growth productivity (expansion in irrigation, increased use of fertilizers and chemicals for pest control) are no longer
relevant. Policy regimes which helped achieve increased productivity are now not only irrelevant but are alsocontributing negatively to resource quality. Any efforts to enhance and even maintain productivity of theseregions is totally linked to concerns of resource conservation. Evidence from several long-term experimental
situational studies reveals that the quality of soil is declining. This is owing to declining soil organic mattercontent due to intensive cultivation, which in turn adversely affects and limits the capacity of the soil to performvital functions, including maintenance of good physical properties, ability to retain and regulate supply of water
and nutrients, etc. Current nutrient management practices result in inefficient use of nutrients applied throughchemical fertilizers, resulting in increasing environmental problems, decline in the quality of groundwater,increasing emission of GHGs, etc. Current cropping patterns (rice – wheat) are also causing exploitation of
groundwater resources, reinforcing that current agricultural practices and policies are contributing to fastdegradation of resource base and un sustainability of production systems.
In this background, the environmental degradation is one of the most pronounced problem inagriculture. The industrial pollution is a major cause of environmental degradation. The number of industries
had increased over a period of time which aggravates the environmental degradation. The study of socioeconomic profile of farm households is pre requirement for the study of impact of environmental pollution on
agriculture in Coimbatore district.
II. Methodology
The data for the study is primary in nature. The study was conducted in Coimbatore district of Tamil
Nadu. The data for the study is purely primary in nature. A multistage random sampling procedure was adoptedin selecting the sample. In the first stage, the area in which the industrial cluster located in the district was
identified. The Kurichi in Coimbatore district come under Coimbatore Corporation where the industrial clustersare located. In Kuruchi, there are two industrial clusters such as SIDCO and Private. Moreover the CentralPollution Control Board, Ministry of Environment and Forest, Government of India had declared Kurichi as one
of the critically polluted areas. Hence, Kurichi was selected. Similarly, Malumachampatti is also located in theSIPCOT industrial cluster. Hence Malumachampatti was selected in the next stage. The list and the address ofthe farm households were obtained from the Coimbatore corporation office for Kurichi and from
Malumachampatti Village Panchayat office for Malumachampatti Village. In the second stage, from the lists ofaddress provided by the respective administrative offices, 75 farm households located nearby the industrialestates were identified and selected.
This sample group is target group. The Kinathukadavu is one of the agriculturally developed blockfrom which the Kinathukadavu village was selected. The Kinathukadavu village was far away from the
industrial estates. From the Kinathukadavu village administrative office, the lists of address of the farmers werecollected. From the lists of farm households, 75 farm households were selected based on random sampling usingrandom number table in the next stage. This sample group is control group. Hence the sample size is 150 for the present study.
III. Results And DiscussionSocio Economic Profile Of Farm Households:
Social Characteristics of Farm Households:The social factors such as age and education of the farmer head, religion, caste, type of family and size
of family were analysed for head of the farm households in Polluted and Non-Polluted areas. The results
pertaining to the above social factors are shown in Table-1.

8/9/2019 Socio Economic Profile of Farm Households in Polluted and Non Polluted Area in Coimbatore District
http://slidepdf.com/reader/full/socio-economic-profile-of-farm-households-in-polluted-and-non-polluted-area 3/8
Socio Economic Profile of Farm Households in Polluted and Non Polluted Area...
DOI: 10.9790/0837-20342633 www.iosrjournals.org 28 | Page
Table-1 - Social Characteristics Of Farm Households In Polluted And Non-Polluted AreasCharacteristics Polluted area Non polluted area
Age (mean)* 50.88 49.533
Education (number)*
Secondary 28
(37.3)
31
(41.33)
Higher secondary 30(40) 31(41.33)
College 17
(22.7)
13
(17.3)
Religion (number)*
Hindu 65
(86.7)
66
(88.0)
Christian 10
(13.3)
9
(12.0)
Caste (number)*
Bc 48
(64.0)
10
(13.3)
Mbc 14
(18.7)
38
(50.7)
Obc 13
(17.3)
27
(36.0)
Type of family (number)* Nuclear 45
(60.0)
49
(65.3)
Joint 30
(40.0)
26
(34.7)
Size of family (mean) 4.33 4.44
Source: Field Survey, 2013
Note: * The details corresponding to Age and Education are for Head of the Farm households.
The average age of farm household head in polluted area was 51 years. Whereas in Non-Polluted areait was 50 years. It shows that there was no much difference in the age of the farmer head between polluted and
non-polluted areas. Highest percentage of farm household head had completed higher secondary education in both polluted and non-polluted areas. There were no illiterates in the sample. In the study area, more than 50 percentages of the farm households were Hindus. In polluted area, 64 percentage of the farm households were
belonging to backward class and 50.7 percentage of the farm households in the non-polluted areas were belonging to the most backward community. In both polluted and non-polluted areas, 60 percentage ofhouseholds had nuclear family system, less than 50 percentage of the farm households had joint family system.
The average size of family was four in both polluted and non-polluted areas.
Economic Characteristics Of Farm Households:The economic characteristics of farm households are discussed under the following heads:
1. Family income2.
Family Expenses
3. Savings4.
Livestock5.
Farm Assets
6. Farm Equipments
Family Income:The family income determines consumption expenses and investments pattern of farm households. The
table-2 shows the family income of farm households in polluted and non-polluted areas.
Table-2 Average Family Income Of Farm Households
In Polluted And Non-Polluted Areas
(Amount in Rs.)Farmer Category Polluted Area Non-Polluted Area
Marginal 57500 49000
Small 63158 71324
Semi – Medium 141700 113410
Medium and Large 167000 162140
TOTAL 122930 99133
Source: Field Survey, 2013
8/9/2019 Socio Economic Profile of Farm Households in Polluted and Non Polluted Area in Coimbatore District
http://slidepdf.com/reader/full/socio-economic-profile-of-farm-households-in-polluted-and-non-polluted-area 4/8
Socio Economic Profile of Farm Households in Polluted and Non Polluted Area...
DOI: 10.9790/0837-20342633 www.iosrjournals.org 29 | Page
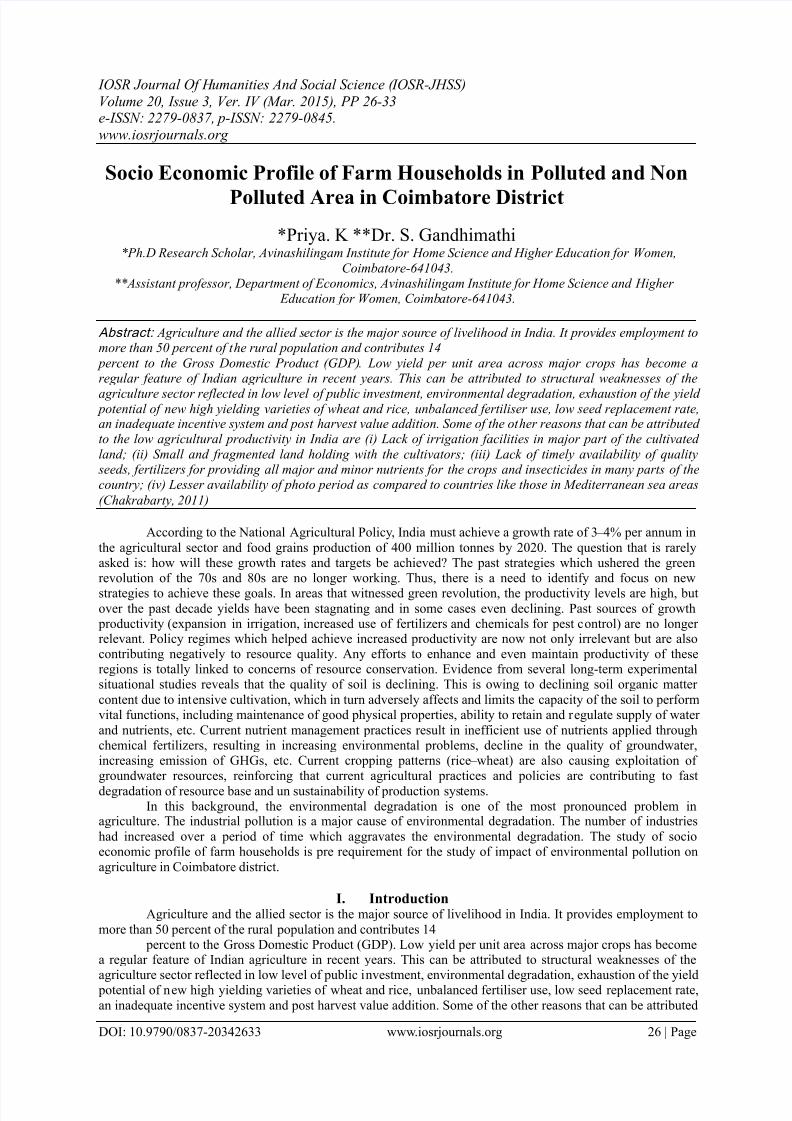
In polluted areas, higher amount of family income was observed for medium and large farmers. It wascomparatively higher than the other categories of farmers. Less amount of family income was observed formarginal farmers. In non polluted areas, higher amount of family income was for medium and large farmers.Comparatively less amount of family income was observed for marginal farmers.
Figure-1 Average Family Income Of Farm Households In Polluted And Non-Polluted Areas(Amount in Rs.)
Family Expenses:Family expenses are expected to be inversely related with family savings and investment pattern of
farm house holds. The table-3 shows the family expenditure of farm households in polluted and non pollutedareas.
Table-3 Average Family Expenditure Of Farm Households In Polluted And Non-Polluted Areas
(Amount in Rs.)Farmer Category Polluted Area Non-Polluted Area
Marginal 16500 22600
Small 14737 28794
Semi – Medium 20341 36409
Medium and Large 25500 39571
TOTAL 19507 32627
Source: Field Survey, 2013
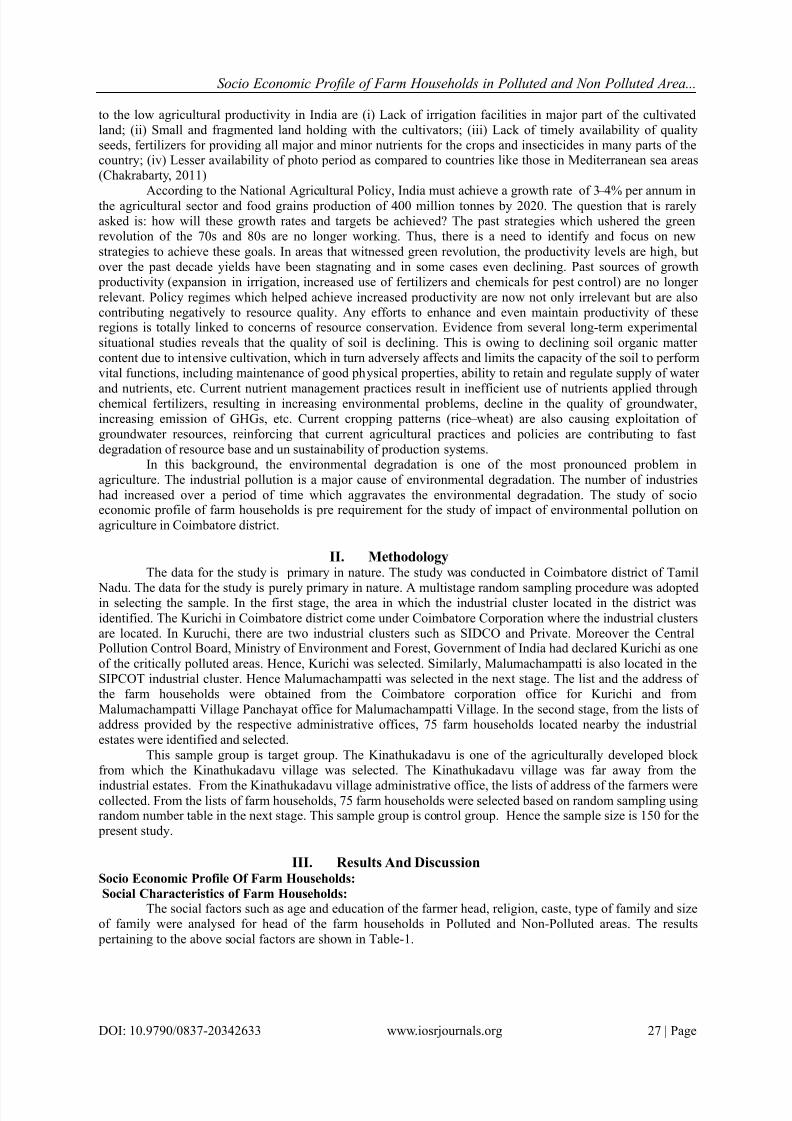
The average amount of family expenses for medium and large farmers was Rs. 39571 in non-pollutedarea. It was the highest amount compared to other categories of farmers. In polluted area also, the medium andlarge farmers had earned higher amount of family income.
Figure-2 Average Family Expenditure Of Farmhouseholds In Polluted And Non-Polluted Areas
(Amount in Rs.)
8/9/2019 Socio Economic Profile of Farm Households in Polluted and Non Polluted Area in Coimbatore District
http://slidepdf.com/reader/full/socio-economic-profile-of-farm-households-in-polluted-and-non-polluted-area 5/8
Socio Economic Profile of Farm Households in Polluted and Non Polluted Area...
DOI: 10.9790/0837-20342633 www.iosrjournals.org 30 | Page
Savings:The savings pattern of farm households determines the future investment in agriculture. The table-4
shows the average savings of farm households in polluted and non polluted areas.
Table-4 Average Savings Of Farm Households
In Polluted And Non-Polluted Area(Amount in Rs.)Farmer Category Polluted Area Non-Polluted Area
Marginal 35000 50000
Small 42632 11059
Semi – Medium 18625 17045
Medium and Large 10300 21071
TOTAL 13473 14280
Source: Field Survey, 2013
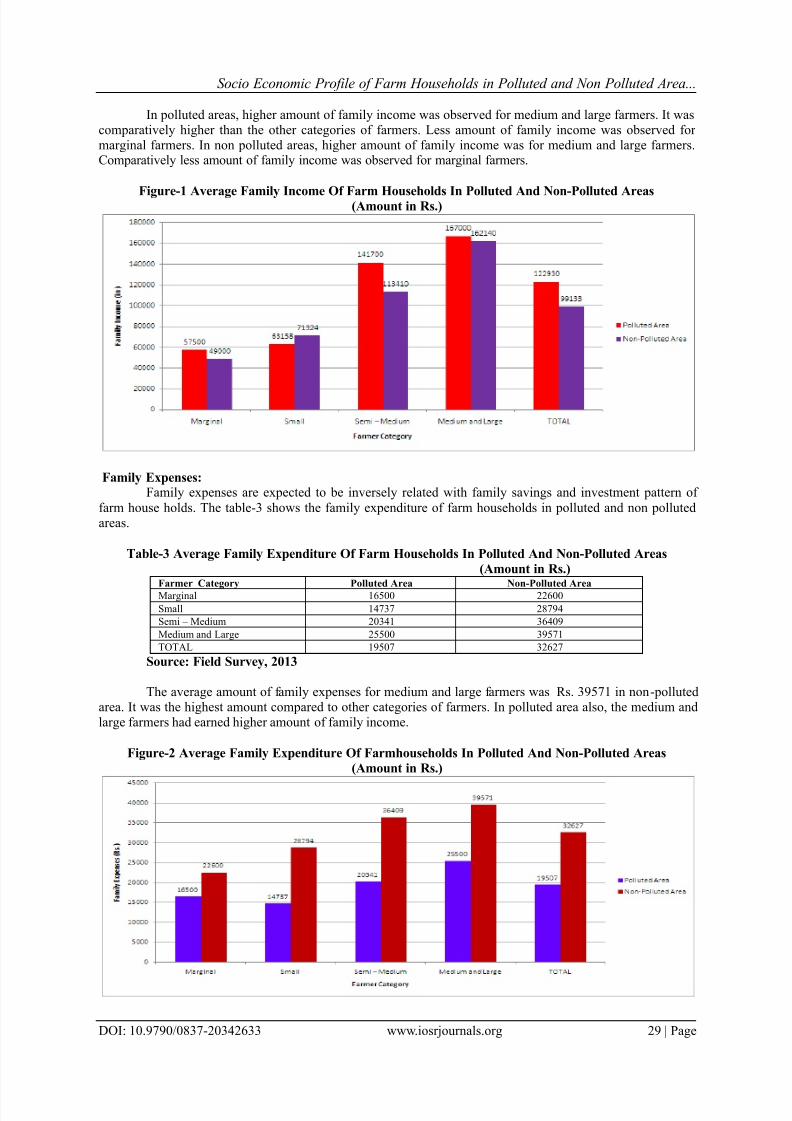
In polluted area, the average amount of savings was higher for small farmers. It was amounted to
Rs.42632. In non polluted area, the marginal farmers had higher amount of savings than the other categories offarmers. In total, on an average, higher amount of savings were observed in non polluted area (Rs. 14280) thanthe polluted area (Rs. 13473).
Figure-3 Average Savings Of Farm Households In Polluted And Non-Polluted Area
(Amount in Rs.)
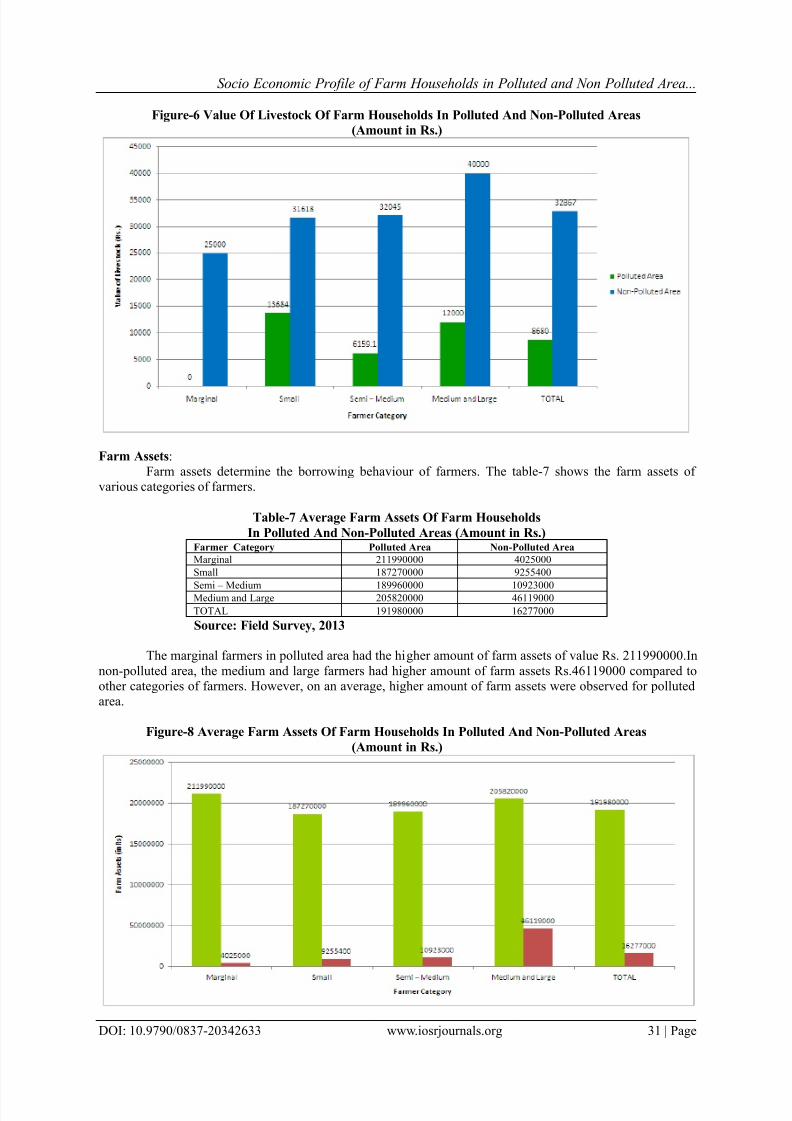
Livestock:
The farmer category wise value of livestock were calculated and is shown in table – 5
Table-5 Value Of Livestock Of Farm Households
In Polluted And Non-Polluted Areas (Amount in Rs.)Farmer Category Polluted Area Non-Polluted Area
Marginal 0 25000
Small 13684 31618
Semi – Medium 6159.1 32045
Medium and Large 12000 40000
TOTAL 8680 32867
Source: Field Survey, 2013
The value of livestock for small farmers in polluted area was Rs. 13684. No value of livestock wasobserved for marginal farmers in the same area. In non polluted area the value of livestock was amounted to Rs.
40000 for medium and large farmers. Only Rs.25000 was observed as the value of livestock for marginal
farmers in non polluted area. On an average, higher amount of value of livestock was observed for non pollutedarea than the polluted area.
8/9/2019 Socio Economic Profile of Farm Households in Polluted and Non Polluted Area in Coimbatore District
http://slidepdf.com/reader/full/socio-economic-profile-of-farm-households-in-polluted-and-non-polluted-area 6/8
Socio Economic Profile of Farm Households in Polluted and Non Polluted Area...
DOI: 10.9790/0837-20342633 www.iosrjournals.org 31 | Page
Figure-6 Value Of Livestock Of Farm Households In Polluted And Non-Polluted Areas
(Amount in Rs.)
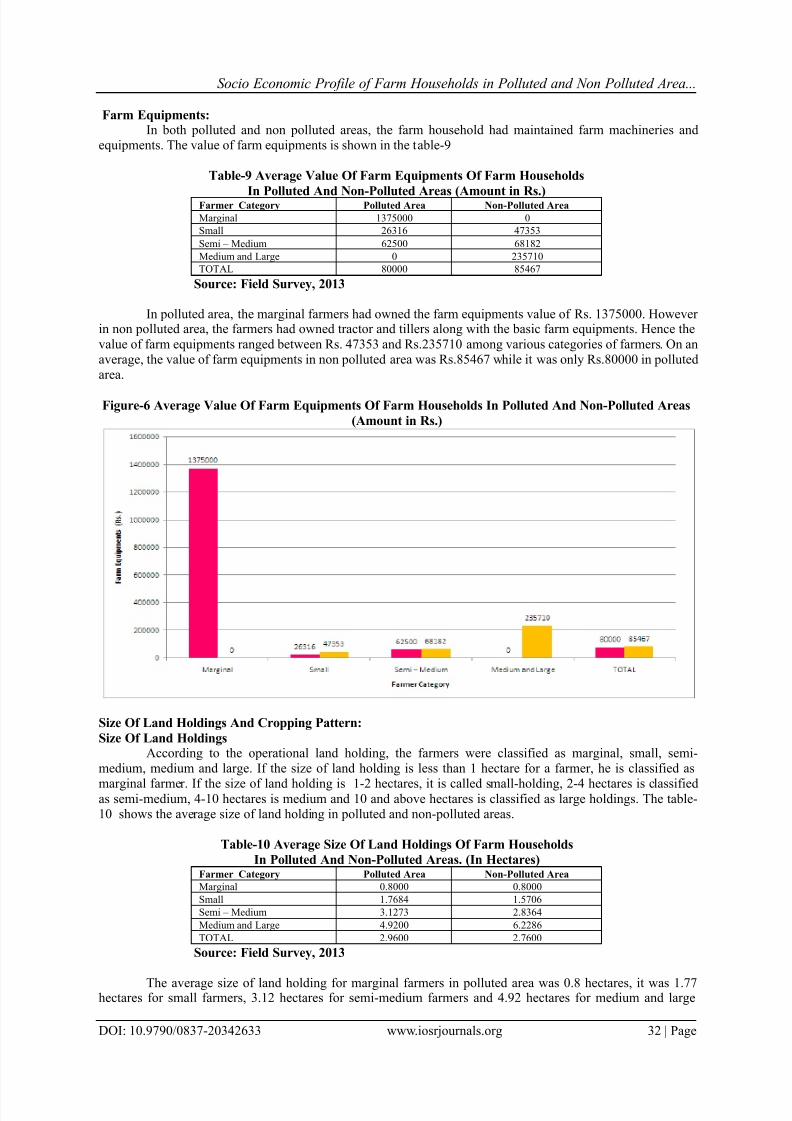
Farm Assets:Farm assets determine the borrowing behaviour of farmers. The table-7 shows the farm assets of
various categories of farmers.
Table-7 Average Farm Assets Of Farm Households
In Polluted And Non-Polluted Areas (Amount in Rs.)Farmer Category Polluted Area Non-Polluted Area
Marginal 211990000 4025000
Small 187270000 9255400
Semi – Medium 189960000 10923000Medium and Large 205820000 46119000
TOTAL 191980000 16277000
Source: Field Survey, 2013
The marginal farmers in polluted area had the higher amount of farm assets of value Rs. 211990000.In
non-polluted area, the medium and large farmers had higher amount of farm assets Rs.46119000 compared toother categories of farmers. However, on an average, higher amount of farm assets were observed for pollutedarea.
Figure-8 Average Farm Assets Of Farm Households In Polluted And Non-Polluted Areas
(Amount in Rs.)
8/9/2019 Socio Economic Profile of Farm Households in Polluted and Non Polluted Area in Coimbatore District
http://slidepdf.com/reader/full/socio-economic-profile-of-farm-households-in-polluted-and-non-polluted-area 7/8
Socio Economic Profile of Farm Households in Polluted and Non Polluted Area...
DOI: 10.9790/0837-20342633 www.iosrjournals.org 32 | Page
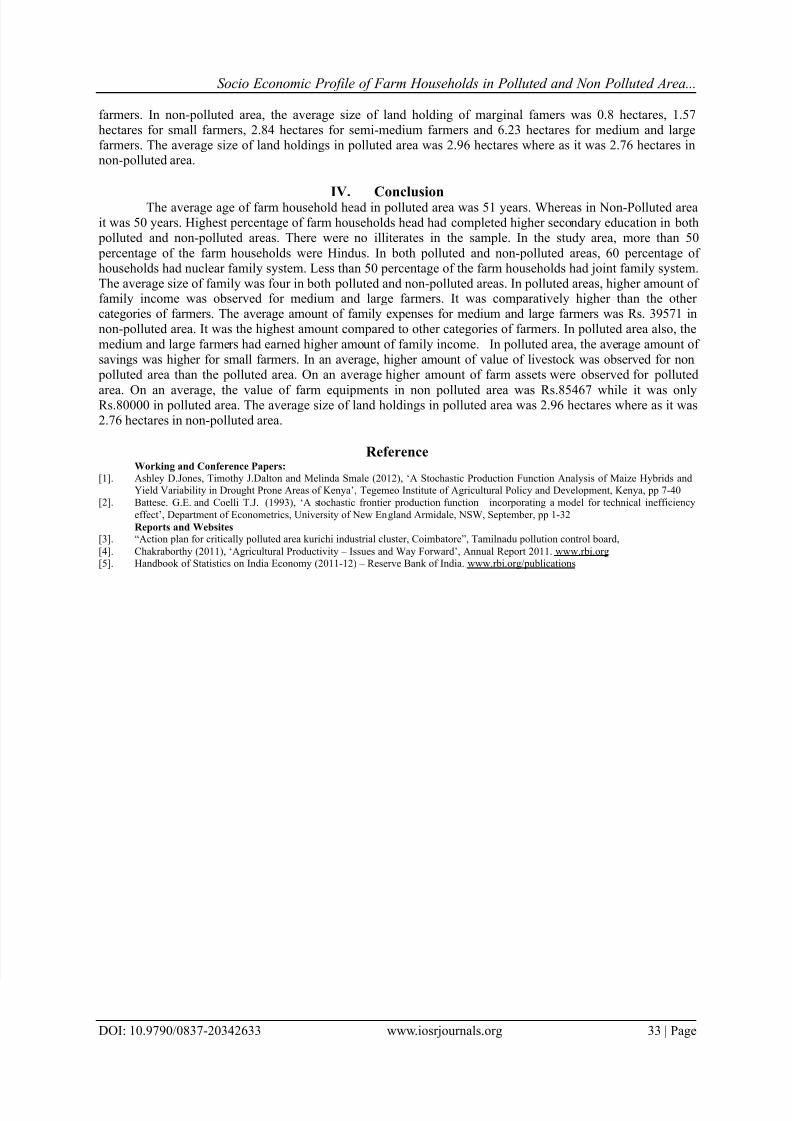
Farm Equipments:In both polluted and non polluted areas, the farm household had maintained farm machineries and
equipments. The value of farm equipments is shown in the table-9
Table-9 Average Value Of Farm Equipments Of Farm Households
In Polluted And Non-Polluted Areas (Amount in Rs.)Farmer Category Polluted Area Non-Polluted Area
Marginal 1375000 0
Small 26316 47353
Semi – Medium 62500 68182
Medium and Large 0 235710
TOTAL 80000 85467
Source: Field Survey, 2013
In polluted area, the marginal farmers had owned the farm equipments value of Rs. 1375000. Howeverin non polluted area, the farmers had owned tractor and tillers along with the basic farm equipments. Hence the
value of farm equipments ranged between Rs. 47353 and Rs.235710 among various categories of farmers. On anaverage, the value of farm equipments in non polluted area was Rs.85467 while it was only Rs.80000 in pollutedarea.
Figure-6 Average Value Of Farm Equipments Of Farm Households In Polluted And Non-Polluted Areas
(Amount in Rs.)
Size Of Land Holdings And Cropping Pattern:
Size Of Land HoldingsAccording to the operational land holding, the farmers were classified as marginal, small, semi-
medium, medium and large. If the size of land holding is less than 1 hectare for a farmer, he is classified as
marginal farmer. If the size of land holding is 1-2 hectares, it is called small-holding, 2-4 hectares is classifiedas semi-medium, 4-10 hectares is medium and 10 and above hectares is classified as large holdings. The table-10 shows the average size of land holding in polluted and non-polluted areas.
Table-10 Average Size Of Land Holdings Of Farm Households
In Polluted And Non-Polluted Areas. (In Hectares)Farmer Category Polluted Area Non-Polluted Area
Marginal 0.8000 0.8000
Small 1.7684 1.5706
Semi – Medium 3.1273 2.8364
Medium and Large 4.9200 6.2286
TOTAL 2.9600 2.7600
Source: Field Survey, 2013
The average size of land holding for marginal farmers in polluted area was 0.8 hectares, it was 1.77hectares for small farmers, 3.12 hectares for semi-medium farmers and 4.92 hectares for medium and large
8/9/2019 Socio Economic Profile of Farm Households in Polluted and Non Polluted Area in Coimbatore District
http://slidepdf.com/reader/full/socio-economic-profile-of-farm-households-in-polluted-and-non-polluted-area 8/8
Socio Economic Profile of Farm Households in Polluted and Non Polluted Area...
DOI: 10.9790/0837-20342633 www.iosrjournals.org 33 | Page
farmers. In non-polluted area, the average size of land holding of marginal famers was 0.8 hectares, 1.57hectares for small farmers, 2.84 hectares for semi-medium farmers and 6.23 hectares for medium and largefarmers. The average size of land holdings in polluted area was 2.96 hectares where as it was 2.76 hectares innon-polluted area.
IV.
ConclusionThe average age of farm household head in polluted area was 51 years. Whereas in Non-Polluted areait was 50 years. Highest percentage of farm households head had completed higher secondary education in both polluted and non-polluted areas. There were no illiterates in the sample. In the study area, more than 50
percentage of the farm households were Hindus. In both polluted and non-polluted areas, 60 percentage ofhouseholds had nuclear family system. Less than 50 percentage of the farm households had joint family system.The average size of family was four in both polluted and non-polluted areas. In polluted areas, higher amount offamily income was observed for medium and large farmers. It was comparatively higher than the othercategories of farmers. The average amount of family expenses for medium and large farmers was Rs. 39571 innon-polluted area. It was the highest amount compared to other categories of farmers. In polluted area also, the
medium and large farmers had earned higher amount of family income. In polluted area, the average amount ofsavings was higher for small farmers. In an average, higher amount of value of livestock was observed for non polluted area than the polluted area. On an average higher amount of farm assets were observed for polluted
area. On an average, the value of farm equipments in non polluted area was Rs.85467 while it was onlyRs.80000 in polluted area. The average size of land holdings in polluted area was 2.96 hectares where as it was2.76 hectares in non-polluted area.
Reference Working and Conference Papers:
[1].
Ashley D.Jones, Timothy J.Dalton and Melinda Smale (2012), „A Stochastic Production Function Analysis of Maize Hybrids and
Yield Variability in Drought Prone Areas of Kenya‟, Tegemeo Institute of Agricultural Policy and Development, Kenya, pp 7-40
[2]. Battese. G.E. and Coelli T.J. (1993), „A stochastic frontier production function incorporating a model for technical ineff iciency
effect‟, Department of Econometrics, University of New England Armidale, NSW, September, pp 1-32
Reports and Websites
[3]. “Action plan for critically polluted area kurichi industrial cluster, Coimbatore”, Tamilnadu pollution control board,
[4]. Chakraborthy (2011), „Agricultural Productivity – Issues and Way Forward‟, Annual Report 2011. www.rbi.org
[5]. Handbook of Statistics on India Economy (2011-12) – Reserve Bank of India. www.rbi.org/publications