Embed Size (px)
Citation preview

Munich Personal RePEc Archive
Socioeconomic correlates of mortality in
Pakistan
Mohammad, Irfan and Alam, I.
Pakistan Institute of Development Economics Islamabad Pakistan,
Population Division, ESCAP, Bangkok, Thailand
1986
Online at https://mpra.ub.uni-muenchen.de/38633/
MPRA Paper No. 38633, posted 07 May 2012 14:29 UTC

SOCIOECONOMIC CORRELATES OF MORTALITY IN PAKISTAN
M. Irian· and I. A/am··
INTRODUCTION
Although quantification of changes in mortality is precluded by lack .of a
proper data set, various sources of information suggest that there has been a
significant decline in mortality in Pakistan. Researchers seem to agree that
mortality reductions have been mostly confined to the pre-1965 period, and
that no significant progress has been made since then. On the basis of the
reproductive history data obtained from the Pakistan Fertility Survey (PFS)
1975, Alam and Cleland have concluded:
"The most important finding to have emerged from this analysis of
the PFS mortality is that infant and child mortality appears to have
stabilized around 1960 at a high level. Between 1960 and 1975 the
infant mortality has been a little under 150 deaths per thousand" I.
To the extent that these findings are not statistical artifacts, they underscore
the need to identify the factors responsible for this arrest in mortality decline.
It may be that the causes of mortality - the disease pattern - have changed or
that the health services have not yet reached the poverty-stricken and under
privileged groups of society; whatever the causes of the arrest, they have to be
investigated in order to plan for the earlier decline to resume. Admittedly it is
difficult to unravel the complicated interaction between the individual's
capacity to obtain health care and the government's efforts to improve health
through effective policy measures. However, there is little doubt that widespread
social and economic inequalities, including unequal access to health care, play
a major role.
This paper disc;usses socioeconomic mortality differentials in Pakistan on
the basis of data collected in 1979 from a nationally representative sample of
over lO,OOO households in a survey carried out for the Population, Labour
The views express herein are those of authors and do not necessarily reflect the views of Pakistan
Institute of Development Economics or of the United Nations.
·Chief of Research, Pakistan Institute of Development Economics, Islamabad, Pakistan.
··Population Division, ESCAP, Bangkok, Thailand.
c·

472
Force and Migration (PLM) project of Pakistan Institute of Development
Economics/International Labour Organization. In addition to the questionnaire
on fertility, three questionnaires - Income and Expenditure, Labour Force,
and Migration - were administered to each household. This data-set not only
affords a comparison with PFS 1975 but also permits a study of the relation
between income, land holding, tenurial status, and the mortality experience of
households. The mortality data obtained from the PLM survey are discussed
briefly in the first section of the paper; Mortality differentials by characteristics
of the child, mother, household and village are discussed in the second section.
Wherever possible, the findings of the PLM 1979 survey are compared with
thoseofPFS 1975.
INFANT MORTALITY -LEVELS AND TRENDS
Infant mortality rates obtained from PLM data for the period 1950-79 are
juxtaposed with those of PFS in Table 1. A comparison of the two surveys
suggests that deaths have been under-enumerated in the PLM since the PFS is
unlikely to have over-estimated the number of deaths. However, much more
investigation is needed before a firm conclusion can be reached. In both
surveys many of the dates for births and deaths of children have been estimated
by the use of a Date Edit Imputation and Recode programme. How far the
levels of mortality yielded by the two surveys are sensitive to such estimations
is not known. To complicate th!! problem, some researchers have noticed
misreporting of age upwards due to a tendency to advance the age to the next
higher digit. In addition, PFS estimates are much higher than alternative
sources of information such as Population Growth Survey (1968-71 and 1976).
Admittedly the PGS data can hardly be said to be free of error; their comparison
with PFS data reflects the margin of uncertainty associated with level of infant
mortality reported by any single survey such as PLM or PFS.
While it is difficult to determine which of the two surveys is the more
accurate, the trend appears to be simil for the five years immediately
preceding the surveys, both t e and the PLM indicate an apparently
spurious rise in these rates, which is presumably the converse of the same
phenomenon ·ch generates a decline in fertilit for the same period This
highlights the hazards involved in depen ing upon a smgle source for a set of
mortality data. If this statistical illusion is disregarded for the remaining
periods, neither the neonatal nor the postneonatal mortality rate has declined
significantly since the 1960-65 period. The earlier conclusion based on PFS
"that infant and child mortality appears to have stabilized around 1960" is
substantiated by PLM data. What has yet to be settled is the levela of mortality,
which has so far shown no response to health measures. This paper is concerned
aThe official figures are over 100. The data base of this figure is not fully known however.
;

473·
TABLE 1
Infant and Child Mortality Rate derived from the Population Labour Force and
Migration (PLM)a Survey 1950-1979 and the Pakistan Fertility Survey (PFS)b
Infant-CbDd Mortality Rate
Birtb 1950-55 1955-60 1960-65 1965-70 1970-74 1975·79 Cobort
PLM PFS PLM PFS PLM PFS PLM PFS PLM PFS PLM
lQ
O 160 178 137 157 125 141 116 136 115 145 124
NNR 93 94 84 85 72 81 70 78 69 84 83
PNNR 67 84 53 72 53 60 46 58 46 61 41
5% 273 305 237 258 197 205 176 200 157 207 168
lQ
O = Infant mortality rate
NNR = Neonatal rate
PNNR = Postneonatal rate
5% = Mortality up to age 5.
Source: apLM Survey 1979.
b Alam and Cleland. Infant and Child Mortality Trends and Determinants.
mainly with the assessment of mortality differentials by socioeconomic
characteristics, and not with the determination of levels and trends. The
examination of differentials permits the identification of measures to reduce
them and thereby to reduce the overall mortality levels in the country.
MORTALITY DIFFERENTIALS
This section examines mortality differentials by demographic correlates, to
be followed by correlates of socioeconomic and macro-level policy intervention.
Such demographic variables as mother's age at birth, order of birth, and
preceding birth interval constitute some of the important associates of infant
. mortality. The association between infant mortality and mother's age at birth
as shown in Table 2 indicates a U-shaped relationship. The risk of death is
higher at younger and older ages than in the middle-age groups. The trend is
more sharp for neonatal mortality rates than for postneonatal rates. The PLM
results are at variance with those of PFS in that the latter did not suggest lower
survival probability at older maternal ages. The PLM results are consistent
with those of studies on other countries2 and this suggests that neonatal
mortality may not be the sole factor involved in higher risks of death at younger
ages. 1

474
TABLE 2
Infant Death by Mother's Age at Birth: PLM 1979
Years Prior to Survey
Mother's Age 0-4 5·9 10-14
Less than 20 years
Neonatal mortality rate 103.0 118.6 105.4
Postneonatal mortality rate 51.0 58.1 46.7
Infant mortality rate 154.0 176.7 152.0
20 to 29 years
Neonatal mortality rate 68.6 63.4 66.9
Postneonatal mortality rate 41.6 43.2 50.0
Infant mortality rate 1l0.2 106.7 116.9
30 to 39 years
Neonatal mortality rate 83.8 58.4 62.1
Postneonatal mortality rate 46.6 44.9 32.4
Infant mortality rate 130.3 103.3 94.5
40 or more years
Neonatal mortality rate 112.5 77.4
Postneonatal mortality rate 62.6 56.7
Infant mortality rate 175.1 134.1
Source: PLM Survey 1979.
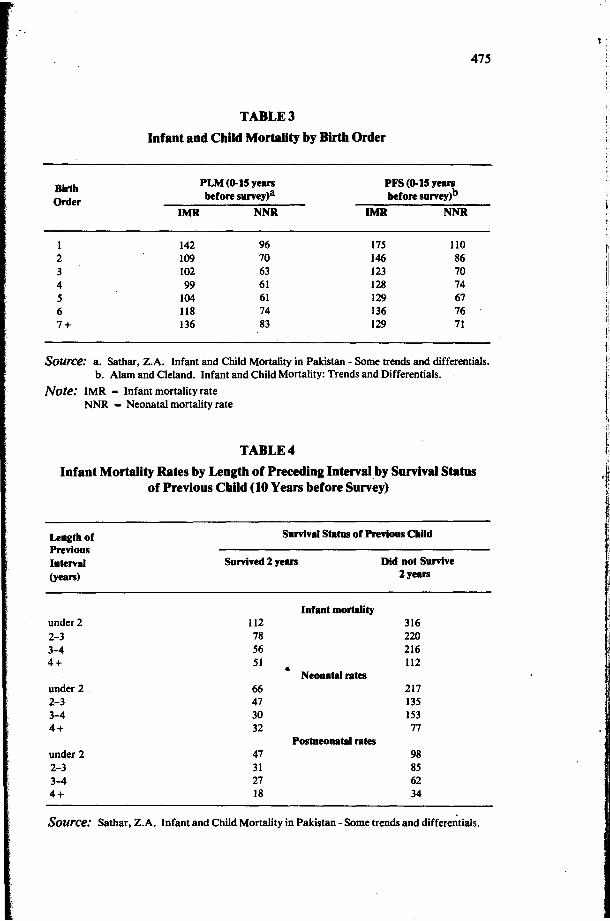
The relation between birth order and the probability of survival of a child generally mirrors that of the association between mother's age and infant
mortality. As shown in Table 3, according to PLM there is an inverse association between risk of death and birth order up to the fourth child, thereby reversing
the direction of association that suggests a lower probability of survival at higher-order births. By contrast, the PFS data fail to exhibit any systematic
association between birth order and infant mortality rate beyond the secondorder birth. Both surveys, however, show that first births are at highest risk of
death.
The influence of preceding birth interval on the infant mortality rate in
Pakistan is well documented. The negative association of the length of the preceding interval with mortality of the index child was found to persist despite controls for age, education and residence of mother, birth order and survival status of the preceding child.3
Table 4 shows the association between
length of previous birth interval and the infant mortality rate, controlling for
the survival status of the older sibling. For a specific survival status there is a negative association between infant mortality rate and length of the preceding birth interval. However, holding constant the preceding birth interval, there
appears to be a positive association with survival probabilities of siblings, but
Birth
Order
1
2
3
4
5
6
7+
475
TABLE 3
Infant and CbUd Mortality by Birtb Order
PLM (0-15 years PFS (0-15 years
before survey)a before survey)b
IMR NNR IMR NNR
142 96 175 110 109 70 146 86 102 63 123 70
99 61 128 74
104 61 129 67
118 74 136 76
136 83 129 71
Source: a. Sathar, Z.A. Infant and Child Mortality in Pakistan - Some trends and differentials.
b. Alam and Cleland. Infant and Child Mortality: Trends and Differentials.
Note: IMR - Infant mortality rate
NNR = Neonatal mortality rate
TABLE 4
Infant Mortality Rates by Lengtb of Preceding Interval by Survival Status
of Previous Cbild (10 Years before Survey)
Length of
Previous
Interval
(years)
under 2
2-3 3-4 4+
under 2
2-3 3-4 4+
under 2
2-3 3-4 4+
Survival Status of Previous Child
Survived 2 years
112 78 56 51
66
47 30 32
47 31
27 18
Infant mortality
• Neonatal rates
Postneonatal rates
Did not Survive
2 years
316 220 216 112
217 135 153
77
98 85 62 34
Source: Sathar, Z.A. Infant and Child Mortality in Pakistan - Some trends and differe~tials.

/
476
it is difficult to determine whether this correlation is due to genetic factors or
to selectivity arising from the distribution of privilege and economic opportunities.
SOCIOECONOMIC CORRELATES OF MORTALITY
Parental characteristics such as education and social status in the community influence the survival probabilities and health status of household members.
How socioeconomic factors affect mortality is not very obvious, however. To
clarify the effects of socioeconomic differentials on mortality, a closer scrutiny is needed of the nature of the interaction between an individual's capacity to
derive benefits from health services and the existence and delivery of these
services. To the extent that resources are allocated for purposes of development,
the distribution of health facilities reflects the influence of certain communities, classes and regional power groups. A disproportionate allocation to urban
areas in the developing world, therefore, may reflect an urban-biased development strategy, which results in higher infant mortality in rural areas.
Within a community the availability of a service designed to reduce the public's exposure to disease may have a differential impact even if the service is free and available to all. Differential participation may be explained either
by differences in individual behaviour such as risk-taking or by discrimination or neglect on the part of government officials responsible for the delivery of these services. In a village, landlords or the well-to-do will receive better
services than the labourer, whose goodwill government servants least need.
These services, being free, with no cost to the consumer other than travelling time, are often regarded as having an impact separate from that of household
behaviour.4 In the cultural setting, where the human agent takes account of
socioeconomic status in the administration of these services, the association between benefitting from the services and household socioeconomic status cannot be ruled out, even though this association may emanate from the supply side.
Equally it is very difficult to identify whether a facility is truly free. To the extent that the chances of being admitted to hospital or to a bed in a ward
depend upon the patient's visit to a doctor's private clinic, it can hardly be considered free access. In addition to these "free" services, the subsidized
services are expected to be demanded differentially by people with different abilities and attitudes. Differentials in mortality and morbidity are therefore,
products of a variety of factors on both the supply and the demand side.
Systematic variation in mortality across socioeconomic groups is Pakistan has been the subject of earlier studies. In a suburb of Lahore, family income
was found to be the only independent variable besides duration of marriage that acquired statistical significance in the explanation of the dependent

477
variable - child mortality. 5 In a recent study of a low-income area of Karachi,
family income and duration of breast-feeding were found to be the significant
explanatory variables of child mortality. 6 In addition to these small-area
studies, the mortality determinants were assessed on the basis of nationala
data by Ali Khan and Sirageldin.7 In the framework of a simultaneous equation estimation, births, deaths, income, and participation of females in
the labour force were endogenously explained. Time taken to reach a medical
facility was the only significant variable in the rural area mortality equations. In the case of urban areas, time, female age, age at marriage and family
structure (nuclear or extended) emerged as significant. It was interesting that
parental education failed to qualify as a significant explanatory variable of
child mortality in the above-mentioned analyses of infant and child mortality. However, the studies based on PFS 1975 data found educational level of both
mother and father to be an important factor influencing infant mortality. Bivariate relationships between a few socioeconomic variables and infant
mortality as shown by PLM data are briefly discussed below.
PARENTAL EDUCATIONb
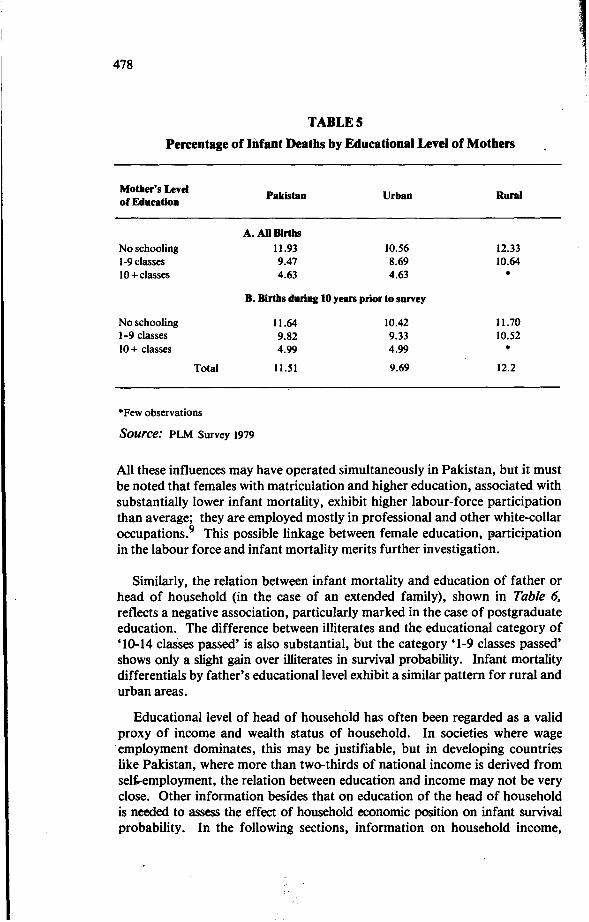
The relation between mother's level of education and infant mortality (proportion of infants who died) yielded by PLM data is shown in Table 5.
The proportions of infants who died appear to be inversely related to level of education, but major change is associated with mothers who have matriculation
and higher education. The pattern of differential is similar for mortality based on all births and births during the 10 years prior to the survey (Panel B).
The probab.ility of survival of infants born to mothers with a higher level of education (10 classes or higher) is two and a half times the average and
slightly less than double the probability of the next lower education level (1-9 years of classes). Indeed the recent mortality differential between illiterates
and that of 1-9 years of mother's education is marginal. A closer focus on PLM data reveals that these differentials by educational level of mother are
not only carried over to childhood mortality (4q l) but also are enhanced.
Various explanations of the effect of mother's education on infant mortality
are found in the literature. Educated mothers may be more efficient in producing health capital than illiterate mothers. Female education may indicate a household's social status or it may act independently, as suggested by Caldwell.8
aNational Impact Survey (NIS) 1968.
byears of education are grouped according to certificates required for entry into different cadres
of jobs. Matriculation (10 classes) qualifies for entry into clerical jobs, while graduate (14
classes) confers entitlement to professional and administrative employment. Less than matricu1ation
(1-9), however, hardly permits access to white-collar jobs, but is preferred to illiteracy because of
the literacy associated with this level.
" ! ~
478
TABLES
Percentage of Infant Deaths by Educational Level of Mothers
Mother's Level
of Education
No schooling
1-9 classes
10+ classes
Pakistan
A. All Births
11.93
9.47
4.63
Urban
10.56
8.69
4.63
B. Births during 10 years prior to survey
No schooling
1-9 classes
10+ classes
Total
*Few observations
Source: PLM Survey 1979
11.64
9.82
4.99
11.51
10.42
9.33
4.99
9.69
Rural
12.33
10.64
*
11.70
10.52
* 12.2
All these influences may have operated simultaneously in Pakistan, but it must
be noted that females with matriculation and higher education, associated with substantially lower infant mortality, exhibit higher labour-force participation
than average; they are employed mostly in professional and other white-collar
occupations.9 This possible linkage between female education, ~articipation in the labour force and infant mortality merits further investigation.
Similarly, the relation between infant mortality and education of father or
head of household (in the case of an extended family), shown in Table 6,
reflects a negative association, particularly marked in the case of postgraduate education. The difference between illiterates and the educational category of
'10-14 classes passed' is also substantial, but the category '1-9 classes passed' shows only a slight gain over illiterates in survival probability. Infant mortality differentials by father's educational level exhibit a similar pattern for rural and
urban areas.
Educational level of head of household has often been regarded as a valid
proxy of income and wealth status of household. In societies where wage . employment dominates, this may be justifiable, but in developing countries
like Pakistan, where more than two-thirds of national income is derived from sel,"employment, the relation between education and income may not be very
close. Other information besides that on education of the head of household is needed to assess the effect of household economic position on infant survival
probability. In the following sections, information on household income,
.~ !

•
l
479
TABLE 6
Percentage of Infant Deaths by Educational Levels of the Head of Household
Educational Level of Pakistan Urban Rural
Head of Household
No schooling .
12.47 10.70 12.87
1-4 classes 11.98 10.79 12.53
5-9 classes 11.10 10.10 11.64
10-14 classes 8.31 7.43 10.19
14+ classes 3.86 3.86 •
·Fewobservations
Source: PLM Survey 1979
land, tenurial status and occupation of the head of household available from
the PLM survey is used to determine the influence of these variables on the
infant mortality rate.
HOUSEHOLD INCOME
A higher level of income is expected to be associated with a higher expenditure
on food, shelter and sanitation and this can have a positive influence on
~rvival of household members. These possible links between household
income and infant mortality may be difficult to assess from cross-sectional
data because of the incongruence between the temporal reference of the data
on current income and mortality - a life-cycle phenomenon. Moreover, a
household's income may very well partly reflect past mortality. The consequences
of infant mortality on the size and structure of family, and the resultant
dependency load and earning potentials at different phases of the family life
cycle, are not very well explored in the literature. In addition, income data
collected by means of surveys are generally affected by measurement errors.
The bivariate association between household income and infant mortality
provided in Table 7 therefore needs to be interpreted with caution. The table
indicates a positive influence of household income on the survival probabilities
of infants. The lowest income group has an infant mortality rate which is 75 %
higher than that of the highest. This differential is slightly narrowed (64%) in
the case of births during the 10 years prior to the survey. It is of interest that
the infant mortality differentials are sharper in urban areas than in rural areas;
the relative gain associated with the two higher income groups is less visible in
rural areas. Rural-urban differentials persist after controlling for income
level of the household and tend to become larger for higher income groups.
As regards recent mortality experience, rural/urban differentials for the two
lower income groups are minimal.
i
I! I:
!I t: l I . i
i
"~I ·1
1 I

480
TABLE 7
Percentage of Infant Deaths by Household Income
Income Group Pakistan Urban Runl
(Rs. per month)
A. All Births
1-500 16.4 11.30 17.0
501-1200 11.7 11.0 12.0
1201-2800 9.8 8.0 11.0
2800+ 9.4 7.0 •
B. Births during 10 years prior to survey
1-500 13.4 13.55 13.37
501-1200 12.25 10.67 11.40
1201-2800 9.41 8.11 10.29
2800+ 8.19 8.19 •
·Few observations
Source: PLM Survey 1979
It is difficult to explain the variation between rural and urban areas in the
direction and level of the effect of household income on infant mortality. The
possibly greater measurement error in income and recall error in mortality ill
rural than in urban areas, and the greater availability of health facilities in
urban areas, may have some influence on the relation between income and
mortality. In addition it may be recalled that it is the permanent, not the current income which is expected to influence household behaviour. The
computation of permanent income on the basis of information on current
income, age, and education of earners, as done in many research studies, is
not attempted here because of the predominance of self-employment, in which
the role of assets in the determination of income is of paramount importance.
OCCUPATION OF FATHERS
There is little information on assets, apart from data on area cropped by a
household in a rural farming population. For urban and rural non-farming
households, the occupation of fathers or heads of households is used instead
as an indicator of socioeconomic status. The bivariate relation between infant
mortality and father's occupation shown in Table 8 reveals that children born
to fathers in white-collar occupations enjoy a substantially higher survival
probability than those of the blue-collar workers in urban areas; the latter
have a mortality rate that is 32 % higher than that of infants belonging to the
former group. When occupation as a variable is controlled, the employment
'. :. 'a '
•

481
status of fathers or heads of households appears to have some influence.
Lower infant mortality is associated with employers, but a substantial difference
occurs only in the case of employers in the occupational group of professionals,
a very small and select group. The standard occupational classification used in
the table is very aggregative in that primary school teachers are included with
engineers and classified as professional despite the wide difference in their
income and socioeconomic status. In the case of rural areas, where this
classification would be less relevant, the classification is based on the usual
occupations, which can be regarded as more suitable proxies of income and
socioeconomic status in the non-farming population.
TABLE 8
Percentage of Infant Deaths to All Births by Employment Status
and Occupation of Head of Household - Urban Areas
Occupational group Employers Selfemployed Employees Total
Professionall 1.8 12.44 8.69 8.69
administrative
Clerical, sales 11.29 10.07 10.39 10.39
and services
Production worker 9.51 12.18 1l.38 11.48
and others
Source: PLM Survey 1979.
The relations between usual occupation of head of household and infant
mortality in rural non-farming households, presented in Table 9, indicate that
major differentials appear between the kameesP and handicraft workers and
the remaining groups. Kamees, who are generally at the bottom of the status
ladder in rural areas, have 200/0 higher infant mortality than average. The remaining three groups - shopkeepers, rentier class, and others - are indistingui
shable.
aKamees usually refer to artisan class such as shoemaker, tailor, potter, blacksmith in the village.
This class is generally subservient to farmers and held in low esteem in the village.
,I
"I; !
1~
I"

482
TABLE 9
Percentage of Infant Deaths to All Births by Usual Occupation
and Employment Status of Head of Household-Rural Non-Farming
Population
Usual Occupational Employers Selfemployed Employees Otbers& Total
Categories not working
Kamees, cottage and 13.6 15.1I 12.80 14.05 15.00
handicraft workers
Industrial workers and • 6.35 15.08 11.74 14.77
other employees
Shopkeepers 15.82 11.47 13.38 18.12 11.71
Landlords and other 11.74 10.98 • 13.94 12.05
rentier class
Undefined categories 13.1I 12.57 11.87 11.38 11.97
·Fewobservations
Source: PLM Survey 1979
LANDHOLDING
The relations between landholding, tenurial status and infant mortality for
the farm population in rural areas presented in Table 10 fail to reflect any
substantial differential across either land-size categories or tenurial status of
fathers except for the noticeably higher mortality associated with landless
agricultural labour, which indicates a 250/0 higher infant mortality than the
rest of the classes. The difference between the survival probabilities of infants
of the owner operator and sharecropper is very little. However, data on land
pertain to the operational holding and not to ownership. Also, the absence
of systematic variation appears to be partly due to the age structure of females.
For instance, a detailed examination of the data indicates that infant mortality
is associated with land size of 5-10 hectares (12.6 to 25 acres), which is lower
than that associated with larger farm sizes, is due to the disproportionate
share of younger mothers in this group. Also, the quality of land, such as
its accessibility to irrigation facilities and tractors, is not controlled. The
above results suggest that the groups generally regarded as lowest in the
class-ridden rural areas - agricultural landless labourers and kamees-experience
around 20-25 % higher infant mortality rates than average.
-....

483
TABLE 10
Infant Mortality by Cropped Area and Tenurial Status of Household:
Rural Areas
(All Births)
Tenurial Status
Cropped Area Total
Owner Sharecropper Agricultural (hectares) Operator Landless Labour
Less than 5 hectares 13.07 13.53 12.09
5-10 hectares 11.23 11.67 9.70
10 hectares and above 12.44 12.44 *
Total 12.92 12.84 11.37 15.46
*Few observations
Source: PLM Survey 1979
Whether the presence or absence of a medical facility in the village has an
effect on the survival probabilities of the infants can be infered from Table 11.
In the case of all births the presence of a health facility such as hospital or
dispensary is not associated with a substantial lower mortality. In the case
of recent births (10 years prior to survey), which also coincides with the
continued existence of these health facilities, some mortality differentials
appear. The gain in survival probability of an infant living in a village with a
hospital or dispensary over that of an infant living in a village without these
facilities is little-SOlo to 12%-compared with the differentials associated with education, income or occupation.
MULTIVARIATE ANALYSIS
To investigate the stability of the association between infant mortality and
the foregoing variables a multivariate regression analysis was performed.a
These exercises are discussed elsewhere in detail; their major results pertaining
aAs the dependent variable was the proportion of children who died at up to one or two years of
age, the proper estimation technique would have been logit or probit. Since the package was not
available, Ordinary Least Squares was applied. The estimated model explained 12% of the
variation in the dependent variable in urban areas and 22% in rural areas. Given the cross
sectional nature of the data, the results are not necessarily discouraging.
1
!"I
I

484
TABLE 11
Percentage of Infant Deaths by Presence/ Absence of Healtb Facility
in tbe Villages
Hospital
Dispensary
Hospital
Dispensary
Yes
A. All Births
12.0
12.0
No
12.3
12.4
B. Births during 10 years prior to survey
11.0 11.8
11.8 12.5
Source: PLM Surey 1979.
to the variables of interest are presented below. Most of the bivariate associa
tions discussed above emerged as significant in the mUltiple regression analysis.
For instance, a demographic variable such as female age has a significant non
linear relationship, which implies that infant survival probabilities are lower at
either end of the reproductive span - a result consistent with those obtained in
a number of other countries2. Similarly, duration of breast-feeding during
the last closed birth interval reflects a significantly negative association with
infant mortality. It must be noted that length of breastfeeding may be picking
up the influence of preceding birth interval, which is not reckoned in the
estimating equations.
All levels of parental education have an expected negative association with
infant mortality. However, the conventional significance is acquired by the
binary variable denoting the higher educational level of matriculation and
above (10 classes or more). These results pertain to rural as well as urban
areas, and also to both total and recent mortality. They also hold for both the
dependent variables - proportion of infants (0-11 months) and proportion of
children (0-23 months) who died. The partial regression coefficients of
mother's as well as father's education is shown in Table 12.
Table 12 suggests a greater responsiveness of infant survival probability to
the mother's education than to the father's. Similarly, a large effect appears
to be associated with mothers residing in rural areas.
Since household income and demographic characteristics of mothers were
controlled in the regression equation, the explanation of the significant
association of parental education (10 or more classes) may be that these highly

TABLE 12
Partial Regression Coefficient of Mother and Father Education
(10 classes or more).
485
Dependent Variables Births during 10 Years Prior All Births Proportion Infant
Died
Urban Areas
Rural Areas
* Significant at 5 %
**Significant at 10%
Mother
-.06*
-.OS*
to Survey
Father Mother Father
-.03* -.06* -.02*
-.02'" -.OS* -.03*
educated parents are more efficient in the production of health capital or that
they make more use of the free and subsidized medical services than the less
educated. Moreover, as already mentioned, this level of education (10 classes
or more) qualifies for entry into white-collar occupations. The possible links
between job structure, education (credentialism), and infant mortality is not
very well explored and needs further investigation. The effect of wage level
could not be separated from that of education to assess the importance of
participation in the labour market, particularly by females, because the
preponderance of self-employment does not permit the computation of wages
for females as well as males.
HOUSEHOLD INCOME
Household income emerged as a significant negative association with infant
mortality. Elasticities of infant and child mortality with respect to household
income are shown in Table 13.
On thewhole, the probability of infant survival does not reflect very high
responsiveness to household income. For instance, doubling of average
household income in urban areas results in a lowering of the infant mortality
rate from 100 to 80. Given that there is a lower limit to the mortality rate,
even this change in mortality rate can hardly be regarded as insignificant. In
addition, it must be noted that current income used in the estimating equations
is not an adequate explanatory variable; permanent income should be used
instead. The significance of the income variable has been reported to be
substantially improved for Colombia when permanent rather than current
income was used as an explanatory variable.4

486
TABLEt3
Elasticity of Infant and Child Mortality with Respect to Household Income
Dependent V mables
Proportion Died
Urban Areas
Rural Areas
*Significant at 5 %
All Births
0-11 Months 0-23 Months
-0.20* -0.22*
-0.14* -0.14*
Births during 10 Years Prior to Survey
0-11 Montbs O-23'Montbs
-0.18* -0.19*
-0.12* -0.12*
Whether the social status of head of household - when household income,
parental education and demographic variables are held constant - has any
influence of infant mortality is ascertained by incorporating a binary variable
for kamees and landless labour. Both variables indicate a positive association,
but with acquired statistical significance at the margin (10%). This suggests
discrimination on the supply side of the delivery mechanism, but more refined
studies are needed to arrive at a conclusive finding.
The effects of the above-mentioned parental and household characteristics
on survival probability of infants and children were assessed with some control
for environmental variables. In the case of urban areas the only developmental
or environmental variable studied was location of household in the metropolitan
cities of Karachi and Lahore. Infant mortality was found to be significantly
lower in these large cities than in the other urban areas. Obviously, general
development, which includes also housing, sanitation, water availability, and
private and public health facilities, explains the lower mortality rates of the
metropolitan centres. .
In the case of rural areas, the influence of the presence of public health
facilities in the village was assessed. It is of interest that the variable, hospital
or dispensary in the village, showed no significant association with infant
mortality. The failure of the presence of health facilities to emerge a significant
explanatory variable in the multivariate analysis needs to be interpreted with
care. The presence of a hospital and a dispensary in a village is hardly evidence
that the residents of that village make more use of them than those of the
next village. In this respect also it appears that the distribution and location of private and informal health services such as medical doctors, hakims, homoe
opaths and aids are more important than tbe presence of a hospital and a
dispensary. The non-significance of the binary variable denoting the existence
of health facilities in the village sug~ests that these facilities fail to have a
,

r
487
significantly different effect on infant mortality from the effect of the tradi
tional and private facilities. Even this result may be regarded as only tentative
until the use of these facilities is investigated in more depth.
CONCLUSION
That infant and child mortality appears to have stabilized around an
inordinately high level presents a challenge both to policy makers and to
researchers in Pakistan. Apparently either the disease pattern has changed or
the delivery mechanism of health facilities has yet to make inroads into under
privileged sections of society. By examining the infant mortality differentials
across various socioeconomic groups in urban and rural areas of Pakistan, this
paper provides some explanations of the complicated interaction between the
individuals's capacity to derive benefits and the existence of public facilities.
The analysis of infant mortality differentials is extended beyond demographic
variables to include such factors as household income and usual occupation of
head of household. Consistent with earlier studies on Pakistan and other
developing countries, demographic variables such as mother's age, preceding
birth interval, and birth order have been found to be important correlates of
infant mortality. Parental education, however, reflects a negative association
with mortality; the bivariate finding holds only for the higher level of education
(10 classes or more) in multiple regression. This calls for a deeper investigation
of the association between education, labour-market participation, and mortality
experience of the household. J.\
Household income and survival probability of infants appear to be t:el~ve9a associated. The results hold for both rural and urban areas, and total as well
as recent mortality. This result shows the importance of higher food expenditure
associated with higher level of income, and presumably difference in the
behaviour of households with regard to investment in health capital. It is of
interest that when household income, parental education, and demographic
variables are held constant, the social status of the head of the household, as
indicated by occupation, tends to be related with infant mortality. Kamees and
landless labourers, who are generally ranked lowest in order of prestige in
rural societies, are associated with lower probability of survival of infants and
children. This clearly highlights the relevance of the ways in which health care
is provided in a class-ridden village, where the lower classes may suffer
discrimination at the hands of those involved in the actual delivery of the
services. This supply-side discrimination merits distinct treatment in research
into the demand side of health capital. In general, the results reflect substantial
differentials across the various groups differentiated by socioeconomic status.

488
REFERENCES
1. Alam, I. and Cleland, J. Infant and Child Mortality: Trends and
Determinants. In: I. Alam and B. Denison (eds.), Fertility in Pakistan,
a Review of Findings from the Pakistan Fertility Survey. International
Statistical Institute, WFS Netherlands 1984.
2. Stoeckel, J. and Chowdhury, A.K.M. Neonatal and Post Neonatal
Mortality in Rural Areas of Bangladesh, Population Studies, March 1972.
3. Sathar, Z.A. Mortality and Health in Pakistan: Selected Issues and Areas
of Concern: Paper presented at Seminar on Population in Pakistan
Islamabad, sponsored by Population Division, Government of Pakistan,
July 1984.
4. Schultz, T. Interpretations of Relations Among Mortality Economics of
the Household and Health Environment. Paper presented at the meeting on Socio-Economic Determinants and Consequences of Mortality, Mexico City, sponsored by World Health Organization, June 1984.
5. Mohammad, A. Khan, Z. and Choudhry, N.A. Age at Marriage,
Fertility and Infant Mortality in a Lahore Suburb (Part II). The Pakistan
Development Review. Summer 1976.
6. Knowles, J.G. The Determinants of Mortality in a Low Income Area of Karachi. Pakistan Journal of Applied Economics, Summer 1982.
7. Khan, M. and Sirageldin, I. Education, Income and Fertility in Pakistan,
Economic Development and Cultural Change, April 1979 .
8. Caldwell, J.C. Education as a Factor in Mortality Decline: An Examination
of Nigerian Data. Population Studies, November 1979.
9. Irfan, M. The Determinants of Female Labour Force Participation in
Pakistan. PIDE Research Report, Islamabad, September 1983.
10. Irfan, M. Class Structure, Poverty and Household Demographic Behaviour.
Mimeo., Pakistan Institute of Development Economics, Islamabad,
September 1984.