Embed Size (px)
Citation preview

Software Estimation: Practical Insights &
Orphean Research Issues
Alain Abran École de Technologie Supérieure, University of Québec, Montréal, Canada
9th International Conference Software Engineering Advances
October 12-16, 2014 - Nice (France)

© Copyrights Abran 2014 2
Alain Abran
20 years 20 years
+ 35 PhD Development
Maintenance
Process Improvements ISO: 19761, 9216,
25000, 15939,
14143, 19759

© Copyrights Abran 2014
List of topics
1. Estimation: Craft or Engineering?
2. The estimation phases
3. Economic concepts for estimation models
4. Orphean research issues
3

© Copyrights Abran 2014
List of topics
1. Estimation: Craft or Engineering?
2. The estimation phases
3. Economic concepts for estimation models
4. Orphean research issues
4

© Copyrights Abran 2014
Or?
(Software) Estimation

© Copyrights Abran 2014
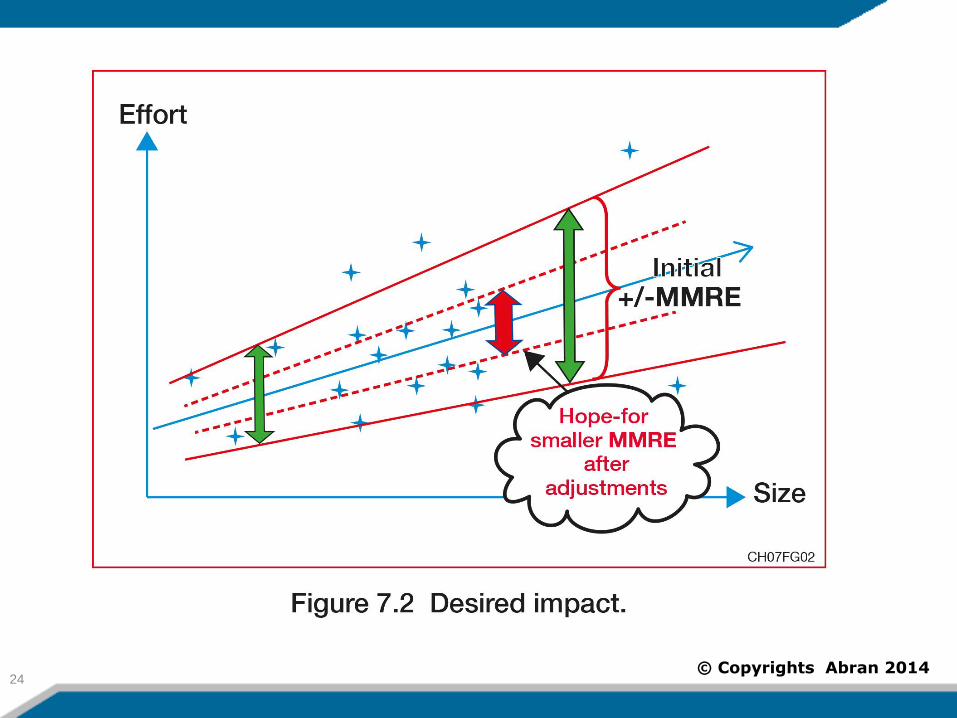
Estimation expectations

© Copyrights Abran 2014

© Copyrights Abran 2014
© Copyrights Abran 2014

© Copyrights Abran 2014
© Copyrights Abran 2014

© Copyrights Abran 2014 © Copyrights Abran 2014

© Copyrights Abran 2014 © Copyrights Abran 2014

© Copyrights Abran 2014
Imprecise Inputs at Feasibility Analysis – Much Greater Error Range
12

© Copyrights Abran 2014 © Copyrights Abran 2014

© Copyrights Abran 2014
A look at the most-known estimation approach:
The ‘COCOMO-like’ approach with its ‘cost drivers’ where:
Effort = F(Size,+15 ‘cost drivers’)
14

© Copyrights Abran 2014 15

© Copyrights Abran 2014 16
Estimation
by
‘experts’

© Copyrights Abran 2014 17

© Copyrights Abran 2014 18
Each
COCOMO
cost driver =
an estimation
sub-model
with unkown
quality &
large errors

© Copyrights Abran 2014 19
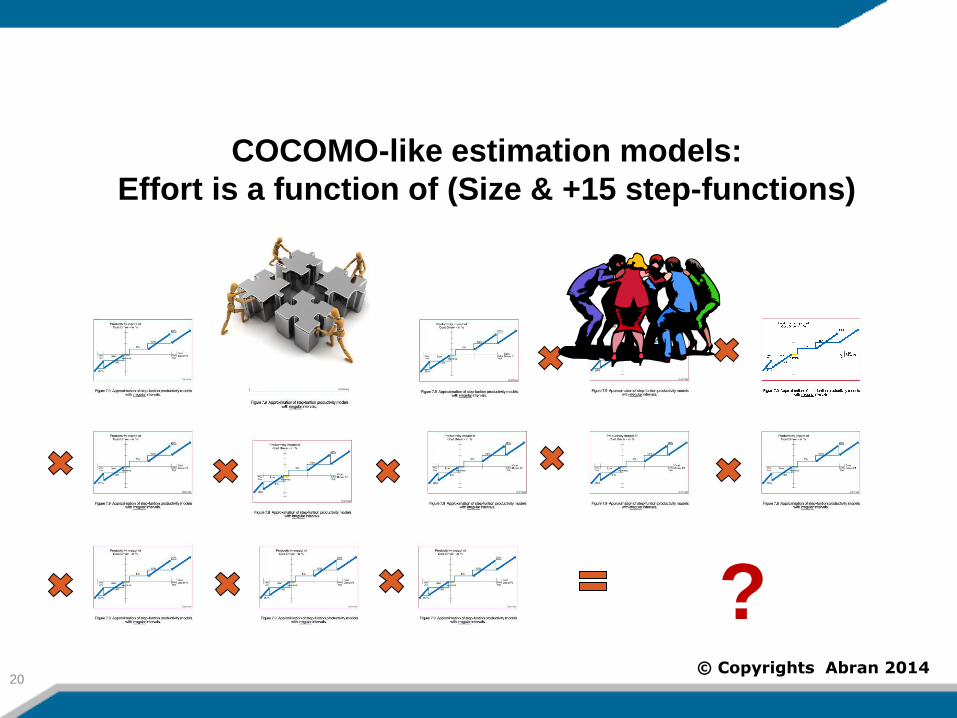
COCOMO-like estimation models:
Effort is a function of (Size & +15 step-functions)
?
© Copyrights Abran 2014 20
COCOMO-like estimation models:
Effort is a function of (Size & +15 step-functions)
?

© Copyrights Abran 2014 21
COCOMO-like estimation models:
Effort is a function of (Size & +15 step-functions)
of unknown quality combined into a single number!
Greater
Error
Ranges

© Copyrights Abran 2014 22
COCOMO-like estimation models:
Effort is a function of (Size & +15 step-functions)
of unknown quality combined into a single number!
Built-in
Systematic Errors &
Error Propagation

© Copyrights Abran 2014
Kemerer 1987 on COCOMO81
Small scale replication study - 17 projects
23
Basic Exponential
on Size
Intermediate & 15 cost drivers
Detailed & 4 project
phases
R2
(max=1.0)
0.68
0.60
0.52
MMRE (mean magnitude of relative errors)
610%
583%
607%
© Copyrights Abran 2014 24

© Copyrights Abran 2014 25

© Copyrights Abran 2014 26
© Copyrights Abran 2014

© Copyrights Abran 2014 27
© Copyrights Abran 2014

© Copyrights Abran 2014
Estimation Maths status: The search for gold!

© Copyrights Abran 2014
KEMERER 1987
Another Estimation Model:
With complex mathematical formula
Claims of being based on +4,000 projects
Still being marketed in 2014
…at a very high cost!
MMRE = 772%
29
© Copyrights Abran 2014
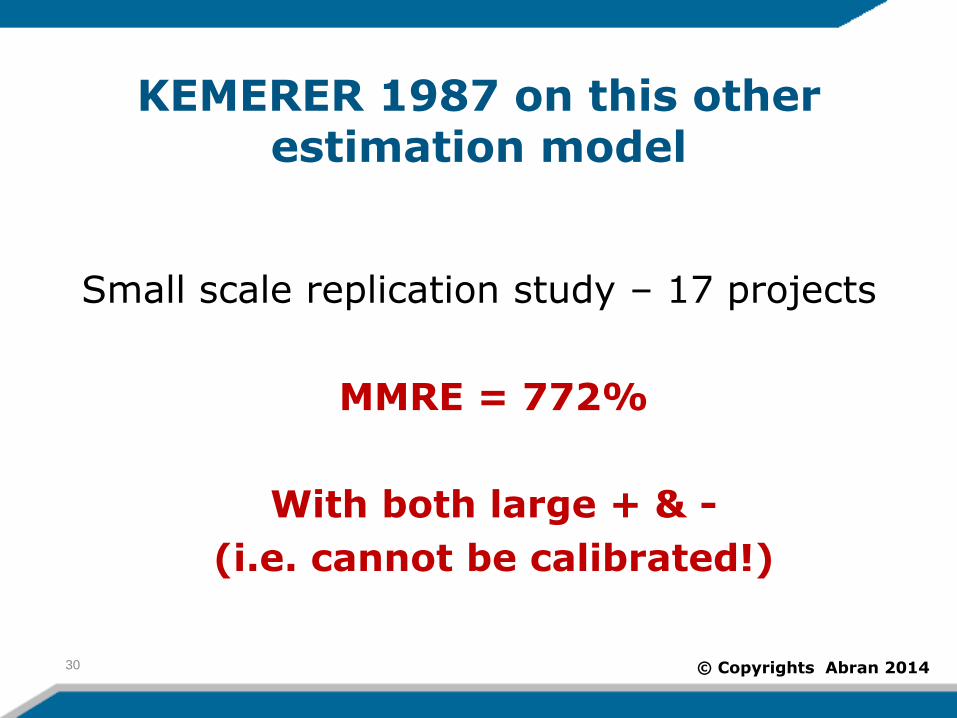
KEMERER 1987 on this other estimation model
Small scale replication study – 17 projects
MMRE = 772%
With both large + & -
(i.e. cannot be calibrated!)
30

© Copyrights Abran 2014
Larger scale replication study - MMRE
Programming language,
size range [in Function
Points]
(1)
Vendor’s black-box
estimation tool (%)
(2)
White-box models
built directly from
the data (%)
Access [200,800] 341 15
C [200, 800] 1653 50
C++ [70, 500] 97 86
C++ [750, 1250] 95 24
Cobol [60, 400] 400 42
Cobol [401, 3500] 348 51
Cobol II [80, 180] 89 29
Cobol II [180, 500] 109 46
Natural [20, 620] 243 50
Natural [621, 3500] 347 35
Oracle [100, 2000] 319 120
PL1 [80, 450] 274 45
PL1 [550, 2550] 895 21
Powerbuilder [60, 400] 95 29
SQL [280, 800] 136 81
SQL [801, 4500] 127 45
Telon [70, 650] 100 22
Visual Basic [30, 600] 122 54
Min 89 15
Max 1,653 120
31

© Copyrights Abran 2014
Larger scale replication study - MMRE
Programming language,
size range [in Function
Points]
(1)
Vendor’s black-box
estimation tool (%)
(2)
White-box models
built directly from
the data (%)
Access [200,800] 341 15
C [200, 800] 1653 50
C++ [70, 500] 97 86
C++ [750, 1250] 95 24
Cobol [60, 400] 400 42
Cobol [401, 3500] 348 51
Cobol II [80, 180] 89 29
Cobol II [180, 500] 109 46
Natural [20, 620] 243 50
Natural [621, 3500] 347 35
Oracle [100, 2000] 319 120
PL1 [80, 450] 274 45
PL1 [550, 2550] 895 21
Powerbuilder [60, 400] 95 29
SQL [280, 800] 136 81
SQL [801, 4500] 127 45
Telon [70, 650] 100 22
Visual Basic [30, 600] 122 54
Min 89 15
Max 1,653 120 32

© Copyrights Abran 2014
Another Key Issue:
The quality of the inputs to the
estimation models

© Copyrights Abran 2014

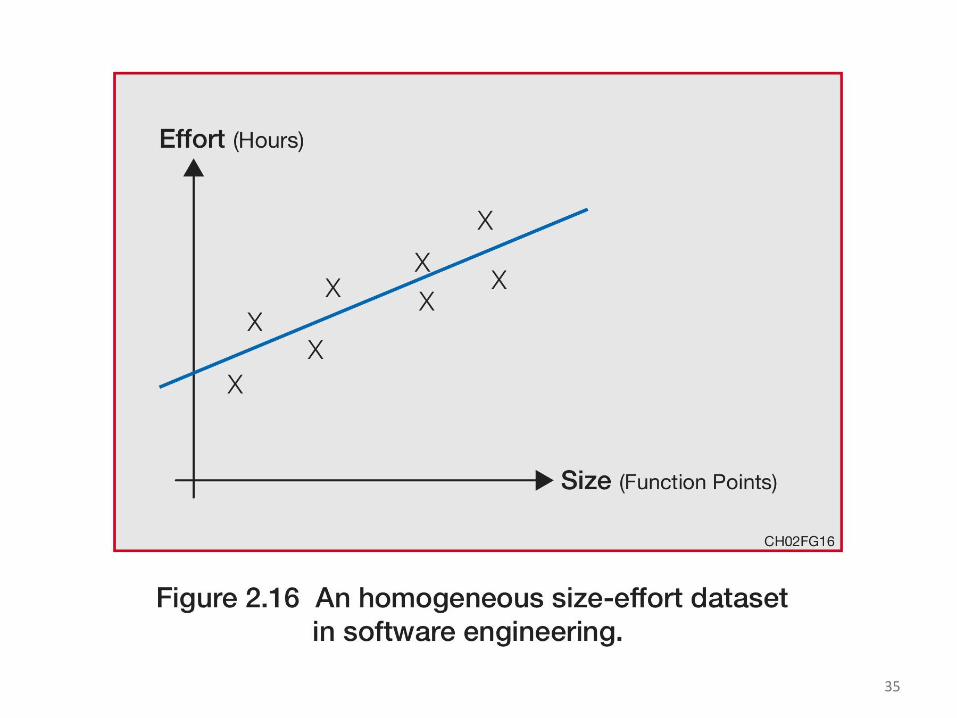
© Copyrights Abran 2014 35

© Copyrights Abran 2014

© Copyrights Abran 2014 37
A New Software
Metric to Complement
Function Points
The Software Non-functional
Assessment Process (SNAP)

© Copyrights Abran 2014 38
Author Very strong relationship of SNAP with Effort
R2 = 0 ,89 (R2 max = 1,0)

© Copyrights Abran 2014
Author’s assertion on Figure 4:
R2 = .89 Significance F = 1.7 * 10-23 Spearman = .85 Runs = pass
&
Spearman test for rank correlation of .85, with an associated confidence of statistical significance of greater than 99% (p-value <.0001).
39

© Copyrights Abran 2014
Author’s assertion on Figure 4:
R2 = .89 Significance F = 1.7 * 10-23 Spearman = .85 Runs = pass
&
Spearman test for rank correlation of .85, with an associated confidence of statistical significance of greater than 99% (p-value <.0001).
But:
These numbers and stats are invalid the necessary requiremenst for a regression are not met! Presence of large outliers which distorts all stats numbers Meaningless!!
40

© Copyrights Abran 2014 41

© Copyrights Abran 2014 42
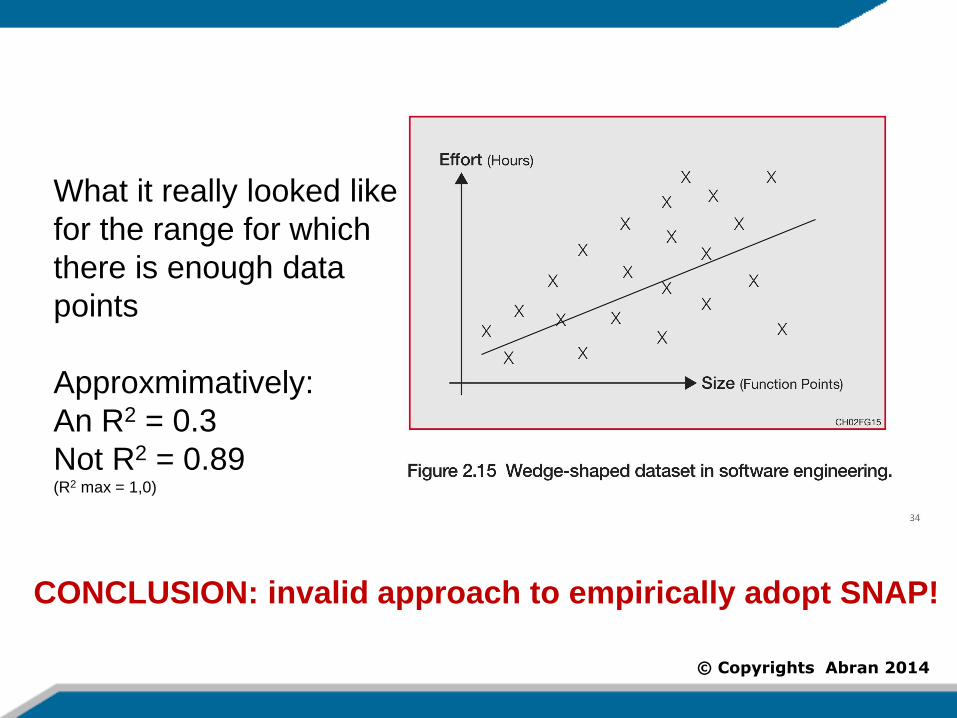
Invalidity Range
© Copyrights Abran 2014
What it really looked like
for the range for which
there is enough data
points
Approxmimatively:
An R2 = 0.3
Not R2 = 0.89 (R2 max = 1,0)
CONCLUSION: invalid approach to empirically adopt SNAP!

© Copyrights Abran 2014 44
Hell is paved all over
with good intentions!

© Copyrights Abran 2014
Estimation is
always urgent
Is there a
‘quick’ solution?

© Copyrights Abran 2014
Estimation is
always urgent
Is there a
‘quick’ solution?
The web!

© Copyrights Abran 2014
Estimation is
always urgent
Is ‘quick’ the
right question?
The web!

© Copyrights Abran 2014
Estimation is
always urgent
Isn’t it ‘quality’ of
the estimation
model
the right
question?
The web!

© Copyrights Abran 2014
Estimation is
always urgent
Isn’t ‘quality’ of
the estimation
model the right
question?
The web!

© Copyrights Abran 2014
Estimation Expected Outcomes
50
Quick &
Easy…

© Copyrights Abran 2014
Estimation Outcomes!
51
Quick &
Easy…

© Copyrights Abran 2014
COCOMO-like estimation models
The ‘feel-good’ dead end!
52
Quick &
Easy…

© Copyrights Abran 2014
List of topics
1. Estimation: Craft or Engineering?
2. The estimation phases
3. Economics concepts for estimation models (fixed-variable costs, economies of scale…)
4. Orphean research issues
53

© Copyrights Abran 2014
Estimation & Uncertainty – Boehm’s Cone of Uncertainty

© Copyrights Abran 2014
© Copyrights Abran 2014

© Copyrights Abran 2014
© Copyrights Abran 2014

© Copyrights Abran 2014 © Copyrights Abran 2014
Models Built with completed projects
© Copyrights Abran 2014
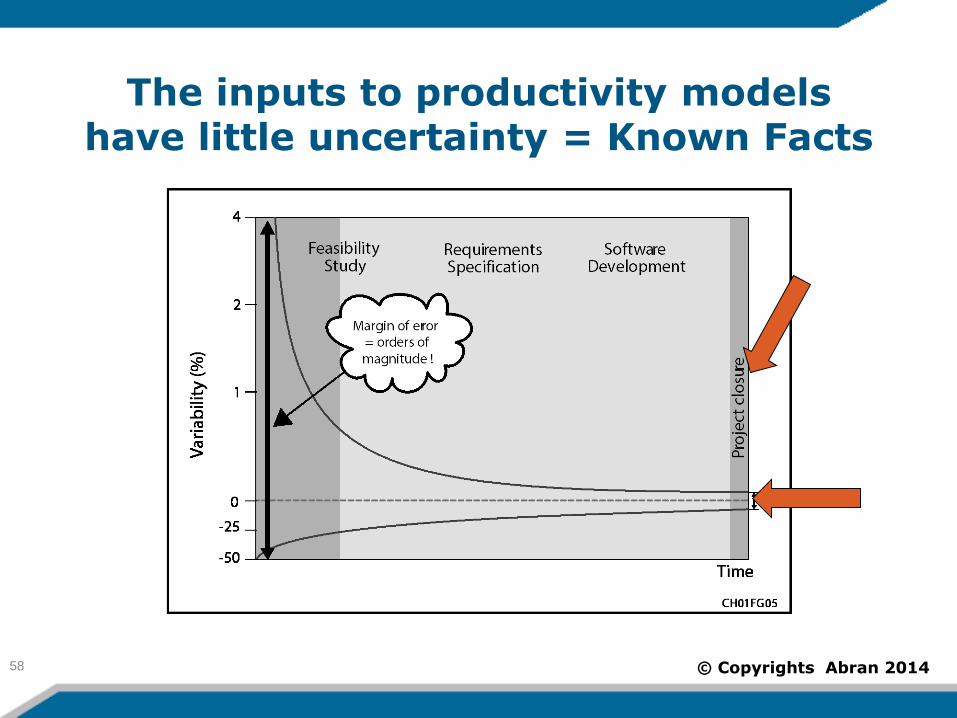
The inputs to productivity models have little uncertainty = Known Facts
58

© Copyrights Abran 2014
Imprecise Inputs at Feasibility Analysis – Much Greater Error Range
59

© Copyrights Abran 2014
Project Scope = ?
The dreamer
Accounting
Marketing
The visionnary 60
Stakeholders initial wishes

© Copyrights Abran 2014
Project Scope: Detailed & Approved
Agreed Project Scope!
The dreamer
Accounting
Marketing
The visionnary 61
Stakeholders initial wishes

© Copyrights Abran 2014
Estimation Models: The Uncertainty Cone: Requirements Specs
62

© Copyrights Abran 2014 © Copyrights Abran 2014

© Copyrights Abran 2014 64
© Copyrights Abran 2014 65

© Copyrights Abran 2014 © Copyrights Abran 2014

© Copyrights Abran 2014 67

© Copyrights Abran 2014 68

© Copyrights Abran 2014 © Copyrights Abran 2014

© Copyrights Abran 2014 70

© Copyrights Abran 2014 © Copyrights Abran 2014

© Copyrights Abran 2014 © Copyrights Abran 2014

© Copyrights Abran 2014 © Copyrights Abran 2014
© Copyrights Abran 2014 74
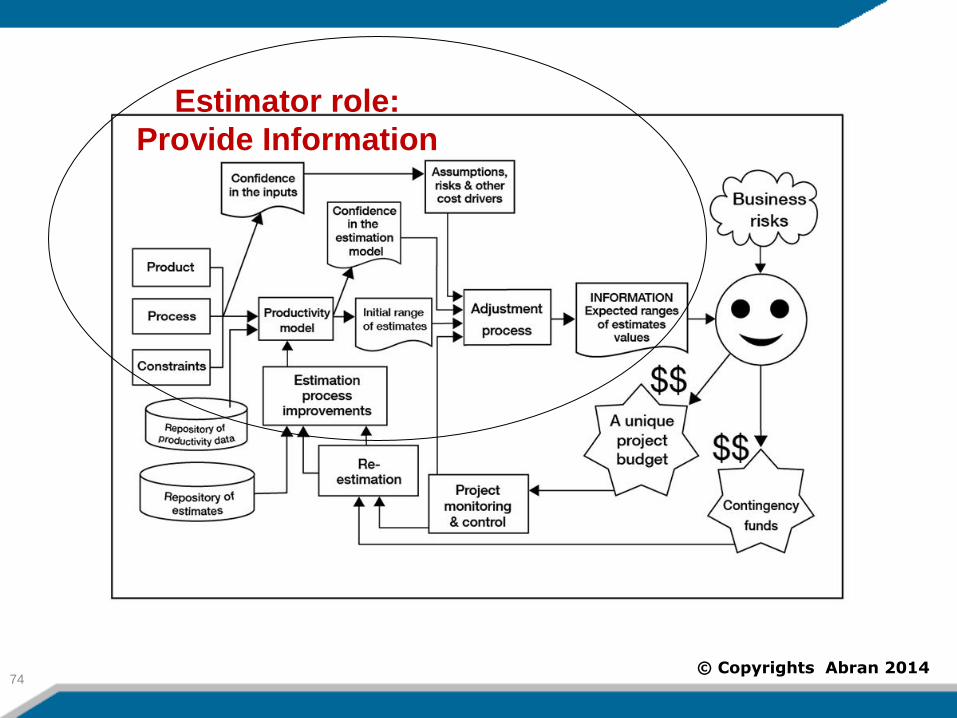
Estimator role:
Provide Information
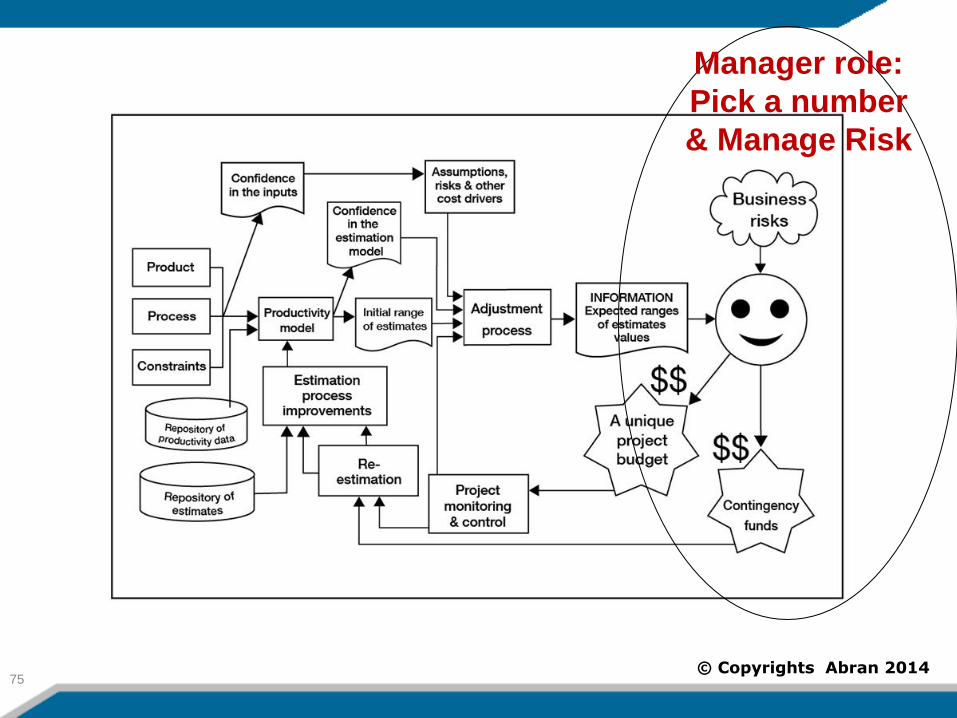
© Copyrights Abran 2014 75
Manager role:
Pick a number
& Manage Risk

© Copyrights Abran 2014
List of topics
1. Estimation: Craft or Engineering?
2. The estimation phases
3. Economic concepts for estimation models
4. Orphean research issues
76
© Copyrights Abran 2014

© Copyrights Abran 2014

© Copyrights Abran 2014

© Copyrights Abran 2014

© Copyrights Abran 2014
Economies of scale
Diseconomies of scale

© Copyrights Abran 2014
Projects from a financial governmental organization
82

© Copyrights Abran 2014
Projects from a financial governmental organization

© Copyrights Abran 2014 © Copyrights Abran 2014

© Copyrights Abran 2014 © Copyrights Abran 2014

© Copyrights Abran 2014
Causes: Schedule compression, users changing
their minds, integrated applications…

© Copyrights Abran 2014 © Copyrights Abran 2014
Which estimation model to use in which contexts?
A Management Decision!
© Copyrights Abran 2014
Estimation Models based on economic concepts
A large scale success story:
Embedded software domain
Requirements & Specifications:
– In-house
– Model driven using Matlab-Simulink
Software development:
– Outsourced across the world
– with qualified suppliers
88

© Copyrights Abran 2014
Estimation Models based on economic concepts
Initial productivity models developed with 20 to 30 projects for each software supplier:
– Based on 2nd generation COSMIC size method
– R2 within the 0.8 to 0.9+ range
– MMRE varies for each supplier
– Info on both fixed & variable costs used to compare suppliers:
Simple models that ‘talk’ to managers based on international standards – No ‘black boxes’ & game playing with numbers!
– Info on variance to negotiate next projects
89

© Copyrights Abran 2014
Automated COSMIC measurement
+ 300 projects to size and estimate each each at rush time every yeat
Investment in automation of functional size measurement (with a PhD student)
– Automation results verified with duplicate measurements over +70 projects (manual & automated).
– Accuracy of size automation:
Prototype: 96%
Final automation tool: 99+%
90

© Copyrights Abran 2014
Other usages of functional size measurement
Prediction model of memory size based on the size of the functional specifications
Balancing the worload within the team of 100 engineers preparing the detailed software specifications for outsourcing
Setting annual productivity increases to their network of software suppliers
– as mandated to their hardware suppliers
91

© Copyrights Abran 2014
Lessons learned
This organization:
did not look for miracles (quick & at no cost)!
They invested time & monies to build a competitive advantage by:
– Collecting historical data
– Using standards for measurement
– Developing minimum statistical skills
– Being transparent with software suppliers
92

© Copyrights Abran 2014
List of topics
1. Estimation: Craft or Engineering?
2. The estimation phases
3. Economic concepts for estimation models
4. Orphean research issues
93

© Copyrights Abran 2014 94
Most research focus here

© Copyrights Abran 2014 95
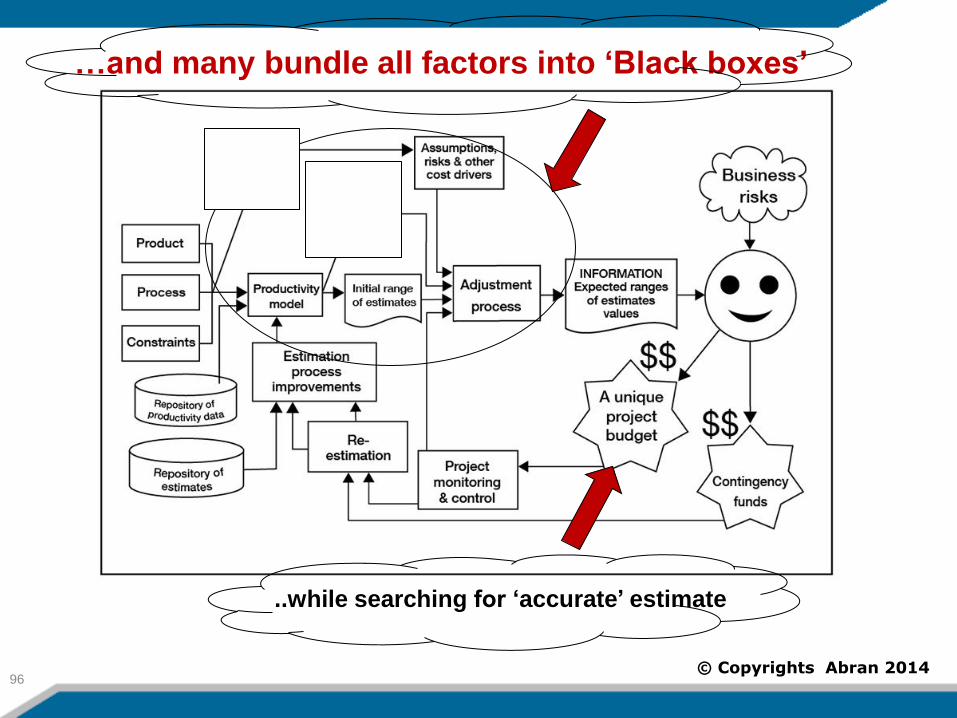
Most papers focus here
….and search for ‘accurate’ estimate
© Copyrights Abran 2014 96
…and many bundle all factors into ‘Black boxes’
..while searching for ‘accurate’ estimate

© Copyrights Abran 2014 97
Simple models easy to
understand by management

© Copyrights Abran 2014 98
Issues on Software
Measurement &
Estimation Inputs

© Copyrights Abran 2014
Software Size?
Lines of code
Or
Function Points:
– +30 variations
– & 5 International Standards!
99

© Copyrights Abran 2014

© Copyrights Abran 2014
Gold Turning dust into
gold…

© Copyrights Abran 2014
FP to LOC convertion ratios in Estimation Models
What happened to Ariane 5 spacecraft … and why?
102

© Copyrights Abran 2014
Issues on Estimation Inputs Which method for software functional size:
1st generation: IFPUG Function Points - 1979
– Innovator (in 1979, but not in 2004!)
– Systematic errors! (step function with min & max)
– Invalid maths!
– No measurement unit!
– Still cannot be automated & be compliant after 35 years!
2nd generation: COSMIC Function Points - 2003
– Strenghts based on metrology principles
– Can be automated & compliant to ISO
– Applicable across domains
– Free & + 15 translations
103

© Copyrights Abran 2014
Other Issues on Estimation Inputs
Unsound sizing methods compounding mistakes:
– Usecase Points
– Story Points
For incomplete software requirements documents, lack of independently verified approximate sizing method
104

© Copyrights Abran 2014
Estimation Models: The Uncertainty Cone: Requirements Specs
105

© Copyrights Abran 2014
Scales in Plans - Architects & Engineers
106
© Almakadmeh-Abran
2013 © Almakadmeh-Abran
2012

© Copyrights Abran 2014
Scales in Software Documents?
107
© Almakadmeh 2013

© Copyrights Abran 2014
Scales in Software Requirements Texts?
108
© Almakadmeh 2013

© Copyrights Abran 2014
A functional size approximation technique: Unkown Performance..!
109
© Almakadmeh 2013

© Copyrights Abran 2014
An investigation of an existing functional size approximation technique: reproducibility
110
Difference of functional size approximation
© Almakadmeh 2013
Participant
code
Approximate functional size
using the E&Q COSMIC technique
(Min, Most-likely, Max) (in CFP)
Percentage difference in
functional size approximation
(w.r.t. Most-likely value)
A6 (45, 74, 93) − 90%
A12 (57, 114, 179) − 84%
A3 (238, 543, 910) − 23%
A9 (250, 545, 909) − 23%
A5 (299, 592, 962) − 16%
A2 (250, 705, 1250) 0%
A1 (521, 1071, 1616) + 52%
A11 (581, 1185, 1972) + 68%
A8 (697, 1454, 2472) + 106%
A7 (964, 2077, 3450) + 195%
A4 (1181, 2369, 3957) + 236%
A10 (2265, 4510, 7408) + 540%
Minimum − 90%
Maximum + 540%
12
Participants

© Copyrights Abran 2014
An investigation of an existing functional size approximation technique: accuracy
111
Accuracy of the functional size approximation
© Almakadmeh 2013
12
Participants
Participant
code
Approximated functional
size using the E&Q
COSMIC technique in CFP
(min, most-likely, max) (1)
Reference
functional
size for
accuracy
criteria (2)
MRE calculated using
values in (1) and (2)
(min, most-likely, max)
A6 (45, 74, 93)
79 CFP
(43%, 7%, 17%)
A12 (57, 114, 179) (28%, 44%, 126%)
A3 (238, 543, 910) (200%, 585%, 1047%)
A9 (250, 545, 909) (215%, 587%, 1046%)
A5 (299, 592, 962) (277%, 646%, 1113%)
A2 (250, 705, 1250) (215%, 789%, 1476%)
A1 (521, 1071, 1616) (557%, 1251%, 1938%)
A11 (581, 1185, 1972) (633%, 1394%, 2387%)
A8 (697, 1454, 2472) (779%, 1733%, 3017%)
A7 (964, 2077, 3450) (1115%, 2519%, 4250%)
A4 (1181, 2369, 3957) (1389%, 2887%, 4890%)
A10 (2265, 4510, 7408) (2756%, 5587%, 9241%)
Average MRE on functional size approximations
(all 12 participants) (684%, 1502%, 2546%)
Average MRE on functional size approximations
(except participants A6 & A12) (814%, 1798%, 3041%)

© Copyrights Abran 2014
Estimation Approaches
The ‘feel-good’ dead end!
112
Quick &
Easy…

© Copyrights Abran 2014
Building ‘good’ estimation process & good estimation models
It requires:
Recognition of uncertainties: how to recognize this and how to deal with it
The estimator has to provide information, not a single estimate
The manager has to select a single budget number, and manage risks through contingency planning.
Discipline, rigor, commitments and $$$
113

© Copyrights Abran 2014 © Copyrights Abran 2014
Source of historical data:
www.isbsg.org

© Copyrights Abran 2014 © Copyrights Abran 2014
Orphean research issues:
Research on software estimation dates back to
the early 70’s, but much still remain……

© Copyrights Abran 2014 © Copyrights Abran 2014
Orphean research issues:
Research on software estimation dates back to
the early 70’s, but much still remain……

© Copyrights Abran 2014 © Copyrights Abran 2014
Orphean research issues:
Research on software estimation dates back to
the early 70’s, but much still remain……

© Copyrights Abran 2014 118
You want to know
more?