Embed Size (px)
Citation preview
Software for Automated Analysisof DNA Fingerprinting GelsDaniel R. Fuhrmann,1 Martin I. Krzywinski,2 Readman Chiu,2 Parvaneh Saeedi,2
Jacqueline E. Schein,2 Ian E. Bosdet,2 Asif Chinwalla,3 LaDeana W. Hillier,3
Robert H. Waterston,3 John D. McPherson,3 Steven J.M. Jones,2 andMarco A. Marra2,41Department of Electrical Engineering, Washington University, St. Louis, Missouri 63130, USA; 2Genome Sciences Centre,British Columbia Cancer Agency, Vancouver, British Columbia V5Z 4E6, Canada; 3Genome Sequencing Center, WashingtonUniversity School of Medicine, St. Louis, Missouri 63108, USA
Here we describe software tools for the automated detection of DNA restriction fragments resolved on agarosefingerprinting gels. We present a mathematical model for the location and shape of the restriction fragments asa function of fragment size, with model parameters determined empirically from “marker” lanes containingmolecular size standards. Automated identification of restriction fragments involves several steps, including:image preprocessing, to put the data in a form consistent with a linear model; marker lane analysis, fordetermination of the model parameters; and data lane analysis, a procedure for detecting restriction fragmentmultiplets while simultaneously determining the amplitude curve that describes restriction fragment amplitudeas a function of mobility. In validation experiments conducted on fingerprinted and sequenced BacterialArtificial Chromosome (BAC) clones, sensitivity and specificity of restriction fragment identification exceeded96% on restriction fragments ranging in size from 600 base pairs (bp) to 30,000 bp. The integrated suite ofsoftware tools, written in MATLAB and collectively called BandLeader, is in use at the BC Cancer AgencyGenome Sciences Centre (GSC) and the Washington University Genome Sequencing Center, and has beenprovided to the Wellcome Trust Sanger Institute and the Whitehead Institute. Employed in a production modeat the GSC, BandLeader has been used to perform automated restriction fragment identification for more than850,000 BAC clones for mouse, rat, bovine, and poplar fingerprint mapping projects.
Maps constructed from fingerprinted large-insert bacterialclones (Marra et al. 1997) have been constructed to supportwhole-genome and localized DNA sequencing activities, aswell as gene cloning studies, in plants (Marra et al. 1999;Mozo et al. 1999; Tao et al. 2001; Chen et al. 2002), animals(McPherson et al. 2001; Gregory et al. 2002), the nematodesCaenorhabditis elegans (Coulson et al. 1995; The C. elegansGenome Sequencing Consortium 1998) and Caenorhabditisbriggsae (J. Schein and M. Marra, unpubl.), insects (Hoskins etal. 2000), fungi (Olson et al. 1986; Schein et al. 2002), andbacteria (Wechter et al. 2002; J. Schein, I. Bosdet, and M.Marra, unpubl.). Starting with a sufficiently redundant large-insert library of genomic DNA, the fingerprinting process(Schein et al. 2003) involves purification of DNA from clones,treatment of the DNA with restriction enzymes to producerestriction fragments, resolution of the restriction fragmentson agarose gels, identification of the restriction fragments toproduce a fingerprint, comparison of the fingerprints to eachother to generate contigs (clusters of overlapping clones rep-resenting the genomic regions from which the clones werederived), and finally verification of clone ordering within ev-ery contig. Even using clones containing very large inserts(i.e., bacterial artificial chromosome [BAC] clones; Shizuya et
al. 1992), hundreds of thousands of fingerprints may be re-quired to accurately represent a large (i.e., mammalian-sized)genome in large contigs. The scale of such efforts and theneed to produce data in a rapid, efficient, and cost-effectivefashion have provided impetus for the automation of varioussteps in the fingerprinting procedure. Here we describe auto-mation of the step involving identification of restriction frag-ments (“bandcalling”), which is performed on digital imagesof agarose fingerprinting gels.
Sulston et al. (1988, 1989) were among the first to de-velop methods for automating bandcalling. They developedsoftware for lane tracking and band detection that was theprecursor to the IMAGE package, which is available from theSanger Institute (http://www.sanger.ac/Software/Image). Al-though IMAGE is user-friendly and has impressive function-ality in terms of image manipulation and display, in our ex-perience the bandcalls it produces require significant manualverification. Presumably one reason for this is that IMAGEwas designed for analysis of fingerprints generated on acryl-amide gels from end-labeled DNA fragments (Coulson et al.1986; Gregory et al. 1997). These end-labeled fragments rep-resent typically only a portion of the DNA contained withinthe clone. This is in contrast to the agarose method employedcurrently by ourselves (Marra et al. 1997; Schein et al. 2003)and others, in which all of the restriction fragments derivedfrom a clone are visualized by postelectrophoretic staining ofagarose gels with SYBR green (Molecular Probes). Indeed, thismethodological difference has made possible our bandcalling
4Corresponding author.E-MAIL [email protected]; FAX (604) 877-6085.Article and publication are at http://www.genome.org/cgi/doi/10.1101/gr.904303.
Methods
940 Genome Research 13:940–953 ©2003 by Cold Spring Harbor Laboratory Press ISSN 1088-9051/03 $5.00; www.genome.orgwww.genome.org
approach, which aims to identify all of the restriction frag-ments and, in the case of comigrating restriction fragments,their copy number (or “multiplicity”).
Our software tools, collectively called BandLeader, con-sist of a set of MATLAB routines that are capable of automati-cally identifying and locating marker lanes and data lanes andthe restriction fragments contained therein. Gel images, col-lected during the fingerprinting procedure, are subjected firstto “lane-tracking”, a semi-automated procedure that identi-fies the location of the lanes on the digital gel image. This stepis performed using the excellent image manipulation toolsthat are part of the IMAGE package. IMAGE-extracted gellanes are then passed automatically to BandLeader for band-calling. Currently the BandLeader software is completely de-pendent upon the gel and data format presently in use at theBritish Columbia Cancer Agency (BCCA) Genome SciencesCentre. Detailed protocols for the production of fingerprintssuitable for analysis by BandLeader have been described(Schein et al. 2003). Briefly, each gel consists of 25 markerlanes and 96 “data lanes” containing large-insert clone fin-gerprints. DNA quantities and electrophoresis conditions arestrictly controlled to ensure gel-to-gel uniformity of the data.Each marker lane contains 37 fragments, with data lanes(BACs digested with HindIII or another suitable restrictionenzyme) containing 50 or more bands. Hence, each gel con-tains more than 6000 fragments that must be identified. TheBandLeader suite accomplishes this task for each gel in ap-proximately 10 min on a computer with 1 gigabyte of RAMand an Intel-based processor running at 1 GHz. Using heuris-tic data checking, the BandLeader routines flag potential ar-tifact lanes and exclude them from the data set. These can beviewed subsequently if desired.
BandLeader has been under development at both Wash-ington University (St. Louis) and the Genome Sciences Centre(Vancouver) for more than four years, and during this timeseveral versions were produced and used. The earliest ver-sions, developed during the height of activity on the HumanGenome Project, were based on full two-dimensional imageprocessing techniques and were too slow to be of practicaluse. The basic methodology as presented here was in place byJune 2000 (Version 2.0). At that time, the software could beused as a first step, but manual postprocessing was required tocorrect for certain artifacts, most notably overcalls, which re-sulted from a mismatch between a narrowly defined datamodel and the actual image data. Most of the developmenteffort of the past two years was carried out while the mousemapping effort at the Genome Sciences Centre was underway,and concentrated on making the software more reliable andthe results more robust with respect to variations in the dataaway from the nominal model. A full set of exception-handling routines, to flag data that the software tools wereunable to interpret, were also implemented. The most recentversion (Version 2.3.3) is described here.
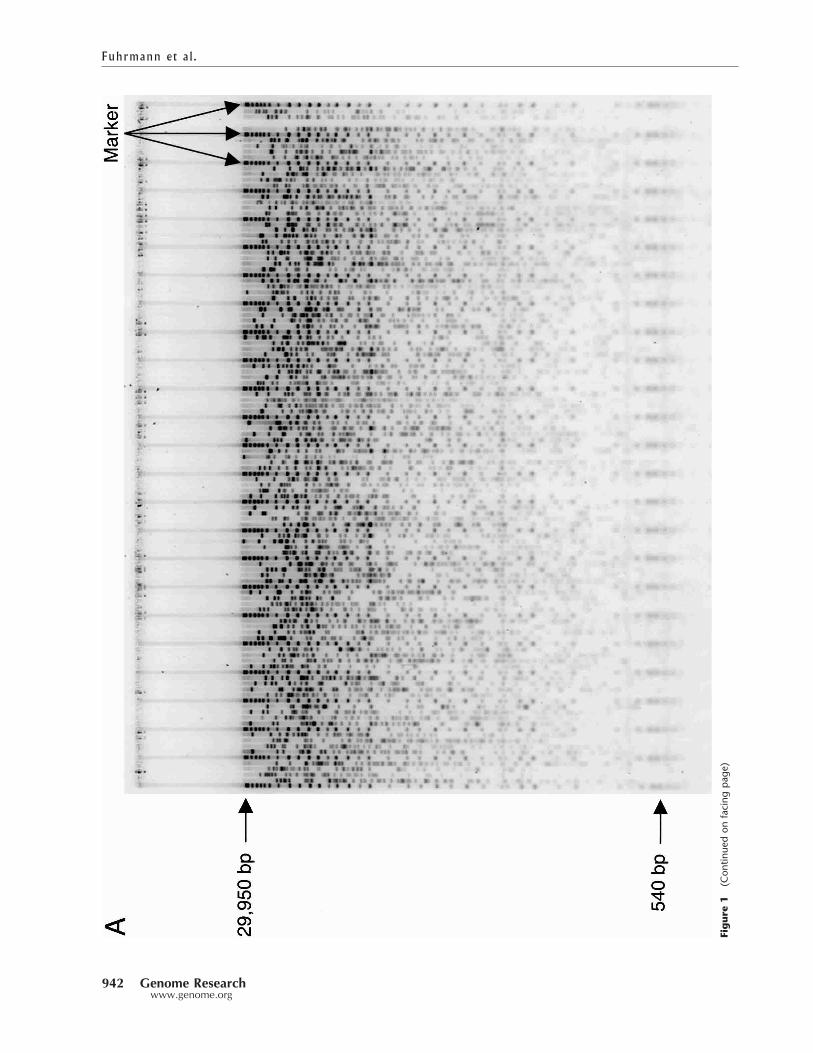
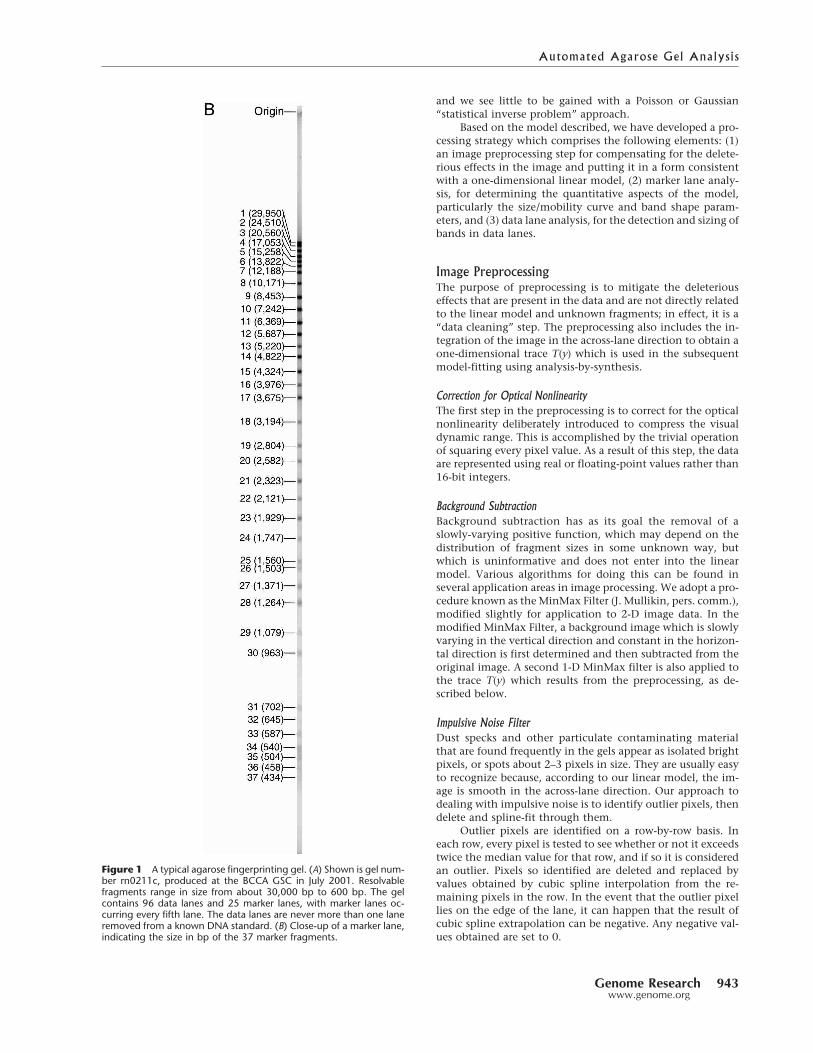
RESULTSAn electronic image of a typical agarose fingerprinting gel isshown in Figure 1A. Figure 1B shows a marker lane, with eachenumerated DNA fragment annotated with the correspond-ing size of the fragment. Gel (TIFF) images are collected on aMolecular Dynamics Fluorimager. Although the Fluorimageris capable of different settings, BandLeader has been tuned touse 200-micron-square pixels. Each gel image is 1000 � 1200pixels. The gel image is partitioned into 121 single-lane im-
ages, each 1000 pixels long � 9 pixels wide, as a result of thelane tracking process in IMAGE, but is otherwise unprocessedprior to our analysis. The lanes on the gel image in Figure 1Aare typical of the input provided to BandLeader, and illustratethe problem BandLeader has been designed to address;namely, the automated identification of all DNA fragments inboth the marker lanes and the data lanes. Below we describethe considerations and approaches that we devised to auto-matically identify fragments on gels of this type, and quantifyBandLeader’s performance on fingerprints corresponding to atest set of fully sequenced and finished BAC clones.
Forward Synthesis ModelThe methodology we adopt for the analysis of fingerprintinggels is consistent in many respects with the general model-based image analysis paradigm of O’Sullivan, Blahut, andSnyder (1998). It is based on a forward synthesis model thatcaptures as much relevant information about the desiredquantities (the molecular fragment sizes) as possible, whilemaintaining a level of simplicity that allows for computa-tional efficiency. While the model is based in part on theunderlying physics of the fingerprinting process, the quanti-tative aspects are derived or refined from the data themselves.
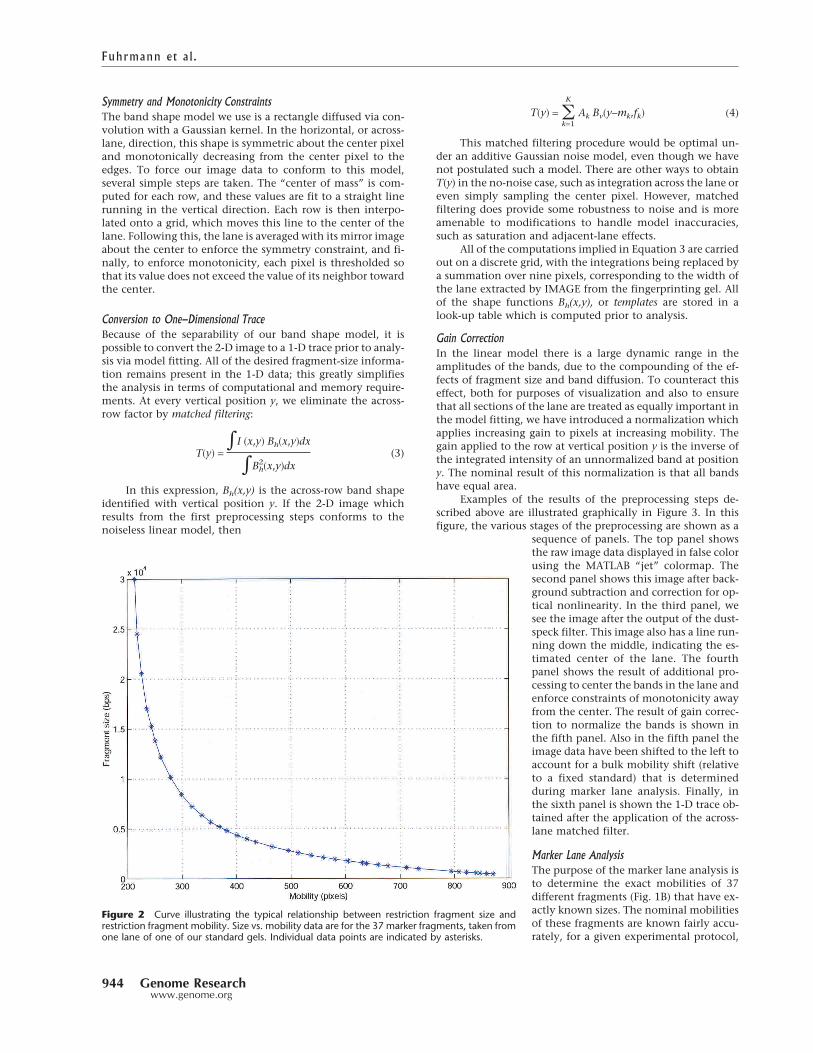
In brief, our model for the production of electrophoreticgel data is as follows. Under the influence of an electric field,molecular fragments of a certain size fk migrate to a particularlocation on a fingerprinting gel and form a diffuse band. Therelationship between the distance traveled, or mobility, andthe fragment size is given by a curve which is known approxi-mately but which must be refined empirically. A typical size/mobility curve is shown in Figure 2.
In our model, the shape of the band is a rectangle sub-jected to Gaussian diffusion, and the diffusion parameters aresize-dependent. The brightness, or amplitude of each band isalso size-dependent. Qualitatively speaking, bands due tosmaller fragments travel further, are dimmer, and are morediffuse, as is evident in Figure 1. In an idealized linear model,one data lane contains the superposition of bands consistentwith this model at locations determined by the fragmentsizes. This is described by the model equation
I�x,y� = �k
K
Ak B�x,y − mk,fk� ( 1)
where x and y are the horizontal and vertical spatial coordi-nates, respectively, I is the acquired image intensity, Ak is theamplitude of the kth band, mk is the mobility of the kth band,and B is a band shape function for the kth band. This bandshape function is separable, that is,
B�x,y,fk� = Bh�x,fk� Bv�y,fk� ( 2)
where Bh and Bv are the horizontal and vertical factors.Our model also accounts for the various deleterious ef-
fects that cause the image data to depart from the idealizedlinear model. These include: (1) a pointwise nonlinearity offluorescent signal intensity, deliberately introduced by theMolecular Dynamics Fluorimager to compress the visual dy-namic range, (2) an additive background function which ap-pears data-dependent in an unknown way but which issmoothly-varying, (3) impulsive noise due to dust specks andother gel impurities, and (4) saturation in regions of highsignal intensity. Background instrumentation noise is not in-cluded in the model, as the signal-to-noise ratio (SNR) is high
Automated Agarose Gel Analysis
Genome Research 941www.genome.org
Figure
1(C
ontin
uedon
facing
page
)
Fuhrmann et al.
942 Genome Researchwww.genome.org
and we see little to be gained with a Poisson or Gaussian“statistical inverse problem” approach.
Based on the model described, we have developed a pro-cessing strategy which comprises the following elements: (1)an image preprocessing step for compensating for the delete-rious effects in the image and putting it in a form consistentwith a one-dimensional linear model, (2) marker lane analy-sis, for determining the quantitative aspects of the model,particularly the size/mobility curve and band shape param-eters, and (3) data lane analysis, for the detection and sizing ofbands in data lanes.
Image PreprocessingThe purpose of preprocessing is to mitigate the deleteriouseffects that are present in the data and are not directly relatedto the linear model and unknown fragments; in effect, it is a“data cleaning” step. The preprocessing also includes the in-tegration of the image in the across-lane direction to obtain aone-dimensional trace T(y) which is used in the subsequentmodel-fitting using analysis-by-synthesis.
Correction for Optical NonlinearityThe first step in the preprocessing is to correct for the opticalnonlinearity deliberately introduced to compress the visualdynamic range. This is accomplished by the trivial operationof squaring every pixel value. As a result of this step, the dataare represented using real or floating-point values rather than16-bit integers.
Background SubtractionBackground subtraction has as its goal the removal of aslowly-varying positive function, which may depend on thedistribution of fragment sizes in some unknown way, butwhich is uninformative and does not enter into the linearmodel. Various algorithms for doing this can be found inseveral application areas in image processing. We adopt a pro-cedure known as theMinMax Filter (J. Mullikin, pers. comm.),modified slightly for application to 2-D image data. In themodified MinMax Filter, a background image which is slowlyvarying in the vertical direction and constant in the horizon-tal direction is first determined and then subtracted from theoriginal image. A second 1-D MinMax filter is also applied tothe trace T(y) which results from the preprocessing, as de-scribed below.
Impulsive Noise FilterDust specks and other particulate contaminating materialthat are found frequently in the gels appear as isolated brightpixels, or spots about 2–3 pixels in size. They are usually easyto recognize because, according to our linear model, the im-age is smooth in the across-lane direction. Our approach todealing with impulsive noise is to identify outlier pixels, thendelete and spline-fit through them.
Outlier pixels are identified on a row-by-row basis. Ineach row, every pixel is tested to see whether or not it exceedstwice the median value for that row, and if so it is consideredan outlier. Pixels so identified are deleted and replaced byvalues obtained by cubic spline interpolation from the re-maining pixels in the row. In the event that the outlier pixellies on the edge of the lane, it can happen that the result ofcubic spline extrapolation can be negative. Any negative val-ues obtained are set to 0.
Figure 1 A typical agarose fingerprinting gel. (A) Shown is gel num-ber rn0211c, produced at the BCCA GSC in July 2001. Resolvablefragments range in size from about 30,000 bp to 600 bp. The gelcontains 96 data lanes and 25 marker lanes, with marker lanes oc-curring every fifth lane. The data lanes are never more than one laneremoved from a known DNA standard. (B) Close-up of a marker lane,indicating the size in bp of the 37 marker fragments.
Automated Agarose Gel Analysis
Genome Research 943www.genome.org
Symmetry and Monotonicity ConstraintsThe band shape model we use is a rectangle diffused via con-volution with a Gaussian kernel. In the horizontal, or across-lane, direction, this shape is symmetric about the center pixeland monotonically decreasing from the center pixel to theedges. To force our image data to conform to this model,several simple steps are taken. The “center of mass” is com-puted for each row, and these values are fit to a straight linerunning in the vertical direction. Each row is then interpo-lated onto a grid, which moves this line to the center of thelane. Following this, the lane is averaged with its mirror imageabout the center to enforce the symmetry constraint, and fi-nally, to enforce monotonicity, each pixel is thresholded sothat its value does not exceed the value of its neighbor towardthe center.
Conversion to One-Dimensional TraceBecause of the separability of our band shape model, it ispossible to convert the 2-D image to a 1-D trace prior to analy-sis via model fitting. All of the desired fragment-size informa-tion remains present in the 1-D data; this greatly simplifiesthe analysis in terms of computational and memory require-ments. At every vertical position y, we eliminate the across-row factor by matched filtering:
T�y� =�I �x,y� Bh�x,y�dx
�Bh2�x,y�dx
(3)
In this expression, Bh(x,y) is the across-row band shapeidentified with vertical position y. If the 2-D image whichresults from the first preprocessing steps conforms to thenoiseless linear model, then
T�y� = �k = 1
K
Ak Bv�y − mk,fk� ( 4 )
This matched filtering procedure would be optimal un-der an additive Gaussian noise model, even though we havenot postulated such a model. There are other ways to obtainT(y) in the no-noise case, such as integration across the lane oreven simply sampling the center pixel. However, matchedfiltering does provide some robustness to noise and is moreamenable to modifications to handle model inaccuracies,such as saturation and adjacent-lane effects.
All of the computations implied in Equation 3 are carriedout on a discrete grid, with the integrations being replaced bya summation over nine pixels, corresponding to the width ofthe lane extracted by IMAGE from the fingerprinting gel. Allof the shape functions Bh(x,y), or templates are stored in alook-up table which is computed prior to analysis.
Gain CorrectionIn the linear model there is a large dynamic range in theamplitudes of the bands, due to the compounding of the ef-fects of fragment size and band diffusion. To counteract thiseffect, both for purposes of visualization and also to ensurethat all sections of the lane are treated as equally important inthe model fitting, we have introduced a normalization whichapplies increasing gain to pixels at increasing mobility. Thegain applied to the row at vertical position y is the inverse ofthe integrated intensity of an unnormalized band at positiony. The nominal result of this normalization is that all bandshave equal area.
Examples of the results of the preprocessing steps de-scribed above are illustrated graphically in Figure 3. In thisfigure, the various stages of the preprocessing are shown as a
sequence of panels. The top panel showsthe raw image data displayed in false colorusing the MATLAB “jet” colormap. Thesecond panel shows this image after back-ground subtraction and correction for op-tical nonlinearity. In the third panel, wesee the image after the output of the dust-speck filter. This image also has a line run-ning down the middle, indicating the es-timated center of the lane. The fourthpanel shows the result of additional pro-cessing to center the bands in the lane andenforce constraints of monotonicity awayfrom the center. The result of gain correc-tion to normalize the bands is shown inthe fifth panel. Also in the fifth panel theimage data have been shifted to the left toaccount for a bulk mobility shift (relativeto a fixed standard) that is determinedduring marker lane analysis. Finally, inthe sixth panel is shown the 1-D trace ob-tained after the application of the across-lane matched filter.
Marker Lane AnalysisThe purpose of the marker lane analysis isto determine the exact mobilities of 37different fragments (Fig. 1B) that have ex-actly known sizes. The nominal mobilitiesof these fragments are known fairly accu-rately, for a given experimental protocol,
Figure 2 Curve illustrating the typical relationship between restriction fragment size andrestriction fragment mobility. Size vs. mobility data are for the 37 marker fragments, taken fromone lane of one of our standard gels. Individual data points are indicated by asterisks.
Fuhrmann et al.
944 Genome Researchwww.genome.org
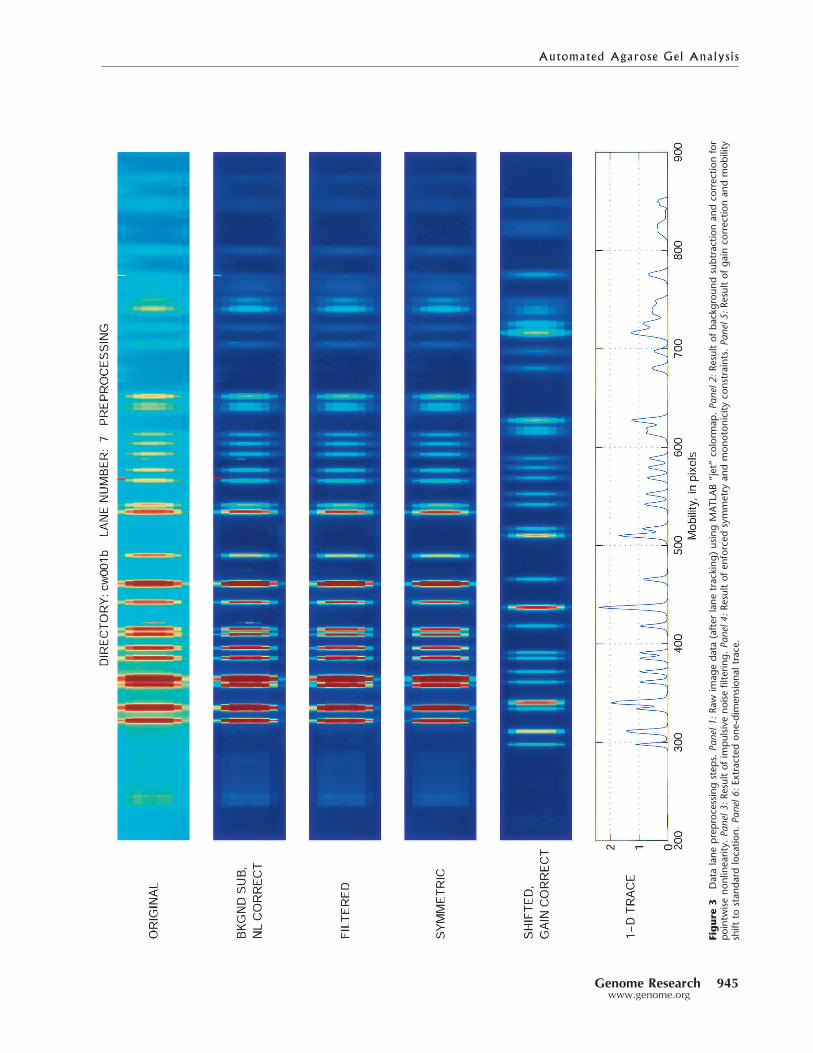
Figure
3Datalane
prep
roce
ssingstep
s.Panel1:R
awim
ageda
ta(after
lane
trac
king
)usingMATL
AB“jet”co
lorm
ap.Panel2:R
esultof
backgrou
ndsubtractionan
dco
rrec
tionfor
pointw
iseno
nlinea
rity.Panel3:R
esultof
impu
lsiveno
isefilterin
g.Panel4:R
esultof
enforced
symmetry
andmon
oton
icity
cons
traints.Panel5:R
esultof
gain
correc
tionan
dmob
ility
shift
tostan
dard
loca
tion.
Panel6:Ex
trac
tedon
e-dimen
sion
altrac
e.
Automated Agarose Gel Analysis
Genome Research 945www.genome.org
but vary slightly even within one gel due to subtle variation inthe gel conditions and nonuniformities in the electric field.Once the marker band locations have been determined, thefragment size/mobility relation can be determined for everydata lane by interpolation across the gel and down each lane.After the locations of the bands have been identified, theshapes of the bands are also analyzed to develop the templatesneeded for a complete linear model for the data lanes in a gel.
Marker Band DetectionThe first step in the marker lane analysis is the image prepro-cessing described previously. The templates used for theacross-lane matched filtering are taken from a “standard” gen-erated by the analysis of a typical gel produced under a givenexperimental protocol.
In a marker lane there are 37 bands (Fig. 1B), most ofwhich are distinct and easily identified, except for the pairnumbered 18–19, and the group of seven at high mobility,numbers 31–37. All of the marker lanes appear similar, differ-ing only in some translation and distortion of the mobilityaxis, and in the overall lane amplitude. Thus, the primary taskin marker lane analysis is to fit a distorted version of a stan-dard template to the marker trace. In this respect, the analysishas much in common with algorithms in pattern matching orpattern recognition using deformable templates (Grenanderand Miller 1994; Jain et al. 1996; Zalubas et al. 1997).
In the marker template, the first 17 bands form a distinc-tive and easily recognized pattern. This pattern is approxi-mated by a translated and dilated version of a standard tem-plate, with all the band peak amplitudes equal. The top sec-tion of the trace is matched to a set of 4000 versions of thetemplate (100 translations times 40 dilations) until a best fit isfound.
As the distortion of the mobility axis may be somethingother than a simple translation and dilation, each markerband must be individually isolated. This is accomplished bysequentially finding each band using a prediction based onpreviously identified bands. This sequential procedure is car-ried out beginning at marker band 9 and operates in bothdirections, up and down the trace, from this point. Quadraticpeak-finding is used to identify peak locations to subpixelaccuracy for known singlets, whereas a slightly different ver-sion of the previously described pattern-matching procedureis used for bands that do not have clearly identifiable peaks.
Marker Band VerificationThe accuracy of the bandcalling depends critically on the cor-rectness of the marker lane analysis; in short, there is littleroom for error at this step. Accordingly, measures must betaken to ensure that the marker lane analysis was successful.For verification, we generate a synthetic marker trace usingthe called band locations and the nominal band shapes. Thecorrelation between the synthetic and the true (preprocessed)trace is then computed. This correlation must exceed 0.95;otherwise, the marker lane is discarded.
Additional steps are taken to verify the marker laneanalysis, once all the individual lanes have been called. The25 marker lanes across the gel are examined for any discrep-ancies. For each marker band k, the 25 called mobilities acrossthe gel, mk(I), I = 1···25, should form a smooth curve. Eachfunction mk(I), I = 1···25, is fit to a low-order polynomial. Anycalled locations that deviate significantly from this curve arereplaced by an estimated mobility found by polynomial in-terpolation. The same interpolation procedure can be used to
replace data from “bad” marker lanes discarded by the corre-lation analysis.
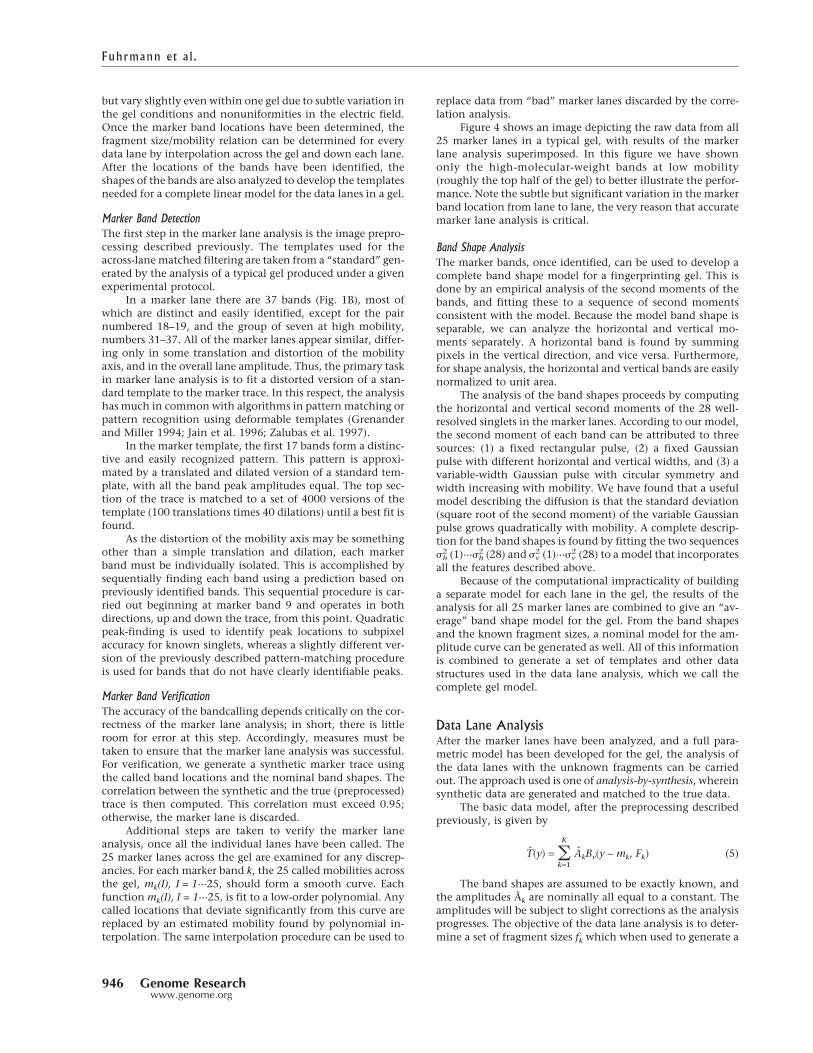
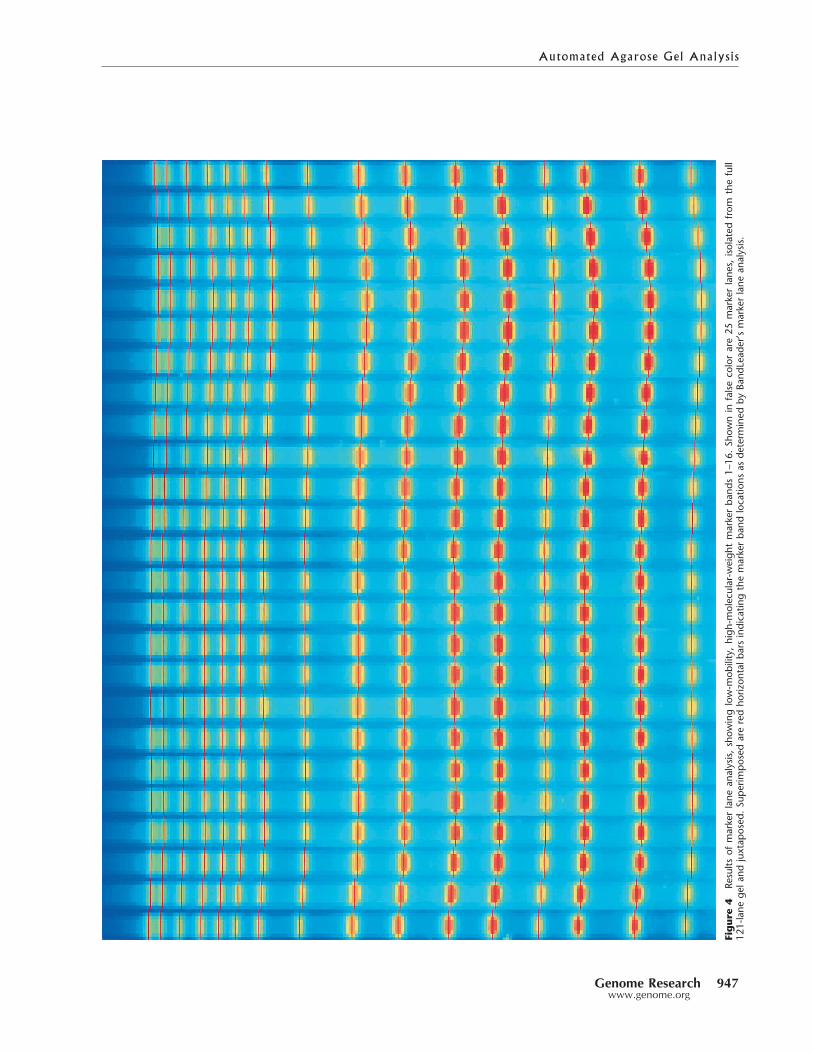
Figure 4 shows an image depicting the raw data from all25 marker lanes in a typical gel, with results of the markerlane analysis superimposed. In this figure we have shownonly the high-molecular-weight bands at low mobility(roughly the top half of the gel) to better illustrate the perfor-mance. Note the subtle but significant variation in the markerband location from lane to lane, the very reason that accuratemarker lane analysis is critical.
Band Shape AnalysisThe marker bands, once identified, can be used to develop acomplete band shape model for a fingerprinting gel. This isdone by an empirical analysis of the second moments of thebands, and fitting these to a sequence of second momentsconsistent with the model. Because the model band shape isseparable, we can analyze the horizontal and vertical mo-ments separately. A horizontal band is found by summingpixels in the vertical direction, and vice versa. Furthermore,for shape analysis, the horizontal and vertical bands are easilynormalized to unit area.
The analysis of the band shapes proceeds by computingthe horizontal and vertical second moments of the 28 well-resolved singlets in the marker lanes. According to our model,the second moment of each band can be attributed to threesources: (1) a fixed rectangular pulse, (2) a fixed Gaussianpulse with different horizontal and vertical widths, and (3) avariable-width Gaussian pulse with circular symmetry andwidth increasing with mobility. We have found that a usefulmodel describing the diffusion is that the standard deviation(square root of the second moment) of the variable Gaussianpulse grows quadratically with mobility. A complete descrip-tion for the band shapes is found by fitting the two sequences�2h (1)···�
2h (28) and �2v (1)···�
2v (28) to a model that incorporates
all the features described above.Because of the computational impracticality of building
a separate model for each lane in the gel, the results of theanalysis for all 25 marker lanes are combined to give an “av-erage” band shape model for the gel. From the band shapesand the known fragment sizes, a nominal model for the am-plitude curve can be generated as well. All of this informationis combined to generate a set of templates and other datastructures used in the data lane analysis, which we call thecomplete gel model.
Data Lane AnalysisAfter the marker lanes have been analyzed, and a full para-metric model has been developed for the gel, the analysis ofthe data lanes with the unknown fragments can be carriedout. The approach used is one of analysis-by-synthesis, whereinsynthetic data are generated and matched to the true data.
The basic data model, after the preprocessing describedpreviously, is given by
T�y� = �k= 1
K
AkBv�y − mk, Fk� (5)
The band shapes are assumed to be exactly known, andthe amplitudes Ãk are nominally all equal to a constant. Theamplitudes will be subject to slight corrections as the analysisprogresses. The objective of the data lane analysis is to deter-mine a set of fragment sizes fk which when used to generate a
Fuhrmann et al.
946 Genome Researchwww.genome.org
Figure
4Re
sults
ofmarke
rlane
analysis,sh
owing
low-m
obility,high
-molec
ular-w
eigh
tmarke
rba
nds1–
16.Sh
own
infalseco
lorare25
marke
rlane
s,isolated
from
thefull
121-lane
gela
ndjuxtap
osed
.Su
perim
posedareredho
rizon
talb
arsindica
tingthemarke
rba
ndloca
tions
asde
term
ined
byBa
ndLe
ader’s
marke
rlane
analysis.
Automated Agarose Gel Analysis
Genome Research 947www.genome.org
synthetic trace according to the model of Equation 5, providethe best least-squares fit to the preprocessed data.
We adopt a discrete implementation of the model, inwhich the possible mobilities mk are quantized onto a grid of1500 possible values, logarithmically spaced between a mini-mum and maximum mobility determined by the modelingstep. Typically this leads to step sizes on the “mobility grid”,as it is called, of approximately 0.2 pixels at low mobilitiesand 1 pixel at high mobility. This corresponds roughly to theresolution available from the band shapes, which decreaseswith increasing mobility. The typical quantization error inmobility leads to errors on the order of 0.25% in fragmentsize, ignoring other bandcalling errors.
The reason for the discretization of the mobilities ontothe mobility grid is that it simplifies the search procedure. Weuse a search algorithm that shares properties of both a gradi-ent algorithm and exhaustive search. As the band shapemodel is stored in a look-up table, it is not possible to com-pute gradients analytically; a numerical approach is required.
Cluster AnalysisOne of the characteristics of the trace T(y) is that the bandstend to occur in isolated groups containing typically any-where from 1–10 or 12 bands. We call these groups clusters. Inthe space between the clusters, the signal value is near 0, andthis fact can be used to isolate clusters. In effect, by searchingfor signal-absent regions the trace is broken down into a se-quence of contiguous signal-present and signal-absent re-gions. In this way the global model-fitting problem is reducedto a number of much smaller local model-fitting problems.
Grid SearchFollowing the partitioning of the trace and the mobility gridinto isolated clusters, each cluster is analyzed for the bestmodel fit. Suppose that a cluster occupies pixels N1···N2 andthat these same pixels correspond to mobilities M1··· M2 onthe mobility grid. Define N = N2 �N1 + 1 (number of pixels)and M = M2 � M1 + 1 (number of mobilities to test). Definethe test vector as s = T [N1 : N2] in MATLAB notation. We seeka model of the form
s � Ax (6)
where A is an N � M matrix whose columns contain the in-dividual band model. x is a vector of M integers, describingthe finite combination of bands to include in the model fit.Most of the entries of x will be either 0 or 1, but our modeldoes allow for multiple copies of bands at the same mobility.
The knowledge of the amplitudes of the bands, orequivalently the fact that the entries of the solution vector xare integers, eliminates the model-order problem which oftenplagues model-fitting procedures. There is no risk of overfit-ting the data with too many bands. Increasing the number ofbands over that which gives the optimal fit will simply in-crease the error between the data and linear combination;thus the fitting procedure is in a sense self-limiting.
We have crafted a hybrid numerical gradient search tosolve the model-fitting problem for one cluster. We adopt acost function h(s,Ax), and seek the value of the vector swhich minimizes this cost function. For simplicity, the detailsof the search algorithm are omitted here. The cost function isa modified least-squares function, where the modificationsaddress the uncertainty in the amplitude curve. The modifiedcost function places more emphasis on the shape of the targetfunction, and less on its amplitude.
Amplitude Curve EstimationThe determination of the amplitude curve ak, k = 1···1500 iscritical to the success of the algorithm described above. Nomi-nally, the amplitude curve is known to within a single scalefactor prior to the data analysis. However, the amplitudecurve varies from lane to lane, and the model based on inte-grated intensities is not sufficiently predictive to be used with-out modification. Accordingly, the full data lane analysis re-quires three passes through the data, with refinements of theamplitude curve at each pass.
Pass 1. The amplitude curve is found by scaling the nor-malized amplitude curve by a factor �, where � is chosen sothat 15% of the values in the trace vector y are above thecurve, and the remaining 85% below.We have found that thisnormally causes the adjusted curve to “hug” most of thesingle peaks, and that it allows the multiplet peaks to exceedthe curve. Using this scaled nominal amplitude curve, thealgorithm described above is run; however, only clusters withsinglets and resolved doublets are retained.
Pass 2. The normalized amplitude curve is again scaledby a factor �, this time chosen to achieve a least-squares fitbetween the trace vector t and the retained clusters. This newamplitude curve is again used in the gradient search proce-dure, and this time all the clusters are retained.
Pass 3. The amplitude curve is multiplied pointwise by acubic polynomial. The coefficients of this polynomial arechosen to minimize the squared error between a synthetictrace and the data.
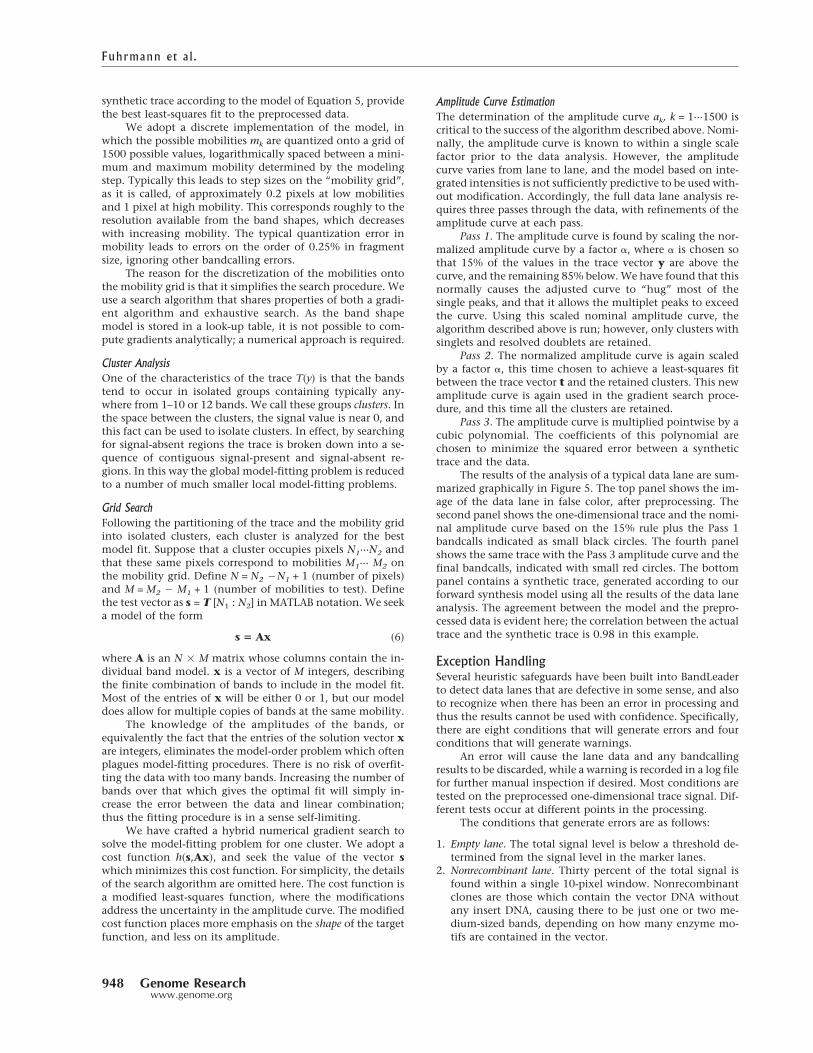
The results of the analysis of a typical data lane are sum-marized graphically in Figure 5. The top panel shows the im-age of the data lane in false color, after preprocessing. Thesecond panel shows the one-dimensional trace and the nomi-nal amplitude curve based on the 15% rule plus the Pass 1bandcalls indicated as small black circles. The fourth panelshows the same trace with the Pass 3 amplitude curve and thefinal bandcalls, indicated with small red circles. The bottompanel contains a synthetic trace, generated according to ourforward synthesis model using all the results of the data laneanalysis. The agreement between the model and the prepro-cessed data is evident here; the correlation between the actualtrace and the synthetic trace is 0.98 in this example.
Exception HandlingSeveral heuristic safeguards have been built into BandLeaderto detect data lanes that are defective in some sense, and alsoto recognize when there has been an error in processing andthus the results cannot be used with confidence. Specifically,there are eight conditions that will generate errors and fourconditions that will generate warnings.
An error will cause the lane data and any bandcallingresults to be discarded, while a warning is recorded in a log filefor further manual inspection if desired. Most conditions aretested on the preprocessed one-dimensional trace signal. Dif-ferent tests occur at different points in the processing.
The conditions that generate errors are as follows:
1. Empty lane. The total signal level is below a threshold de-termined from the signal level in the marker lanes.
2. Nonrecombinant lane. Thirty percent of the total signal isfound within a single 10-pixel window. Nonrecombinantclones are those which contain the vector DNA withoutany insert DNA, causing there to be just one or two me-dium-sized bands, depending on how many enzyme mo-tifs are contained in the vector.
Fuhrmann et al.
948 Genome Researchwww.genome.org
Figure
5Datalane
band
calling
step
s.Panel1: Imag
eda
taafterprep
roce
ssing.
Panel2:R
esultof
band
calling
,firs
tpa
ss. Panel3:
Resultof
band
calling
,sec
ondpa
ss.
Panel4:R
esulto
fban
dcallin
g,third
pass,w
ithindividu
alba
ndssupe
rimpo
sedin
red.Panel5: S
ynthetic
trac
eba
sedon
calle
dba
ndsan
destim
ated
mod
elpa
rameters.
Automated Agarose Gel Analysis
Genome Research 949www.genome.org
3. Low-mobility concentration. The total signal in the first 100pixels is greater than 80% of the total signal in the lane.
4. Overcount. The sum of all called fragment sizes exceeds auser-specified limit (e.g., 350 kbp).
5. Undercount. The sum of all called fragment sizes is below auser-specified limit (e.g., 50 kbp)
6. Poor quality measure. The correlation between the prepro-cessed trace and a synthetic signal generated using thebandcalls as input to our forward model is less than 0.9.
7. No singlets found. No singlets were identified in the firstbandcalling pass, thus making amplitude curve estimationimpossible.
8. Unknown error. A run-time software error such as divide-by-zero or subscript out-of-bounds is trapped by the MATLABerror handling routines. This prevents any remaining“bugs” in the software from halting production bandcall-ing, although naturally it is a cause for concern and usuallyleads to investigation and correction of the problem.
The conditions that generate warnings are as follows
1. Low-mobility contamination. Some lanes contain high-molecular-weight genomic DNA which does not belong toeither the vector or the insert. There are two tests for thiscondition: (a) The number of pixels that are assigned toband clusters in the first 180 pixels exceeds 60, and (b) thenumber of bands called in the first 20 pixels exceeds three.There is some modification to the processing under theseconditions; under condition (b), all bandcalls in the first 10pixels are disregarded.
2. Possible overcall. There are 10 or more bandcalls in anyregion of four or fewer pixels.
3. Saturation. The number of pixels in the high-mobility re-gion of the lane which are set equal to the largest outputvalue of the imaging A/D converter exceeds a given thresh-old.
4. High-mobility concentration. The total signal level in the last200 pixels exceeds the total signal in the first 400 pixels.
All of the errors and warnings are recorded in a separatelog file for each gel analyzed. In our experience it is rare thatall 96 data lanes are analyzed without error, with an averageof nine lanes per gel generating a warning or error record inthe log files.
Assessment of BandLeader PerformanceTo evaluate BandLeader’s performance on agarose fingerprint-ing gels, we identified a “test set” of 140 human BAC clonesand 185 mouse BAC clones. These were selected from amonga set of BACs, available in GenBank (http://www.ncbi.nlm.nih.gov), that had been sequenced completely and accu-rately (i.e., were “finished”) at Washington University Ge-nome Sequencing Center, the Whitehead Institute for Bio-medical Research Sequencing Center, or at the Sanger Insti-tute. We generated HindIII fingerprints of the BACs using ourstandard laboratory conditions (Schein et al. 2003). The re-sulting gel images were analyzed with BandLeader, and thebandcall data compared to the “in silico” fingerprints identi-fied by computer analysis of the sequenced BACs (see Meth-ods). In our analyses, the sizes of “in silico” and actual restric-tion fragments that were within an arbitrarily chosen 2% win-dow were classified as identical. This criterion was applied toall restriction fragments except those less than 600 base pairs(bp). These were excluded because under our standard finger-printing gel conditions they tend to be diffuse with low levels
of signal, obviating their accurate identification by any ap-proach. The adoption of a test set of fingerprinted BACs wascrucial, as it provided us with objective “ground truth” testdata that made critical evaluation of BandLeader performancepossible.
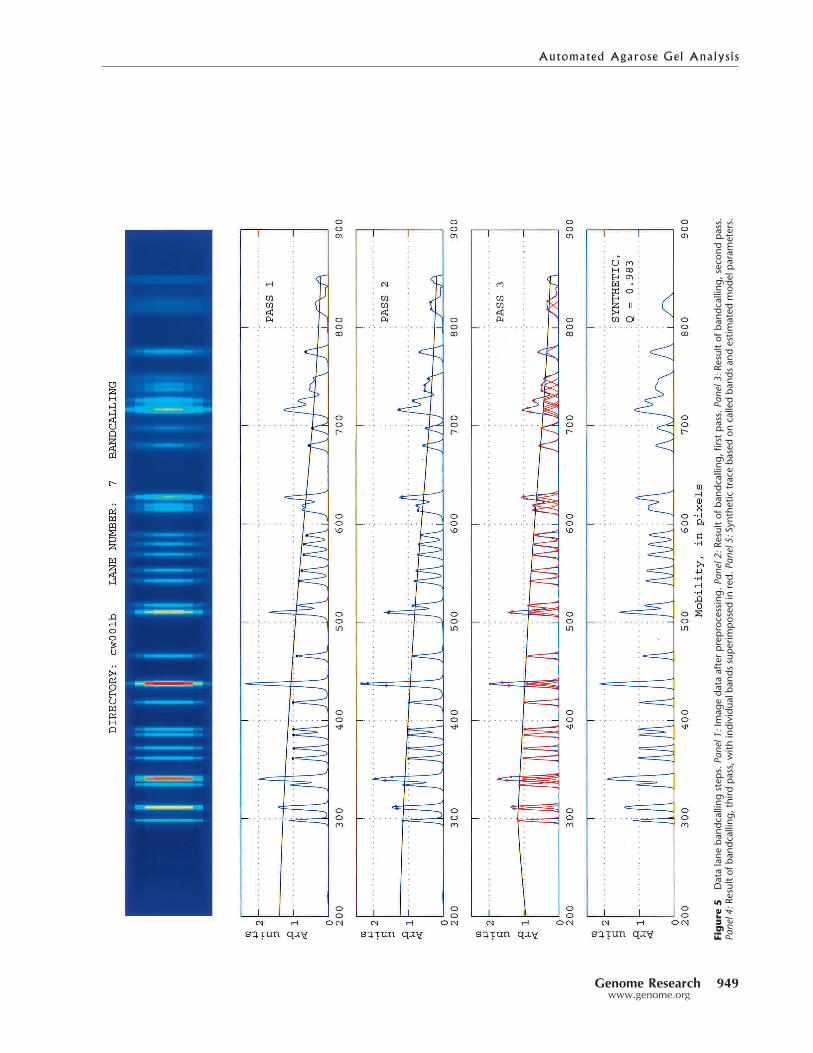
The results of our analyses are shown in Figure 6A. Forcomparison, we have included the results of a similar analysisperformed using automatically generated IMAGE bandcalls(Fig. 6B). Of the 140 fingerprinted human BACs and 185fingerprinted mouse BACs considered for this analysis,BandLeader accepted 139 and 183, respectively. Analysis ofthe sequences corresponding to these clones revealed thatthey contain 16,782 HindIII restriction fragments. Of these,BandLeader correctly identified 16,134, corresponding to asensitivity measure of 96.13%. Of the 16,736 fragments iden-tified by BandLeader, 16,138 correctly identified a sequence-predicted fragment, for a specificity measure of 96.42%. Forcomparison, automated IMAGE bandcalls are only 60.99%sensitive and 88.65% specific. Hence, although BandLeader isnot perfect, it offers a remarkable improvement over IMAGE.Further, BandLeader outperforms the manual efforts of evenour most experienced technical staff, at throughputs far ex-ceeding those possible by manual analysis of the fingerprint-ing gels.
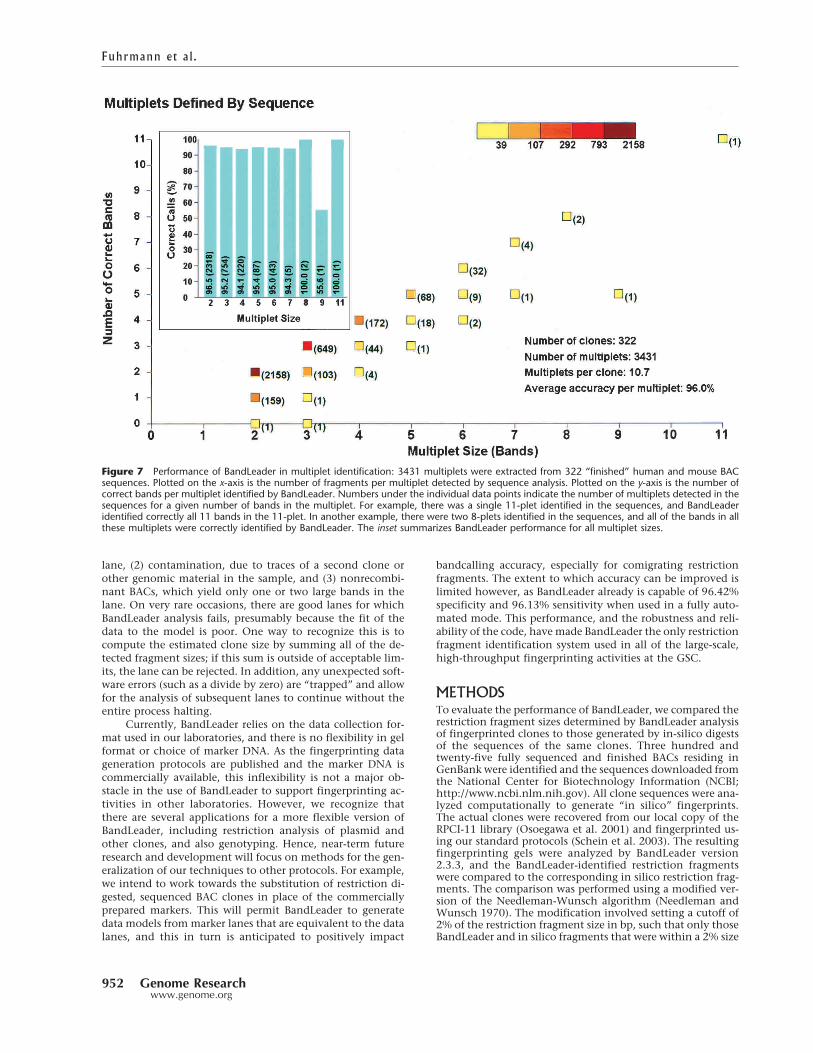
A major goal of the BandLeader project was to producesoftware that would reliably detect multiplets, which we de-fined as restriction fragments that comigrated within thesame data lane on a fingerprinting gel. We assessed the per-formance of BandLeader in multiplet identification as fol-lows. First, we identified as multiplets all fragments in BACsequence data falling within a restriction fragment sizewindow of +/� 2%. A similar grouping was done for theBandLeader bandcalls corresponding to these clones. A totalof 322 human and mouse BAC sequences were analyzed and3431 multiplets found in the sequence, for an average of ap-proximately 10 multiplets per sequenced BAC. BandLeadercorrectly predicted band multiplicity in 96.0 % of thesecases (see Fig. 7 and Methods). BandLeader’s performance,even on the larger fragment clusters, is striking. For example,BandLeader correctly identifies a cluster of 11 bands. Again,although BandLeader is not perfect, it is distinctly superior toany other bandcalling option we are aware of, manual or au-tomatic.
DISCUSSIONWe have described a set of software tools for the automatedanalysis of agarose gel images acquired during the DNA fin-gerprinting process. The various steps involved are commonto many image analysis and related engineering problems.First, a model was established for the process of electropho-resis and the digital image acquisition. The model includedsufficient detail to allow for variations in the model param-eters, but was not so complex as to lead to unwieldy imageanalysis tasks. Based on this model, procedures were derivedfor determining the model parameters (through the use ofmarker lanes) and for solving the inverse problem on the datalanes. The integrated suite of tools, written in MATLAB andcollectively called BandLeader, has been used for the mousefingerprint mapping project at the BCCA (Gregory et al. 2002)and is currently being used in fingerprint mapping projectstargeting the rat and bovine genomes (J. Schein, I. Bosdet,C. Mathewson, N.Wye, R. Chiu, C. Fjell, H. Shin, S. Jones, andM. Marra, unpubl.).
The use of automated image analysis for high-
Fuhrmann et al.
950 Genome Researchwww.genome.org
throughput fingerprint mappingprojects has important advantages.Chief among these are the increasesin both the rate and accuracy ofdata analysis and the opportunityto reanalyze the very large finger-print data sets if more suitable pa-rameters are found. Further, the op-portunity exists to repeatedly ana-lyze the gel images to collectstatistics. For example, our entireset of mouse (C57BL/6) fingerprints(3500 gels containing more than330,000 fingerprints) can be reanal-yzed in 600 CPU hours. Since eachgel analysis is independent, the pro-cess is amenable to parallelization,such that only about 24 processorswould be needed to reanalyze the3500-gel mouse set in one day.
The BandLeader software hasalready proven of enormous valuein completing mapping projectsthat would otherwise be unfeasiblegiven time and budgetary con-straints. We have used versions ofBandLeader to analyze 13,629 fin-gerprinting gels, generated in fin-gerprint mapping efforts aimed atbacterial, fungal, plant, and animalgenomes. Although BandLeader’sperformance is excellent, there isroom for incremental improve-ment. With continued careful mod-eling and algorithm improvement,we see the potential for increasedbandcalling performance, withgains in sensitivity, specificity, andsizing accuracy. One of the morechallenging aspects of the auto-mated trace analysis has been theestimation of the amplitude curve,which facilitates detection of mul-tiple bands. The human eye adaptsquite easily to model variations andaberrations, and in all but the mostpathological cases it is a simplematter for our technical staff toidentify singlets visually and hy-pothesize a smooth curve connect-ing the peaks. In our automatedanalysis, it has proven difficult tosort out the singlets, multiplets,and clusters, and derive a reliableamplitude curve. The current ver-sion of the software is doing a sat-isfactory job with this particulartask, but on rare occasions, errorsmay cause a lane to be failed.
There are several safeguardsbuilt into the software to recognizebad data and to abort the process-ing for a given lane. Causes of un-usable data include: (1) an empty
Figure 6 Comparison of BandLeader (A) and IMAGE (B) performance on test gels. “Real fragmentsize”, plotted on the x-axes, refers to restriction fragment size as determined by computer analysis of“finished” human and mouse BAC sequence data. Fragment sizes determined by BandLeader orIMAGE are plotted on the y-axes. Fragments less than 600 bp are not considered. Each data pointrepresents the comparison of a restriction fragment predicted by sequence analysis to a restrictionfragment identified by either IMAGE or BandLeader. Red lines on the plot indicate a 2% size window.Points falling within the 2% window are considered to represent identical restriction fragments. “Totalcalled” refers to the number of restriction fragments identified by IMAGE or BandLeader. “Totalcorrect” refers to the number of these fragments that match the corresponding sequence-predicted frag-ments. This is a measure of specificity. “Total real” refers to the number of sequence-predicted fragments,and “total found” refers to the number of these detected by the software. This is a measure of sensitivity.
Automated Agarose Gel Analysis
Genome Research 951www.genome.org
lane, (2) contamination, due to traces of a second clone orother genomic material in the sample, and (3) nonrecombi-nant BACs, which yield only one or two large bands in thelane. On very rare occasions, there are good lanes for whichBandLeader analysis fails, presumably because the fit of thedata to the model is poor. One way to recognize this is tocompute the estimated clone size by summing all of the de-tected fragment sizes; if this sum is outside of acceptable lim-its, the lane can be rejected. In addition, any unexpected soft-ware errors (such as a divide by zero) are “trapped” and allowfor the analysis of subsequent lanes to continue without theentire process halting.
Currently, BandLeader relies on the data collection for-mat used in our laboratories, and there is no flexibility in gelformat or choice of marker DNA. As the fingerprinting datageneration protocols are published and the marker DNA iscommercially available, this inflexibility is not a major ob-stacle in the use of BandLeader to support fingerprinting ac-tivities in other laboratories. However, we recognize thatthere are several applications for a more flexible version ofBandLeader, including restriction analysis of plasmid andother clones, and also genotyping. Hence, near-term futureresearch and development will focus on methods for the gen-eralization of our techniques to other protocols. For example,we intend to work towards the substitution of restriction di-gested, sequenced BAC clones in place of the commerciallyprepared markers. This will permit BandLeader to generatedata models from marker lanes that are equivalent to the datalanes, and this in turn is anticipated to positively impact
bandcalling accuracy, especially for comigrating restrictionfragments. The extent to which accuracy can be improved islimited however, as BandLeader already is capable of 96.42%specificity and 96.13% sensitivity when used in a fully auto-mated mode. This performance, and the robustness and reli-ability of the code, have made BandLeader the only restrictionfragment identification system used in all of the large-scale,high-throughput fingerprinting activities at the GSC.
METHODSTo evaluate the performance of BandLeader, we compared therestriction fragment sizes determined by BandLeader analysisof fingerprinted clones to those generated by in-silico digestsof the sequences of the same clones. Three hundred andtwenty-five fully sequenced and finished BACs residing inGenBank were identified and the sequences downloaded fromthe National Center for Biotechnology Information (NCBI;http://www.ncbi.nlm.nih.gov). All clone sequences were ana-lyzed computationally to generate “in silico” fingerprints.The actual clones were recovered from our local copy of theRPCI-11 library (Osoegawa et al. 2001) and fingerprinted us-ing our standard protocols (Schein et al. 2003). The resultingfingerprinting gels were analyzed by BandLeader version2.3.3, and the BandLeader-identified restriction fragmentswere compared to the corresponding in silico restriction frag-ments. The comparison was performed using a modified ver-sion of the Needleman-Wunsch algorithm (Needleman andWunsch 1970). The modification involved setting a cutoff of2% of the restriction fragment size in bp, such that only thoseBandLeader and in silico fragments that were within a 2% size
Figure 7 Performance of BandLeader in multiplet identification: 3431 multiplets were extracted from 322 “finished” human and mouse BACsequences. Plotted on the x-axis is the number of fragments per multiplet detected by sequence analysis. Plotted on the y-axis is the number ofcorrect bands per multiplet identified by BandLeader. Numbers under the individual data points indicate the number of multiplets detected in thesequences for a given number of bands in the multiplet. For example, there was a single 11-plet identified in the sequences, and BandLeaderidentified correctly all 11 bands in the 11-plet. In another example, there were two 8-plets identified in the sequences, and all of the bands in allthese multiplets were correctly identified by BandLeader. The inset summarizes BandLeader performance for all multiplet sizes.
Fuhrmann et al.
952 Genome Researchwww.genome.org
window were classified as identical. In addition, a cutoff of600 bp was introduced, as our standard laboratory protocolsdo not yield reliable data for fragments that are smaller thanthis size. The in silico and BandLeader-generated datasetswere each used in turn as the reference fingerprint set, and thepercentage of matching bands for all of the test clones wastaken and designated as the “sensitivity” and “specificity”merits, respectively.
ACKNOWLEDGMENTSThis work was supported in part by NIH grants 1-U01-HG02042, Sequencing the Human Genome, and 1-U01-HG02155, Sequencing the Mouse Genome. We gratefully ac-knowledge the support of the British Columbia Cancer Foun-dation, the British Columbia Cancer Agency (BCCA), and allmembers of the Mapping Group at the BCCA Genome Sci-ences Centre. M.M. is a Michael Smith Foundation for HealthResearch Scholar.
The publication costs of this article were defrayed in partby payment of page charges. This article must therefore behereby marked “advertisement” in accordance with 18 USCsection 1734 solely to indicate this fact.
REFERENCESThe C. elegans Genome Sequencing Consortuim 1998. Genome
sequence of the nematode C. elegans: A platform forinvestigating biology. Science 282: 2012–2018.
Chen, M., Presting, G., Barbazuk, W.B., Goicoechea, J.L., Blackmon,B., Fang, G., Kim, H., Frisch, D., Yu, Y., Sun, S., et al. 2002. Anintegrated physical and genetic map of the rice genome. PlantCell 14: 537–545.
Coulson, A., Huynh, C., Kozono, Y., and Shownkeen, R. 1995. Thephysical map of the Caenorhabditis elegans genome. Methods CellBiol. 48: 533–550.
Coulson, A.R., Sulston, J., Brenner, S., and Karn, J. 1986. Towards aphysical map of the genome of the nematode Caenorhabditiselegans. Proc. Natl. Acad. Sci. 83: 7821–7825.
Gregory, S.G., Howell, G.R., and Bentley, D.R. 1997. Genomemapping by fluorescent fingerprinting. Genome Res.7: 1162–1168.
Gregory, S.G., Sekhon, M., Schein, J., Zhao, S., Osoegawa, K., Scott,C.E., Evans, R.S., Burridge, P.W., Cox, T.V., Fox, C.A., et al. 2002.A physical map of the mouse genome. Nature 418: 743–750.
Grenander, U. and Miller, M.I. 1994. Representations of knowledgein complex systems. J. Royal Stat. Soc. B 56: 549–603.
Hoskins, R.A., Nelson, C.R., Berman, B.P., Laverty, T.R., George, R.A.,Ciesiolka, L., Naeemuddin, M., Arenson, A.D., Durbin, J., David,R.G., et al. 2000. A BAC-based physical map of the majorautosomes of Drosophila melanogaster. Science 287: 2271–2274.
Jain, A., Zhong, Y., and Lakshmanan, S. 1996. Object matching viadeformable templates. IEEE Trans. Pattern Analysis and MachineIntelligence 18: 267–278.
Marra, M., Kucaba, T., Sekhon, M., Hillier, L., Martienssen, R.,Chinwalla, A., Crockett, J., Fedele, J., Grover, H., Gund, C., et al.1999. A map for sequence analysis of the Arabidopsis thalianagenome. Nat. Genet. 22: 265–270.
Marra, M.A., Kucaba, T.A., Dietrich, N.L., Green, E.D., Brownstein,B., Wilson, R.K., McDonald, K.M., Hillier, L.W., McPherson, J.D.,and Waterston, R.H. 1997. High throughput fingerprint analysisof large-insert clones. Genome Res. 7: 1072–1084.
McPherson, J.D., Marra, M., Hillier, L., Waterston, R.H., Chinwalla,
A., Wallis, J., Sekhon, M., Wylie, K., Mardis, E.R., Wilson, R.K., etal. 2001. A physical map of the human genome. Nature409: 934–941.
Mozo, T., Dewar, K., Dunn, P., Ecker, J.R., Fischer, S., Kloska, S.,Lehrach, H., Marra, M., Martienssen, R., Meier-Ewert, S., et al.1999. A complete BAC-based physical map of the Arabidopsisthaliana genome. Nat. Genet. 22: 271–275.
Needleman, S.B., and Wunsch, C.D. 1970. A general methodapplicable to the search for similarities in the amino acidsequence of two proteins. J. Mol. Biol. 48: 443–453.
Olson, M.V., Dutchik, J.E., Graham, M.Y., Brodeur, G.M., Helms, C.,Frank, M., MacCollin, M., Scheinman, R., and Frank, T. 1986.Random-clone strategy for genomic restriction mapping in yeast.Proc. Natl. Acad. Sci. 83: 7826–7830.
Osoegawa, K., Mammoser, A.G., Wu, C., Frengen, E., Zeng, C.,Catanese, J.J., and de Jong, P.J. 2001. A bacterial artificialchromosome library for sequencing the complete humangenome. Genome Res. 11: 483–496.
O’Sullivan, J.A., Blahut, R.E., and Snyder, D.L. 1998.Information-theoretic image formation. IEEE Trans. Info. Theory44: 2094–2123.
Schein, J., Tangen, K., Chiu, R., Shin, H., Lengeler, K.B., MacDonald,K., Bosdet, I., Heitman, J., Jones, S.J.M., Marra, M., et al. 2002.Physical maps for genome analysis of serotype A and D strains ofthe fungal pathogen Cryptococcus neoformans. Genome Res.12: 1445–1453.
Schein, J., Kucaba, T., Sekhon, M., Smailus, D., Waterston, R., andMarra, M. 2003. High-throughput BAC fingerprinting. InBacterial artificial chromosomes: methods and protocols (eds. S. Zhaoand M. Stodolsky), Humana Press Inc., Totowa, NJ (in press).
Shizuya, H., Birren, B., Kim, U.J., Mancino, V., Slepak, T., Tachiiri,Y., and Simon, M. 1992. Cloning and stable maintenance of300-kilobase-pair fragments of human DNA in Escherichia coliusing an F-factor-based vector. Proc. Natl. Acad. Sci. 89:8794–8797.
Sulston, J., Mallett, F., Staden, R., Durbin, R., Horsnell, T., andCoulson, A. 1988. Software for genome mapping byfingerprinting techniques. Comput. Appl. Biosci. 4: 125–132.
Sulston, J., Mallett, F., Durbin, R., and Horsnell, T. 1989. Imageanalysis of restriction enzyme fingerprint autoradiograms.Comput. Appl. Biosci. 5: 101–106.
Tao, Q., Chang, Y.L., Wang, J., Chen, H., Islam-Faridi, M.N.,Scheuring, C., Wang, B., Stelly, D.M., and Zhang, H.B. 2001.Bacterial artificial chromosome-based physical map of the ricegenome constructed by restriction fingerprint analysis. Genetics158: 1711–1724.
Wechter, W.P., Begum, D., Presting, G., Kim, J.J., Wing, R.A., andKluepfel, D.A. 2002. Physical mapping, BAC-end sequenceanalysis, and marker tagging of the soilborne nematicidalbacterium, Pseudomonas synxantha BG33R. OMICS 6: 11–21.
Zalubas, E.J., O’Niell, J.C., Williams, W.J., and Hero, A.O. 1997. Shiftand scale invariant detection. Proc. ICASSP (Munich, Germany)5: 3637–3640.
WEB SITE REFERENCEShttp://www.sanger.ac/Software/Image; IMAGE software is available at
this Sanger Institute site.http://www.ncbi.nlm.nih.gov; NCBI home page. Access to GenBank
database.
Received October 11, 2002; accepted in revised form February 26, 2003.
Automated Agarose Gel Analysis
Genome Research 953www.genome.org