Embed Size (px)
Citation preview
S O F T W A R E QUALITY:
BARBARA KITCHENHAM, National Computing Centre SHARI LAWRENCE PFLEEGER, Systerns/Software, Inc.
n the recent past, when bank ; context is important. Errors toler- statements contained errors ated in word-processing software or the telephone network may not be acceptable in control broke down, the general pub- software for a nuclear-power plant.
lic usually blamed “the computer,” i Thus, we must reexamine the making no distinction between i meanings of “safety-critical” and hardware and software. However, “mission-critic.al” in the context of high-profile disasters and the ensu- software’s contribution to the ing debates in the press are alerting i larger functionality and quality of more people to the crucial nature ! products and businesses. At the of software quality in their every- same time, we must ask ourselves day lives. Before long, we can ex- who is responsible for setting qual- pect increasing public concern ity goals and making sure they are about the pervasiveness of soft- achieved. ware, not only in public services but also in consumer products like i WHAT DOES QUALITY automobiles, washing machines, REALLY MEAN? telephones, and electric shavers. i Consequently, we software profes- ! Most of us are affected by the sionals need to worry about the ! quality of the software we create quality of all our products - from because our organization’s viability large, complex, stand-alone sys- depends on it. And most software- tems to small embedded ones. ! related tools and methods - in-
So how do we assess “adequate” ; cluding those described in IEEE quality in a software product? The Sofcware - claim to assess or im-
I
12 0 7 4 0 J A N U A R Y 1996 7 4 5 9 / 9 6 / $ 0 5 00 0 1 9 9 6 I E E E
Authorized licensed use limited to: The University of Arizona. Downloaded on January 9, 2009 at 13:16 from IEEE Xplore. Restrictions apply.
prove software quality in some way. So we must question what we and our cus- tomers mean by software quality.
A good definition must let us mea- sure quality in a meaningful way. Measurements let us know if our tech- niques really improve our software, as well as how process quality affects prod- uct quality. We also need to know how the quality we build in can affect the product’s use after delivery and if the in- vestment of time and resources to assure high quality reap higher profits or larger market share. In other words, we want to know if good software is good business.
Recent articles have raised this ques- tion, but the answer is still far from clear. Still, most people believe that quality is important and that it can be improved. Companies and countries continue to invest a great deal of time, money, and effort in improving software quality. But we should try to determine if these na- tional initiatives have directly affected and improved software quality. The an- swer may depend on how you approach quality improvement. Some companies take a product-based approach, while others focus on process; both strategies have led to Malcolm Baldridge awards
for overall product quality. In their more general questioning of
quality goals and techniques, Roger Howe, Dee Gaeddert, and Maynard Howe pointed out that most quality ini- tiatives either fail (by drowning in a sea of rhetoric) or cannot demonstrate suc- cess because no financial r e t u n can be identified.’ In this special issue, we ques- tion software quality in the same way. We consider the meaning of software quality, how we assess it, and whether the steps we are taking to improve it are really worthwhile.
VIEWS OF SOFTWARE QUALITY
In an influential paper examining views of quality, David Gamin studied how quality is perceived in various do- mains, including philosophy, economics, marketing, and operations management.’ H e concluded that “quality is a complex and multifaceted concept” that can be de- scribed from five different perspectives. + The transcendental view sees quality as something that can be recognized but not defined. + The user view sees quality as fitness for purpose.
+ The manujicturing view sees qual- ity as conformance to specification. + The product view sees quality as tied to inherent characteristics of the product. + The value-based view sees quality as dependent on the amount a customer is willing to pay for it.
Transcendental view. This view of soft- ware quality is much like Plato’s descrip- tion of the ideal or Aristotle’s concept of form. Just as every table is different but each is an approximation of an ideal table, we can think of software quality as something toward which we strive as an ideal, but may never implement com- pletely. When software gurus exhort us to produce products that delight users, this delight represents the strived-for “recognition” in the transcendental def- inition of quality.
User view. Whereas the transcenden- tal view is ethereal, the user view is more concrete, grounded in product charac- teristics that meet the user’s needs. This view of quality evaluates the product in a task context and can thus be a highly personalized view. In reliability and per- formance modeling, the user view is in-
EOFTWARE QUALITY SURVEY IASL year we invited readers lo air
their view on soft~r are quality by coni- plctiiig a short questiomiairc. As proniisetl? we report the results of the sui-vey here. \,\’e thank those who coiii- pleted the questionnaire. Of the 27 re- spondents, 1; uwe froni rhe US, live froni Europe, and fiw from Asia - sim- ilar to the distribution of lb.’/*,‘f; .’ii!~mm reiiders. Respondents l~ackground cxpc- rience w a s mixed and soiuc indivitluals marked several categor nine marks in developmeni and seven iii rescarch. Of‘the 12 who markecl “other,” five \\rote in “qmalin- asstirmce.”
:\Ithough this is ncithcr ;I large nor rcprcsenrati\ e saniple, we hope that thc responses will rnaltc !;OLI think ahout your own perspective on quality and cx- arniuc how qii;ility is effected hy the tiest-liractice activities ! ~ L I irnplenient.
Views of quality. \.Vc ;isLcd respon- tlcnts to suggest thcir own quality cleti- nitions :ind then assessed thein against
I I I , I I ~ I I ~ ~ I ~ ~ I I I I ~ ~ I ~ ~ i i w (17 and 13, rcspcc- ti \L*l ! I . I loi\c~\.ci., 14 respondents sus- qcstcd definitions tha t covered two or more different views. Other vicwpoiii ts included product (nine reslioiidents), tr,i n scen de n tal (thrcc), and \,a I ue (fire).
O f the 27 respondents, I8 strongly agreed and seven aprccd tha t software q t d i t ~ constituted a prol)leiii. \Vhcn asked i f a cl~~iIit!-in:iiiageiiieiit systciii alone could solve tlic q i d i t y problein. 18 disagreed, thrcc :igrcetl, nnd t ~ v o re-
Opinions were inixc ’ .. I . , ....‘a. :‘.: . S~l~Jlld~ll~S S L l . O l l g l ~ >lgrCcd.
qualit!! is nioic o r Icss i b . . i . : I , , : : :I
time to market: 17 thought time to inarket was oFeqti:il or greater inipor- tance than quality i i i i ( l w x ’ i i ilioiigli~ qii;lli t!, n as no re i i I I I ) ( i11;i 111 !I 1 1 I’CY Iiii( I no opinion). On the relative vdue of quality ancl protlucti\in; 17 thought qixility \vas inore important tlian pro-
dtictirity a11d ninc thought protluctivit\.. n:1s of equal or greater importance.
Quality issues. \.\:e asked rcsponilcnts to select thrce c p l i t y issues from a list and rank them in terms of inipc)rtance. Mi. used :i simple ranking ordcr for thc
igning three points to the item niarkcd as most in ip - f i i n t , two points to those marked ;is next most im- portant, and one point to thc third inwr important issuc.
Respondents ranked speci$ing qu;iI- ity requirernents ohjcctively as most ini- portant (28 points), followed 11. scttirig 111) a cl~i~ilit\:-nianagcriieiit spsteni (20 points). This implics that respoideiits rate a UhIS as necessary - but not suf- f ic ient - for addressing qiialiri,. :Ichieving operational quality that inccts requirements U a s ~.:inl;etl third (18 points), follon-ed b!; mcasiiring qunlity achievcincnts ( 1 7 points), a n d agreeing wi th thc ctistoiiier o n nhat qualit!, iiieans ( 1 5 pints).
I E E E S O F T W A R E
Authorized licensed use limited to: The University of Arizona. Downloaded on January 9, 2009 at 13:16 from IEEE Xplore. Restrictions apply.

G U E S T E D I T O R S ’ I N T R O D U C T I O N
herent, since both methods assess prod- uct behavior with respect to operational profiles (that is, to expected functionality and usage patterns). Product usability is also related to the user view: in usability laboratories, researchers observe how users interact with software products.
Manufacturing view. The Manufactur- ing view focuses on product quality during production and after delivery. This view examines whether or not the product was constructed “right the first time,” in an effort to avoid the costs as- sociated with rework during develop- ment and after delivery. This process focus can lead to quality assessment that is virtually independent of the product itself. That is, the manufactur- ing approach - adopted by I S 0 90013 and the Capability Maturity Model4 - advocates conformance to process rather than to specification.
There is little evidence that confor- mance to process standards guarantees good products. In fact, critics of this view suggest that process standards guarantee only uniformity of output and can thus institutionalize the pro- duction of mediocre or bad products. However, this criticism may be unfair. Although process standards are usually based on the principle of “documenting what you do and doing what you say,” both CMM and I S 0 9001 also insist (with different degrees of emphasis) that you improve your process to enhance product quality.s
Product view. Whereas the user and manufacturing views examine the prod- uct from without, a product view of qual- ity looks inside, considering the product’s inherent characteristics. This approach is frequently adopted by software-metrics advocates, who assume that measuring and controlling internal product proper- ties (internal quality indicators) will result in improved external product behavior (quality in use). Assessing quality bymea- suring internal properties is attractive be- cause it offers an objective and context- independent view of quality. However, more research is needed to confirm that internal quality assures external quality and to determine which aspects of inter-
I E E E S O F T W A R E
nal quality affect the product’s use. Some researchers have developed models to link the product view to the user view.
Value-based view. Different views can be held by different groups involved in soft- ware development. Customers or market- ing groups typically have a user view, re- searchers a product view, and the production department a manufacturing view. If the difference in viewpoints is not made explicit, misunderstandings about quality created during project initiation are likely to resurface as (potentially) major problems during product acceptance.
These disparate views can comple- ment each other in early phases. If the user’s view is stated explicitly during re- quirements specification, the technical specification that drives the production process can be derived directly from it - as can product functionality and features. However, problems can arise when changes to the requirements occur. At this point, the user’s requirement for a useful product may be in conflict with the man- ufacturer’s goal of minimizing rework.
This is where the value-based view of quality becomes important. Equating quality to what the customer is willing to pay for encourages everyone to consider the trade-offs between cost and quality. A value-based perception can involve tech- niques to manage conflicts when require- ments change. Among them are “design to cost,” in which design possibilities are constrained by available resources and “requirements scrubbing,” in which re- quirements are assessed and revised in light of costs and benefits.
Product purchasers take a rather dif- ferent value-based view. Part of their job is to know if a software product repre- sents value for money to their organiza- tion. In this context, internal software measures are irrelevant. Purchasers com- pare the product cost with the potential benefits. In her article in this issue, “Quality Outcomes: Determining Bus-
benefits obtained from investment in in- formation systems.
iness Value,” Pamela Simmons discusses
MEASURING QUALITY
The perspective we take on quality
influences how we define it. But we also want to be able to measure quality so we can establish baselines, predict likely quality, and monitor improvement. Here, too, perspective influences our choice. Users assess software-product quality in terms of their interaction with the final product. Product attributes that contribute to user satisfaction are a mix- ture of
+ the product’s functions, which are either present or absent;
+ the product’s nonfunctional quali- ties (its behavior), which is measurable within some range; and
+ the constraints that determine if a customer will use a particular product.
For example, a system may be re- quired to perform a particular function, and a nonfunctional requirement may prescribe that the function be performed within two seconds of its invocation. At the same time, the system is constrained by the function’s cost and availability, as well as the environment it will be used in.
Past discussions of product quality have ignored constraints, which are con- sidered to be the responsibility of man- agers who consider trade-offs between quality and cost. Some quality experts now suggest that all aspects of quality re- lated to user needs be considered during definition and assessment. This corre- sponds to the I S 0 definition of quality, “the totality of characteristics of an entity that bear on its ability to satisfy stated and implied
Measuring the user’s view. When users think of software quality, they often think of reliability: how long the prod- uct functions properly between fail- ures. Reliability models plot the num- ber of failures over time.’ These
. -
Authorized licensed use limited to: The University of Arizona. Downloaded on January 9, 2009 at 13:16 from IEEE Xplore. Restrictions apply.

~~
G U E S T E D I T O R S ’ I N T R O D U C T I O N
models sometimes use an operational profile, which depicts the likely use of different system functions.*
Users, however, often measure more than reliability. They are also concerned about usability, including ease of instal- lation, learning, and use. Tom Gilb sug- gests that these characteristics can be measured directly.’ For example, learn- ing time can be captured as the average elapsed time (in hours) for a typical user to achieve a stated level of competence.
Gilb’s technique can be generalized to any quality feature. The quality concept is broken down into component parts until each can be stated in terms of di- rectly measurable attributes. Thus, each quality-requirement specification in- cludes a measurement concept, unit, and tool, as well as the planned level (the tar- get for good quality), the currently avail- able level, the best possible level (state- of-the-art), and worst level. Gilb does not prescribe a universal set of quality concepts and measurements, because dif- ferent systems will require different qual- ities and different measurements.
Measuring the manufacturer’s view. The manufacturing view of quality suggests two characteristics to measure: defect counts and rework costs.
Defectcounts. Defect counts are the num- ber of known defects recorded against a product during development and use. For comparison across modules, prod- ucts, or projects, you must count defects in the same way and at the same time during the development and mainte- nance processes. For more detailed analysis, you can categorize defects on the basis of the phase or activity where the defect was introduced, as well as the phase or activity in which it was detected. This information can be especially help- hl in evaluating the effects of process change (such as the introduction of in- spections, tools, or languages).
The relationship between defects counts and operational failures is unclear. However, you can use defect counts to indicate test efficiency and identify process-improvement areas. In addition, a stable environment can help you esti- mate post-release defect counts.
I E E E S O F T W A R E
To compare the quality of different products, you can “normalize” defect count by product size, to yield a defect density. This measure lets you better compare modules or products that differ greatly in size. In addition, you can “nor- malize” postrelease defect counts by the number of product users, the number of installations, or the amount of use. Divi- ding the number of defects found during a particular development stage by the total number of defects found during the product’s life helps determine the effec- tiveness of different testing activities.
Rework costs. Defects differ in their effect on the system: some take a little time to find and fix; others are catastrophic and consume valuable resources. To monitor the effect of defect detection and correc- tion, we often measure rework costs - the staff effort spent correcting defects before and after release. This cost of nonconformance supports the manufac- turing view.
Rework is defined as any additional effort required to find and fix problems after documents and code are formally signed-off as part of configuration man- agement. Thus, end-phase verification and validation are usually excluded, but debugging effort during integration and system testing is included. To compare different products, rework effort is some- times “normalized” by being calculated as a percentage of development effort.
Because we want to capture the cost of nonconformance, we must be sure to distinguish effort spent on enhance- ments from effort spent on maintenance. Only defect correction should count as rework. It is also important to separate pre- and postrelease rework. Postrelease rework effort is a measure of delivered quality; prerelease rework effort is a mea- sure of manufacturing efficiency. If we zan attribute the prerelease rework effort to specific phases, we can use it to iden- tify areas for process improvement.
Developers and customers alike are interested in knowing as early as possible the likely quality of the delivered prod- uct. But the relationship between post- delivery failure and defects, structural measures, and other predelivery infor- mation is far from clear. In 1984, the
Esprit-funded Request project con- cluded that there were no software-prod- uct metrics that were likely to be good predictors of final product qualities.” Twelve years later, there is no evidence of any significant improvement. Much use- ful software-metrics research concen- trates instead on linking software-prod- uct measures to error-prone modules.
An example of this type of work is found in the article by Taghi Koshgoftaar and colleagues, “Early Quality Pre- diction: A Case Study in Telecommu- nications,” in this issue. However, re- searchers have provided no convincing evidence that module-level measures are consistently related to external, behav- ioral properties of the product as a whole. Indeed, there are major technical
difficulties in assessing such relation- ships; correlating system-level measures with simple module-level statistics, such as means, are unlikely to be appropriate.
Capturing quality data. The way we mea- sure quality depends on the viewpoint we take and the aspect of quality we want to capture. Peter Mellor provides guidelines for defining incidents, failures, and faults that can help you capture raw data for re- liability assessment.” This type of data can measure other aspects related to the user view of quality. Proper classification of incidents lets us identify potential us- ability problems (that is, incidents result- ing from misuse of the software or m i s - understanding of the user manuals and help systems). In addition, information about the time and effort needed to diag- nose the cause of different priorities and correct any underlying faults can give 11s useful information about system main- tainability. This sort of data is often used to monitor service-level agreements that define the obligations of software-main- tenance organizations.
Authorized licensed use limited to: The University of Arizona. Downloaded on January 9, 2009 at 13:16 from IEEE Xplore. Restrictions apply.

p v e 1 . McCall’s quality model defines sojiware-product qualities us a hierarchy t o n , cvzteria, and metrics.
Capturing data associated with other quality aspects -particularly those asso- ciated with the product and manufactur- ing view - is usually part of a company’s software-measurement system. The par- ticular measures an organization collects will depend on its goals and management requirements. Techniques such as the Goal-Question-Metric paradigm devel- oped by Vic Basili and colleagues’2 can help us identify which measures will help us monitor and improve quality.
MODELING QUALITY
To understand and measure quality, researchers have often built models of how quality characteristics relate to one another. Just as Gilb decomposed quality
*
into various factors, so have others de- picted quality in a hierarchical way. In the past, many researchers developed soft- ware quaky models that were intended to be comprehensive and applicable to all software development.
McCall’s quality model. One of the earli- est quality models was suggested by Jim McCall and colleagues.13 As shown in Figure 1, the model defines software- product qualities as a hierarchy of factors, criteria, and metrics. The arrows indicate which factors the criteria influence.
A quality factor represents a behav- ioral characteristic of the system. A qual- ity criterion is an attribute of a quality factor that is related to software produc- tion and design. A quality metric is a
neasure that captures some aspect of a pality criterion. Thus, the 11 quality -actors contribute to a complete picture If software quality.
One or more quality metric should be issociated with each criterion. Thus, as h e figure shows, you can measure porta- d i t y by combining self-descriptiveness, nodularity, software-system indepen- dence, and machine independence. The netrics are derived from the number of ‘yes” responses to questions whose an- jwers are subjective, such as “Is all docu- mentation structured and written clearly md simply such that procedures, func- hons, algorithms, and so forth can easily be understood?” Dividing the number of yes responses by the number of questions gives a series of values in the range 0 to 1. The measures can be composed into either measures of specific factor quality or the product’s quality as a whole by considering the relevant selection of questions .
However, there are problems with values derived in this way. The degree of subjectivity varies substantially from one question to another, even though all re- sponses are treated equally. This varia- tion makes combining metrics difficult, if not impossible. Moreover, when ap- propriate, response complexity should be reflected in a richer measurement scale. For example, while it is reasonable to expect a yes-or-no response to the question, “Does this module have a sin- gle entry and exit point?” questions about documentation clarity probably require a multiple-point ordinal scale to reflect the variety of possible answers.
IS0 9126. More recently, interna- tional efforts have led to the develop- ment of a standard for software-quality measurement, I S 0 9126.14 The stan- dards group has recommended six char- acteristics to form a basic set of inde- pendent quality characteristics. The quality characteristics and their defini- tions are shown in Table 1.
The standard also includes a sample quality model that refines the features of IS0 9126 into several subcharacteristics, as Figure 2 shows. The arrows in the fig- ure indicate how the characteristics are decomposed into subcharacteristm.
J A N U A R Y 1996
Authorized licensed use limited to: The University of Arizona. Downloaded on January 9, 2009 at 13:16 from IEEE Xplore. Restrictions apply.
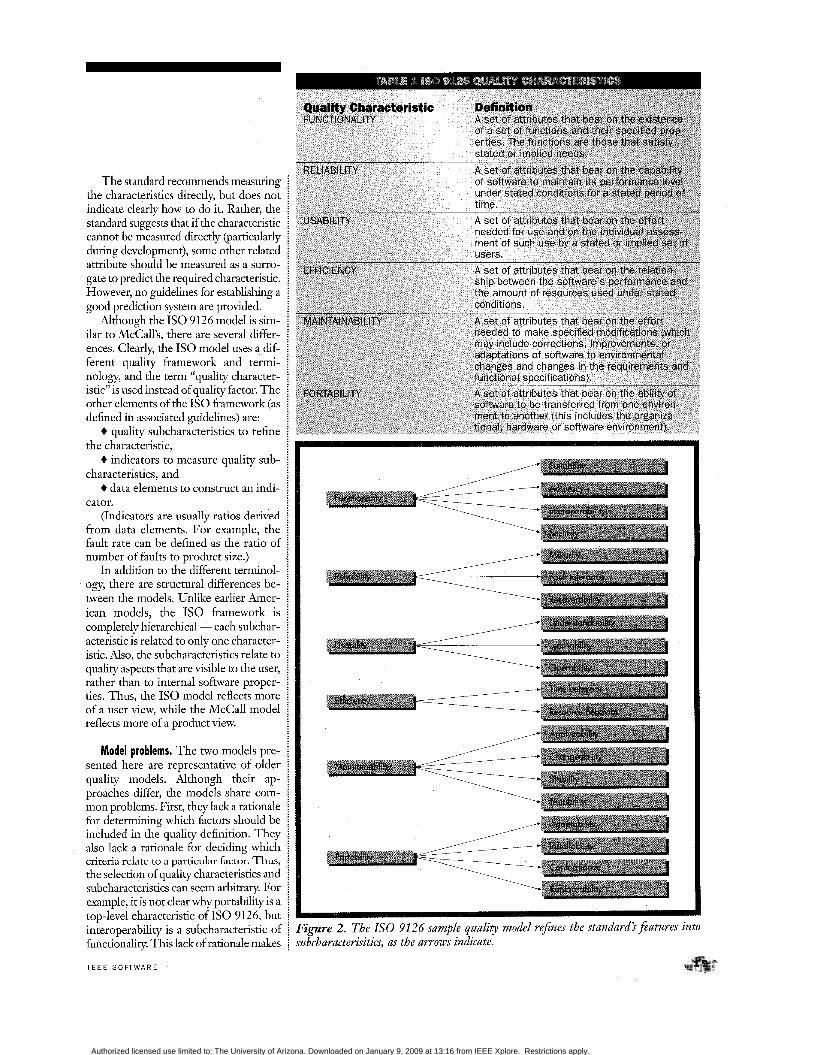
The standard recommends measuring the characteristics directly, but does not indicate clearly how to do it. Rather, the standard suggests that if the characteristic cannot be measured directly (particularly during development), some other related attribute should be measured as a surro- gate to predict the required characteristic. However, no guidelines for establishg a good prediction system are provided.
Although the I S 0 9126 model is sim- ilar to McCall’s, there are several differ- ences. Clearly, the IS0 model uses a dif- ferent quality framework and termi- nology, and the term “quality character- istic” is used instead of quality factor. The other elements of the IS0 framework (as defined in associated guidelines) are:
+ quality subcharacteristics to refine the characteristic,
+ indicators to measure quality sub- characteristics, and
+ data elements to construct an indi- cator.
(Indicators are usually ratios derived from data elements. For example, the fault rate can be defined as the ratio of number of faults to product size.)
In addition to the different terminol- ogy, there are structural differences be- tween the models. Unlike earlier Amer- ican models, the IS0 framework is completely hierarchical - each subchar- acteristic is related to only one character- istic. Also, the subcharacteristics relate to quality aspects that are visible to the user, rather than to internal software proper- ties. Thus, the IS0 model reflects more of a user view, while the McCall model reflects more of a product view.
Model problems. The two models pre- sented here are representative of older quality models. Although their ap- proaches differ, the models share com- mon problems. First, they lack a rationale for determining which factors should be included in the quality definition. They also lack a rationale for deciding which criteria relate to a particular factor. Thus, the selection of quality characteristics and subcharacteristics can seem arbitrary. For examde. it is not clear whv Dortabilitv is a
i l
top-l&el characteristic of IS0 9126; but :
interoperability is a subcharacteristic of i F i p r e 2. The I S 0 9126 sample qua@ model refines the standard’sfeatures into functionality. This lack of rationale makes j subcharacterisitics, as the arrows indicate.
I E E E S O F T W A R E I
Authorized licensed use limited to: The University of Arizona. Downloaded on January 9, 2009 at 13:16 from IEEE Xplore. Restrictions apply.
it impossible to determne if the model is a complete or consistent definihon of quality.
Second, there is no descriphon of how the lowest-level metrics (called lndicators iii the IS0 9126 model) are composed into an overall assessment of hgher level quality characteristm. In parncular, then, there is no means for verifying that the chosen metrics affect the observed behav- ior of a factor. That is, there is no attempt to measure factors at the top of the her- archy, so the model is untestable.
~~omey’§ model. Geoff Dromey has de- veloped a model that addresses many of these problems. Dromey points out that hierarchical models that use a top-down decomposihon are usually rather vague III
their definitions of lower levels. They thus offer little help to software developers who need to build quality products. Dromey believes that it is impossible to build high- level quality attributes such as reliability or maintainability into products. Rather, soft- ware engneers must build components that exhibit a consistent, harmonious, and complete set of product properties that re- sult in the manifestations of quality attrib- utes. His article, “Cornering the Ch- mera,” in t l s issue, describes his approach in more detail.
Drorney’s approach is important be- cause it allows us to verify models. It es- tablishes a criterion for including a par- ticular software property in a model (that is, that a quality defect can be as- sociated with the concept) and a means
of establishing when the model is in- complete (that the model cannot clas- sify a specific defect).
Modeling process quality. Another ap- proach to quality modeling is to look at process. John Evans and John Marciniak suggested a full process model analo- gous to the product quality models de- scribed above.ls The quality implications of a specific software-development process are also of interest. For example, in “Support for Quality-Based Design and Inspection” in this issue, Ilkka Tervonen discusses how to integrate the inspection process with designing for quality by justifying different develop- ment decisions based on their impact on quality requirements.
J A N U A R Y 1996
Authorized licensed use limited to: The University of Arizona. Downloaded on January 9, 2009 at 13:16 from IEEE Xplore. Restrictions apply.
G U E S T E D I T O R S ’ I N T R O D U C T I O N
THE BUSINESS VALUE OF QUALITY
In the last few decades, software has grown to become a vital part of most companies’ products and services, With that growth comes our responsibility for determining how much software con- tributes to the corporate bottom line. When a telephone company cannot im- plement a new service because the billing-system software cannot handle the new features, then lack of software quality is a corporate problem. When a national gas utility must spend millions of dollars to fix a software glitch in moni- toring systems embedded in gas meters throughout the country, then small soft- ware defects become big headaches. And when software problems stop the assem- bly line, ground the plane, or send the troops to the wrong location, organiza- tions realize that software is essential to the health and safety of business and peo- ple. Little research is done into the rela- tionship between software quality and business effectiveness and efficiency. But unless we begin to look at these issues, companies will be unable to support key business decisions.
In particular, we must look more care-
fully at how our methods and tools affe software quality. Businesses take big ris when they invest in technology that h not been carefully tested and evaluate The Desmet project, funded by the LIE Department of Trade and Industry, h produced guidelines for how to condu case studies and experiments in suppo of technology evaluation.16
But looking at the software alone not enough. We must see it in the conte of how it is used by business to determii if investment in higher software quality worthwhile. As Ed Yourdon pointed OL
sometimes less-than-perfect is goc enough;l7 only business goals and prior ties can determine how much “less th: perfect” we are willing to accept. In the article, “Software Quality in Consuml Electronic Products,” Jan Rooijmans ar colleagues take up this issue with a di cussion of the problems and challeng associated with producing consumc electronic products.
uality is a complex concep Because it means different thin!
to different people, it is highly contex dependent. Just as there is no one aut(
REFERENCES 1. R. Howe, D. Gaeddert, and M. Howe, Quality on Trial, McGraw-Hill Europe, Maidenhead, England,
2. D. Gamin, “What Does “Product Quality” Really Mean?” Sloan Management Review, Fall 1984, pp.
3. I S 0 9001 Quality Systems - Model for Quality Assurance in DesigdDevelopment, Production, Installation,
4. M. Paulk, et al., “Capability Maturity Model, Version 1.1,” IEEE Software, July 1993, pp. 18-27. 5 . M. Paulk, “How I S 0 9001 Compares With the CMM,” IEEE Software, Jan. 1995, pp. 74-83. 6. I S 0 8402 Quality Management and Quality Assurance - Vocabulary, International Organisation for
7. Special issue on reliability measurement, IEEE Sofhare, July 1992. 8. J. Musa, “Operational Profiles in Software-Reliability Engineering,” IEEE Softwan, Mar. 1993, pp.
9. T. Gilb, Phczpals of Software Engineering Management, Addison-Wesley, Reading, Mass., 1987.
1992.
25-45.
and Servicing, International Organisation for Standardization, Geneva, 1994.
Standardization, Geneva, 2nd Edition, 1994.
14-32.
10. G. Frewin et al., “Quality Measurement and Modelling - State of the Art Report,” Request Report to the CEC Esprit program, R1.l.l , 1984 (available from the European Commission, Brussels).
11. J.A. McCall, P.K. Richards, and G.F. Walters, Factors in Software Quality, Vol. 1 ,2 , and 3, AD/A-049- 014/015/055, Nat’l Tech. Information Service, Springfield, Va., 1977.
12. IS091 26 Infirmation Technology - Softwam Product Evaluation - Quality Characteristics and Guidelines fov Their Use, International Organisation for Standardization, Geneva, 1992.
13. P. Mellor, “Failures, Faults and Changes in Dependability Measurement,”y. Infoormation and Software
14. V Basili and D. Rombach, “The TAME Project: Towards Improvement-Oriented Software
15 M. Evans and J. Marciniak, Software Qualiq Assnrance andManagement, John Wiley & Sons, New
16 B. Kitchenham, L. Pickard, and S. Lawrence Pfleeger, “Case Studies for Method and Tool
17 E. Yourdon, “When Good Enough Software is Best,” IEEE Software, May 1995, pp. 79-81.
Technology, Oct. 1992, pp. 640-654.
Environments,” IEEE Trans. Software Eng., June 1989, pp. 758-773.
York, 1987.
Evaluation,” IEEE Software, July 1995, pp. 52-62; correction, Sept. 1995, pp. 98-99.
mobile to satisfy everyone’s needs, so too there is no universal definition of quality. Thus, there can be no single, simple mea- sure of software quality acceptable to everyone. To assess or improve software quality in your organization, you must define the aspects of quality in which you are interested, then decide how you are going to measure them. By defining qual- ity in a measurable way, you make it eas- ier for other people to understand your viewpoint and relate your notions to their own. Ultimately, your notion of quality must be related to your business goals. Only you can determine if good software is good business. +
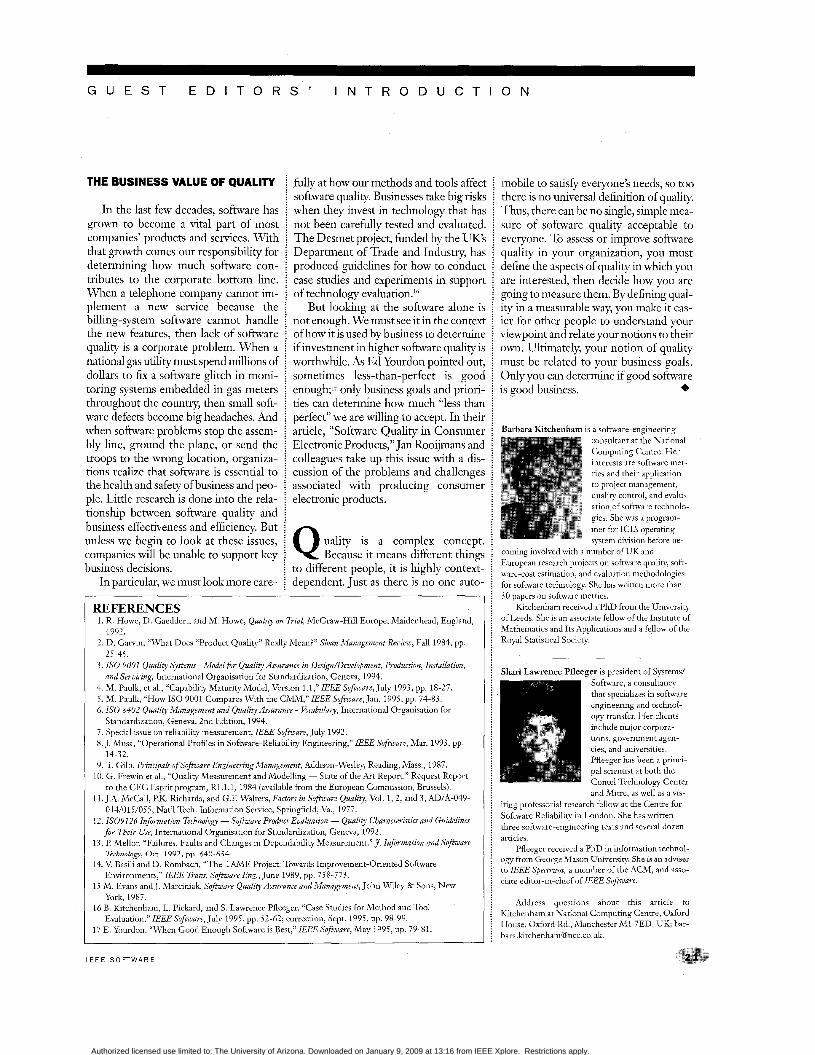
Barbara Kitchenham is a software-encineerine consultant at the National Computing Centre. Her interests are software met- rics and their application to project management, quality control, and evalu- ation of software technolo- gies. She was a program- mer for ICES operating system division before be-
coming involved with a number of UK and European research projects on software quality, soft- ware-cost estimation, and evaluation methodologies for software technology. She has written more than 30 papers on software metrics.
Kitchenham received a PhD from the University of Leeds. She is an associate fellow of the Institute of Mathematics and Its Applications and a fellow of the Royal Statistical Society.
Shari Lawrence Pfleeger is president of Systems/
and Mitre, as well as a vis- iting professorial research fellow at the Centre for Software Reliability in London. She has written three software-engineering texts and several dozen articles.
Pfleeger received a PhD in information technol- ogy from George Ma>on University. She is an adviser to IEEE Specwum, a member of the ACM, and asso- ciate editor-in-chief of IEEE Software.
Address questions about this article to Kitchenham at National Computing Centre, Oxford House, Oxford Rd., Manchester M1 7ED, UK; bar- bara.lutchenhamQncc.co.uk.
I E E E S O F T W A R E
Authorized licensed use limited to: The University of Arizona. Downloaded on January 9, 2009 at 13:16 from IEEE Xplore. Restrictions apply.