Embed Size (px)
Citation preview

Wireless Innovation Forum European Conference on Communications Technologies and Software Defined Radio
Brussels – 27-29 June 2012
Software Radio
Spectrum Analyzer
SUPELEC - Campus de RennesSCEE – Signal, Communications et Electronique Embarquée
IETR – UMR CNRS 6164Institut d'Electronique et Télécommunications de Rennes
Jérôme PARISOT, Emilien LE SUR, Christophe MOY, Daniel LE GUENNEC, Pierre LERAY
SUPELEC/IETR27 June 2012

Project goal
• Student project– implement real radio on a part-time
3 months project
– evaluate/dimension SDR capabilities for real-time processing
Christophe MOY - SUPELEC – 27 June 2012 2IETR - INSTITUT D’ÉLECTRONIQUE ET DE TÉLÉCOMMUNICATIONS DE RENNES
– not only for communications
• System– SDR approach
– USRP N210 from Ettus research
– Simulink processing environment

Presentation outline
• Power spectral density
• Simulink implementation on N210 platforms
Christophe MOY - SUPELEC – 27 June 2012 3IETR - INSTITUT D’ÉLECTRONIQUE ET DE TÉLÉCOMMUNICATIONS DE RENNES
• Windows implementation on N210 platforms
• Conclusion

Presentation outline
• Power spectral density
• Simulink implementation on N210 platforms
Christophe MOY - SUPELEC – 27 June 2012 4IETR - INSTITUT D’ÉLECTRONIQUE ET DE TÉLÉCOMMUNICATIONS DE RENNES
• Windows implementation on N210 platforms
• Conclusion

Spectrum analysis
• Spectrum– continuous
– discrete
• but : amplitude and phase
( ) ∫+∞
∞−
π−= dte).t(xfX fti2
( ) fkTi2N
1k
e).k(xTfX̂ π−
=∑=
Christophe MOY - SUPELEC – 27 June 2012 5IETR - INSTITUT D’ÉLECTRONIQUE ET DE TÉLÉCOMMUNICATIONS DE RENNES
• but : amplitude and phase
• convergence not guaranteed mathematically
• Power Spectral Density– auto-correlation
( ) ∫+∞
∞−
τπ− ττγ=Γ de).(f fi2
xx
{ })t(x).t(xE)(x τ+=τγ
for real signals
Fourrier
transform

Power Spectral Density
• Power Spectral Density– it can be shown that
� periodogram
� instead: (Schuster - 1898)
( ))f(X̂
ˆ
2
=Γ
( )
=ΓT.N
)f(X̂Elimf
2
x
Christophe MOY - SUPELEC – 27 June 2012 6IETR - INSTITUT D’ÉLECTRONIQUE ET DE TÉLÉCOMMUNICATIONS DE RENNES
• but: it can be shown that estimation error standard
deviation (hypothesis of White Gaussian Noise)
• error is a the level of the measure!
– necessary to average
• Welch approach
( )T.N
)f(Xfˆ
x =Γ
( ) ( )0xfˆ f0x
Γ≈σΓ

WELCH method (I)
• Discrete PSD by Welch method• based on temporal samples (periodogram-based)
• subdivide the samples in temporal slots
• combine the PSD result of each slot in order to
make a global mean PSD
Christophe MOY - SUPELEC – 27 June 2012 7IETR - INSTITUT D’ÉLECTRONIQUE ET DE TÉLÉCOMMUNICATIONS DE RENNES
– advantage on precision
– disadvantage
• resolution
( )T.N
)f(X̂fˆ
2
x =Γ
1 M 2.M k.M
( ) ∑=
Γ=Γk
1i
ix )f(ˆk
1fˆ
)f(1Γ )f(2Γ
( ) ( )0i0xffˆ
k
1ΓΓ
σ=σ
1 N t

WELCH method (II)
• Overlap
t
observation horizon
slot )f(iΓ )f(1i+Γ
Christophe MOY - SUPELEC – 27 June 2012 8IETR - INSTITUT D’ÉLECTRONIQUE ET DE TÉLÉCOMMUNICATIONS DE RENNES
• Overlap– avoid loosing effects at the slot border
t
observation horizon
slot overlap

WELCH method (III)
• Windowing– in order to mitigate truncature effect
– Hamming here
t
Christophe MOY - SUPELEC – 27 June 2012 9IETR - INSTITUT D’ÉLECTRONIQUE ET DE TÉLÉCOMMUNICATIONS DE RENNES
t
…

WELCH method (IV)
t
Windowing
FT
| |²
Windowing
FT
| |²
Windowing
FT
| |²
Windowing
FT
| |²
…
Christophe MOY - SUPELEC – 27 June 2012 10IETR - INSTITUT D’ÉLECTRONIQUE ET DE TÉLÉCOMMUNICATIONS DE RENNES
Mean
Normalisation
…

Matlab implementation
• Function for Welch algorithm– input: time samples
– output: PSD
– parameters:
• number of slots
signalOut = zeros(1,sizeFFT);.for i=0:nbSlots-1
offset=doffsetSlot*i+1;% Slot extraction and windowing.slot= signalIn(offset:offset + slotSize-1).*fen;
Christophe MOY - SUPELEC – 27 June 2012 11IETR - INSTITUT D’ÉLECTRONIQUE ET DE TÉLÉCOMMUNICATIONS DE RENNES
• number of slots
• overlapping ratio
• windowing type
function [ signalOut ] = algoWelch( signalIn , nbSlots , overlapRatio, window)
% Normailze FFT.S = fft(slot, sizeFFT)/slotSize;% SquaresignalOut = signalOut + abs(S).^2;
end
% Mean and normalization.signalOut = signalOut/ nbSlots * slotSize/ norm_win;

Presentation outline
• Power spectral density
• Simulink implementation on N210 platforms
Christophe MOY - SUPELEC – 27 June 2012 12IETR - INSTITUT D’ÉLECTRONIQUE ET DE TÉLÉCOMMUNICATIONS DE RENNES
• Windows implementation on N210 platforms
• Conclusion

• USRP based platform (N210 frome EttusTM)– UHD drivers
– for Simulink environmentreal-time processing
– GBethernet link USRP
Hardware system
2.3 GHzIntel Core i5
Christophe MOY - SUPELEC – 27 June 2012 13IETR - INSTITUT D’ÉLECTRONIQUE ET DE TÉLÉCOMMUNICATIONS DE RENNES
– GBethernet link
• SDR approach for testand measurements
• Not only for communications
13
USRP
N210
RF
80 MHz -1,4 GHz
ADC
100 MHz ↓↓↓↓256
Spectrum Analyzer
(Simulink)
fS=390 kHzfADC=100 MHz

N210 platform from EttusTM
Christophe MOY - SUPELEC – 27 June 2012 14IETR - INSTITUT D’ÉLECTRONIQUE ET DE TÉLÉCOMMUNICATIONS DE RENNES
14
fADC
DCR

IF ADC DDC Buffer
input
buffer
Welch
algorithm
USRP N210 platform
GBethernet
System functional view
Christophe MOY - SUPELEC – 27 June 2012 15IETR - INSTITUT D’ÉLECTRONIQUE ET DE TÉLÉCOMMUNICATIONS DE RENNES
data re-ordering
Spectrum anayzer
Spectrogram
Persistance
PC for
processing
and
display
-
Simulink™data re-ordering

• Spectrum analyzer
Simulink processing (I)
t
Amplitude
Christophe MOY - SUPELEC – 27 June 2012 16IETR - INSTITUT D’ÉLECTRONIQUE ET DE TÉLÉCOMMUNICATIONS DE RENNES
16
Spectral
EstimationDisplay
Spectral
EstimationDisplay
Spectral
Estimation…
Acquisition
n-1 n
Acquisition
n+1
…
…

• Spectrum analyzer performance– bandwidth
• DCR: undersampling factor
– display frequency (of PSD)
• nf: number of samples per frame
Simulink processing (I)
DCR2
ff ADCMax ⋅
=
ADC 1ff ⋅=
Christophe MOY - SUPELEC – 27 June 2012 17IETR - INSTITUT D’ÉLECTRONIQUE ET DE TÉLÉCOMMUNICATIONS DE RENNES
• nf: number of samples per frame
• nb: number of frames
– real time (2.3 GHz Intel Core i5)
bf
ADCdisp
nnDCRf
⋅⋅=
Fc(center freq.)
Decim bandwidth Frame Length
SampleTime(s)
Output data type
80 Mhz –1.4 GHz
256 195 kHz 362 2,56.10-6 double

• Spectrum analyzer in Simulink
Simulink processing (I)
Christophe MOY - SUPELEC – 27 June 2012 18IETR - INSTITUT D’ÉLECTRONIQUE ET DE TÉLÉCOMMUNICATIONS DE RENNES

• Spectrum analyzer – FM 10 kHz
signal
Simulink processing (I)
Christophe MOY - SUPELEC – 27 June 2012 19IETR - INSTITUT D’ÉLECTRONIQUE ET DE TÉLÉCOMMUNICATIONS DE RENNES
– DCR = 256
– DCR = 128
– DCR = 64

• Spectrogram– overlapping ratio = 0.5, Nb slots = 8
• display refresh frequency � 5.7Hz
– overlapping ratio = 0.8, Nb slots = 16
• display refresh frequency � 2.6Hz
Simulink processing (II)
frequency
Christophe MOY - SUPELEC – 27 June 2012 20IETR - INSTITUT D’ÉLECTRONIQUE ET DE TÉLÉCOMMUNICATIONS DE RENNES
• display refresh frequency � 2.6Hz frequency
time
carrier jumping
FM modulation
FM
jumpingcarrier

• Remanence– overlapping ratio = 0.5, Nb slots = 8
• display refresh frequency � 8.33 Hz
– overlapping ratio = 0.8, Nb slots = 16
• display refresh frequency � 3.86 Hz
Simulink processing (III)
Christophe MOY - SUPELEC – 27 June 2012 21IETR - INSTITUT D’ÉLECTRONIQUE ET DE TÉLÉCOMMUNICATIONS DE RENNES
• display refresh frequency � 3.86 Hz

• Trade-off: quality / execution duration
PSD variance estimate
2
2.5
Relative delay for a input of 14480 samples
1.6
1.8
Relative delay for a input of 14480 samples
Variance for an input of 43440 samples
Variance/E
nerg
y /
variance f
or
r=0,
nb=
1
Christophe MOY - SUPELEC – 27 June 2012 22IETR - INSTITUT D’ÉLECTRONIQUE ET DE TÉLÉCOMMUNICATIONS DE RENNES
0
5
10
15
20
0
5000
100001
1.5
Number of slicesSize of each slice
dela
y
0
5
10
15
20
0
0.2
0.4
0.6
0.8
1
1.2
1.4
1.6
Number of slicesOverlapping Ratio
dela
y
2 4 68 10
12 14 16 0
0.2
0.4
0.6
0.8
0.2
0.4
0.6
0.8
1
Overlapping Ratio
Number of slices
Variance/E
nerg
y /
variance f
or
r=0,
nb=
1
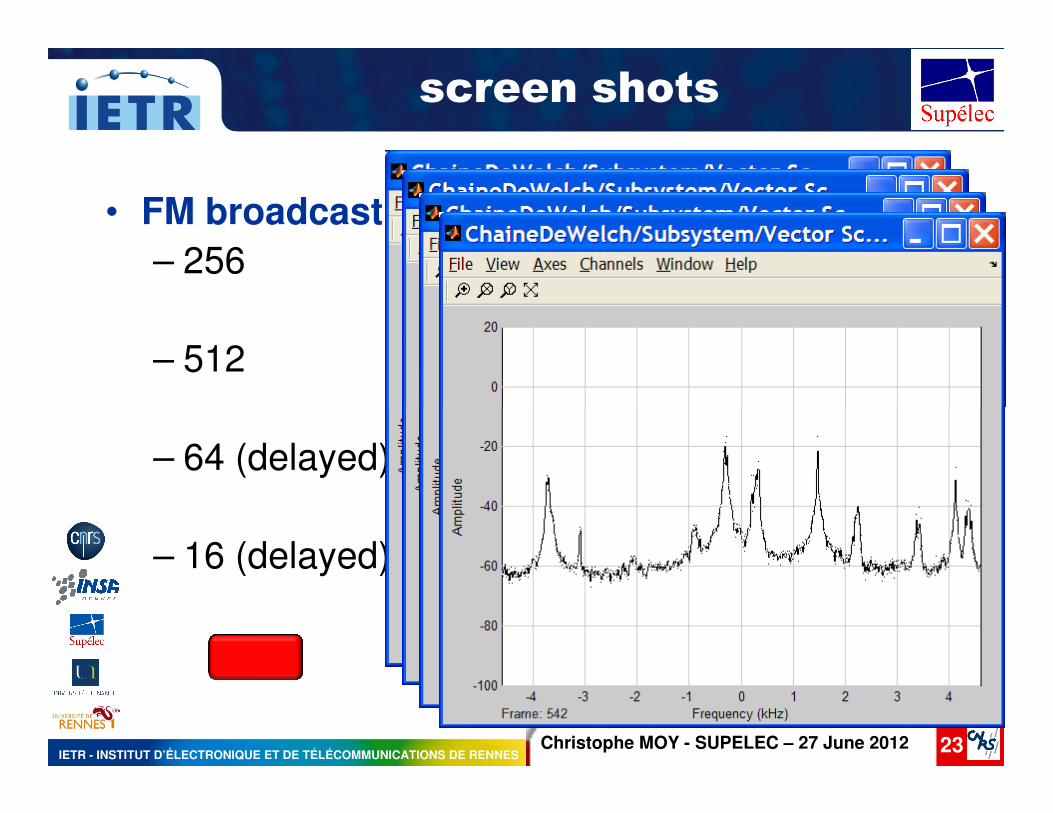
• FM broadcast– 256
– 512
screen shots
Christophe MOY - SUPELEC – 27 June 2012 23IETR - INSTITUT D’ÉLECTRONIQUE ET DE TÉLÉCOMMUNICATIONS DE RENNES
– 64 (delayed)
– 16 (delayed)

Presentation outline
• Power spectral density
• Simulink implementation on N210 platforms
Christophe MOY - SUPELEC – 27 June 2012 24IETR - INSTITUT D’ÉLECTRONIQUE ET DE TÉLÉCOMMUNICATIONS DE RENNES
• Windows implementation on N210 platforms
• Conclusion

Windows implementation
• Development Environment– SUPELEC proprietary environment (Windows)
• UHD library– from Ettus Research
• Supporting HDCRAM– Hierarchical and Distributed Cognitive Radio
Christophe MOY - SUPELEC – 27 June 2012 25IETR - INSTITUT D’ÉLECTRONIQUE ET DE TÉLÉCOMMUNICATIONS DE RENNES
– Hierarchical and Distributed Cognitive Radio Architecture Management [1]
– HDCRAM is an architecture for the management of reconfiguration and cognitive facilities (metrics capture and decision/learning)
– for real-time auto-adaptation[1] Christophe MOY, "High-Level Design Approach for the Specification of Cognitive Radio Equipments
Management APIs", Journal of Network and System Management - Special Issue on Management Functionalities for Cognitive Wireless Networks and Systems, vol. 18, number 1, pp. 64-96, Mar. 2010

• Spectrum analyzer is a kind of cognitive radio– carrier frequency adjustment � sensor
– DCR factor (undersampling) � sensor
– display parameters � data processing to be reconfigured
HDCRAM management
Christophe MOY - SUPELEC – 27 June 2012 26IETR - INSTITUT D’ÉLECTRONIQUE ET DE TÉLÉCOMMUNICATIONS DE RENNES
reconfigured
• FM 10 kHz

Presentation outline
• Power spectral density
• Simulink implementation on N210 platforms
Christophe MOY - SUPELEC – 27 June 2012 27IETR - INSTITUT D’ÉLECTRONIQUE ET DE TÉLÉCOMMUNICATIONS DE RENNES
• Windows implementation on N210 platforms
• Conclusion

Conclusion
• Teaching level (project benefit for students)– power spectrum density study
– fast and easy to implement
– very motivating for students compared to
• analytical analysis
• simulations more or less deconnected from reality
Christophe MOY - SUPELEC – 27 June 2012 28IETR - INSTITUT D’ÉLECTRONIQUE ET DE TÉLÉCOMMUNICATIONS DE RENNES
• simulations more or less deconnected from reality
• writing a paper for a conference
• SDR for other stuff than communications– channel sounder last year
– spectrum analyzer here
• Sensor for cognitive radio

• Thank you to/This is the work of students:
Emilien LE SURJérôme PARISOT
Christophe MOY - SUPELEC – 27 June 2012 29IETR - INSTITUT D’ÉLECTRONIQUE ET DE TÉLÉCOMMUNICATIONS DE RENNES
Thanks for your attention
http://www.rennes.supelec.fr/ren/perso/cmoy/SCEE-SERI/