Embed Size (px)
Citation preview
Soil Carbon Dynamics in Northern Kenya Rangelands
Prepared by
Mark Ritchie, Syracuse University, Syracuse New York, USA;
19 September, 2014
Progress report for subcontract between The Nature Conservancy and Syracuse University regarding USAID funding through the Africa Biodiversity and
Conservation Group
Soil Carbon Dynamics on Northern Kenya Rangelands
This report is made possible by the generous support of the American people through the United States Agency for International Development (USAID) under the terms of Cooperative Agreement No. RLA-A-00-07-00043-00. The contents are the responsibility of the Africa Biodiversity Collaborative Group (ABCG). Any opinions, findings, conclusions, or recommendations expressed in this publication are those of the authors and do not necessarily reflect the views of USAID or the United States Government. This publication was produced by The Nature Conservancy on behalf of ABCG.
ii
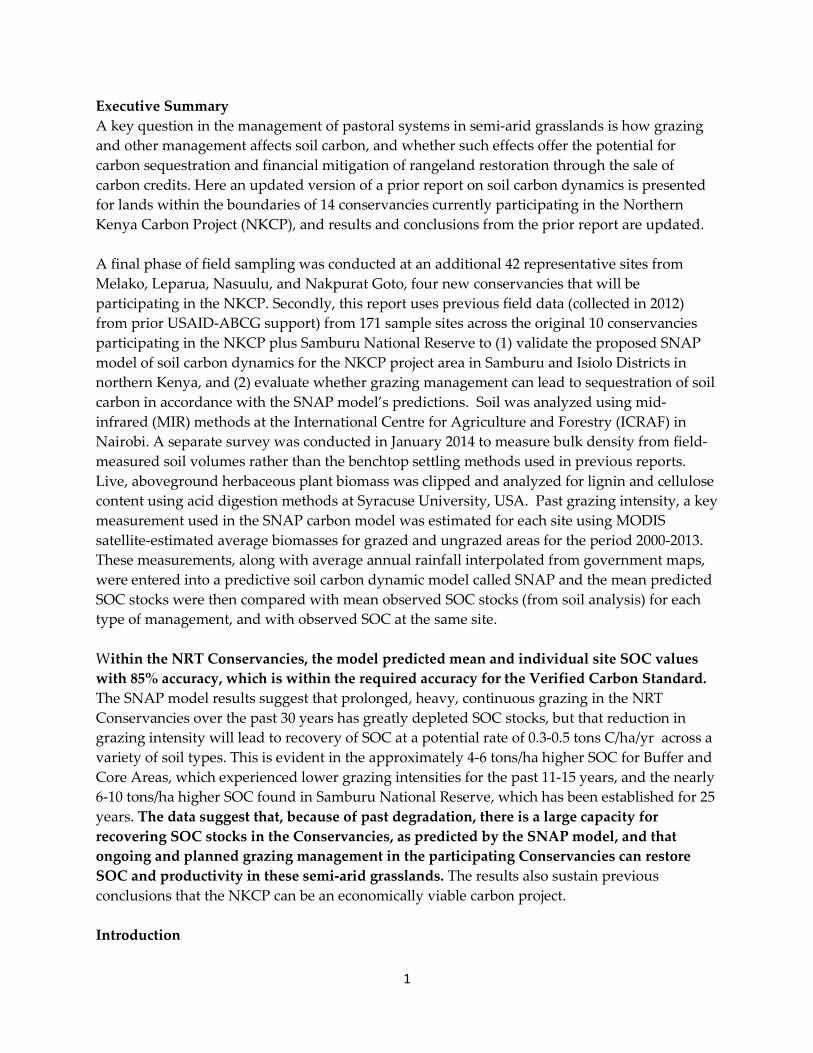
Executive Summary A key question in the management of pastoral systems in semi-arid grasslands is how grazing and other management affects soil carbon, and whether such effects offer the potential for carbon sequestration and financial mitigation of rangeland restoration through the sale of carbon credits. Here an updated version of a prior report on soil carbon dynamics is presented for lands within the boundaries of 14 conservancies currently participating in the Northern Kenya Carbon Project (NKCP), and results and conclusions from the prior report are updated. A final phase of field sampling was conducted at an additional 42 representative sites from Melako, Leparua, Nasuulu, and Nakpurat Goto, four new conservancies that will be participating in the NKCP. Secondly, this report uses previous field data (collected in 2012) from prior USAID-ABCG support) from 171 sample sites across the original 10 conservancies participating in the NKCP plus Samburu National Reserve to (1) validate the proposed SNAP model of soil carbon dynamics for the NKCP project area in Samburu and Isiolo Districts in northern Kenya, and (2) evaluate whether grazing management can lead to sequestration of soil carbon in accordance with the SNAP model’s predictions. Soil was analyzed using mid-infrared (MIR) methods at the International Centre for Agriculture and Forestry (ICRAF) in Nairobi. A separate survey was conducted in January 2014 to measure bulk density from field-measured soil volumes rather than the benchtop settling methods used in previous reports. Live, aboveground herbaceous plant biomass was clipped and analyzed for lignin and cellulose content using acid digestion methods at Syracuse University, USA. Past grazing intensity, a key measurement used in the SNAP carbon model was estimated for each site using MODIS satellite-estimated average biomasses for grazed and ungrazed areas for the period 2000-2013. These measurements, along with average annual rainfall interpolated from government maps, were entered into a predictive soil carbon dynamic model called SNAP and the mean predicted SOC stocks were then compared with mean observed SOC stocks (from soil analysis) for each type of management, and with observed SOC at the same site. Within the NRT Conservancies, the model predicted mean and individual site SOC values with 85% accuracy, which is within the required accuracy for the Verified Carbon Standard. The SNAP model results suggest that prolonged, heavy, continuous grazing in the NRT Conservancies over the past 30 years has greatly depleted SOC stocks, but that reduction in grazing intensity will lead to recovery of SOC at a potential rate of 0.3-0.5 tons C/ha/yr across a variety of soil types. This is evident in the approximately 4-6 tons/ha higher SOC for Buffer and Core Areas, which experienced lower grazing intensities for the past 11-15 years, and the nearly 6-10 tons/ha higher SOC found in Samburu National Reserve, which has been established for 25 years. The data suggest that, because of past degradation, there is a large capacity for recovering SOC stocks in the Conservancies, as predicted by the SNAP model, and that ongoing and planned grazing management in the participating Conservancies can restore SOC and productivity in these semi-arid grasslands. The results also sustain previous conclusions that the NKCP can be an economically viable carbon project. Introduction
1
Soil Carbon Dynamics on Northern Kenya Rangelands
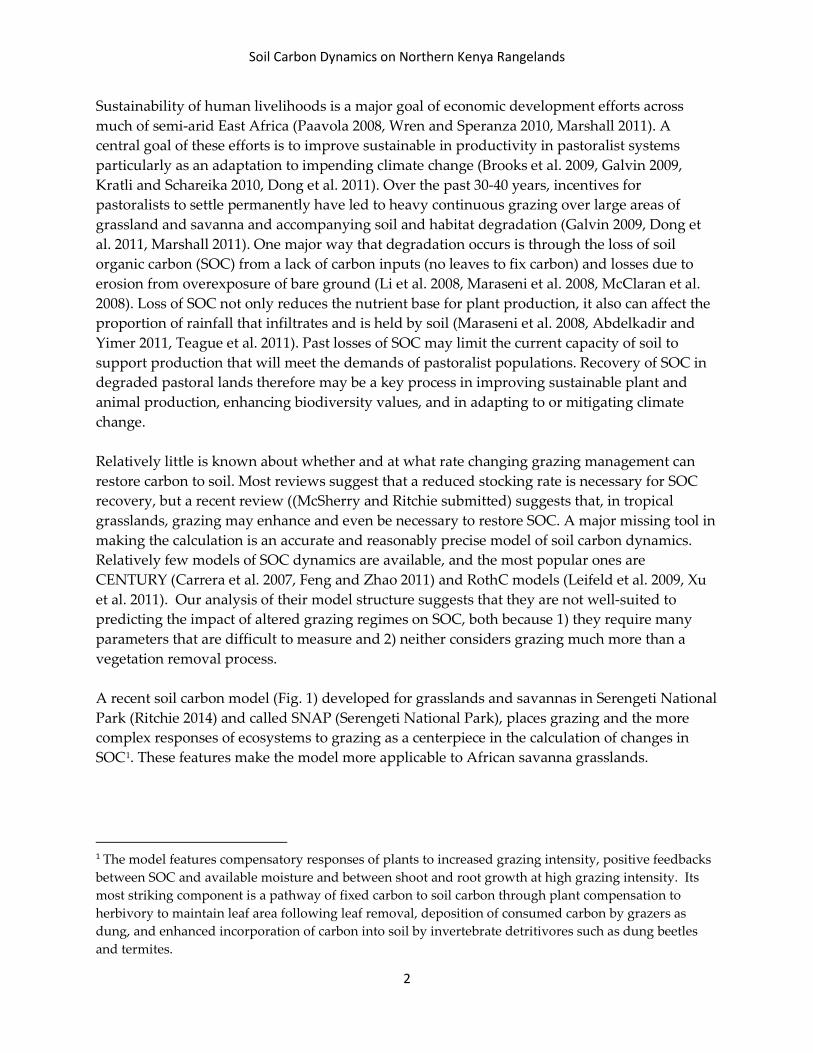
Sustainability of human livelihoods is a major goal of economic development efforts across much of semi-arid East Africa (Paavola 2008, Wren and Speranza 2010, Marshall 2011). A central goal of these efforts is to improve sustainable in productivity in pastoralist systems particularly as an adaptation to impending climate change (Brooks et al. 2009, Galvin 2009, Kratli and Schareika 2010, Dong et al. 2011). Over the past 30-40 years, incentives for pastoralists to settle permanently have led to heavy continuous grazing over large areas of grassland and savanna and accompanying soil and habitat degradation (Galvin 2009, Dong et al. 2011, Marshall 2011). One major way that degradation occurs is through the loss of soil organic carbon (SOC) from a lack of carbon inputs (no leaves to fix carbon) and losses due to erosion from overexposure of bare ground (Li et al. 2008, Maraseni et al. 2008, McClaran et al. 2008). Loss of SOC not only reduces the nutrient base for plant production, it also can affect the proportion of rainfall that infiltrates and is held by soil (Maraseni et al. 2008, Abdelkadir and Yimer 2011, Teague et al. 2011). Past losses of SOC may limit the current capacity of soil to support production that will meet the demands of pastoralist populations. Recovery of SOC in degraded pastoral lands therefore may be a key process in improving sustainable plant and animal production, enhancing biodiversity values, and in adapting to or mitigating climate change. Relatively little is known about whether and at what rate changing grazing management can restore carbon to soil. Most reviews suggest that a reduced stocking rate is necessary for SOC recovery, but a recent review ((McSherry and Ritchie submitted) suggests that, in tropical grasslands, grazing may enhance and even be necessary to restore SOC. A major missing tool in making the calculation is an accurate and reasonably precise model of soil carbon dynamics. Relatively few models of SOC dynamics are available, and the most popular ones are CENTURY (Carrera et al. 2007, Feng and Zhao 2011) and RothC models (Leifeld et al. 2009, Xu et al. 2011). Our analysis of their model structure suggests that they are not well-suited to predicting the impact of altered grazing regimes on SOC, both because 1) they require many parameters that are difficult to measure and 2) neither considers grazing much more than a vegetation removal process. A recent soil carbon model (Fig. 1) developed for grasslands and savannas in Serengeti National Park (Ritchie 2014) and called SNAP (Serengeti National Park), places grazing and the more complex responses of ecosystems to grazing as a centerpiece in the calculation of changes in SOC1. These features make the model more applicable to African savanna grasslands.
1 The model features compensatory responses of plants to increased grazing intensity, positive feedbacks between SOC and available moisture and between shoot and root growth at high grazing intensity. Its most striking component is a pathway of fixed carbon to soil carbon through plant compensation to herbivory to maintain leaf area following leaf removal, deposition of consumed carbon by grazers as dung, and enhanced incorporation of carbon into soil by invertebrate detritivores such as dung beetles and termites.
2
Soil Carbon Dynamics on Northern Kenya Rangelands
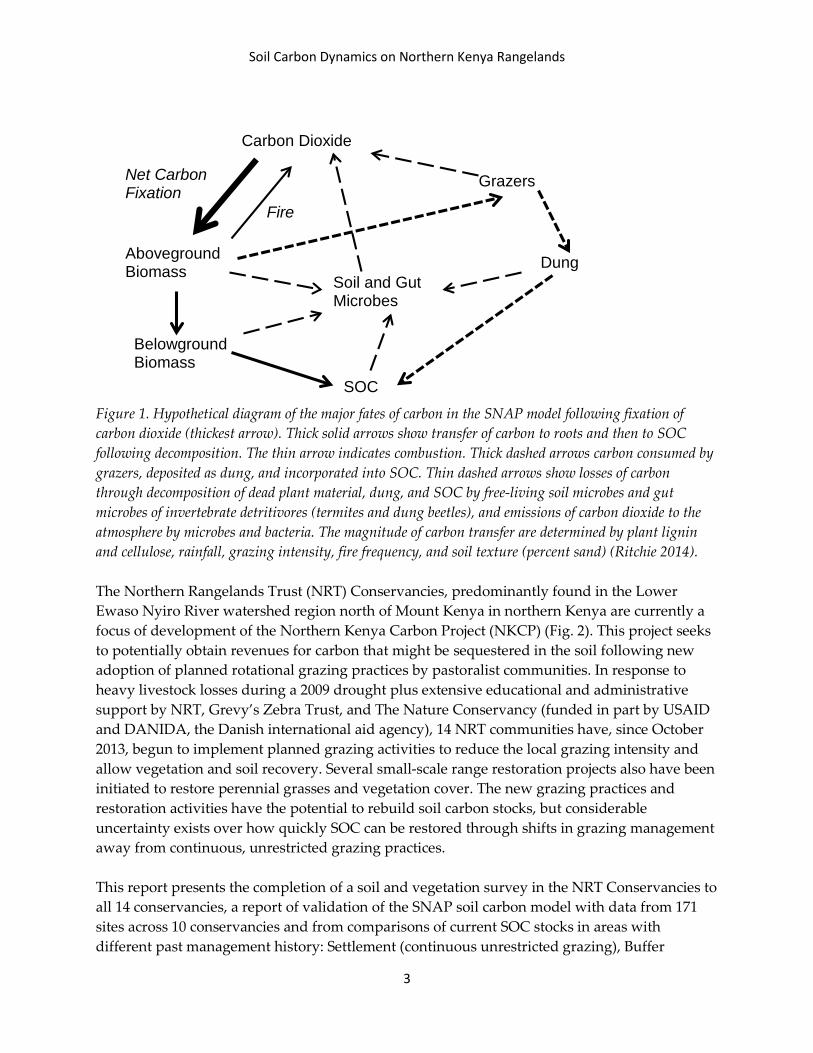
Figure 1. Hypothetical diagram of the major fates of carbon in the SNAP model following fixation of carbon dioxide (thickest arrow). Thick solid arrows show transfer of carbon to roots and then to SOC following decomposition. The thin arrow indicates combustion. Thick dashed arrows carbon consumed by grazers, deposited as dung, and incorporated into SOC. Thin dashed arrows show losses of carbon through decomposition of dead plant material, dung, and SOC by free-living soil microbes and gut microbes of invertebrate detritivores (termites and dung beetles), and emissions of carbon dioxide to the atmosphere by microbes and bacteria. The magnitude of carbon transfer are determined by plant lignin and cellulose, rainfall, grazing intensity, fire frequency, and soil texture (percent sand) (Ritchie 2014). The Northern Rangelands Trust (NRT) Conservancies, predominantly found in the Lower Ewaso Nyiro River watershed region north of Mount Kenya in northern Kenya are currently a focus of development of the Northern Kenya Carbon Project (NKCP) (Fig. 2). This project seeks to potentially obtain revenues for carbon that might be sequestered in the soil following new adoption of planned rotational grazing practices by pastoralist communities. In response to heavy livestock losses during a 2009 drought plus extensive educational and administrative support by NRT, Grevy’s Zebra Trust, and The Nature Conservancy (funded in part by USAID and DANIDA, the Danish international aid agency), 14 NRT communities have, since October 2013, begun to implement planned grazing activities to reduce the local grazing intensity and allow vegetation and soil recovery. Several small-scale range restoration projects also have been initiated to restore perennial grasses and vegetation cover. The new grazing practices and restoration activities have the potential to rebuild soil carbon stocks, but considerable uncertainty exists over how quickly SOC can be restored through shifts in grazing management away from continuous, unrestricted grazing practices. This report presents the completion of a soil and vegetation survey in the NRT Conservancies to all 14 conservancies, a report of validation of the SNAP soil carbon model with data from 171 sites across 10 conservancies and from comparisons of current SOC stocks in areas with different past management history: Settlement (continuous unrestricted grazing), Buffer
Grazers
Carbon Dioxide
Fire
Dung Aboveground Biomass
Belowground Biomass
SOC
Soil and Gut Microbes
Net Carbon Fixation
3
Soil Carbon Dynamics on Northern Kenya Rangelands
(grazing use only during the dry season), Core (no livestock grazing in order to support wildlife tourist operations), and Reserve (wildlife grazed with some occasional livestock use). Predicted values from the SNAP model were compared against observed SOC using regression and among ANOVA statistics to determine accuracy and bias of SNAP in predicting soil carbon stocks following long-term management and to predict changes in SOC in response to changed management. Results Data for testing the SNAP model were obtained for 10 of the participating conservancies (Fig. 2). Soil carbon analyses for the final four conservancies by the ICRAF (Nairobi) laboratory are in progress, with results expected by October.
Figure 2
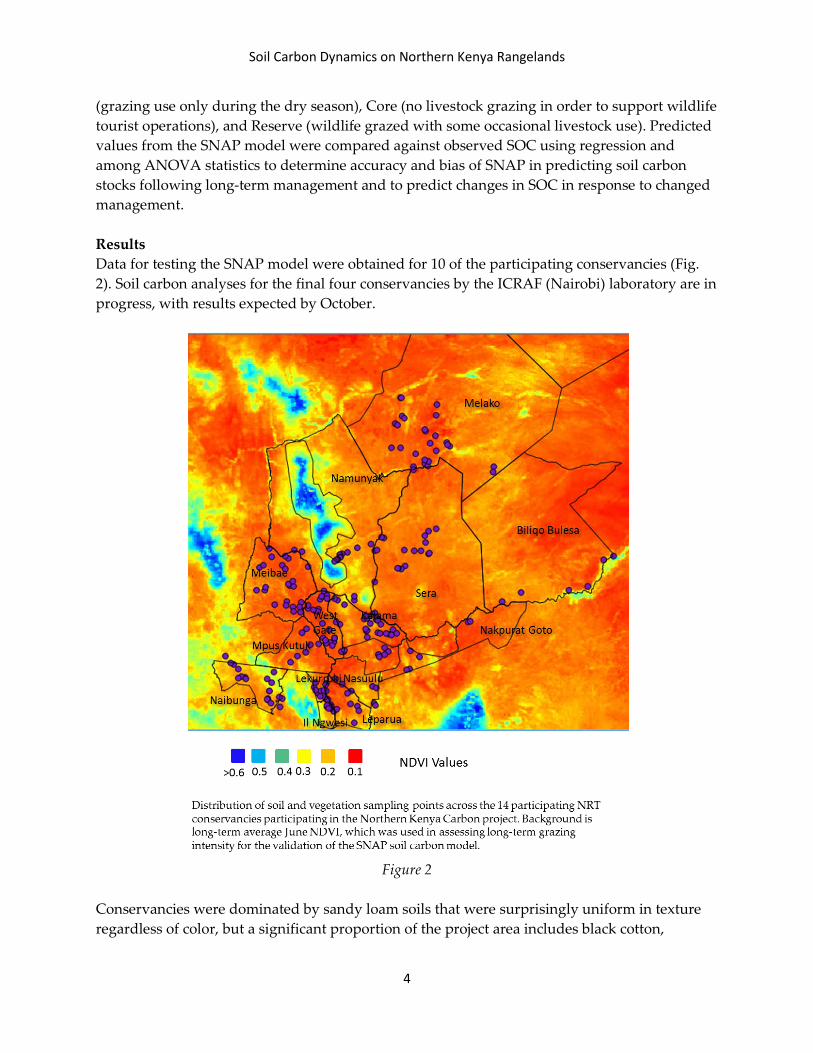
Conservancies were dominated by sandy loam soils that were surprisingly uniform in texture regardless of color, but a significant proportion of the project area includes black cotton,
4
Soil Carbon Dynamics on Northern Kenya Rangelands
cracking clay soils (Fig. 3). Except in black cotton soils on eroded lava plateaus or riparian areas, soil was 55-70% sand, < 5% silt and < 25-40% clay. Black cotton soils held 70-80% clay, 5% silt and < 25% sand. Consequently, percent sand within a soil class did not vary significantly among sites (sandy loam vs clay loam “black cotton”) (P > 0.76). Based on these results for soil type, we altered the effect of soil type on the statistical analysis from an either-or soil classification variable and included it in subsequent analyses as a covariate.
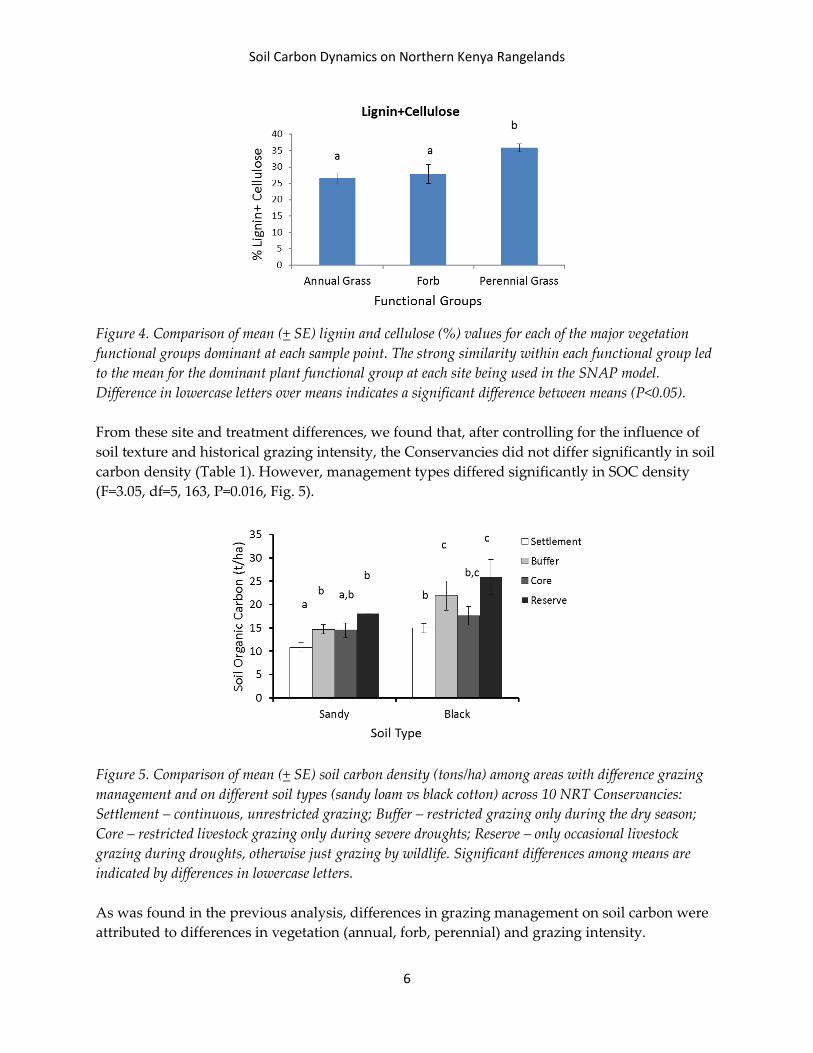
Figure 3. Map of soils for the Northern Kenya Carbon Project (Black outlines showing the participating conservancies, showing dark red for sandy loam, pale red for black cotton, and white for rocky soils or forest areas not included in the carbon project. Effects of grazing management Lignin and cellulose content varied from 12% - 40% across sites and exhibited considerable variation even within a management type. Nevertheless, lignin + cellulose differed significantly among management types (F = 8.122, df=3,69, P < 0.001) due almost entirely to the greater presence of perennial grasses in Core areas, as perennial grasses had significantly higher lignin and cellulose (mean 34%) compared to either annual grasses or forbs (mean 26 and 27%, respectively) (Fig. 4).
5
Soil Carbon Dynamics on Northern Kenya Rangelands
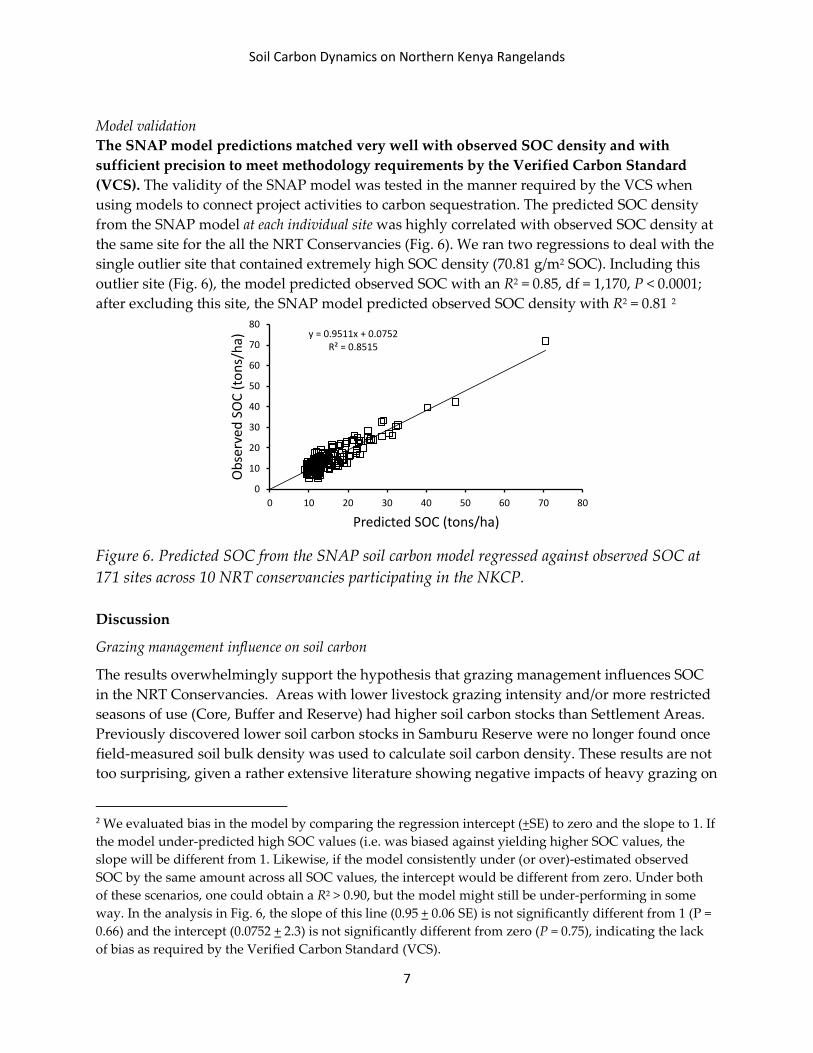
Figure 4. Comparison of mean (+ SE) lignin and cellulose (%) values for each of the major vegetation functional groups dominant at each sample point. The strong similarity within each functional group led to the mean for the dominant plant functional group at each site being used in the SNAP model. Difference in lowercase letters over means indicates a significant difference between means (P<0.05). From these site and treatment differences, we found that, after controlling for the influence of soil texture and historical grazing intensity, the Conservancies did not differ significantly in soil carbon density (Table 1). However, management types differed significantly in SOC density (F=3.05, df=5, 163, P=0.016, Fig. 5).
Figure 5. Comparison of mean (+ SE) soil carbon density (tons/ha) among areas with difference grazing management and on different soil types (sandy loam vs black cotton) across 10 NRT Conservancies: Settlement – continuous, unrestricted grazing; Buffer – restricted grazing only during the dry season; Core – restricted livestock grazing only during severe droughts; Reserve – only occasional livestock grazing during droughts, otherwise just grazing by wildlife. Significant differences among means are indicated by differences in lowercase letters. As was found in the previous analysis, differences in grazing management on soil carbon were attributed to differences in vegetation (annual, forb, perennial) and grazing intensity.
6
Soil Carbon Dynamics on Northern Kenya Rangelands
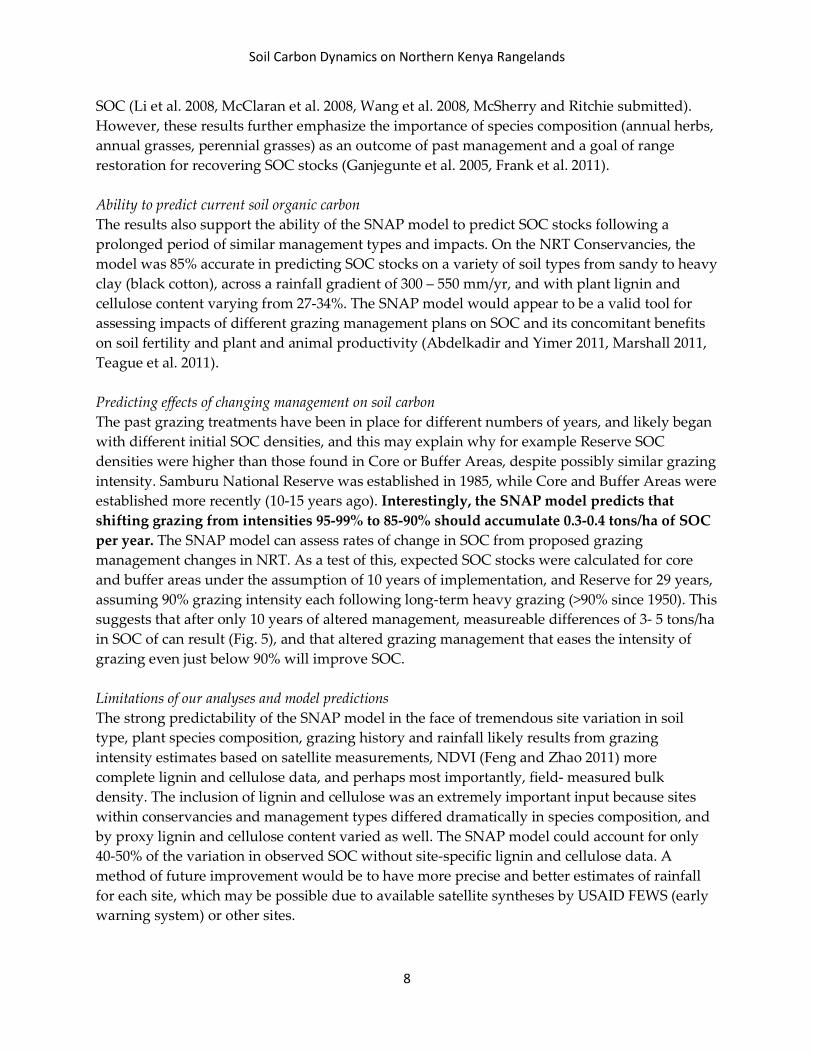
Model validation The SNAP model predictions matched very well with observed SOC density and with sufficient precision to meet methodology requirements by the Verified Carbon Standard (VCS). The validity of the SNAP model was tested in the manner required by the VCS when using models to connect project activities to carbon sequestration. The predicted SOC density from the SNAP model at each individual site was highly correlated with observed SOC density at the same site for the all the NRT Conservancies (Fig. 6). We ran two regressions to deal with the single outlier site that contained extremely high SOC density (70.81 g/m2 SOC). Including this outlier site (Fig. 6), the model predicted observed SOC with an R2 = 0.85, df = 1,170, P < 0.0001; after excluding this site, the SNAP model predicted observed SOC density with R2 = 0.81 2
Figure 6. Predicted SOC from the SNAP soil carbon model regressed against observed SOC at 171 sites across 10 NRT conservancies participating in the NKCP. Discussion
Grazing management influence on soil carbon
The results overwhelmingly support the hypothesis that grazing management influences SOC in the NRT Conservancies. Areas with lower livestock grazing intensity and/or more restricted seasons of use (Core, Buffer and Reserve) had higher soil carbon stocks than Settlement Areas. Previously discovered lower soil carbon stocks in Samburu Reserve were no longer found once field-measured soil bulk density was used to calculate soil carbon density. These results are not too surprising, given a rather extensive literature showing negative impacts of heavy grazing on
2 We evaluated bias in the model by comparing the regression intercept (+SE) to zero and the slope to 1. If the model under-predicted high SOC values (i.e. was biased against yielding higher SOC values, the slope will be different from 1. Likewise, if the model consistently under (or over)-estimated observed SOC by the same amount across all SOC values, the intercept would be different from zero. Under both of these scenarios, one could obtain a R2 > 0.90, but the model might still be under-performing in some way. In the analysis in Fig. 6, the slope of this line (0.95 + 0.06 SE) is not significantly different from 1 (P = 0.66) and the intercept (0.0752 + 2.3) is not significantly different from zero (P = 0.75), indicating the lack of bias as required by the Verified Carbon Standard (VCS).
y = 0.9511x + 0.0752R² = 0.8515
0
10
20
30
40
50
60
70
80
0 10 20 30 40 50 60 70 80
Obs
erve
d SO
C (to
ns/h
a)
Predicted SOC (tons/ha)
7
Soil Carbon Dynamics on Northern Kenya Rangelands
SOC (Li et al. 2008, McClaran et al. 2008, Wang et al. 2008, McSherry and Ritchie submitted). However, these results further emphasize the importance of species composition (annual herbs, annual grasses, perennial grasses) as an outcome of past management and a goal of range restoration for recovering SOC stocks (Ganjegunte et al. 2005, Frank et al. 2011). Ability to predict current soil organic carbon The results also support the ability of the SNAP model to predict SOC stocks following a prolonged period of similar management types and impacts. On the NRT Conservancies, the model was 85% accurate in predicting SOC stocks on a variety of soil types from sandy to heavy clay (black cotton), across a rainfall gradient of 300 – 550 mm/yr, and with plant lignin and cellulose content varying from 27-34%. The SNAP model would appear to be a valid tool for assessing impacts of different grazing management plans on SOC and its concomitant benefits on soil fertility and plant and animal productivity (Abdelkadir and Yimer 2011, Marshall 2011, Teague et al. 2011). Predicting effects of changing management on soil carbon The past grazing treatments have been in place for different numbers of years, and likely began with different initial SOC densities, and this may explain why for example Reserve SOC densities were higher than those found in Core or Buffer Areas, despite possibly similar grazing intensity. Samburu National Reserve was established in 1985, while Core and Buffer Areas were established more recently (10-15 years ago). Interestingly, the SNAP model predicts that shifting grazing from intensities 95-99% to 85-90% should accumulate 0.3-0.4 tons/ha of SOC per year. The SNAP model can assess rates of change in SOC from proposed grazing management changes in NRT. As a test of this, expected SOC stocks were calculated for core and buffer areas under the assumption of 10 years of implementation, and Reserve for 29 years, assuming 90% grazing intensity each following long-term heavy grazing (>90% since 1950). This suggests that after only 10 years of altered management, measureable differences of 3- 5 tons/ha in SOC of can result (Fig. 5), and that altered grazing management that eases the intensity of grazing even just below 90% will improve SOC. Limitations of our analyses and model predictions The strong predictability of the SNAP model in the face of tremendous site variation in soil type, plant species composition, grazing history and rainfall likely results from grazing intensity estimates based on satellite measurements, NDVI (Feng and Zhao 2011) more complete lignin and cellulose data, and perhaps most importantly, field- measured bulk density. The inclusion of lignin and cellulose was an extremely important input because sites within conservancies and management types differed dramatically in species composition, and by proxy lignin and cellulose content varied as well. The SNAP model could account for only 40-50% of the variation in observed SOC without site-specific lignin and cellulose data. A method of future improvement would be to have more precise and better estimates of rainfall for each site, which may be possible due to available satellite syntheses by USAID FEWS (early warning system) or other sites.
8
Soil Carbon Dynamics on Northern Kenya Rangelands
Applications to carbon markets The predicted additional carbon added as a consequence of reducing grazing intensities in core and buffer areas predicted by the SNAP model of 0.3 – 0.5 tons SOC/ha/yr translates to carbon dioxide sequestration of 1.1 – 1.84 tons CO2 per year. This is virtually the same range of carbon dioxide sequestration predicted by the SNAP model in previous assessments. Based on pending methodologies on the Verified Carbon Standard, and using a base rate of $5.00-$9.00 USD per ton of carbon on the open market (Carbon Trade Exchange, http://carbontradexchange.com ), this rate of carbon sequestration extrapolated over 1 million ha could result in substantial revenue generation if sustainable grazing practices can be effectively implemented at that scale. All the required carbon baseline data for validating the NKCP on the VCS are now available, and so development of a VCS project document can proceed. Conclusion The results of this study affirm that grazing management influences SOC by altering grazing intensity and species composition. Changes in SOC from different management strategies can be predicted well with the SNAP carbon dynamic model developed in Tanzania. Improvements in model predictions could be achieved with more precise rainfall interpolations. However, even without improved data, the model results suggest that prolonged, heavy, continuous grazing in the NRT Conservancies over the past 40 years has greatly depleted SOC stocks, but that reduction in grazing intensity can lead to recovery of SOC and relatively large eventual increases (10-20 tons C/ha) in SOC. Such recovery, if implemented across multiple Conservancies, could produce an economically viable carbon offset project with potentially annual or biannual revenues using pending methodologies on the Verified Carbon Standard.
Methods
Study site
The study was conducted in all 14 participating conservancies, Il Ngwesi, Lekurruki, Mpus Kutuk, Kalama, Meibae, West Gate, Namunyak, Sera, Buliqo Bulesa, Melako, Leparua, Nasuulu, Nakpurat-Goto within the Northern Rangelands Trust Conservancies (Fig. 2). Sometime in the past 5-14 years, each Conservancy except Meibae and Namunyak established a “core area” designated to be free of livestock (except under drought conditions or for limited periods during the wet season (low tourist occupancy periods), surrounded by a “buffer area” that received only partial livestock use during dry seasons. These contrasted with “settlement” areas in which there were no restrictions on livestock use. Finally, we also sampled “Reserve” at six sites within Samburu National Reserve, which lies just south of the Kalama Conservancy. Rainfall in the area and for specific sampling sites was determined by interpolating mean annual rainfall isopleth maps for Samburu, Isiolo, and Laikipia Districts published by Hijmans et al. (2005) (Fig. 7) Rainfall varies from 300-350 mm/yr in the eastern portion of the NRT
9
Soil Carbon Dynamics on Northern Kenya Rangelands
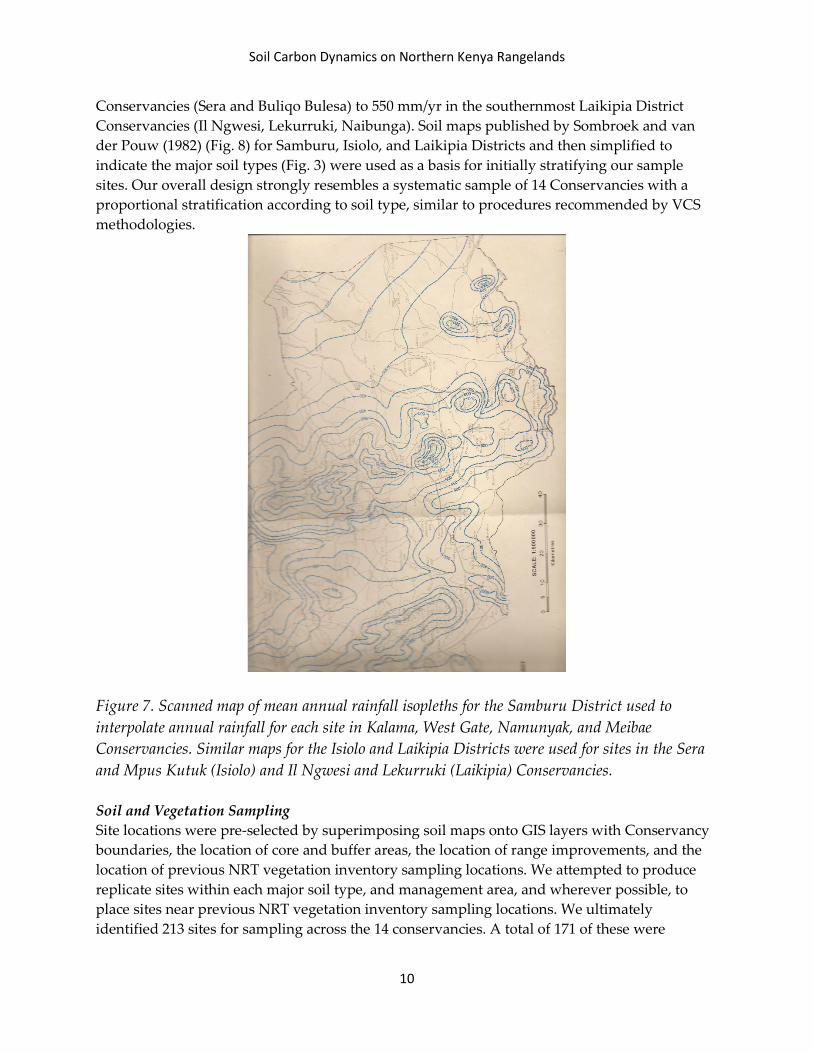
Conservancies (Sera and Buliqo Bulesa) to 550 mm/yr in the southernmost Laikipia District Conservancies (Il Ngwesi, Lekurruki, Naibunga). Soil maps published by Sombroek and van der Pouw (1982) (Fig. 8) for Samburu, Isiolo, and Laikipia Districts and then simplified to indicate the major soil types (Fig. 3) were used as a basis for initially stratifying our sample sites. Our overall design strongly resembles a systematic sample of 14 Conservancies with a proportional stratification according to soil type, similar to procedures recommended by VCS methodologies.
Figure 7. Scanned map of mean annual rainfall isopleths for the Samburu District used to interpolate annual rainfall for each site in Kalama, West Gate, Namunyak, and Meibae Conservancies. Similar maps for the Isiolo and Laikipia Districts were used for sites in the Sera and Mpus Kutuk (Isiolo) and Il Ngwesi and Lekurruki (Laikipia) Conservancies. Soil and Vegetation Sampling Site locations were pre-selected by superimposing soil maps onto GIS layers with Conservancy boundaries, the location of core and buffer areas, the location of range improvements, and the location of previous NRT vegetation inventory sampling locations. We attempted to produce replicate sites within each major soil type, and management area, and wherever possible, to place sites near previous NRT vegetation inventory sampling locations. We ultimately identified 213 sites for sampling across the 14 conservancies. A total of 171 of these were
10

Soil Carbon Dynamics on Northern Kenya Rangelands
originally sampled in 2012 and then re-sampled to measure bulk density in January 2014. An additional 42 sites were sampled in the four new participating conservancies in August 2014. New sampling occurred at 171 sites in January 2014 for measuring bulk density properly and to identify the most dominant plant functional group. At each of the 42 new sites, the GPS location (GPS point) was noted and marked with a cairn of stones, as was done at the previous 171 sites. Three soil cores were taken with a hand-held corer to a depth of 20 cm approximately 3m N of the GPS point3. We also clipped aboveground vegetation from two 25 x 25 cm quadrats near each GPS point to obtain samples for lignin and cellulose4. Grazing Intensity Past grazing history, which reflects conditions that would lead to current soil carbon stocks was estimated as 1 – (Biomass LT/Biomass REF) where Biomass LT was estimated from long-term (10 year) average NDVI at the end of the growing season (June) measured at each sample point. Biomass REF was calculated from long-term average NDVI measured in June at points that were known to be grazed by livestock only infrequently during the 10 year period. In a separate report from this same USAID ABCG grant , NDVI was found to be very strongly correlated with forage biomass (R2 = 0.60) (NDVI = 0.2096 + 0.0009*Biomass). Using this regression, average NDVI at each sample point for the period 2003-2013 (long-term average NDVI, NDVILT) was then used to calculate long-term average biomass: Biomass LT = -232.88 + 1111.11*NDVILT . Grazing intensity was then calculated as 1 – (Biomass LT/Biomass REF), where Biomass REF was determined as Biomass REF = -232.88 +1111.11*NDVIREF where NDVIREF was the average (mean ungrazed NDVI = 0.4135 + 0.0323 SE) over the period 2003-2013 from 100 points in known Core areas that were only very infrequently grazed (such as in Sera Core or near the lodge in Kalama Core area).
3 Cores were pooled, mixed, and a 100 g sample was saved for later analysis. Soil samples were analyzed for the concentration of soil organic carbon (g SOC/g soil) by the laboratory at the International Centre for Agriculture and Forestry (ICRAF), Nairobi with mid-infrared (MIR) methods calibrated with direct soil carbon measurements with a Carlo-Erba autoanalyzer (Fig. A) and with dry mass/volume measured directly in the field for bulk density (g soil/cm3). A smaller subset of samples, representing sites with from the major soils categories listed on the soils map, were analyzed for texture (percent sand, silt, and clay) using MIR methods calibrated to liquid settling methods by ICRAF. 4 Live and standing dead plant material was dried at 60oC and weighed to determine biomass. These two types of material were combined and ground through a 0.8 mm mesh screen in a Wiley Mill and then digested for 24 hrs while agitated in a solution of acid and detergent (Claessens et al. 2005). The remainder (mass R) was then placed in a 400oC muffle furnace for 48 hrs to yield ash content (mass A). The Lignin + cellulose content (mass L) = (R-A)/T, where T is the total dry mass of the sample.
11
Soil Carbon Dynamics on Northern Kenya Rangelands
References
Abdelkadir, A., and F. Yimer. 2011. Soil water property variations in three adjacent land use types in the Rift Valley area of Ethiopia. Journal of Arid Environments 75:1067-1071.
Brooks, N., N. Grist, and K. Brown. 2009. Development futures in the context of climate change: challenging the present and learning from the past. Development Policy Review 27:741-765.
Carrera, A., J. Ares, J. Labraga, S. Thurner, and M. Bertiller. 2007. Scenarios of future climate and land-management effects on carbon stocks in northern Patagonian shrublands. Environmental Management 40:944-957.
Claessens, A., R. Michaud, G. Belanger, and D. E. Mather. 2005. Leaf and stem characteristics of timothy plants divergently selected for the ratio of lignin to cellulose. Crop Science 45:2425-2429.
Dong, S. K., L. Wen, S. L. Liu, X. F. Zhang, J. P. Lassoie, S. L. Yi, X. Y. Li, J. P. Li, and Y. Y. Li. 2011. Vulnerability of Worldwide Pastoralism to Global Changes and Interdisciplinary Strategies for Sustainable Pastoralism. Ecology and Society 16.
Feng, X. M., and Y. S. Zhao. 2011. Grazing intensity monitoring in Northern China steppe: Integrating CENTURY model and MODIS data. Ecological Indicators 11:175-182.
Frank, D. A., T. Depriest, K. McLauchlan, and A. C. Risch. 2011. Topographic and ungulate regulation of soil C turnover in a temperate grassland ecosystem. Global Change Biology 17:495-504.
Galvin, K. A. 2009. Transitions: Pastoralists Living with Change. Pages 185-198 Annual Review of Anthropology.
Ganjegunte, G. K., G. F. Vance, C. M. Preston, G. E. Schuman, L. J. Ingram, P. D. Stahl, and J. M. Welker. 2005. Organic carbon composition in a northern mixed-grass prairie: Effects of grazing. Soil Science Society of America Journal 69:1746-1756.
Kratli, S., and N. Schareika. 2010. Living Off Uncertainty: The Intelligent Animal Production of Dryland Pastoralists. European Journal of Development Research 22:605-622.
Leifeld, J., M. Zimmermann, J. Fuhrer, and F. Conen. 2009. Storage and turnover of carbon in grassland soils along an elevation gradient in the Swiss Alps. Global Change Biology 15:668-679.
Li, C. L., X. Y. Hao, M. L. Zhao, G. D. Han, and W. D. Willms. 2008. Influence of historic sheep grazing on vegetation and soil properties of a Desert Steppe in Inner Mongolia. Agriculture Ecosystems & Environment 128:109-116.
Maraseni, T. N., N. J. Mathers, B. Harms, G. Cockfield, A. Apan, and J. Maroulis. 2008. Comparing and predicting soil carbon quantities under different land-use systems on the Red Ferrosol soils of southeast Queensland. Journal of Soil and Water Conservation 63:250-256.
Marshall, N. A. 2011. Assessing resource dependency on the rangelands as a measure of climate sensitivity. Society & Natural Resources 24:1105-1115.
McClaran, M. P., J. Moore-Kucera, D. A. Martens, J. van Haren, and S. E. Marsh. 2008. Soil carbon and nitrogen in relation to shrub size and death in a semi-arid grassland. Geoderma 145:60-68.
12
Soil Carbon Dynamics on Northern Kenya Rangelands
McSherry, M., and M. E. Ritchie. submitted. Effects of grazing on soil carbon density: a global review. Globall Change biology.
Paavola, J. 2008. Livelihoods, vulnerability and adaptation to climate change in Morogoro, Tanzania. Environmental Science & Policy 11:642-654.
Ritchie, M. E. 2014. Plant compensation to grazing and soil carbon dynamics in a tropical grassland PeerJ 2:e233.
Teague, W. R., S. L. Dowhower, S. A. Bakera, N. P. B. Haileb, P. B. DeLaunea, and D. M. Conovera. 2011. Grazing management impacts on vegetation, soil biota and soil chemical, physical and hydrological properties in tall grass prairie. Agriculture, Ecosystems, and the Environment 141:310-322.
Wang, Y. H., G. S. Zhou, and B. R. Jia. 2008. Modeling SOC and NPP responses of meadow steppe to different grazing intensities in Northeast China. Ecological Modelling 217:72-78.
Wren, S., and C. I. Speranza. 2010. The struggle to diversify rural livelihoods: bio-enterprise initiatives and their impacts on agro-pastoralists and pastoralist communities in the drylands of Kenya. European Journal of Development Research 22:751-769.
Xu, X. L., W. Liu, and G. Kiely. 2011. Modeling the change in soil organic carbon of grassland in response to climate change: Effects of measured versus modelled carbon pools for initializing the Rothamsted Carbon model. Agriculture Ecosystems & Environment 140:372-381.
13