Embed Size (px)
Citation preview
ESDD6, 1047–1100, 2015
Soil C management,large-scale Earthsystem modelling
S. Olin et al.
Title Page
Abstract Introduction
Conclusions References
Tables Figures
J I
J I
Back Close
Full Screen / Esc
Printer-friendly Version
Interactive Discussion
Discussion
Paper
|D
iscussionP
aper|
Discussion
Paper
|D
iscussionP
aper|
Earth Syst. Dynam. Discuss., 6, 1047–1100, 2015www.earth-syst-dynam-discuss.net/6/1047/2015/doi:10.5194/esdd-6-1047-2015© Author(s) 2015. CC Attribution 3.0 License.
This discussion paper is/has been under review for the journal Earth SystemDynamics (ESD). Please refer to the corresponding final paper in ESD if available.
Soil carbon management in large-scaleEarth system modelling: implications forcrop yields and nitrogen leaching
S. Olin1, M. Lindeskog1, T. A. M. Pugh2, G. Schurgers3, D. Wårlind4,M. Mishurov1, S. Zaehle5, B. D. Stocker6, B. Smith1, and A. Arneth2
1Department of Physical Geography and Ecosystem Science, Lund University,223 62 Lund, Sweden2Karlsruhe Institute of Technology, Institute of Meteorology and ClimateResearch/Atmospheric Environmental Research, 82467 Garmisch-Partenkirchen, Germany3Department of Geosciences and Natural Resource Management, University of Copenhagen,Øster Voldgade 10, 1350 Copenhagen, Denmark4CSIRO Sustainable Agricultural Flagship, CSIRO Agriculture, GPO Box 1666, BlackMountain, Canberra, ACT 2601, Australia5Max Planck Institute for Biogeochemistry – Biogeochemical Integration Department, P.O.Box 60 01 64, 07701 Jena, Germany6Department of Life Sciences, Imperial College London, Silwood Park, Ascot, SL5 7PY, UK
1047
ESDD6, 1047–1100, 2015
Soil C management,large-scale Earthsystem modelling
S. Olin et al.
Title Page
Abstract Introduction
Conclusions References
Tables Figures
J I
J I
Back Close
Full Screen / Esc
Printer-friendly Version
Interactive Discussion
Discussion
Paper
|D
iscussionP
aper|
Discussion
Paper
|D
iscussionP
aper|
Received: 5 May 2015 – Accepted: 17 May 2015 – Published: 15 June 2015
Correspondence to: S. Olin ([email protected])
Published by Copernicus Publications on behalf of the European Geosciences Union.
1048
ESDD6, 1047–1100, 2015
Soil C management,large-scale Earthsystem modelling
S. Olin et al.
Title Page
Abstract Introduction
Conclusions References
Tables Figures
J I
J I
Back Close
Full Screen / Esc
Printer-friendly Version
Interactive Discussion
Discussion
Paper
|D
iscussionP
aper|
Discussion
Paper
|D
iscussionP
aper|
Abstract
We explore cropland management alternatives and the effect these can have on fu-ture C and N pools and fluxes using the land use-enabled dynamic vegetation modelLPJ-GUESS. Simulated crop production, cropland carbon storage, carbon sequestra-tion and nitrogen leaching from croplands are evaluated and discussed. Compared5
to the version of LPJ-GUESS that does not include land use dynamics, estimates ofsoil carbon stocks and nitrogen leaching from terrestrial to aquatic ecosystems wereimproved.
We explore trade-offs between important ecosystem services that can be providedfrom agricultural fields such as crop yields, retention of nitrogen and carbon storage.10
These trade-offs are evaluated for current land use and climate and further exploredfor future conditions within the two future climate change scenarios, RCP 2.6 and 8.5.Our results show that the potential for carbon sequestration due to typical croplandmanagement practices such as no-till and cover-crops proposed in literature is notrealised, globally or over larger climatic regions. Our results highlight important consid-15
erations to be made when modelling C–N interactions in agricultural ecosystems underfuture environmental change, and the effects these have on terrestrial biogeochemicalcycles.
1 Introduction
Growing population along with rapidly changing dietary preferences pose a key eco-20
nomical and environmental challenge of this century (Gerland et al., 2014; Hertel,2015). According to estimates made by the United Nations Food and Agriculture Or-ganisation (FAO), food production will need to be doubled by 2050 in order to meetthe global food demand (FAO, 2008). Since the beginning of the 20th century therehas been an increase in crop yields and overall production, especially since the 1950s25
(Steffen et al., 2015), as a result of agricultural intensification driven by substantial
1049
ESDD6, 1047–1100, 2015
Soil C management,large-scale Earthsystem modelling
S. Olin et al.
Title Page
Abstract Introduction
Conclusions References
Tables Figures
J I
J I
Back Close
Full Screen / Esc
Printer-friendly Version
Interactive Discussion
Discussion
Paper
|D
iscussionP
aper|
Discussion
Paper
|D
iscussionP
aper|
advances in agricultural practices and technology, improved crop varieties and an in-creased application of N and P fertiliser (Evans, 1999; Spano et al., 2003). In addition,agricultural land area globally has expanded, with presently around 35 % of the totalland surface being covered by cropland and pastures (Ramankutty et al., 2008). A fur-ther increase in cropland area by at most around 5 Mha (> 3 times the present area;5
Eitelberg et al., 2015) would be possible, but a range of societal and political pressureson land resources may limit the conversion of additional land area to agricultural pro-duction in many regions. Increasing yields on existing cropland would reduce pressurefor further land conversion. Yield increases may be achieved through further devel-opment of high-yielding varieties or through further improvements in the efficiency of10
agricultural practices, the latter especially in regions where gaps between actual andpotential yields are large (Licker et al., 2010; Mueller et al., 2014). The enhanced inputof nitrogen (N) into ecosystems, jointly with other technical developments, has playeda major role in the large increase in agricultural productivity over the last 50 years, of-ten termed the “green revolution”. However, the associated environmental effects have15
often been detrimental, with negative impacts on biodiversity and water quality, andsubstantial emissions of N trace gases that affect air quality and climate, such as ni-trous oxide (N2O), a potent greenhouse gas (Galloway et al., 2004; Rockstrom et al.,2009; Tilman et al., 2002; Vitousek et al., 1997). A large fraction of the N2O emitted tothe atmosphere today originates from terrestrial sources, mostly from fertiliser use on20
agricultural soils (Zaehle et al., 2011; Park et al., 2012; Ciais et al., 2013). Fertiliser usealso promotes nitrate leaching which causes eutrophication and algal blooms in water-sheds and coastal seas, with follow-on effects such as loss of fish populations andrecreational value, and health risks through contamination of drinking water (Cameronet al., 2013). Even in Europe, where environmental regulations are relatively advanced,25
around 70 % of the population live in areas where the levels of nitrate in drinking watereither exceed the recommended value (ca. 20 % of the population) or have reached atleast half this level (ca. 50 % of the population; Grizetti, 2011).
1050

ESDD6, 1047–1100, 2015
Soil C management,large-scale Earthsystem modelling
S. Olin et al.
Title Page
Abstract Introduction
Conclusions References
Tables Figures
J I
J I
Back Close
Full Screen / Esc
Printer-friendly Version
Interactive Discussion
Discussion
Paper
|D
iscussionP
aper|
Discussion
Paper
|D
iscussionP
aper|
Previous studies of the effects of agriculture on global biogeochemical cycles havetypically focused on the largest immediate impacts, like the carbon losses followingdeforestation (e.g. Ciais et al., 2013; Houghton et al., 2012; Le Quéré et al., 2015). Itis estimated that over the last 150–200 years, the conversion of natural to managedecosystems, especially croplands, has released ca. 180 Pg carbon (C, current rate is5
∼ 1 PgCyr−1) from the terrestrial biosphere to the atmosphere by disturbing soils andthrough the harvesting and burning of biomass (Le Quéré et al., 2014). This sum isequivalent to around a third of the anthropogenic CO2 concentration in the atmospheretoday. However, the land-use related carbon flux is one of the most uncertain terms inthe global carbon budget (Ciais et al., 2013; Le Quéré et al., 2015), and studies with10
dynamic vegetation models (DVMs) incorporating representations of land-use change(LUC) have shown that the actual estimate is highly dependent on the managementpractices assumed in the model (Bondeau et al., 2007; Levis et al., 2014; Lindeskoget al., 2013; Pugh et al., 2015).
Available knowledge on the effects of interactions between nitrogen and carbon cy-15
cles in terrestrial ecosystems is largely based on simulations with DVMs represent-ing potential natural vegetation (e.g., Thornton et al., 2009; Zaehle and Dalmonech,2011; Smith et al., 2014). The results obtained with these models suggest that soil Nprocesses governing plant available nitrogen can constrain vegetation growth and thestrength of the terrestrial carbon sink (e.g., Zaehle et al., 2011; Wårlind et al., 2014).20
Only two global modelling frameworks have been put forward with both detailed crop-land ecosystem functioning and coupled C–N cycling simulated in a consistent fashion(Arora, 2003; Drewniak et al., 2013). No study has applied such a model at globalscale to investigate joint impacts of environmental change and land management onassociated changes in agricultural yields, water pollution and carbon balance.25
The production of food and the protection of the environment often require conflict-ing strategies. Compared to forests, agricultural lands have lower carbon sequestrationrates and enhanced nitrogen leaching, and agricultural production is hence done at theexpense of other ecosystem services that those lands might otherwise provide; inten-
1051

ESDD6, 1047–1100, 2015
Soil C management,large-scale Earthsystem modelling
S. Olin et al.
Title Page
Abstract Introduction
Conclusions References
Tables Figures
J I
J I
Back Close
Full Screen / Esc
Printer-friendly Version
Interactive Discussion
Discussion
Paper
|D
iscussionP
aper|
Discussion
Paper
|D
iscussionP
aper|
sifying agricultural production might have further detrimental effects on these ecosys-tems (Tilman et al., 2002). At the same time, the world’s population needs to be fed,and a more nitrogen-intensive agricultural system with higher productivity may resultin a lower overall area in use for agriculture, leaving aside a greater area that canbe devoted to the provision of other ecosystem services. This debate, often termed5
land-sparing vs. land-sharing, is currently a matter of great scientific and political de-bate (Phalan et al., 2011). These trade-offs between agricultural production on the onehand and carbon sequestration and reduction of nitrogen leaching on the other havegiven rise to a number of mitigation strategies in agricultural practice that have onlya limited impact on production but contribute to other ecosystem services.10
From an ecosystem carbon-pool-size perspective, the largest effect on terrestrialcarbon storage through agricultural management practices is in fact induced throughharvest (Smith et al., 2012; Pugh et al., 2015), as this removes a considerable amountof biomass each year from the ecosystem. Harvest is, however, the fundamental pur-pose of croplands and pastures, and is rarely discussed as an element of a manage-15
ment strategy targeting enhanced environmental value. Management practices needto move into focus in global-scale modeling, and some of the key interventions arereviewed below. One management option related to harvest is residue-removal afterharvest (Lal and Bruce, 1999). Removing residues for use in bio-fuel production is anappealing measure, as making multiple use of the existing croplands may be seen as20
a win-win situation (Lal, 2004b; Smith et al., 2012). However, not incorporating residuesinto soils results in their becoming drained of soil organic carbon (SOC); which retainswater and nutrients and thus affects the soil fertility (Lal, 2004b; Smith et al., 2012).Another practice that is often debated is tillage (Lal, 2004a, 2008). Different forms oftillage have been used for centuries to promote the release of nutrients from the soil25
organic matter (SOM) for uptake by crops. However, the aeration of the soil associatedwith the mechanical disturbance of the soil profile increases heterotrophic respiration(Rh), and thus enhances soil C losses to the atmosphere (Chatskikh et al., 2009; Lal,2004a). No-till management has gained popularity as a potential climate change mit-
1052
ESDD6, 1047–1100, 2015
Soil C management,large-scale Earthsystem modelling
S. Olin et al.
Title Page
Abstract Introduction
Conclusions References
Tables Figures
J I
J I
Back Close
Full Screen / Esc
Printer-friendly Version
Interactive Discussion
Discussion
Paper
|D
iscussionP
aper|
Discussion
Paper
|D
iscussionP
aper|
igation measure, as it can prevent management-related losses of soil C stocks (Lal,2004a). But while no-till is expected to favour carbon retention by agricultural fields,the strength and persistence of any sink is debated (Lal, 2004a; Schlesinger, 2000).In a review on soil C sequestration, comparing conventional and no-till, Baker et al.(2007) found that the top soil in no-till treatments did contain more C, but the C density5
below the top soil layer in the conventionally tilled fields was higher, and there wasno significant difference in overall C densities between the two treatments. Moreover,the conversion of N to plant-available forms is reduced in untilled soils and can thuslead to lower crop productivity, which could in the long run decrease the soil’s abilityto store water and nutrients because the reduced release is partly counterbalanced by10
a reduced input of new organic material (Lal, 2004a).Timing of farmer practices such as sowing and harvest, fertilisation or irrigation are
crucial for calculation of yields and – from the fertilisation perspective in particular –N leaching, but these practices are unlikely to affect carbon cycling on a global scale(Pugh et al., 2015). A major challenge is therefore to identify practices that increase15
soil C sequestration while maintaining or increasing current yields and at the same timewithout detrimental side-effects on ecosystems.
In this study we employ the land-use enabled version of a global DVM, LPJ-GUESS(Lindeskog et al., 2013; Olin et al., 2015), to explore and quantify the effectuality ofalternative management strategies targeting mitigation of the negative effects of agri-20
culture on carbon and nitrogen cycles. To this end, we extended the model to includeN dynamics for crops, and the response of different N-application rates was evaluatedon local to regional scale. Management options considered are tillage, cover-crops andmanure application. We quantify management effects on soil carbon pools, yields andnitrogen losses through leaching from croplands and evaluate the model globally and25
for a representative range of climatic regions. In addition, the persistence and directionof these effects under future climate change scenarios are explored.
1053

ESDD6, 1047–1100, 2015
Soil C management,large-scale Earthsystem modelling
S. Olin et al.
Title Page
Abstract Introduction
Conclusions References
Tables Figures
J I
J I
Back Close
Full Screen / Esc
Printer-friendly Version
Interactive Discussion
Discussion
Paper
|D
iscussionP
aper|
Discussion
Paper
|D
iscussionP
aper|
2 Materials and methods
2.1 LPJ-GUESS
LPJ-GUESS (Smith et al., 2014) is a DVM that simulates dynamic vegetation responseto climate, atmospheric CO2 levels ([CO2]) and N input through competition for light,N, and water on a daily time step. Vegetation is represented by plant functional types5
(PFTs) that differ in their growth form, phenology, life-history strategy, distributional tem-perature limits and N requirements. C3 and C4 photosynthetic pathways are discrimi-nated for grasses. Leaf-level net photosynthesis is calculated following a Farquhar-typeapproach, modified by Collatz et al. (1991, 1992) and scaled to the canopy followingHaxeltine and Prentice (1996). Canopy conductance of water vapor and respiration of10
plant compartments other than leaves follows (Sitch et al., 2003). For potential nat-ural vegetation, carbon allocation and stand dynamics, based on competition amongage-classes of trees co-occurring in a number (here 5) of replicated patches in eachgrid cell, are modelled on a yearly time-step (Smith et al., 2001; Hickler et al., 2004).Disturbance by wildfire and other events such as storms are accounted for. Details of15
the representation of soil and plant physiological and growth processes are provided inSmith et al. (2001, 2014); Olin et al. (2015).
Soil C–N dynamics in LPJ-GUESS are based on the CENTURY model (Parton et al.,1993) in which SOM and litter are represented by 11 pools that differ in their C to Nratios (C : N), which are dynamic within prescribed limits (Smith et al., 2014). Mobili-20
sation of mineral N is the result of heterotrophic decay and respiration which dependson the C : N and decay rates (Kd) of the SOM pools. Values of Kd are dynamic andvary between these pools, and are also modified by factors related to temperature andwater content of the soil (Smith et al., 2014). Immobilisation of mineral N occurs whenthe C : N ratio of transferred SOM is larger than that of the receiving pool. Both organic25
and mineral N leaching are represented in the model and are related to percolation; fororganic leaching there is also a dependency on soil silt and clay fractions.
1054

ESDD6, 1047–1100, 2015
Soil C management,large-scale Earthsystem modelling
S. Olin et al.
Title Page
Abstract Introduction
Conclusions References
Tables Figures
J I
J I
Back Close
Full Screen / Esc
Printer-friendly Version
Interactive Discussion
Discussion
Paper
|D
iscussionP
aper|
Discussion
Paper
|D
iscussionP
aper|
The present study uses the managed land version of the model (Lindeskog et al.,2013; Olin et al., 2015). Crops are represented in the model by crop functional types(CFTs), which differ in their temperature requirements for survival, heat requirementsfor growth and their C allocation patterns. Land-use and land-cover change are mod-elled on a yearly basis (Lindeskog et al., 2013) based on the externally supplied frac-5
tional area change within a grid-cell. Sowing dates are determined dynamically in themodel based on the prevailing climate in the grid cell (Lindeskog et al., 2013; Wahaet al., 2011), and crops are harvested when specified heat sum requirements are ful-filled. The crops are allowed to adapt to the local conditions by adjusting the heat sumrequirements to the historic climate (Lindeskog et al., 2013), reflecting a difference in10
varieties of a given crop grown in different climatic zones.The allocation of C and N for the CFTs in the C-N version of LPJ-GUESS (Olin et al.,
2015) is done on a daily time-step. C allocation depends on the plant’s developmentstage which in turn is based on temperature and day length, and follows Penning deVries et al. (1989), as described in detail for winter and spring wheat in Olin et al.15
(2015), and for maize in Table A1. N requirements for the plant vary during the growingperiod. This is reflected in the model by applying fertilisers proportionally at differentdevelopmental stages; see Appendix for more information on the timing of N fertiliserapplication for different CFTs.
At present, the C-N version of LPJ-GUESS is limited to three CFTs that are based20
on wheat and maize growth characteristics: a C3 crop with dynamic selection betweenspring and autumn sowing (presented here as winter wheat, WW), a C3 crop with sow-ing enforced in spring (spring wheat, SW) and a C4 crop (maize, MA). Allocation for SWand WW is described in Olin et al. (2015), MA-specific allocation parameters are listedin Tables A1–A2. For comparison with yield data, we adopt these three types to rep-25
resent the entire spectrum of crops grown globally. In particular, wheat and rapeseedthat have spring and autumn sown varieties were simulated as WW, whereas other C3crops (beans, rice, tubers, etc.) were modelled as SW, since these are typically springsown. Sorghum and millet were modelled as MA.
1055

ESDD6, 1047–1100, 2015
Soil C management,large-scale Earthsystem modelling
S. Olin et al.
Title Page
Abstract Introduction
Conclusions References
Tables Figures
J I
J I
Back Close
Full Screen / Esc
Printer-friendly Version
Interactive Discussion
Discussion
Paper
|D
iscussionP
aper|
Discussion
Paper
|D
iscussionP
aper|
LPJ-GUESS has been evaluated against a range of experimental and observationaldata types, e.g. CO2-fertilisation experiments (Olin et al., 2015; Smith et al., 2014),ecosystem dynamics (Smith et al., 2014), vegetation seasonality (Lindeskog et al.,2013) and C fluxes at various scales (Ahlström et al., 2012; Piao et al., 2013; Wram-neby et al., 2008). In Olin et al. (2015), the growth response to N fertiliser application on5
site scale (under ambient and elevated CO2) and over a larger region (western Europe)was evaluated.
2.1.1 Cropland management
The cropland management options implemented in LPJ-GUESS are sowing, irrigation,tillage, N-application, cover crops and residue management. The latter four options are10
relevant for this study and will be described below.
Tillage
Tillage is implemented using a tillage factor (fT) which affects Kd for selected SOMpools on croplands. Two tillage routines were implemented: moderate tillage where fTaffects the surface microbial pool and humus, and the microbial and slow turnover pool15
of the soil; and full tillage in which Kd for the metabolic and structural surface pools andthe passive and metabolic pools of the soil are also affected. The two tillage levels arenot intended to represent different tillage practices, but rather to span uncertainties inthe overall effect of tillage on soil respiration rates. The value of fT (1.94) is taken fromChatskikh et al. (2009), and modifies Kd (K ′d = fTKd) throughout the year.20
N application
Fertilisers are applied as mineral N (Olin et al., 2015). The timing of fertiliser applica-tions in the model roughly coincides with the crucial developmental periods of plantsbeing applied at the development stages (DS) 0, 0.5 and 0.9 (Olin et al., 2015) in CFT-specific amounts listed in Table A2.25
1056
ESDD6, 1047–1100, 2015
Soil C management,large-scale Earthsystem modelling
S. Olin et al.
Title Page
Abstract Introduction
Conclusions References
Tables Figures
J I
J I
Back Close
Full Screen / Esc
Printer-friendly Version
Interactive Discussion
Discussion
Paper
|D
iscussionP
aper|
Discussion
Paper
|D
iscussionP
aper|
Here we have extended the available N fertiliser application management optionsto also include manure application in the first of the three events (DS = 0, sowing).The manure is derived from the mineral N application and is applied as an increasein the metabolic and structural SOM pools with a C : N of 30, which has been chosento represent the C and N content in manure from sources ranging from poultry waste5
(C : N∼15) to straw-rich manure from livestock (C : N&40), (Nieder and Benbi, 2008).As the metabolic and structural SOM pools have different turnover (decomposition)rates the manure-derived N becomes available for an extended period in the soil.
Cover crops
Cover crops are intermediate crops that are grown in-between the main agricultural10
growing seasons. This can occur either as a fallow that stretches over the subsequentgrowing season or within a year (Follett, 2001). A common practice is to sow N-fixingplants such as legumes as cover crops, but grasses are also used. If the cover crop isnot harvested but, for example, ploughed in, some of the captured or retained nutrients,as well as the carbon content of the crop biomass, are retained in the soil, enhancing15
nutrient availability.In our implementation, cover crops are grown in-between two growing periods of
the generic main crop used if the crop-free period is longer than 15 days. At the timeof sowing of the subsequent main crop, the cover crop biomass is added to the soillitter pool. C and N allocation of the cover crop is done daily, with a leaf-to-root ratio20
that depends on the plant water status. In case of water stress, a functional balanceresponse is introduced and allocation to roots increases relative to leaves. Cover cropsare modelled as grasses, being “planted” with an initial C mass of 0.01 kgCm−2 andN mass that is based on the C : Nmin value for grasses (C : Nmin = 16). Symbiotic N-fixation, such as in legumes – common as cover crops in temperate latitudes – is not25
yet implemented.
1057
ESDD6, 1047–1100, 2015
Soil C management,large-scale Earthsystem modelling
S. Olin et al.
Title Page
Abstract Introduction
Conclusions References
Tables Figures
J I
J I
Back Close
Full Screen / Esc
Printer-friendly Version
Interactive Discussion
Discussion
Paper
|D
iscussionP
aper|
Discussion
Paper
|D
iscussionP
aper|
Residue removal
A measure to increase the soil fertility and decrease the water loss, in particular in aridareas, is to leave the residues on the ground after harvest (Lal, 2004a; Smith et al.,2012). This practice is represented in our model by removing only a fraction (defaultset to 75 %) of the biomass remaining following harvest, thus leaving the rest as litter5
which enters the normal soil-decomposition calculations.
2.2 Experimental setups
Our study is divided into two parts. In the first part we test the ability of LPJ-GUESS tosimulate present-day soil C and yield response to management by comparing sim-ulated results with datasets of soil C in crop fields, potential C sequestration after10
a change in management, and global yield statistics. In the second part of the study,we investigate the effectuality of alternative crop management options described inSect. 2.1.1 for mitigating climate change through increased carbon retention in crop-land soils. The sensitivity of soil carbon sequestration to these management optionsis first studied for present-day climate conditions, assessing relative effects in differ-15
ent regions. Subsequently, we force the model with General Circulation Model (GCM)-simulated climate under a 21st century future climate projection to investigate com-bined effects of future changes in multiple ecosystem drivers on cropland ecosystemcarbon balance.
For simulation over the recent historic period (1901–2006), gridded monthly mean20
observations from CRU (precipitation, air temperature and cloudiness, Mitchell andJones, 2005) were used. For the future climate simulations, monthly climate data wereadopted from four GCMs (CCSM4, Gent et al., 2011; MPI-ESM-LR, e.g. Stevens et al.,2013; IPSL-CM5A-LR, Dufresne et al., 2013; and HadGEM2-ES, Collins et al., 2011)from the CMIP5 data set (Taylor et al., 2011) and were bias corrected against CRU25
for monthly means over the period from 1961–1990, as described in (Ahlström et al.,2013). Climate data for the contrasting RCPs 2.6 and 8.5 radiative forcing projections
1058

ESDD6, 1047–1100, 2015
Soil C management,large-scale Earthsystem modelling
S. Olin et al.
Title Page
Abstract Introduction
Conclusions References
Tables Figures
J I
J I
Back Close
Full Screen / Esc
Printer-friendly Version
Interactive Discussion
Discussion
Paper
|D
iscussionP
aper|
Discussion
Paper
|D
iscussionP
aper|
(Moss et al., 2010) were selected based on the availability of projections of future N-fertilisation.
For all simulations soil C and N pools were initialised using a 500 year “spin-up” us-ing atmospheric [CO2] from the first historic year (1901 for the historical CRU-basedsimulations and 1850 for the CMIP5 simulations) combined with repeatedly cycled, de-5
trended climate input using the first 30 years of the historic climate data set. For com-parison with the CRU simulations described above, the spin-up in the CMIP5 simula-tions was set to 450 years, followed by a simulation for years 1850–1901 with dynamicclimate but constant [CO2] (using the [CO2] for 1901).
N atmospheric deposition was provided as decadally-varying monthly averages from10
the ACCMIP data set (Lamarque et al., 2010) transformed to the resolution of theclimate data following (Smith et al., 2014; Wårlind et al., 2014).
As N-fertiliser input for the croplands, data from (Zaehle et al., 2010a) were usedfor the historical time period starting from 1901 (CRU) and 1850 (CMIP5); for the fu-ture period (2006–2100), a dataset described in Stocker et al. (2013) was used, which15
expands on the data set from Zaehle et al. (2010a), and includes simulated futurefertiliser applications from integrated assessment models (RCP 2.6, Bouwman et al.,2013; RCP 8.5 Riahi et al., 2011). In addition, a simulation using N-fertiliser informa-tion from AgGRID (Elliott et al., 2014) was performed for the comparison of yieldswith national statistics from the FAO. The AgGRID dataset provides a long-term mean20
N fertiliser input for each grid cell representing present day (approximately the year2000). In these simulations the input from (Zaehle et al., 2010a) was used until 1990,subsequently switching over to AgGRID data.
Land cover information was adopted from (Hurtt et al., 2011), with the forested,rangeland and urban classes treated as natural land cover. During spin-up, cropland25
fraction was linearly increased from an assumed baseline of zero at 1750 to the firsthistoric value (1901 for CRU and 1850 for CMIP5). The number of years for this tran-sition (150 years for the CRU-based and 100 years for the CMIP5 simulations) waschosen to ensure that the soil C and N pools of the natural vegetation fraction of each
1059

ESDD6, 1047–1100, 2015
Soil C management,large-scale Earthsystem modelling
S. Olin et al.
Title Page
Abstract Introduction
Conclusions References
Tables Figures
J I
J I
Back Close
Full Screen / Esc
Printer-friendly Version
Interactive Discussion
Discussion
Paper
|D
iscussionP
aper|
Discussion
Paper
|D
iscussionP
aper|
grid cell reached steady-state by the end of the spin-up. While this procedure will likelyresult in higher SOM pools in areas such as central Europe, India and the Middle Eastwhere agriculture has been present for many centuries, it will be most realistic for re-gions where most agricultural expansion has taken place over the last 100–200 years.Grid cell fractions of crop coverage for those grid cells where data on crop species exist5
were taken from MIRCA (Portmann et al., 2010), and aggregated to the three CFTs asdescribed in Sect. 2.1. The relative CFT cover fractions were conserved over time, andinformation from the neighbouring cells was used using a distance weighted mean forgrid cells that lack information in the MIRCA data set.
As soil input, fractions of clay, silt and sand from the WISE 3.0 dataset (Batjes, 2005)10
were used. Hydrological properties of the soil were calculated following Eqs. (19)–(20)from Olin et al. (2015).
2.2.1 Soil carbon and management response
Soil columns from croplands in the WISE 3.0 data set (Batjes, 2005) were used toevaluate the ability of LPJ-GUESS to model cropland soil C. Soil carbon from the top15
1.5 m was averaged for each 0.5◦ grid cell (≈ 1000). As no detailed information wasavailable on the management or land-use history for the different soil column sites theCFT fractions from (Portmann et al., 2010) were used together with N-fertiliser input asdescribed above.
In (Stockmann et al., 2013), data on long term soil carbon response to the man-20
agement options (cover-crops, no-tillage and manure application) were divided be-tween four climatic regions: humid temperate, dry temperate, humid tropical and drytropical. In order to compare our simulated carbon sequestration with the findings of(Stockmann et al., 2013), each simulated grid cell with soil data was classified to beeither tropical (24◦ S> latitude<24◦N) or temperate (24◦ S< latitude>24◦N and lati-25
tude <60◦N), as depicted in Fig. B2. These categories were further subdivided intodry if the water balance coefficient (WBC=precipitation – potential evapotranspiration)was negative, and humid if positive. Each of the resulting four classes covered approxi-
1060

ESDD6, 1047–1100, 2015
Soil C management,large-scale Earthsystem modelling
S. Olin et al.
Title Page
Abstract Introduction
Conclusions References
Tables Figures
J I
J I
Back Close
Full Screen / Esc
Printer-friendly Version
Interactive Discussion
Discussion
Paper
|D
iscussionP
aper|
Discussion
Paper
|D
iscussionP
aper|
mately 200 grid cells, evenly spread over the continents (Fig. B2). Some 200 of the gridcells were either in the boreal zone or not included in the climate dataset. Managementpractices were enabled from year 1990 and throughout the remaining simulation pe-riod. For the simulations using CRU climate input, the last 30 years of climate and [CO2](381 ppm), N deposition and fertiliser from the last year, were repeated until 2100, the5
end of the CMIP5 climate data set, in order to allow soil carbon and nitrogen pools toreach a new equilibrium after the management shift.
2.2.2 Management, global soil C and N leaching
The effect of the different management strategies considered (no-tillage, manure ap-plication, cover-crops and leaving residues) on simulated global crop yields, soil C10
pool size, and N leaching were tested in a factorial experiment where managementswas turned on at the beginning of the simulation. The simulated yields, soil C and N-leaching were then compared with a baseline simulation (Fstd, Table 2.1.1) with settingsas in (Lindeskog et al., 2013; Smith et al., 2014; Olin et al., 2015).
To be able to compare our results with previous estimates of global soil C and N15
pools and N leaching from LPJ-GUESS (Smith et al., 2014), a simulation with potentialnatural vegetation (PNV) was also conducted. In addition, an optimised simulation set-up was created (Fopt), where the management from Table 1 that yielded the largestincrease in soil carbon per grid cell was selected, for the CRU and CMIP5 simulations.
3 Results20
3.1 Yield comparison
LPJ-GUESS wheat (C3) and maize (C4) yields were simulated using the gridded N-fertiliser dataset (Elliott et al., 2014) and compared to reported yields from FAO1 for
1FAOSTAT, http://faostat3.fao.org/home/E
1061
ESDD6, 1047–1100, 2015
Soil C management,large-scale Earthsystem modelling
S. Olin et al.
Title Page
Abstract Introduction
Conclusions References
Tables Figures
J I
J I
Back Close
Full Screen / Esc
Printer-friendly Version
Interactive Discussion
Discussion
Paper
|D
iscussionP
aper|
Discussion
Paper
|D
iscussionP
aper|
the years 1996–2005 (Fig. 1). The overall model agreement with reported wheat yieldsper country was good across all wheat producing countries, with a correlation coeffi-cient of 0.73. Maize yields had a lower agreement (correlation coefficient 0.46), withsimulated yields overestimating the observations for most countries that have a lowmaize production, (e.g., Mexico, China and many African countries; Fig. 1). However,5
with exception of China and Mexico, yields in high producing countries were capturedwell, including the largest producer, the USA.
The total simulated production (wet weight) of all agricultural crops (including cereals,tubers and pulses) of 2.7 Gt, was within 30 % of what is reported to the FAO, 3.5 Gt forthe period 1996–2005 (cereals, 2.12; coarse grain, 0.93; roots & tubers, 0.282; pulses,10
0.06; oil crops, 0.11).
3.2 Simulated soil C and its response to management
Simulated soil C pools (0–1.5 m) for the selected grid cells (Sect. 2.2.1) were comparedagainst data from soil cores from agricultural fields for the four climatic regions (Batjes,2005). This comparison did not aim to reproduce observed C values at the individual15
field scale, as this would require to capture individual site meteorology as well as detailson land-use history. Consequently, per-site comparison of simulated vs. observed soilC resulted in low correlations of 0.05–0.14, but the mean and spread over the climaticzones were captured by the model (Table 2).
In Fig. 2, the simulated mean soil C sequestration response to the three manage-20
ments (no-till, manure and cover-crops) is compared to estimates of potential soil C se-questration from Stockmann et al. (2013) for the simulated climatic regions over the his-toric period (1990–2006). Besides the model’s average regional response to the threemanagement options, Fig. 2 illustrates how the soil C sequestration in response to theonset of management (here: in the year 1990, see Sect. 2.2.1) evolves over time. The25
simulated long term (100 years) mean soil C sequestration by using manure on tropical
2Corrected for moisture content, value from FAOSTAT, 0.68 Gt.
1062
ESDD6, 1047–1100, 2015
Soil C management,large-scale Earthsystem modelling
S. Olin et al.
Title Page
Abstract Introduction
Conclusions References
Tables Figures
J I
J I
Back Close
Full Screen / Esc
Printer-friendly Version
Interactive Discussion
Discussion
Paper
|D
iscussionP
aper|
Discussion
Paper
|D
iscussionP
aper|
soils was ca. 0.001 kgCm−2 yr−1, declining to negligible levels by the end of the simu-lated period. For no-till, the long term mean C sequestration was 0.003 kgCm−2 yr−1 orhigher for all treatments, and levelled off to ca. 0.002 kgCm−2 yr−1 by simulation year2100. The highest mean C sequestration rates were found for manure in the humid tem-perate climatic regions (0.006 kgCm−2 yr−1) and for cover-crops in the tropical humid5
regions (0.008 kgCm−2 yr−1), in both cases levelling off to below 0.001 kgCm−2 yr−1 bythe end of the simulation period.
3.3 Global responses to management
The simulated management options resulted in an increase in cropland soil C, for allclimatic regions (Fig. 3), with the largest global increase, as expected, for the option10
in which the management that yielded the largest carbon sequestration in a given gridcell was chosen (Fopt). With the exception of no residue removal, the simulated man-agement treatments reduced N leaching (expressed here as negative anomalies), withcover-crop resulting in the largest decline. Cover crops and no-residue removal hadopposite effects on both yields and N leaching. The reduction in N leaching from cover15
crops (∼ 15 %) was accompanied by a decline in simulated global yields of 5 %. Thelarge negative effect of cover crops on simulated yields in the temperate humid climaticregion is due to the implicit competition over the available N between the cover cropand the main crop, the low temperature makes the decomposition of the SOM slow andin turn the release of N more evenly spread throughout the year. The N retained in the20
system is locked in SOM, and not easily available for plant uptake, the opposite hap-pens in the tropical regions and especially so for the humid tropics, where turnover ofthe SOM is relatively fast due to the prevailing warm and moist conditions. Leaving allthe residues on the fields (no residue removal) was the only treatment that increasedthe modelled yields both globally and for all climatic regions, but with the environmen-25
tal “cost” of an increase in N-leaching. The increase in both modelled yields and Nleaching is obtained because N becomes available for plant uptake and transport over
1063

ESDD6, 1047–1100, 2015
Soil C management,large-scale Earthsystem modelling
S. Olin et al.
Title Page
Abstract Introduction
Conclusions References
Tables Figures
J I
J I
Back Close
Full Screen / Esc
Printer-friendly Version
Interactive Discussion
Discussion
Paper
|D
iscussionP
aper|
Discussion
Paper
|D
iscussionP
aper|
a longer period, and between the growing periods there is nothing growing that cantake up the available nitrogen. In all treatments, the soil N pools were higher than forthe standard simulation (Table 3), which is caused by the reduction in leaching and theincorporation of nitrogen in SOM.
In general, the soil C pools simulated with the managed land version of LPJ-GUESS5
were slightly larger than simulated with PNV (Table 3), which is due to higher C storagein pastures compared to the natural vegetation they have replaced (e.g. Central Asiaand parts of the Great Plains of North America) and also in high-productivity croplandsthat receive high inputs of N fertilisers (e.g. Egypt and western China; results not shownhere).10
From the simulations of different cropland management options, the managementcombination that yielded the largest SOC stocks 1996–2005 was chosen for each gridcell (Fopt); the spatial patterns are shown in Fig. 4, FCC and FNT being the most dominantand with distinct differences with FCC mostly in humid tropical areas and FNT in sub-tropical and temperate regions.15
Figure 5 depicts the evolution over time of the effects of implementing the differentsoil carbon sequestration managements for two future climate change, CO2 and land-use change scenarios. The spread that can be seen around the simulations with CRUforcing in Fig. 5 originates from the GCM climate variability, which can be seen alsoduring the historic period (Fig. B1b). In the scenarios of land-use change (Hurtt et al.,20
2011), there is a steady increase of cropland area globally, which is most extreme forRCP 2.6 (Fig. B1a). Differences between the RCP 2.6 and 8.5 cases regarding theeffects of management are consistently seen only for cropland soil C storage, withvalues being higher for RCP8.5 compared to RCP 2.6. Manure and no-tillage did notaffect calculated N leaching or yields under future conditions any more than for present-25
day forcing. The effect of cover crops and best carbon management for RCP 8.5 wasan enhanced reduction of yields and enhanced N leaching compared to the standardmodel set-up.
1064

ESDD6, 1047–1100, 2015
Soil C management,large-scale Earthsystem modelling
S. Olin et al.
Title Page
Abstract Introduction
Conclusions References
Tables Figures
J I
J I
Back Close
Full Screen / Esc
Printer-friendly Version
Interactive Discussion
Discussion
Paper
|D
iscussionP
aper|
Discussion
Paper
|D
iscussionP
aper|
For the future simulations, there were changes in the optimal C sequestration man-agement (Table 4), most of these “transitions” (∼ 7 % for RCP 2.6 and ∼ 9 % for 8.5)being from no-till to the other managements options (Fig. 6).
4 Discussion
Olin et al. (2015) addressed the effect of N-fertiliser applications on crop yields in Eu-5
rope. In the present study we extended this analysis to the global scale and addressthe effect of additional land-management practices, other than fertiliser applications,on crop yields and carbon retention in cropland ecosystems and soils. The manage-ment practices explored are widely-used approaches that have been recommendedas suitable for climate change mitigation and claimed to have benefits for a range of10
ecosystem services.
4.1 Soil carbon and nitrogen
Large-scale models like LPJ-GUESS are not designed for making assessments of localmanagement decisions, but are optimised to address consequences of managementdecisions across regions and on the global scale (Rounsevell et al., 2014). The ac-15
curate modelling of soil carbon pool sizes and changes is of great importance whenassessing impacts of global environmental change, since soils are the main long-termterrestrial sink of carbon (Smith, 2004a). This has proven to be a difficult task to masterfor DVMs (McGuire et al., 2001; Sitch et al., 2008) and earth system models (Todd-Brown et al., 2013). One cause for such inaccuracy may be the limited availability of20
observational soil carbon data. Global estimates of soil carbon and nitrogen pools arederived by extrapolation of highly-variable point observations from soil inventories orfrom data-based modelling. For instance, global C and N densities reported by Batjes(2014) (see Table 3) were derived by extrapolating measurements taken in 4353 soilcores across all biomes, using maps of soil types and land cover. LPJ-GUESS projec-25
1065
ESDD6, 1047–1100, 2015
Soil C management,large-scale Earthsystem modelling
S. Olin et al.
Title Page
Abstract Introduction
Conclusions References
Tables Figures
J I
J I
Back Close
Full Screen / Esc
Printer-friendly Version
Interactive Discussion
Discussion
Paper
|D
iscussionP
aper|
Discussion
Paper
|D
iscussionP
aper|
tions of soil N pools agree well with other estimates, the soil C pools are at the lowend of generally reported global estimates (Ciais et al., 2013; Stockmann et al., 2013),which can partially be attributed to absence of wetland and permafrost processes inthe current model setup (Miller and Smith, 2012; Tarnocai et al., 2009; Wania et al.,2009).5
When making projections on global C pools, the information on land-use history isvital (Pongratz et al., 2014). In our simulations, the assumption that the main – naturalto cropland – conversions started at 1750, could have resulted in overestimations ofC stored in agricultural soils. When focusing on site data collected for croplands andgrouped by four climate regions (Table 2), simulated average C pools in LPJ-GUESS10
were higher than observations, especially for temperate soils. It is to be expected thatmany of these sites, especially in temperate environments, would have been underland use for very long periods, which could well lead to lower C pools compared toour modelling assumptions. Moreover, we do not have comprehensive information onpresent management practices, or how these would have changed over time. Still, the15
among-grid-cell variations in C pools were similarly large in observed and simulateddata (Table 2), suggesting that the model response is sound overall.
4.1.1 Carbon sequestration potential through cropland management
Global-scale modelling of the impacts of specific land-management options is in itsinfancy, but since a number of future climate and socioeconomic scenarios highlight20
the importance of land-based mitigation, and because of the multiple trade-offs thatexist with other ecosystem services, they are of importance for future research andpractical applications. Published estimates of the global carbon sequestration potentialon existing cropland due to different types of cropland management range between0.34–0.57 PgCyr−1 for present-day environmental conditions (Lal, 2004a). Our model25
estimate when implementing the best practice (from the perspective of maximisingC storage) globally is roughly 20 % of that value. Figure 3 shows a global increaseof ca. 5 % in soil C for the Fopt case (ranging from 4 to 9 % between large regions),
1066
ESDD6, 1047–1100, 2015
Soil C management,large-scale Earthsystem modelling
S. Olin et al.
Title Page
Abstract Introduction
Conclusions References
Tables Figures
J I
J I
Back Close
Full Screen / Esc
Printer-friendly Version
Interactive Discussion
Discussion
Paper
|D
iscussionP
aper|
Discussion
Paper
|D
iscussionP
aper|
which equates to an annual uptake of 0.08 PgCyr−1 globally compared to the standardmodel version. The exact reasons for these low simulated uptake rates are difficult toassess, but representing land-use history and land-management practices at a largeregional to global scale is a recognised challenge. In the CLM model (Levis et al.,2014), a country-specific tillage management has been implemented, which is not con-5
stant over the year, but carried out in connection with harvest. The authors found thatestimations of the land-use emissions with CLM without tillage practices underesti-mates the emissions caused by agricultural practices. For a global scale simulation,this underestimation was 0.4 PgCyr−1. When comparing the results from Levis et al.(2014) to the simulation in our study corresponding to that (FNT − Fstd), our estimate is10
that the error from not including tillage in the simulations is some 0.02 PgCyr−1. Wehave chosen to implement uniform management for tillage in this study, reasoning thatthe additional assumptions one would need to make to resolve spatially-varying tillagewould increase the uncertainty in our model predictions, in particular because of theabsence of available information on future tillage practices.15
Another important aspect is productivity during growing season and the possibilityfor multi-cropping. In many tropical areas the growing season is not limited to a shortperiod of the year, especially in the humid tropics where two or more crops may begrown in sequence (Francis, 1989). Currently LPJ-GUESS is restricted to one grow-ing period per year for the primary crop. Multiple cropping has been implemented in20
other modelling frameworks, such as LPJmL (Waha et al., 2013). Multiple croppingdoes not always increase the yields of the economic crops, but results in a more re-silient cropping system with more than one harvest per year and thus reduces the riskof complete crop failures, while promoting high net productivity (Francis, 1989), and isthus also relevant to consider from a carbon cycle perspective. Thus, the simplifica-25
tions we necessarily have to include in a global model regarding some managementapplications might lead to overall lower C sequestration compared to other publishedestimates (Lal, 2004a; Smith, 2004b). However, it also needs to be noted that theseprevious estimates are based on empirical modelling, not accounting for process-level
1067

ESDD6, 1047–1100, 2015
Soil C management,large-scale Earthsystem modelling
S. Olin et al.
Title Page
Abstract Introduction
Conclusions References
Tables Figures
J I
J I
Back Close
Full Screen / Esc
Printer-friendly Version
Interactive Discussion
Discussion
Paper
|D
iscussionP
aper|
Discussion
Paper
|D
iscussionP
aper|
interactions between vegetation, soils and the abiotic environment. In a review of thepotential for countries to fulfil emissions reduction obligations under the Kyoto protocolIPCC (1996); Schlesinger (2000) found only a small or even no potential for C se-questration in cropland soils, while (Powlson et al., 2014) argued that no-tillage overtillage enhances some important soil properties but has a small overall effect of total5
agricultural soil C.
4.2 Yields
Compared to other measures of global C flows, statistics on crop production and yieldsare relatively accessible, and encompass relatively long time-series, albeit with dif-fering quality between individual countries. While yield is not a direct measure of the10
net primary productivity (NPP), it is a good proxy for trends and variability of carbonflows on croplands (Haberl et al., 2007) and thus relevant for the estimation of fluxesand pools on agricultural fields. From a food production perspective, Olin et al. (2015)showed that including C–N dynamics and fertiliser input significantly increased modelperformance compared to the C-only version of LPJ-GUESS (e.g. Rosenzweig et al.,15
2014) for yield modelling and responses of yields to environmental changes. This wasexpected, since the C-only version intentionally represents a situation not limited by nu-trients. The data sets used in this study were either designed for crop modelling in theAgMIP project (Elliott et al., 2014), or for studying global flows of carbon and nitrogen(rather than yields) (Stocker et al., 2013; Zaehle et al., 2011). When using the former20
(Elliott et al., 2014), the model performance was significantly improved (an increase inmodel agreement with observed yields from (R2) 0.25 to 0.53 for WW and from 0.1 to0.25 for MA). However, since the AgMIP dataset lacks information on temporal varia-tions and trends, it could not be applied to transient historical or future simulations ofglobal yields, C and N flows. Previous studies with global models have simulated yields25
(e.g. PEGASUS Deryng et al., 2011, R2 for WW=0.22, MA=0.39, and DayCent Ste-hfest et al., 2007 R2 for WW=0.66, MA=0.67). Our results compare favourably withthese studies for WW, but less so for MA. The C-N version of our model has not yet
1068
ESDD6, 1047–1100, 2015
Soil C management,large-scale Earthsystem modelling
S. Olin et al.
Title Page
Abstract Introduction
Conclusions References
Tables Figures
J I
J I
Back Close
Full Screen / Esc
Printer-friendly Version
Interactive Discussion
Discussion
Paper
|D
iscussionP
aper|
Discussion
Paper
|D
iscussionP
aper|
been evaluated and parameterised against observations of maize yields, and the lowerdegree of agreement with data was expected.
4.3 N leaching
Global estimates of N leaching from terrestrial ecosystems are uncertain (Gruber andGalloway, 2008), and the estimates with LPJ-GUESS fall well within the broad range5
of published annual global totals (Table 3). Only a few other global studies with DVMs(e.g. Smith et al., 2014; Stocker et al., 2013; Yang et al., 2009; Zaehle et al., 2010b)have reported N leached from terrestrial ecosystems. For models that included N-fertiliser applications, we estimated a range from 63 TgNyr−1 (Yang et al., 2009)3 to133 TgNyr−1 (Stocker et al., 2013)4. None of these simulation studies accounted for10
croplands explicitly, non-harvested grasslands in Zaehle et al. (2010b) and harvestedgrasslands in Stocker et al. (2013) were used as proxies for croplands. Zaehle et al.(2010b), estimated the total N leached to aquatic ecosystems from terrestrial sourcesto be 86 TgNyr−1, out of which 57 TgNyr−1 was attributed to agricultural ecosystems.These estimates for the entire land surface are considerably larger than the estimates15
provided here (24–66 TgNyr−1 for the simulations including croplands, Table 3). Amongthe simulations performed here, the simulation without residue removal (FNR) was theonly one in which N leached from croplands was of comparable magnitude to the find-ings of Zaehle et al. (2010b). In our study fertilisers are applied at specific crop devel-opmental stages with amounts that match the CFT specific demand (see Table A2),20
whereas in Zaehle et al. (2010b) three applications with equal amounts were spreadusing climate indicators defining the peak in the growing season. This could lead tohigher leaching when fertiliser application is not timed to coincide with the peak of the
3Derived by scaling their average 0.47 g N m−2 yr−1 by the ice-free land area of 1.33×10¹⁴ m2, consistent with the estimates done elsewhere in this study.
4derived from the N2O emissions of 0.8 TgNyr−1 stemming from N-leaching and the con-stant fraction of leached N that is emitted as N2O, 0.6 % that is assumed in the study.
1069
ESDD6, 1047–1100, 2015
Soil C management,large-scale Earthsystem modelling
S. Olin et al.
Title Page
Abstract Introduction
Conclusions References
Tables Figures
J I
J I
Back Close
Full Screen / Esc
Printer-friendly Version
Interactive Discussion
Discussion
Paper
|D
iscussionP
aper|
Discussion
Paper
|D
iscussionP
aper|
growing season when crop N uptake is highest. Despite its importance for the overallamount of leached N (Cameron et al., 2013), timing of fertiliser applications alone can-not explain the difference between this study and Zaehle et al. (2010b). By contrast tothe three other DVM studies mentioned above, LPJ-GUESS treats all inorganic N asone pool, as opposed to modelling nitrate and ammonium separately. A fraction of this5
pool is leached without any distinction of the nitrogen species, while in reality, most ofthe nitrogen leached is in the form of nitrate (Smil, 1999), and only a small amount isin the form of organic N or ammonium, the latter mainly in association with extremeevents like floods. During the growing season when crops (and plants in general) areactive, leaching may thus be expected to be overestimated by our model as nitrates are10
the primary nitrogen source for plants (Penning de Vries et al., 1989), while during thefallow periods with no or only very little vegetation cover – and consequently relativelyhigher abundance of nitrates as compared to ammonium – the nitrogen exported inconjunction with run-off and drainage will tend to be underestimated.
4.4 Trade-offs and win-win management options15
Due to the rising human population, changing lifestyles, as well as a number of – some-times conflicting – policies related to e.g., climate change mitigation, agriculture, con-servation or water regulation, the demand for resources from land ecosystems is in-creasing, and also constantly changing. In order to achieve, ultimately, a sustainableuse of natural resources there is a need to identify strategies that minimise degrada-20
tion and wastage of resources while still addressing society’s growing needs for land-based ecosystem services including agricultural production. To this end, informationon the trade-offs implicit in different management strategies but also possible win-winsituations is of high value. In our analysis we attempted to compare three importantparameters related to ecosystem functioning (yield, C uptake and N leaching) in terms25
of how different forms of crop management may be expected to influence their relativepatterns of change. From our results (Fig. 3), two general findings emerge. Firstly, noneof the management options explored lead to a win-win situation in the sense of an in-
1070

ESDD6, 1047–1100, 2015
Soil C management,large-scale Earthsystem modelling
S. Olin et al.
Title Page
Abstract Introduction
Conclusions References
Tables Figures
J I
J I
Back Close
Full Screen / Esc
Printer-friendly Version
Interactive Discussion
Discussion
Paper
|D
iscussionP
aper|
Discussion
Paper
|D
iscussionP
aper|
crease in all three of the examined variables. Secondly, general patterns of change onthe global scale were – with some variability – also seen at the regional scale: we did(for present day conditions) not find a situation where a win-win at global scale wascontingent upon trade-offs at large regional scale.
All the implemented management options targeting carbon benefits resulted in a net5
increase in simulated soil carbon (Fig. 3). Most of these also showed the added benefitof reduced leaching of N – albeit at the cost of reduced yields. Avoided residue re-moval stands out from this general pattern, resulting in increased soil C and increasedyields, but at the same time enhanced N leaching. The largest effects, at least whentaking the regional spread into consideration, were found when including cover crops10
as a management option. The relatively large reduction in yield found in the FCC sim-ulations resulted from indirect competition over water and nitrogen, which were notavailable for the new crops planted following the cover-crop period. Interestingly, eventhough the yields were substantially lower in FCC, the total vegetation productivity washigher due to the extended growing period (not shown; global annual total NPP were15
+0.25 PgCyr−1 compared with Fstd). This higher NPP was also reflected in the en-hanced soil C content. In reality, cover crops are an often applied management tech-nique to sequester or retain nutrients and carbon in the field, which is why legumes area preferred choice. While LPJ-GUESS correctly simulates enhanced C sequestrationwith cover crops, symbiotic N-fixation is not yet implemented in the current crop version20
of the model. Hence, the indirect competition for N between cover crop and main cropdiscussed above may be overestimated in the model. Vegetation carbon and nitrogenturnover in the grass PFT used here for FCC obviously is too slow to make nitrogenavailable for the following crops, in particular in the temperate regions, which couldalso underlie the strong simulated reduction in leaching.25
Absence of residue removal was positive for soil carbon, as well as for yields, result-ing from the higher litter input. Similar responses of enhanced C storage (up to 30 %)and increased yields (10–30 %) in response to residue management have also been
1071

ESDD6, 1047–1100, 2015
Soil C management,large-scale Earthsystem modelling
S. Olin et al.
Title Page
Abstract Introduction
Conclusions References
Tables Figures
J I
J I
Back Close
Full Screen / Esc
Printer-friendly Version
Interactive Discussion
Discussion
Paper
|D
iscussionP
aper|
Discussion
Paper
|D
iscussionP
aper|
found for e.g. maize and soybean in the US (Wilhelm et al., 2004) and millet in Niger(Bationo et al., 1993).
Manure (FMN) application had minor effects on any of the investigated processes,both globally and in any particular climatic region (Fig. 3). The relatively low effect onsoil C might be caused by the relatively small fraction of the total N applied at sowing5
(which is the time when manure was also applied), 8 % for WW and 11 % for SW andMA. In terms of yield, the relatively high C : N (30), might have reduced crop productivityslightly, since the manure-N will not be available for plant uptake at sowing, but will bereleased from the SOM during the growing season. Still, in some of the high producingregions (e.g. north-western Europe and parts of China), manure application was the10
most effective management for carbon sequestration (Fig. 4); these are all areas wherethe N application rates in the data set used here are high (Zaehle et al., 2011), and thusthe amount of carbon added to the soil is relatively large.
By contrast with moderate tillage, complete absence of tillage resulted in enhancedsoil C, with only small to moderate yield reduction, and a small reduction of N loss15
through leaching. Depending on the regional climate and N-fertiliser applications, re-ductions in crop productivity by up to 0.5 t ha−1 were also reported for maize and winterwheat grown in the USA in a recent meta-analysis, comparing tillage to no-tillage (Ogleet al., 2012). A larger effect on C sequestration (at similarly small to moderate effectson yields) was only found when optimising for carbon sequestration also resulted in20
a moderate reduction in yields while achieving a reduction in the modelled N-leachingby ca. 30 % (Fig. 3). Considering the high global demand for food today and in the fu-ture, a 5 % yield reduction may be difficult to motivate in exchange for a 5 % increase insoil C and reduced leaching. Avoiding the loss of food production would require eitherfurther intensification (likely resulting in enhanced N losses through leaching) or expan-25
sion of crop and pasture areas (potentially interfering with other ecosystem services).In this regard, regional differences are crucial to consider. Large vegetation carbonstocks in tropical forest ecosystems motivate the protection of these systems, limitingthe further expansion of managed land in these ecosystems. Given that tropical areas
1072
ESDD6, 1047–1100, 2015
Soil C management,large-scale Earthsystem modelling
S. Olin et al.
Title Page
Abstract Introduction
Conclusions References
Tables Figures
J I
J I
Back Close
Full Screen / Esc
Printer-friendly Version
Interactive Discussion
Discussion
Paper
|D
iscussionP
aper|
Discussion
Paper
|D
iscussionP
aper|
tend also to have the largest yield gaps (Licker et al., 2010), a much better strategy inthese regions is to invest in sustainable intensification of existing managed land.
The initial difference between Fopt and FCC in Fig. 3, where FCC had a positive effecton yields until mid 1960s, is due to the fact that in the model, the cover-crops arebeing sown with a finite initial carbon and nitrogen mass. This results in more available5
nitrogen in the fields with this management (basically a fertilisation via the seeds),despite the indirect competition for nitrogen between the cover-crop and the main cropwhich subsequently also results in a relatively larger nitrogen export through leaching.Cover-crops have been used to re-vitalise croplands, the results shown here impliesthat the model partly captures this, but the simulated indirect competition is too strong10
and further studies and model developments are needed to better represent cover-crop management. Also, as the cover-crop implementation does not include symbioticN-fixation, the simulated reduction in yields with that management could very well haveresulted in the opposite effect, but as was seen for N-leaching prior to 1960 and alsofor the no-residue removal, maybe also an increase in the relative N-leakage.15
5 Conclusions
We have presented a global model analysis highlighting effects of alternative crop man-agement strategies for a range of core ecosystem processes and the services derivedfrom them, related to interactions of climate change and land use change.
Our large-scale approach based on the simplifying assumption of uniform manage-20
ment across regions does not faithfully represent actual conditions, but instead allowsthe influence of different management actions to be evaluated, and geographical differ-ence to be highlighted.
Results demonstrate that effects of management on cropland can be beneficial forcarbon and nutrient retention without risking (large) yield losses. Nevertheless, ef-25
fects on soil carbon are small compared with extant stocks in natural and semi-naturalecosystem types and managed forests. While agricultural management can be tar-
1073
ESDD6, 1047–1100, 2015
Soil C management,large-scale Earthsystem modelling
S. Olin et al.
Title Page
Abstract Introduction
Conclusions References
Tables Figures
J I
J I
Back Close
Full Screen / Esc
Printer-friendly Version
Interactive Discussion
Discussion
Paper
|D
iscussionP
aper|
Discussion
Paper
|D
iscussionP
aper|
geted towards sustainable goals, from a climate change or carbon sink perspectiveavoided deforestation or reforestation constitutes a far more effective overall strategyfor maintaining and enhancing global carbon sinks. However, enhanced carbon storagein agricultural soils could also be seen as a surrogate for enhanced soil structure andreduced erosion having additional (non-climate) environmental benefits.5
Appendix: Allocation
In Olin et al. (2015) relationships between allocation to leaves (gL), stem (gSt), root(gR) and grains (gY) based on the allocation model of Penning de Vries et al. (1989)were established using a logistic growth function, a Richards curve (Richards, 1959),(Eq. A1):10
fi = a+b−a
1+e−c(DS−d )(A1)
where fi is the daily allocation of assimilates to a plant organ relative to e.g. the shoot, ais the asymptote when DS→ 0, b is the upper asymptote when DS→∞, c the growthrate, and d is the DS of maximum growth.
The relative relationships of daily assimilate allocation to the organs described with15
Eq. (A1):
f1 =gR
gR +gL +gSt, f2 =
gL
gL +gSt, f3 =
gY
gR +gL +gSt +gY(A2)
And combining the equations in Eq. (A2) yields:
gR = f1(1− f3)
gL = f2(1− f1)(1− f3)
gSt = (1− f2)(1− f1)(1− f3)
gY = f3
(A3)
1074

ESDD6, 1047–1100, 2015
Soil C management,large-scale Earthsystem modelling
S. Olin et al.
Title Page
Abstract Introduction
Conclusions References
Tables Figures
J I
J I
Back Close
Full Screen / Esc
Printer-friendly Version
Interactive Discussion
Discussion
Paper
|D
iscussionP
aper|
Discussion
Paper
|D
iscussionP
aper|
See Olin et al. (2015) for more details on how these relationships were derived.
Acknowledgements. This study is a contribution to the Strong Research Environment Land-Use Today and Tomorrow funded by the Swedish Research Council FORMAS (Contract No.211–2009-1682). A. Arneth and T. A. M. Pugh acknowledge support from the European Com-mission in the FP 7 projects OPERAS (grant no. 308393) and LUC4C (grant no. 603542).5
M. Lindeskog was funded by the Mistra Swedish Research Programme for Climate, Impactsand Adaptation. This study is a contribution to the Strategic Research Areas BECC andMERGE and to the Lund University Centre for Studies of Carbon Cycle and Climate Inter-actions (LUCCI).
References10
Ahlström, A., Schurgers, G., Arneth, A., and Smith, B.: Robustness and uncertainty in terrestrialecosystem carbon response to CMIP5 climate change projections, Environ. Res. Lett., 7,044008, doi:10.1088/1748-9326/7/4/044008, 2012. 1056
Ahlström, A., Smith, B., Lindström, J., Rummukainen, M., and Uvo, C. B.: GCM characteristicsexplain the majority of uncertainty in projected 21st century terrestrial ecosystem carbon15
balance, Biogeosciences, 10, 1517–1528, doi:10.5194/bg-10-1517-2013, 2013. 1058Arora, V. K.: Simulating energy and carbon fluxes over winter wheat using coupled land surface
and terrestrial ecosystem models, Agr. Forest Meteorol., 118, 21–47, doi:10.1016/S0168-1923(03)00073-X, 2003. 1051
Baker, J. M., Ochsner, T. E., Venterea, R. T., and Griffis, T. J.: Tillage and soil car-20
bon sequestration – what do we really know?, Agr. Ecosyst. Environ., 118, 1–5,doi:10.1016/j.agee.2006.05.014, 2007. 1053
Bationo, A., Christianson, C., and Klaij, M.: The effect of crop residue and fertilizer use on pearlmillet yields in Niger, Fert. Res., 34, 251–258, doi:10.1007/BF00750571, 1993. 1072
Batjes, N. H. .: ISRICE-WISE global data ser of derived soil properties on a 0.5 by 0.5 degree25
grid (version 3.0), Report 08, ISRIC – World Soil Information, Wageningen, 2005. 1060,1062, 1100
Batjes, N. H.: Total carbon and nitrogen in the soils of the world, Eur. J. Soil Sci., 65, 10–21,doi:10.1111/ejss.12114_2, 2014. 1065, 1088, 1089
1075

ESDD6, 1047–1100, 2015
Soil C management,large-scale Earthsystem modelling
S. Olin et al.
Title Page
Abstract Introduction
Conclusions References
Tables Figures
J I
J I
Back Close
Full Screen / Esc
Printer-friendly Version
Interactive Discussion
Discussion
Paper
|D
iscussionP
aper|
Discussion
Paper
|D
iscussionP
aper|
Bondeau, A., Smith, P. C., Zaehle, S., Schaphoff, S., Lucht, W., Cramer, W., and Gerten, D.:Modelling the role of agriculture for the 20th century global terrestrial carbon balance, Glob.Change Biol., 13, 679–706, doi:10.1111/j.1365-2486.2006.01305.x, 2007. 1051
Bouwman, L., Goldewijk, K. K., Van Der Hoek, K. W., Beusen, A. H. W., Van Vuuren, D. P.,Willems, J., Rufino, M. C., and Stehfest, E.: Exploring global changes in nitrogen and phos-5
phorus cycles in agriculture induced by livestock production over the 1900–2050 period, P.Natl. Acad. Sci. USA, 110, 20882–20887, doi:10.1073/pnas.1012878108, 2013. 1059
Boyer, E. W., Howarth, R. W., Galloway, J. N., Dentener, F. J., Green, P. A., and Vörös-marty, C. J.: Riverine nitrogen export from the continents to the coasts, Global Biogeochem.Cy., 20, GB1S91, doi:10.1029/2005GB002537, 2006. 108910
Cameron, K., Di, H., and Moir, J.: Nitrogen losses from the soil/plant system: a review, Ann.Appl. Biol., 162, 145–173, doi:10.1111/aab.12014, 2013. 1050, 1070
Chatskikh, D., Hansen, S., Olesen, J. E., and Petersen, B. M.: A simplified modelling ap-proach for quantifying tillage effects on soil carbon stocks, Eur. J. Soil Sci., 60, 924–934,doi:10.1111/J.1365-2389.2009.01185.x, 2009. 1052, 105615
Ciais, P., Sabine, C., Bala, G., Bopp, L., Brovkin, V., Canadell, J., Chhabra, A., DeFries, R., Gal-loway, J., Heimann, M., et al.: Carbon and other biogeochemical cycles, in: Climate Change2013: The Physical Science Basis. Contribution of Working Group I to the Fifth AssessmentReport of the Intergovernmental Panel on Climate Change, edited by: Stocker, T. F., Qin, D.,Plattner, G.-K., Tignor, M., Allen, S. K., Boschung, J., Nauels, A., Xia, Y., Bex, V., and Midg-20
ley, P. M., Cambridge University Press, Cambridge, UK and New York, NY, USA, 465–570,2013. 1050, 1051, 1066, 1089
Collatz, G., Ball, J., Grivet, C., and Berry, J. A.: Physiological and environmental regulationof stomatal conductance, photosynthesis and transpiration: a model that includes a lami-nar boundary layer, Agr. Forest Meteorol., 54, 107–136, doi:10.1016/0168-1923(91)90002-8,25
1991. 1054Collatz, G., Ribas-Carbo, M., and Berry, J.: Coupled photosynthesis-stomatal conductance
model for leaves of C4 plants, Functional Plant Biol., 19, 519–538, available at: http://www.publish.csiro.au/paper/PP9920519, 1992. 1054
Collins, W. J., Bellouin, N., Doutriaux-Boucher, M., Gedney, N., Halloran, P., Hinton, T.,30
Hughes, J., Jones, C. D., Joshi, M., Liddicoat, S., Martin, G., O’Connor, F., Rae, J., Senior, C.,Sitch, S., Totterdell, I., Wiltshire, A., and Woodward, S.: Development and evaluation of an
1076
ESDD6, 1047–1100, 2015
Soil C management,large-scale Earthsystem modelling
S. Olin et al.
Title Page
Abstract Introduction
Conclusions References
Tables Figures
J I
J I
Back Close
Full Screen / Esc
Printer-friendly Version
Interactive Discussion
Discussion
Paper
|D
iscussionP
aper|
Discussion
Paper
|D
iscussionP
aper|
Earth-System model – HadGEM2, Geosci. Model Dev., 4, 1051–1075, doi:10.5194/gmd-4-1051-2011, 2011. 1058
Deryng, D., Sacks, W. J., Barford, C. C., and Ramankutty, N.: Simulating the effects of climateand agricultural management practices on global crop yield, Global Biogeochem. Cy., 25, 2,doi:10.1029/2009GB003765, 2011. 10685
Drewniak, B., Song, J., Prell, J., Kotamarthi, V. R., and Jacob, R.: Modeling agriculture in theCommunity Land Model, Geosci. Model Dev., 6, 495–515, doi:10.5194/gmd-6-495-2013,2013. 1051
Dufresne, J.-L., Foujols, M.-A., Denvil, S., Caubel, A., Marti, O., Aumont, O., Balkanski, Y.,Bekki, S., Bellenger, H., Benshila, R., Bony, S., Bopp, L., Braconnot, P., Brockmann, P., Cad-10
ule, P., Cheruy, F., Codron, F., Cozic, A., Cugnet, D., de Noblet, N., Duvel, J.-P., Ethé, C., Fair-head, L., Fichefet, T., Flavoni, S., Friedlingstein, P., Grandpeix, J.-Y., Guez, L., Guilyardi, E.,Hauglustaine, D., Hourdin, F., Idelkadi, A., Ghattas, J., Joussaume, S., Kageyama, M., Krin-ner, G., Labetoulle, S., Lahellec, A., Lefebvre, M.-P., Lefevre, F., Levy, C., Li, Z., Lloyd, J.,Lott, F., Madec, G., Mancip, M., Marchand, M., Masson, S., Meurdesoif, Y., Mignot, J.,15
Musat, I., Parouty, S., Polcher, J., Rio, C., Schulz, M., Swingedouw, D., Szopa, S., Ta-landier, C., Terray, P., Viovy, N., and Vuichard, N.: Climate change projections using theIPSL-CM5 Earth System Model: from CMIP3 to CMIP5, Clim. Dynam., 40, 2123–2165,doi:10.1007/s00382-012-1636-1, 2013. 1058
Eitelberg, D. A., van Vliet, J., and Verburg, P. H.: A review of global potentially available cropland20
estimates and their consequences for model-based assessments, Glob. Change Biol., 21,1236–1248, doi:10.1111/gcb.12733, 2015. 1050
Elliott, J., Müller, C., Deryng, D., Chryssanthacopoulos, J., Boote, K. J., Büchner, M., Foster, I.,Glotter, M., Heinke, J., Iizumi, T., Izaurralde, R. C., Mueller, N. D., Ray, D. K., Rosenzweig, C.,Ruane, A. C., and Sheffield, J.: The Global Gridded Crop Model Intercomparison: data and25
modeling protocols for Phase 1 (v1.0), Geosci. Model Dev., 8, 261–277, doi:10.5194/gmd-8-261-2015, 2015. 1059, 1061, 1068
Evans, L.: Steps towards feeding the ten billion: a crop physiologists view, Plant Prod. Sci., 2,3–9, 1999. 1050
FAO: The state of food and agriculture, available at: http://www.fao.org/docrep/011/i0100e/30
i0100e00.htm (last access: 9 June 2015), 2008. 1049Follett, R.: Soil management concepts and carbon sequestration in cropland soils, Soil Till.
Res., 61, 77–92, doi:10.1016/S0167-1987(01)00180-5, 2001. 1057
1077
ESDD6, 1047–1100, 2015
Soil C management,large-scale Earthsystem modelling
S. Olin et al.
Title Page
Abstract Introduction
Conclusions References
Tables Figures
J I
J I
Back Close
Full Screen / Esc
Printer-friendly Version
Interactive Discussion
Discussion
Paper
|D
iscussionP
aper|
Discussion
Paper
|D
iscussionP
aper|
Francis, C. A.: Biological efficiencies in multiple-cropping systems, in: Advances in Agronomy,vol. 42, Adv Agron, doi:10.1016/S0065-2113(08)60522-2, 1–42, 1989. 1067
Galloway, J. N., Dentener, F. J., Capone, D. G., Boyer, E. W., Howarth, R. W., Seitzinger, S. P.,Asner, G. P., Cleveland, C. C., Green, P. A., Holland, E. A., Karl, D. M., Michaels, A. F.,Porter, J. H., Townsend, A. R., and Vörösmarty, C. J.: Nitrogen cycles: past, present, and5
future, Biogeochemistry, 70, 153–226, doi:10.1007/s10533-004-0370-0, 2004. 1050Gent, P. R., Danabasoglu, G., Donner, L. J., Holland, M. M., Hunke, E. C., Jayne, S. R.,
Lawrence, D. M., Neale, R. B., Rasch, P. J., Vertenstein, M., Worley, P. H., Yang, Z.-L., andZhang, M.: The Community Climate System Model Version 4, J. Climate, 24, 4973–4991,doi:10.1175/2011JCLI4083.1, 2011. 105810
Gerland, P., Raftery, A. E., Ševčíková, H., Li, N., Gu, D., Spoorenberg, T., Alkema, L.,Fosdick, B. K., Chunn, J., Lalic, N., Bay, G., Buettner, T., Heilig, G. K., andWilmoth, J.: World population stabilization unlikely this century, Science, 346, 234–237,doi:10.1126/science.1257469, 2014. 1049
Grizetti, B.: Nitrogen as a Threat to European Water Quality, Cambridge University Press, Cam-15
bridge, UK and New York, NY, USA, doi:10.1017/CBO9780511976988.020, 2011. 1050Gruber, N. and Galloway, J. N.: An Earth-system perspective of the global nitrogen cycle, Na-
ture, 451, 293–296, doi:10.1038/nature06592, 2008. 1069, 1089Haberl, H., Erb, K. H., Krausmann, F., Gaube, V., Bondeau, A., Plutzar, C., Gingrich, S.,
Lucht, W., and Fischer-Kowalski, M.: Quantifying and mapping the human appropriation of20
net primary production in earth’s terrestrial ecosystems, P. Natl. Acad. Sci. USA, 104, 12942–12947, doi:10.1073/pnas.0704243104, 2007. 1068
Haxeltine, A. and Prentice, I. C.: A general model for the light-use efficiency of primary produc-tion, Funct. Ecol., 10, 551–561, doi:10.2307/2390165, 1996. 1054
Hertel, T.: The challenges of sustainably feeding a growing planet, Food Security, 1–14,25
doi:10.1007/s12571-015-0440-2, 2015. 1049Hickler, T., Smith, B., Sykes, M. T., Davis, M. B., Sugita, S., and Walker, K.: Using a generalized
vegetation model to simulate vegetation dynamics in northeastern USA, Ecology, 85, 519–530, doi:10.1890/02-0344, 2004. 1054
Houghton, R. A., House, J. I., Pongratz, J., van der Werf, G. R., DeFries, R. S., Hansen, M. C.,30
Le Quéré, C., and Ramankutty, N.: Carbon emissions from land use and land-cover change,Biogeosciences, 9, 5125–5142, doi:10.5194/bg-9-5125-2012, 2012. 1051
1078
ESDD6, 1047–1100, 2015
Soil C management,large-scale Earthsystem modelling
S. Olin et al.
Title Page
Abstract Introduction
Conclusions References
Tables Figures
J I
J I
Back Close
Full Screen / Esc
Printer-friendly Version
Interactive Discussion
Discussion
Paper
|D
iscussionP
aper|
Discussion
Paper
|D
iscussionP
aper|
Hurtt, G., Chini, L., Frolking, S., Betts, R., Feddema, J., Fischer, G., Fisk, J., Hibbard, K.,Houghton, R., Janetos, A., Jones, C., Kindermann, G., Kinoshita, T., Klein Goldewijk, K.,Riahi, K., Shevliakova, E., Smith, S., Stehfest, E., Thomson, A., Thornton, P., van Vuuren, D.,and Wang, Y.: Harmonization of land-use scenarios for the period 1500–2100: 600 yearsof global gridded annual land-use transitions, wood harvest, and resulting secondary lands,5
Climatic Change, 109, 117–161, doi:10.1007/s10584-011-0153-2, 2011. 1059, 1064, 1090,1099
IPCC: Revised 1996 IPCC Guidelines for National Greenhouse Gas Inventories, Organizationfor Economic Cooperation and Development (OECD), Washington, DC, 1996. 1068
Lal, R.: Soil carbon sequestration to mitigate climate change, Geoderma, 123, 1–22,10
doi:10.1016/j.geoderma.2004.01.032, 2004a. 1052, 1053, 1058, 1066, 1067Lal, R.: Carbon emission from farm operations, Environ. Int., 30, 981–990,
doi:10.1016/j.envint.2004.03.005, 2004b. 1052Lal, R.: Carbon sequestration, Philos. T. R. Soc. Lon. B, 363, 815–830,
doi:10.1098/rstb.2007.2185, 2008. 105215
Lal, R. and Bruce, J.: The potential of world cropland soils to sequester C and mitigate thegreenhouse effect, Environ. Sci. Policy, 2, 177–185, doi:10.1016/S1462-9011(99)00012-X,1999. 1052
Lamarque, J.-F., Bond, T. C., Eyring, V., Granier, C., Heil, A., Klimont, Z., Lee, D., Liousse, C.,Mieville, A., Owen, B., Schultz, M. G., Shindell, D., Smith, S. J., Stehfest, E., Van Aar-20
denne, J., Cooper, O. R., Kainuma, M., Mahowald, N., McConnell, J. R., Naik, V., Riahi, K.,and van Vuuren, D. P.: Historical (1850–2000) gridded anthropogenic and biomass burn-ing emissions of reactive gases and aerosols: methodology and application, Atmos. Chem.Phys., 10, 7017–7039, doi:10.5194/acp-10-7017-2010, 2010. 1059
Le Quéré, C., Peters, G. P., Andres, R. J., Andrew, R. M., Boden, T. A., Ciais, P., Friedling-25
stein, P., Houghton, R. A., Marland, G., Moriarty, R., Sitch, S., Tans, P., Arneth, A., Arvani-tis, A., Bakker, D. C. E., Bopp, L., Canadell, J. G., Chini, L. P., Doney, S. C., Harper, A.,Harris, I., House, J. I., Jain, A. K., Jones, S. D., Kato, E., Keeling, R. F., Klein Goldewijk, K.,Körtzinger, A., Koven, C., Lefèvre, N., Maignan, F., Omar, A., Ono, T., Park, G.-H., Pfeil, B.,Poulter, B., Raupach, M. R., Regnier, P., Rödenbeck, C., Saito, S., Schwinger, J., Segschnei-30
der, J., Stocker, B. D., Takahashi, T., Tilbrook, B., van Heuven, S., Viovy, N., Wanninkhof, R.,Wiltshire, A., and Zaehle, S.: Global carbon budget 2013, Earth Syst. Sci. Data, 6, 235–263,doi:10.5194/essd-6-235-2014, 2014. 1051
1079

ESDD6, 1047–1100, 2015
Soil C management,large-scale Earthsystem modelling
S. Olin et al.
Title Page
Abstract Introduction
Conclusions References
Tables Figures
J I
J I
Back Close
Full Screen / Esc
Printer-friendly Version
Interactive Discussion
Discussion
Paper
|D
iscussionP
aper|
Discussion
Paper
|D
iscussionP
aper|
Le Quéré, C., Moriarty, R., Andrew, R. M., Peters, G. P., Ciais, P., Friedlingstein, P., Jones, S. D.,Sitch, S., Tans, P., Arneth, A., Boden, T. A., Bopp, L., Bozec, Y., Canadell, J. G., Chini, L. P.,Chevallier, F., Cosca, C. E., Harris, I., Hoppema, M., Houghton, R. A., House, J. I.,Jain, A. K., Johannessen, T., Kato, E., Keeling, R. F., Kitidis, V., Klein Goldewijk, K., Koven, C.,Landa, C. S., Landschützer, P., Lenton, A., Lima, I. D., Marland, G., Mathis, J. T., Metzl, N.,5
Nojiri, Y., Olsen, A., Ono, T., Peng, S., Peters, W., Pfeil, B., Poulter, B., Raupach, M. R., Reg-nier, P., Rödenbeck, C., Saito, S., Salisbury, J. E., Schuster, U., Schwinger, J., Séférian, R.,Segschneider, J., Steinhoff, T., Stocker, B. D., Sutton, A. J., Takahashi, T., Tilbrook, B.,van der Werf, G. R., Viovy, N., Wang, Y.-P., Wanninkhof, R., Wiltshire, A., and Zeng, N.:Global carbon budget 2014, Earth Syst. Sci. Data, 7, 47–85, doi:10.5194/essd-7-47-2015,10
2015. 1051Levis, S., Hartman, M. D., and Bonan, G. B.: The Community Land Model underestimates land-
use CO2 emissions by neglecting soil disturbance from cultivation, Geosci. Model Dev., 7,613–620, doi:10.5194/gmd-7-613-2014, 2014. 1051, 1067
Licker, R., Johnston, M., Foley, J. A., Barford, C., Kucharik, C. J., Monfreda, C., and15
Ramankutty, N.: Mind the gap: how do climate and agricultural management explainthe “yield gap” of croplands around the world?, Global Ecol. Biogeogr., 19, 769–782,doi:10.1111/j.1466-8238.2010.00563.x, 2010. 1050, 1073
Lindeskog, M., Arneth, A., Bondeau, A., Waha, K., Seaquist, J., Olin, S., and Smith, B.: Impli-cations of accounting for land use in simulations of ecosystem carbon cycling in Africa, Earth20
Syst. Dynam., 4, 385–407, doi:10.5194/esd-4-385-2013, 2013. 1051, 1053, 1055, 1056,1061
Liu, J., You, L., Amini, M., Obersteiner, M., Herrero, M., Zehnder, A. J. B., and Yang, H.: A high-resolution assessment on global nitrogen flows in cropland, P. Natl. Acad. Sci. USA, 107,8035–8040, doi:10.1073/pnas.0913658107, 2010. 108925
McGuire, A. D., Sitch, S., Clein, J. S., Dargaville, R., Esser, G., Foley, J., Heimann, M., Joos, F.,Kaplan, J., Kicklighter, D. W., Meier, R. A., Melillo, J. M., Moore, B., Prentice, I. C., Ra-mankutty, N., Reichenau, T., Schloss, A., Tian, H., Williams, L. J., and Wittenberg, U.: Car-bon balance of the terrestrial biosphere in the Twentieth Century: Analyses of CO2, climateand land use effects with four process-based ecosystem models, Global Biogeochem. Cy.,30
15, 183–206, doi:10.1029/2000GB001298, 2001. 1065Miller, P. A. and Smith, B.: Modelling tundra vegetation response to recent arctic warming,
Ambio, 41, 281–291, doi:10.1007/s13280-012-0306-1, 2012. 1066
1080
ESDD6, 1047–1100, 2015
Soil C management,large-scale Earthsystem modelling
S. Olin et al.
Title Page
Abstract Introduction
Conclusions References
Tables Figures
J I
J I
Back Close
Full Screen / Esc
Printer-friendly Version
Interactive Discussion
Discussion
Paper
|D
iscussionP
aper|
Discussion
Paper
|D
iscussionP
aper|
Mitchell, T. D. and Jones, P. D.: An improved method of constructing a database of monthlyclimate observations and associated high-resolution grids, Int. J. Climatol., 25, 693–712,doi:10.1002/joc.1181, 2005. 1058
Moss, R. H., Edmonds, J. A., Hibbard, K. A., Manning, M. R., Rose, S. K., van Vuuren, D. P.,Carter, T. R., Emori, S., Kainuma, M., Kram, T., Meehl, G. A., Mitchell, J. F. B., Naki-5
cenovic, N., Riahi, K., Smith, S. J., Stouffer, R. J., Thomson, A. M., Weyant, J. P., andWilbanks, T. J.: The next generation of scenarios for climate change research and assess-ment, Nature, 463, 747–756, doi:10.1038/nature08823, 2010. 1059
Mueller, N. D., West, P. C., Gerber, J. S., MacDonald, G. K., Polasky, S., and Foley, J. A.: Atradeoff frontier for global nitrogen use and cereal production, Environ. Res. Lett., 9, 054002,10
doi:10.1088/1748-9326/9/5/054002, 2014. 1050Nieder, R. and Benbi, D. K.: Carbon and Nitrogen in the Terrestrial Environment, Springer
Science and Business Media, the Netherlands, 2008. 1057Ogle, S. M., Swan, A., and Paustian, K.: No-till management impacts on crop produc-
tivity, carbon input and soil carbon sequestration, Agr. Ecosyst. Environ., 149, 37–49,15
doi:10.1016/j.agee.2011.12.010, 2012. 1072Olin, S., Schurgers, G., Lindeskog, M., Wårlind, D., Smith, B., Bodin, P., Holmér, J., and Ar-
neth, A.: Modelling the response of yields and tissue C : N to changes in atmosphericCO2 and N management in the main wheat regions of western Europe, Biogeosciences,12, 2489–2515, doi:10.5194/bg-12-2489-2015, 2015. 1053, 1054, 1055, 1056, 1060, 1061,20
1065, 1068, 1074, 1075, 1092Park, S., Croteau, P., Boering, K. A., Etheridge, D. M., Ferretti, D., Fraser, P. J., Kim, K.-R.,
Krummel, P. B., Langenfelds, R. L., van Ommen, T. D., Steele, L. P., and Trudinger, C. M.:Trends and seasonal cycles in the isotopic composition of nitrous oxide since 1940, Nat.Geosci., 5, 261–265, doi:10.1038/ngeo1421, 2012. 105025
Parton, W. J., Scurlock, J. M. O., Ojima, D. S., Gilmanov, T. G., Scholes, R. J., Schimel, D. S.,Kirchner, T., Menaut, J.-C., Seastedt, T., Garcia Moya, E., Kamnalrut, A., and Kinya-mario, J. I.: Observations and modeling of biomass and soil organic matter dynamics for thegrassland biome worldwide, Global Biogeochem. Cy., 7, 785–809, doi:10.1029/93GB02042,1993. 105430
Penning de Vries, F. W. T., Jansen, D. M., Berge, H. F. M., and Bakema, A.: Simulation ofEcophysiological Processes of Growth in Several Annual Crops, Centre for Agricultural Pub-lishing and Documentation, Wageningen, the Netherlands, 1989. 1055, 1070, 1074
1081

ESDD6, 1047–1100, 2015
Soil C management,large-scale Earthsystem modelling
S. Olin et al.
Title Page
Abstract Introduction
Conclusions References
Tables Figures
J I
J I
Back Close
Full Screen / Esc
Printer-friendly Version
Interactive Discussion
Discussion
Paper
|D
iscussionP
aper|
Discussion
Paper
|D
iscussionP
aper|
Phalan, B., Onial, M., Balmford, A., and Green, R. E.: Reconciling food production and biodi-versity conservation: land sharing and land sparing compared, Science, 333, 1289–1291,doi:10.1126/science.1208742, 2011. 1052
Piao, S., Sitch, S., Ciais, P., Friedlingstein, P., Peylin, P., Wang, X., Ahlström, A., Anav, A.,Canadell, J. G., Cong, N., Huntingford, C., Jung, M., Levis, S., Levy, P. E., Li, J., Lin, X.,5
Lomas, M. R., Lu, M., Luo, Y., Ma, Y., Myneni, R. B., Poulter, B., Sun, Z., Wang, T.,Viovy, N., Zaehle, S., and Zeng, N.: Evaluation of terrestrial carbon cycle models for theirresponse to climate variability and to CO2 trends, Glob. Change Biol., 19, 2117–2132,doi:10.1111/gcb.12187, 2013. 1056
Pongratz, J., Reick, C. H., Houghton, R. A., and House, J. I.: Terminology as a key uncertainty in10
net land use and land cover change carbon flux estimates, Earth Syst. Dynam., 5, 177–195,doi:10.5194/esd-5-177-2014, 2014. 1066
Portmann, F. T., Siebert, S., and Döll, P.: MIRCA2000–Global monthly irrigated and rainfed cropareas around the year 2000: a new high-resolution data set for agricultural and hydrologicalmodeling, Global Biogeochem. Cy., 24, GB1011, doi:10.1029/2008GB003435, 2010. 106015
Powlson, D. S., Stirling, C. M., Jat, M. L., Gerard, B. G., Palm, C. A., Sanchez, P. A., andCassman, K. G.: Limited potential of no-till agriculture for climate change mitigation, NatureClimate Change, 4, 678–683, doi:10.1038/nclimate2292, 2014. 1068
Pugh, T. A. M., Olin, S., G., S., Lindeskog, M., and Arneth, A.: Carbon emissions from land-use change is substantially enhanced by agricultural management, Nature Climate Change,20
submitted, 2015. 1051, 1052, 1053Ramankutty, N., Evan, A. T., Monfreda, C., and Foley, J. A.: Farming the planet: 1. Geo-
graphic distribution of global agricultural lands in the year 2000, Global Biogeochem. Cy.,22, GB1003, doi:10.1029/2007GB002952, 2008. 1050
Riahi, K., Rao, S., Krey, V., Cho, C., Chirkov, V., Fischer, G., Kindermann, G., Nakicenovic, N.,25
and Rafaj, P.: RCP 8.5 – a scenario of comparatively high greenhouse gas emissions, Cli-matic Change, 109, 33–57, doi:10.1007/s10584-011-0149-y, 2011. 1059
Richards, F. J.: A flexible growth function for empirical use, J. Exp. Bot., 10, 290–301,doi:10.1093/jxb/10.2.290, 1959. 1074
Rockstrom, J., Steffen, W., Noone, K., Persson, A., Chapin, F. S., Lambin, E. F., Lenton, T. M.,30
Scheffer, M., Folke, C., Schellnhuber, H. J., Nykvist, B., de Wit, C. A., Hughes, T., van derLeeuw, S., Rodhe, H., Sorlin, S., Snyder, P. K., Costanza, R., Svedin, U., Falkenmark, M.,Karlberg, L., Corell, R. W., Fabry, V. J., Hansen, J., Walker, B., Liverman, D., Richardson, K.,
1082
ESDD6, 1047–1100, 2015
Soil C management,large-scale Earthsystem modelling
S. Olin et al.
Title Page
Abstract Introduction
Conclusions References
Tables Figures
J I
J I
Back Close
Full Screen / Esc
Printer-friendly Version
Interactive Discussion
Discussion
Paper
|D
iscussionP
aper|
Discussion
Paper
|D
iscussionP
aper|
Crutzen, P., and Foley, J. A.: A safe operating space for humanity, Nature, 461, 472–475,doi:10.1038/461472a, 2009. 1050
Rosenzweig, C., Elliott, J., Deryng, D., Ruane, A. C., Müller, C., Arneth, A., Boote, K. J., Fol-berth, C., Glotter, M., Khabarov, N., Neumann, K., Piontek, F., Pugh, T. A. M., Schmid, E.,Stehfest, E., Yang, H., and Jones, J. W.: Assessing agricultural risks of climate change in the5
21st century in a global gridded crop model intercomparison, P. Natl. Acad. Sci. USA, 111,3268–3273, doi:10.1073/pnas.1222463110, 2014. 1068
Rounsevell, M. D. A., Arneth, A., Alexander, P., Brown, D. G., de Noblet-Ducoudré, N., El-lis, E., Finnigan, J., Galvin, K., Grigg, N., Harman, I., Lennox, J., Magliocca, N., Parker, D.,O’Neill, B. C., Verburg, P. H., and Young, O.: Towards decision-based global land use mod-10
els for improved understanding of the Earth system, Earth Syst. Dynam., 5, 117–137,doi:10.5194/esd-5-117-2014, 2014. 1065
Schlesinger, W. H.: Carbon sequestration in soils: some cautions amidst optimism, Agr.Ecosyst. Environ., 82, 121–127, doi:10.1016/S0167-8809(00)00221-8, 2000. 1053, 1068
Sitch, S., Smith, B., Prentice, I. C., Arneth, A., Bondeau, A., Cramer, W., Kaplan, J. O., Levis, S.,15
Lucht, W., Sykes, M. T., Thonicke, K., and Venevsky, S.: Evaluation of ecosystem dynamics,plant geography and terrestrial carbon cycling in the LPJ dynamic global vegetation model,Glob. Change Biol., 9, 161–185, doi:10.1046/j.1365-2486.2003.00569.x, 2003. 1054
Sitch, S., Huntingford, C., Gedney, N., Levy, P., Lomas, M., Piao, S., Betts, R., Ciais, P., Cox, P.,Friedlingstein, P., Jones, C., Prentice, I., and Woodward, F.: Evaluation of the terrestrial car-20
bon cycle, future plant geography and climate-carbon cycle feedbacks using five DynamicGlobal Vegetation Models (DGVMs), Glob. Change Biol., 14, 2015–2039, 2008. 1065
Smil, V.: Nitrogen in crop production: an account of global flows, Global Biogeochem. Cy., 13,647–662, doi:10.1029/1999GB900015, 1999. 1070, 1089
Smith, B., Prentice, I. C., and Sykes, M. T.: Representation of vegetation dynamics in the mod-25
elling of terrestrial ecosystems: comparing two contrasting approaches within European cli-mate space, Global Ecol. Biogeogr., 10, 621–637, 2001. 1054
Smith, B., Wårlind, D., Arneth, A., Hickler, T., Leadley, P., Siltberg, J., and Zaehle, S.: Implica-tions of incorporating N cycling and N limitations on primary production in an individual-baseddynamic vegetation model, Biogeosciences, 11, 2027–2054, doi:10.5194/bg-11-2027-2014,30
2014. 1051, 1054, 1056, 1059, 1061, 1069Smith, P.: Soils as carbon sinks: the global context, Soil Use Manage., 20, 212–218,
doi:10.1111/j.1475-2743.2004.tb00361.x, 2004a. 1065
1083
ESDD6, 1047–1100, 2015
Soil C management,large-scale Earthsystem modelling
S. Olin et al.
Title Page
Abstract Introduction
Conclusions References
Tables Figures
J I
J I
Back Close
Full Screen / Esc
Printer-friendly Version
Interactive Discussion
Discussion
Paper
|D
iscussionP
aper|
Discussion
Paper
|D
iscussionP
aper|
Smith, P.: Carbon sequestration in croplands: the potential in Europe and the global context,Eur. J. Agron., 20, 229–236, doi:10.1016/j.eja.2003.08.002, 2004b. 1067
Smith, W., Grant, B., Campbell, C., McConkey, B., Desjardins, R., Kröbel, R., and Malhi, S.:Crop residue removal effects on soil carbon: measured and inter-model comparisons, Agr.Ecosyst. Environ., 161, 27–38, doi:10.1016/j.agee.2012.07.024, 2012. 1052, 10585
Spano, G., Di Fonzo, N., Perrotta, C., Platani, C., Ronga, G., Lawlor, D. W., Napier, J. A., andShewry, P. R.: Physiological characterization of “stay green” mutants in durum wheat, J. Exp.Bot., 54, 1415–1420, doi:10.1093/jxb/erg150, 2003. 1050
Steffen, W., Broadgate, W., Deutsch, L., Gaffney, O., and Ludwig, C.: The tra-jectory of the anthropocene: the great acceleration, Anthrop. Rev., 2, 81–98,10
doi:10.1177/2053019614564785, 2015. 1049Stehfest, E., Heistermann, M., Priess, J. A., Ojima, D. S., and Alcamo, J.: Simulation of
global crop production with the ecosystem model DayCent, Ecol. Model., 209, 203–219,doi:10.1016/j.ecolmodel.2007.06.028, 2007. 1068
Stevens, B., Giorgetta, M., Esch, M., Mauritsen, T., Crueger, T., Rast, S., Salzmann, M.,15
Schmidt, H., Bader, J., Block, K., Brokopf, R., Fast, I., Kinne, S., Kornblueh, L., Lohmann, U.,Pincus, R., Reichler, T., and Roeckner, E.: Atmospheric component of the MPI-M Earth Sys-tem Model: ECHAM6, J. Adv. Modeling Earth Syst., 5, 146–172, doi:10.1002/jame.20015,2013. 1058
Stocker, B. D., Roth, R., Joos, F., Spahni, R., Steinacher, M., Zaehle, S., Bouwman, L., Xu-Ri,20
and Prentice, I. C.: Multiple greenhouse-gas feedbacks from the land biosphere under fu-ture climate change scenarios, Nature Clim. Change, 3, 666–672, doi:10.1038/nclimate1864,2013. 1059, 1068, 1069, 1099
Stockmann, U., Adams, M., Crawford, J., Field, D., Henakaarchchi, N., Jenkins, M., Mi-nasny, B., McBratney, A., Courcelles, V., Singh, K., Wheeler, I., Abbott, L., Angers, D., Bal-25
dock, J., Bird, M., Brookes, P., Chenu, C., Jastrow, J., Lal, R., Lehmann, J., O’Donnell, A.,Parton, W., Whitehead, D., and Zimmermann, M.: The knowns, known unknowns andunknowns of sequestration of soil organic carbon, Agr. Ecosyst. Environ., 164, 80–99,doi:10.1016/j.agee.2012.10.001, 2013. 1060, 1062, 1066, 1089, 1094
Tarnocai, C., Canadell, J. G., Schuur, E. A. G., Kuhry, P., Mazhitova, G., and Zimov, S.: Soil30
organic carbon pools in the northern circumpolar permafrost region, Global Biogeochem.Cy., 23, GB2023, doi:10.1029/2008GB003327, 2009. 1066
1084

ESDD6, 1047–1100, 2015
Soil C management,large-scale Earthsystem modelling
S. Olin et al.
Title Page
Abstract Introduction
Conclusions References
Tables Figures
J I
J I
Back Close
Full Screen / Esc
Printer-friendly Version
Interactive Discussion
Discussion
Paper
|D
iscussionP
aper|
Discussion
Paper
|D
iscussionP
aper|
Taylor, K. E., Stouffer, R. J., and Meehl, G. A.: An overview of CMIP5 and the experimentdesign, B. Am. Meteorol. Soc., 93, 485–498, doi:10.1175/BAMS-D-11-00094.1, 2011. 1058
Thornton, P. E., Doney, S. C., Lindsay, K., Moore, J. K., Mahowald, N., Randerson, J. T.,Fung, I., Lamarque, J.-F., Feddema, J. J., and Lee, Y.-H.: Carbon-nitrogen interactions reg-ulate climate-carbon cycle feedbacks: results from an atmosphere-ocean general circulation5
model, Biogeosciences, 6, 2099–2120, doi:10.5194/bg-6-2099-2009, 2009. 1051Tilman, D., Cassman, K. G., Matson, P. A., Naylor, R., and Polasky, S.: Agricultural sustainability
and intensive production practices, Nature, 418, 671–677, doi:10.1038/nature01014, 2002.1050, 1052
Todd-Brown, K. E. O., Randerson, J. T., Post, W. M., Hoffman, F. M., Tarnocai, C.,10
Schuur, E. A. G., and Allison, S. D.: Causes of variation in soil carbon simulations fromCMIP5 Earth system models and comparison with observations, Biogeosciences, 10, 1717–1736, doi:10.5194/bg-10-1717-2013, 2013. 1065
Vitousek, P. M., Mooney, H. A., Lubchenco, J., and Melillo, J. M.: Human domination of earth’secosystems, Science, 277, 494–499, doi:10.1126/science.277.5325.494, 1997. 105015
Waha, K., van Bussel, L. G. J., Muller, C., and Bondeau, A.: Climate-driven simulationof global crop sowing dates, Global Ecol. Biogeogr., 21, 247–259, doi:10.1111/j.1466-8238.2011.00678.x, 2011. 1055
Waha, K., Müller, C., Bondeau, A., Dietrich, J., Kurukulasuriya, P., Heinke, J., andLotze-Campen, H.: Adaptation to climate change through the choice of cropping sys-20
tem and sowing date in sub-Saharan Africa, Global Environ. Chang., 23, 130–143,doi:10.1016/j.gloenvcha.2012.11.001, 2013. 1067
Wania, R., Ross, I., and Prentice, I. C.: Integrating peatlands and permafrost into a dynamicglobal vegetation model: 1. Evaluation and sensitivity of physical land surface processes,Global Biogeochem. Cy., 23, GB3014, doi:10.1029/2008GB003412, 2009. 106625
Wårlind, D., Smith, B., Hickler, T., and Arneth, A.: Nitrogen feedbacks increase future terrestrialecosystem carbon uptake in an individual-based dynamic vegetation model, Biogeosciences,11, 6131–6146, doi:10.5194/bg-11-6131-2014, 2014. 1051, 1059
Wilhelm, W. W., Johnson, J. M. F., Hatfield, J. L., Voorhees, W. B., and Linden, D. R.: Crop andsoil productivity response to corn residue removal, this paper is a joint contribution of the30
USDA-ARS and the Agricultural Research Division of the University of Nebraska, publishedas Journal Ser. no. 13949., Agron. J., 96, 1–17, 2004. 1072
1085

ESDD6, 1047–1100, 2015
Soil C management,large-scale Earthsystem modelling
S. Olin et al.
Title Page
Abstract Introduction
Conclusions References
Tables Figures
J I
J I
Back Close
Full Screen / Esc
Printer-friendly Version
Interactive Discussion
Discussion
Paper
|D
iscussionP
aper|
Discussion
Paper
|D
iscussionP
aper|
Wramneby, A., Smith, B., Zaehle, S., and Sykes, M. T.: Parameter uncertainties in the modellingof vegetation dynamics – effects on tree community structure and ecosystem functioning inEuropean forest biomes, Ecol. Model., 216, 277–290, doi:10.1016/j.ecolmodel.2008.04.013,2008. 1056
Yang, X., Wittig, V., Jain, A. K., and Post, W.: Integration of nitrogen cycle dynamics into the5
Integrated Science Assessment Model for the study of terrestrial ecosystem responses toglobal change, Global Biogeochem. Cy., 23, GB3474, doi:10.1029/2009GB003474, 2009.1069
Zaehle, S. and Dalmonech, D.: Carbon–nitrogen interactions on land at global scales: currentunderstanding in modelling climate biosphere feedbacks, Current Op. Environ. Sustain., 3,10
311–320, doi:10.1016/j.cosust.2011.08.008, carbon and nitrogen cycles, 2011. 1051Zaehle, S., Friedlingstein, P., and Friend, A. D.: Terrestrial nitrogen feedbacks may accelerate
future climate change, Geophys. Res. Lett., 37, L01401, doi:10.1029/2009GL041345, 2010a.1059, 1099
Zaehle, S., Friend, A. D., Friedlingstein, P., Dentener, F., Peylin, P., and Schulz, M.: Car-15
bon and nitrogen cycle dynamics in the O-CN land surface model: 2. Role of the nitro-gen cycle in the historical terrestrial carbon balance, Global Biogeochem. Cy., 24, GB3522,doi:10.1029/2009GB003522, 2010b. 1069, 1070
Zaehle, S., Ciais, P., Friend, A. D., and Prieur, V.: Carbon benefits of anthropogenic reactivenitrogen offset by nitrous oxide emissions, Nat. Geosci., 4, 601–605, doi:10.1038/ngeo1207,20
2011. 1050, 1051, 1068, 1072
1086
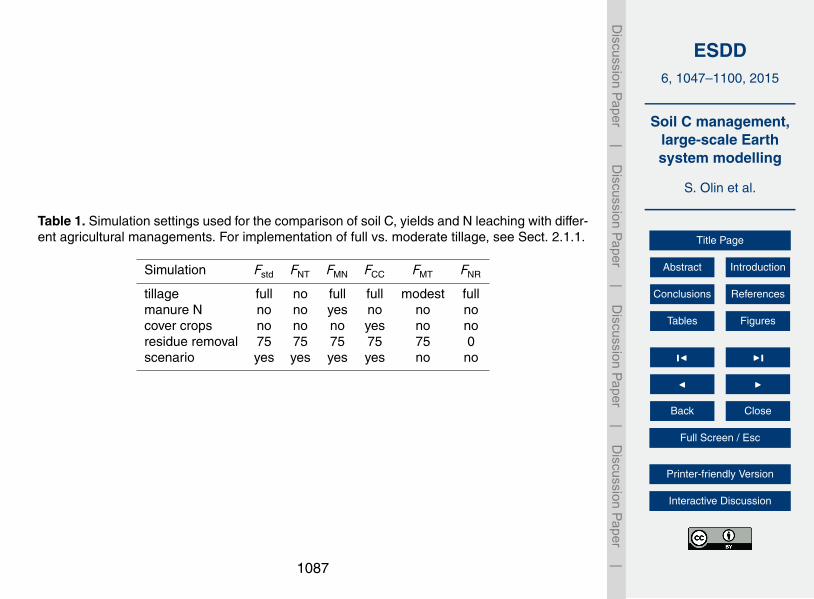
ESDD6, 1047–1100, 2015
Soil C management,large-scale Earthsystem modelling
S. Olin et al.
Title Page
Abstract Introduction
Conclusions References
Tables Figures
J I
J I
Back Close
Full Screen / Esc
Printer-friendly Version
Interactive Discussion
Discussion
Paper
|D
iscussionP
aper|
Discussion
Paper
|D
iscussionP
aper|
Table 1. Simulation settings used for the comparison of soil C, yields and N leaching with differ-ent agricultural managements. For implementation of full vs. moderate tillage, see Sect. 2.1.1.
Simulation Fstd FNT FMN FCC FMT FNR
tillage full no full full modest fullmanure N no no yes no no nocover crops no no no yes no noresidue removal 75 75 75 75 75 0scenario yes yes yes yes no no
1087
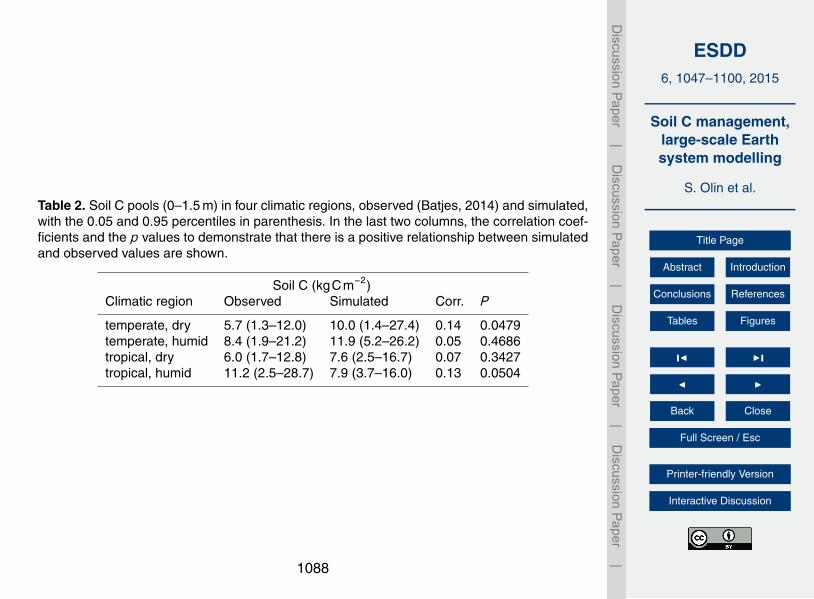
ESDD6, 1047–1100, 2015
Soil C management,large-scale Earthsystem modelling
S. Olin et al.
Title Page
Abstract Introduction
Conclusions References
Tables Figures
J I
J I
Back Close
Full Screen / Esc
Printer-friendly Version
Interactive Discussion
Discussion
Paper
|D
iscussionP
aper|
Discussion
Paper
|D
iscussionP
aper|
Table 2. Soil C pools (0–1.5 m) in four climatic regions, observed (Batjes, 2014) and simulated,with the 0.05 and 0.95 percentiles in parenthesis. In the last two columns, the correlation coef-ficients and the p values to demonstrate that there is a positive relationship between simulatedand observed values are shown.
Soil C (kgCm−2)Climatic region Observed Simulated Corr. P
temperate, dry 5.7 (1.3–12.0) 10.0 (1.4–27.4) 0.14 0.0479temperate, humid 8.4 (1.9–21.2) 11.9 (5.2–26.2) 0.05 0.4686tropical, dry 6.0 (1.7–12.8) 7.6 (2.5–16.7) 0.07 0.3427tropical, humid 11.2 (2.5–28.7) 7.9 (3.7–16.0) 0.13 0.0504
1088
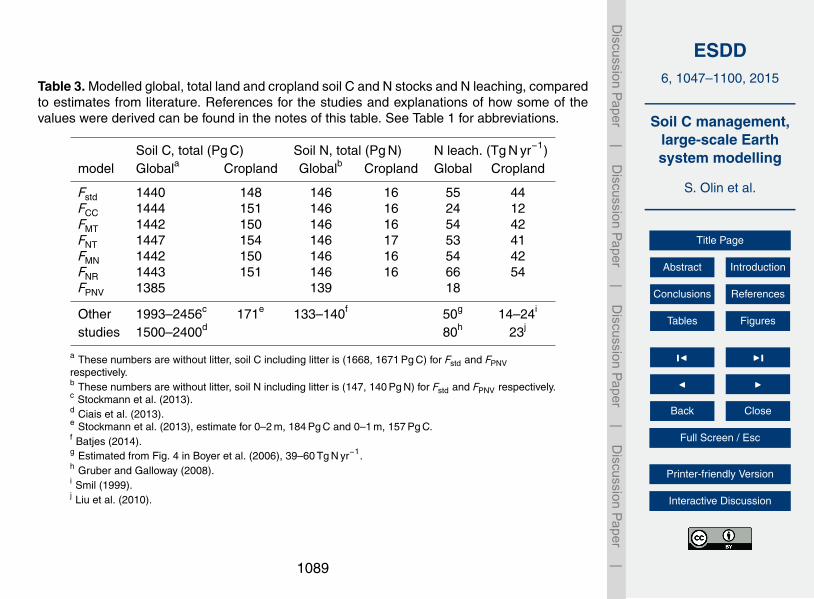
ESDD6, 1047–1100, 2015
Soil C management,large-scale Earthsystem modelling
S. Olin et al.
Title Page
Abstract Introduction
Conclusions References
Tables Figures
J I
J I
Back Close
Full Screen / Esc
Printer-friendly Version
Interactive Discussion
Discussion
Paper
|D
iscussionP
aper|
Discussion
Paper
|D
iscussionP
aper|
Table 3. Modelled global, total land and cropland soil C and N stocks and N leaching, comparedto estimates from literature. References for the studies and explanations of how some of thevalues were derived can be found in the notes of this table. See Table 1 for abbreviations.
Soil C, total (Pg C) Soil N, total (Pg N) N leach. (Tg N yr−1)model Globala Cropland Globalb Cropland Global Cropland
Fstd 1440 148 146 16 55 44FCC 1444 151 146 16 24 12FMT 1442 150 146 16 54 42FNT 1447 154 146 17 53 41FMN 1442 150 146 16 54 42FNR 1443 151 146 16 66 54FPNV 1385 139 18
Other 1993–2456c 171e 133–140f 50g 14–24i
studies 1500–2400d 80h 23j
a These numbers are without litter, soil C including litter is (1668, 1671 Pg C) for Fstd and FPNVrespectively.b These numbers are without litter, soil N including litter is (147, 140 Pg N) for Fstd and FPNV respectively.c Stockmann et al. (2013).d Ciais et al. (2013).e Stockmann et al. (2013), estimate for 0–2 m, 184 Pg C and 0–1 m, 157 Pg C.f Batjes (2014).g Estimated from Fig. 4 in Boyer et al. (2006), 39–60 Tg N yr−1.h Gruber and Galloway (2008).i Smil (1999).j Liu et al. (2010).
1089

ESDD6, 1047–1100, 2015
Soil C management,large-scale Earthsystem modelling
S. Olin et al.
Title Page
Abstract Introduction
Conclusions References
Tables Figures
J I
J I
Back Close
Full Screen / Esc
Printer-friendly Version
Interactive Discussion
Discussion
Paper
|D
iscussionP
aper|
Discussion
Paper
|D
iscussionP
aper|
Table 4. The relative (%) number of cropland grid cells with a shift regarding the manage-ment practice optimal from a carbon sequestration perspective, comparing the highest SOC for1996–2005 and for 2046–2055, for RCP 2.6 and 8.5. Also listed are, the share of the croplandgrid cells with no change in the optimal C sequestration practice, and the percent of total num-ber of grid cells that were cropland around the year 2000 in the data set from Hurtt et al. (2011).See Table 1 for abbreviations.
Amount of grid cells (%)from to RCP 2.6 RCP 8.5
Fstd FCC 0.7 0.7Fstd FMN 0.2 0.3Fstd FNT 1.0 0.9FCC Fstd 0.2 0.1FCC FMN 0.3 0.5FCC FNT 2.2 2.5FMN Fstd 0.0 0.0FMN FCC 0.1 0.1FMN FNT 1.3 0.4FNT Fstd 0.2 0.1FNT FCC 3.8 3.5FNT FMN 2.9 5.2
No change 87.2 85.6Cropland cells 69.1 67.2
1090
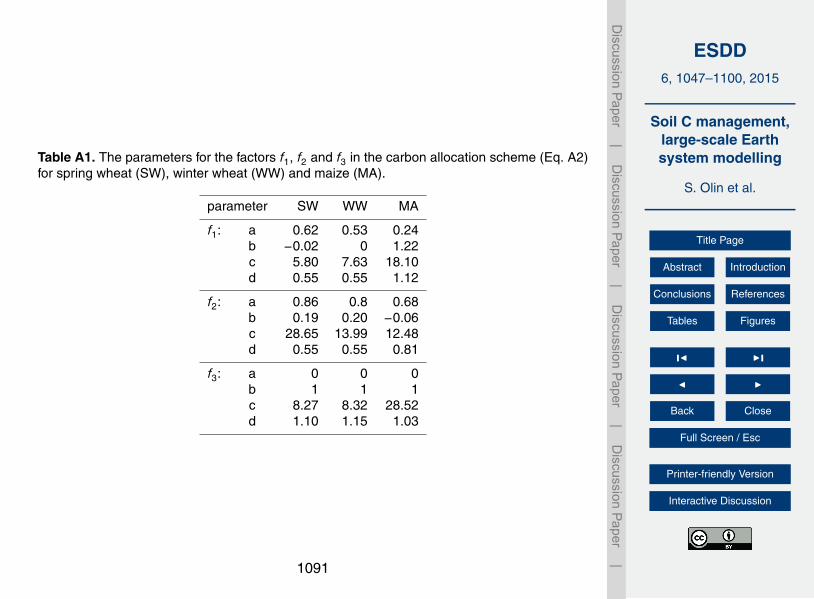
ESDD6, 1047–1100, 2015
Soil C management,large-scale Earthsystem modelling
S. Olin et al.
Title Page
Abstract Introduction
Conclusions References
Tables Figures
J I
J I
Back Close
Full Screen / Esc
Printer-friendly Version
Interactive Discussion
Discussion
Paper
|D
iscussionP
aper|
Discussion
Paper
|D
iscussionP
aper|
Table A1. The parameters for the factors f1, f2 and f3 in the carbon allocation scheme (Eq. A2)for spring wheat (SW), winter wheat (WW) and maize (MA).
parameter SW WW MA
f1: a 0.62 0.53 0.24b −0.02 0 1.22c 5.80 7.63 18.10d 0.55 0.55 1.12
f2: a 0.86 0.8 0.68b 0.19 0.20 −0.06c 28.65 13.99 12.48d 0.55 0.55 0.81
f3: a 0 0 0b 1 1 1c 8.27 8.32 28.52d 1.10 1.15 1.03
1091

ESDD6, 1047–1100, 2015
Soil C management,large-scale Earthsystem modelling
S. Olin et al.
Title Page
Abstract Introduction
Conclusions References
Tables Figures
J I
J I
Back Close
Full Screen / Esc
Printer-friendly Version
Interactive Discussion
Discussion
Paper
|D
iscussionP
aper|
Discussion
Paper
|D
iscussionP
aper|
Table A2. CFT specific parameters of Specific Leaf Area (SLA), minimum C : N value of theleaves and the amount of the total N that is applied at the different developmental atages (DS),where DS= 0 is sowing, DS= 0.5 is half way into the vegetative phase. At DS= 0.9 the rest isapplied, see Olin et al. (2015) for more details.
parameter SW WW MA Unit Reference
SLA 35 35 45 m2 kg−1 C−1
C : Nmin 15 15 15 kg C kg−1 N−1
Napp,DS=0 0.11 0.08 0.11 fraction Olin et al. (2015)Napp,DS=0.5 0.50 0.19 0.50 fraction Olin et al. (2015)
1092
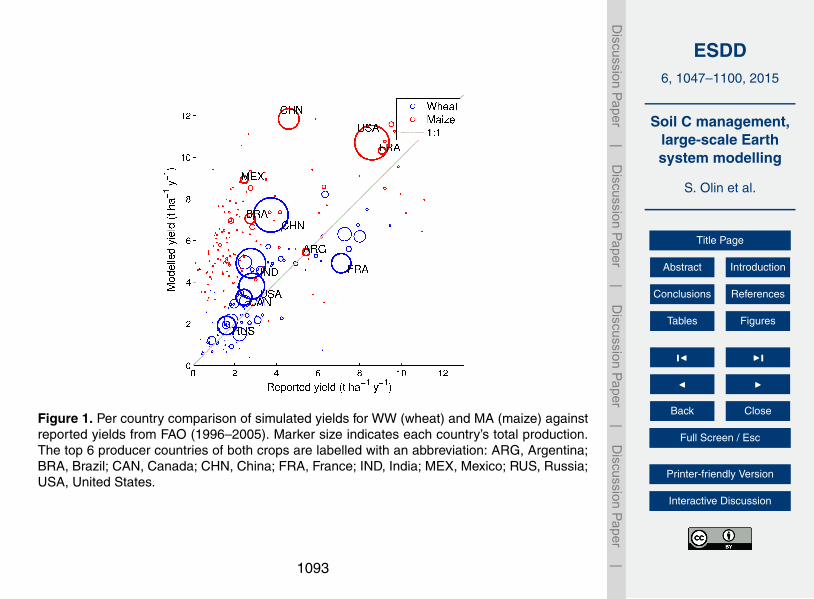
ESDD6, 1047–1100, 2015
Soil C management,large-scale Earthsystem modelling
S. Olin et al.
Title Page
Abstract Introduction
Conclusions References
Tables Figures
J I
J I
Back Close
Full Screen / Esc
Printer-friendly Version
Interactive Discussion
Discussion
Paper
|D
iscussionP
aper|
Discussion
Paper
|D
iscussionP
aper|
Figure 1. Per country comparison of simulated yields for WW (wheat) and MA (maize) againstreported yields from FAO (1996–2005). Marker size indicates each country’s total production.The top 6 producer countries of both crops are labelled with an abbreviation: ARG, Argentina;BRA, Brazil; CAN, Canada; CHN, China; FRA, France; IND, India; MEX, Mexico; RUS, Russia;USA, United States.
1093
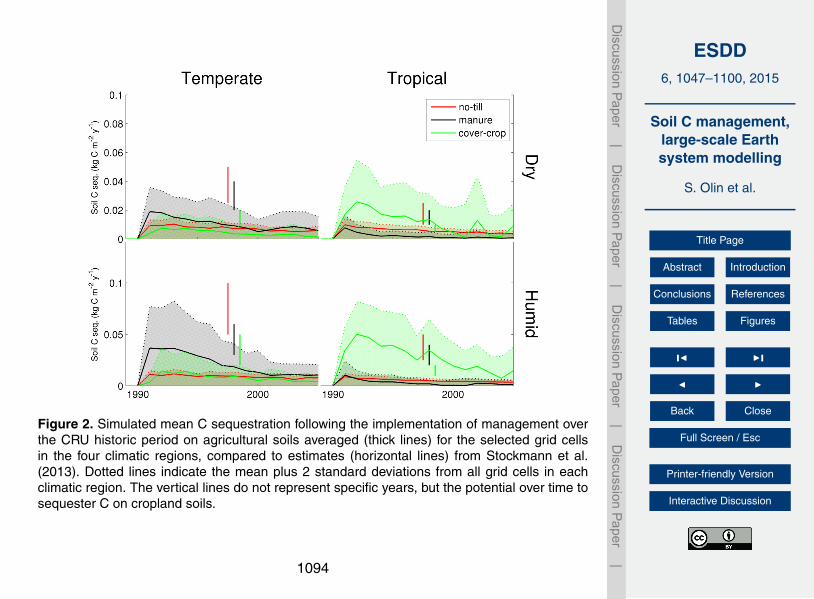
ESDD6, 1047–1100, 2015
Soil C management,large-scale Earthsystem modelling
S. Olin et al.
Title Page
Abstract Introduction
Conclusions References
Tables Figures
J I
J I
Back Close
Full Screen / Esc
Printer-friendly Version
Interactive Discussion
Discussion
Paper
|D
iscussionP
aper|
Discussion
Paper
|D
iscussionP
aper|
Figure 2. Simulated mean C sequestration following the implementation of management overthe CRU historic period on agricultural soils averaged (thick lines) for the selected grid cellsin the four climatic regions, compared to estimates (horizontal lines) from Stockmann et al.(2013). Dotted lines indicate the mean plus 2 standard deviations from all grid cells in eachclimatic region. The vertical lines do not represent specific years, but the potential over time tosequester C on cropland soils.
1094

ESDD6, 1047–1100, 2015
Soil C management,large-scale Earthsystem modelling
S. Olin et al.
Title Page
Abstract Introduction
Conclusions References
Tables Figures
J I
J I
Back Close
Full Screen / Esc
Printer-friendly Version
Interactive Discussion
Discussion
Paper
|D
iscussionP
aper|
Discussion
Paper
|D
iscussionP
aper|
Figure 3. The simulated relative response (%) of soil carbon to management options (Table. 1)compared to the standard setup, averaged for 1996–2005 and displayed as the global response(filled symbol) and per climatic region. Note the reversed axes for N leaching (all axes displayscales from reduced to enhanced ecosystem services).
1095

ESDD6, 1047–1100, 2015
Soil C management,large-scale Earthsystem modelling
S. Olin et al.
Title Page
Abstract Introduction
Conclusions References
Tables Figures
J I
J I
Back Close
Full Screen / Esc
Printer-friendly Version
Interactive Discussion
Discussion
Paper
|D
iscussionP
aper|
Discussion
Paper
|D
iscussionP
aper|
Figure 4. Optimal carbon sequestration practice around the year 2000, as simulated by LPJ-GUESS. The standard setup (Fstd, blue) was selected when none of the other managementsgave an increase in the amount of carbon sequestered. The C sequestered compared to Fstdfor choosing the optimal practice in each grid cell is 7.7 Pg C from 1750 to 2000, the reductionin global N leaching for best C sequestration practices is 11.9 TgNyr−1.
1096
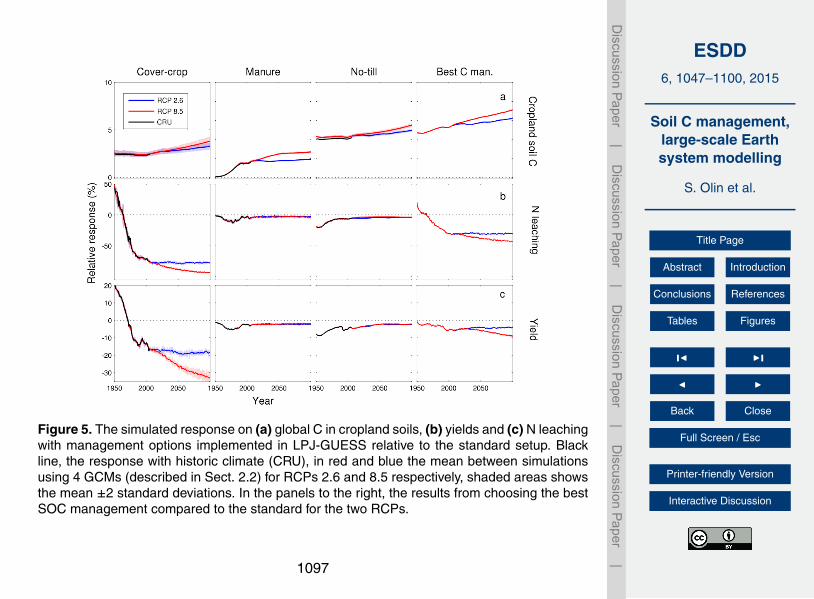
ESDD6, 1047–1100, 2015
Soil C management,large-scale Earthsystem modelling
S. Olin et al.
Title Page
Abstract Introduction
Conclusions References
Tables Figures
J I
J I
Back Close
Full Screen / Esc
Printer-friendly Version
Interactive Discussion
Discussion
Paper
|D
iscussionP
aper|
Discussion
Paper
|D
iscussionP
aper|
Figure 5. The simulated response on (a) global C in cropland soils, (b) yields and (c) N leachingwith management options implemented in LPJ-GUESS relative to the standard setup. Blackline, the response with historic climate (CRU), in red and blue the mean between simulationsusing 4 GCMs (described in Sect. 2.2) for RCPs 2.6 and 8.5 respectively, shaded areas showsthe mean ±2 standard deviations. In the panels to the right, the results from choosing the bestSOC management compared to the standard for the two RCPs.
1097
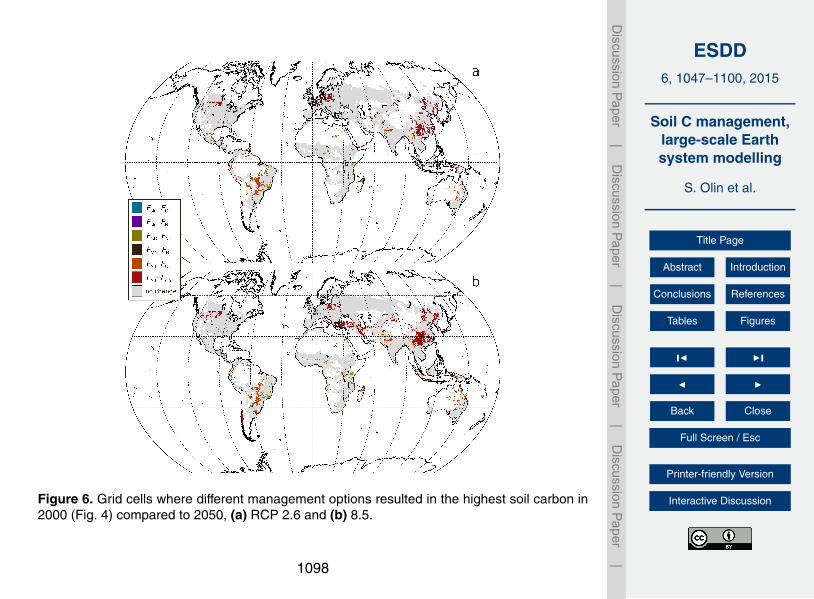
ESDD6, 1047–1100, 2015
Soil C management,large-scale Earthsystem modelling
S. Olin et al.
Title Page
Abstract Introduction
Conclusions References
Tables Figures
J I
J I
Back Close
Full Screen / Esc
Printer-friendly Version
Interactive Discussion
Discussion
Paper
|D
iscussionP
aper|
Discussion
Paper
|D
iscussionP
aper|
Figure 6. Grid cells where different management options resulted in the highest soil carbon in2000 (Fig. 4) compared to 2050, (a) RCP 2.6 and (b) 8.5.
1098

ESDD6, 1047–1100, 2015
Soil C management,large-scale Earthsystem modelling
S. Olin et al.
Title Page
Abstract Introduction
Conclusions References
Tables Figures
J I
J I
Back Close
Full Screen / Esc
Printer-friendly Version
Interactive Discussion
Discussion
Paper
|D
iscussionP
aper|
Discussion
Paper
|D
iscussionP
aper|
Figure B1. Input used for the simulations over the historic and scenario (RCP 2.6 and 85)periods. (a), Global cropland cover (%) from (Hurtt et al., 2011), mean N fertiliser applicationrate (Stocker et al., 2013; Zaehle et al., 2010a); (b), [CO2] and mean terrestrial temperaturefrom the 4 GCMs (Sect. 2.2).
1099
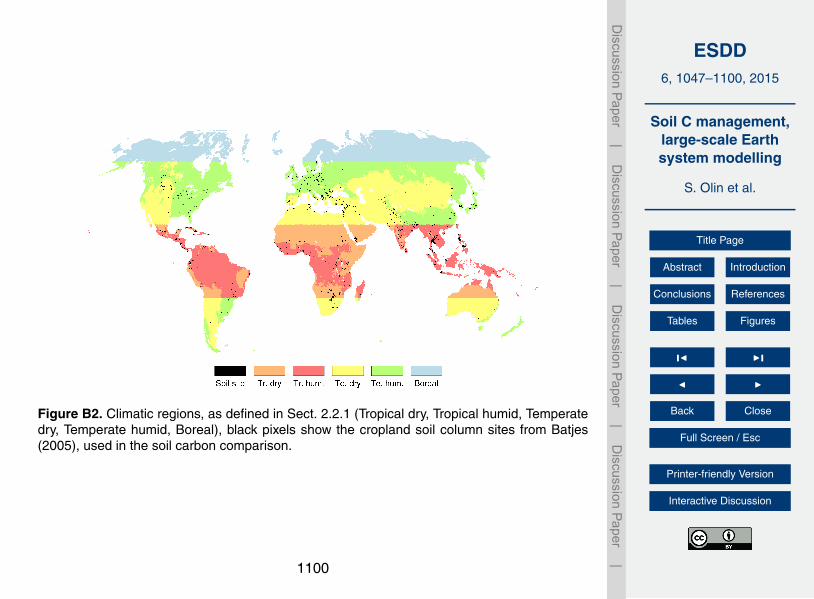
ESDD6, 1047–1100, 2015
Soil C management,large-scale Earthsystem modelling
S. Olin et al.
Title Page
Abstract Introduction
Conclusions References
Tables Figures
J I
J I
Back Close
Full Screen / Esc
Printer-friendly Version
Interactive Discussion
Discussion
Paper
|D
iscussionP
aper|
Discussion
Paper
|D
iscussionP
aper|
Figure B2. Climatic regions, as defined in Sect. 2.2.1 (Tropical dry, Tropical humid, Temperatedry, Temperate humid, Boreal), black pixels show the cropland soil column sites from Batjes(2005), used in the soil carbon comparison.
1100