Embed Size (px)
Citation preview

Soil carbon stock under different land-use systems in Attapady Valley of Nilgiri Biosphere Reserve, Western Ghats, India
Sowmya Chandramouli1, Sameer,P.A2, Syam Viswanath1, Nair, K.M3
1 Tree Improvement and Genetics Division, Institute of Wood Science & Technology, ICFRE, Bangalore, India
2Dabur Nepal Private Ltd., Kathmandu, Nepal 3National Bureau of Soil Survey & Land Use Planning, ICAR, Bangalore
E-mail: [email protected], [email protected], [email protected], [email protected]

Background
Attappady valley of Nilgiri biosphere Reserve - well known for its abundant natural wealth and indigenous people
History of land-ownership and uses in the area - evolution of land-use problems

Demography
Native Tribes (Irula, Muduga & Kurumba)
Settlers
Location
Area: 745 km2
Latitude: 100 55’ and 110 14’ N
Longitude: 760 21’ and 760 48’
Altitude: 450 to 2300 M above MSL
Pudur
Sholayur
Agali

Era Ownership Land use Pattern
Up to 18th Century Chera, Chola, Pandya,
Vijayanagara, Mysore (Kongu) and
Samothiri (Malabar) kingdoms
Dense forests, Shifting
cultivation, hunting and
gathering
18th–20th Century East India Company-Kingdoms
and Land Lords ( Janmis)
Dense forests, Shifting
cultivation, hunting and Timber
extraction
1950-1970
(After Tamil Nadu
Preservation of
Private Forests Act,
1949)
Tribes, State Departments of
Forest and Revenue
Extraction of timber and NTFP.
Shifting / Kumri cultivation
1970-Onwards
(After Kerala Private
Forests Vesting and
Assignment Act,
1971)
Adivasis, State Departments of
Forest and Revenue, commercial
establishments, institutions
Degraded forests, Settled Dry
farming, plantations, fallows
(wastelands), brick-kilns,
buildings
Land use History of Attapady valley

Land-use systems (LUS) in Attapady
Attapady - covered by pristine natural forest until 19th century
Anthropogenic interventions - deforestation and vegetational changes in LUS – 1950-60
Three newly transformed LUS
Agroforestry
Annual crop agriculture
Barren land

Study procedure
Spatial delineation of the study area
Climatic analysis
Selection of sites
Study of land and soil at selected sites
Soil Sampling
Laboratory analysis of soils
Data processing and interpretations

Geo-referencing of satellite image of the study area
Satellite image of the study area (LISS-2)

N
o
Land Use Area
Sq.km
%
area
Forest
1 Degraded forest 355.30 47.7
2 deciduous forest 27.38 3.6
3 evergreen forest 80.75 10.8
Agricultural land
4 Single crop(Kharif) 41.43 5.5
5 Double crop
(Kharif and Rabi)
66.00 8.8
Agroforestry 92. 69 12.4
Barren Land
6 Permanent fallow 50.56 6.8
7 Barren rocks 27.38 3.7
8 Water bodies 2.81 0.3
Physiography of the study area (not to scale). Drainage network of the study area (not to scale)
Slope <5%
Slope 5-10%
Slope 10-15%
Slope 15-35%
Slope >35%

Soil Series map of the study area
(NBSS& LUP) (not to scale)

Site selection
Study area was delineated in to 3 agroecological zones and 4 prevalent land- use systems (LUS)
Study sites identified in each category keeping all other pedogenic factors (slope, geology etc) constant.
Soil Profiles were exposed up to the parent material
soil organic carbon (SOC) estimated.

Agroclimatic zonation S.No. Agroecological unit Site
1 Per-humid A – (precipitaion 2000-2500 mm/yr) Mukkali
2 Per-humid A – (precipitaion 2000-2500 mm/yr) Chittoor
3 Per-humid A – (precipitaion 2000-2500 mm/yr) Jellippara
4 Moist sub-humid zone C-2 (precipitaion 1000-1500 mm/yr)
Thavalam
5 Moist sub-humid zone C-2 (precipitaion 1000-1500 mm/yr)
Vechappathy
6 Dry sub-humid zone C-1 (precipitaion 7000- 1000 mm/yr)
Puthoor
7 Dry sub-humid zone C-1 (precipitaion 7000- 1000 mm/yr)
Anakkatty
8 Dry sub-humid zone C-1 (precipitaion 7000- 1000 mm/yr)
Cheerakadavu

Agro ecological zonation map of the study area (not to scale)

Land-use systems (LUS) identified for study in Attapady Pristine Natural forests - dense evergreen and
deciduous forests
Agroforestry - Cocos nucifera and Areca catechu based homestead gardens with diverse agricultural horticultural and forest species
Agriculture - vegetable crops cereals, millets, Saccharum spp. and medicinal plants like Coleus aromaticus
Barren lands - degraded forest land devoid of trees and the deforested lands left fallow under private ownership

Forest
Agroforestry
Wastelands
Agriculture
Different land uses sytems (LUS) in Attappady valley

forest
Agroforestry
Agriculture Wastelands
Different land uses sytems (LUS) in Attappady valley

Forest
Agroforestry
Agriculture
Different land uses sytems (LUS) in Attappady valley

SOC status
Comparisons of the present SOC status across these four LUS
Vegetation and debris were cleared in one m2 area in the identified sites
SOC analyzed by Walkley-Black procedure
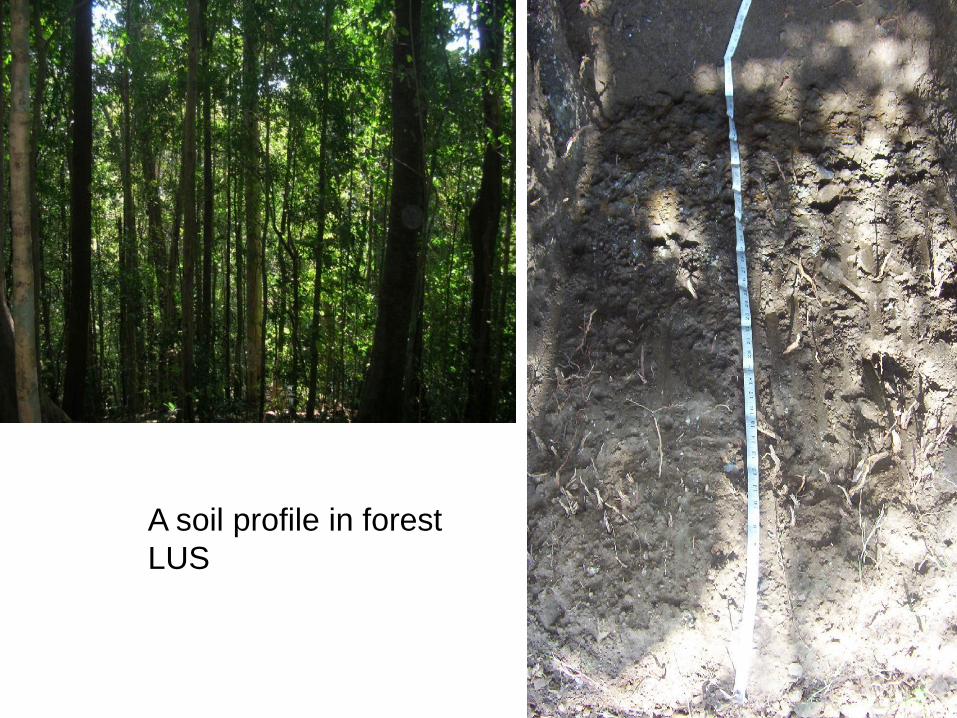
A soil profile in forest
LUS

A soil profile in agroforestry
LUS

A typical agriculture LUS
with exposed soil profile

A typical wasteland/barren
land (LUS) soil profile

Sites
selected in
each LUS and
agroclimatic
zone
Forest LUS Agroforestry LUS Agriculture LUS Barren Land LUS
0-30
cm
30-100
cm
0-100
cm
0-30
cm
30-100
cm
0-100
cm
0-30
cm
30-100
cm
0-100
cm
0-30
cm
30-100
cm
0-100
cm
Perhumid
Mukkali 1.48 1.54 1.51 1.52 1.56 1.53 1.54 1.55 1.56 1.57 1.59 1.58
Chittoor 1.45 1.53 1.5 1.49 1.57 1.48 1.5 1.58 1.54 1.51 1.65 1.58
Jellippara 1.41 1.49 1.45 1.42 1.51 1.47 1.53 1.58 1.56 1.56 1.64 1.6
Mean 1.44 1.52 1.48 1.47 1.54 1.49 1.52 1.57 1.55 1.54 1.62 1.58
Moist deciduous
Thavalam 1.49 1.56 1.53 1.52 1.54 1.53 1.56 1.59 1.7 1.56 1.62 1.59
Vechappathy 1.49 1.54 1.52 1.5 1.57 1.54 1.51 1.6 1.56 1.56 1.62
Mean 1.49 1.55 1.52 1.51 1.55 1.53 1.53 1.59 1.63 1.56 1.62 1.59
Dry deciduous
Puthoor 1.47 1.6 1.54 1.49 1.62 1.56 1.55 1.65 1.6 1.58 1.68 1.63
Anakkatty 1.4 1.5 1.45 1.49 1.58 1.54 1.54 1.64 1.59 1.62 1.68 1.65
Cheerakadavu 1.48 1.52 1.5 1.5 1.57 1.54 1.54 1.6 1.57 1.58 1.62 1.6
Mean 1.45 1.54 1.49 1.49 1.59 1.54 1.54 1.63 1.58 1.59 1.66 1.62
Over all mean
1.46 1.53 1.49 1.49 1.56 1.52 1.53 1.59 1.58 1.56 1.63 1.59
Soil bulk density in sites selected in each LUS and agroclimatic zone

Measurement of C efflux from soil in the study sites
Ce = (A x D x b x SOC x f )
Ce is the C efflux from soil to atmosphere,
A is the area of land conversion ,
D is the soil depth in m,
b is the soil bulk density as the weighted average for all
depths.
f is the SOC fraction efflux by the change in land use.
Houghton (1995)

(Bouwman 1990 )

Land use
Area
(Sq km)
Mean SOC in kg m-2 Carbon stock in Mg ha -1
0-30
cm
30-100
cm
0-100
cm
0-30
cm 30-100 cm 0-100 cm
Dense
evergreen
forest
80.74 9.56 7.49 17.05 772 605 1377
Dense
deciduous
forest
27.38 7.68 5.43 13.11 210 149 359
Agroforestry
92.68 7.14 3.02 10.17 662 280 942
Agriculture 107.43 4.79 2.07 6.86 514 223 737
Wastelands 405.85 3.60 0.87 4.47 1461 354 1814
Total 3619 1611 5229
Soil Organic Carbon Stock (SOC) and Total Carbon stock of different land use systems in Attapady Valley, Kerala

• Undisturbed forest (15.14% of area ) accounted for 33.20% of SOC stock
• Agroforestry (12.98 % of area) held 18.02% of SOC stock
• Agriculture landscapes (15.04 % of area ) held 14.09 % of SOC stock
• Barren lands (56.3% of the study area) accounted for 34.6% of the total SOC stock
SOC stock at top 100cm in Attapady Valley
Site SOC Stock decline
Agroforestry Kg m-1
SOC Stock decline
Agriculture Kg m-1
SOC Stock decline
Wasteland Kg m-1
0-30
cm
30-100
cm
0-100
cm
0-30
cm
30-100
cm
0-100
cm
0-30
cm
30-100
cm
0-100
cm
Perhumid
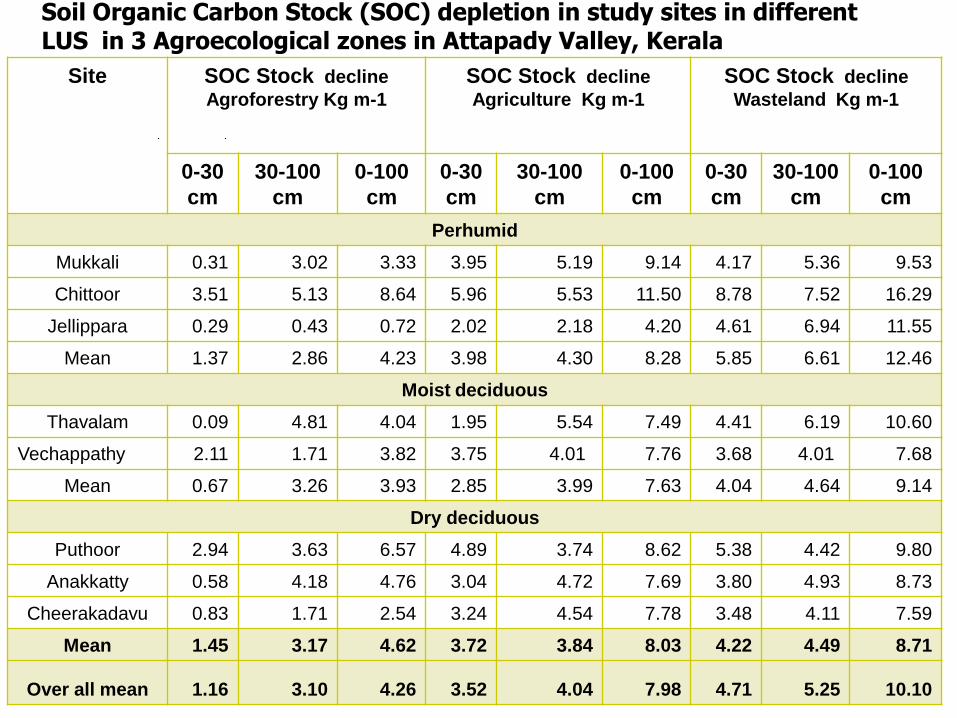
Mukkali 0.31 3.02 3.33 3.95 5.19 9.14 4.17 5.36 9.53
Chittoor 3.51 5.13 8.64 5.96 5.53 11.50 8.78 7.52 16.29
Jellippara 0.29 0.43 0.72 2.02 2.18 4.20 4.61 6.94 11.55
Mean 1.37 2.86 4.23 3.98 4.30 8.28 5.85 6.61 12.46
Moist deciduous
Thavalam 0.09 4.81 4.04 1.95 5.54 7.49 4.41 6.19 10.60
Vechappathy 2.11 1.71 3.82 3.75 4.01 7.76 3.68 4.01 7.68
Mean 0.67 3.26 3.93 2.85 3.99 7.63 4.04 4.64 9.14
Dry deciduous
Puthoor 2.94 3.63 6.57 4.89 3.74 8.62 5.38 4.42 9.80
Anakkatty 0.58 4.18 4.76 3.04 4.72 7.69 3.80 4.93 8.73
Cheerakadavu 0.83 1.71 2.54 3.24 4.54 7.78 3.48 4.11 7.59
Mean 1.45 3.17 4.62 3.72 3.84 8.03 4.22 4.49 8.71
Over all mean 1.16 3.10 4.26 3.52 4.04 7.98 4.71 5.25 10.10
Soil Organic Carbon Stock (SOC) depletion in study sites in different LUS in 3 Agroecological zones in Attapady Valley, Kerala

SOC stock depletion
• Major depletion of SOC - top 30cm soil
• Estimated depletion around 1.16 kg m-2 on conversion to
agroforestry
• 3.52 kg m-2 on conversion to agriculture
• 4.71 kg m-2 on conversion barren lands
• barren land > agriculture land > agroforestry> forestland

0
2
4
6
8
10
12
14
Perhumid Moist subhumid Dry subhumid
Climatic zone
SO
C lo
st
in k
g/m
2
Agroforestry
Agriculture
Wasteland
Magnitude of SOC decline at top 100 cm of soil due to shifting from forest to different LUS in different agroecological zones in Attapady
Valley

CO2 released (kg m-1 ) during LUS shift in the 3 different agroecological
zones in Attapady Valley
Site Agroforestry Agriculture Wasteland
Perhumid
Mukkali 12.21 33.51 34.96
Chittoor 31.68 42.15 59.74
Jellippara 2.62 15.40 42.35
Mean 15.51 30.35 45.68
Moist deciduous
Thavalam 14.80 27.48 38.88
Vechappathy 14.00 28.45 28.17
Mean 14.40 27.97 33.53
Dry deciduous
Puthoor 24.08 31.62 35.93
Anakkatty 17.44 28.21 32.02
Cheerakadavu 9.32 28.53 27.83
Mean 16.95 29.45 31.93
Over all mean 15.62 29.26 37.05
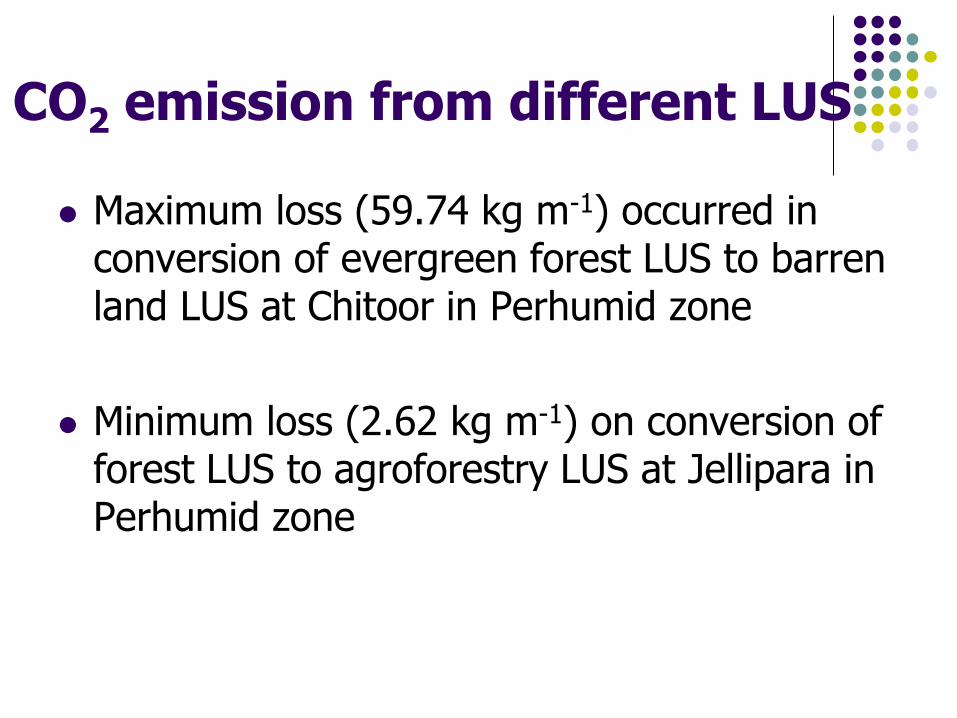
Maximum loss (59.74 kg m-1) occurred in conversion of evergreen forest LUS to barren land LUS at Chitoor in Perhumid zone
Minimum loss (2.62 kg m-1) on conversion of forest LUS to agroforestry LUS at Jellipara in Perhumid zone
CO2 emission from different LUS

Land use system (LUS)
Area
(Sq km)
CO2 trapped
(Mg m-1)
Dense evergreen forest
80.75 5048
Dense deciduous forest
27.38 1317
Agroforestry
92.69 3455
Agriculture
107.43 2702
Wastelands 405.85 6652
Total 19174
CO2 stored under different LUS in Attapady Valley

Forest LUS had a carbon reserve 3.2 times greater than barren land LUS. Nearly 19 Tg of C is estimated to be fixed as SOC through current prevalent LUS If the natural forest had been retained, 45 Tg C could have been potentially fixed, which may be significant contribution to SOC stock in Attapady valley Deforestation has caused a depletion of 25 Tg from this potential SOC stock.
SUMMARY

Conclusions
Deleterious effects of converting climax natural forest area to agroforestry LUS or agriculture LUS may not be as serious as natural forest LUS conversion to barren lands
Need for systematic planning for converting barren lands in a sequential stepwise process towards natural forest land LUS
Participatory approach - considering issues like land tenure, land policy issues and stake holder preferences
This study can be a benchmark for the evaluation and monitoring of further restoration activities

Acknowledgement
Dr.V.P.Tewari, Scientist, Wood energy Division, IWST, Bangalore
Dr.Christoph Kleinn, Professor of Forest Inventory and Remote Sensing, Burckhardt-Institute at the Faculty of Forest Sciences and Forest Ecology, Georg-August-Universität Göttingen

Thank you for your kind
attention…