Embed Size (px)
Citation preview

Soil Cement Roads Richland County MT
Russell Huotari, Richland Co Public Works Director
Steve Monlux, USFS Retired LVR Consultants, LLC
[email protected] Vischer, USFS Retired
2/29/2016 Copyright Monlux/Vischer 2016 1
20th Annual NRRA Pavement Conference
St. Paul, MNFebruary 18th, 2016
For Current Report, Google “soil cement montana”

Presentation Topics
• The Problem: • Structural Design Options• Performance Measurements• Life Cycle Cost Comparisons• Soil Cement Construction & Repair• Conclusions & Recommendations
2/29/2016 Copyright Monlux/Vischer 2016 2
2/29/2016 Copyright Monlux/Vischer 2016 3
The Problem
• Heavy Truck Traffic on Weak Soil Roads– 50,000 ESAL’s per well (development, fracking, crude and produced water haul)
• Truck ADT & Weight Unknown• Over 100 miles of oil field arterials• Limited Budget• Limited Rock Resources

2/29/2016 Copyright Monlux/Vischer 2016 4
Richland Co Road Network & Resource Impacts
Missouri River
Oil Development, Wheat, Gravel Roads
Richland County Border
North DakotaMontana
Population Center, Beet Farms, Gravel Resources
Yellowstone River
56 mi

2/29/2016 Copyright Monlux/Vischer 2016 5
Approach to Problem• Staff a Group to develop options• Design structural sections
– Subgrade strengths – Truck traffic– Available materials
• Build trial sections that have low initial cost– Falling Weight Deflectometer (FWD) Test (Montana Non‐Destructive Test Unit)
– Back calculate ESAL life, develop thickness design process (William Vischer, USFS Retired)
– Develop repair options for problems that develop
2/29/2016 Copyright Monlux/Vischer 2016 6
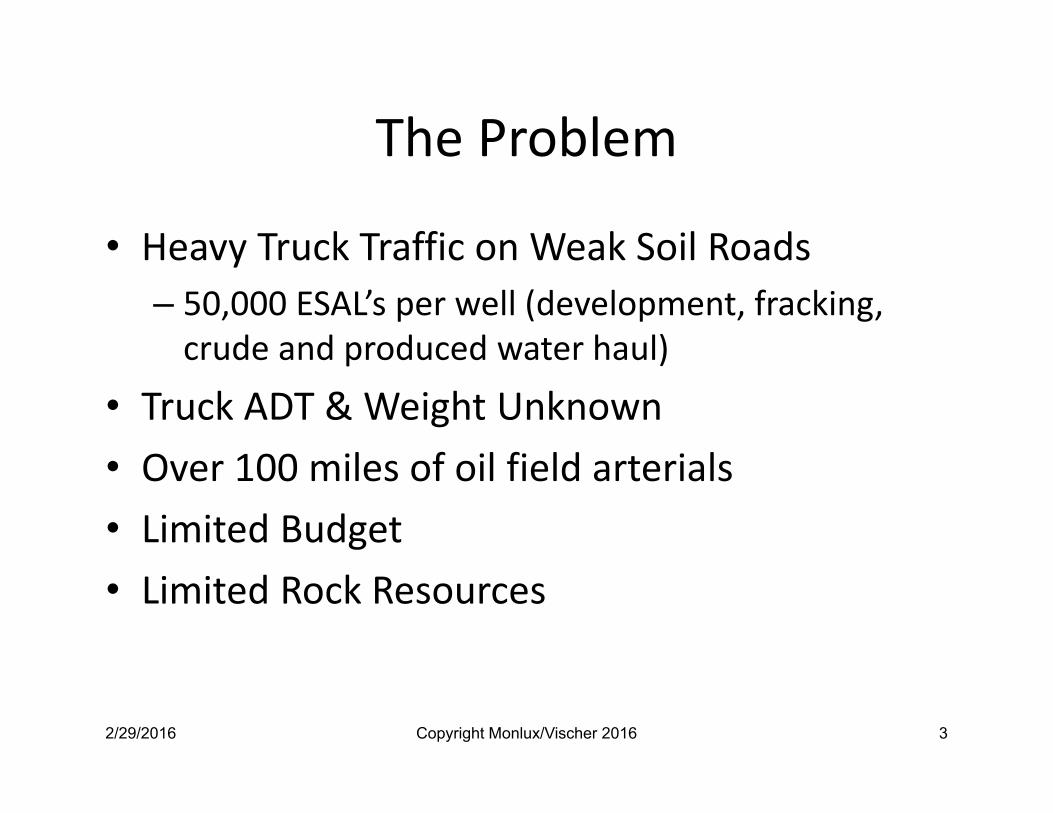
Weak Soils (CBR of 1 to 3 typical)
5” Asphalt, + 8” Base (15 yrs old)
3” Scoria, old gravel base (after 3 months)

2/29/2016 Copyright Monlux/Vischer 2016 7
Weak Clay/Silt Subgrade Soils
Standard Pavement Design Hot Mix
Crushed Gravel
Fabric Geogrid
Gravel with Fabric & Geogrid
Subgrade
Gravel $ Too High
GravelThin gravel layers mix with subgrade Subgrade

Asphalt & Aggregate Designs ~ 2006 to 2014
Gravel Base –8” Thick (2009) 10” Thick (2010)
Fabric
Structural Layer
2/29/2016 Copyright Monlux/Vischer 2016 8
Standard Hot Mix Designs Structural
Layers 8” Crushed Gravel Base
Subgrade Soil
5” Hot Mix
2006 ($1 M/mi)
Double BST
Structural Layer (4” Lift of gravel
stabilized with BASE 1)
Thin BST on Base Designs
~ Subgrade Soil
2009
2014 ($3 M/mi +)
17” Pit Run Gravel
7” Hot Mix
8” Crushed Gravel Base
2/29/2016 Copyright Monlux/Vischer 2016 9
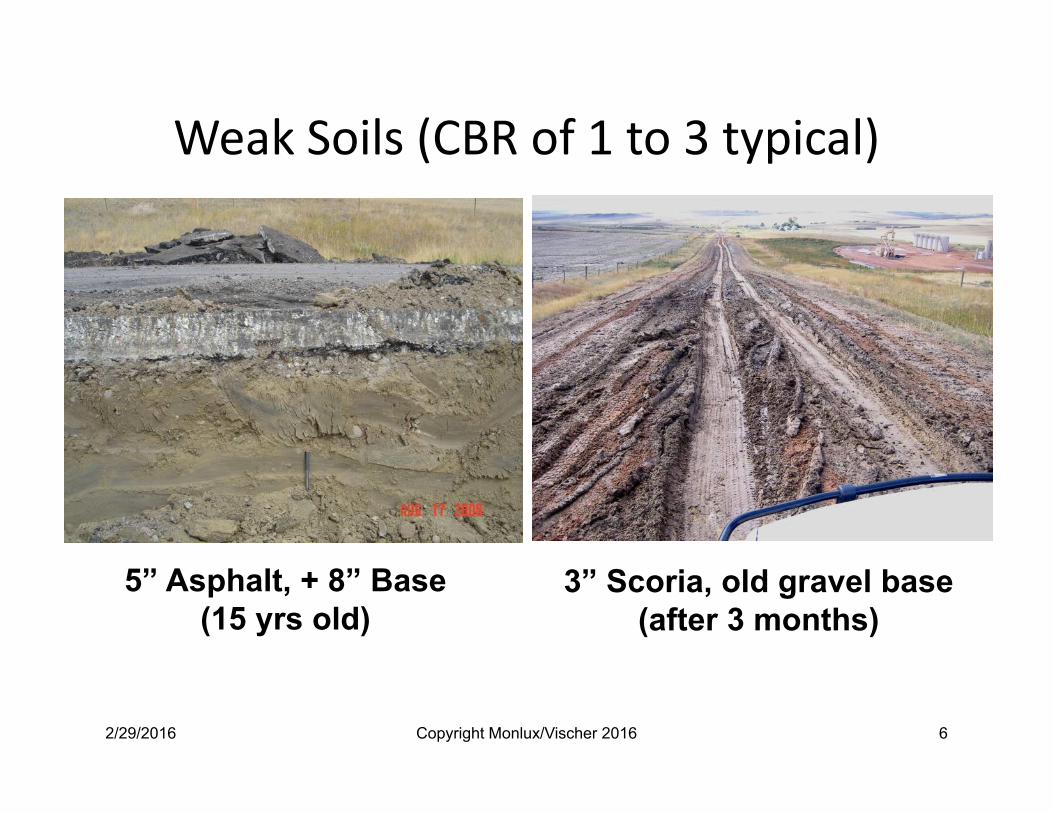
2010 Designs
$250,000 /mile
12’ 2’Flatter wider shoulder is less of a hazard
Wide impermeable shoulder keeps surface water further away from critical structure support area.
Harder support from soil cement reduces damage from large rock punctures
C
BST over 8” Soil Cement
Clay Subgrade
Critical Structural Support Area
$400,000/mileBST over 10” Gravel Base
1’
Water infiltration to Clay Subgrade is close to structural support area
C
Clay Subgrade
Critical Structural Support Area Edge cracking & break off mtc. problems

What is Soil Cement?
2/29/2016 Copyright Monlux/Vischer 2016 10

Concerns with Clay Soil Cement
• Life• Low cost driving surface• Repair methods for semi‐rigid layer• Accurate thickness design process• Clay pulverization • Deep layer compaction• Curing in windy climate
2/29/2016 Copyright Monlux/Vischer 2016 11

Soil Cement Designs – Typical Sections
Soil Cement, 8” to 12” thick
5% to 8% Cement
2010
2/29/2016 Copyright Monlux/Vischer 2016 12
Designs modified after FWD
testing in spring and fall
Soil Cement, 10” thick,
8% Cement
2011
Soil Cement, 12” thick, 6% to 7% Cement
2012-13

Soft Subgrade Designs
Soft Spot Location2011: (5%) Proof Rolling & DCP2012: (15%) Intelligent Compaction Roller & DCP2013: (15%) Ground Penetrating Radar & DCP
Soil Modification,18” thick, 3% Cement
2012 & 2013
CBR = 1
2/29/2016 Copyright Monlux/Huotari 2014 13
Soil Stabilization, 12” thick,
6% to 7% Cement
CBR = 1
2011
Soil Stabilization
12” thick, 10% Cement

2/29/2016 Copyright Monlux/Vischer 2016 14
Long Term Strength of Soil Cement
Designs should assume Ep will be reduced by 20% to 40% over time (Bill Vischer, Nov 2014)
50100150200250300
0 1 2 3 4
Ep x 1000, psi
Soil Cement Age, years
CR 129W
50100150200250300
0 1 2 3 4
Ep x 1000, psi
Soil Cement Age, years
CR 201
50100150200250300
0 1 2 3 4
Ep x 1000, psi
Soil Cement Age, years
CR 321
50100150200250300
0 1 2 3 4
Ep x 1000, psi
Soil Cement Age, years
CR 143E
50100150200250300
0 1 2 3 4
Ep x 1000, psi
Soil Cement Age, years
CR 324
50100150200250300
0 1 2 3 4
Ep x 1000, psi
Soil Cement Age, years
CR 146W
50100150200250300
0 1 2 3 4
Ep x 1000, psi
Soil Cement Age, years
CR 146E
50100150200250300
0 1 2 3 4
Ep x 1000, psi
Soil Cement Age, years
CR 314
50100150200250300
0 1 2 3 4
Ep x 1000, psi
Soil Cement Age, years
CR 143W

Soil Cement Thickness Design (Bill Vischer)
2/29/2016 Copyright Monlux/Vischer 2016 15
ESAL: 1,000,000Subgrade Mr,
psi:3000
FWD Do, mils: 160
Max Subgrade Microstrain: 480
Max Stress Ratio 0.60
Design Option
Thickness, inches Esc, psi
6% min for Frost
8% max for shrinkage cracking
1 16 >100 6% OK Two Layers2 14 >140 6% OK Two Layers3 12 >170 OK No Single Layer4 <12 wont work5
OK at any Esc 8.88" won't work No 8" won't work
Step 9: Recommendations:
Alternative A: Pretreat all known weak areas with 3%
cement to 18" depth to raise the average subgrade
Mr, followed by 12 % treatment @ 8% Cement. Alternative B: Treat 12" depth at 8% Cement and
Lower Design Traffic ESAL value from 1,000,000 to
750,000
Cement content for Lean Clay Soils Maximum One
Layer depth equals 12". Two layers
increase cost
OK at any Esc 5.3OK at any Esc 6.8
Step 3: Use Graph 2 to determine allowable subgrade strain for the design ESAL.
Step 4: Use Graph 3 to determine maximum allowable stress ratio limit for the Soil Cement layer based on design traffic ESAL.
Sep 5: Use Graph 4 and the maximum subgrade strain to
identify options of soil cement layer thicknesses possible for the design
Subgrade Mr. Thicknesses correlating for Esc between 100 and
200 are suggested.
Step 6: Use Graph 5 and the
maximum stress ratio to determine
which options from Step 5 are
acceptable based on the design Subgrade Mr
Step 7: Use Graph 6 to determine
the minimum cement
content for each
acceptable design option
Step 8: Selecting the best option requires engineering judgment
when consideration of the following criteria
Appendix E1 - Thickness Design Curves - Soil Cement with BST Surface (4/2/2014)
Thickness Design Outline: Page one provides and example solution with a step by step process that uses graphs shown on page two and three. Page 4 is a blank form of page one that should help keep the process organized.
Thickness Design Steps with an Example Design DataStep 1: Assume a design traffic ESAL value. Step 2: Determine subgrade modulus. Use either a DCP and charts, or FWD & DCP (preferred option) for the average deflection directly under a 6,000 lb load (Do) from tests conducted in the Spring season. Use Graph 1 to determine Subgrade Mr from FWD maximum deflection, Do
Page 1

Soil Cement Thickness Design (Con’t)
2/29/2016 Copyright Monlux/Vischer 2016 16
y = 0.0208e0.0086xR² = 0.9995
3%
4%
5%
6%
7%
8%
9%
50 70 90 110 130 150 170
Cemen
t %
ESC of Soil Cement , psi x 1000
Graph 6. Soil Cement (ESC) VS Cement Content
400
500
600
700
800
900
1000
0 500 1000 1500 2000
Subgrade
Microstrain
ESALS X 1000 ( Asphalt Institute Equation)
Graph 2. Subgrade Strain VS ESALS
0
50
100
150
200
250
0 500 1000 1500 2000
Soil Ce
men
t Mod
ulus psi
Subgrade Microstrain
Graph 4. Soil Cement (Esc) VS Subgrade Strain
Mr=6 ; 18Mr=3 ; 18"Mr=9 ; 18"Mr=6 ; 12"Mr=3 ; 12"Mr=9 ; 12"Mr=9 ; 8"Mr=6 ; 8"Mr=3 ; 8"Mr=3 ; 22"Mr=6 ; 22"
8"22" 18" 12"
y = 480035x‐0.997R² = 0.9999
0
2,000
4,000
6,000
8,000
10,000
12,000
14,000
0 50 100 150 200
Subg
rade
Mr p
si
Do‐Max Deflection‐Mils
Graph 1. Subgrade Mr vs Max Deflections ( From CR 351 Tests on Subgrade)
Load 5.‐6.7k MrNorm 6k MrPower (Norm 6k Mr)
0
50
100
150
200
250
0.00 0.20 0.40 0.60 0.80 1.00 1.20
Soil
Cem
ent
Mod
ulus
psi
Stabilized Layer Stress Ratio
Graph 5. Soil Cement (Esc) VS Soil Cement Stress RatioMr=6 ; 18
Mr=3 ; 18"
Mr=9 ; 18"
Mr=6 ; 12"
Mr=3 ; 12"
Mr=9 ; 12"
Mr=9 ; 8"
Mr=6 ; 8"
Mr=3 ; 8"
Mr=3 ; 22"
Mr=6 ; 22"
Mr=9 ; 22"
8"22" 18" 12"
y = 1.4723x-0.134
R² = 0.9857
0.40
0.50
0.60
0.70
0.80
0.90
1.00
0 500 1000 1500 2000
Stre
ss R
atio
18 kip ESALs ( x 1000 )
Graph 3. Stress Ratio vs ESALs
Calc Values

Estimated Annual Cost Comparisons
2/29/2016 Copyright Monlux/Vischer 2016 17
Road Surface
Support Structure
ESAL Life Years (b)Construc‐
tionAverage
Annual MtcAnnual Cost
5" Hot Mix 8" Base 1,150,000 8 $900,000 $16,000 $149,000
Road Design OptionAverage Estimated Life from FWD Data
Approximate Cost per Mile (a)
(a) Costs are very project specific(b) Based on 200 trucks/day, 50,000/yr (150,000 ESAL/yr)
Double BST 10" Base 100,000 1 $400,000 $20,000 $606,000 (c)
(c) Classic case of under designed structural section for the selected ESAL/year traffic
Double BST12" Soil Cement
500,000 3 $300,000 $18,000 $115,000
Double BST3" Gravel on 12" Soil Cement
2,000,000 13 $350,000 $16,000 $48,000
4" Treated Gravel
12" Soil Cement
2,000,000 13 $400,000 $26,000 (d) $63,000
(d) Primarily gravel replacement ‐ WAG
Consider other issues with the Soil Cement option

2/29/2016 Copyright Monlux/Vischer 2016 18
Soil Cement Construction• Road Preparation• Cement Spreading• Mixing Cement & Water• Compaction• Final Shaping & Compaction• Curing & Surface Construction

Road Prep & Cement Spread
2/29/2016 Copyright Monlux/Huotari 2014 19
1. Rebuild Crown
2. Blade up shoulder & center line berm
3. Rip Surface to control cement flow
4. Spread cement

Mixing, Compaction & Finishing
2/29/2016 Copyright Monlux/Vischer 2016 20
Water to Hydrate Cement
Reclaimer to pulverize soil and mix soil, water
& cement
Pad Foot Roller for Compaction
25 Ton Rubber Roller for Finish
Blade Rebuilds Crown
Spread Cement

Uneven Moisture/Compaction
Problem solved in 2013 by mix chamber cleaning after each cement spread
2/29/2016 Copyright Monlux/Vischer 2016 21

Clay Pulverization Problems
Pulverization increased by:slower ground speed,multiple passes, higher drum speeds, and closing mix chamber doors
Good Pulverization
Poor Pulverization
2/29/2016 Copyright Monlux/Vischer 2016 22

Double Chip Seal (2011‐12)
2/29/2016 Copyright Monlux/Vischer 2016 23
First Seal on Soil Cement
Second Seal on top of First Seal

Surfacing on Soil Cement
2/29/2016 Copyright Monlux/Vischer 2016 24
Build $ Low Moderate Highest Moderate
Est. Mtc. $ Moderate Low Lowest Moderate(Blading, Chloride, Rock)
Estimated Life Cycle $
Moderate? Low? Low? Moderate?
YearSurfacing Type, Miles
Double BST
BST on 3” Gravel
3” HMA on 3” Base
4” Treated Gravel(Bentonite & CaCl2)
2010 1.75 0 0 32011 24 0.8 0 02012 12 0 0.4 122013 0 4.8 0 8

Treated Gravel Surfacing (1 yr. old)
Close‐up photo of road surface in wheel track
Treated Gravel (3% Bentonite, 1.5% Calcium Chloride)
2/29/2016 Copyright Monlux/Vischer 2016 25
Bentonite reduces chloride leaching, chloride reduces Bentonite dusting

2/29/2016 Copyright Monlux/Vischer 2016 26
Soil Cement Quality Assurance
• Cement application rate• Pulverization• Depth of mixing• Moisture content during mixing• Compaction• Surface finish crown and profile• Curing
QA Costs depend on Contractor, site conditions, weather, etc

Extent of Soil Cement Structural Repairs
2011 (24 miles)
2012 & 13 (30 Miles)
Total Surface Area, SY 394,240 SY 492,800 SY
Total Repair Surface Area 9,878 SY 1,418 SY% of Total work (1) 2.5 % 0.3%
2/29/2016 Copyright Monlux/Vischer 2016 27
(1) Note that the relative amounts of truck traffic are unknown
Repairs for 2012 & 2013 work is less because• Better control of cement flow/content• Better control of pulverization and moisture content• Increased design thickness – 10” vs. 12”• Soft Spot Treatment ~ more treated (15% vs 5% of road area),
deeper treatment (12” vs. 18”)

Problems with 2011 Work
Low cement content on 5 ft shoulder
12 inch stabilization depth inadequate for very soft subgrade
Soil cement compression failure due to excessive flexure
2/29/2016 Copyright Monlux/Vischer 2016 28
Otta Seal Bleeding
Compression Failures
QA/QC – Soil Pulverization & Cement Uniformity
Note: Repair patch of 5” Hot mix & 15” Base rutted after 6 months

BST “Pick‐up” Problems (2011)(caused by stopping vehicles on bleeding BST)
Solution: Spray patch, UPM or Omega Mix patch
2/29/2016 Copyright Monlux/Vischer 2016 29
Cold UPM Patch
Material
Problem Area

Road 321 BST Shoving/Tearing (2011)
Repair Methods:No Depression Area: Remove BST & fabric, new BST full widthDepression Area: Re‐soil cement, 3” Gravel & BST Full width2/29/2016 Copyright Monlux/Vischer 2016 30

Damage by 200 Ton Oil Rig Movement (2011)
2/29/2016 Copyright Monlux/Vischer 2016 31
Re soil cement or cover with 3” gravel & BST
full width

Pot Hole at Soil Cement Transverse Joint (2011) (Caused by low cement content)
1 yr. Fix? (UPM Type cold mix patch)Long Term Fix (Re‐mix with Portland
Cement, add 3” Base & BST)
2/29/2016 Copyright Monlux/Vischer 2016 32

Depressed/Rutted Areas (2011)(Caused by low cement content)
Full Depth Reclamation with additional Portland Cement
2/29/2016 Copyright Monlux/Vischer 2016 33
Use Pick Axe to determine FDR area

Repair Options for Structural Problems
2/29/2016 Copyright Monlux/Vischer 2016 34
Compression Failures from Flexure
Soil Cement
Very Weak Subgrade
Depressions caused by low cement content
Soil CementFull Depth & Width Reclamation with more cement, gravel base and BST
FDR Soil Cement Repair
Reinforce with 4” Gravel Base & BST

Proposed Strategy for Improving Unpaved Arterial Roads
• Year 1: Cement stabilize soft spot areas on gravel roads – 18 inch treatment depth– 3 inch gravel surfacing
• Year 2: After all soft spots stabilized– Cement stabilize 12 inch depths,– Add 3 inch base – Double chip seal or 3 inch hot mix asphalt
• Re‐stabilize any failed areas with at least 5% more cement
2/29/2016 Copyright Monlux/Vischer 2016 35
50 to 300 ft.

Conclusions/Recommendations
2/29/2016 Copyright Monlux/Vischer 2016 36
Design Design thicknesses
based on truck traffic, subgrade strength, etc.
Costs: Soil Cement cost effective where:Rock costs are high, Soils are suitable, Road widths are marginal
MarginalBetter
Best

Conclusions/Recommendations
• Construction and MaintenanceGoogle: “Soil Cement – Montana”
2/29/2016 Copyright Monlux/Vischer 2016 37
Wirtgen Cold Recycling Technology Manual
TRB – “Recommended Practice for Stabilization of Subgrade Soils and Base Materials”
Soil Stabilization for Pavements UFC 3‐250‐11 (TM 5‐822)Transportation Research Board publications
Non‐Standard Stabilizers(FS): “Stabilization Selection Guide for Aggregate and Native Surfaced Low Volume Roads”
• Other Resources

Thank You!
2/29/2016 Copyright Monlux/Vischer 2016 38
Questions or Comments?


![UFGS 32 11 33 Cement Stabilized [Base] [Subbase] Course at ... 32 11 33.pdf · cement stabilized [base] [subbase] course at airfields and roads ... 2.6.1.1 liquid asphalt ... [base]](https://img.pdfslide.net/doc/110x75/5af531ae7f8b9a92718e8e92/ufgs-32-11-33-cement-stabilized-base-subbase-course-at-32-11-33pdfcement.jpg)


![UFGS 32 11 33 Cement Stabilized [Base] [Subbase] Course at ... 32 11 33.pdf · CEMENT STABILIZED [BASE] [SUBBASE] COURSE AT AIRFIELDS AND ROADS 08/08 ***** NOTE: This guide specification](https://img.pdfslide.net/doc/110x75/5e13a408babedd1c5e1cf8d3/ufgs-32-11-33-cement-stabilized-base-subbase-course-at-32-11-33pdf-cement.jpg)