Embed Size (px)
Citation preview
Soil degradation in farmlands of California’s San Joaquin Valley resulting from drought-induced land-use changes
by Elia Scudierowith Todd H. Skaggs and Dennis L. Corwin
Agricultral Research ServiceUS Salinity Laboratory
University of California RiversideEnvironmental Sciences
CDFA International Climate Smart Agriculture Webinar“Looking to Soil as a Climate Smart Agricultural Strategy”
California Soils Week – December 5, 2017

2/16
USDA-ARS United States Salinity LaboratoryPart of our mission: Identify and understand drivers and spatial trends in agricultural soil salinity to support the development of mitigation strategies and management plans
• Develop tools for assessing and characterizing the spatiotemporal variability of agricultural soil salinity at various spatial scales
Some social and environmental impacts of soil salinity:• Agricultural losses (-$3.7 BILLION for CA in 2014. Welle and Mauter (2017), Environ Res Lett)• Hazard to long-term sustainability of soil use (fertility, waterlogging, erosion, …)• Flood risks• Health hazard (wind-born salts)• Hazard to wildlife (in CA, high Se in drain. water birth defects. Letey (2000), Calif Agr)• Soil erosion (health hazard, Wind-born salts, …)

3/16
Salinity is a global issue
Faunt (2009)
1 billion ha salt-affected (ITPS, 2015)20% of the 300 million ha of irrigated farmland
50 % of which in 4 countries: China, India, Pakistan, and United States
USA, major issues in California’s Central Valley western San Joaquin Valley (WSJV)
(1 Million ha of irrigated farmland)FRESNO COUNTY
• Soluble salts (e.g., Na+, Cl-) in the soil solution• Electrical conductivity of the saturated soil extract (ECe, dS m-1)
Non-saline (0-2 dS m-1 ) Strongly saline (8-16 dS m-1) Slightly saline (2-4 dS m-1) Extremely saline (>16 dS m-1)Moderately saline (4-8 dS m-1)
4/16
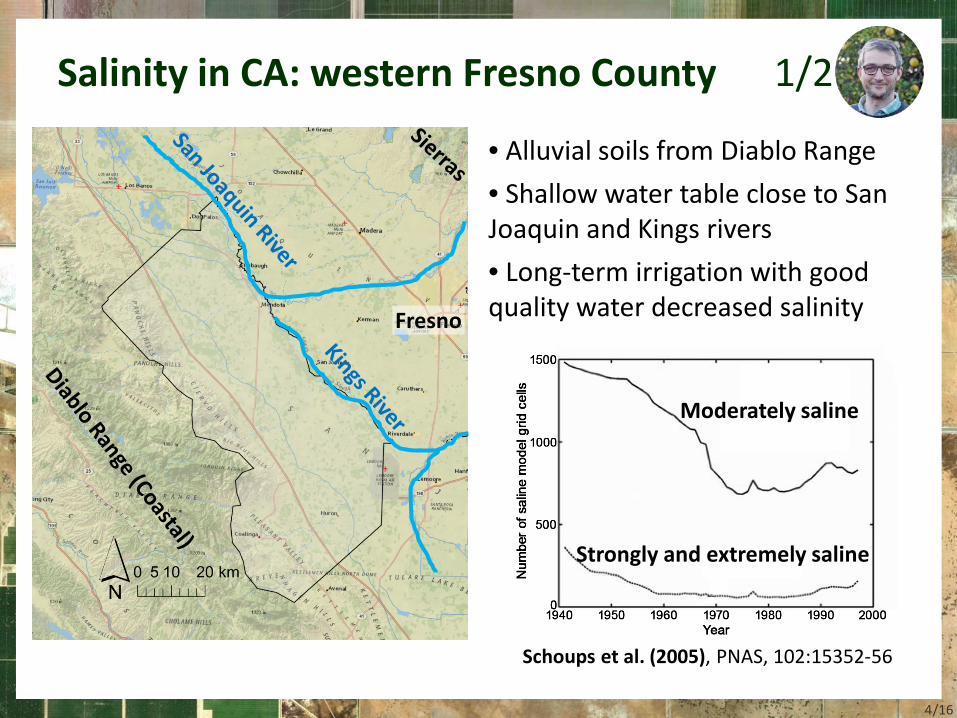
Salinity in CA: western Fresno County 1/2
Fresno
• Alluvial soils from Diablo Range • Shallow water table close to San Joaquin and Kings rivers• Long-term irrigation with good quality water decreased salinity
Schoups et al. (2005), PNAS, 102:15352-56
Moderately saline
Strongly and extremely saline

5/16
Salinity in CA: western Fresno County 2/2
NRCS - Soil Survey Geographic database (SSURGO)Harradine (1950)
~1945

6/16
What happens when irrigation ceases in these areas,e.g., California multi-year drought (2011-2015)?
• Cuts in surface water allocations
• Increased pumping and use of lower quality ground waters (high salinity, high Sodium Adsorption Ratio)
Increased salinization of soil
Decreased soil permeability
Land subsidence
• Increase area of fallow farmland
Scudiero et al. (2017), Calif Agr, 71: 231-238using Cropland Data Layer
7/16
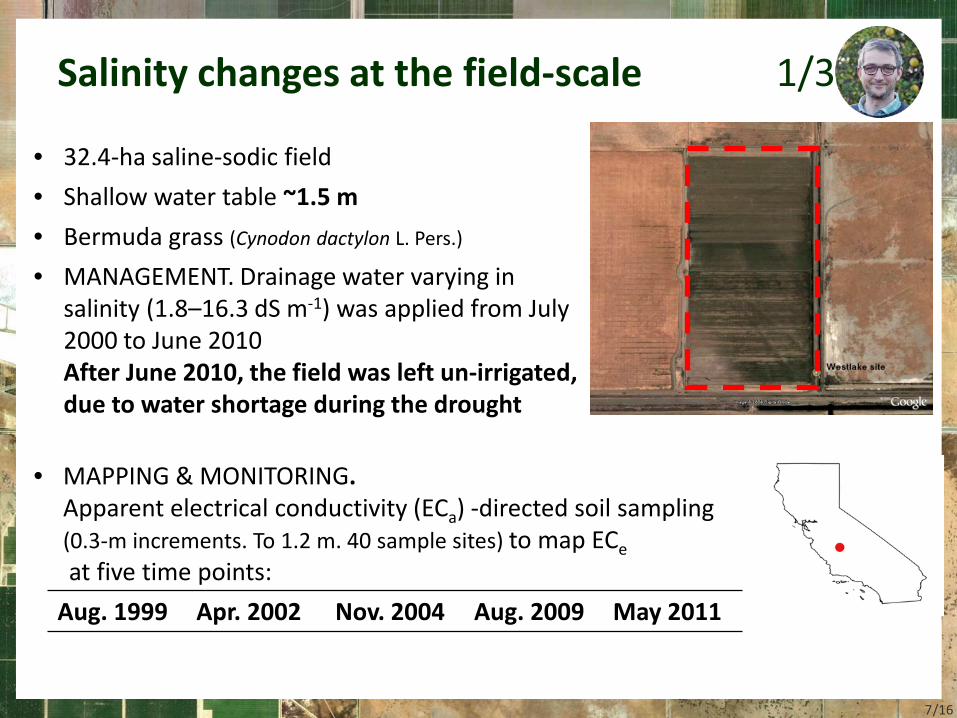
Salinity changes at the field-scale 1/3
• 32.4-ha saline-sodic field• Shallow water table ~1.5 m• Bermuda grass (Cynodon dactylon L. Pers.)
• MANAGEMENT. Drainage water varying in salinity (1.8–16.3 dS m-1) was applied from July 2000 to June 2010After June 2010, the field was left un-irrigated, due to water shortage during the drought
• MAPPING & MONITORING. Apparent electrical conductivity (ECa) -directed soil sampling (0.3-m increments. To 1.2 m. 40 sample sites) to map ECeat five time points:
Aug. 1999 Apr. 2002 Nov. 2004 Aug. 2009 May 2011

8/16
Drainage water reuse was shown to reclaim non-productive saline-sodic soils, bringing them back into agricultural production
Irrigation terminated in 2010/2011 because of water shortage (drought). The reclaimed field quickly returned (less than 2 years) to its original saline-sodic condition due to shallow water table at 1.5 m
March 20, 2000 March 24, 2004 April 8, 2010 August 22, 2012
Corwin (2012), J Environ Monit, 14:1576–1596
MEAN
Salinity changes at the field-scale 2/3

9/16
Salinity changes at the field-scale 3/3
• Important to understand the spatiotemporal dynamics of
soil salinity trends working with uncertain water
availability
• At the field scale, surveys of apparent electrical
conductivity and soil sampling can be used as expedited
and economically feasible means for monitoring salinity
changes
• How can these changes be monitored at broader scales?
10/16
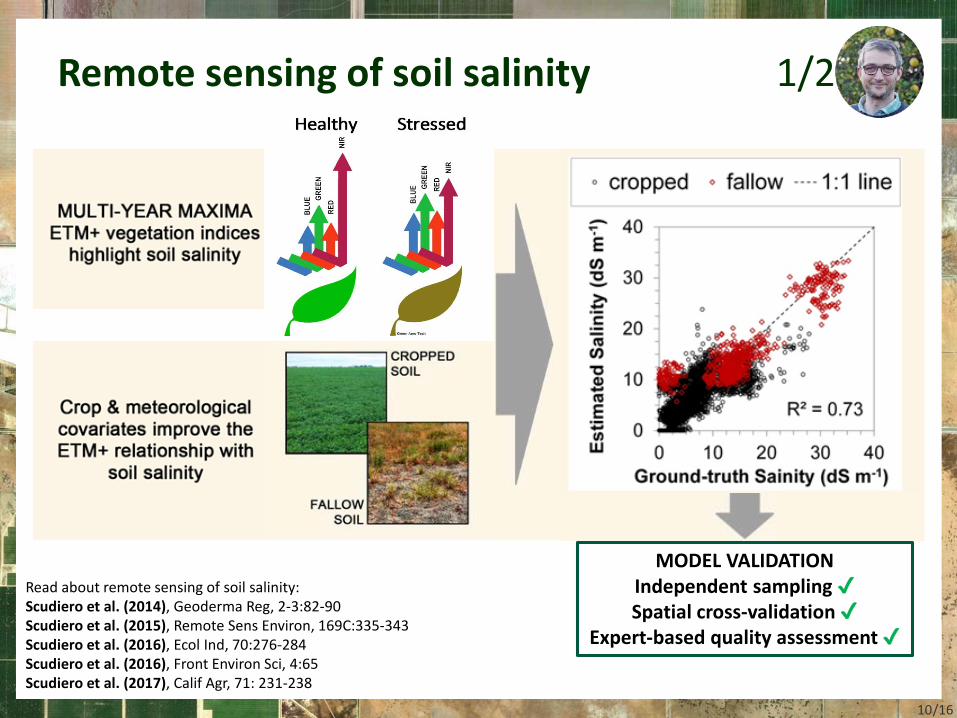
Remote sensing of soil salinity 1/2
Read about remote sensing of soil salinity:Scudiero et al. (2014), Geoderma Reg, 2-3:82-90Scudiero et al. (2015), Remote Sens Environ, 169C:335-343Scudiero et al. (2016), Ecol Ind, 70:276-284Scudiero et al. (2016), Front Environ Sci, 4:65Scudiero et al. (2017), Calif Agr, 71: 231-238
MODEL VALIDATIONIndependent sampling ✔Spatial cross-validation ✔
Expert-based quality assessment ✔
11/16
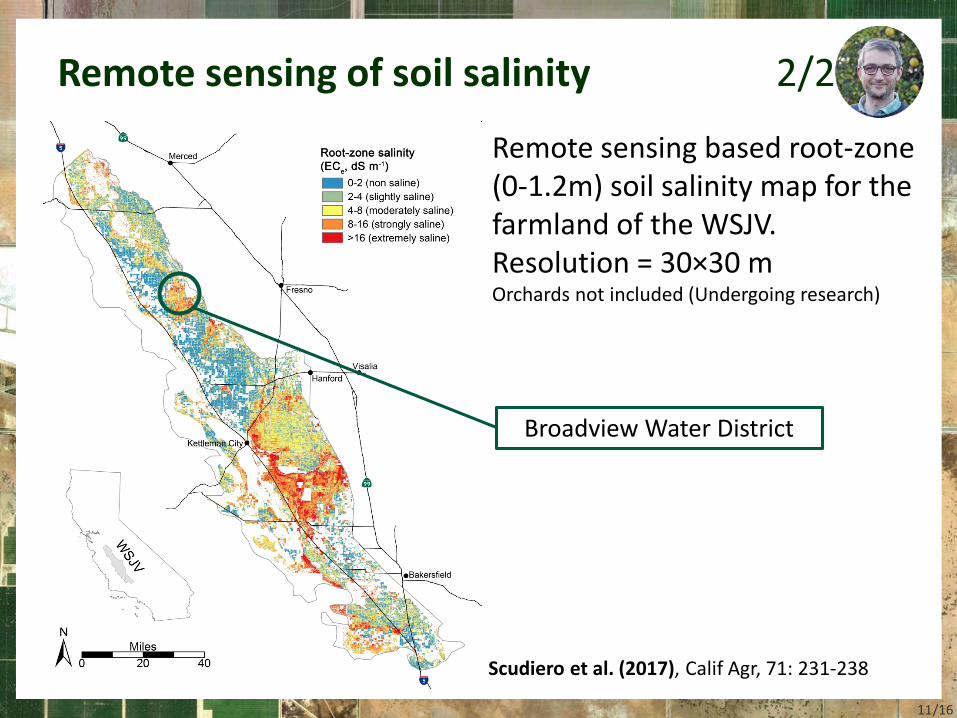
Remote sensing based root-zone (0-1.2m) soil salinity map for the farmland of the WSJV. Resolution = 30×30 mOrchards not included (Undergoing research)
Remote sensing of soil salinity 2/2
Broadview Water District
Scudiero et al. (2017), Calif Agr, 71: 231-238

12/16
Salinity changes at the landscape-scale: Broadview Water District 1/2• 2400 ha in Fresno County, CA
• Proximity to San Joaquin River, shallow water table
Wichelns et al. (2002), Irrigat Drain Syst, 16: 1–14
• 1949, strongly saline
• 1992, mostly slightly and moderately saline
• Highly productive farmland
• Irrigated farmland until spring 2006
• Then became fallow land(water rights were sold)

13/16
1991 map based on ECa-ECe calibrationCorwin et al. (1999) J Environ Qual 28:471-480
2013 map based on remote sensing
Field average salinityTotal changes +43%
Non significant changes observed in strongly and extremely saline fields
Remarkable changes for non-saline and slightly saline fields (mean change +97%)
all the non-saline & slightly saline soils in 1991 have become moderately and strongly saline in 2013
Salinity changes at the landscape-scale: Broadview Water District 2/2
14/16
Take home messages
• Water availability –induced changes in farmland
management can lead to substantial impairment of
soil quality in short times (< 18 months)
• For region-wide assessment, temporal analysis of
crop remote sensing is a viable approach to monitor
long term (e.g., 10 years) soil salinity changes
15/16
Future research challenges
• Improve modeling to support short time salinity
changes monitoring and prediction (multi-platform
remote sensing & hydrogeological modeling)
• Expand modeling to wider extents: California, USA,
and global
16/43
Thanks for listening,happy World Soil Day!
Elia Scudiero, PhDUC Riverside, Environmental Sciences Department
& USDA-ARS, US Salinity [email protected]
https://sites.google.com/site/scudieroe/