Embed Size (px)
Citation preview

Contents lists available at ScienceDirect
Soil Dynamics and Earthquake Engineering
journal homepage: www.elsevier.com/locate/soildyn
Centrifuge tests to assess seismic site response of partially saturated sandlayers
Morteza Mirshekari, Majid Ghayoomi⁎
Department of Civil and Environmental Engineering, University of New Hampshire, 33 Academic Way, Durham NH 03824, United States
A R T I C L E I N F O
Keywords:Seismic site responseUnsaturated soilsCentrifuge modeling
A B S T R A C T
Seismic response of unsaturated soil layers may differ from that of saturated or dry soil deposits. A set ofcentrifuge experiments was conducted to study the influence of partial saturation on seismic response of sandlayers under scaled Northridge earthquake motion. Steady state infiltration was implemented to control andprovide uniform degree of saturation profiles in depth. The amplification of peak ground acceleration at the soilsurface was inversely proportional to the degree of saturation, especially in low period range. The cumulativeintensity amplification of the motion was also higher in unsaturated soils with higher suctions. The lateraldeformation and surface settlement of partially saturated sand with higher stiffness were generally lower thanthat in dry soil. Although neglecting the effect of partial saturation in sand layers might be conservative withrespect to seismic deformations, it may result in underestimating the surface design spectra.
1. Introduction
Seismic waves generated by earthquakes often travel through soilswith different mechanical and hydraulic characteristics where they canbe dramatically altered in terms of intensity, frequency content, andduration. This transition is commonly evaluated using “Site ResponseAnalysis”, which is a crucial step toward seismic design of soil-structuresystems. Applications of site response analysis include development ofdesign response spectra for surface structures, estimating seismicallyinduced stresses, strains, and settlements, and liquefaction hazardassessment. Local site conditions such as soil density, plasticity index,stiffness, and damping can significantly affect seismic site response [1–8]. Thus, ignoring the effects of changes in the site conditions may leadto inaccurate assessment of the site response.
The role of local site condition and the intensity of rock motion inthe site response have been highlighted using fully monitored andinstrumented sites during past earthquakes [1,4–15]. In general, lowersite amplification factors were observed during earthquakes withhigher bedrock motion intensities [8,11–15]. This could be attributedto the nonlinear stress-strain behavior of soils and higher dampingvalues as a result of higher induced strain levels. The motionamplification was, also, found inversely proportional to the squareroot of shear wave velocity as a representative measure of local siteconditions [1,4–7,16]. Data obtained from instrumented sites understrong ground motions (e.g. [17,18]) as well as physical modelingexperiments (e.g. [19,20]) can be used to develop guidelines for site
response assessment. Traditionally, different methods have beenemployed to consider the effects of local site conditions and motionintensity in the surface motion evaluation, ranging from simplifiedprocedures regulated by seismic provisions [21–23] to more complexsite-specific ground response analysis for sensitive seismic designsusing available software [24–29]. In current seismic provisions thelocal site condition is reflected through site classification system usingan average shear wave velocity of the top 30 m of the soil profile (Vs)(Table 1).
Degree of water saturation is among the parameters that influencethe seismic response of soil layers [30]. Inter-particle suction inpartially saturated soils increases the effective stresses on the grainskeleton [31]. This, in turn, yields to different soil dynamic propertiesincluding small-strain and strain-dependent shear modulus and damp-ing [32–43]. As a result, seismic wave propagation mechanisms mayvary in partially saturated soil layers [44] that would lead to a differentseismic site response [30,45–49]. Soils in either dry or fully saturatedconditions have been believed to result in more conservative solutionsbecause matric suction in unsaturated soils increases the groundstiffness. Therefore, partial saturation has not been directly consideredin the state-of-the-practice site response analysis. However, recentinvestigations on the site response in unsaturated soils showed that thisassumption might not be always reasonable [47–49]. Further, theinfluence of the degree of saturation on seismic response analysis isoften considered by incorporating the in-situ measured shear wavevelocity of shallow unsaturated soil layers. However, the extent of this
http://dx.doi.org/10.1016/j.soildyn.2017.01.024Received 9 August 2016; Received in revised form 28 November 2016; Accepted 11 January 2017
⁎ Corresponding author.E-mail address: [email protected] (M. Ghayoomi).
Soil Dynamics and Earthquake Engineering 94 (2017) 254–265
0267-7261/ © 2017 Elsevier Ltd. All rights reserved.
MARK

influence might be beyond the suction-dependency of the dynamic soilproperties where the wave propagation mechanisms may vary [45]. Inaddition, soil properties may differ between the time of the construc-tion and prior to the earthquake due to the seasonal fluctuation ofwater table. Thus, recognizing this difference would be essential inassessing the uncertainty in projected site response.
Yang [45] analytically studied the frequency-dependent amplifica-tion of inclined vertically propagated shear waves (SV waves) in soillayers overlying bedrock. The results indicated that a slight decrease inthe degree of saturation of fully-saturated soil layers causes a dramaticdifference in vertical amplification of the SV waves. Specifically, forregular earthquake frequencies, unsaturated soils may lead to a highervertical amplification than saturated soil layers. D’Onza et al. [46]implemented the small-strain shear modulus and damping obtainedfrom suction-controlled resonant column tests in a series of numericalsite response analyses. Suction was found to significantly affect thenatural frequency and Peak Ground Acceleration (PGA) amplificationfactor in clayey silt and silty sand layers. According to their numericalstudy, the natural frequency of the soil layers increased in highersuction values whereas PGA amplification factor was reduced.Ghayoomi et al. [30] studied seismically induced settlements inpartially saturated sand by applying sinusoidal cyclic loads to sandlayers in a set of suction-controlled centrifuge tests using steady-stateinfiltration technique [50]. The least amount of surface settlementoccurred in middle range degrees of saturation due to the increase inshear modulus. Moreover, they observed a maximum 20% increase inPGA amplification factor in unsaturated sand with respect to the one indry condition [47].
Recently, Ghayoomi and Mirshekari [48] and Mirshekari andGhayoomi [49] numerically studied the seismic response of partiallysaturated sand and silt layers using site response software DeepSoil[24]. In the absence of any available numerical procedure to accountfor partial saturation, this influence was investigated by adjusting thesoil unit weight and effective stress for any given degree of saturation.Changes of the effective stress in unsaturated soils, in turn, altered soildynamic properties including small-strain and strain-dependent shearmodulus and damping. Accordingly, partial saturation in the soil layersappeared to considerably influence the site response, where the extentof this effect was a function of soil type as well as induced motioncharacteristics. For example, partial saturation in sandy soils with low-range suction level (e.g. 10 kPa) resulted in higher amplifications andlateral deformations whereas in silty soils with high suction range (e.g.70 kPa) led to lower amplifications and lateral deformations incomparison with those of dry soil layers.
Despite the proven influence of the degree of saturation on thedynamic soil properties and the site response, well-documented field orlaboratory seismic site response data in partially saturated soils are stillneeded. Centrifuge physical modeling of free-field seismic groundresponse using a “degree of saturation-controlled” system is of a greatvalue to validate this effect and to calibrate future numerical andanalytical predictive models. This paper describes the adaptation andmodification of an experimental setup to control the degree of
saturation in a geotechnical centrifuge and its application to studyseismic site response of partially-saturated soil layers. Furthermore,the effect of partial saturation on the site response of a sand layer isinvestigated and discussed in terms of different motion characteristicsincluding PGA amplification factor (FPGA), low-period and mid-periodamplification factors (Fa and Fv, respectively), 5% damped spectralacceleration, Arias intensity (Ia), lateral deformation, and seismicallyinduced settlements.
2. Suction control in geotechnical centrifuge
Modeling unsaturated soils under high gravitational acceleration isa challenging task where controlling suction or the degree of saturationis the key to any systematic investigation involving partially saturatedsoils. Centrifuge modeling of unsaturated fine-grained soils could beaccomplished by using methods such as compacting soils with a targetdegree of saturation [51] or in-flight free drainage of an initiallysaturated specimen [52]. For sand layers, however, centrifugationalong with free drainage leads to very low degrees of saturation dueto their relatively higher permeability values. To address this problem,steady state infiltration was implemented in this study to generateuniform degree of saturation profiles inside a geotechnical centrifuge.This approach was devised from centrifuge permeameters [53–55],mainly used to streamline measurements of hydraulic parameters inunsaturated soils. Recently, similar steady state infiltration method wassuccessfully incorporated in a laminar container inside a large armcentrifuge to study seismically induced settlements in partially satu-rated sand layers [50].
Dell’Avanzi et al. [56] analytically solved Richards' equation ofwater flow in unsaturated soils [57] for steady state infiltration, underhigher gravitational field inside a geotechnical centrifuge. The suctionprofile along the depth of the specimen during steady state infiltrationcan be estimated using the following equations [56]:
⎡⎣⎢⎢
⎤⎦⎥⎥
⎛⎝⎜
⎞⎠⎟ψ
aln e v
N kif v
N ke=− 1 − + >0
ln vN k e aρ z ω r z
m
r sat
m
r sat
aψ( + − ( − 2 )) −mr sat
aψw m
m− 0 2 0 0
(1a)
⎡⎣⎢⎢
⎤⎦⎥⎥
⎛⎝⎜
⎞⎠⎟ψ
aln e v
N kif v
N ke=− 1 − − + <0
ln vN k e aρ z ω r z
r sat
m
r sat
aψ( + − ( − 2 )) −mr sat
aψw m
m− 0 2 0 0
(1b)
where a is the Gardner's hydraulic conductivity parameter in kPa−1
[58], e is the natural base of logarithms, vm is the discharge velocity inm/s, zm is height of any location in the specimen from its bottom in m,Nr is the g-level depending on zm parameter, ksat is the soil hydraulicconductivity in saturated condition, ψ0 is suction at the bottom of thespecimen defining the boundary conditions, and ρw is the density ofwater in kg/m3. Then, the degree of saturation profiles could beobtained using hydraulic constitutive models relating the degree ofsaturation and matric suction; Soil Water Retention Curves (SWRC)(e.g. van Genuchten [59]). Applying steady state infiltration in higherg-levels results in a uniform suction with height with small transitionzones. For example, profiles of the degree of saturation are illustratedin Fig. 1(a) and (b) for different discharge velocities and g-levels,respectively, during the centrifugation of a 22.86 cm of model Ottawasand.
Dell’Avanzi et al. [56], also, determined suction scaling factor forsteady state flow condition where a prototype infiltration is to berepresented by a model with the length and discharge velocity scalingfactors of 1/N and N, respectively. Comparison of prototype and modelinfiltration equations led to a suction scaling factor of unity forrelatively uniform acceleration fields (i.e. ratio of centrifuge arm'slength to the length of specimen is greater than 10). For the case ofsmaller centrifuges, however, the suction scaling factor becomes
Table 1Site classification (after NEHRP Provisions [21]).
NEHRPcategory
Description Time-weighted average
shear wave velocity (V )s
A Hard rock > 1500 m/sB Firm to hard rock 760–1500 m/sC Dense soil, soft rock 360–760 m/sD Stiff soil 180–760 m/sE Soft clays < 180 m/sF Special study soils, e.g. liquefiable
soils, sensitive clays, organic soils,soft clays > 36 m thick
M. Mirshekari, M. Ghayoomi Soil Dynamics and Earthquake Engineering 94 (2017) 254–265
255

slightly different leaning toward lower values within the upper portionof the profile (this is observed in the analytical solutions in Fig. 1(b)).This scaling factor is solely for an infiltration problem, where the sameprototype suction profile would be achieved in a model (in largecentrifuges) undergoing a N-times increased discharge velocity. Thisconcept, however, should not be considered when mechanical behaviorof soils is studied. When suction stresses that were measured in themodel should be projected to prototype values, matric suction in thecentrifuge has to be scaled using the conventional pressure scalingfactor (i.e. Nσ=1). However, in this study matric suction was indirectlyobtained from the measured degrees of saturation, so the interchange-able application of soil water retention in model and prototype wascarefully considered. Since SWRC is not a function of g-level [60,61]measured degrees of saturation in centrifuge experiments can be linkedto matric suction using 1-g SWRC.
3. Experimental program
3.1. Experimental setup
3.1.1. Centrifuge, shaking table, and containerThe recently renovated 5 g-ton centrifuge at the University of New
Hampshire was used in this investigation [62]. The arm radius is 1 mfrom the center of rotation to the platform in its fully extendedposition. The centrifuge is equipped with an in-flight shaking tablethat is capable of imposing harmonic or seismic displacement timehistories. A hydraulic servo valve controlled by National Instrumentssystem operates the table. Due to servo valve limitations, the currentsystem has an analog displacement threshold of 10-mm. Four fluidsupply lines, two devoted to the hydraulic fluid and two to theinfiltrating water, were passed through the centrifuge slip ring. Alaminar container was used herein to avoid adverse boundary effects onthe shear wave propagation [63]. The container consists of 19rectangular aluminum laminates, each 12.7 mm thick, which areseparated using cylindrical bearing with negligible frictional resistance[64]. The inner dimensions of the box are 35.5 cm in length, 17.7 cm inwidth, and 25.4 cm in height with the ratio of length to width as 2. Aschematic of the container is shown in Fig. 2. In order to allow for freedrainage of water, the container base plate was replaced with anoutflow control aluminum plate with a network of 14 drainage ports.
3.1.2. Infiltration setupThe basic procedure to apply steady-state infiltration inside the
laminar container in this study is similar to Ghayoomi et al. [50].
Inflow water was supplied from an 80-gallons pressurized tank locatedoutside the centrifuge. An inlet slip-ring port was deployed to route thewater to 8 fog-spray nozzles. Three sets of BETE nozzles were utilizedin this investigation to obtain various discharge rates and, therefore,different degree of saturation profiles. 1/8 PJ10, 1/8 PJ20, and 1/8PJ40 nozzles were used for degrees of saturation lower than 45%,between 45% and 60%, and higher than 60%, respectively. In order tocontrol the inflow rate, a solenoid valve was employed in conjunctionwith an ultra-precision needle valve ahead of the nozzles. The solenoidvalve was used to open the water flow during the centrifugation whilethe needle valve was in charge of controlling the inflow rate. Drainagewas conducted through four of the outflow ports opened by miniaturesolenoid valves. The outflow water was guided to four drainage tanksmounted on the front, back, and bottom of centrifuge platform (Fig. 2).
3.1.3. InstrumentationInstrumentation setup comprises of dielectric sensors, acceler-
ometers, and LVDTs to measure volumetric water content, accelera-tion, and displacement, respectively. Four EC-5 dielectric sensors fromDecagon Devices were placed at different depths (i.e. 1.6, 6.3, 12.4, and18.1 cm in model scale from the top of the soil surface). Several PCBPiezoelectronics accelerometers were used to record acceleration timehistories along the depth of the specimen (i.e. at surface, bottom anddepths of 5.7, 11.4, and 17.1 cm in model scale from the top of thespecimen as shown in Fig. 2). Two accelerometers were placed apartfrom each other at some levels to ensure the uniformity of motionacross the container. In addition, one accelerometer was mounted tothe base plate of the container to measure the actual applied motion.Two MHR500 LVDTs and three MHR250 LVDTs were mounted on thetop and side of the specimen to measure the vertical and lateraldeformations, respectively.
3.2. Material
F-75 Ottawa sand was used in this study as it is fine-enough to holdsuctions up to 10 kPa and yet permeable-enough to permit the steady-state infiltration. The grain size distribution of the sand is illustrated inFig. 3(a). The sand was dry-pluviated in the container to reach thetarget void ratio of 0.66. Soil Water Retention Curve (SWRC) of thissand measured by Mirshekari and Ghayoomi [49] and Le andGhayoomi [43] are shown in Fig. 3(b) alongside fitted curves for bothdrying and wetting paths using van Genuchten's equation [59].Geotechnical physical and hydraulic properties of the sand are sum-marized in Table 2. The Hydraulic Conductivity Function (HCF) fitting
Fig. 1. Analytical degree of saturation profiles during steady-state infiltration (after Dell’Avanzi et al. [56]): (a) for different discharge velocities; (b) for different g-levels.
M. Mirshekari, M. Ghayoomi Soil Dynamics and Earthquake Engineering 94 (2017) 254–265
256

parameter (αG) necessary for steady state infiltration solution wasfound to be 2.5 kPa−1 using van Genuchten-Mualem model [59].
3.3. Testing procedures
3.3.1. Sample preparationLoose specimens were prepared inside the laminar container while
a plastic membrane was glued to the base plate in order to preventleakage of sand and water from the gaps between laminates. Inaddition, a gravel layer was placed at the bottom of the sand specimento provide a saturated boundary condition, separated from the sandlayer using geotextile filters. The final specimen height was 22.86 cm inmodel scale with an approximate relative density of 45%.Accelerometers and dielectric sensors were placed at different depthsof the soil layer when needed (Fig. 2). Upon completing the pluviation,spray nozzles and vertical LVDTs were mounted on the sensor racksatop the container sitting on the in-flight shaking table. Moreover,horizontal LVDTs were placed on a side frame measuring the displace-ments of the laminates. The specimen was, then, saturated (forsaturated and unsaturated tests) by passing de-aired water throughtwo drainage ports on the base plate. A completely prepared andmounted specimen is shown in Fig. 4. A slight negligible change in therelative density was measured due to the saturation and centrifugation.
The centrifuge was spun up to 50-g acceleration measured at themiddle of the soil layer. Upon reaching the target g-level, the inflow andoutflow solenoid valves were opened to generate a steady-stateinfiltration within the specimen. Different discharge rates were ob-
tained in this study by varying the types of nozzles and opening of theneedle valve (i.e. vm/ksat between 1.5×10⁻⁴ to 2.4×10⁻³).Consequently, various uniform degree of saturation profiles wereobtained ranging from 32% to 68% (corresponding to matric suctionsfrom 3.9 to 4.9 kPa) within a short time span after starting theinfiltration (e.g. about 1 min for all the specimens). Some of the
Fig. 2. Instrumentation in the laminar container modified for steady-state infiltration: (a) Side-view Schematic (b) Front-view Schematic.
Fig. 3. Properties of F-75 Ottawa sand: (a) Grain size distribution; (b) SWRC.
Table 2Physical and hydraulic properties of F-75 Ottawa sand.
Parameter Value
Coefficient of curvature, Cc 1.71Coefficient of uniformity, Cu 1.01Specific gravity, Gs 2.65D50 (mm) 0.182Dry density limits, ρD-min, ρD-max (kg/m
3) 1469, 1781Void ratio limits, emin, emax 0.49, 0.80Relative density, Dr 0.45Friction angle (deg) 40Poisson's ratio, υ 0.38Saturated Hydraulic Conductivity, ks (cm/s) 6×10⁻⁴
van Genuchten's avG parameter for Drying Path (kPa−1) 0.25van Genuchten's NvG parameter for Drying Path 9Residual volumetric water content for Drying Path, θr 0.07Saturated volumetric water content for Drying Path, θs 0.392van Genuchten's avG parameter for Wetting Path (kPa−1) 0.7van Genuchten's NvG parameter for Wetting Path 5Residual volumetric water content for Wetting Path, θr 0.07Saturated volumetric water content for Wetting Path, θs 0.322
M. Mirshekari, M. Ghayoomi Soil Dynamics and Earthquake Engineering 94 (2017) 254–265
257

achieved degrees of saturation and their corresponding dischargevelocities are shown in Fig. 5 along with the corresponding analyticalsolutions (Eq. (1)). Although a somewhat uniform degree of saturationprofile was reached across the height of the specimen, the bottommostsection (about 5% in length) still had a transient degree of saturationvarying from the fully saturated boundary condition to the targetdegree of saturation. This length was aimed to become minimal byincreasing the g-level (Fig. 1b). The transition zone has to beconsidered when interpreting and applying the results of this study.After a constant degree of saturation was achieved throughout thespecimen, the scaled earthquake motion was applied to the sand layerand the response was captured. Conventionally, a more viscous porefluid with similar mechanical properties with water has been imple-mented to address the time scaling conflicts between dynamic anddiffusion problems in the centrifuge [65]. However, the mechanisms ofdynamic suction variations mainly rely on distortions of water menisciduring seismic events and differ from those of excess pore waterpressure generation and dissipation. The unsaturated tests in this study
were performed in degrees of water saturation much lower than one(for fully saturated) to avoid the time scaling conflict for dynamicproblems in the centrifuge models. In addition, the steady stateinfiltration technique leverages the accelerated flow of the water inthe soil in high g-level, which would not be the case for fluids withhigher viscosity.
3.3.2. Input earthquake motionNorthridge earthquake motion, 1994, captured at WPI station was
selected as the desired motion in this investigation, as it encompasses awide range of frequency contents. The acceleration time history of theoriginal recorded motion was scaled down to meet the shaking tablelimits (i.e. PGA was scaled from 0.42g to 0.3g in prototype scale). Thefrequencies higher than 8 Hz in prototype scale were filtered from this“desired” motion to obtain the “target” motion for this investigation. Asa common practice, in-flight shaking tables are calibrated for a specificearthquake motion by matching the target and the “achieved” motionson the shaking table [66,67]. The method introduced by Mason et al.[67] was used through which the “command” motion sent to theshaking table was modified using a set of frequency response analysis,so the achieved motion becomes approximately similar to the targetmotion. Different characteristics of the final achieved motion includingacceleration time history, Arias intensity, Fourier amplitude, and 5%damped spectral acceleration are illustrated in Fig. 6. Although thesame motion was imposed to all the specimens with different degrees ofsaturation, the input motions recorded at the bottom accelerometerwere slightly different. This could be due to the different specimenweights and nonlinear shaking table performance.
4. Results and discussion
The centrifuge experiments were performed on three dry specimens(D1, D2, and D3), eleven unsaturated specimens (specified with theletter U followed by the degree of saturation) with degrees of saturationvarying between 32% and 68%, and one saturated (S) specimen. Thecaptured acceleration and displacement time histories were post-processed to obtain various motion characteristics. Then, the influence
Fig. 4. Fully assembled experimental setup.
Fig. 5. Experimentally developed profiles of degree of saturation along with theanalytical solutions (after Dell’Avanzi et al. [56]).
M. Mirshekari, M. Ghayoomi Soil Dynamics and Earthquake Engineering 94 (2017) 254–265
258

of the degree of saturation on the seismic response was investigated interms of different motion parameters including PGA, frequency-dependent motion amplification, cumulative intensity amplification,lateral deformation, and seismic settlement. The following results areall presented in prototype scale unless specified.
4.1. Peak ground acceleration amplification
PGA amplification factor (FPGA) was calculated at different depthsusing the following equation:
F PGAPGA
=PGAbase (2)
where PGA and PGAbase are the maximum accelerations at a givendepth and at the bottom of the specimen (considered as bedrockmotion herein), respectively.
As previously mentioned, PGAbase slightly varied among differenttests that, in turn, influenced the FPGA values. In order to eliminate thiseffect, a relationship was formulated to normalize all the base motionsto a reference one. To find such a correlation, FPGA values were graphedover PGAbase for tests with approximately similar degrees of saturation;e.g. D1, D2, and D3 and U48, U49, and U50; shown in Fig. 7. Knowingthe expected trend from previous studies [8,11–15], FPGA was setinversely proportional to PGAbase for the given limited range ofacceleration. The following linear correlation was developed wherethe slope of the line was similar for dry and partially saturated cases:
F PGA d= −5. 75 × +PGA base (3)
where the parameter d indicates the influence of degree of saturation.The FPGA values were modified by moving along the same slope suchthat a reference base PGA of 0.3g was achieved for all the tests basedon the abovementioned linear relationship:
Fig. 6. Applied scaled Northridge earthquake motion characteristics: (a) Acceleration time history; (b) Arias intensity; (c) Fourier amplitude; (d) 5% damped spectral acceleration.
Fig. 7. Correlation of PGA amplification factor (FPGA) and base peak ground acceleration(PGAbase).
M. Mirshekari, M. Ghayoomi Soil Dynamics and Earthquake Engineering 94 (2017) 254–265
259
F F PGA= −5. 75 × (0. 3− )PGA Mod PGA base, . (4)
This modification could increase or decrease the FPGA depending onthe values of PGAbase (e.g. for the test U66 with PGAbase of 0.2828 theFPGA was modified from 1.212 to 1.1131). Modified surface FPGA valuesfor different degrees of saturation are shown in Fig. 8(a). While theamplification factors for dry tests were approximately one, the un-saturated soil condition led to higher amplification factors at surfaceespecially at lower degrees of saturation (with an average increase of16%). The amplification factor for the case of fully saturated sand layerwas expectedly lower than the ones in dry and unsaturated sand layersdue to the de-amplification of motion in possibly fully- or partially-liquefied ground (the liquefaction occurrence was not assured due tothe absence of pore water pressure transducers). Therefore, the focus ofthis paper has been mainly on comparing the response of dry andunsaturated sand layers.
Amplification factor at the soil surface was shown to be inverselyproportional to the degree of saturation with a nonlinear pattern. Theamplification factor is somewhat constant for mid-level degrees ofsaturation where the change in suction is almost negligible (i.e.between 45% and 70% degrees of saturation). In addition, the code-based [21,22] amplification factor is demonstrated in Fig. 8(a) wherethe weighted-average shear wave velocity,Vs , was calculated using thefollowing formula:
∫V H
dz=s H
v01s (5)
where H is the soil layer thickness, z is the depth, and vs is the depth-dependent shear wave velocity resulted from small-strain shear mod-ulus values at each depth. The site class, thereafter, was estimatedusing Table 1 where regardless of the choice of the small-strainmodulus formula (i.e. [40,68,69]), a Class D was assigned. Also,estimating an average shear wave velocity for 30-m soil layer assuggested by the code or for 11.43-m soil layer in this study wouldyield to the same site class. Although partial saturation increased thePGA amplification, the code-suggested FPGA value for this case isconservatively higher than nearly all the experimental values. Thevalues suggested by seismic provisions were developed based upon alarge number of recorded data from the past earthquakes in differentsite conditions [70] while this study limited the testing conditions (e.g.uniform degree of saturation profiles; one type of sand, and oneearthquake motion) to evaluate the effect of partial saturation.
The observed higher amplification in unsaturated sand layer incomparison with the one in the dry condition is consistent with theones from simplified numerical site response analysis [48,49] andcentrifuge physical modeling under cyclic loads with equivalent PGA of0.55g and 0.65g [47]. However, Ghayoomi and McCartney [47] foundthe code-based amplification factors to be lower than the measuredFPGA values. This difference could be either a result of simulatingseismic motions using cyclic loads in Ghayoomi and McCartney [47] ordifferent suction-dependent site response mechanisms in very strongground motions such as continuous full cycles of dynamic loads.
Parameters influencing the site response could be simplisticallyexplored by inspecting the analytical solution to a linear Single Degreeof Freedom (SDOF) system under cyclic motion. This SDOF systemcould represent a uniform soil layer overlying bedrock. The maximumacceleration amplification ratio in such a system would be approxi-mated as follows [71]:
aa β
( ) ≈ 1( )+( )
surface
bedrockmax
Iπ
S1
2 (6)
where βS is the soil damping ratio and I is the rock/soil impedanceratio equal to γrVr/γsVs, in which γr and γs are the unit weights and Vr
and Vs are the shear wave velocities of the rock and soil, respectively.As the ratio of γr/γs is between 1.1 and 1.4 for majority of sites [70], the
Fig. 8. PGA amplification factor (FPGA) for sand layers with different (a) degrees ofsaturation; (b) matric suction; and (c) suction stress.
M. Mirshekari, M. Ghayoomi Soil Dynamics and Earthquake Engineering 94 (2017) 254–265
260

amplification ratio becomes a function of the shear wave velocity anddamping where both are influenced by motion intensity and local siteconditions. However, for sands, the shear wave velocity is mainly afunction of local site conditions while the damping is predominantlyaffected by the motion intensity [70]. Despite the useful insights gainedfrom the analytical solution to the dynamic response of the SDOFsystem, this simplified equation might not be used in real applicationswhere soil becomes nonlinear under relatively intense earthquakesespecially in layered grounds; e.g. Northridge region during the 1994earthquake [72]. Eq. (6), however, might be used to shed light ondifferent aspects of the effect of partial saturation on site responsewhere both parameters affecting the SDOF response (i.e. shear wavevelocity and damping) vary by changes of the degree of saturation.Shear wave velocity or small-strain shear modulus are increased inpartially saturated soils as a function of matric suction [38,40,73]. Onthe contrary, damping decreases while matric suction increases [41].Given the inversely proportional relations between the amplificationfactor and both shear modulus and damping in Eq. (6), the increase inshear wave velocity of unsaturated soils yields to lower amplificationwhereas the decrease in damping leads to higher amplification. As aresult, the influence of partial saturation on the site response should beholistically explored considering the interaction between the change inshear modulus and damping.
Shear modulus and damping are functions of their small-strainvalues and induced level of strain in soils. Small-strain shear modulusis proportional to the square root of effective stress in dry or saturatedsoils [68,69] while small-strain damping is correlated to the effectivestress raised to a much lower power (e.g. −0.08 according to Menq[74]). Therefore, the influence of the effective stress is more pro-nounced on shear wave velocity in comparison with damping, resultingin a general trend of lower amplification factors for stiffer sites [21].The presence of suction in unsaturated soils increases the effectivestress, however, the variations of small-strain dynamic properties fordifferent degrees of saturation might not only depend on the effectivestress [73]. Dong et al. [73] discussed that water can soften the soilmatrix in unsaturated soils by reducing the inter-particle friction thatcontradicts the added stiffness caused by the matric suction. Hence, theinfluence of damping and shear modulus on the site response maybecome comparable. Also, the extent of the influence of partialsaturation on the site response could vary in depth depending on thedominance of variations in either damping or shear modulus.
Further, the seismically induced strain level in soil layers plays animportant role in interpreting the acceleration amplification factors.Basically, higher intensity earthquake motion leads to higher strain-dependent damping and lower strain-dependent shear modulus. Then,the amplification factor decreases [11,12] as a result of the interactionof these two parameters. In unsaturated soil conditions, however, theinduced shear strains are affected not only by the intensity of themotion but also by the soil stiffening and lower damping. Depending onthe induced level of shear strain, the mobilized shear modulus anddamping in soil layers may vary and, consequently, alter the amplifica-tion factor.
Since matric suction increases the contact effective stresses inunsaturated soils, more insights might be gained by illustrating FPGA
versus matric suction, shown in Fig. 8(b). In addition, Lu et al. [75]discussed that it is the combined effect of the matric suction and thedegree of saturation that influence the behavior of unsaturated soils.They synthesized experimental data from shear or tensile strength testsand proposed “suction stress” parameter that could be practicallyresponsible for the mechanical behavior of unsaturated soils; asfollows:
σ = u − u(1+[α(u − u )] )
s a w
a wn 1− 1
n (7)
whereσs is the suction stress, ua and uw are pore air and pore waterpressures, respectively, and α and n are the parameters for the van
Genuchten [59] SWRC model. FPGA values are shown versus suctionstress in Fig. 8(c). Although the performed tests cover a wide range ofdegree of saturation, only a slight variation occurred in terms of matricsuction (i.e. from 3.9 to 4.9 kPa) while the suction stress expands therange from 0.8 to 2.3 kPa. The suction stress might be a betterpredictor of seismic soil behavior while the amplification factor wasnot coherently linked to the change in matric suction. Overall,unsaturated specimens showed a higher amplification factor at surface,however, FPGA decreases as suction stress increases.
In order to understand the variations of amplification factor alongthe depth, FPGA profiles are shown over the height of the sand layer fordifferent degrees of saturation in Fig. 9 (only for the tests with fiveaccelerometers in the middle array); where an average FPGA ispresented for the tests with similar degrees of saturation. The degreeof saturation imposed a depth-dependent influence on PGA amplifica-tion factor. Despite the observed trend at the soil surface, shown inFig. 8, FPGA values in depth of unsaturated sand layers were mostly(except for the lowest degree of saturation) lower than the ones of drysand. This difference can be associated with the coupled effects ofdepth-, strain-, and suction-dependent damping and shear modulus onmotion amplification pattern. For example, the suction stress results ina higher increase in the effective stress in shallow soils where totalstresses are low. Further, the inconsistent amplification profiles inunsaturated soil layers would imply more complex wave propagationmechanisms in unsaturated soils [45].
4.2. Frequency-dependent motion amplification
Surface to bedrock amplification of response spectra or Fourierspectra could be used to investigate the frequency-dependent amplifi-cation of seismic motions. Low-period and mid-period amplificationfactors are commonly evaluated as average values of Ratio of ResponseSpectra (RRS) or the ratio of Fourier spectra within a period orfrequency range; e.g. between 0.1–0.5 s and between 0.4 and 2 s forFa and Fv for the recorded data of Loma Prieta earthquake 1989,respectively [5]. An average value of RRS between 0.1–0.5 s and 0.6–2 s were used herein to calculate Fa and Fv, respectively, since for thespecific case of this study the values of RRS at 0.4 s do not representamplification at mid-term periods; as shown in Fig. 10. Fa and Fv
variations for different degrees of saturation and suction stresses areshown in Fig. 11. Both amplification factors were significantly higher atsoil surface in partially saturated specimens than the ones in drycondition. This clarifies that unsaturated condition yields to higheramplification at surface regardless of the period range. An average
Fig. 9. Profiles of PGA amplification factors (FPGA) for sand layers with different degreesof saturation.
M. Mirshekari, M. Ghayoomi Soil Dynamics and Earthquake Engineering 94 (2017) 254–265
261

increase of 19% and 6% were observed in Fa and Fv values ofunsaturated specimens than dry ones, respectively. This indicates amore significant influence of unsaturated condition on motion ampli-fication at low-period range. Since no strong correlation between the Fa
and Fv and PGAbase was found for the tests with similar degree of
saturation, the frequency-dependent amplification factors were notmodified with respect to the base motion. This explains the reason thatthe data was more scattered in terms of Fa and Fv in comparison withthe FPGA. In order to better compare the response of dry and
Fig. 10. Period range selection procedure for low- and mid-period amplification factors.
Fig. 11. Low-period amplification factors (Fa) for different: (a) degrees of saturation; and (b) suction stress. Mid-period amplification factors (Fv) for different: (c) degrees of saturation;and (d) suction stress.
Fig. 12. Ratio of Reponses Spectra (RSS) for selected tests for sand layers with differentdegrees of saturation.
M. Mirshekari, M. Ghayoomi Soil Dynamics and Earthquake Engineering 94 (2017) 254–265
262
unsaturated sand layers in terms of frequency-dependent amplifica-tion, 5% damped smoothed surface-to-base RRS graphs for selectedtests are shown in Fig. 12. The general higher motion amplification inunsaturated soil, more substantial in low period range, is discernable.
4.3. Cumulative intensity amplification
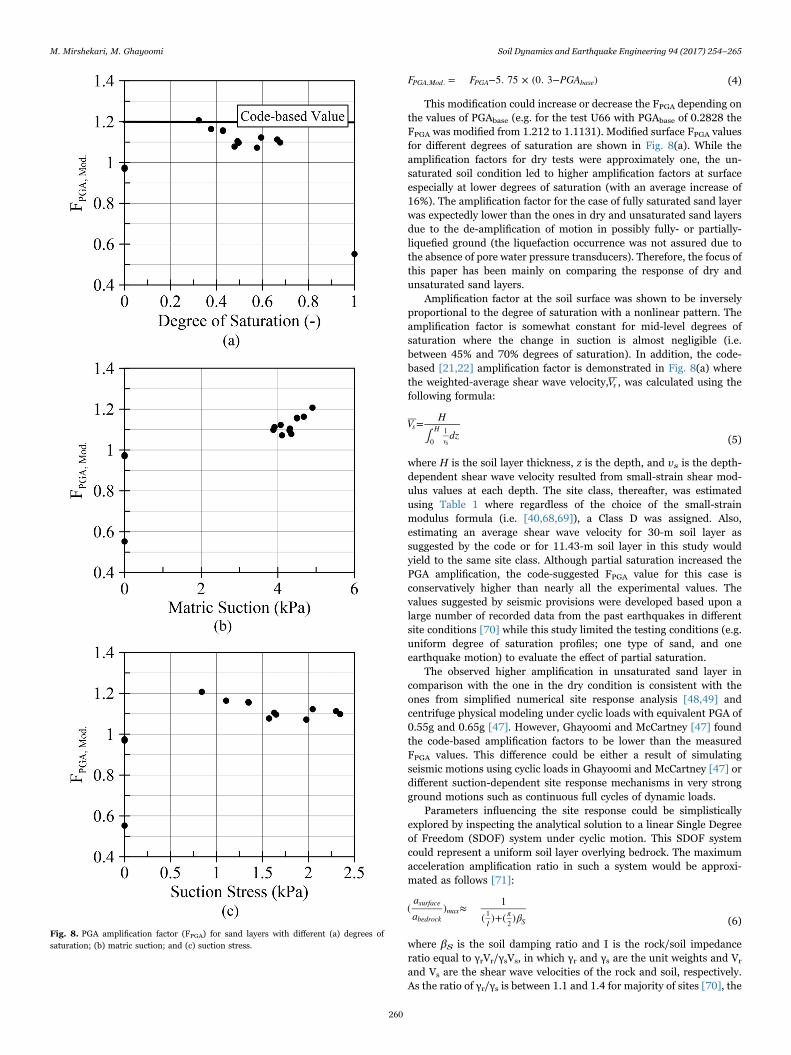
Arias intensity [76], a well-known cumulative intensity character-istic, was selected to represent the accumulated energy buildup duringa shaking event in sites with different degrees of saturation. Ratio of themaximum Arias intensity at the soil surface over the maximum Ariasintensity at the base was used to quantify the change in energy level ofthe motions. The variation of Arias Intensity ratio with the degree ofsaturation is shown in Fig. 13, enabling a comparison between theresponse of dry and unsaturated sand layers. To avoid misinterpreta-tion of the results only the tests with bedrock Arias intensity within a ±5% offset from the reference dry motion were shown. The presentedresults show an overall 6% increase in Arias Intensity amplification forunsaturated specimens where the acceleration was amplified differentlyin different frequency ranges.
4.4. Lateral deformation
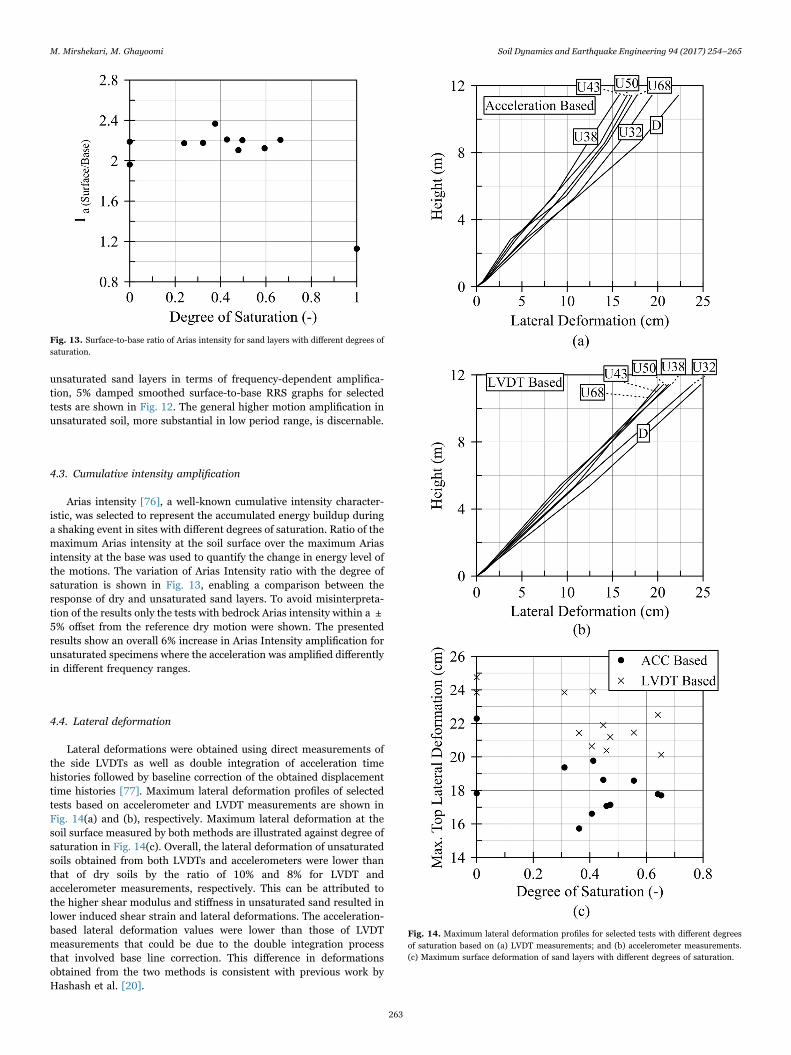
Lateral deformations were obtained using direct measurements ofthe side LVDTs as well as double integration of acceleration timehistories followed by baseline correction of the obtained displacementtime histories [77]. Maximum lateral deformation profiles of selectedtests based on accelerometer and LVDT measurements are shown inFig. 14(a) and (b), respectively. Maximum lateral deformation at thesoil surface measured by both methods are illustrated against degree ofsaturation in Fig. 14(c). Overall, the lateral deformation of unsaturatedsoils obtained from both LVDTs and accelerometers were lower thanthat of dry soils by the ratio of 10% and 8% for LVDT andaccelerometer measurements, respectively. This can be attributed tothe higher shear modulus and stiffness in unsaturated sand resulted inlower induced shear strain and lateral deformations. The acceleration-based lateral deformation values were lower than those of LVDTmeasurements that could be due to the double integration processthat involved base line correction. This difference in deformationsobtained from the two methods is consistent with previous work byHashash et al. [20].
Fig. 13. Surface-to-base ratio of Arias intensity for sand layers with different degrees ofsaturation.
Fig. 14. Maximum lateral deformation profiles for selected tests with different degreesof saturation based on (a) LVDT measurements; and (b) accelerometer measurements.(c) Maximum surface deformation of sand layers with different degrees of saturation.
M. Mirshekari, M. Ghayoomi Soil Dynamics and Earthquake Engineering 94 (2017) 254–265
263
4.5. Seismic settlement
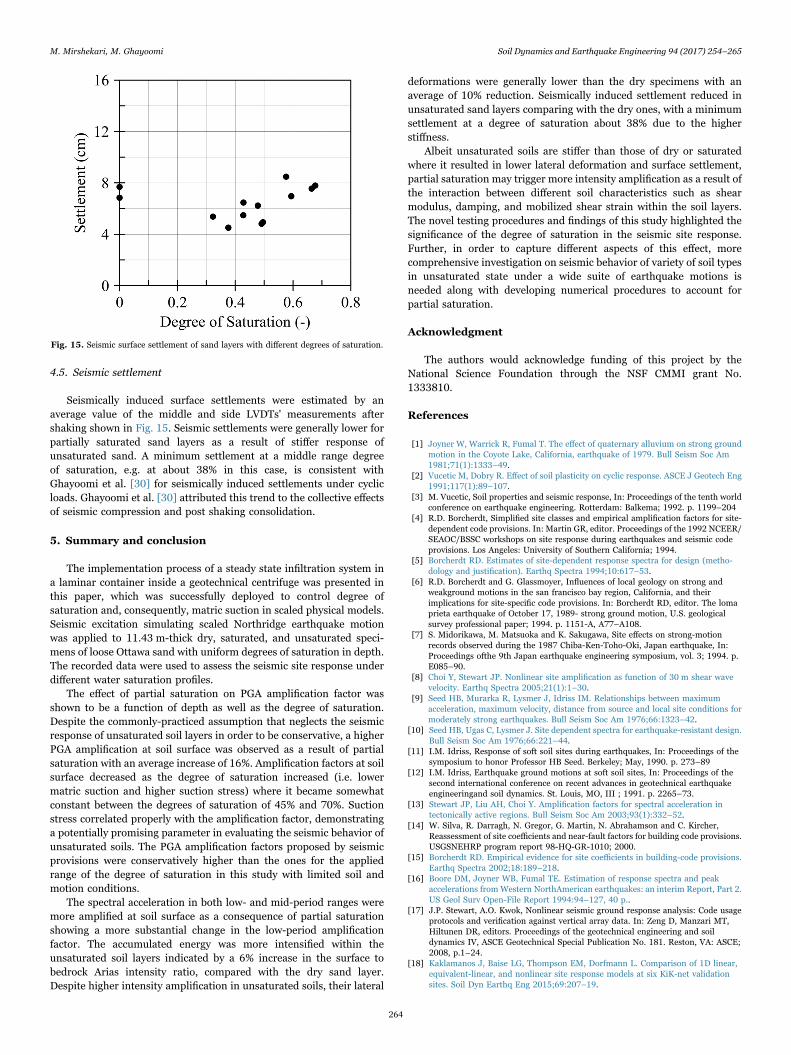
Seismically induced surface settlements were estimated by anaverage value of the middle and side LVDTs' measurements aftershaking shown in Fig. 15. Seismic settlements were generally lower forpartially saturated sand layers as a result of stiffer response ofunsaturated sand. A minimum settlement at a middle range degreeof saturation, e.g. at about 38% in this case, is consistent withGhayoomi et al. [30] for seismically induced settlements under cyclicloads. Ghayoomi et al. [30] attributed this trend to the collective effectsof seismic compression and post shaking consolidation.
5. Summary and conclusion
The implementation process of a steady state infiltration system ina laminar container inside a geotechnical centrifuge was presented inthis paper, which was successfully deployed to control degree ofsaturation and, consequently, matric suction in scaled physical models.Seismic excitation simulating scaled Northridge earthquake motionwas applied to 11.43 m-thick dry, saturated, and unsaturated speci-mens of loose Ottawa sand with uniform degrees of saturation in depth.The recorded data were used to assess the seismic site response underdifferent water saturation profiles.
The effect of partial saturation on PGA amplification factor wasshown to be a function of depth as well as the degree of saturation.Despite the commonly-practiced assumption that neglects the seismicresponse of unsaturated soil layers in order to be conservative, a higherPGA amplification at soil surface was observed as a result of partialsaturation with an average increase of 16%. Amplification factors at soilsurface decreased as the degree of saturation increased (i.e. lowermatric suction and higher suction stress) where it became somewhatconstant between the degrees of saturation of 45% and 70%. Suctionstress correlated properly with the amplification factor, demonstratinga potentially promising parameter in evaluating the seismic behavior ofunsaturated soils. The PGA amplification factors proposed by seismicprovisions were conservatively higher than the ones for the appliedrange of the degree of saturation in this study with limited soil andmotion conditions.
The spectral acceleration in both low- and mid-period ranges weremore amplified at soil surface as a consequence of partial saturationshowing a more substantial change in the low-period amplificationfactor. The accumulated energy was more intensified within theunsaturated soil layers indicated by a 6% increase in the surface tobedrock Arias intensity ratio, compared with the dry sand layer.Despite higher intensity amplification in unsaturated soils, their lateral
deformations were generally lower than the dry specimens with anaverage of 10% reduction. Seismically induced settlement reduced inunsaturated sand layers comparing with the dry ones, with a minimumsettlement at a degree of saturation about 38% due to the higherstiffness.
Albeit unsaturated soils are stiffer than those of dry or saturatedwhere it resulted in lower lateral deformation and surface settlement,partial saturation may trigger more intensity amplification as a result ofthe interaction between different soil characteristics such as shearmodulus, damping, and mobilized shear strain within the soil layers.The novel testing procedures and findings of this study highlighted thesignificance of the degree of saturation in the seismic site response.Further, in order to capture different aspects of this effect, morecomprehensive investigation on seismic behavior of variety of soil typesin unsaturated state under a wide suite of earthquake motions isneeded along with developing numerical procedures to account forpartial saturation.
Acknowledgment
The authors would acknowledge funding of this project by theNational Science Foundation through the NSF CMMI grant No.1333810.
References
[1] Joyner W, Warrick R, Fumal T. The effect of quaternary alluvium on strong groundmotion in the Coyote Lake, California, earthquake of 1979. Bull Seism Soc Am1981;71(1):1333–49.
[2] Vucetic M, Dobry R. Effect of soil plasticity on cyclic response. ASCE J Geotech Eng1991;117(1):89–107.
[3] M. Vucetic, Soil properties and seismic response, In: Proceedings of the tenth worldconference on earthquake engineering. Rotterdam: Balkema; 1992. p. 1199–204
[4] R.D. Borcherdt, Simplified site classes and empirical amplification factors for site-dependent code provisions. In: Martin GR, editor. Proceedings of the 1992 NCEER/SEAOC/BSSC workshops on site response during earthquakes and seismic codeprovisions. Los Angeles: University of Southern California; 1994.
[5] Borcherdt RD. Estimates of site-dependent response spectra for design (metho-dology and justification). Earthq Spectra 1994;10:617–53.
[6] R.D. Borcherdt and G. Glassmoyer, Influences of local geology on strong andweakground motions in the san francisco bay region, California, and theirimplications for site-specific code provisions. In: Borcherdt RD, editor. The lomaprieta earthquake of October 17, 1989- strong ground motion, U.S. geologicalsurvey professional paper; 1994. p. 1151-A, A77–A108.
[7] S. Midorikawa, M. Matsuoka and K. Sakugawa, Site effects on strong-motionrecords observed during the 1987 Chiba-Ken-Toho-Oki, Japan earthquake, In:Proceedings ofthe 9th Japan earthquake engineering symposium, vol. 3; 1994. p.E085–90.
[8] Choi Y, Stewart JP. Nonlinear site amplification as function of 30 m shear wavevelocity. Earthq Spectra 2005;21(1):1–30.
[9] Seed HB, Murarka R, Lysmer J, Idriss IM. Relationships between maximumacceleration, maximum velocity, distance from source and local site conditions formoderately strong earthquakes. Bull Seism Soc Am 1976;66:1323–42.
[10] Seed HB, Ugas C, Lysmer J. Site dependent spectra for earthquake-resistant design.Bull Seism Soc Am 1976;66:221–44.
[11] I.M. Idriss, Response of soft soil sites during earthquakes, In: Proceedings of thesymposium to honor Professor HB Seed. Berkeley; May, 1990. p. 273–89
[12] I.M. Idriss, Earthquake ground motions at soft soil sites, In: Proceedings of thesecond international conference on recent advances in geotechnical earthquakeengineeringand soil dynamics. St. Louis, MO, III ; 1991. p. 2265–73.
[13] Stewart JP, Liu AH, Choi Y. Amplification factors for spectral acceleration intectonically active regions. Bull Seism Soc Am 2003;93(1):332–52.
[14] W. Silva, R. Darragh, N. Gregor, G. Martin, N. Abrahamson and C. Kircher,Reassessment of site coefficients and near-fault factors for building code provisions.USGSNEHRP program report 98-HQ-GR-1010; 2000.
[15] Borcherdt RD. Empirical evidence for site coefficients in building-code provisions.Earthq Spectra 2002;18:189–218.
[16] Boore DM, Joyner WB, Fumal TE. Estimation of response spectra and peakaccelerations fromWestern NorthAmerican earthquakes: an interim Report, Part 2.US Geol Surv Open-File Report 1994:94–127, 40 p..
[17] J.P. Stewart, A.O. Kwok, Nonlinear seismic ground response analysis: Code usageprotocols and verification against vertical array data. In: Zeng D, Manzari MT,Hiltunen DR, editors. Proceedings of the geotechnical engineering and soildynamics IV, ASCE Geotechnical Special Publication No. 181. Reston, VA: ASCE;2008, p.1–24.
[18] Kaklamanos J, Baise LG, Thompson EM, Dorfmann L. Comparison of 1D linear,equivalent-linear, and nonlinear site response models at six KiK-net validationsites. Soil Dyn Earthq Eng 2015;69:207–19.
Fig. 15. Seismic surface settlement of sand layers with different degrees of saturation.
M. Mirshekari, M. Ghayoomi Soil Dynamics and Earthquake Engineering 94 (2017) 254–265
264

[19] Afacan KB, Brandenberg SJ, Stewart JP. Centrifuge modeling studies of siteresponse in soft clay over wide strain range [ASCE]. J Geotech Geoenviron Eng2014;140(2):04013003.
[20] Hashash YMA, Dashti S, Romero MI, Ghayoomi M, Musgrove M. Evaluation of 1-Dseismic site response modeling of sand using centrifuge experiments. Soil DynEarthq Eng 2015;78:19–31.
[21] Federal Emergency Management Agency, FEMA. NEHRP recommended seismicprovisions for new buildings and other structures. FEMA P-750, 2009.
[22] American Society of Civil Engineers, ASCE. Minimum design loads for buildingsand other structures. ASCE/SEI 7-10, 2010.
[23] International Code Council. 2012 International building code. Country Club Hills,Ill: ICC. 2011.
[24] Hashash YMA, Musgrove MI, Harmon JA, Groholski DR, Phillips CA, Park D.DEEPSOIL 6.1, user manual. Urbana, IL: Board of Trustees of University of Illinoisat Urbana-Champaign; 2016.
[25] Idriss IM, Sun JI. User's manual for SHAKE91. Davis: Center for GeotechnicalModeling, Dept. of Civil and Environmental Engineering, University of California;1992.
[26] Lee MKW, Finn WDL. DESRA-2: dynamic effective stress response analysis of soildeposit with energy transmitting boundary including assessment of liquefactionpotentialSoil Mechanics Series. Vancouver, Canada: University of British Columbia;1978.
[27] Matasovic N. Seismic response of composite horizontally-layered soil deposits[Ph.D. thesis]. Los Angeles, CA: University of California; 1993.
[28] Itasca Consulting Group.. FLAC, Fast langrangian analysis of continua, Version 5.0.Minneapolis, Minnesota: Itasca Consulting Group; 2005.
[29] Mazzoni S, McKenna F, Scott MH, Fenves GL. The opensees command languagemanual. Berkeley, California: Pacific Earthquake Engineering Research (PEER)Center; 2006. p. 451.
[30] Ghayoomi M, McCartney JS, Ko H-Y. Empirical methodology to estimate seismi-cally induced settlement of partially saturated sand. ASCE J Geotech GeoenvironEng 2013;139(3):1–10.
[31] Lu N, Likos WJ. Suction stress characteristic curve for unsaturated soils. J GeotechGeoenviron Eng 2006;1322:131–42.
[32] Wu S, Gray DH, Richart FE. Jr., Capillary effects on dynamic modulus of sands andsilts. ASCE J Geotech Eng 1984;110(9):1188–203.
[33] Qian X, Gray DH, Woods RD. Resonant column tests on partially saturated sands.Geotech Test J 1991;14(3):266–75.
[34] E.A.M. Marinho, R.J. Chandler, M.S. Crilly, Stiffness measurements on a partiallysaturated high plasticity clay using bender elements. In: Balkema AA. Proceedingsof the 1st International Conference on Unsaturated Soils, Paris, France, vol. 2.Rotterdam, The Netherlands; 6–8 September 1995. p. 535–39.
[35] Mancuso C, Vassallo R, d’Onofrio A. Small strain behavior of a silty sand incontrolled-suction resonant column – torsional shear tests. Can Geotech J2002;39(1):22–31.
[36] Mendoza CE, Colmenares JE, Merchan VE. Stiffness of an unsaturated compactedclayey soil at very small strains. Advanced experimental unsaturated soil me-chanics. London: Taylor & Francis Group; 2005.
[37] Ng CWW, Xu J, Yung SY. Effects of imbibition-drainage and stress ratio onanisotropic stiffness of an unsaturated soil at very small strains. Can Geotech J2009;46(9):1062–76.
[38] A. Khosravi, M. Ghayoomi, J.S. McCartney, Impact of effective stress on thedynamic shear modulus of unsaturated sand. West Palm Beach, Florida, USA:GeoFlorida, CD-ROM; Feb. 20–24. 2010.
[39] Biglari M, Jafari MK, Shafiee A, Mancuso C, d’Onofrio A. Shear modulus anddamping ratio of unsaturated kaolin measured by new suction-controlled cyclictriaxial device. ASTM Geotech Test J 2011;34(5):1–12.
[40] Ghayoomi M, McCartney JS. Measurement of small-strain shear moduli of partiallysaturated sand during infiltration in a geotechnical centrifuge. Special issue onadvances in experimental characterization of unsaturated soils volume 1. ASTMGeotech Test J 2011;34(5):10, [pg].
[41] Hoyos LR, Suescun-Florez EA, Puppala AJ. Stiffness of intermediate unsaturatedsoil from simultaneous suction-controlled resonant column and bender elementtesting. Eng Geol 2015;188:10–28.
[42] Ghayoomi M, Suprunenko G, Mirshekari M. Cyclic triaxial test to measure strain-dependent shear modulus of unsaturated sand. ASCE Int J Geomech 2017, (Inpress).
[43] Le K, Ghayoomi M. Cyclic direct simple shear test to measure strain-dependentdynamic properties of unsaturated sand. ASTM Geotech Test J 2017, (In press).
[44] Yang J, Sato T. Effects of pore-water saturation on seismic reflection andtransmission from a boundary of porous soils. Bull Seismol Soc Am2000;90(5):1313–7.
[45] Yang J. Frequency-dependent amplification of unsaturated surface soil layer. ASCEJ Geotech Geoenviron Eng 2006;132(4):526–31.
[46] F. D’Onza, A. D’Onofrio, C. Mancuso, Effects of unsaturated soil state on the localseismic response of soil deposits, In: Proceedings of the 1st European conferenceon unsaturated soils, Durham, UK; 2008. p. 531–36.
[47] M. Ghayoomi, J.S. McCartney, Centrifuge evaluation of the impact of partialsaturation on the amplification of peak ground acceleration in soil layers. In:Hryciw RD, Athanasopoulos-Zekkos A, Yesiller N, editors. Proceedings ofGeoCongress (GSP 225). ASCE. pp. 1968–77; 2012.
[48] M. Ghayoomi and M. Mirshekari, Equivalent linear site response analysis ofpartially saturated sand layers, In: Proceedings of the UNSAT Conference, Sydney,Australia ; 2014. p. 1–6.
[49] Mirshekari M, Ghayoomi M. Simplified equivalent linear and nonlinear siteresponse analysis of partially saturated soil layers. In: Iskander M, Suleiman MT,Anderson JB, Laefer DF, editors. IFCEE. San Antonio, Texas: Geotechnical SpecialPublication; 2015. p. 2131–40.
[50] Ghayoomi M, McCartney JS, Ko H-Y. Centrifuge test to assess the seismiccompression of partially saturated sand layers. ASTM Geotech Test J2011;34(4):321–31.
[51] S. Deshpande and K.K. Muraleetharan, Dynamic behavior of unsaturated soilembankments, In: Proceedings of the (geotechnical special publication No. 75)specialty conference, geotechnical earthquake engineering and soil dynamics III.Seattle, WA: Geo-Institute, ASCE; 1998. p. 890–901.
[52] Ng CWW, Leung AK, Kamchoom V, Garg A. A novel root system for simulatingtranspiration-induced soil suction in centrifuge. Geotech Test J 2014;37(5):1–15.
[53] Nimmo JR, Rubin J, Hammermeister DP. Unsaturated flow in a centrifugal field:measurement of hydraulic conductivity and testing of Darcy's Law. Water ResourRes 1987;23(1):124–34.
[54] Conca JL, Wright J. Diffusion coefficients in gravel under unsaturated conditions.Water Resour Res 1990;26(5):1055–66.
[55] Dell’Avanzi E. Unsaturated flow under increased gravitational field [Ph.D. dis-sertation]. Boulder, CO: University of Colorado, Department of Civil Environmentaland Architectural Engineering; 2004.
[56] Dell’Avanzi E, Zornberg JG, Cabral AR. Suction profiles and scale factors forunsaturated flow under increased gravitational field. Soils Found2004;44(3):79–90.
[57] Richards LA. Capillary conduction of liquids through porous mediums. Physics1931;1:318–33.
[58] Gardner W. Some steady state solutions of the unsaturated water flow equationwith applications to evaporation from a water table. Soil Sci 1958;85:228–32.
[59] van Genuchten M. A closed form equation for Predicting the hydraulic conductivityof unsaturated soils. Soil Sci Soc Am J 1980;58:647–52.
[60] McCartney JS, Zornberg JG. Centrifuge Permeameter for unsaturated soils. II:measurement of the hydraulic characteristics of an unsaturated clay. ASCE JGeotech Geoenviron Eng 2010;136(8):1064–76.
[61] Reis RM, Sterck WN, Ribeiro AB, Dell’Avanzi E, Saboya F, Tibana S, et al.Determination of the soil-water retention curve and the hydraulic conductivityfunction using a small centrifuge. ASTM Geotech Test J 2011;34(5):1–10.
[62] Ghayoomi M, Wadsworth S. Renovation and reoperation of a geotechnicalcentrifuge at the university of new hampshire. In: Gaudin , White , editors. 8thinternational conference on physical modelling in geotechnics. Perth: CRC Press;2014. p. 201–5.
[63] Whitman RV, Lambe PC. Effect of boundary conditions upon centrifuge experi-ments using ground motion simulation. Geotech Test J 1986;9(2):61–71.
[64] Hushmand B, Scott RF, Crouse CB. Centrifuge liquefaction test in a laminar box.Geotechnique 1988;38(2):253–62.
[65] Dewoolkar MM, Ko HY, Stadler AT, Astaneh SMF. A substitute pore fluid forseismic centrifuge modeling. ASTM Geotech Test J 1999;22:196–210.
[66] S.A. Ketcham, H.Y. Ko, A. Sture, Performance of an earthquake motion simulatorfor a small geotechnical centrifuge, In: Proceedings of the Centrifuge 91. Boulder,CO; 1991.
[67] H.B. Mason, J.D. Bray, B.L. Kutter, D.W. Wilson, B.Y. Choy, Earthquake motionselection and calibration for use in a geotechnical centrifuge, In: Proceedings of the7th international conference on physical modeling in geotechnics. Zurich,Switzerland; 2010.
[68] Seed HB, Idriss IM. Soil moduli and damping factors for dynamic responseanalysesReport No. EERC70-10. Berkeley, California: Earthquake EngineeringResearch Center, University of California; 1970.
[69] B.O. Hardin, The nature of stress-strain behavior of soils, In: Proceedings of theearthquake engineering and soil dynamics, vol. 1. California: ASCE Pasadena;1978. p. 3–89.
[70] Dobry R, Borcherdt RD, Crouse CB, Idriss IM, Joyner WB, Martin GR, et al. Newsite coefficients and site classification system used in recent building seismic codeprovisions. Earthq Spectra 2000;16(1):41–67.
[71] Roesset JM. Soil amplification in earthquakes. In: Desai CS, Christian JT, editors.Numerical methods in geotechnical engineering. New York: McGraw Hill; 1977. p.639–82, [chapter 19].
[72] J.F. Gibbs, J.C. Tinsley, W.B. Joyner, Seismic velocities and geological conditions attwelve sites subjected to strong ground motion in the 1994 Northridge California,Earthquake. U.S. Geological Survey Open-File Report 96-740; 1996. 103p.
[73] Dong Y, McCartney JS, Lu N. Small-strain shear modulus model for saturated andunsaturated soil. Chicago: Go-Chicago; 2016. p. 316–25.
[74] Menq FY. Dynamic properties of sandy and gravelly soils [Ph.D. dissertation].Austin: University of Texas; 2003.
[75] Lu N, Godt JW, Wu DT. A closed form equation for effective stress in unsaturatedsoil. Water Resour Res 2010;46(W05515):14.
[76] Arias A. A measure of earthquake intensity. In: Hansen RJ, editor. Seismic designfor nuclear power plants. Cambridge, MA: MIT Press; 1970.
[77] Zeghal M, Elgamal AW, Tang HT, Stepp JC. Lotung downhole array. II: evaluationof soil nonlinear properties. J Geotech Eng 1995;4(363):363–78.
M. Mirshekari, M. Ghayoomi Soil Dynamics and Earthquake Engineering 94 (2017) 254–265
265