Embed Size (px)
Citation preview
University of Nebraska - Lincoln University of Nebraska - Lincoln
DigitalCommons@University of Nebraska - Lincoln DigitalCommons@University of Nebraska - Lincoln
Agronomy & Horticulture -- Faculty Publications Agronomy and Horticulture Department
2021
Soil erosion modelling: A global review and statistical analysis Soil erosion modelling: A global review and statistical analysis
Pasquale Borrelli University of Pavia, [email protected]
Panos Panagos European Commission, Joint Research Centre, [email protected]
Dinesh Panday University of Nebraska - Lincoln, [email protected]
64 more co-authors
Follow this and additional works at: https://digitalcommons.unl.edu/agronomyfacpub
Part of the Agricultural Science Commons, Agriculture Commons, Agronomy and Crop Sciences
Commons, Botany Commons, Horticulture Commons, Other Plant Sciences Commons, and the Plant
Biology Commons
Borrelli, Pasquale; Panagos, Panos; Panday, Dinesh; and co-authors, 64 more, "Soil erosion modelling: A global review and statistical analysis" (2021). Agronomy & Horticulture -- Faculty Publications. 1437. https://digitalcommons.unl.edu/agronomyfacpub/1437
This Article is brought to you for free and open access by the Agronomy and Horticulture Department at DigitalCommons@University of Nebraska - Lincoln. It has been accepted for inclusion in Agronomy & Horticulture -- Faculty Publications by an authorized administrator of DigitalCommons@University of Nebraska - Lincoln.
Review
Soil erosion modelling: A global review and statistical analysis
Pasquale Borrelli a,b,c,⁎, Christine Alewell b, Pablo Alvarez d,e, Jamil Alexandre Ayach Anache f,g,Jantiene Baartman h, Cristiano Ballabio i, Nejc Bezak j, Marcella Biddoccu k, Artemi Cerdà l, Devraj Chalise m,Songchao Chen n, Walter Chen o, Anna Maria De Girolamo p, Gizaw Desta Gessesse q, Detlef Deumlich r,Nazzareno Diodato s, Nikolaos Efthimiou t, Gunay Erpul u, Peter Fiener v, Michele Freppaz w, Francesco Gentile x,Andreas Gericke y, Nigussie Haregeweyn z, Bifeng Hu aa,ab, Amelie Jeanneau ac, Konstantinos Kaffas ad,Mahboobeh Kiani-Harchegani ae, Ivan Lizaga Villuendas af, Changjia Li ag,ah, Luigi Lombardo ai,Manuel López-Vicente aj, Manuel Esteban Lucas-Borja ak, MichaelMärker a, FrancisMatthews i, ChiyuanMiao ag,Matjaž Mikoš j, Sirio Modugno al,am, Markus Möller an, Victoria Naipal ao, Mark Nearing ap, Stephen Owusu aq,Dinesh Panday ar, Edouard Patault as, Cristian Valeriu Patriche at, Laura Poggio au, Raquel Portes av,Laura Quijano aw, Mohammad Reza Rahdari ax, Mohammed Renima ay, Giovanni Francesco Ricci x,Jesús Rodrigo-Comino l,az, Sergio Saia ba, Aliakbar Nazari Samani bb, Calogero Schillaci bc, Vasileios Syrris i,Hyuck Soo Kim c, Diogo Noses Spinola bd, Paulo Tarso Oliveira g, Hongfen Teng be, Resham Thapa bf,Konstantinos Vantas bg, Diana Vieira bh, Jae E. Yang c, Shuiqing Yin ag, Demetrio Antonio Zema bi,Guangju Zhao bj, Panos Panagos i,⁎⁎a Department of Earth and Environmental Sciences, University of Pavia, Via Ferrata, 1, 27100 Pavia, Italyb Department of Environmental Sciences, Environmental Geosciences, University of Basel, Basel CH-4056, Switzerlandc Department of Biological Environment, Kangwon National University, Chuncheon 24341, Republic of Koread Institute of Geography and Geoecology, Karlsruhe Institute of Technology, Germanye Faculty of Agricultural Sciences, National University of Loja, Ecuadorf Department of Hydraulics and Sanitation, São Carlos School of Engineering (EESC), University of São Paulo (USP), CxP. 359, São Carlos, SP 13566-590, Brazilg Federal University of Mato Grosso do Sul, CxP. 549, Campo Grande, MS 79070-900, Brazilh Soil Physics and Land Management Group, Wageningen University, Wageningen, the Netherlandsi European Commission, Joint Research Centre (JRC), Ispra, Italyj University of Ljubljana, Faculty of Civil and Geodetic Engineering, Ljubljana, Sloveniak Institute of Sciences and Technologies for Sustainable Energy and Mobility (STEMS), National Research Council of Italy (CNR), Strada delle Cacce 73, 10135 Torino, Italyl Soil Erosion and Degradation Research Group, Department of Geography, University of Valencia, Valencia, Spainm School of Environmental and Rural Science, University of New England, Armidale, NSW 2351, Australian INRAE, Unité InfoSol, Orléans 45075, Franceo Department of Civil Engineering, National Taipei University of Technology, Taiwanp Water Research Institute, National Research Council, Bari, Italyq International Crops Research Institute for the Semi-Arid Tropics (ICRISAT), Ethiopiar Leibniz-Center for Agricultural Landscape Research Muencheberg (ZALF), Germanys Met European Research Observatory—International Affiliates Program of the University Corporation for Atmospheric Research, Via Monte Pino snc, 82100 Benevento, Italyt Faculty of Environmental Sciences, Czech University of Life Sciences Prague, Kamýcká 129, Praha, Suchdol 165 00, Czech Republicu Department of Soil Science and Plant Nutrition, Faculty of Agriculture, University of Ankara, 06110, Diskapi, Ankara, Turkeyv Water and Soil Resources Research Group, Institute of Geography, Universität Augsburg, Alter Postweg 118, 86159 Augsburg, Germanyw University of Turin, Department of Agricultural, Forest and Food Sciences, Largo Paolo Braccini, 2, 10095 Grugliasco, Italyx University of Bari Aldo Moro, Department of Agricultural and Environmental Sciences, Bari, Italyy Leibniz-Institute of Freshwater Ecology and Inland Fisheries (FV-IGB), Department of Ecohydrology, 12587 Berlin, Germanyz International Platform for Dryland Research and Education, Tottori University, Tottori 680-0001, Japanaa Unité de Recherche en Science du Sol, INRAE, Orléans 45075, Franceab Sciences de la Terre et de l'Univers, Orléans University, 45067 Orléans, Franceac School of Biological Sciences, University of Adelaide, Adelaide, Australiaad Faculty of Science and Technology, Free University of Bozen-Bolzano, Bolzano, Italyae Department of Watershed Management Engineering, Faculty of Natural Resources, Yazd university, Yazd, Iranaf Estación Experimental de Aula-Dei (EEAD-CSIC), Spanish National Research Council, Avenida Montañana, 1005, 50059 Zaragoza, Spainag State Key Laboratory of Earth Surface Processes and Resource Ecology, Faculty of Geographical Science, Beijing Normal University, Beijing, Chinaah Institute of Land Surface System and Sustainable Development, Faculty of Geographical Science, Beijing Normal University, Beijing, China
Science of the Total Environment 780 (2021) 146494
⁎ Correspondence to: P. Borrelli, Department of Earth and Environmental Sciences, University of Pavia, Via Ferrata, 1, 27100 Pavia, Italy.⁎⁎ Corresponding author.
E-mail addresses: [email protected] (P. Borrelli), [email protected] (P. Panagos).
https://doi.org/10.1016/j.scitotenv.2021.1464940048-9697/© 2021 The Authors. Published by Elsevier B.V. This is an open access article under the CC BY license (http://creativecommons.org/licenses/by/4.0/).
Contents lists available at ScienceDirect
Science of the Total Environment
j ourna l homepage: www.e lsev ie r .com/ locate /sc i totenv
ai University of Twente, Faculty of Geo-Information Science and Earth Observation (ITC), PO Box 217, Enschede AE 7500, the Netherlandsaj Team Soil, Water and Land Use, Wageningen Environmental Research, Wageningen 6708RC, Netherlandsak Castilla La Mancha University, School of Advanced Agricultural and Forestry Engineering, Albacete 02071, Spainal World Food Programme, Roma 00148, Italyam University of Leicester, Centre for Landscape and Climate Research, Department of Geography, University Road, Leicester LE1 7RH, UKan Julius Kühn Institute (JKI), Federal Research Centre for Cultivated Plants, Institute for Strategies and Technology Assessment, Kleinmachnow, Germanyao Ludwig-Maximilian University, Munich, Germanyap Southwest Watershed Research Center, USDA-ARS, 2000 E. Allen Rd., Tucson, AZ 85719, United Statesaq Soil Research Institute, Council for Scientific and Industrial Research, Kwadaso, Kumasi, Ghanaar Department of Agronomy and Horticulture, University of Nebraska-Lincoln, Lincoln, NE, United Statesas Normandie Univ, Rouen, UNIROUEN, UNICAEN, CNRS, M2C, FED-SCALE, Rouen, Franceat Romanian Academy, Iasi Branch, Geography Group, 8 Carol I, 700505, Iasi, Romaniaau ISRIC - World Soil Information, Wageningen, the Netherlandsav Minas Gerais State University - Campus Frutal, Brazilaw Georges Lemaître Centre for Earth and Climate Research - Earth and Life Institute, Université Catholique de Louvain, Belgiumax Faculty of Agriculture, University of Torbat Heydarieh, Torbat Heydarieh, Iranay University Hassiba Benbouali of Chlef, Laboratory of Chemistry Vegetable-Water-Energy, Algeriaaz Department of Physical Geography, University of Trier, 54296 Trier, Germanyba Department of Veterinary Sciences, University of Pisa, Pisa, Italybb Faculty of Natural Resources, University of Tehran, Tehran, Iranbc Department of Agricultural and Environmental Sciences, University of Milan, Via Celoria 2, 20133 Milan, Italybd Department of Chemistry and Biochemistry, University of Alaska Fairbanks, Fairbanks, AK, USAbe School of Environmental Ecology and Biological Engineering, Wuhan Institute of Technology, Wuhan 430205, Chinabf Department of Plant Science and Landscape Architecture, University of Maryland, College Park, MD, USAbg Department of Rural and Surveying Engineering, Aristotle University of Thessaloniki, 54124 Thessaloniki, Greecebh Centre for Environmental and Marine Studies (CESAM), Dpt. of Environment and Planning, University of Aveiro, Portugalbi Department “Agraria”, University “Mediterranea” of Reggio Calabria, Località Feo di Vito, 89122 Reggio Calabria, Italybj State Key Laboratory of Soil Erosion and Dryland Farming on the Loess Plateau, Institute of Soil and Water Conservation, Northwest A&F University, Yangling, Shaanxi 712100, China
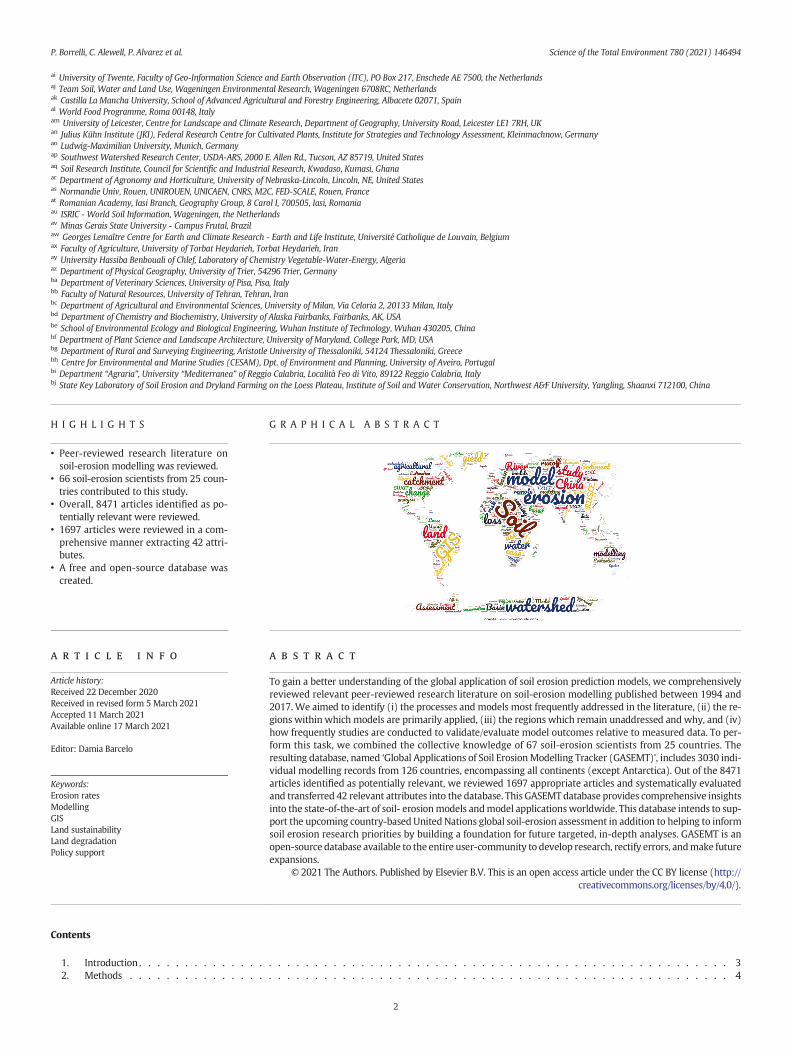
H I G H L I G H T S
• Peer-reviewed research literature onsoil-erosion modelling was reviewed.
• 66 soil-erosion scientists from 25 coun-tries contributed to this study.
• Overall, 8471 articles identified as po-tentially relevant were reviewed.
• 1697 articles were reviewed in a com-prehensive manner extracting 42 attri-butes.
• A free and open-source database wascreated.
G R A P H I C A L A B S T R A C T
a b s t r a c ta r t i c l e i n f o
Article history:Received 22 December 2020Received in revised form 5 March 2021Accepted 11 March 2021Available online 17 March 2021
Editor: Damia Barcelo
Keywords:Erosion ratesModellingGISLand sustainabilityLand degradationPolicy support
To gain a better understanding of the global application of soil erosion prediction models, we comprehensivelyreviewed relevant peer-reviewed research literature on soil-erosion modelling published between 1994 and2017. We aimed to identify (i) the processes and models most frequently addressed in the literature, (ii) the re-gions within which models are primarily applied, (iii) the regions which remain unaddressed and why, and (iv)how frequently studies are conducted to validate/evaluate model outcomes relative to measured data. To per-form this task, we combined the collective knowledge of 67 soil-erosion scientists from 25 countries. Theresulting database, named ‘Global Applications of Soil ErosionModelling Tracker (GASEMT)’, includes 3030 indi-vidual modelling records from 126 countries, encompassing all continents (except Antarctica). Out of the 8471articles identified as potentially relevant, we reviewed 1697 appropriate articles and systematically evaluatedand transferred 42 relevant attributes into the database. This GASEMT database provides comprehensive insightsinto the state-of-the-art of soil- erosionmodels andmodel applicationsworldwide. This database intends to sup-port the upcoming country-based United Nations global soil-erosion assessment in addition to helping to informsoil erosion research priorities by building a foundation for future targeted, in-depth analyses. GASEMT is anopen-source database available to the entire user-community to develop research, rectify errors, andmake futureexpansions.
© 2021 The Authors. Published by Elsevier B.V. This is an open access article under the CC BY license (http://creativecommons.org/licenses/by/4.0/).
Contents
1. Introduction . . . . . . . . . . . . . . . . . . . . . . . . . . . . . . . . . . . . . . . . . . . . . . . . . . . . . . . . . . . . . . . . 32. Methods . . . . . . . . . . . . . . . . . . . . . . . . . . . . . . . . . . . . . . . . . . . . . . . . . . . . . . . . . . . . . . . . . 4
P. Borrelli, C. Alewell, P. Alvarez et al. Science of the Total Environment 780 (2021) 146494
2
2.1. Data collection and GASEMT database . . . . . . . . . . . . . . . . . . . . . . . . . . . . . . . . . . . . . . . . . . . . . . . . . 42.2. Statistical analysis . . . . . . . . . . . . . . . . . . . . . . . . . . . . . . . . . . . . . . . . . . . . . . . . . . . . . . . . . . 4
3. Results . . . . . . . . . . . . . . . . . . . . . . . . . . . . . . . . . . . . . . . . . . . . . . . . . . . . . . . . . . . . . . . . . . 53.1. Geography of the modelling applications . . . . . . . . . . . . . . . . . . . . . . . . . . . . . . . . . . . . . . . . . . . . . . . 53.2. Temporal trends . . . . . . . . . . . . . . . . . . . . . . . . . . . . . . . . . . . . . . . . . . . . . . . . . . . . . . . . . . 53.3. Erosion processes and type of predictions . . . . . . . . . . . . . . . . . . . . . . . . . . . . . . . . . . . . . . . . . . . . . . . 63.4. Spatial scale . . . . . . . . . . . . . . . . . . . . . . . . . . . . . . . . . . . . . . . . . . . . . . . . . . . . . . . . . . . . 63.5. Aims of the modelling application. . . . . . . . . . . . . . . . . . . . . . . . . . . . . . . . . . . . . . . . . . . . . . . . . . . 73.6. Models, input data and outcomes . . . . . . . . . . . . . . . . . . . . . . . . . . . . . . . . . . . . . . . . . . . . . . . . . . . 73.7. Statistical analysis . . . . . . . . . . . . . . . . . . . . . . . . . . . . . . . . . . . . . . . . . . . . . . . . . . . . . . . . . . 8
4. Discussion. . . . . . . . . . . . . . . . . . . . . . . . . . . . . . . . . . . . . . . . . . . . . . . . . . . . . . . . . . . . . . . . 105. GASEMT database: data availability and limitations . . . . . . . . . . . . . . . . . . . . . . . . . . . . . . . . . . . . . . . . . . . . . 156. Conclusions . . . . . . . . . . . . . . . . . . . . . . . . . . . . . . . . . . . . . . . . . . . . . . . . . . . . . . . . . . . . . . . 16CRediT authorship contribution statement. . . . . . . . . . . . . . . . . . . . . . . . . . . . . . . . . . . . . . . . . . . . . . . . . . . . 16Declaration of competing interest. . . . . . . . . . . . . . . . . . . . . . . . . . . . . . . . . . . . . . . . . . . . . . . . . . . . . . . . 16Acknowledgement . . . . . . . . . . . . . . . . . . . . . . . . . . . . . . . . . . . . . . . . . . . . . . . . . . . . . . . . . . . . . . 16References . . . . . . . . . . . . . . . . . . . . . . . . . . . . . . . . . . . . . . . . . . . . . . . . . . . . . . . . . . . . . . . . . . 16
1. Introduction
Humans affect natural erosion processes and have induced a rele-vant and observable increase in soil erosion rates across landscapes(Poesen, 2018). For over a century the scientific community has beenaddressing the processes governing soil erosion, the occurrence of ac-celerated soil erosion, and its negative associated socio-environmentalimpacts (Bennett and Chapline, 1928; Smith, 1914). A body of researchon the mechanics of soil erosion and its geographical distribution hasbenefited from the cognitive contributions of several adjoining disci-plines, such as physical geography, soil science, engineering, hydrology,biogeochemistry, human sciences, and economics.This interdisciplinarynature is reflected in the numerous scientific approaches presented inthe literature to better understand soil erosion phenomena, each havingvariable temporal and spatial scales, methodologies, and research goals(Boardman and Poesen, 2006;Morgan, 2009). Qualitative and quantita-tive descriptions of soil erosion have been performed through field ob-servations andmeasurements (Toy et al., 2002), laboratory experiments(Mutchler et al., 2017), aswell as through ameta-analysis of soil erosionrates across the world (García-Ruiz et al., 2015). Summatively, the vastand diversified scientific literature states that soil erosion includes abroad spectrumof processes (Poesen, 2018), which comewith differentcharacteristics (form, intensity, and frequency) and encompass all con-tinents (Oldeman, 1994; Wuepper et al., 2020).
With an increased abundance of observed data and the aim of map-ping spatially distributed soil erosion rates with a better understandingof their mechanics (Cook, 1937), scientists started to develop quantita-tive soil-erosion prediction equations based on physical factors such asclimate, soil characteristics, vegetation type, and topography (Zingg,1940). Since scientists proposed one of the earliest quantitative soil-erosion prediction equations in the 1940s, several mathematical modelsclassified as empirical, conceptual, or process-oriented have been devel-oped to predict soil erosion processes at different spatial and temporalscales (Merritt et al., 2003; Morgan and Nearing, 2011; Nearing, 2013).Batista et al. (2019) reported that today “there is no shortage of soil ero-sion models, model applications, and model users' but there is still aknowledge gap on the validity, quality, and reliability of the modellingapplication results”. Despite the significant progress made in model de-velopment and input parameterization, output uncertainties persist dueto the non-linear relationships and thresholds at play between drivingfactors and the subsequent erosion processes, as well as the difficultiesof upscaling model findings from the local scale to larger ones (DeVente and Poesen, 2005).
Part of the challenge to improve soil-erosion modelling is the devel-opment of baseline information on how models are used. Essentialquestions are: What do we know about soil-erosion model applicationsworldwide? What processes and models are mainly addressed? What
are the regionswheremodels are mainly applied?What are the regionsthat remain unaddressed?How frequently and howwell aremodel out-comes validated? In short, we lack a clear picture of the worldwidestate-of-the-art of soil-erosion model applications.
Today, with the well-established use of geospatial technologies likeGeographic Information Systems (GIS), spatial interpolation techniques,and the ever-growing range of environmental data; soil-erosionmodelsplay an increasingly important role in the design and implementation ofsoil management and conservation strategies (Panagos et al., 2015b).The applications of soil erosion models are growing (Auerswald et al.,2014), alongside the scale of their application (Borrelli et al., 2017a,2017b; Naipal et al., 2018). These models play an important role astools to support decision-makers in policy evaluations (Olsson andBarbosa, 2019). The Sixth Session of the Global Soil Partnership (GSP)Plenary Assembly, under the solicitation of its Intergovernmental Tech-nical Panel on Soils (ITPS), voted in favor of a resolution to put thedevel-opment of a new country-driven global soil-erosion (GSER) assessment(GSP, 2019) on the agenda for 2019–2021. Unlike previous United Na-tions (UN) assessments that were based on expert judgments carriedout in the 1990's, such as the Global Assessment of Human-inducedSoil Degradation (GLASOD, Oldeman, 1994), the new UN Global SoilErosion map (GSERmap) will rely on modelling. These modelling activ-ities will be supported and validated by field and remote observationsusing satellite imagery and aerial photography. GSERmap will addressthe three main soil erosion-driven processes, i.e., water erosion, winderosion, and redistribution due to the mechanization of agriculture (re-ferred to as tillage erosion).
The new country-based UN global soil erosion assessment will in-volve hundreds of soil erosion expertsworldwide (FAO, 2019). This rep-resents an opportunity to enhance the understanding of global soilerosion, identify soil-erosion hotspots, and gain momentum for newpolicies at all levels. A UN project of this scale on soil erosion can alsostrengthen the soil-erosion scientific community's collaborative effortsto boost the development and applicability of models. However, theachievement of these goals could be hindered by the lack of globalknowledge on soil erosion model usage. Improving such knowledgewould help pave the way for more structured modelling and allow thefurther identification of needs to validate, measure, monitor, and mapsoil-erosion processes.
In this study, we systematically reviewed soil-erosionmodelling ap-plications worldwide and performed a statistical analysis with the aimof addressing identified knowledge gaps and facilitating information ac-quisition for the new country-based UN global soil erosion assessment.The subsequent database presents the current state of knowledge onsoil-erosion modelling applications worldwide. We aimed to createand share a comprehensive and unprecedented database on soil erosionapplications worldwide with an open science participatory approach.
P. Borrelli, C. Alewell, P. Alvarez et al. Science of the Total Environment 780 (2021) 146494
3
Sixty-six scientists from 25 countries representing all continents(except Antarctica) have contributed their findings, systematicallyreviewed all available peer-reviewed literature, and merged theirknowledge. The database is available in Appendix A of this article. Inour study, we provide an evaluation of (i) the processes and modelsmost frequently addressed in the literature, (ii) the regions withinwhich models are primarily applied, (iii) the regions which remain un-addressed and why and (iv) how frequently studies are conducted tovalidate/evaluate model outcomes relative to measured data. Thisapproach provides insights into the worldwide state-of-the-art in soil-erosion model applications and allows a synthesis of information onwhichprocesses,models, and regions have received themost evaluativeattention and which require increased focus in the future.
2. Methods
2.1. Data collection and GASEMT database
In this study, we report the results of an in-depth review of scien-tific peer-reviewed literature on soil-erosion modelling published ininternational journals between the 1st of January 1994 and the 31stof December 2017 and present in Elsevier's Scopus bibliographic da-tabase. We used the following criteria to identify articles potentiallyrelevant for our statistical analysis: keywords soil erosion and modelor name of the model (Box 1) in the title, abstract, or the keywordsof the Scopus indexed articles. All articles matching the selected key-words have been downloaded and reviewed by one of the 67 soilerosion experts involved in the study. The review phase started inearly 2018 and followed a participatory approach open to the entirescientific community, without any restrictions. The authors are com-posed of scientists who responded to an open call for expression ofinterest published on ResearchGate and advertised through mailinglists and word-of-mouth. Within the first data collection phase, allauthors paid close attention to the following criteria: (i) verifyingthe relevance of the articles with respect to the objective of the re-view study, (ii) recording the entries' information (hereinafter alsoreferred to as records), and (iii) extract all information listed inTable 1 for each relevant article. As a second quality control phase,P. Borrelli randomly inspected about 5% of the articles reviewed bythe authors and verifiedwhether the gathered informationwas com-plete. P. Borrelli reviewed the database to identify and rectify themost evident inconsistencies, misclassifications, and typos.
The database is named Global Applications of Soil ErosionModellingTracker (GASEMT). In the case of studies reporting multiple modelapplications or numerous study sites, authors created multiple individ-ual data entries in the GASEMT database. Each entry in the databasereports information on the 42 attributes listed above (unless the re-viewers did not find the required details and therefore reported theterm ‘unknown’). The term ‘NA’ is used as the acronym of ‘not applica-ble’. Notably, the database only considers and reports on studiespresenting soil-erosion modelling applications with spatially and tem-porally defined boundary conditions. In thedatabase,we did not includedata from articles that exclusively reported technical descriptions ofmodels, refinement of individual model parameters, or methodological
improvement without practical applications. We excluded all articlesnot written in English from the analysis.
2.2. Statistical analysis
GASEMT's records allow a comprehensive meta-analysis of soil-erosion model predictions, which cover a diverse range of time periodsand locations globally. A subset of GASEMT data with complete inputsthat included (i) modelled soil erosion rates (Mg ha−1 yr−1), (ii) geo-graphical coordinates, and (iii) the size of the study area (km2), allowedstatistical insights to be gained into soil-erosion model prediction pat-terns and trends through space and time. Excluding continental andglobal scale studies from this analysis, 1586 of GASEMT's modelling es-timates met all these requirements, compiled from 786 individualpublications.
Firstly, we approximated the global land surface (km2) covered bythe recorded modelling applications together with data on total soilloss (billion Mg yr−1), the average (x ̃) area-specific soil erosion(Mg ha−1 yr−1), and standard deviation (σ). Secondly, we analysed
Box 1Scopus query and acronym list of the soil erosionmodels used for the literature search (inthe title, abstract, and the keywords of the Scopus indexed articles).
Scopus search“soil erosion” AND “model” OR:AGNPS, ANSWERS, APSIM, CREAMS, EGEM, EPIC, EROSION-3D, EUROSEM,GeoWEPP, GLEAMS, GUEST, KINEROS, KINEROS2, LISEM, MIKE-11, MMF, MMMF,MOSES, MUSLE, PERFECT, PESERA, RHEM, RillGrow, RUSLE, RUSLE2, RUSLE-3D,RWEQ, SEDEM, SEDEM/WaTEM, SERAE, STREAM, SWAT, TMDL, USLE, USPED,WATEM, WATEM/SEDEM, WEPP, WEPS, WEQ.
Table 1List of information collected for each entry in the GASEMT database (extended version inTable S1).
Group Entry Types of data
i Entry info ID Open (numeric)Reviewer ID Open (alphanumeric)General ID Open (alphanumeric)
ii Bibliography Year of publication Open (numeric)List of authors Open (alphanumeric)Title Open (alphanumeric)Journal Open (alphanumeric)DOI Open (alphanumeric)
iii Modellingexercise
Erosion agent Multiple choiceModelling type Multiple choiceGross/net estimatea Multiple choiceQuantitative/qualitative estimateb Multiple choiceEstimated soil erosion rate convertedto (Mg ha−1 yr−1)
Open (numeric)
Soil erosion rate (note) Open (alphanumeric)Model name Open (alphanumeric)Modelling aim Multiple choiceModelled period Multiple choice
iv Study area Continent Multiple choiceCountry Open (text)Name of the study area Open (alphanumeric)Latitude (decimal degrees) Open (numeric)Longitude (decimal degrees) Open (numeric)Area (km2) Open (numeric)
v Climate Data indicative period Open (numeric)Type of data Multiple choiceTime resolution Multiple choiceRainfall amount (mm) Open (numeric)Rainfall (note) Open (alphanumeric)
vi Landuse/cover
Type of data source Multiple choiceModelled area Multiple choice
vii Fieldworkactivities
Field activities Multiple choiceType of activities Multiple choice
viii Soil info Soil sampling Multiple choiceType of soil information Multiple choice
ix Topography DEM cell size (m) Open (numeric)x Modelling
outcomesScalec Multiple choiceCell size (m) Open (numeric)Modelled years Open (numeric)Modelled period Multiple choiceValidation/evaluation attempt ofmodel results
Multiple choice
Type of validation/evaluation Multiple choiceModel calibration Multiple choice
a Gross erosion is on-site soil erosion potential without considering re-deposition. Neterosion is the difference between erosion and deposition processes at a given point.
b Qualitative refers to an assessment of temporal trends, spatial patterns and/or drivingfactors, while quantitative refers to quantitative assessment of sediment detachment andor transport.
c Definitions are provided in the Supporting Information (Table S2).
P. Borrelli, C. Alewell, P. Alvarez et al. Science of the Total Environment 780 (2021) 146494
4
and subdivided modelling applications by categories of i) land cover/use, ii) type of erosion agent, iii) the scale of application (listed inTable 1).We used the non-parametric Kruskal–Wallis test to investigatethe difference between the categories of records, accompanied byboxplots to display the distributions of predicted erosion rates amongland use/land cover anddifferentmodels (includingminimumandmax-imum,first quartile,median, third quartile). Temporal trendswere iden-tified by means of simple linear regression.
3. Results
A literature search in the Elsevier's Scopus bibliographic databaseresulted in 8471 articles potentially reporting soil-erosion modellingapplications. The further review process revealed that 6042 articles(71%) were not relevant for the study, as they did not report actualsoil-erosion modelling applications. The number of articles not inEnglish language or not accessible totalled 513 (6%) and 241 (3%), re-spectively. The resulting number of suitable articles was 1697 (20%),representing 3030 data entries in GASEMT, each equal to an individualmodelling application.
3.1. Geography of the modelling applications
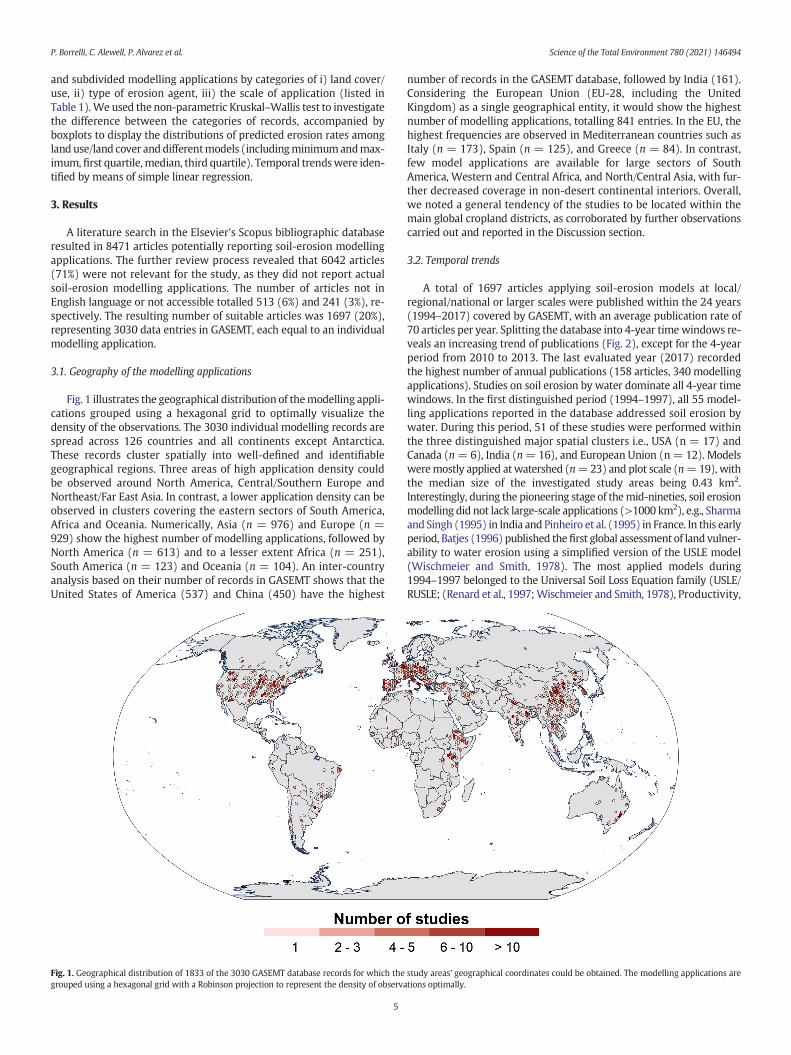
Fig. 1 illustrates the geographical distribution of themodelling appli-cations grouped using a hexagonal grid to optimally visualize thedensity of the observations. The 3030 individual modelling records arespread across 126 countries and all continents except Antarctica.These records cluster spatially into well-defined and identifiablegeographical regions. Three areas of high application density couldbe observed around North America, Central/Southern Europe andNortheast/Far East Asia. In contrast, a lower application density can beobserved in clusters covering the eastern sectors of South America,Africa and Oceania. Numerically, Asia (n = 976) and Europe (n =929) show the highest number of modelling applications, followed byNorth America (n = 613) and to a lesser extent Africa (n = 251),South America (n = 123) and Oceania (n = 104). An inter-countryanalysis based on their number of records in GASEMT shows that theUnited States of America (537) and China (450) have the highest
number of records in the GASEMT database, followed by India (161).Considering the European Union (EU-28, including the UnitedKingdom) as a single geographical entity, it would show the highestnumber of modelling applications, totalling 841 entries. In the EU, thehighest frequencies are observed in Mediterranean countries such asItaly (n = 173), Spain (n = 125), and Greece (n = 84). In contrast,few model applications are available for large sectors of SouthAmerica, Western and Central Africa, and North/Central Asia, with fur-ther decreased coverage in non-desert continental interiors. Overall,we noted a general tendency of the studies to be located within themain global cropland districts, as corroborated by further observationscarried out and reported in the Discussion section.
3.2. Temporal trends
A total of 1697 articles applying soil-erosion models at local/regional/national or larger scales were published within the 24 years(1994–2017) covered by GASEMT, with an average publication rate of70 articles per year. Splitting the database into 4-year timewindows re-veals an increasing trend of publications (Fig. 2), except for the 4-yearperiod from 2010 to 2013. The last evaluated year (2017) recordedthe highest number of annual publications (158 articles, 340 modellingapplications). Studies on soil erosion by water dominate all 4-year timewindows. In the first distinguished period (1994–1997), all 55 model-ling applications reported in the database addressed soil erosion bywater. During this period, 51 of these studies were performed withinthe three distinguished major spatial clusters i.e., USA (n = 17) andCanada (n= 6), India (n= 16), and European Union (n= 12). Modelsweremostly applied at watershed (n=23) and plot scale (n=19), withthe median size of the investigated study areas being 0.43 km2.Interestingly, during the pioneering stage of themid-nineties, soil erosionmodelling did not lack large-scale applications (>1000 km2), e.g., Sharmaand Singh (1995) in India and Pinheiro et al. (1995) in France. In this earlyperiod, Batjes (1996) published thefirst global assessment of land vulner-ability to water erosion using a simplified version of the USLE model(Wischmeier and Smith, 1978). The most applied models during1994–1997 belonged to the Universal Soil Loss Equation family (USLE/RUSLE; (Renard et al., 1997;Wischmeier and Smith, 1978), Productivity,
Fig. 1. Geographical distribution of 1833 of the 3030 GASEMT database records for which the study areas' geographical coordinates could be obtained. The modelling applications aregrouped using a hexagonal grid with a Robinson projection to represent the density of observations optimally.
P. Borrelli, C. Alewell, P. Alvarez et al. Science of the Total Environment 780 (2021) 146494
5
Erosion and Runoff Functions, to Evaluate Conservation Techniques(PERFECT; Littleboy et al., 1989), Water Erosion Prediction Model(WEPP; Flanagan and Nearing, 1995), the Limburg Soil ErosionModel (LISEM; De Roo et al., 1996) and the Areal Nonpoint SourceWatershed Environment Response Simulation (ANSWERS; Beasleyet al., 1980).
In time windows post-1997, modelling applications investigatingwind, tillage (downslope sediment redistribution due to tillage activ-ity), and harvest erosion (export of sediments with harvested plantsdue to soil attaching to roots or machine parts) become apparent inthe GASEMT database. Inmost time periods, the number of applicationsmodelling this suite of processes are below ten. Only in 2006–2009 and2014–2017 did tillage (n = 30) and wind erosion (n = 41) exceed tendatabase entries, respectively. Within 2014–2017, wind erosionmodelsshow an evident increase reaching a level of applications higher thanobserved in the previous 20 years. Most study areas with wind erosionmodelling records are located in the USA (n=32) and China (n=18),while applications are mostly regional (n = 34) and plot scale (n =30). Large scale modelling applications include five national (Baadeand Rekolainen, 2006; Borrelli et al., 2015; Hansen, 2007; Hansenet al., 2002; Mezosi et al., 2015), two continental (Borrelli et al.,2016, 2017a, 2017b) and one global-scale application (Chappelland Webb, 2016). The most commonly applied wind erosion modelsare the Wind Erosion Equation ((R)WEQ; Fryrear et al., 2001;Woodruff and Armbrust, 1968), the Single-event Wind ErosionEvaluation Program (SWEEP; Wagner, 2013), and the Wind ErosionPrediction System (WEPS; Wagner, 1996).
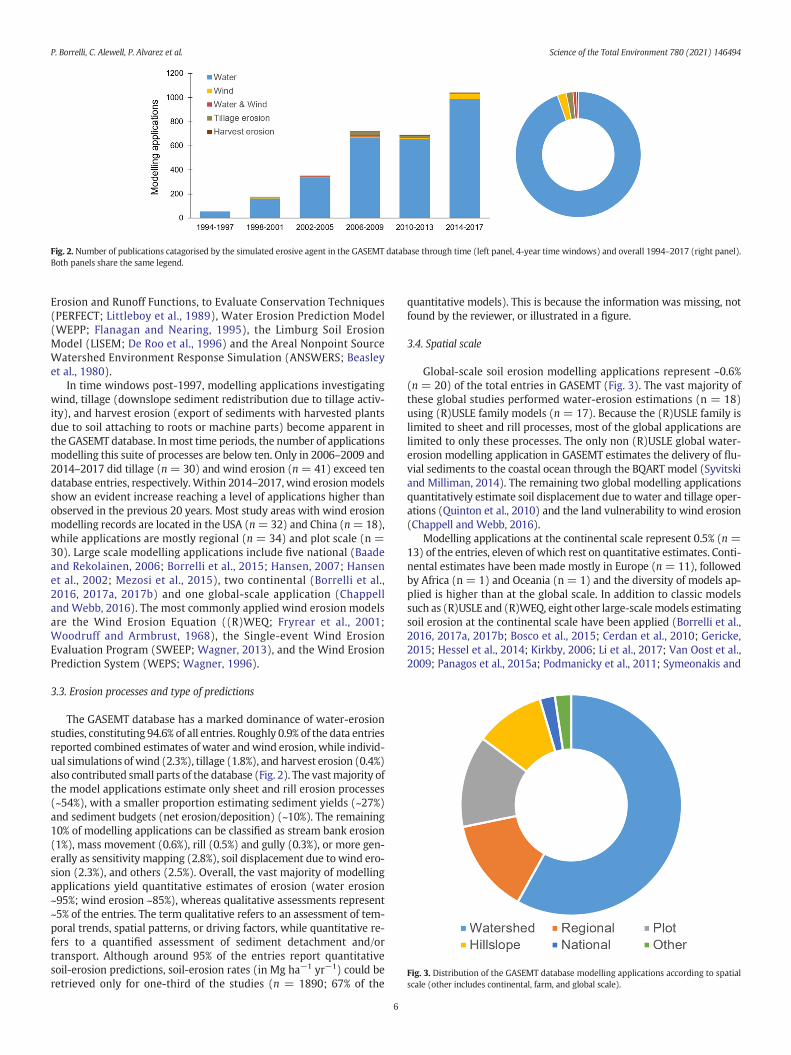
3.3. Erosion processes and type of predictions
The GASEMT database has a marked dominance of water-erosionstudies, constituting 94.6% of all entries. Roughly 0.9% of the data entriesreported combined estimates of water and wind erosion, while individ-ual simulations of wind (2.3%), tillage (1.8%), and harvest erosion (0.4%)also contributed small parts of the database (Fig. 2). The vastmajority ofthe model applications estimate only sheet and rill erosion processes(~54%), with a smaller proportion estimating sediment yields (~27%)and sediment budgets (net erosion/deposition) (~10%). The remaining10% of modelling applications can be classified as stream bank erosion(1%), mass movement (0.6%), rill (0.5%) and gully (0.3%), or more gen-erally as sensitivity mapping (2.8%), soil displacement due to wind ero-sion (2.3%), and others (2.5%). Overall, the vast majority of modellingapplications yield quantitative estimates of erosion (water erosion~95%; wind erosion ~85%), whereas qualitative assessments represent~5% of the entries. The term qualitative refers to an assessment of tem-poral trends, spatial patterns, or driving factors, while quantitative re-fers to a quantified assessment of sediment detachment and/ortransport. Although around 95% of the entries report quantitativesoil-erosion predictions, soil-erosion rates (in Mg ha−1 yr−1) could beretrieved only for one-third of the studies (n = 1890; 67% of the
quantitative models). This is because the information was missing, notfound by the reviewer, or illustrated in a figure.
3.4. Spatial scale
Global-scale soil erosion modelling applications represent ~0.6%(n = 20) of the total entries in GASEMT (Fig. 3). The vast majority ofthese global studies performed water-erosion estimations (n = 18)using (R)USLE family models (n = 17). Because the (R)USLE family islimited to sheet and rill processes, most of the global applications arelimited to only these processes. The only non (R)USLE global water-erosion modelling application in GASEMT estimates the delivery of flu-vial sediments to the coastal ocean through the BQART model (Syvitskiand Milliman, 2014). The remaining two global modelling applicationsquantitatively estimate soil displacement due to water and tillage oper-ations (Quinton et al., 2010) and the land vulnerability to wind erosion(Chappell and Webb, 2016).
Modelling applications at the continental scale represent 0.5% (n =13) of the entries, eleven of which rest on quantitative estimates. Conti-nental estimates have been made mostly in Europe (n = 11), followedby Africa (n = 1) and Oceania (n = 1) and the diversity of models ap-plied is higher than at the global scale. In addition to classic modelssuch as (R)USLE and (R)WEQ, eight other large-scalemodels estimatingsoil erosion at the continental scale have been applied (Borrelli et al.,2016, 2017a, 2017b; Bosco et al., 2015; Cerdan et al., 2010; Gericke,2015; Hessel et al., 2014; Kirkby, 2006; Li et al., 2017; Van Oost et al.,2009; Panagos et al., 2015a; Podmanicky et al., 2011; Symeonakis and
Fig. 2. Number of publications catagorised by the simulated erosive agent in the GASEMT database through time (left panel, 4-year time windows) and overall 1994–2017 (right panel).Both panels share the same legend.
Fig. 3. Distribution of the GASEMT database modelling applications according to spatialscale (other includes continental, farm, and global scale).
P. Borrelli, C. Alewell, P. Alvarez et al. Science of the Total Environment 780 (2021) 146494
6
Drake, 2010; Teng et al., 2016). Eleven out of 13 modelling applicationsrested on quantitative estimation of soil erosion.
We identified 67 (~2%) national-scale modelling applications,mostly applied in Europe (n = 34), Asia (n = 12), and North America(n = 9). Except for three wind erosion studies in the USA and Spain(Baade and Rekolainen, 2006;Hansen et al., 2002), all other quantitative(n=48) and qualitative (n=3) applications focus onwater erosion. Ofthese, the USA (n = 6), Czech Republic (n = 4), and Hungary (n = 4)are examples of countries with higher modelling applications.
About 14% (n = 418) of the recorded modelling exercises fall intoregional-scale applications (x̃ = 6131 km2). Although smaller in size,the watershed-scale applications have the largest share of entries inthe database (~59%), also including some very large study areas (x̃ =128.5 km2). The three remaining small-scale application categories arehillslope (~10%; x ̃ = 1 km2), farm/landscape (~0.4%; x ̃ = 0.65 km2),and plot scale (~12.8%; x̃ = 0.0018 km2).
3.5. Aims of the modelling application
In ~40% of the GASEMT modelling applications, the authors did notdescribe their specific aim. In these cases, we classify the records as‘general’ modelling exercises. They are to be considered as modellingapplications carried out to generically assess the risk or magnitude ofsoil erosion without a specific aim. This contrasts to studies explicitlyaiming to address land-use change, climate change, or their combinedeffects, which represent 20.4%, 3.5%, and 3% of the total, respectively.Other aims include the simulation of the impact of topographic change(3.7%), soil and water conservation (13.7%), ploughing impact (4.5%),forest harvesting (1.7%), wildfire (1.4%) andmining (0.3%). Studies sim-ulating soil erosion dynamics in the present (52.4%), past (26.7%), orboth (8.4%) representmost of the entries in thedatabase (i.e., 87.5%). Al-though less common, studies providing either future or combined pres-ent and future projections of soil erosion still cover a relevant share ofthe entries with 3.8% and 5.9%, respectively. For the remaining entries(~2.8%), the modelling application's temporal frame was not specified(classified as ‘unknown’ in GASEMT).
More than half of the modelling applications estimate soil erosionconsidering all types of land uses/land covers present in the investigatedarea (n = 1575; ~54.4%). Agricultural areas in general, and exclusivelyarable land, are modelled specifically in only about 13.6% and 9.3% ofthe cases, respectively. The remaining modelling applications addressforests (5.1%), grassland/rangeland (4.7%) and to a lesser extent baresoil (2.4%), pasturelands (1.4%), agroforestry (0.8%), riverbank (0.6%),and mine soil (0.1%). For the remaining ~7.5% of entries it was not pos-sible to retrieve land-use/cover information.
Concerning the procedures employed to describe land-use/coverconditions, according to the studies that explicitly provided this infor-mation (~79% of the total), most of the studies used existing land-usemaps (25.4%), created their maps through remote sensing (23.8%), orcombined the two (12.3%). A considerable number of studies (18.1%),however, performed field mapping/observations. For the remaining~20%, classification information was not available.
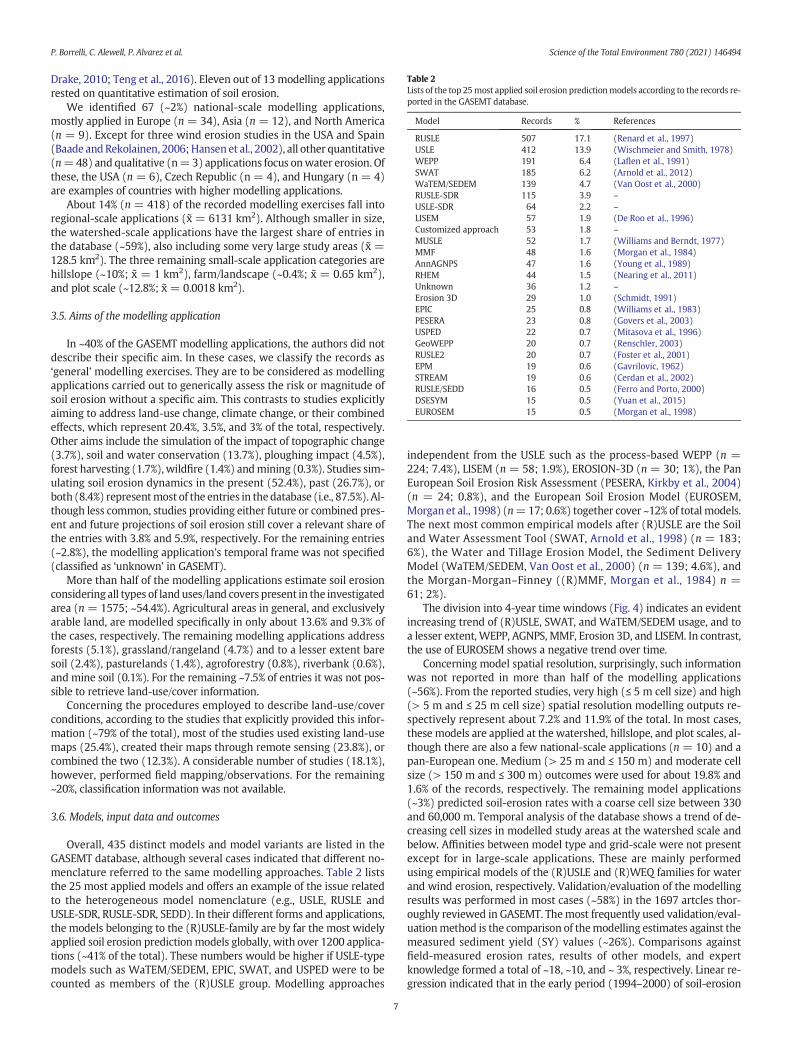
3.6. Models, input data and outcomes
Overall, 435 distinct models and model variants are listed in theGASEMT database, although several cases indicated that different no-menclature referred to the same modelling approaches. Table 2 liststhe 25 most applied models and offers an example of the issue relatedto the heterogeneous model nomenclature (e.g., USLE, RUSLE andUSLE-SDR, RUSLE-SDR, SEDD). In their different forms and applications,the models belonging to the (R)USLE-family are by far the most widelyapplied soil erosion predictionmodels globally, with over 1200 applica-tions (~41% of the total). These numbers would be higher if USLE-typemodels such as WaTEM/SEDEM, EPIC, SWAT, and USPED were to becounted as members of the (R)USLE group. Modelling approaches
independent from the USLE such as the process-based WEPP (n =224; 7.4%), LISEM (n = 58; 1.9%), EROSION-3D (n = 30; 1%), the PanEuropean Soil Erosion Risk Assessment (PESERA, Kirkby et al., 2004)(n = 24; 0.8%), and the European Soil Erosion Model (EUROSEM,Morgan et al., 1998) (n=17; 0.6%) together cover ~12% of total models.The next most common empirical models after (R)USLE are the Soiland Water Assessment Tool (SWAT, Arnold et al., 1998) (n = 183;6%), the Water and Tillage Erosion Model, the Sediment DeliveryModel (WaTEM/SEDEM, Van Oost et al., 2000) (n = 139; 4.6%), andthe Morgan-Morgan–Finney ((R)MMF, Morgan et al., 1984) n =61; 2%).
The division into 4-year time windows (Fig. 4) indicates an evidentincreasing trend of (R)USLE, SWAT, and WaTEM/SEDEM usage, and toa lesser extent, WEPP, AGNPS, MMF, Erosion 3D, and LISEM. In contrast,the use of EUROSEM shows a negative trend over time.
Concerning model spatial resolution, surprisingly, such informationwas not reported in more than half of the modelling applications(~56%). From the reported studies, very high (≤ 5 m cell size) and high(> 5 m and ≤ 25 m cell size) spatial resolution modelling outputs re-spectively represent about 7.2% and 11.9% of the total. In most cases,these models are applied at the watershed, hillslope, and plot scales, al-though there are also a few national-scale applications (n = 10) and apan-European one. Medium (> 25 m and ≤ 150 m) and moderate cellsize (> 150 m and ≤ 300 m) outcomes were used for about 19.8% and1.6% of the records, respectively. The remaining model applications(~3%) predicted soil-erosion rates with a coarse cell size between 330and 60,000 m. Temporal analysis of the database shows a trend of de-creasing cell sizes in modelled study areas at the watershed scale andbelow. Affinities between model type and grid-scale were not presentexcept for in large-scale applications. These are mainly performedusing empirical models of the (R)USLE and (R)WEQ families for waterand wind erosion, respectively. Validation/evaluation of the modellingresults was performed in most cases (~58%) in the 1697 artcles thor-oughly reviewed in GASEMT. Themost frequently used validation/eval-uationmethod is the comparison of themodelling estimates against themeasured sediment yield (SY) values (~26%). Comparisons againstfield-measured erosion rates, results of other models, and expertknowledge formed a total of ~18, ~10, and ~ 3%, respectively. Linear re-gression indicated that in the early period (1994–2000) of soil-erosion
Table 2Lists of the top 25most applied soil erosion predictionmodels according to the records re-ported in the GASEMT database.
Model Records % References
RUSLE 507 17.1 (Renard et al., 1997)USLE 412 13.9 (Wischmeier and Smith, 1978)WEPP 191 6.4 (Laflen et al., 1991)SWAT 185 6.2 (Arnold et al., 2012)WaTEM/SEDEM 139 4.7 (Van Oost et al., 2000)RUSLE-SDR 115 3.9 –USLE-SDR 64 2.2 –LISEM 57 1.9 (De Roo et al., 1996)Customized approach 53 1.8 –MUSLE 52 1.7 (Williams and Berndt, 1977)MMF 48 1.6 (Morgan et al., 1984)AnnAGNPS 47 1.6 (Young et al., 1989)RHEM 44 1.5 (Nearing et al., 2011)Unknown 36 1.2 –Erosion 3D 29 1.0 (Schmidt, 1991)EPIC 25 0.8 (Williams et al., 1983)PESERA 23 0.8 (Govers et al., 2003)USPED 22 0.7 (Mitasova et al., 1996)GeoWEPP 20 0.7 (Renschler, 2003)RUSLE2 20 0.7 (Foster et al., 2001)EPM 19 0.6 (Gavrilovic, 1962)STREAM 19 0.6 (Cerdan et al., 2002)RUSLE/SEDD 16 0.5 (Ferro and Porto, 2000)DSESYM 15 0.5 (Yuan et al., 2015)EUROSEM 15 0.5 (Morgan et al., 1998)
P. Borrelli, C. Alewell, P. Alvarez et al. Science of the Total Environment 780 (2021) 146494
7
modelling the percentage of studies accompanied by validation/evalua-tion was higher. Although not statistically significant, we observed aslightly decreasing trend starting in 2015. The vast majority of non-traditional models – those only applied around one to five times – pro-vide a validation/evaluation of the results. Of the most applied models,those with the highest share of validation/evaluation (>85%) areANSWERS, PERFECT, USLE-M, DSESYM, and EUROSEM. SWAT andWaTEM/SEDEM both have values around 80%, while LISEM, WEPP,and MMF total 72, 66, and 63.3%, respectively. Applications of USLEand RUSLE models show reasonably high (63–69%) validation/evalua-tion values when applied to simulate SY. However, these values dropwhen validating/evaluating hillslope gross erosion estimates (RUSLE:41%; USLE: 34%). Except for the modelling results validated/evaluatedthroughmeasured SY and comparisons with results from other models,different forms of validation/evaluation are not adequately detailed inthe current version of GASEMT. These were classified as ‘measured ero-sion rates’ or ‘expert knowledge’. These two categories are too broadand generic when considered a posteriori and should be better definedin future versions of the database. An extensive set of techniques are in-cluded in the validation/evaluation group, ranging from volumetric lossmeasurement (e.g., pins, cross-sections, contour gauge, and terrestriallaser scanning) to qualitative observations performed through field ob-servations and remote sensing. About one-third of the entries reportedmodel calibration. Themodels with the highest shares of calibration areSWAT, LISEM, WaTEM/SEDEM, and MMF. Specific information aboutthe calibration techniques was not collected, as these were found tobe highly variable and difficult to classify given the extensive range ofmodels considered.
Some level of field-based data collection exists in over half of themodelling application cases. In-situ soil erosion measurements are themost common field activity associated with modelling, followed byfield observation and soil sampling formodellingparametrization.Map-ping of erosion features is relatively infrequent, totalling less than 3% ofthe field activities.
3.7. Statistical analysis
Overall, the model area covers an approximated total surface of 48.3million km2. This area covers about 32% of theWorld's land area assum-ing (i) a total area of 149 million km2 and (ii) a marginal overlap be-tween the modelled areas contributing to the GASEMT database. Thepredicted annual soil erosion totals 80.4 billion Mg yr−1, with an aver-age area-specific soil erosion rate of 16.6 Mg ha−1 yr−1 (x ̃ =7.4 Mg ha−1 yr−1; σ = 39.8 Mg ha−1 yr−1). As expected, a significantdifference between median values of gross (x ̃ = 10 Mg ha−1 yr−1)and net (x̃=5.4Mgha−1 yr−1) erosion is observed. In the gross erosioncategory, all modelling applications that did not consider re-depositionare included (e.g., traditional (R)USLE-based models)). In contrast, thenet erosion category includes modelling applications that predictsediment yield from a plot, hillslope, or watershed. Models spatiallypredicting explicit net soil erosion/deposition rates (named in GASEMT
as sediment budget models, e.g., WaTEM/SEDEM) show a lower medianvalue equal to 4 Mg ha−1 yr−1 (x̄ = 14.1 Mg ha−1 yr−1).
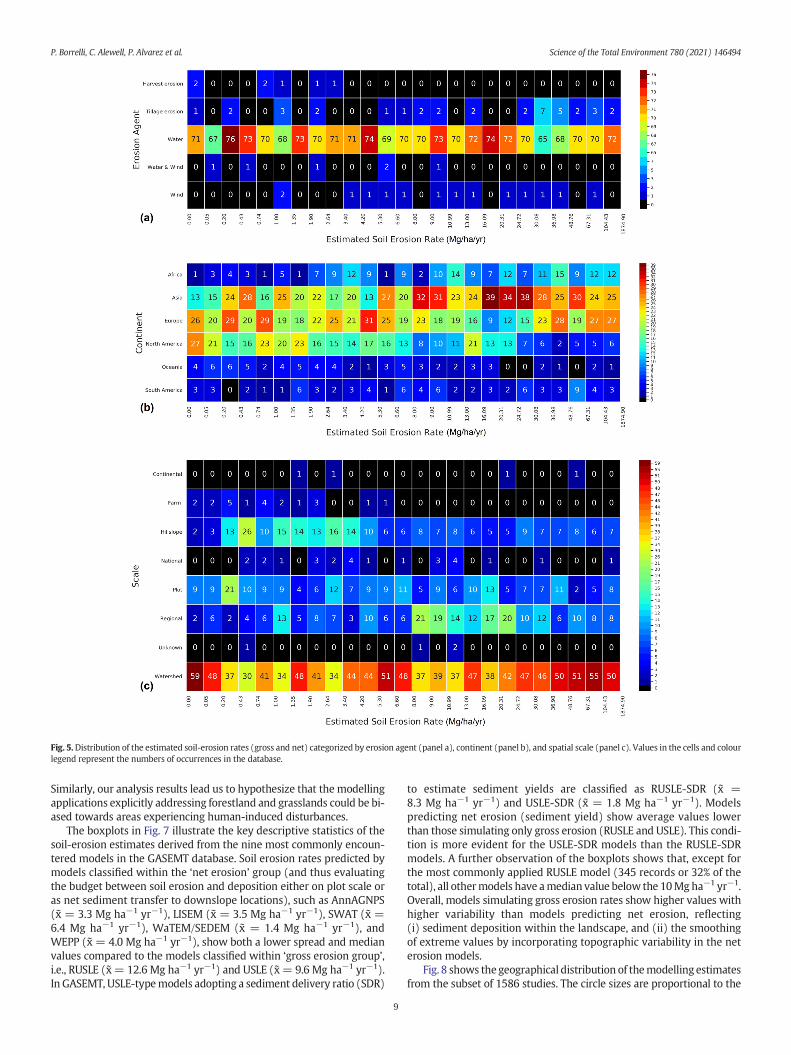
An analysis of estimated soil-erosion rates suggests thatmoderate tosevere erosion is a common phenomenon under all climatic conditionsencompassing all continents (except Antarctica). Fig. 5a shows that thevast majority of predicted soil-erosion rates refer to water erosion andto a much lesser extent to tillage (n = 37) and wind (n = 18) erosion.The predicted median values are 30.1 and 6.3 Mg ha−1 yr−1 for tillageand wind erosion, respectively. In terms of geographical region, thenumber of modelled occurrences of high and severe soil-erosion ratesin Asia and Europe exceeds that in Africa, South America, and NorthAmerica (Fig. 5b). Fig. 5c shows the categorical distribution of the pre-dicted soil erosion rates scaled by intensity. Extremely high averagerates (greater than 100 Mg ha−1 yr−1) of soil erosion are reported in57 studies (76 entries), of which most are predicted in watershed-scale applications in Europe (~40%), Asia (~30%), and Africa (~17%). Sur-prisingly, most of the applications with extremely high erosion rates(73%) are so-called ‘generic modelling assessments’, which typically in-dicates that a model has been applied to heterogeneous land cover/usethat includes natural and semi-natural vegetation (e.g., unmanagedgrassland, bushland). Therefore, these studies did not target specificland disturbances such as wildfires, forest logging, or land-use changesfor which severe soil erosion can be associated. Approximately 18% ofthe modelling applications reported in the GASEMT database aimed atland use or climate changes as the modelling objective.
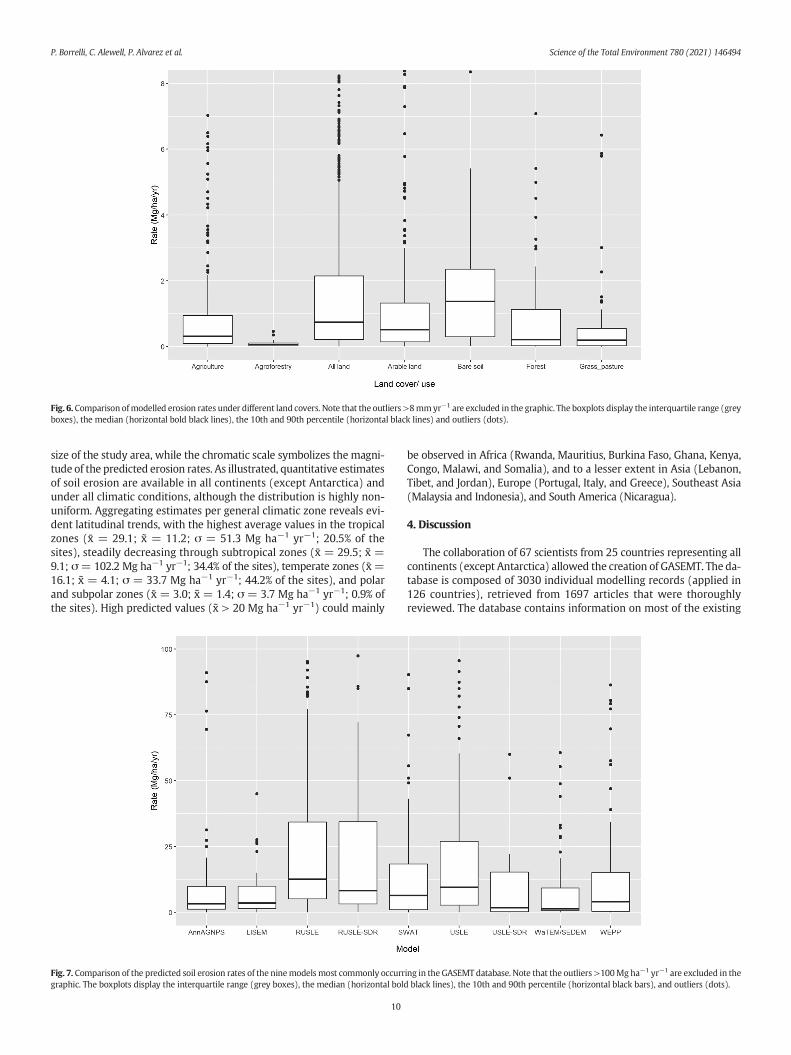
Comparing soil-erosion rates by land cover/use types (Fig. 6),we ob-serve a substantial decline in soil-erosion rates (reported in mm yr−1
assuming an average bulk density of 1.35 g cm−3) from bare soil (x̃ =1.2 mm yr−1) to agricultural areas (generic, x̃ = 0.3 mm yr−1; arableland, x̃ = 0.5 mm yr−1; agroforestry, x̃ = 0.1 mm yr−1), forests (x̃ =0.2 mm yr−1) and other forms of semi-natural vegetation (x ̃ =0.2 mm yr−1). When all land uses are modelled, we obtain a medianvalue of 0.75 mm yr−1. This distribution of soil erosion rates amongthe different land cover/use units fit those reported by Montgomery(2007) and Borrelli et al. (2017a, 2017b) for values observed fromfield measurements. However, the agreement is better for the valuespredicted in agricultural areas than those predicted in the grass and for-estland areas.
The non-parametric Kruskal-Wallis test confirmed the absence of astatistically significant difference between measured soil erosion ratesand those measured in arable lands. Modelled grass and forestlandrates show a tendency to exceed their field measurement counterpartswith median values in the order of 0.2 mm yr−1, considerably higherthan those observed in field measurements which are placed at 0.001and 0.01 mm yr−1 for forest and semi-natural vegetation, respectively.The disagreement between modelling results and field measurementscould be partially explained by the fact that in more than 50% of themodelling exercises considering forestland and grassland areas changesin land cover/use or vegetation disturbances are reported. Cerdan et al.(2010) hypothesized that field measurements in arable lands could bebiased towards areas known to be exposed to erosion processes.
Fig. 4. Number of publications according to models in the GASEMT database through time (left) (4-year time windows) and overall distribution (right).
P. Borrelli, C. Alewell, P. Alvarez et al. Science of the Total Environment 780 (2021) 146494
8
Similarly, our analysis results lead us to hypothesize that the modellingapplications explicitly addressing forestland and grasslands could be bi-ased towards areas experiencing human-induced disturbances.
The boxplots in Fig. 7 illustrate the key descriptive statistics of thesoil-erosion estimates derived from the nine most commonly encoun-tered models in the GASEMT database. Soil erosion rates predicted bymodels classified within the ‘net erosion’ group (and thus evaluatingthe budget between soil erosion and deposition either on plot scale oras net sediment transfer to downslope locations), such as AnnAGNPS(x̃ = 3.3 Mg ha−1 yr−1), LISEM (x̃ = 3.5 Mg ha−1 yr−1), SWAT (x̃ =6.4 Mg ha−1 yr−1), WaTEM/SEDEM (x ̃ = 1.4 Mg ha−1 yr−1), andWEPP (x̃ = 4.0 Mg ha−1 yr−1), show both a lower spread and medianvalues compared to the models classified within ‘gross erosion group’,i.e., RUSLE (x̃ = 12.6 Mg ha−1 yr−1) and USLE (x̃ = 9.6 Mg ha−1 yr−1).In GASEMT, USLE-typemodels adopting a sediment delivery ratio (SDR)
to estimate sediment yields are classified as RUSLE-SDR (x ̃ =8.3 Mg ha−1 yr−1) and USLE-SDR (x ̃ = 1.8 Mg ha−1 yr−1). Modelspredicting net erosion (sediment yield) show average values lowerthan those simulating only gross erosion (RUSLE and USLE). This condi-tion is more evident for the USLE-SDR models than the RUSLE-SDRmodels. A further observation of the boxplots shows that, except forthe most commonly applied RUSLE model (345 records or 32% of thetotal), all othermodels have amedian value below the 10Mgha−1 yr−1.Overall, models simulating gross erosion rates show higher values withhigher variability than models predicting net erosion, reflecting(i) sediment deposition within the landscape, and (ii) the smoothingof extreme values by incorporating topographic variability in the neterosion models.
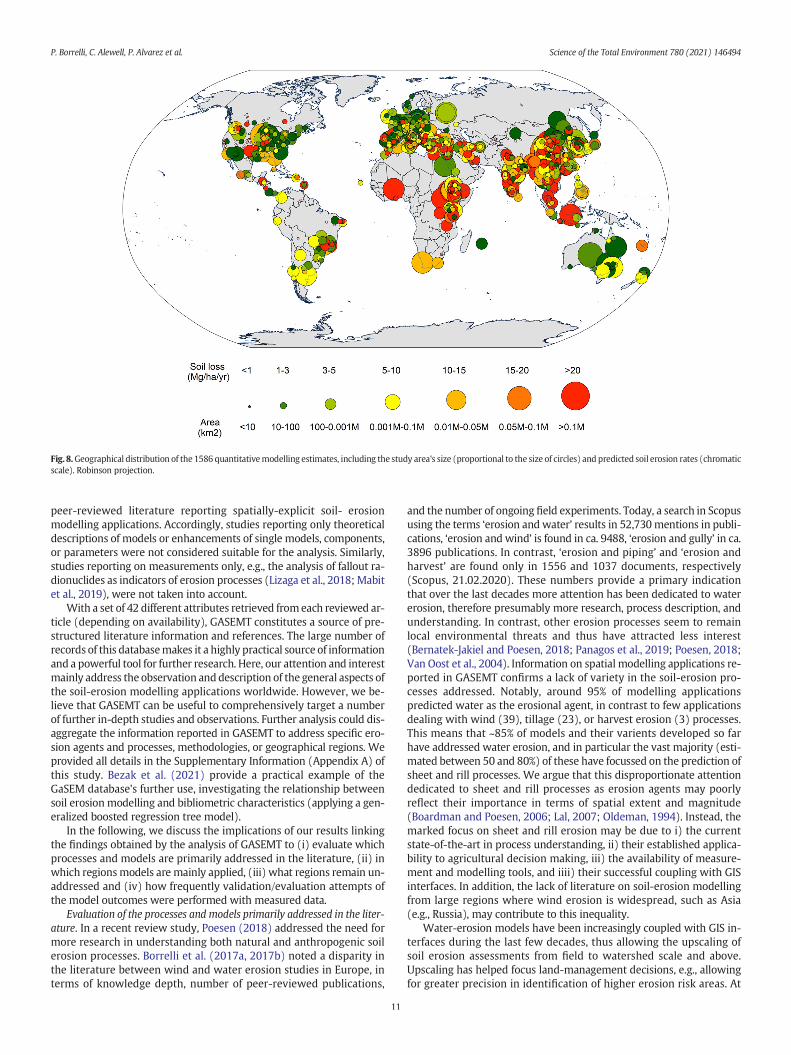
Fig. 8 shows the geographical distribution of themodelling estimatesfrom the subset of 1586 studies. The circle sizes are proportional to the
Fig. 5.Distribution of the estimated soil-erosion rates (gross and net) categorized by erosion agent (panel a), continent (panel b), and spatial scale (panel c). Values in the cells and colourlegend represent the numbers of occurrences in the database.
P. Borrelli, C. Alewell, P. Alvarez et al. Science of the Total Environment 780 (2021) 146494
9
size of the study area, while the chromatic scale symbolizes the magni-tude of the predicted erosion rates. As illustrated, quantitative estimatesof soil erosion are available in all continents (except Antarctica) andunder all climatic conditions, although the distribution is highly non-uniform. Aggregating estimates per general climatic zone reveals evi-dent latitudinal trends, with the highest average values in the tropicalzones (x ̄ = 29.1; x ̃ = 11.2; σ = 51.3 Mg ha−1 yr−1; 20.5% of thesites), steadily decreasing through subtropical zones (x ̄ = 29.5; x ̃ =9.1; σ= 102.2 Mg ha−1 yr−1; 34.4% of the sites), temperate zones (x̄ =16.1; x̃ = 4.1; σ = 33.7 Mg ha−1 yr−1; 44.2% of the sites), and polarand subpolar zones (x̄ = 3.0; x̃ = 1.4; σ = 3.7 Mg ha−1 yr−1; 0.9% ofthe sites). High predicted values (x̃ > 20 Mg ha−1 yr−1) could mainly
be observed in Africa (Rwanda, Mauritius, Burkina Faso, Ghana, Kenya,Congo, Malawi, and Somalia), and to a lesser extent in Asia (Lebanon,Tibet, and Jordan), Europe (Portugal, Italy, and Greece), Southeast Asia(Malaysia and Indonesia), and South America (Nicaragua).
4. Discussion
The collaboration of 67 scientists from 25 countries representing allcontinents (except Antarctica) allowed the creation of GASEMT. The da-tabase is composed of 3030 individual modelling records (applied in126 countries), retrieved from 1697 articles that were thoroughlyreviewed. The database contains information on most of the existing
Fig. 6. Comparison ofmodelled erosion rates under different land covers. Note that the outliers >8mmyr−1 are excluded in the graphic. The boxplots display the interquartile range (greyboxes), the median (horizontal bold black lines), the 10th and 90th percentile (horizontal black lines) and outliers (dots).
Fig. 7. Comparison of the predicted soil erosion rates of the ninemodels most commonly occurring in the GASEMT database. Note that the outliers >100Mg ha−1 yr−1 are excluded in thegraphic. The boxplots display the interquartile range (grey boxes), the median (horizontal bold black lines), the 10th and 90th percentile (horizontal black bars), and outliers (dots).
P. Borrelli, C. Alewell, P. Alvarez et al. Science of the Total Environment 780 (2021) 146494
10
peer-reviewed literature reporting spatially-explicit soil- erosionmodelling applications. Accordingly, studies reporting only theoreticaldescriptions of models or enhancements of single models, components,or parameters were not considered suitable for the analysis. Similarly,studies reporting on measurements only, e.g., the analysis of fallout ra-dionuclides as indicators of erosion processes (Lizaga et al., 2018; Mabitet al., 2019), were not taken into account.
With a set of 42 different attributes retrieved fromeach reviewed ar-ticle (depending on availability), GASEMT constitutes a source of pre-structured literature information and references. The large number ofrecords of this databasemakes it a highly practical source of informationand a powerful tool for further research. Here, our attention and interestmainly address the observation and description of the general aspects ofthe soil-erosion modelling applications worldwide. However, we be-lieve that GASEMT can be useful to comprehensively target a numberof further in-depth studies and observations. Further analysis could dis-aggregate the information reported in GASEMT to address specific ero-sion agents and processes, methodologies, or geographical regions. Weprovided all details in the Supplementary Information (Appendix A) ofthis study. Bezak et al. (2021) provide a practical example of theGaSEM database's further use, investigating the relationship betweensoil erosion modelling and bibliometric characteristics (applying a gen-eralized boosted regression tree model).
In the following, we discuss the implications of our results linkingthe findings obtained by the analysis of GASEMT to (i) evaluate whichprocesses and models are primarily addressed in the literature, (ii) inwhich regionsmodels are mainly applied, (iii) what regions remain un-addressed and (iv) how frequently validation/evaluation attempts ofthe model outcomes were performed with measured data.
Evaluation of the processes and models primarily addressed in the liter-ature. In a recent review study, Poesen (2018) addressed the need formore research in understanding both natural and anthropogenic soilerosion processes. Borrelli et al. (2017a, 2017b) noted a disparity inthe literature between wind and water erosion studies in Europe, interms of knowledge depth, number of peer-reviewed publications,
and the number of ongoing field experiments. Today, a search in Scopususing the terms ‘erosion and water’ results in 52,730mentions in publi-cations, ‘erosion and wind’ is found in ca. 9488, ‘erosion and gully’ in ca.3896 publications. In contrast, ‘erosion and piping’ and ‘erosion andharvest’ are found only in 1556 and 1037 documents, respectively(Scopus, 21.02.2020). These numbers provide a primary indicationthat over the last decades more attention has been dedicated to watererosion, therefore presumably more research, process description, andunderstanding. In contrast, other erosion processes seem to remainlocal environmental threats and thus have attracted less interest(Bernatek-Jakiel and Poesen, 2018; Panagos et al., 2019; Poesen, 2018;Van Oost et al., 2004). Information on spatial modelling applications re-ported in GASEMT confirms a lack of variety in the soil-erosion pro-cesses addressed. Notably, around 95% of modelling applicationspredicted water as the erosional agent, in contrast to few applicationsdealing with wind (39), tillage (23), or harvest erosion (3) processes.This means that ~85% of models and their varients developed so farhave addressed water erosion, and in particular the vast majority (esti-mated between 50 and 80%) of these have focussed on the prediction ofsheet and rill processes. We argue that this disproportionate attentiondedicated to sheet and rill processes as erosion agents may poorlyreflect their importance in terms of spatial extent and magnitude(Boardman and Poesen, 2006; Lal, 2007; Oldeman, 1994). Instead, themarked focus on sheet and rill erosion may be due to i) the currentstate-of-the-art in process understanding, ii) their established applica-bility to agricultural decision making, iii) the availability of measure-ment and modelling tools, and iiii) their successful coupling with GISinterfaces. In addition, the lack of literature on soil-erosion modellingfrom large regions where wind erosion is widespread, such as Asia(e.g., Russia), may contribute to this inequality.
Water-erosion models have been increasingly coupled with GIS in-terfaces during the last few decades, thus allowing the upscaling ofsoil erosion assessments from field to watershed scale and above.Upscaling has helped focus land-management decisions, e.g., allowingfor greater precision in identification of higher erosion risk areas. At
Fig. 8.Geographical distribution of the 1586 quantitativemodelling estimates, including the study area's size (proportional to the size of circles) and predicted soil erosion rates (chromaticscale). Robinson projection.
P. Borrelli, C. Alewell, P. Alvarez et al. Science of the Total Environment 780 (2021) 146494
11
the same time, quantitative attempts to integrate wind and tillage ero-sion prediction models into GIS environments have been less straight-forward, although quite a few applications have reached beyond thefield scale. For instance, the latest reference document of the UN (FAOand ITPS, 2015) reports that a likely range of global soil erosion bywater is 20–30 Gt yr−1, while tillage erosion may amount to ca. 5 Gtyr−1. These numbers, presumably based on the study of Quinton et al.(2010) reported in GASEMT, suggest that tillage erosion could accountfor up to 25% of water erosion globally. Modelling results reported byBorrelli et al. (2017a, 2017b) indicated that wind erosionmight be a rel-evant phenomenon for Europe, although this land-degradation processhas been overlooked until very recently. Their estimates suggest soilerosion values can be particularly high for the arable land of Denmark(~3 Mg ha−1 yr−1), the Netherlands (2.6 Mg ha−1 yr−1), and theUnited Kingdom (~1 Mg ha−1 yr−1); indicating that wind erosion maybe a major agent of soil erosion in localised areas. Quantitative assess-ments of wind erosion over large areas in China and Iran reported inGASEMT show average soil-erosion values well above 10 Mg ha−1 yr−1
(Jabbar et al., 2006; Rezaei et al., 2016; Zhang andMcBean, 2016). In ad-dition, the 37% of the GASEMT records reporting wind and tillage ero-sion predicted high soil erosion rates (x ̃ = 10.2 Mg ha−1 yr−1) thatmay locally represent a threat to agricultural productivity and the sus-tainability of the Earth's natural resources.
Broad spatiotemporal trends inmodel applications are evident glob-ally. In their different forms and applications, models belonging to the(R)USLE-family are by far the most widely applied soil-erosion modelsglobally. They cover ~41% of the total records in the database. Thisvalue could increase to ~55% if USLE-based models such as WaTEM/SEDEM, EPIC, SWAT were included in the same category. In line withthe observation of Alewell et al. (2019), we also found a strong risingtrend (R2 0.82 significance level < 0.001) of (R)USLE-type applicationsacross all continents. Other models showing both rising trends andworldwide applications are SWAT (R2 0.78 significance level < 0.001),WEPP-type (R2 0.27 significance level < 0.01), WaTEM/SEDEM (R2
0.27 significance level < 0.01), and to a lesser extent RHEM (R2 0.21 sig-nificance level < 0.02) which remains almost exclusively applied in theUnited States of America. Other models had either no significant trend(MMF-type, LISEM) or had slightly negative trends (EUROSEM). In2017, the last year of our observations, RUSLE-type applications (n =153)were usedmany timesmore frequently as themost commonly ap-plied process-basedmodels, i.e.,WEPP (n=11), RHEM (n=6), PESERA(n = 2), LISEM (n = 1), EUROSEM (n = 0).
Regions wheremodels are mainly applied. We analysed the spatial dis-tribution of modelling applications using a subset of 1833 records forwhich the spatial coordinates of their centroids could be gathered(shown in Fig. 1). The worldwide increase in usage of models with lowinput demand, such as (R)USLE-type, SWAT, andWaTEM/SEDEM, is ac-companied by a significant rise in the size of themodelled areas (R2 0.41significance level < 0.001). The geographical distribution of soil-erosionmodelling itself is clustered within well-defined geographical regions inNorth America, Europe and Southeast Asia. We found six countries topossess about 50% of the total modelling studies (i.e., United States ofAmerica, China, Italy, India, Spain and Australia). A higher incidence ofmodelled sites in temperate and subtropical zones can be also observed,while theoccurrence in tropical regions is notably lower (~15%). This sit-uation contrasts with a general understanding of the geography of soil-erosion processes emerging from field observations, indicating thattropical zones are more prone to erosion (Boardman, 2006). A phenom-enon also confirmed by global expert-based qualitative assessmentssuch as (GLASOD; Oldeman, 1994) and quantitative modelling descrip-tions of major soil-erosion drivers (Chappell and Webb, 2016; Panagoset al., 2017), which indicate tropical regions as being highly susceptibleto erosion (Labrière et al., 2015). The GASEMT database demonstratesthe lower incidence of studies in the tropics and subtropical regions,while latitudinal trends indicate higher soil erosion on average in thetropics (Fig. 8). The gradually increasing erosion rates from the subpolar
zones to the temperate, the subtropical, andfinally the tropics are pairedwith decreasing investigation intensity and thus a noticeable lack ofknowledge. This situation indicates that the urgency of environmentalimpact assessment does not necessarily drive erosion modelling, butmore the spatial occurrence and frequency of studies in the countriespublishing the most science articles in peer-reviewed journals (Forbes,2020). García-Ruiz et al. (2015) observed in a similar study evaluatingmeasured soil erosion rates that their spatial occurrence does not neces-sarily reflect the regional relevance of soil erosion processes, but ratherthe spatial concomitance of soil-erosion processes with scientific groupsinterested in this topic and publishing their research outcomes in inter-national literature. The overall volume of research on soil erosionmodelling may be considerably larger, as suggested by the 419,000 re-sults obtained searching for ‘soil erosion modelling’ in Google Scholar.
A comparison of the spatial patterns of the soil erosion ratemeasure-ments collected by García-Ruiz et al. (2015) (Fig. 9) and the modellingapplications gathered in this study (Fig. 8) indicates that model applica-tions have amore even distribution globally. Although a significant spa-tial agreement between the two datasets can be observed in North andSouth America, Western Europe, and Eastern Africa, models appear tobe more applied in regions that rarely report field measurements suchas India, China, and Southeast Asia. While it is generally agreed in thescientific world that models should be validated/evaluated with mea-sured data, erosion measurements are often as uncertain as modelling(Batista et al., 2019; Alewell et al., 2019), and are not in existence inmany areas of the world. As such, modelling endeavours must be seenas hypotheses on temporal trends, spatial patterns, driving factors,and triggering processes.
Regions unaddressed by modelling. Without considering global andcontinental-scale studies, plot- to national-scale modelling applicationswould jointly cover a surface of approximately 48 million km2, equal to32% of theworld's land. This estimate assumesmarginal overlap betweenthe modelled areas within the GASEMT records. Further analysis/refine-ment of the data, excluding the most apparent spatial overlaps, resultsin about 35 million km2 of modelled land, or a realistic range between25 and 35 million km2. Of this 35 million km2, about 66% is due tonational-scale studies in the USA (~28.4%), China (~27.7%), and India(~9.5%). As expected from model application frequency, soil erosion bywater dominatedmost of themodelled area, leavingwind and tillage ero-sion with values at approximately 2.5 and 0.12 million km2, respectively.
We noted a general tendency of studies to be located around themain global cropland areas. These insights are corroborated byFig. 10a, which overlaps the hexagonal pixels of modelled areas toglobal croplands (Hurtt et al., 2020; Stehfest et al., 2014). Based on theavailable peer-reviewed English-language journals, large areasexploited for crop production in Russia and East Europe, Central Asia,throughoutmost of Africa, and SouthAmerica seem to be poorly studiedthrough soil-erosion modelling. However, this can also be the result ofmore publishing in the local language or technical reports.
Fig. 10b presents the average annual rainfall for the period1960–1990 (www.worldclim.org). Comparing rainfall patterns inFig. 10b with the soil-erosion modelling applications indicates thatareas characterized by low to medium rainfall values have been moreintensely studied compared to regions in wet climates covered or for-merly covered by tropical rainforest. These conditions are particularlynoticeable along areas characterized by high rainfall erosivity inSouth-Eastern Asia (Cambodia, Indonesia, Malaysia, the Philippines,and Bangladesh), Central Africa (Congo and Cameroon), SouthAmerica (Brazil, Colombia, and Peru), Central America, and the Carib-bean (Panagos et al., 2017). Some of the regions poorly represented bysoil-erosionmodelling studies have experienced, andwill probably con-tinue to experience (Global Change AssessmentModel (GCAM) RCP 6.0,Hurtt et al., 2020) (Fig. 10c), increasing trends of forest logging andcropland expansion (Hansen et al., 2013). This vulnerability could alsobe accompanied by a trend towards increasing rainfall intensities inthese regions, as predicted by several future projections (Hijmans
P. Borrelli, C. Alewell, P. Alvarez et al. Science of the Total Environment 780 (2021) 146494
12
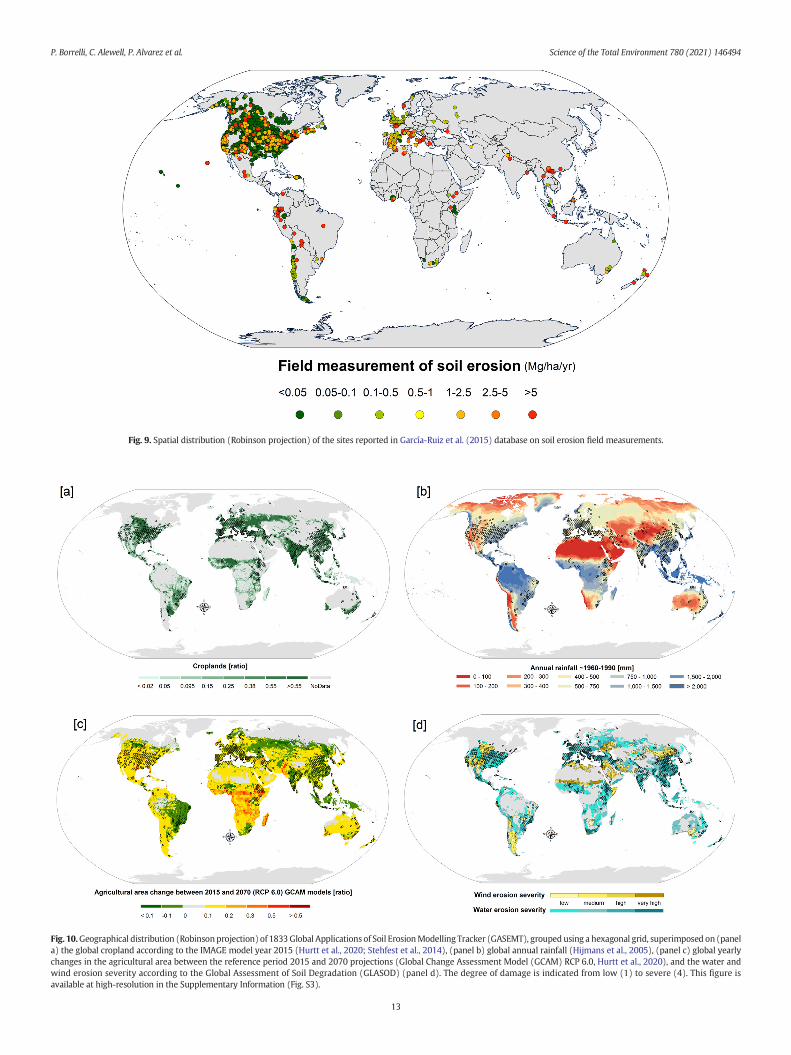
Fig. 10.Geographical distribution (Robinsonprojection) of 1833Global Applications of Soil ErosionModelling Tracker (GASEMT), grouped using a hexagonal grid, superimposed on (panela) the global cropland according to the IMAGE model year 2015 (Hurtt et al., 2020; Stehfest et al., 2014), (panel b) global annual rainfall (Hijmans et al., 2005), (panel c) global yearlychanges in the agricultural area between the reference period 2015 and 2070 projections (Global Change Assessment Model (GCAM) RCP 6.0, Hurtt et al., 2020), and the water andwind erosion severity according to the Global Assessment of Soil Degradation (GLASOD) (panel d). The degree of damage is indicated from low (1) to severe (4). This figure isavailable at high-resolution in the Supplementary Information (Fig. S3).
Fig. 9. Spatial distribution (Robinson projection) of the sites reported in García-Ruiz et al. (2015) database on soil erosion field measurements.
P. Borrelli, C. Alewell, P. Alvarez et al. Science of the Total Environment 780 (2021) 146494
13
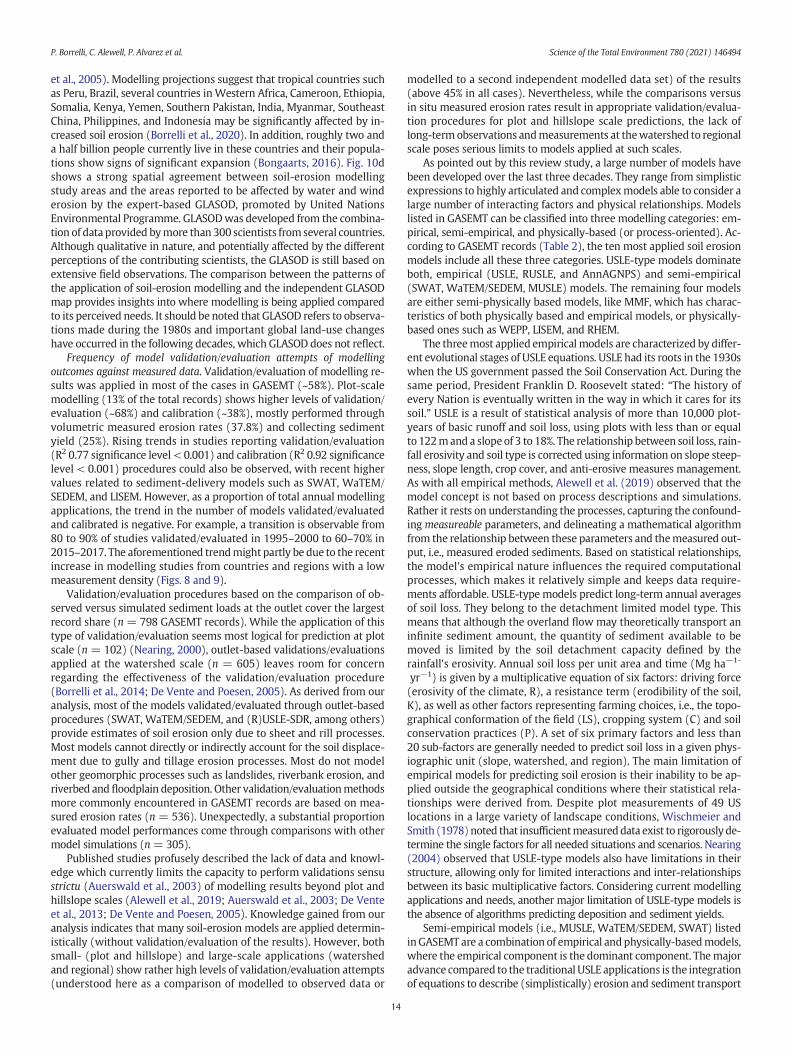
et al., 2005). Modelling projections suggest that tropical countries suchas Peru, Brazil, several countries inWestern Africa, Cameroon, Ethiopia,Somalia, Kenya, Yemen, Southern Pakistan, India, Myanmar, SoutheastChina, Philippines, and Indonesia may be significantly affected by in-creased soil erosion (Borrelli et al., 2020). In addition, roughly two anda half billion people currently live in these countries and their popula-tions show signs of significant expansion (Bongaarts, 2016). Fig. 10dshows a strong spatial agreement between soil-erosion modellingstudy areas and the areas reported to be affected by water and winderosion by the expert-based GLASOD, promoted by United NationsEnvironmental Programme. GLASODwas developed from the combina-tion of data provided bymore than 300 scientists from several countries.Although qualitative in nature, and potentially affected by the differentperceptions of the contributing scientists, the GLASOD is still based onextensive field observations. The comparison between the patterns ofthe application of soil-erosion modelling and the independent GLASODmap provides insights into where modelling is being applied comparedto its perceived needs. It should be noted that GLASOD refers to observa-tions made during the 1980s and important global land-use changeshave occurred in the following decades, which GLASOD does not reflect.
Frequency of model validation/evaluation attempts of modellingoutcomes against measured data. Validation/evaluation of modelling re-sults was applied in most of the cases in GASEMT (~58%). Plot-scalemodelling (13% of the total records) shows higher levels of validation/evaluation (~68%) and calibration (~38%), mostly performed throughvolumetric measured erosion rates (37.8%) and collecting sedimentyield (25%). Rising trends in studies reporting validation/evaluation(R2 0.77 significance level < 0.001) and calibration (R2 0.92 significancelevel < 0.001) procedures could also be observed, with recent highervalues related to sediment-delivery models such as SWAT, WaTEM/SEDEM, and LISEM. However, as a proportion of total annual modellingapplications, the trend in the number of models validated/evaluatedand calibrated is negative. For example, a transition is observable from80 to 90% of studies validated/evaluated in 1995–2000 to 60–70% in2015–2017. The aforementioned trendmight partly be due to the recentincrease in modelling studies from countries and regions with a lowmeasurement density (Figs. 8 and 9).
Validation/evaluation procedures based on the comparison of ob-served versus simulated sediment loads at the outlet cover the largestrecord share (n = 798 GASEMT records). While the application of thistype of validation/evaluation seems most logical for prediction at plotscale (n = 102) (Nearing, 2000), outlet-based validations/evaluationsapplied at the watershed scale (n = 605) leaves room for concernregarding the effectiveness of the validation/evaluation procedure(Borrelli et al., 2014; De Vente and Poesen, 2005). As derived from ouranalysis, most of the models validated/evaluated through outlet-basedprocedures (SWAT, WaTEM/SEDEM, and (R)USLE-SDR, among others)provide estimates of soil erosion only due to sheet and rill processes.Most models cannot directly or indirectly account for the soil displace-ment due to gully and tillage erosion processes. Most do not modelother geomorphic processes such as landslides, riverbank erosion, andriverbed and floodplain deposition. Other validation/evaluationmethodsmore commonly encountered in GASEMT records are based on mea-sured erosion rates (n = 536). Unexpectedly, a substantial proportionevaluated model performances come through comparisons with othermodel simulations (n = 305).
Published studies profusely described the lack of data and knowl-edge which currently limits the capacity to perform validations sensustrictu (Auerswald et al., 2003) of modelling results beyond plot andhillslope scales (Alewell et al., 2019; Auerswald et al., 2003; De Venteet al., 2013; De Vente and Poesen, 2005). Knowledge gained from ouranalysis indicates that many soil-erosion models are applied determin-istically (without validation/evaluation of the results). However, bothsmall- (plot and hillslope) and large-scale applications (watershedand regional) show rather high levels of validation/evaluation attempts(understood here as a comparison of modelled to observed data or
modelled to a second independent modelled data set) of the results(above 45% in all cases). Nevertheless, while the comparisons versusin situ measured erosion rates result in appropriate validation/evalua-tion procedures for plot and hillslope scale predictions, the lack oflong-term observations andmeasurements at thewatershed to regionalscale poses serious limits to models applied at such scales.
As pointed out by this review study, a large number of models havebeen developed over the last three decades. They range from simplisticexpressions to highly articulated and complexmodels able to consider alarge number of interacting factors and physical relationships. Modelslisted in GASEMT can be classified into three modelling categories: em-pirical, semi-empirical, and physically-based (or process-oriented). Ac-cording to GASEMT records (Table 2), the ten most applied soil erosionmodels include all these three categories. USLE-type models dominateboth, empirical (USLE, RUSLE, and AnnAGNPS) and semi-empirical(SWAT, WaTEM/SEDEM, MUSLE) models. The remaining four modelsare either semi-physically based models, like MMF, which has charac-teristics of both physically based and empirical models, or physically-based ones such as WEPP, LISEM, and RHEM.
The threemost applied empiricalmodels are characterized by differ-ent evolutional stages of USLE equations. USLE had its roots in the 1930swhen the US government passed the Soil Conservation Act. During thesame period, President Franklin D. Roosevelt stated: “The history ofevery Nation is eventually written in the way in which it cares for itssoil.” USLE is a result of statistical analysis of more than 10,000 plot-years of basic runoff and soil loss, using plots with less than or equalto 122mand a slope of 3 to 18%. The relationship between soil loss, rain-fall erosivity and soil type is corrected using information on slope steep-ness, slope length, crop cover, and anti-erosive measures management.As with all empirical methods, Alewell et al. (2019) observed that themodel concept is not based on process descriptions and simulations.Rather it rests on understanding the processes, capturing the confound-ingmeasureable parameters, and delineating a mathematical algorithmfrom the relationship between these parameters and themeasured out-put, i.e., measured eroded sediments. Based on statistical relationships,the model's empirical nature influences the required computationalprocesses, which makes it relatively simple and keeps data require-ments affordable. USLE-type models predict long-term annual averagesof soil loss. They belong to the detachment limited model type. Thismeans that although the overland flow may theoretically transport aninfinite sediment amount, the quantity of sediment available to bemoved is limited by the soil detachment capacity defined by therainfall's erosivity. Annual soil loss per unit area and time (Mg ha−1-
yr−1) is given by a multiplicative equation of six factors: driving force(erosivity of the climate, R), a resistance term (erodibility of the soil,K), as well as other factors representing farming choices, i.e., the topo-graphical conformation of the field (LS), cropping system (C) and soilconservation practices (P). A set of six primary factors and less than20 sub-factors are generally needed to predict soil loss in a given phys-iographic unit (slope, watershed, and region). The main limitation ofempirical models for predicting soil erosion is their inability to be ap-plied outside the geographical conditions where their statistical rela-tionships were derived from. Despite plot measurements of 49 USlocations in a large variety of landscape conditions, Wischmeier andSmith (1978) noted that insufficientmeasureddata exist to rigorously de-termine the single factors for all needed situations and scenarios. Nearing(2004) observed that USLE-type models also have limitations in theirstructure, allowing only for limited interactions and inter-relationshipsbetween its basic multiplicative factors. Considering current modellingapplications and needs, another major limitation of USLE-type models isthe absence of algorithms predicting deposition and sediment yields.
Semi-empirical models (i.e., MUSLE, WaTEM/SEDEM, SWAT) listedinGASEMT are a combination of empirical andphysically-basedmodels,where the empirical component is the dominant component. Themajoradvance compared to the traditional USLE applications is the integrationof equations to describe (simplistically) erosion and sediment transport
P. Borrelli, C. Alewell, P. Alvarez et al. Science of the Total Environment 780 (2021) 146494
14
processes in order to predict sediment yields. MUSLE and SWAT sharethe samemodelling schemewith aminimal difference. They implementUSLE replacing climate R factor with the total event runoff (m3) and theevent peak discharge (m3 s−1), while all other USLE factors (K, LS, C, andP) remain unchanged. This modification allows the equation to be ap-plied to individual stormevents (Arnold et al., 1998). A partial drawbackof such models is their semi-distributed nature, which only allows esti-mating the amounts of sediment produced at watershed outlets, with-out providing spatially explicit results. In this regard, WaTEM/SEDEMrepresents a substantial difference. It is a spatially distributed sedimentdelivery model capable to represent erosion and deposition areas forsingle raster cells (and river sediment yields). Unlike SWAT andMUSLE, WaTEM/SEDEM is not a continuous-time model and can onlyestimate long-term average rates of annual soil loss and deposition.The soil loss is computed with the very same multi-parameter schemegenerally used by USLE-type models. Subsequently, the model routessediments downslope across each pixel from hillslopes to the riverinesystems, using a transport capacity coefficient computed based on to-pography and land cover. A further improvement of models such asMUSLE, WaTEM/SEDEM, SWAT is the calibration of some input pa-rameters against observed data, e.g., water discharge and sedimentconcentration.
Physically-based models, or process-oriented, result from more re-cent efforts to more comprehensively represent the complexity of soilerosion, transport, and deposition processes. They consist of algorithmsderived from theoretical principles that aim to explain and predict Earthsystem's dynamic behavior as a whole. These models have advantagescompared to empirical and semi-empirical models. For example, theirability to better represent spatiotemporal distributions of soil loss andland conditions or their transferability to a more extensive set of envi-ronments. The MMF includes aspects of both physically based and em-pirical models to predict annual soil loss. Like USLE-type models, MMFretains a certain level of simplicity but can also better represent the ero-sion process incorporating some recent developments in knowledge.The erosion process is divided into two distinct phases. First, a sedimentphase which determines soil loss due to raindrop impact and runoffdetachment, and a water phase that reflects the transport of soil parti-cles by runoff. A soil erodibility factormainly influences the detachmentrate. Simultaneously, the runoff's annual transport capacity is a functionof water volume, slope steepness, and a crop cover factor. WEPP isthe most applied and comprehensive physically-based model listedin GASEMT. It has been structured to be applicable for an extensiverange of geographic, land-use, and land-management conditions.WEPP can be applied at parcel, hillslope, road, andwatershed-scale pro-viding event or daily sediment yield, runoff, and subsurface flow. Dailyrainfall conditions are described using a stochastic weather generationsub-module. The other model sub-modules describe infiltration andoverland flow, erosion mechanics of sheet and rill processes, soil prop-erties, soil tillage, and residue management, soil consolidation, and theeffect of the different stages of plant growth. It uses a steady-state sed-iment continuity equation to describe the three steps of soil erosion (de-tachment, transportation, and deposition) and provides net erosionestimates. The LISEMmodelwas oneof thefirst physically-basedmodelsto use raster input data and a GIS environment to better account for thespatial variability of runoff and soil erosion processes within a water-shed. Like WEPP, LISEM can estimate soil detachment and depositionfor single events or on a continuous basis using sub-daily rainfall datato reproduce single rain events' intensity and duration. Besides describ-ing the rainfall event, themodel requires an additional set of ca. 30 inputparameters to parametrizewatershed conditions such as soil properties,soil surface roughness, soil moisture, saturated hydraulic conductivityvegetation cover, morphological conditions of the vegetations, amongothers. The RHEM model needs thirteen input parameters to representrainfall, soils, and slope profile conditions. It was designed for rangelandapplication and can predict both runoff and erosion rates based on infil-tration, hydrology, plant science, hydraulics, and erosion mechanics.
The insights gained in this analysis suggest that the research com-munity is contemporaneously working on improving the applicationof complex process-orientedmodels while updating the existing empir-ical approaches such as the USLE, which remains attractive from a prac-tical point of view. It also emerges that, in most cases, the selection ofthe soil erosionmodel applied is not related to the necessaty to calculateexact erosion rates for a particular situation but rather to obtain a riskestimate and compare different land conditions. These are necessitiesthat make simple and time cost-effective soil erosion models still byfar themost commonly used approaches. A development towards an in-creased use of physically-based models in the future remains desirable,however.
5. GASEMT database: data availability and limitations
All data supporting the findings of this study can be extracted fromthe Supplementary Information file (Appendix A: GASEMT database).
Our evaluation of the GASEMT database revealed some shortcom-ings. First, some missing data (reported as unknown in the database)are due to the unavailability of information in the reviewed publica-tions. Although this affects only some attributes, key information suchas predicted soil-erosion rates, coordinates of the study area, and thestudy area's size can be missing. A meta-regression analysis usingGASEMT data could not be performed due to restrictions imposed bythe heterogeneity of the records and, more importantly, due to a lackof detailed georeferenced information about the study areas. Due to ca-pacity bottlenecks (our project relied on a volunteer participatory ap-proach without funding), the scientific team refrained from definingthe shape and perimeter for each study area. This situation limited thepossibility of compiling variables for the modelled sites and investigat-ing relationships between predicted erosion rates and environmentalfactors (e.g., climate data, slope, vegetation cover) through exploratoryanalysis. A further shortcoming relates to potential inconsistencies inthe database. Although a harmonization procedure has been carriedout to identify and rectify most inconsistencies and misclassificationsamong experts, some of these may still affect some records in thispublication's final database. The limited number of studies compileddealing with spatial modelling of gully, and other erosion processes(e.g., harvest erosion, tillage erosion, piping)may also have been dimin-ished by the Scopus search criteria. Our decision to consider only re-search work validated/evaluated through peer-review excluded allgrey literature from GASEMT, such as scientific reports, governmentpublications, proceedings, conference abstracts, and national associa-tions journals. We recognize that this decision could be influenced byscientific communication practices and ‘epistemic cultures’ (Cetina,1991) that are more oriented towards peer-reviewed journals.
The exclusion of grey and non-English peer-reviewed literature inGASEMTmay have affected the geographical representation of some re-gions in the database where publishing in local and national language/literature is more frequent. However, in light of the 419,000 results ob-tained searching for ‘soil erosionmodelling’ via Google Scholar, we recog-nize that this large amount of literature would have been an unrealisticamount to evaluate without aids such as artificial intelligence. An inter-nal debate among the authors also highlighted whether the use ofElsevier's Scopus bibliographic database, instead of Thomson Reuters'Web of Science (WoF), or both,may have contributed to bias in the geo-graphical distribution of the GASEMT records. The decision to useScopus in this analysis was based on the information available in the lit-erature, indicating that Scopus may have a greater coverage of specificsubjects in Earth and Atmospheric Sciences and a larger match withcompared to WoF (Barnett and Lascar, 2012; Mongeon and Paul-Hus,2016). A recent Scopus andWoS query (17.03.2020) searching `soil ero-sion models` in the title, abstract, and keywords resulted in 13,474 and12,972 articles potentially reporting applications of soil erosion model-ling, respectively. Limiting the query to 1994–2017 returned similarresults with 10,010 (Scopus) and 10,187 (WoS) documents. This
P. Borrelli, C. Alewell, P. Alvarez et al. Science of the Total Environment 780 (2021) 146494
15
document the similarity of Scopus and WoS and further supports thevalidity of our choice.
6. Conclusions
This systematic literature review to compile theGASEMTdatabase andit's posterior analysis have allowed data-driven insights into the globalstate-of-the-art in soil erosionmodelling for the first time. Statistical anal-ysis of GASEMT showed that models tend to predict erosion rates thatpeak in the tropics and decrease towards higher latitudes. The frequencyof model applications inversely relates to this erosion severity pattern,with greater numbers of studies in temperate and Mediterranean zones.The results of this analysis suggest that industrialised and highlydeveloped countries, generally in temperate latitudes with lower erosionrates, show a higher incidence of studies. The database reports fewerstudies in less-developed, tropical, and subtropical countries, wheremodelling findings suggest greater exposure to erosive processes.
Unlike previously reported work, our findings suggest that unsus-tainable soil-erosion rates not only occur due to a lack of policy gover-nance (Alewell et al., 2019) but in many regions of the world may alsoresult from a lack of knowledge. Detailed information on soil erosion,through both modelling and measurement, is lacking for large parts ofthe world. This condition is particularly true for regions most suscepti-ble to high levels of soil erosion. For many of these regions we onlyhave information from global modelling applications, which may notadequately represent local causes and drivers of soil erosion nor providea basis for policy solutions.
Our findings indicate that (R)USLE-type models have been exten-sively used and modified during the last two decades and remain themost employed modelling tool today. Based on the dominance ofthese model types, most of our current knowledge on the spatial distri-bution of soil-erosion and it's temporal trends are derived through (R)USLE-type approaches. This, in turn, means that our understanding ofspatial soil erosion mostly relies on empirical models dealing withwater as the erosion agent and focusing on sheet and rill processes asthe dominant ones. Although some models such as WEPP, RHEM, andLISEM show increasing trends of use, applications of process-basedphysical models appear far more constrained. Nevertheless, the scaleof applications of the process-based physical models (x̃= ~1 km2) sug-gests that the required input data are lacking for large-scale applications.
While soil erosion measurements have numerous drawbacks (eghigh uncertainty, high work/time inputs, restrictions to small spatialand temporal scales), many modelling studies lack validation attempts.As such, many soil erosionmodelling applications should be consideredas indications of the best hypotheses currently available rather thanpredictive models. Unvalidated models are useful in time periods and/or locations where soil erosion measurements and monitoring dataare not (yet) available. The drawbacks of unvalidated model applica-tions means that, although numerous in the literature, they should re-main transitory until better methods exist. The ease at which one canuse off-the-shelf soil-erosion models using remotely sensed data andGIS has created an inflated number of models that lack field activitiesand validation/evaluation of the results. True knowledge gain can onlybe achieved by a scientific community that accepts the challenge of re-thinking its approach towards modelling applications. This challenge isreflected in the UNGSERmap, which represents an opportunity to over-come some of these shortcomings by introducing new region andcountry-based modelling assessments supported by well-definedfield-based data collection to validate/evaluate the results.
Supplementary data to this article can be found online at https://doi.org/10.1016/j.scitotenv.2021.146494.
CRediT authorship contribution statement
Pasquale Borrelli developed the research concepts, coordinated thereview activities and wrote the paper. Panos Panagos and all other
authors (listed in alphabetical order) contributed with ideas, reviewedthe papers, worked on developing the GASEMT database, discussedthe results and contributed to improving the text and the discussionsof the results.
Declaration of competing interest
The authors declare that they have no known competing financialinterests or personal relationships that could have appeared to influ-ence the work reported in this paper.
Acknowledgement
Jae E. Yang and Pasquale Borrelli are funded by the EcoSSSoil Project,Korea Environmental Industry & Technology Institute (KEITI), Korea(Grant No. 2019002820004). Diana Vieira is funded by national funds(OE), through FCT – Fundação para a Ciência e a Tecnologia, I.P., in thescope of the framework contract foreseen - DL57/2016 (CDL-CTTRI-97-ARH/2018 - REF.191-97-ARH/2018), and acknowledges CESAM fi-nancial support of through (UIDP/50017/2020+UIDB/50017/2020).Walter Chen is funded by the Ministry of Science and Technology(Taiwan) Research Project (Grant Number MOST 109-2121-M-027-001). Nejc Bezak andMatjažMikošwould like to acknowledge the sup-port of the Slovenian Research Agency through grant P2-0180.
References
Alewell, C., Borrelli, P., Meusburger, K., Panagos, P., 2019. Using the USLE: chances, chal-lenges and limitations of soil erosion modelling. Int. Soil Water Conserv. Res. 7,203–225. https://doi.org/10.1016/j.iswcr.2019.05.004.
Arnold, J.G., Srinivasan, R., Muttiah, R.S., Williams, J.R., 1998. Large area hydrologic model-ing and assesment part I: model development. JAWRA J. Am.Water Resour. Assoc. 34,73–89. https://doi.org/10.1111/j.1752-1688.1998.tb05961.x.
Arnold, J.G., Moriasi, D.N., Gassman, P.W., Abbaspour, K.C., White, M.J., Srinivasan, R.,Santhi, C., Harmel, R.D., Van Griensven, A., Van Liew, M.W., Kannan, N., Jha, M.K.,2012. SWAT: Model use, calibration, and validation. Trans. ASABE 55, 1491–1508.doi:10.13031/2013.42259.
Auerswald, K., Kainz, M., Fiener, P., 2003. Soil erosion potential of organic versus conven-tional farming evaluated by USLE modelling of cropping statistics for agricultural dis-tricts in Bavaria. Soil Use Manag. 19, 305–311. https://doi.org/10.1079/SUM2003212.
Auerswald, K., Fiener, P., Martin,W., Elhaus, D., 2014. Use andmisuse of the K factor equa-tion in soil erosion modeling: an alternative equation for determining USLE nomo-graph soil erodibility values. Catena 118, 220–225. https://doi.org/10.1016/j.catena.2014.01.008.
Baade, J., Rekolainen, S., 2006. Existing soil erosion data sets. In: Poesen, J. (Ed.), Board-man, J. Soil Erosion in Europe. John Wiley & Sons, Ltd, Chichester, UK, pp. 717–728https://doi.org/10.1002/0470859202.ch51.
Barnett, P., Lascar, C., 2012. Comparing unique title coverage of web of science and scopusin earth and atmospheric sciences. Issues Sci. Technol. Librariansh., 1–20 https://doi.org/10.5062/F4W37T8C.
Batista, P.V.G., Davies, J., Silva, M.L.N., Quinton, J.N., 2019. On the evaluation of soil erosionmodels: are we doing enough? Earth-Science Rev. 197, 102898. https://doi.org/10.1016/j.earscirev.2019.102898.
Batjes, N.H., 1996. Global assessment of land vulnerability to water erosion on a 1/2° by 1/2° grid. L. Degrad. Dev. 7, 353–365. https://doi.org/10.1002/(SICI)1099-145X(199612)7:4<353::AID-LDR239>3.0.CO;2-N.
D. B. Beasley, L. F. Huggins, E. J. Monke, 1980. ANSWERS: a model for watershed planning.Trans. ASAE 23, 0938–0944. doi:10.13031/2013.34692.
Bennett, H., Chapline, W., 1928. Soil erosion: a national menace., United States Depart-ment of Agriculture (USDA).
Bernatek-Jakiel, A., Poesen, J., 2018. Subsurface erosion by soil piping: significance and re-search needs. Earth-Science Rev. 185, 1107–1128. https://doi.org/10.1016/j.earscirev.2018.08.006.
Bezak, N., Mikoš, M., Borrelli, P., Alewell, C., Alvarez, P., Anache, j.A.A., Baartman, J.,Ballabio, C., Biddoccu, M., Cerdà, A., Chalise, D., Chen, S., Chen, W., De Girolamo,A.M., Gessesse, G.D., Deumlich, D., Diodato, N., Efthimiou, N., Erpul, G., Fiener, P.,Freppaz, M., Gentile, F., Gericke, A., Haregeweyn, N., Hu, B., Jeanneau, A., Kaffas, K.,Kiani-Harchegani, M., Lizaga Villuendas, I., Li, C., Lombardo, L., López-Vicente, M.,Lucas-Borja, M.E., Märker, M., Miao, C., Modugno, S., Möller, M., Naipal, V., Nearing,M., Owusu, S., Panday, D., Patault, E., Patriche, C.V., Poggio R., Portes, Quijano, L.,Rahdari, M.R., Renima, M., Ricci, G.F., Rodrigo-Comino, J., Saia, S., Samani, A.N.,Schillaci, C., Syrris, V., Kim, H.S., Spinola, D.N., Oliveira, P.T.S., Teng, H., Thapa, R.,Vantas, K., Vieira, D., Yang, J.E, Yin, S., Zema, D.A., Zhao, G., Panagos, P., 2021. SoilErosion Modelling: A Bibliometric Analysis. Manuscript submitted to EnvironmentalResearch.
Boardman, J., 2006. Soil erosion science: reflections on the limitations of current ap-proaches. Catena 68, 73–86. https://doi.org/10.1016/j.catena.2006.03.007.
P. Borrelli, C. Alewell, P. Alvarez et al. Science of the Total Environment 780 (2021) 146494
16
Boardman, J., Poesen, J., 2006. Soil Erosion in Europe. John Wiley & Sons. https://doi.org/10.1002/0470859202.
Bongaarts, J., 2016. Development: slow down population growth. Nature 530, 409–412.https://doi.org/10.1038/530409a.
Borrelli, P., Märker, M., Panagos, P., Schütt, B., 2014. Modeling soil erosion and river sed-iment yield for an intermountain drainage basin of the Central Apennines. Italy. Ca-tena 114. https://doi.org/10.1016/j.catena.2013.10.007.
Borrelli, P., Panagos, P., Montanarella, L., 2015. New insights into the geography andmodelling of wind erosion in the European agricultural land. Application of a spatiallyexplicit indicator of land susceptibility to wind erosion. Sustain. 7, 8823–8836.https://doi.org/10.3390/su7078823.
Borrelli, P., Panagos, P., Ballabio, C., Lugato, E., Weynants, M., Montanarella, L., 2016. To-wards a Pan-European assessment of land susceptibility to wind erosion. L. Degrad.Dev. 27, 1093–1105. https://doi.org/10.1002/ldr.2318.
Borrelli, P., Lugato, E., Montanarella, L., Panagos, P., 2017a. A new assessment of soil lossdue to wind erosion in European agricultural soils using a quantitative spatially dis-tributed modelling approach. L. Degrad. Dev. 28, 335–344. https://doi.org/10.1002/ldr.2588.
Borrelli, P., Robinson, D.A., Panagos, P., Lugato, E., Yang, J.E., Alewell, C., Wuepper, D.,Montanarella, L., Ballabio, C., 2020. Land use and climate change impacts on globalsoil erosion by water (2015-2070). Proc. Natl. Acad. Sci. U. S. A. 117, 21994–22001.https://doi.org/10.1073/pnas.2001403117.
Borrelli, Pasquale, Robinson, D.A., Fleischer, L.R., Lugato, E., Ballabio, C., Alewell, C.,Meusburger, K., Modugno, S., Schütt, B., Ferro, V., Bagarello, V., Van Oost, K.,Montanarella, L., Panagos, P., 2017b. An assessment of the global impact of 21st cen-tury land use change on soil erosion. Nat. Commun. 8, 2013. https://doi.org/10.1038/s41467-017-02142-7.
Bosco, C., De Rigo, D., Dewitte, O., Poesen, J., Panagos, P., 2015. Modelling soil erosion atEuropean scale: towards harmonization and reproducibility. Nat. Hazards EarthSyst. Sci. 15, 225–245. https://doi.org/10.5194/nhess-15-225-2015.
Cerdan, O., Souchère, V., Lecomte, V., Couturier, A., Le Bissonnais, Y., 2002. Incorporatingsoil surface crusting processes in an expert-based runoff model: sealing and transferby runoff and erosion related to agricultural management. Catena 46, 189–205.https://doi.org/10.1016/S0341-8162(01)00166-7.
Cerdan, O., Govers, G., Le Bissonnais, Y., Van Oost, K., Poesen, J., Saby, N., Gobin, A., Vacca,A., Quinton, J., Auerswald, K., Klik, A., Kwaad, F.J.P.M., Raclot, D., Ionita, I., Rejman, J.,Rousseva, S., Muxart, T., Roxo, M.J., Dostal, T., 2010. Rates and spatial variations ofsoil erosion in Europe: a study based on erosion plot data. Geomorphology 122,167–177. https://doi.org/10.1016/j.geomorph.2010.06.011.
Cetina, K.K., 1991. Epistemic. Forms of Reason in Science. Hist. Polit. Econ, Cultureshttps://doi.org/10.1215/00182702-23-1-105.
Chappell, A., Webb, N.P., 2016. Using albedo to reform wind erosion modelling, mappingand monitoring. Aeolian Res. 23, 63–78. https://doi.org/10.1016/j.aeolia.2016.09.006.
Cook, H.L., 1937. The nature and controlling variables of the water erosion process. SoilSci. Soc. Am. J. 1, 478–494.
De Roo, A.P.J., Offermans, R.J.E., Cremers, N.H.D.T., 1996. LISEM: a single-event, physicallybased hydrological and soil erosion model for drainage basins. II: sensitivity analysis,validation and application. Hydrol. Process. 10, 1119–1126. https://doi.org/10.1002/(SICI)1099-1085(199608)10:8<1119::AID-HYP416>3.0.CO;2-V.
De Vente, J., Poesen, J., 2005. Predicting soil erosion and sediment yield at the basin scale:scale issues and semi - quantitative models. Earth - Sci. Rev. 71, 95–125. https://doi.org/10.1016/j.earscirev.2005.02.002.
De Vente, J., Poesen, J., Verstraeten, G., Govers, G., Vanmaercke, M., Van Rompaey, A.,Arabkhedri, M., Boix-Fayos, C., 2013. Predicting soil erosion and sediment yield at re-gional scales: where do we stand? Earth-Science Rev. 127, 16–29. https://doi.org/10.1016/j.earscirev.2013.08.014.
FAO, 2019. Global Symposium on Soil Erosion (GSER19): Outcome Document.FAO, ITPS, 2015. The Status of the World's Soil Resources (Main Report). Rome. doi:ISBN
978-92-5-109004-6.Ferro, V., Porto, P., 2000. Sediment delivery distributed (SEDD) model. J. Hydrol. Eng. 5,
411–422. https://doi.org/10.1061/(ASCE)1084-0699(2000)5:4(411).Flanagan, D.C., Nearing, M.A., 1995. USDA-water erosion prediction project: hillslope pro-
file and watershed model documentation. NSERL Rep 10.Forbes, 2020. No Title [WWWDocument]. Ctries. Lead. World Sci. Publ, URL https://www.
forbes.com/sites/niallmccarthy/2019/12/19/the-countries-leading-the-world-in-sci-entific-publications-infographic/#2dbb3efd1ec4.
G.R. Foster, D.C. Yoder, G.A. Weesies, T.J. Toy, 2001. The design philosophy behindRUSLE2: evolution of an empirical model, in: Engineers, A.S. of A. and B. (Ed.), SoilErosion. American Society of Agricultural and Biological Engineers, St. Joseph, MI,p. 95. doi:10.13031/2013.3211.
Fryrear, D.W., Chen, W.N., Lester, C., 2001. Revised wind erosion equation. Ann. Arid Zone40, 265–279.
García-Ruiz, J.M., Beguería, S., Nadal-Romero, E., González-Hidalgo, J.C., Lana-Renault, N.,Sanjuán, Y., 2015. Ameta-analysis of soil erosion rates across theworld. Geomorphol-ogy 239, 160–173. https://doi.org/10.1016/j.geomorph.2015.03.008.
Gavrilovic, S., 1962. A method for estimating of the average annual quantity of sedimentsaccording to the potency of erosion. Bull. Fac. For. 26, 151–168.
Gericke, A., 2015. Soil loss estimation and empirical relationships for sediment deliveryratios of European river catchments. Int. J. river Basin Manag. 13, 179–202. https://doi.org/10.1080/15715124.2014.1003302.
Govers, G., Gobin, A., Cerdan, O., van Rompaey, A., Kirkby, M., Irvine, B., Le Bissonais, Y.,Daroussin, J., King, D., Jones, R.J.A., 2003. Pan-European soil erosion risk assessmentfor Europe: the PESERA Map, JRC, Ispra, Italy.Available online at http://eusoils.jrc.it/ESDB_Archive/pesera/pesera_cd/pdf/ThePeseraMap.pdf [verified 25 October 2006].
GSP, 2019. Global Soil Partnership [WWW Document]. URL. http://www.fao.org/global-soil-partnership/about/p.
Hansen, L., 2007. Conservation reserve program: environmental benefits update. J. Agric.Resour. Econ. 36, 267–280. https://doi.org/10.1017/S1068280500007085.
Hansen, L.T., Breneman, V.E., Davison, C.W., Dicken, C.W., 2002. The cost of soil erosion todownstream navigation. J. Soil Water Conserv. 57, 205–212.
Hansen, M.C., Potapov, P. V., Moore, R., Hancher, M., Turubanova, S.A., Tyukavina, A., Thau,D., Stehman, S. V., Goetz, S.J., Loveland, T.R., Kommareddy,A., Egorov,A., Chini, L., Justice,C.O., Townshend, J.R.G., 2013. High-resolution global maps of 21st-century forest coverchange. Science (80-. ). 342, 850–853. doi:https://doi.org/10.1126/science.1244693.
Hessel, R., Daroussin, J., Verzandvoort, S., Walvoort, D., 2014. Evaluation of two different soildatabases to assess soil erosion sensitivity with MESALES for three areas in Europe andMorocco. Catena 118, 234–247. https://doi.org/10.1016/j.catena.2014.01.012.
Hijmans, R.J., Cameron, S.E., Parra, J.L., Jones, P.G., Jarvis, A., 2005. Very high resolution in-terpolated climate surfaces for global land areas. Int. J. Climatol. 15, 1965–1978.https://doi.org/10.1002/joc.1276.
Hurtt, G.C., Chini, L., Sahajpal, R., Frolking, S., Bodirsky, B.L., Calvin, K., Doelman, J.C., Fisk, J.,Fujimori, S., Klein Goldewijk, K., Hasegawa, T., Havlik, P., Heinimann, A., Humpenöder,F., Jungclaus, J., Kaplan, J.O., Kennedy, J., Krisztin, T., Lawrence, D., Lawrence, P., Ma, L.,Mertz, O., Pongratz, J., Popp, A., Poulter, B., Riahi, K., Shevliakova, E., Stehfest, E.,Thornton, P., Tubiello, F.N., van Vuuren, D.P., Zhang, X., 2020. Harmonization of globalland use change and management for the period 850–2100 (LUH2) for CMIP6.Geosci. Model Dev. 13, 5425–5464. https://doi.org/10.5194/gmd-13-5425-2020.
Jabbar, M.T., Chen, X., Li, H., 2006. Land degradation due to soil wind erosion in arid andsemi-arid regions with the aid of geoinformation technology. Int. Geosci. RemoteSens. Symp., 3309–3312 https://doi.org/10.1109/IGARSS.2006.850.
Kirkby, M., 2006. Soil erosion in Europe, Soil Erosion in Europe. John Wiley & Sons, Ltd,Chichester, UK. https://doi.org/10.1002/0470859202.
Kirkby, M.J., Jones, R., Irvine, B., Gobin, A., Govers, G., Cerdan, O., Rompaey, A.J.J. Van, LeBissonnais, Y., Daroussin, J., King, D., Montanarella, L., Grimm, M., Vieillefont, V.,Puigdefabregas, J., Boer, M., Kosmas, C., Yassoglou, N., Tsara, M., Mantel, S., Lynden,G.J. Van, Huting, J., 2004. Pan-European soil erosion risk assessment: the PESERAmap, version 1 October 2003. Explanation of special publication Ispra 2004 no.73(S.P.I.04.73). Eur. Soil Bur. Res. Report. Off. Off. Publ. Eur. Communities, Luxemb. 16,18pp. and 1 map in ISO B1 format.
Labrière, N., Locatelli, B., Laumonier, Y., Freycon, V., Bernoux, M., 2015. Soil erosion in thehumid tropics: a systematic quantitative review. Agric. Ecosyst. Environ. 203,127–139. https://doi.org/10.1016/j.agee.2015.01.027.
Laflen, J.M., Lane, L.J., Foster, G.R., 1991. WEPP: a new generation of erosion predictiontechnology. J. Soil Water Conserv. 46, 34–38.
Lal, R., 2007. Anthropogenic influences on world soils and implications to global food se-curity. Adv. Agron. 93, 69–93. https://doi.org/10.1016/S0065-2113(06)93002-8.
Li, P., Holden, J., Irvine, B., Mu, X., 2017. Erosion of Northern Hemisphere blanketpeatlands under 21st-century climate change. Geophys. Res. Lett. 44, 3615–3623.https://doi.org/10.1002/2017GL072590.
Littleboy, M., Silburn, D.M., Freebairn, D.M., Woodruff, D.R., Hammer, G.L., 1989. PERFECT- a computer simulation model of Productivity Erosion Runoff Functions to EvaluateConservation Techniques. Bull. Dep. Prim, Ind.
Lizaga, I., Quijano, L., Gaspar, L., Navas, A., 2018. Estimating soil redistribution patternswith 137Cs measurements in a Mediterranean mountain catchment affected byland abandonment. L. Degrad. Dev. 29, 105–117. https://doi.org/10.1002/ldr.2843.
Mabit, L., Lee, Z.Y., Fulajtar, L., Dercon, G., Zaman, M., Toloza, A., Heng, L., Bernard, C., 2019.Two Decades of FAO/IAEA Supported Research and Development for Combating SoilDegradation Through Isotopes.
Merritt, W.S., Letcher, R.A., Jakeman, A.J., 2003. A review of erosion and sediment trans-port models. Environ. Model. Softw. https://doi.org/10.1016/S1364-8152(03)00078-1.
Mezosi, G., Blanka, V., Bata, T., Kovacs, F., Meyer, B., 2015. Estimation of regional differ-ences in wind erosion sensitivity in Hungary. Nat. Hazards Earth Syst. Sci. 15,97–107. https://doi.org/10.5194/nhess-15-97-2015.
Mitasova, H., Hofierka, J., Zlocha, M., Iverson, L.R., 1996. Modelling topographic potentialfor erosion and deposition using GIS. Int. J. Geogr. Inf. Syst. 10, 629–641. https://doi.org/10.1080/02693799608902101.
Mongeon, P., Paul-Hus, A., 2016. The journal coverage of Web of Science and Scopus: acomparative analysis. Scientometrics 106, 213–228. https://doi.org/10.1007/s11192-015-1765-5.
Montgomery, D.R., 2007. Soil erosion and agricultural sustainability. Proc. Natl. Acad. Sci.U. S. A. 104, 13268–13272. https://doi.org/10.1073/pnas.0611508104.
Morgan, R.P.C., 2009. Soil Erosion and Conservation. John Wiley & Sons.Morgan, R.P.C., Nearing, M.A., 2011. Handbook of erosion modelling, Handbook of Erosion
Modelling. doi:https://doi.org/10.1002/9781444328455.Morgan, R.P.C., Morgan, D.D.V., Finney, H.J., 1984. A predictive model for the assessment
of soil erosion risk. J. Agric. Eng. Res. 30, 245–253. https://doi.org/10.1016/S0021-8634(84)80025-6.
Morgan, R.P.C., Quinton, J.N., Smith, R.E., Govers, G., Poesen, J.W.A., Auerswald, K., Chisci,G., Torri, D., Styczen, M.E., 1998. The European soil erosion model (EUROSEM): aprocess-based approach for predicting soil loss from fields and small catchments.527–544. Earth Surf. Process. Landforms 23, 527–544. doi:10.1002/(SICI)1096-9837(199806)23:6<527::AID-ESP868>3.0.CO;2-5.
Mutchler, C.K., Murphree, C.E., McGregor, K.C., 2017. Laboratory and field plots for erosionresearch, in: Soil Erosion Research Methods. Routledge, Routledge, pp. 11–38.
Naipal, V., Ciais, P., Wang, Y., Lauerwald, R., Guenet, B., Van Oost, K., 2018. Global soil or-ganic carbon removal by water erosion under climate change and land use changeduring AD 1850–2005. Biogeosciences 15, 4459–4480. https://doi.org/10.5194/bg-15-4459-2018.
Nearing, M.A., 2000. Evaluating soil erosion models using measured plot data: accountingfor variability in the data. Earth Surf. Process. Landforms 25, 1035–1043. https://doi.org/10.1002/1096-9837(200008)25:9<1035::AID-ESP121>3.0.CO;2-B.
P. Borrelli, C. Alewell, P. Alvarez et al. Science of the Total Environment 780 (2021) 146494
17
Nearing, M.A., 2013. Soil erosion and conservation, in: Environmental Modelling: FindingSimplicity in Complexity: Second Edition. pp. 365–378. doi:https://doi.org/10.1002/9781118351475.ch22.
Nearing, M., 2004. Soil erosion and conservation. In: Wainwright, J., Mulligan, M. (Eds.),Environmental modelling: Finding simplicity in complexity. John Wiley & Sons, Ltd,pp. 277–290.
Nearing, M.A., Wei, H., Stone, J.J., Pierson, F.B., Spaeth, K.E., Weltz, M.A., Flanagan, D.C.,Hernandez, M., 2011. A rangeland hydrology and erosion model. Trans. ASABE 54,901–908.
Oldeman, L., 1994. The Global Extent of Soil Degradation (Soil resilience and sustainableland use).
Olsson, L., Barbosa, H., 2019. Chapter 4: land degradation, in: Climate Change and Land.pp. 4–186.
Panagos, P., Borrelli, P., Poesen, J., Ballabio, C., Lugato, E., Meusburger, K., Montanarella, L.,Alewell, C., 2015a. The new assessment of soil loss by water erosion in Europe. Envi-ron. Sci. Pol. 54, 438–447. https://doi.org/10.1016/j.envsci.2015.08.012.
Panagos, P., Borrelli, P., Robinson, D.A., 2015b. Common agricultural policy: tackling soilloss across Europe. Nature 526, 195.
Panagos, P., Borrelli, P., Meusburger, K., Yu, B., Klik, A., Lim, K.J., Yang, J.Y., Ni, J., Miao, C.,Chattopadhyay, N., Sadeghi, S.H., Hazbavi, Z., Zabihi, M., Larionov, G.A., Krasnov, S.F.,Garobets, A., Levi, Y., Erpul, G., Birkel, C., Hoyos, N., Naipal, V., Oliveira, P.T.S.,Bonilla, C., Meddi, M., Nel, W., Dashti, H.A., Boni, M., Diodato, N., Van Oost, K.,Nearing, M.A., Ballabio, C., 2017. Global rainfall erosivity assessment based onhigh-temporal resolution rainfall records. Sci. Rep. 7, 1–12. https://doi.org/10.1038/s41598-017-04282-8.
Panagos, P., Borrelli, P., Poesen, J., 2019. Soil loss due to crop harvesting in the EuropeanUnion: A first estimation of an underrated geomorphic process. Sci. Total Environ.664, 487–498. https://doi.org/10.1016/j.scitotenv.2019.02.009.
Pinheiro, A., Caussade, B., Ayphassorho, H., 1995. Simulation of soil erosion bywater at thewatershed level. Trans. Ecol. Environ. 26, 547–556.
Podmanicky, L., Balázs, K., Belényesi, M., Centeri, C., Kristóf, D., Kohlheb, N., 2011. Model-ling soil quality changes in Europe. An impact assessment of land use change on soilquality in Europe. Ecol. Indic. 11, 4–15. https://doi.org/10.1016/j.ecolind.2009.08.002.
Poesen, J., 2018. Soil erosion in the Anthropocene: research needs. Earth Surf. Process.Landforms 84, 64–84. https://doi.org/10.1002/esp.4250.
Quinton, J.N., Govers, G., Van Oost, K., Bardgett, R.D., 2010. The impact of agricultural soilerosion on biogeochemical cycling. Nat. Geosci. 3, 311–314. https://doi.org/10.1038/ngeo838.
Renard, K., Foster, G., Weesies, G., McCool, D., Yoder, D., 1997. Predicting soil erosion bywater: a guide to conservation planning with the Revised Universal Soil Loss Equa-tion (RUSLE). Agric. Handb. No. 703. doi:DC0-16-048938-5 65–100.
Renschler, C.S., 2003. Designing geo-spatial interfaces to scale process modes: theGeoWEPP approach. Hydrol. Process. 17, 1005–1017. https://doi.org/10.1002/hyp.1177.
Rezaei, M., Sameni, A., Shamsi, S.R.F., Bartholomeus, H., 2016. Remote sensing of land use/cover changes and its effect on wind erosion potential in southern Iran. PeerJ 2016,e1948. https://doi.org/10.7717/peerj.1948.
Schmidt, J., 1991. A mathematical model to simulate rainfall erosion. Catena 19, 101–109.Sharma, K.D., Singh, S., 1995. Satellite remote sensing for soil erosion modelling using
the ANSWERS model. Hydrol. Sci. J. 40, 259–272. https://doi.org/10.1080/02626669509491408.
Smith, J.R., 1914. Soil erosion and its remedy by terracing and tree planting. Science (80-.). 39, 858–862. doi:https://doi.org/10.1126/science.39.1015.858.
Stehfest, E., van Vuuren, D., Kram, T., Bouwman, L., Alkemade, R., Bakkenes, M., Biemans,H., Bouwman, A., Den Elzen, M., Janse, J., Alkemade, R., Bakkenes, M., Biemans, H.,Bouwman, A., Den Elzen, M., Janse, J., Lucas, P., van Minnen, J., Muller, C., Prins, A.G.,2014. Integrated assessment of global environmental change with IMAGE 3.0,Model description and policy applications, The Hague: PBL Netherlands Environmen-tal Assessment Agency.
Symeonakis, E., Drake, N., 2010. 10-daily soil erosion modelling over sub-Saharan Africa.Environ. Monit. Assess. 161, 369–387. https://doi.org/10.1007/s10661-009-0754-7.
Syvitski, J.P.M., Milliman, J.D., 2014. Geology, geography, and humans battle for domi-nance over the delivery of fluvial sediment to the coastal iocean. J. Geol. 115, 1–19.https://doi.org/10.1086/509246.
Teng, H., Viscarra Rossel, R.A., Shi, Z., Behrens, T., Chappell, A., Bui, E., 2016. Assimilatingsatellite imagery and visible-near infrared spectroscopy to model and map soil lossby water erosion in Australia. Environ. Model. Softw. 77, 156–167. https://doi.org/10.1016/j.envsoft.2015.11.024.
Toy, T.J., Foster, G.R., Renard, K.G., 2002. Soil Erosion: Processes, Prediction, Measurement,and Control. John Wiley & Sons, Inc., New York.
Van Oost, K., Govers, G., Desmet, P., 2000. Evaluating the effects of changes in landscapestructure on soil erosion by water and tillage. Landsc. Ecol. 15, 577–589. https://doi.org/10.1023/A:1008198215674.
Van Oost, K., Beuselinck, L., Hairsine, P.B., Govers, G., 2004. Spatial evaluation of a multi-class sediment transport and deposition model. Earth Surf. Process. Landforms 29,1027–1044. https://doi.org/10.1002/esp.1089.
Van Oost, K., Cerdan, O., Quine, T.A., 2009. Accelerated sediment fluxes by water and till-age erosion on European agricultural land. Earth Surf. Process. Landforms. 34,1625–1634. https://doi.org/10.1002/esp.
Wagner, L.E., 1996. An overview of the wind erosion prediction system, in: Intl. Conf. onAir Pollution from Agricultural Operations. pp. 73–75.
Wagner, L.E., 2013. A history of wind erosion prediction models in the United States De-partment of Agriculture: the Wind Erosion Prediction System (WEPS). Aeolian Res.10, 9–24. https://doi.org/10.1016/j.aeolia.2012.10.001.
Williams, J.R., Berndt, H.D., 1977. Sediment yield prediction based on watershed hydrol-ogy. Trans. Am. Soc. Agric. Eng. 20, 1100–1104. doi:10.13031/2013.35710.
Williams, J.R., Renard, K.G., Dyke, P.T., 1983. EPIC: a new method for assessing erosion’seffect on soil productivity. J. Soil Water Conserv. 38, 381–383.
Wischmeier, W.H., Smith, D.D., 1978. Predicting rainfall erosion losses. Agric. Handb. no.537, 285–291. https://doi.org/10.1029/TR039i002p00285.
Woodruff, N., Armbrust, D., 1968. Amonthly climatic factor for the wind erosion equation.J. Soil Water Conserv. 23, 103–104.
Wuepper, D., Borrelli, P., Finger, R., 2020. Countries and the global rate of soil erosion. Nat.Sustain. 3, 51–55. https://doi.org/10.1038/s41893-019-0438-4.
Young, R.A., Onstad, C.A., Bosch, D.D., Anderson, W.P., 1989. AGNPS: A nonpoint-sourcepollution model for evaluating agricultural watersheds. J. Soil Water Conserv. 44,121–13.
Yuan, Z., Chu, Y., Shen, Y., 2015. Simulation of surface runoff and sediment yield under dif-ferent land-use in a Taihang Mountains watershed. North China. Soil Tillage Res. 153,7–19.
Zhang, C., McBean, E.A., 2016. Estimation of desertification risk from soil erosion: a casestudy for Gansu Province. China. Stoch. Environ. Res. Risk Assess. 30, 2215–2229.https://doi.org/10.1007/s00477-015-1186-2.
Zingg, R.W., 1940. Degree and length of land slope as it affects soil loss in runoff. J. Agric.Eng. 21, 59–64.
P. Borrelli, C. Alewell, P. Alvarez et al. Science of the Total Environment 780 (2021) 146494
18