Embed Size (px)
Citation preview

Hong, S.Y.*, Y.H. Kim, K.H. Han, B.K. Hyun, Y.S. Zhang, K.C. Song
Digital Soil Mapping of Soil Properties in Korea
National Academy of Agricultural Science (NAAS), RDA, Suwon, Korea
Minasny, B.The University of Sydney, Sydney, Australia

Objective
This presentation estimates soil organic carbon
and clay content at the 6 standard depths for
Korean soils using the equal‐area smoothing
spline functions based on the GlobalSoilMap.net
specification

Data Used
• A Korean soil database based on ‐ “Taxonomical Classification of Korean Soils”(2000, NIAST, RDA)‐mostly collected in 1970’s for soil profile description‐ 380 soil series (as of now 391 soil series in Korea)‐ Soil organic carbon: Tyurin method‐ Clay content: Pipette method
Prediction
• Newly collected 168 soil series data (2009~2011)‐ used for independent validation‐ checking for the accuracy and uncertainty‐ Soil organic carbon: Walkley‐Black method‐ Clay content: Pipette method
Validation

Methodology
The Spline tool version 2.0‐ a generalisation of the quadratic spline model of Bishop et al. (1999)• standard depths: 0‐5, 5‐15, 15‐30, 30‐60, 60‐100, 100‐200 cm• 1‐cm interval depth from 0‐200 cm
※ ASRIS 2011, Malone et al., 2010
Mapping depth‐wise soil properties‐ derived mean values from the fitted spline at standard depths‐matching soil series to the soil map polygons‐ rasterized the results to 100 m grid according to G.S.M.net criteria
※ GlobalSoilMap.net specification
Validation/Uncertainty of prediction‐ The spline predicted soil properties were resampled to match withthe soil depth of recently collected soil profiles: 0 to 15~60 cm
Results
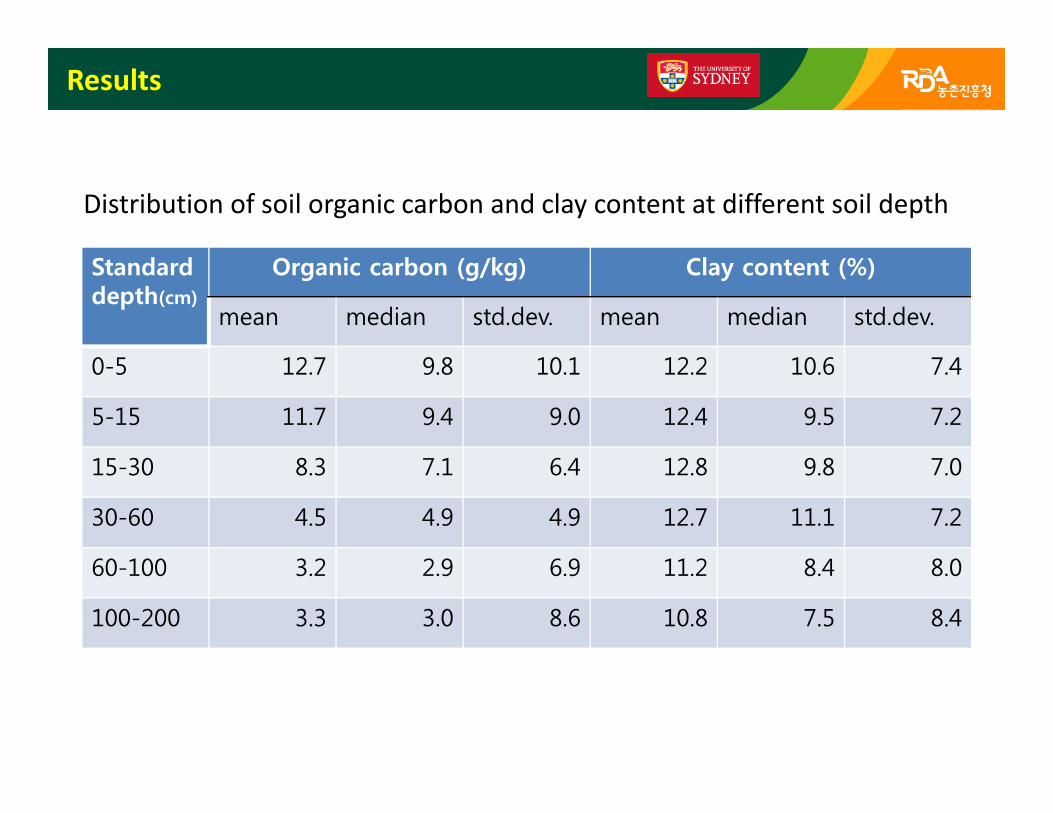
Standard depth(cm)
Organic carbon (g/kg) Clay content (%)
mean median std.dev. mean median std.dev.
0-5 12.7 9.8 10.1 12.2 10.6 7.4
5-15 11.7 9.4 9.0 12.4 9.5 7.2
15-30 8.3 7.1 6.4 12.8 9.8 7.0
30-60 4.5 4.9 4.9 12.7 11.1 7.2
60-100 3.2 2.9 6.9 11.2 8.4 8.0
100-200 3.3 3.0 8.6 10.8 7.5 8.4
Distribution of soil organic carbon and clay content at different soil depth
Results
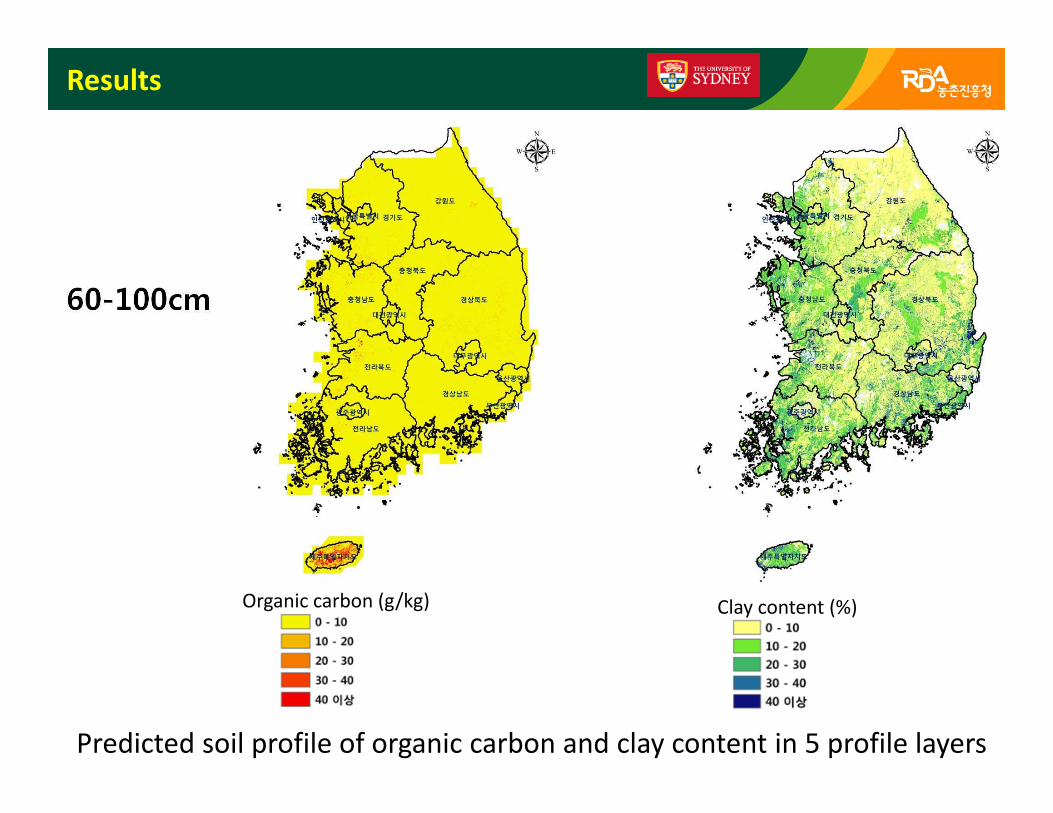
Organic carbon (g/kg) Clay content (%)
Predicted soil profile of organic carbon and clay content in 5 profile layers

Results
0
50
100
150
200
0 50 100 150 200
Measured organic carbon (g/kg)
Pred
icted organic carbon
(g/kg)
0
10
20
30
40
50
60
0 10 20 30 40 50 60
Measured clay content (%)Pred
icted clay con
tent (%
)
Scatter plot of predicted vs. recently measured organic carbon(left) and clay content(right) from 0 to 15~60 cm

Results
0~ ≒35 cm(Mostly 0~below 20 cm)
≒15 ~ ≒40 cm
RMSE_OC (g/kg) RMSE_Clay (%)
Root‐mean‐square errors on predictions for organic carbon and clay content in 2 profile layers
UncertaintyExpressed as RMSE

Summary
Soil organic carbon and clay content for Korean soilswere estimated based on the equal‐area smoothingspline and mapped corresponding soil series toproduce spatial and depth‐wise soil property maps.
Recent collected point data used as validation/uncertainty estimates
Mapped clay content showed good agreement withrecently sampled data.
Detailed soil map can create maps of continuous soilproperties with great accuracy!

• Soil organic carbon map showed a high uncertainty which may be due to the dynamic nature of soil carbon
Minasny et al. 2012. Global Biogeochemical Cycles
Summary
Sand, Silt, pH,…