Embed Size (px)
Citation preview

Soil Moisture Active/Passive (SMAP) Mission NASA Workshop Report
Soil Moisture Active/Passive (SMAP) Mission
NASA Workshop Report
PREFACE ..................................................................................................................................................... 4
EXECUTIVE SUMMARY .......................................................................................................................... 5
1. INTRODUCTION ............................................................................................................................... 6
1.1 THE DECADAL SURVEY ................................................................................................................. 6 1.2 SMAP WORKSHOP ........................................................................................................................ 7
2. SMAP MISSION CONCEPT ............................................................................................................ 8
2.1 MISSION CONCEPT HERITAGE........................................................................................................ 8 2.1.1 Hydros Mission Overview......................................................................................................... 8 2.1.2 Hydros Contributions to SMAP ................................................................................................ 9 2.1.3 Aquarius Contributions to and Synergy with SMAP............................................................... 10
2.2 MEASUREMENT REQUIREMENTS.................................................................................................. 10 2.3 IMPLEMENTATION APPROACH ..................................................................................................... 11
2.3.1 Instrument Architecture .......................................................................................................... 12 2.3.2 Orbit ....................................................................................................................................... 13 2.3.3 Science Operations Concept................................................................................................... 13
2.4 INSTRUMENT SUBSYSTEM-LEVEL DESCRIPTION.......................................................................... 14 2.4.1 Antenna Subsystem ................................................................................................................. 16 2.4.2 Radar Electronics Subsystem ................................................................................................. 18 2.4.3 Radiometer Electronics Subsystem......................................................................................... 19
2.5 SPACECRAFT ACCOMMODATION.................................................................................................. 21
3. SMAP DATA PRODUCTS AND ALGORITHMS ........................................................................ 21
3.1 DATA PRODUCTS ......................................................................................................................... 21 3.2 ALGORITHMS ............................................................................................................................... 22
3.2.1 Soil Moisture Algorithms........................................................................................................ 24 3.2.2 Freeze/Thaw Algorithms......................................................................................................... 26 3.2.3 Algorithm Processing ............................................................................................................. 27
3.3 ANCILLARY DATA REQUIREMENTS ............................................................................................. 27 3.3.1 Ancillary Data for L1-L3 Products......................................................................................... 28 3.3.2 Dynamic Flags........................................................................................................................ 29 3.3.3 Ancillary Data for L4 Data Assimilation Products ................................................................ 29
4. SMAP SCIENCE AND APPLICATIONS....................................................................................... 30
4.1 ENABLED SCIENCE....................................................................................................................... 31 4.1.1 Soil Moisture and Freeze/Thaw State..................................................................................... 31 4.1.2 Soil Moisture and Freeze/Thaw Effect on Vegetation ............................................................ 34 4.1.3 Linking the Terrestrial Water, Energy, and Carbon Cycle..................................................... 34 4.1.4 Sea Ice .................................................................................................................................... 35 4.1.5 Sea Surface Salinity ................................................................................................................ 36 4.1.6 High Ocean Winds.................................................................................................................. 36
4.2 ENABLED APPLICATIONS ............................................................................................................. 37 4.2.1 Hydrological Hazards Applications: Drought and Flood ...................................................... 37 4.2.2 Ecosystem Services Applications: Agricultural Productivity ................................................. 38
2
4.2.3 Weather Forecast Applications .............................................................................................. 39 4.2.4 Climate Prediction Applications............................................................................................. 40 4.2.5 Human Health Applications ................................................................................................... 41 4.2.6 Defense Applications .............................................................................................................. 42 4.2.7 NPOESS Applications............................................................................................................. 42
5. OPPORTUNITIES FOR SYNERGY .............................................................................................. 43
5.1 SYNERGY WITH OTHER REMOTE SENSING MISSIONS ................................................................... 44 5.2 SYNERGY WITH AIRBORNE AND GROUND MEASUREMENTS ........................................................ 44
6. BREAK-OUT SESSION SUMMARIES.......................................................................................... 45
6.1 DATA COLLECTION SCENARIO..................................................................................................... 45 6.2 OPTIMAL OVERPASS TIMES ......................................................................................................... 45 6.3 MEASUREMENT SCIENCE AND VALIDATION ................................................................................ 46 6.4 EFFECTIVE TEMPERATURE ESTIMATION ...................................................................................... 46 6.5 WITHIN-FOOTPRINT HETEROGENEITY.......................................................................................... 47 6.6 LATENCY ..................................................................................................................................... 47 6.7 RADIO FREQUENCY INTERFERENCE ............................................................................................. 47 6.8 TECHNOLOGY READINESS ........................................................................................................... 47
7. CONCLUSIONS AND RECOMMENDATIONS........................................................................... 48
REFERENCES ........................................................................................................................................... 49
APPENDIX A. ACRONYMS ................................................................................................................... 53
APPENDIX B. INSTRUMENT AND SPACECRAFT RESOURCES ................................................. 57
3
Preface
In January 2007, the National Research Council released the first-ever decadal survey of Earth science, Earth Science and Applications from Space: National Imperatives for the Next Decade and Beyond. The study was sponsored by NASA, NOAA, and USGS in order to provide community consensus recommendations to guide the agencies’ space-based Earth observation programs in the coming decade. The report recommended a set of 17 missions in three time phases to achieve the needed observations while providing for both scientific advance and societal benefit.
In summer 2007, NASA convened a series of workshops to further investigate each of the four missions recommended for first phase (2010-2013) implementation. Workshop participants were charged with evaluating the mission implementations provided in the decadal survey in terms of the science and applications goals as defined in the report and identifying the required ancillary measurements (if any) required to accomplish mission goals. This report summarizes the community discussions, findings, and recommendations from the NASA Soil Moisture Active/Passive (SMAP) Mission Workshop held July 9-10, 2007 in Arlington, Virginia.
4

Executive Summary
A two-day workshop was held on July 9-10, 2007 to consider the NASA Soil Moisture Active/Passive (SMAP) mission recommended for early implementation by the 2007 Earth Science Decadal Survey. Participants from the anticipated SMAP user community were invited to present their observational requirements and provide an assessment of the anticipated impact of SMAP on their scientific and operational applications.
Workshop participants were charged with evaluating the mission implementation provided in the decadal survey in terms of the science and applications goals as defined in the report and identifying the required ancillary measurements (if any) required to accomplish mission goals. Breakout sessions provided a forum for participants to suggest additional opportunities for enhanced science or applications that might be achieved through synergy with other planned missions and/or with augmentations to the SMAP mission.
Several key conclusions resulted from the workshop:
• There is a stable set of instrument measurement requirements for SMAP that are traceable to science requirements for soil moisture and freeze/thaw.
• The baseline SMAP instrument design is capable of satisfying the science measurement requirements.
• Significant heritage exits from design and risk-reduction work performed during Hydrosphere State (Hydros) mission formulation and other technology development activities. This heritage includes studies addressing science applications and algorithms, antenna rotation dynamics, antenna performance, and radio frequency interference mitigation techniques.
• Heritage and lessons learned can be leveraged from the Aquarius project. This heritage includes both the L-Band radiometer and radar electronics.
• There are no technology “show-stoppers,” and SMAP formulation is positioned to begin where Hydros left off.
The importance and desirability of global soil moisture measurement from space was reaffirmed by workshop participants. There was general consensus that SMAP, as defined in the decadal survey and described in the NASA mission concept study, can accomplish the intended science. There was also general consensus that SMAP is well-defined, technologically feasible, and ready to be implemented on a “fast-track.”
5

1. Introduction
The NASA Soil Moisture Active/Passive (SMAP) mission will enable global soil moisture mapping with unprecedented resolution, sensitivity, area coverage, and revisit. Soil moisture, as the state variable of the water cycle over land, determines water fluxes between the atmosphere, the surface, and the subsurface. Because a large amount of heat is exchanged when water changes phase, the water cycle is also fundamental to the dynamics of the Earth’s energy cycle. Since water is the ultimate solvent in the Earth system, biogeochemical cycles (carbon, nitrogen, methane, and others) are embedded in the water cycle. Through these effects, which are linked directly to climate and the environment, SMAP observations will be transformational for elements of Earth system science, for water resource assessment, and for natural hazards mitigation.
The 2007 NRC Earth Science Decadal Survey report recommends the SMAP mission for implementation in the first phase of missions (2010-2013). NASA held a two-day workshop on July 9-10, 2007 to evaluate the mission as defined in the report and to identify the ancillary measurements (if any) required to accomplish mission goals. Participants from the anticipated SMAP user community were invited to present their observational requirements and provide an assessment of the anticipated impact of SMAP on their scientific and operational applications.
This report documents the workshop presentations and discussions starting with a brief background on the decadal survey, its process, and SMAP mission recommendation. The technical approach to meet the SMAP science and application goals, algorithms, instrument data processing, and ancillary information required to produce the data in response to user requirements are described next. The anticipated impact of the SMAP data products on key scientific and operational applications is then presented, taking into consideration the instrument characteristics set forth in the baseline implementation approach.
1.1 The Decadal Survey
The National Research Council’s decadal survey, Earth Science and Applications from Space: National Imperatives for the Next Decade and Beyond, was released in 2007 as the culmination of a two year study commissioned by NASA, NOAA, and USGS to provide consensus recommendations to guide the agencies’ space-based Earth observation programs in the coming decade.
As described in the decadal survey report, the committee was organized into seven thematic panels and an executive committee. Community input was solicited via a Request for Information, and over 100 mission concepts were submitted by the community for consideration. The thematic panels evaluated submitted concepts based on eight prioritization criteria which were used to generate each panel’s priority list:
1. Contribution to the most important scientific questions facing Earth sciences today (scientific merit, discovery, exploration)
2. Contribution to applications and policy making (societal benefits) 3. Contribution to long-term observational record of the Earth 4. Ability to complement other observational systems, including national and
international plans
6
5. Affordability (cost considerations, either total costs for mission or costs per year) 6. Degree of readiness (technical, resources, people) 7. Risk mitigation and strategic redundancy (backup of other critical systems) 8. Significant contribution to more than one thematic application or scientific discipline
The panels then worked together to merge, combine, and condense the list of priorities into what is considered a “minimal yet robust” observing strategy. Ultimately, the report recommended a set of 17 missions in three time phases to achieve the needed observations while providing for both scientific advance and societal benefit.
The NRC report recommends the Soil Moisture Active/Passive (SMAP) mission to observe soil moisture and freeze/thaw for weather and water cycle processes for implementation in the first phase (2010-2013). The report further indicates “...the SMAP mission is ready for ‘fast-track’ towards launch as early as 2012, when there are few scheduled Earth missions.” SMAP is identified as the top priority for a new start mission by the Panel on Water Resources and the Global Hydrologic Cycle.
1.2 SMAP Workshop
The Soil Moisture Active/Passive (SMAP) workshop was held July 9-10, 2007 in Arlington, Virginia. SMAP workshop participants were charged to:
• Evaluate the science that can be accomplished by the SMAP mission as described by the NRC decadal survey.
• Articulate clarifications of design or intent that might be required due to the brevity with which the decadal survey described the mission.
• Describe what other measurements from research or operational satellites are necessary to achieve the science expected of the SMAP mission.
The workshop agenda reserved the first day for plenary presentations and the second day for community discussion and analysis. Presentations on day 1 were organized into four sessions. The first session provided context for the workshop and included an overview of the workshop goals, the decadal survey process, and previous formulation work completed as part of the NASA Hydros project. This was followed by a session focused on the NASA-commissioned SMAP mission study, which identified areas where Hydros investments could be leveraged to accomplish SMAP science goals and discussed the technical approach used to define a baseline mission implementation. Sessions 3 and 4 included presentations from the anticipated SMAP user community, covering the multitude of science and applications advances enabled by SMAP, anticipated synergies with planned missions, and opportunities for enhanced science or applications beyond areas discussed in detail in the decadal survey. On day 2 of the workshop, participants in the breakout sessions commented on plenary presentations, discussed the technological readiness of various mission components, highlighted opportunities for additional enhanced science or applications that might be considered during mission formulation, and identified the next steps needed to begin implementation of the SMAP mission.
This workshop report loosely follows the agenda.
7

2. SMAP Mission Concept
The NRC decadal survey report recommends early launch of a Soil Moisture Active/Passive (SMAP) mission to provide global measurements of soil moisture and freeze/thaw state via L-band radar and radiometry. Following the publication of the NRC report, NASA Headquarters tasked the Jet Propulsion Laboratory (JPL) to perform a mission study based on the decadal survey’s SMAP description to assess mission science requirement maturity, implementation readiness, and cost realism.
The mission study team started by refining the science objectives described in the NRC report, filling in details as needed to extract the core science and instrument requirements. The team then considered the mission architecture required to meet those requirements, using the suggested implementation approach provided in the survey as a starting point. The study’s primary goal was to address the core science and applications requirements within the suggested cost range ($300M +/- 50%, FY06). Consistent with report recommendations, the team considered additional science and applications areas that could benefit from the baseline SMAP mission, or the baseline mission with small augmentations, in order to allow consideration of the entire trade space.1
Mission study results included an evaluation of the maturity and technical readiness of the SMAP mission, cost estimate, and list of suggested next steps to move the concept forward toward the implementation phase. Results of the SMAP mission study were presented to the workshop participants in plenary session and are summarized here.
2.1 Mission Concept Heritage
As noted in the decadal survey, SMAP draws heavily upon the heritage of the Hydrosphere State (Hydros) mission (Entekhabi 2004) which was cancelled due to budget constraints in late 2005. Indeed, the decadal survey report cites the previous NASA investment in Hydros as a prime reason SMAP can be “fast-tracked” for an early launch. In order to understand the similarities and differences between SMAP and Hydros, presentations in sessions 1 and 2 covered the Hydros mission history, science goals, implementation strategy, and technology development tasks which are readily leveraged by the SMAP community.
2.1.1 Hydros Mission Overview
The Hydros mission evolved from initial investments by the NASA Instrument Incubator Program (IIP) and many years of analyzing ground and airborne data. The science objective of the Hydros mission was to provide global mapping of the Earth’s changing soil moisture and surface freeze/thaw conditions, enabling new scientific investigations regarding global hydrologic
1 From Chapter 2 of the decadal survey: “Where possible within budget constraints, the augmentation of the specified set of science observations with additional desired observables should be considered; however, NASA and the scientific community must avoid “requirement creep” and the subsequent damaging cost growth.”
8

changes, resulting in improved weather prediction and climate models and carbon source-sink maps based on boreal freeze/thaw measurements.
The Hydros payload was designed to satisfy the Level 1 science requirements using both active (radar) and passive (radiometer) microwave L-band sensors sharing a single reflector antenna and feedhorn. L-band was selected to minimize the measurement contamination due to vegetation, achieve greater penetration depth in the soil, and minimize the impact from RFI (Radio Frequency Interference) by operating in the protected band (1400-1427 MHz). The Hydros instrument was to be the first integrated active/passive microwave sensor to measure soil moisture, combining the attributes of active and passive observations and providing a path to higher spatial resolutions.
Hydros was selected as an alternate Earth System Science Pathfinder (ESSP) mission in 2002. After a year of the Risk Mitigation phase, the Hydros mission was approved to proceed to Formulation Phase in 2003, with a planned launch date of September 2010.
In December 2005, NASA notified the Hydros project that Hydros would not be funded to completion due to agency budgetary constraints. The Hydros team was encouraged to propose again to future NASA competitive solicitations due to the outstanding progress accomplished by the team.
2.1.2 Hydros Contributions to SMAP
As noted in the decadal survey, “the proposed SMAP soil moisture mission builds on the risk-reduction performed for the AO-3 ESSP called The Hydrosphere State (Hydros) mission.” Plenary presentations highlighted the common elements between Hydros and SMAP, and suggested areas where SMAP might leverage Hydros designs or investments. Due to the extensive similarities between SMAP and Hydros, the study team found that both technical and programmatic progress accomplished by Hydros can be used to accelerate SMAP mission development.
The Hydros core science objectives of measuring soil moisture and freeze/thaw are very similar to those specified for SMAP. Thus, the Hydros Level 1, Level 2, and key Level 3 requirements can be used as the staring point in developing the SMAP mission requirements. The Hydros science team had developed the baseline algorithms to satisfy the Level 1 requirements for soil moisture and surface freeze/thaw conditions. These algorithms are described in the Algorithm Roadmap documents which were provided in the Hydros Final Report and can be used as the starting point for SMAP baseline algorithms. The associated ground data system architecture can also be considered as a starting point for SMAP.
The implementation approach specified in the decadal survey is also consistent with the Hydros approach, with the primary difference being the NRC recommendation for a 3-year mission lifetime, whereas Hydros had planned a 2-year primary mission. The longer primary mission mainly results in an increased operations cost and is not expected to significantly impact the development cost (although the study team noted the need to consider each subsystem to ensure all parts were compatible with the longer mission lifetime requirement). Thus, SMAP can leverage the considerable previous NASA investment in science algorithm development, instrument design, and technology maturation during the Hydros formulation phase. In particular, presenters noted the SMAP mission will benefit from the extensive antenna dynamics
9

10
studies performed by Boeing and JPL, showing that two existing antenna designs can satisfy the pointing stability requirements. It was verified that a relatively small spacecraft can control the Hydros reflector (6 m diameter) reliably, with well-understood ACS requirements to maintain observatory mechanical stability.
In order to meet Hydros science goals within the challenging ESSP cost constraint, a robust partnership was developed, involving MIT (Principal Investigator and Soil Moisture Analysis Center), JPL (Project Management, System Engineering, Radar Electronics and JPL Project Scientist), GSFC (Radiometer Electronics, Soil Moisture Data Products Center, Management of all Science Operations and GSFC Project Scientist), University of Montana (Freeze-Thaw Analysis Center), CSA (Antenna Feed Assembly, Antenna System Analysis, Radar Data Processing Center and Canadian Science Team), General Dynamics (Spacecraft and Mission Operations), NGST Astro or Harris (Reflector Antenna vendor undecided), IPO (Data Downlink), and STP (Launch Services). The Hydros partnership arrangement can likely be revived for SMAP if desirable. Representatives from CSA gave a plenary presentation re-affirming their interest in participating in a spaceborne soil moisture mission such as SMAP.
2.1.3 Aquarius Contributions to and Synergy with SMAP
The Aquarius mission (currently in its implementation phase) and its contributions to and synergy with SMAP were discussed in a plenary presentation. Aquarius will make precise measurements of ocean salinity using an L-band radiometer and radar, thus providing an opportunity for early experience with L-band remote sensing from space using combined active and passive approaches. Aquarius will also provide valuable experience with issues such as Faraday rotation correction, the magnitude of solar radiation effects, and the impact of radio frequency interference at L-band, which can be leveraged by the SMAP team. Though Aquarius data will not satisfy SMAP mission requirements, they can be used to test SMAP algorithms. Since the Aquarius instrument will complete the instrument integration and test before the end of the SMAP formulation phase, SMAP should benefit significantly from Aquarius instrument experience, and be able to leverage many Aquarius instrument components to lower the mission cost. In particular, many elements of the Aquarius RF front-end electronics can be used for SMAP with minor modifications. The presentation also discussed the anticipated benefits of SMAP to the sea surface salinity community, which views SMAP as an opportunity for continuity of salinity measurements post-Aquarius, with higher spatial resolution to provide insight into eddies and fronts. Potential SMAP contributions to sea surface salinity are further discussed in section 4.1.5. SMAP synergy with other remote sensing missions is discussed in section 5.1.
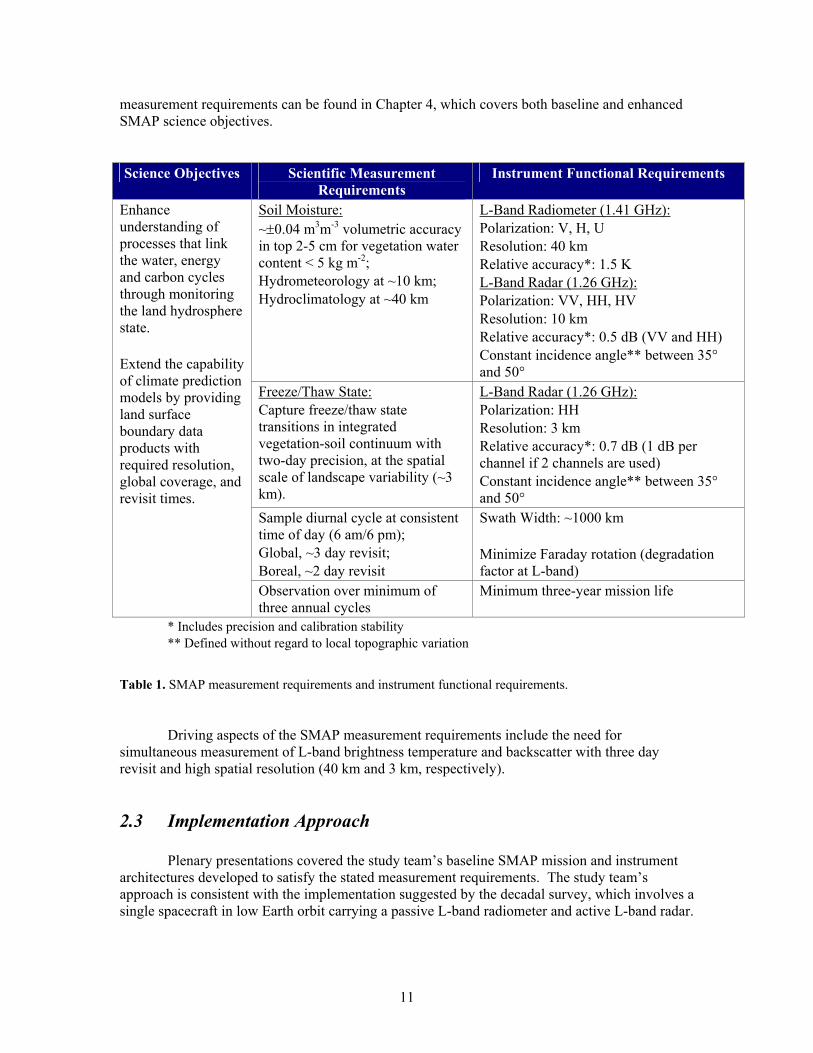
2.2 Measurement Requirements
SMAP measurement requirements and instrument performance characteristics were reviewed to ensure that soil moisture and its freeze/thaw state are measured to the desired accuracy and temporal and spatial resolution needed to accomplish the scientific objectives laid out in the decadal survey. The requirements, summarized in Table 1, were presented by the mission study team. They are derived from the high level science requirements and specifications for soil moisture and freeze/thaw state provided in the decadal survey, and follow those developed for Hydros. A more detailed discussion of the SMAP science requirements driving the
11
measurement requirements can be found in Chapter 4, which covers both baseline and enhanced SMAP science objectives.
Science Objectives Scientific Measurement Requirements
Instrument Functional Requirements
Soil Moisture: ~±0.04 m3m-3 volumetric accuracy in top 2-5 cm for vegetation water content < 5 kg m-2; Hydrometeorology at ~10 km; Hydroclimatology at ~40 km
L-Band Radiometer (1.41 GHz): Polarization: V, H, U Resolution: 40 km Relative accuracy*: 1.5 K L-Band Radar (1.26 GHz): Polarization: VV, HH, HV Resolution: 10 km Relative accuracy*: 0.5 dB (VV and HH) Constant incidence angle** between 35° and 50°
Freeze/Thaw State: Capture freeze/thaw state transitions in integrated vegetation-soil continuum with two-day precision, at the spatial scale of landscape variability (~3 km).
L-Band Radar (1.26 GHz): Polarization: HH Resolution: 3 km Relative accuracy*: 0.7 dB (1 dB per channel if 2 channels are used) Constant incidence angle** between 35° and 50°
Sample diurnal cycle at consistent time of day (6 am/6 pm); Global, ~3 day revisit; Boreal, ~2 day revisit
Swath Width: ~1000 km Minimize Faraday rotation (degradation factor at L-band)
Enhance understanding of processes that link the water, energy and carbon cycles through monitoring the land hydrosphere state. Extend the capability of climate prediction models by providing land surface boundary data products with required resolution, global coverage, and revisit times.
Observation over minimum of three annual cycles
Minimum three-year mission life
* Includes precision and calibration stability ** Defined without regard to local topographic variation
Table 1. SMAP measurement requirements and instrument functional requirements.
Driving aspects of the SMAP measurement requirements include the need for simultaneous measurement of L-band brightness temperature and backscatter with three day revisit and high spatial resolution (40 km and 3 km, respectively).
2.3 Implementation Approach
Plenary presentations covered the study team’s baseline SMAP mission and instrument architectures developed to satisfy the stated measurement requirements. The study team’s approach is consistent with the implementation suggested by the decadal survey, which involves a single spacecraft in low Earth orbit carrying a passive L-band radiometer and active L-band radar.

2.3.1 Instrument Architecture
The most economical approach for accomplishing the required simultaneous radiometer and radar requirements is to utilize a shared antenna/feed approach. In order to meet the 3 day revisit requirement at the equator, a wide measurement swath is necessary. The radiometer and radar resolution requirements at L-Band dictate that a relatively large 6 meter antenna aperture be employed. Thus, the large rotating antenna is the dominant instrument subsystem, and it both drives the ultimate measurement performance and governs spacecraft accommodation requirements. A reflector antenna was chosen to ensure that system calibration requirements, primarily for the radiometer, are met. Rotating the reflector in a conical fashion about the nadir axis provides a wide swath of measurements at a constant incidence angle.
The required 40 km radiometer resolution is obtained using the real aperture of the antenna. To obtain the required resolutions for the freeze/thaw (3 km) and soil moisture products (10 km or less), the radar will employ pulse compression in range and Doppler discrimination in azimuth to subdivide the antenna footprint. This is equivalent to the application of synthetic aperture radar (SAR) techniques to the conically scanning radar case. Due to squint angle effects, the high-resolution products may not meet requirements within the 300 km band of the swath centered on the nadir track. In this region, however, low resolution measurements can still be obtained. A schematic depiction of the measurement geometry is shown in Figure 1.
Figure 1. SMAP measurement geometry.
12

2.3.2 Orbit
The SMAP orbit was chosen to optimize the revisit and temporal sampling characteristics of the chosen instrument architecture, while still ensuring that the spatial resolution requirements can be met with a 6 meter diameter antenna. The baseline orbit parameters are:
� Orbit Altitude: 670 km � Inclination: 98 degrees, sun-synchronous � Local Time of Ascending Node: 6 pm
The instrument design is relatively easily modified for operation in orbits between 450 km to 700 km if there is a desire during later studies to choose a different orbit with different coverage characteristics.
2.3.3 Science Operations Concept
In the baseline science operations scenario, the radiometer, which has a relatively low data rate, operates continuously (around 360 degrees of the antenna scan, and for both ascending and descending portions of the orbit). The radiometer swath is shown in blue in Figure 2. In order to minimize the total data volume to be stored and downlinked, the high-resolution radar data collection is programmable. For the baseline soil moisture and freeze/thaw mission, the high resolution radar data is only collected for the morning or “AM” portion of the orbit, and only over land. The high-resolution radar swath is shown in yellow in Figure 2. Collection of high-resolution radar data is programmable, however, and can be adjusted as necessary to address other applications. There is also a low resolution real-aperture radar data stream that is collected continuously, with a resolution of approximately 30 km in azimuth and 6 km in elevation (very similar to the SeaWinds “slice” data).
13
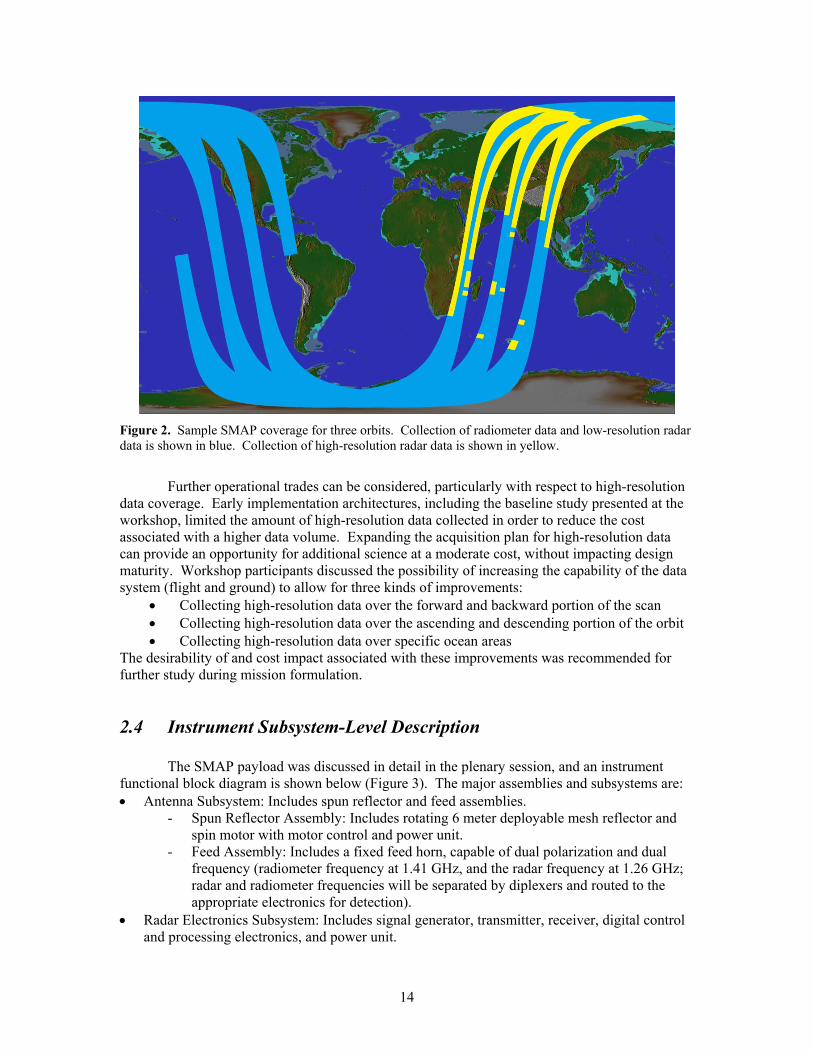
Figure 2. Sample SMAP coverage for three orbits. Collection of radiometer data and low-resolution radar data is shown in blue. Collection of high-resolution radar data is shown in yellow.
Further operational trades can be considered, particularly with respect to high-resolution data coverage. Early implementation architectures, including the baseline study presented at the workshop, limited the amount of high-resolution data collected in order to reduce the cost associated with a higher data volume. Expanding the acquisition plan for high-resolution data can provide an opportunity for additional science at a moderate cost, without impacting design maturity. Workshop participants discussed the possibility of increasing the capability of the data system (flight and ground) to allow for three kinds of improvements:
• Collecting high-resolution data over the forward and backward portion of the scan • Collecting high-resolution data over the ascending and descending portion of the orbit • Collecting high-resolution data over specific ocean areas
The desirability of and cost impact associated with these improvements was recommended for further study during mission formulation.
2.4 Instrument Subsystem-Level Description
The SMAP payload was discussed in detail in the plenary session, and an instrument functional block diagram is shown below (Figure 3). The major assemblies and subsystems are: • Antenna Subsystem: Includes spun reflector and feed assemblies.
- Spun Reflector Assembly: Includes rotating 6 meter deployable mesh reflector and spin motor with motor control and power unit.
- Feed Assembly: Includes a fixed feed horn, capable of dual polarization and dual frequency (radiometer frequency at 1.41 GHz, and the radar frequency at 1.26 GHz; radar and radiometer frequencies will be separated by diplexers and routed to the appropriate electronics for detection).
• Radar Electronics Subsystem: Includes signal generator, transmitter, receiver, digital control and processing electronics, and power unit.
14

• Radiometer Electronics Subsystem: Includes front and back-end electronics for H, V, and U polarization chains, detector, calibration sources, and power unit.
Instrument subsystem descriptions and technical readiness were discussed in detail in both plenary and breakout sessions, and are summarized here.
Figure 3. SMAP instrument functional block diagram (based on Hydros baseline).
15
2.4.1 Antenna Subsystem
The SMAP antenna subsystem consists of a rotating mesh reflector and a single fixed, dual-polarization feed horn. The feed assembly consists of diplexers to separate the radiometer and radar frequency signals, as well as provisions to rotate the radar polarization in synchrony with the antenna rotation. Due to the relatively large size of the required reflector (6 meter projected aperture), a deployable structure is necessary. Deployable mesh reflector technology is quite mature for spaceborne communications applications, and analyses of the mesh material have indicated its acceptability for remote sensing applications at L-band. The unique aspect of the SMAP application is the necessity for rotating the antenna. At the nominal SMAP altitude of 670 km, the reflector must rotate at a rate of 14.6 rpm to maintain contiguity (i.e., minimum overlap) of the measurements in the along-track direction. Key requirements that must be met by the reflector assembly include: (1) all RF performance requirements (gain, beam efficiency, etc.) must be met under the spinning conditions; (2) the total momentum generated must be within the amount the spacecraft is capable of compensating; and (3) the disturbances resulting from residual imbalances must be sufficiently small not to affect overall pointing accuracy or impart excessive loads to the spin motor bearings.
Two designs for the reflector/spin assembly have been studied in parallel for eventual down-selection. Both designs are based on flight-proven mesh reflector technology. One involves application of a “radial rib” reflector design, and the other the application of a “perimeter truss” reflector design (Figure 4).
16
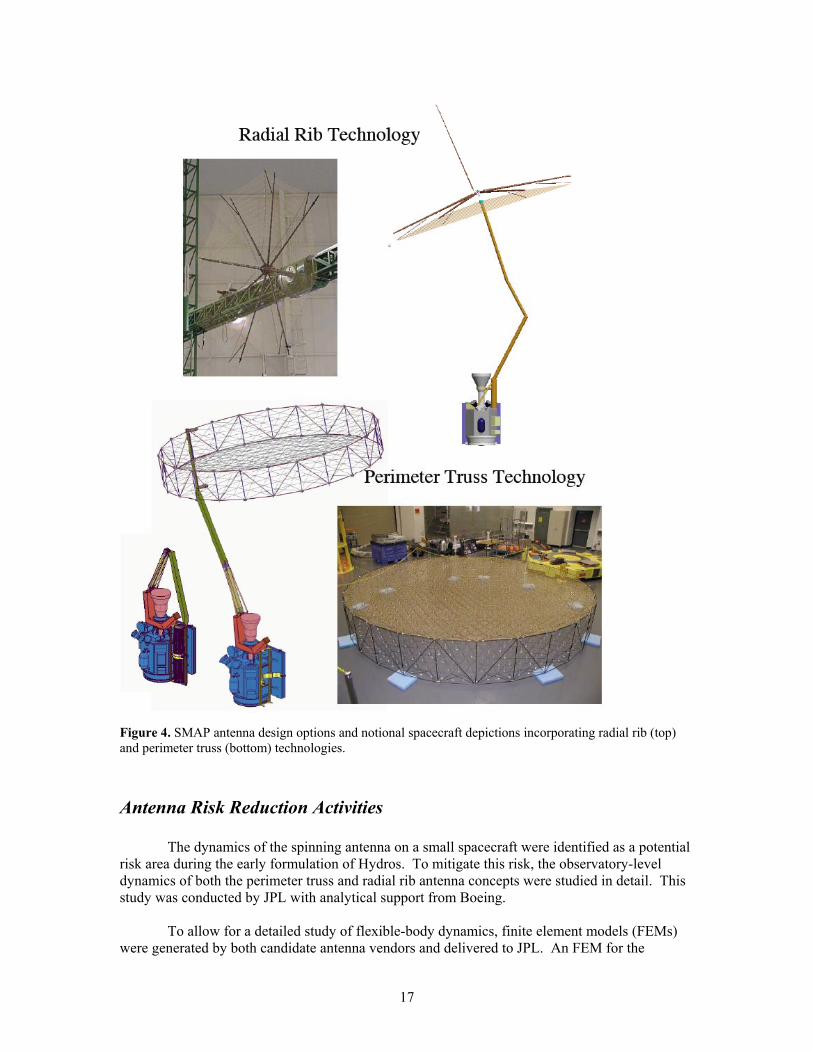
Figure 4. SMAP antenna design options and notional spacecraft depictions incorporating radial rib (top) and perimeter truss (bottom) technologies.
Antenna Risk Reduction Activities
The dynamics of the spinning antenna on a small spacecraft were identified as a potential risk area during the early formulation of Hydros. To mitigate this risk, the observatory-level dynamics of both the perimeter truss and radial rib antenna concepts were studied in detail. This study was conducted by JPL with analytical support from Boeing.
To allow for a detailed study of flexible-body dynamics, finite element models (FEMs) were generated by both candidate antenna vendors and delivered to JPL. An FEM for the
17

spacecraft was also constructed. These models were joined in a dynamics model that included the effects of the antenna rotation on orbit. The central conclusion of this study was that both antennas would behave in a stable fashion on orbit. The antenna would distort slightly due to the spinning forces, but would not distort to the extent that either a significant imbalance was created or that RF performance would be compromised. Further, for the required stiffness of the antenna, no higher order modes on either the antenna or the spacecraft solar array would be excited.
This study was later extended to include the effects of the spacecraft attitude control system. For this study, the antenna “quasi-static” mass/inertia properties are used with a spacecraft simulation where the spin motor, momentum compensation, and attitude control system are fully modeled. Again, within the required pre-launch balance requirements for the antenna, the spacecraft Attitude Control Subsystem (ACS) is shown to yield spacecraft pointing that meets requirements with a wide margin.
2.4.2 Radar Electronics Subsystem
To obtain the required resolution for the freeze/thaw and soil moisture products (3 km and 10 km, respectively), the radar will employ pulse compression in range and Doppler discrimination in azimuth to subdivide the antenna footprint. In order to minimize range/Doppler ambiguities with the baseline antenna and viewing geometry, separate carrier frequencies are used for each polarization. An additional channel measures the HV/VH cross-polarized return. This frequency separation approach allows both polarization channels to be operated simultaneously with the same timing. The radar timing is selected to ensure adequate sampling of the Doppler spectrum, as well as adequate interleaving of the transmit pulses and echo returns. The transmit timing will have to vary slightly around the orbit to account for Earth oblateness and orbit eccentricity effects.
The radar electronics subsystem can utilize significant heritage from other NASA programs. Although the radar digital back-end would require a custom development, much of the radar front-end can inherit mature designs from the Aquarius project (Figure 5). The radar transmitter requires a 200 W L-band transmitter. The 200 W solid-state power amplifiers developed for the Aquarius project can be utilized with little modification. The RF deck requires some tuning for the slightly different frequency, but the same flight-qualified parts can be utilized. The chirp generator used for the Aquarius radar can also be utilized in the SMAP design after reprogramming of the field programmable gate array (FPGA). Finally, the loop-back attenuator technology used in the Aquarius radar calibration may also be employed.
18
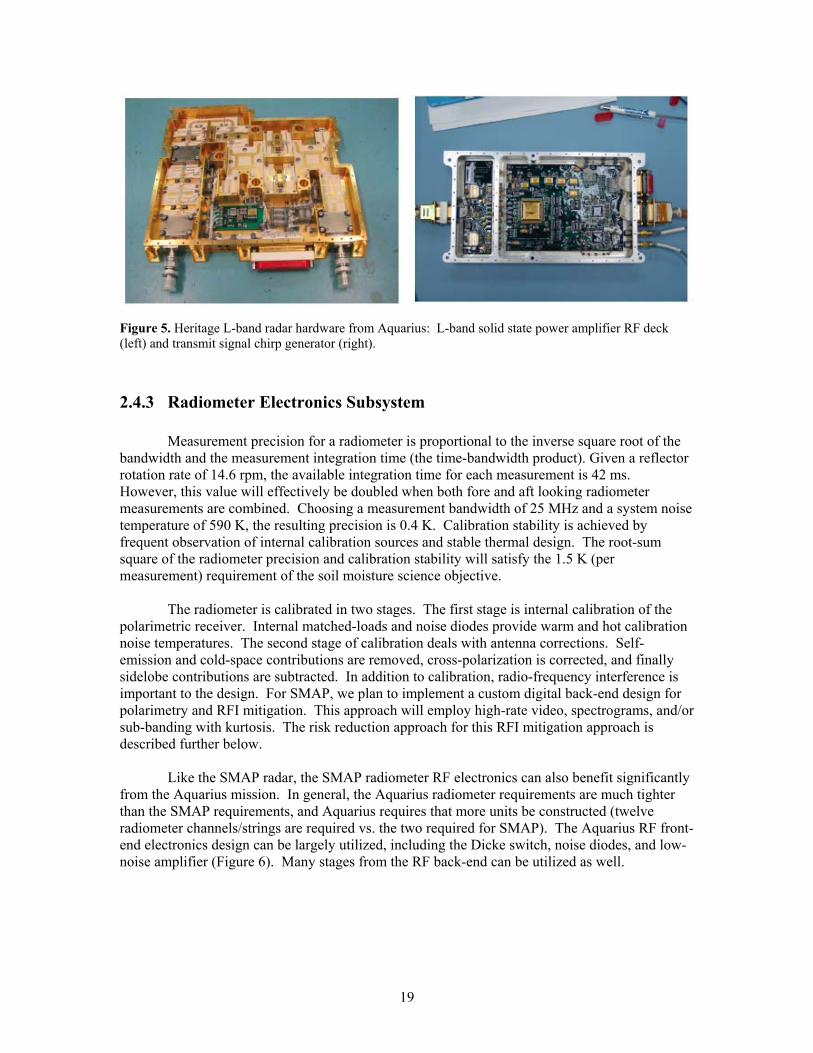
Figure 5. Heritage L-band radar hardware from Aquarius: L-band solid state power amplifier RF deck (left) and transmit signal chirp generator (right).
2.4.3 Radiometer Electronics Subsystem
Measurement precision for a radiometer is proportional to the inverse square root of the bandwidth and the measurement integration time (the time-bandwidth product). Given a reflector rotation rate of 14.6 rpm, the available integration time for each measurement is 42 ms. However, this value will effectively be doubled when both fore and aft looking radiometer measurements are combined. Choosing a measurement bandwidth of 25 MHz and a system noise temperature of 590 K, the resulting precision is 0.4 K. Calibration stability is achieved by frequent observation of internal calibration sources and stable thermal design. The root-sum square of the radiometer precision and calibration stability will satisfy the 1.5 K (per measurement) requirement of the soil moisture science objective.
The radiometer is calibrated in two stages. The first stage is internal calibration of the polarimetric receiver. Internal matched-loads and noise diodes provide warm and hot calibration noise temperatures. The second stage of calibration deals with antenna corrections. Self-emission and cold-space contributions are removed, cross-polarization is corrected, and finally sidelobe contributions are subtracted. In addition to calibration, radio-frequency interference is important to the design. For SMAP, we plan to implement a custom digital back-end design for polarimetry and RFI mitigation. This approach will employ high-rate video, spectrograms, and/or sub-banding with kurtosis. The risk reduction approach for this RFI mitigation approach is described further below.
Like the SMAP radar, the SMAP radiometer RF electronics can also benefit significantly from the Aquarius mission. In general, the Aquarius radiometer requirements are much tighter than the SMAP requirements, and Aquarius requires that more units be constructed (twelve radiometer channels/strings are required vs. the two required for SMAP). The Aquarius RF front-end electronics design can be largely utilized, including the Dicke switch, noise diodes, and low-noise amplifier (Figure 6). Many stages from the RF back-end can be utilized as well.
19
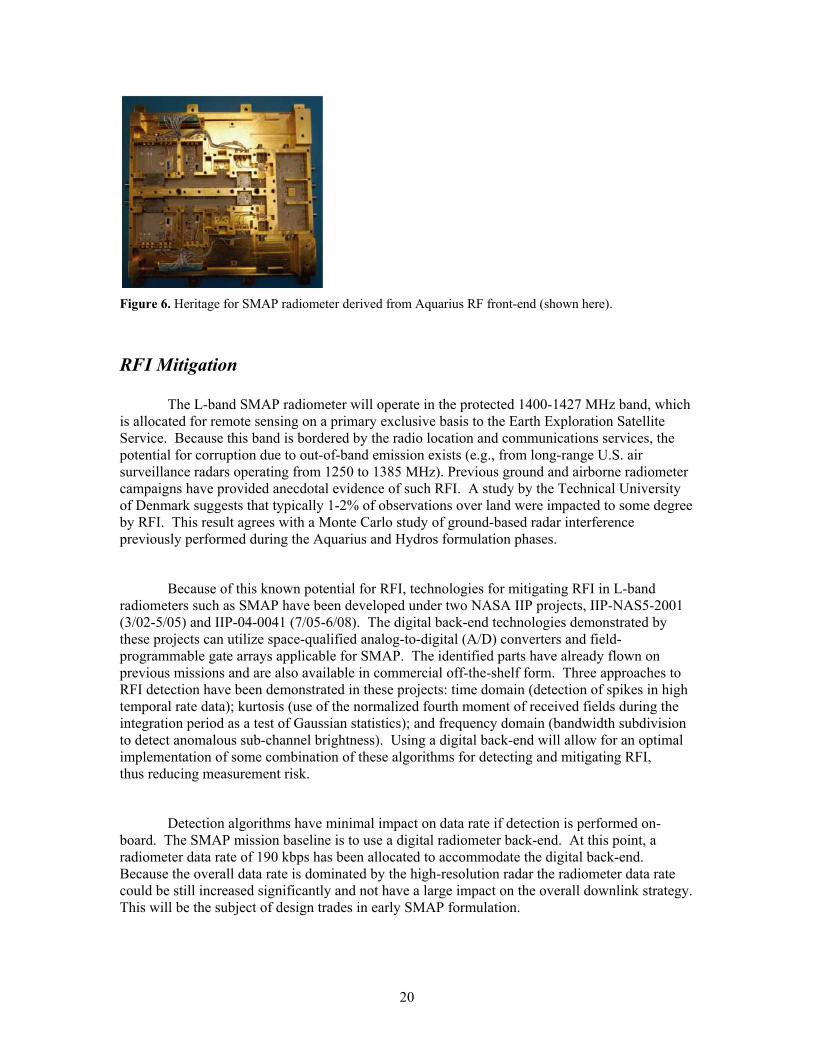
Figure 6. Heritage for SMAP radiometer derived from Aquarius RF front-end (shown here).
RFI Mitigation
The L-band SMAP radiometer will operate in the protected 1400-1427 MHz band, which is allocated for remote sensing on a primary exclusive basis to the Earth Exploration Satellite Service. Because this band is bordered by the radio location and communications services, the potential for corruption due to out-of-band emission exists (e.g., from long-range U.S. air surveillance radars operating from 1250 to 1385 MHz). Previous ground and airborne radiometer campaigns have provided anecdotal evidence of such RFI. A study by the Technical University of Denmark suggests that typically 1-2% of observations over land were impacted to some degree by RFI. This result agrees with a Monte Carlo study of ground-based radar interference previously performed during the Aquarius and Hydros formulation phases.
Because of this known potential for RFI, technologies for mitigating RFI in L-band radiometers such as SMAP have been developed under two NASA IIP projects, IIP-NAS5-2001 (3/02-5/05) and IIP-04-0041 (7/05-6/08). The digital back-end technologies demonstrated by these projects can utilize space-qualified analog-to-digital (A/D) converters and field-programmable gate arrays applicable for SMAP. The identified parts have already flown on previous missions and are also available in commercial off-the-shelf form. Three approaches to RFI detection have been demonstrated in these projects: time domain (detection of spikes in high temporal rate data); kurtosis (use of the normalized fourth moment of received fields during the integration period as a test of Gaussian statistics); and frequency domain (bandwidth subdivision to detect anomalous sub-channel brightness). Using a digital back-end will allow for an optimal implementation of some combination of these algorithms for detecting and mitigating RFI, thus reducing measurement risk.
Detection algorithms have minimal impact on data rate if detection is performed onboard. The SMAP mission baseline is to use a digital radiometer back-end. At this point, a radiometer data rate of 190 kbps has been allocated to accommodate the digital back-end. Because the overall data rate is dominated by the high-resolution radar the radiometer data rate could be still increased significantly and not have a large impact on the overall downlink strategy. This will be the subject of design trades in early SMAP formulation.
20
2.5 Spacecraft Accommodation
Results from the SMAP mission study presented in the plenary session indicate that SMAP baseline payload mass and power estimates are consistent with available commercial spacecraft bus capabilities. The peak instrument data rate is approximately 16 Mbps when high resolution radar data are being collected, and averages about 2 GB per orbit in the baseline collection scenario. The SMAP observatory mass is expected to be consistent with Taurus XL or Minotaur IV class launch vehicles. Key baseline mass and system properties for the baseline SMAP mission are provided in Appendix B. The study team found mission costs to be consistent with the decadal survey’s rough cost estimate of $300M +/- 50% ($FY06).
3. SMAP Data Products and Algorithms
The study team investigated the SMAP data products required to address the science and applications objectives set forth in the decadal survey. An overview of the data products, algorithms, ground data system, and ancillary data requirements was presented in plenary session.
3.1 Data Products
The primary science data products for SMAP are listed in Table 2. These products include calibrated sensor data (backscatter cross-section, σo, and brightness temperature, TB), geophysical products of soil moisture and freeze/thaw, and higher-level products using model assimilation. The geophysical products are derived at spatial resolutions appropriate to the resolutions of the sensor data from which they are obtained. SMAP product specifications were developed from Hydros heritage and science team inputs.
Data Product Description L1B_S0_LoRes Low Resolution Radar so in Time Order L1C_S0_HiRes High Resolution Radar so on Earth Grid L1B_TB Radiometer TB in Time Order L1C_TB Radiometer TB on Earth Grid L3_F/T_HiRes Freeze/Thaw State on Earth Grid L3_SM_40km Radiometer Soil Moisture on Earth Grid L3_SM_A/P Radar/Radiometer Soil Moisture on Earth Grid L4_F/T Freeze/Thaw Model Assimilation on Earth Grid L4_4DDA Soil Moisture Model Assimilation on Earth Grid
Table 2. SMAP primary science data products.
Primary science data products will be archived and distributed with a full set of quality flags, and other ancillary information such as fractional open water, urban areas, and land cover heterogeneity within the footprint. This ancillary information will come from external databases or SMAP high-resolution radar data, and is further defined in a later section.
21

3.2 Algorithms
The SMAP soil moisture and freeze/thaw retrieval algorithms are robust and have been demonstrated using both field campaign and synthetic model-generated data. Algorithm maturity has been established through the heritage of studies conducted during the past three decades, and evolved significantly during the Hydros risk-reduction and Phase A studies particularly in the understanding of vegetation effects, landscape heterogeneity, and incorporating time-history information (relative change) as a means for improved retrievals.
Software to generate the SMAP geophysical data products will be implemented based on algorithms developed by the SMAP science team. These algorithms will be described by Algorithm Theoretical Basis Documents (ATBDs) developed by the science team. Each algorithm consists of a set of equations and processing steps used to generate the product. Each SMAP science data product has a target accuracy, spatial resolution, spatial gridding (posting), global repeat, and latency requirement.
Algorithm roadmap documents are the first step in the algorithm development process. These documents describe the procedure for developing the algorithm and for ensuring that the resulting data product will meet the SMAP requirements. Roadmaps do not require detailed descriptions of the product and algorithms – these are developed in the subsequent ATBDs. However, the roadmaps include descriptions of the approaches to be used in developing the algorithms and for assessing the algorithms as they are developed. There is one algorithm roadmap document per product listed in Table 2.
Roadmaps will include both a baseline and a number of option algorithms for the products. Baseline algorithms will be used to produce SMAP standard products for archival in the designated distributed active archive center (DAAC). A limited number of option algorithms (typically three or so per product) may be implemented in the SMAP science data processing system to generate research products. At appropriate times, after assessment and review by the SMAP science team, option algorithms and research products may evolve into baseline algorithms and standard products respectively, and replace the former versions. Versions of the roadmaps developed for Hydros are available in the Hydros Final Report.
The algorithms for SMAP soil moisture products are based on theoretical studies and field campaigns using L-band ground-based and airborne instruments. Figure 7 illustrates schematically the progression from early studies in the 1970s to current and planned spaceborne sensors. Major field campaigns that have taken place since the mid-1980s using ground based and airborne microwave instruments are listed in Table 3. The locations of these campaigns have included a diversity of land cover and climatic environments. Analyses of the acquired data have solidified the scientific understanding and modeling of microwave interactions with soil and vegetation cover and have enabled robust retrieval algorithms and approaches to be developed for spaceborne missions. A key and successful aspect of these field campaigns has been the study of how microwave models and retrieval algorithms perform and can be applied over a range of spatial scales from field to satellite footprint scale.
22

Figure 7. Timeline showing heritage of observational studies for SMAP algorithm development
Field Campaign Location Period
Airborne Microwave Instruments
FIFE Kansas 1987-1988 PBMR MacHydro’90 Pennsylvania May 1990 PBMR, AIRSAR Monsoon’90 Arizona August 1990 PBMR Monsoon’91 Arizona August 1991 ESTAR Washita’92 Oklahoma June 1992 ESTAR, AIRSAR Washita’94 Oklahoma April 1994 SIR-C, AIRSAR, PBMR SGP’97 Oklahoma July 1997 ESTAR, PSR SGP’99 Oklahoma July 1999 ESTAR, PSR, PALS SMEX02 Iowa June-July 2002 ESTAR, PSR, PALS,
AIRSAR SMEX03 Alabama, Georgia, Oklahoma June-July 2003 2DSTAR, PSR, AIRSAR SMEX04 Arizona, Mexico August, 2004 2DSTAR, PSR SMEX05 Iowa June 2005 APMIR CLASIC Oklahoma June 2007 PSR, PALS HAPEX Toulouse (France) Summer, 1985 PBMR HAPEX Niger (Africa) Aug.-Sept. 1992 PBMR NAFE05 Upper Hunter (Australia) Nov. 2005 PLMR, EMIRAD NAFE06 Yanco (Australia) Nov. 2006 PLMR
Table 3. Major field campaigns using airborne microwave instruments.
23

3.2.1 Soil Moisture Algorithms
SMAP soil moisture retrieval algorithms are based on physical models of microwave emission and backscatter from the surface. These models range from simplified first-order models to sophisticated electromagnetic scattering models that take into account details of the soil substructure, surface roughness and topography, and vegetation structure including stem and leaf dimensions, orientations, and dielectric properties. Rigorous models are useful for understanding the sensitivity of microwave sensor response to the many surface variables, but simpler models with reduced parameterizations are necessary in development of retrieval algorithms for sensors with a limited number of observation channels.
Figure 8. Schematic representation of passive (left) and active (right) microwave interactions with soil and vegetation
A schematic representation of the surface showing the passive and active microwave interaction mechanisms is shown in Figure 8. Both passive and active microwave modeling of the surface can be represented as the sum of contributions from the soil surface (attenuated by the vegetation), the vegetation volume, and interactions between the soil and vegetation. Complementary information in the radar and radiometer signals can be taken advantage of in developing combined active/passive soil moisture algorithms. Radar backscatter is influenced more than radiometric brightness temperature by soil topography, roughness, and vegetation characteristics, thus the radar signals contain more inherent information on soil roughness and vegetation characteristics than the radiometer signals. However, this makes it more difficult to retrieve soil moisture from radar-only observations. A distinct advantage of radar observations is that they can achieve much higher spatial resolution than radiometry for a given antenna size using synthetic aperture processing. Since the information contained in the active and passive signals is complementary, the SMAP soil moisture algorithms seek to optimally combine the active/passive observations in a joint retrieval approach taking advantage of the enhanced spatial resolution and roughness/vegetation information provided by the active measurements and the greater soil moisture accuracy of the passive measurements.
The passive and active soil moisture retrieval algorithms have been developed and validated over an extensive period (nearly three decades) of microwave modeling and field experiments using ground-based, airborne and space shuttle instruments. Recent field experiments include those in Table 3. Some results from these experiments are illustrated in Figure 9. Radiometric retrieval accuracy is greater than radar in vegetated conditions, achieving better than 4% volumetric accuracy for vegetation water contents up to ~5 kg m-2 (mature corn crop). However, as mentioned earlier, radar can achieve higher spatial resolution than radiometry.
24

Figure 9. Field experiment results showing soil moisture retrieval accuracy.
Current research in SMAP soil moisture algorithm development focuses on methods for optimizing the trade-off between the higher accuracy but lower spatial resolution of passive soil moisture retrievals and the lower accuracy but higher spatial resolution of active soil moisture retrievals. There are presently three algorithm development streams for SMAP soil moisture retrievals: (1) passive-only at 40 km resolution, (2) active-only at 1-3 km resolution, and (3) combined active/passive at an intermediate resolution, e.g., 10 km. The active-only and combined active/passive algorithms are less mature than the passive-only algorithms, and were the subject of a special workshop held at UCSB in October 2005.
The development of the combined active/passive algorithm is being pursued via both field experiments (using the PALS passive/active sensor and the airborne SAR) and theoretical simulation studies known as Observing System Simulation Experiments (OSSEs) which use synthetic observational data sets that can incorporate geophysical variability, sensor modeling, and both geophysics and sensor modeling error and observational error. OSSEs are essential for conducting sensitivity studies, evaluating instrument design trades, and for algorithm development, however they cannot realistically represent all soil and vegetation conditions, and are therefore a supplement and not a replacement for observational field campaigns that acquire experimental data for microwave model and algorithm development.
An initial OSSE conducted for Hydros was completed and published (Crow 2005). This OSSE will be extended for SMAP with improvements in the areas of geophysical and microwave modeling, instrument and orbit simulations, and time duration of simulations. Sample results from the Hydros OSSE are shown in Figure 10.
25

26
An in-depth description of soil moisture algorithm development relevant to SMAP, including analyses of recent field campaign data and OSSE simulations, is contained in the Hydros Final Report.
Figure 10. Hydros OSSE results comparing retrieval errors for passive, active, and combined passive/active retrieval approaches.
3.2.2 Freeze/Thaw Algorithms
SMAP freeze/thaw retrieval algorithms operate on the basis of detecting the response of radar backscatter as water in the soil and vegetation biomass transitions between frozen and unfrozen states, as expressed through the change in the microwave dielectric constant of water (McDonald 2005). The radar signal is used primarily in SMAP data processing for detecting the change in dielectric constant, since the high resolution of the radar is necessary to detect the freeze/thaw signal against the background clutter of landscape heterogeneity in the boreal regions where freeze/thaw transition data are most needed. Common approaches employing satellite microwave remote sensing to classifying landscape freeze/thaw state involve temporal change detection schemes applied to time series radar backscatter. A survey of algorithm approaches and application has been provided by McDonald (2005). Currently, the freeze/thaw radar-based algorithms have been developed independently from the soil moisture retrieval algorithms, however a more integrated retrieval algorithm approach will be pursued in future studies.

27
3.2.3 Algorithm Processing
Participants agreed that the Hydros algorithm processing structure was applicable to SMAP due to the strong similarities in science objectives and measurement requirements. The prototype SMAP soil moisture and freeze/thaw algorithm processing flow diagram is shown in Figure 11. The soil moisture processing box has been expanded to show the three soil moisture retrieval algorithm branches.
Figure 11. SMAP soil moisture and freeze/thaw algorithm flow.
3.3 Ancillary Data Requirements
Ancillary data are defined as data from outside the SMAP mission that are required as input to SMAP retrieval algorithms in the generation of standard mission products (primarily Level 3 products). They are distinct from validation data that are used in assessing the accuracy or value of SMAP mission products post-launch. Ancillary data are both static and dynamic. Static ancillary data are data that do not change during the mission, including permanent masks (land/water/forest/urban/mountain), footprint-average elevation and slope data from a DEM, and soils information. In contrast, dynamic ancillary data pose more of a challenge since they require periodic updates in time-frames ranging from seasonal to daily – these would include information such as land cover, roughness, vegetation parameters, and effective soil temperatures. While the amount and type of ancillary data needed are dependent to some extent on the specific retrieval algorithms, all mission products will generally require some ancillary data to meet specified retrieval accuracies.

28
Workshop participants were asked to determine whether any ancillary data from non-SMAP sources were required to accomplish SMAP mission science and applications objectives. For the primary science data products, this was addressed in plenary session by the SMAP study team. Additional discussions continued into the breakout group sessions, and are also captured here.
3.3.1 Ancillary Data for L1-L3 Products
Table 4 presents a list of ancillary data types that are likely to be used in the SMAP Level 1-3 retrieval algorithms, along with their update frequency and multiple sources where this information can be obtained. In all cases, there is a no-risk, no-cost option for obtaining the required ancillary data parameters, generally through the use of either historical/climatological databases, forecast models, or datasets from past missions. Direct estimates of some of these parameters using visible/infrared/microwave measurements from missions active at the same time as SMAP will be utilized if available, and if they have lower error than other potential sources of the same information; however, SMAP is not dependent on any other mission for success. Prior to the SMAP launch, a primary and backup source for each of the needed ancillary data parameters will be chosen based on the accuracy of the ancillary data from this source as well as its time resolution, latency, and ease of access. High resolution ancillary data will generally be resampled to the same resolution as the standard mission products; when this occurs, it is anticipated that relevant information of potential value to users (such as fractional cover information) will be carried forward.
Parameter Source Frequency Surface Classification (including land/water mask)
NGA/SRTM, NGDC, GED v.2, JERS, PALSAR
Land/water mask done once (updated if necessary)
Land Cover (Classification and VCF)
VIIRS; MODIS data sets Seasonal
Soil Texture STATSGO & equiv. in US and Europe World soils map – Reynolds data bank
Done once
Roughness (large area topography)
DEM (SRTM, USGS) Done once
Roughness (local microroughness)
Historical database and/or SMAP radar
Seasonal
Vegetation ( b, W, τ, ω ) VIIRS products MODIS / historical phenology
Updated every 1-2 weeks
Surface air temperature (freeze/thaw)
WMO, SOGS Updated daily at overpass time
Effective Soil Temperature (soil moisture)
ECMWF forecast model NCEP forecast model GMAO model MW / VISIR LSTs as available
Updated daily at overpass time
Reference initial freeze/thaw states
JERS, PALSAR
Done once
Table 4. Ancillary data requirements for L1-L3 SMAP products.
3.3.2 Dynamic Flags
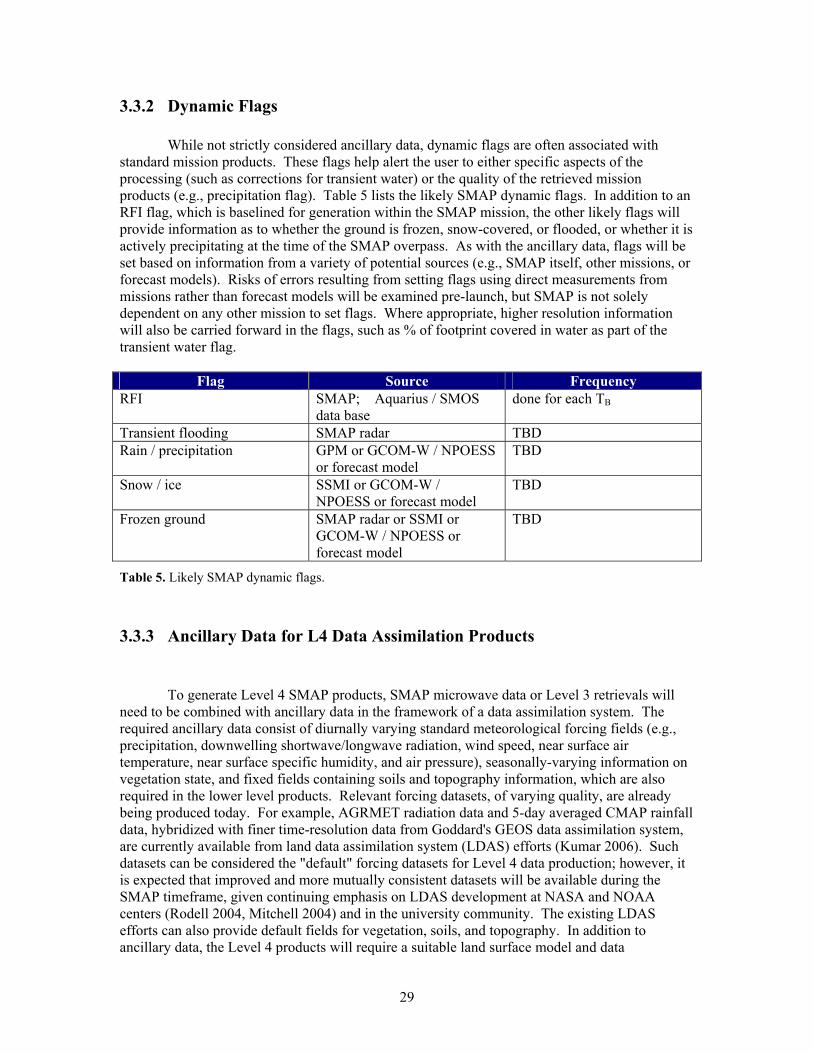
While not strictly considered ancillary data, dynamic flags are often associated with standard mission products. These flags help alert the user to either specific aspects of the processing (such as corrections for transient water) or the quality of the retrieved mission products (e.g., precipitation flag). Table 5 lists the likely SMAP dynamic flags. In addition to an RFI flag, which is baselined for generation within the SMAP mission, the other likely flags will provide information as to whether the ground is frozen, snow-covered, or flooded, or whether it is actively precipitating at the time of the SMAP overpass. As with the ancillary data, flags will be set based on information from a variety of potential sources (e.g., SMAP itself, other missions, or forecast models). Risks of errors resulting from setting flags using direct measurements from missions rather than forecast models will be examined pre-launch, but SMAP is not solely dependent on any other mission to set flags. Where appropriate, higher resolution information will also be carried forward in the flags, such as % of footprint covered in water as part of the transient water flag.
Flag Source Frequency RFI SMAP; Aquarius / SMOS
data base done for each TB
Transient flooding SMAP radar TBD Rain / precipitation GPM or GCOM-W / NPOESS
or forecast model TBD
Snow / ice SSMI or GCOM-W / NPOESS or forecast model
TBD
Frozen ground SMAP radar or SSMI or GCOM-W / NPOESS or forecast model
TBD
Table 5. Likely SMAP dynamic flags.
3.3.3 Ancillary Data for L4 Data Assimilation Products
To generate Level 4 SMAP products, SMAP microwave data or Level 3 retrievals will need to be combined with ancillary data in the framework of a data assimilation system. The required ancillary data consist of diurnally varying standard meteorological forcing fields (e.g., precipitation, downwelling shortwave/longwave radiation, wind speed, near surface air temperature, near surface specific humidity, and air pressure), seasonally-varying information on vegetation state, and fixed fields containing soils and topography information, which are also required in the lower level products. Relevant forcing datasets, of varying quality, are already being produced today. For example, AGRMET radiation data and 5-day averaged CMAP rainfall data, hybridized with finer time-resolution data from Goddard's GEOS data assimilation system, are currently available from land data assimilation system (LDAS) efforts (Kumar 2006). Such datasets can be considered the "default" forcing datasets for Level 4 data production; however, it is expected that improved and more mutually consistent datasets will be available during the SMAP timeframe, given continuing emphasis on LDAS development at NASA and NOAA centers (Rodell 2004, Mitchell 2004) and in the university community. The existing LDAS efforts can also provide default fields for vegetation, soils, and topography. In addition to ancillary data, the Level 4 products will require a suitable land surface model and data
29
assimilation system. Such models and systems already exist today (Reichle 2007) and will undoubtedly be more advanced by the launch of SMAP. Finally, the production of Level 4 products requires estimates of the measurement errors in the SMAP brightness and backscatter data (or for the errors in the Level 3 retrievals), which will come directly from the SMAP teams responsible for generating these data.
4. SMAP Science and Applications
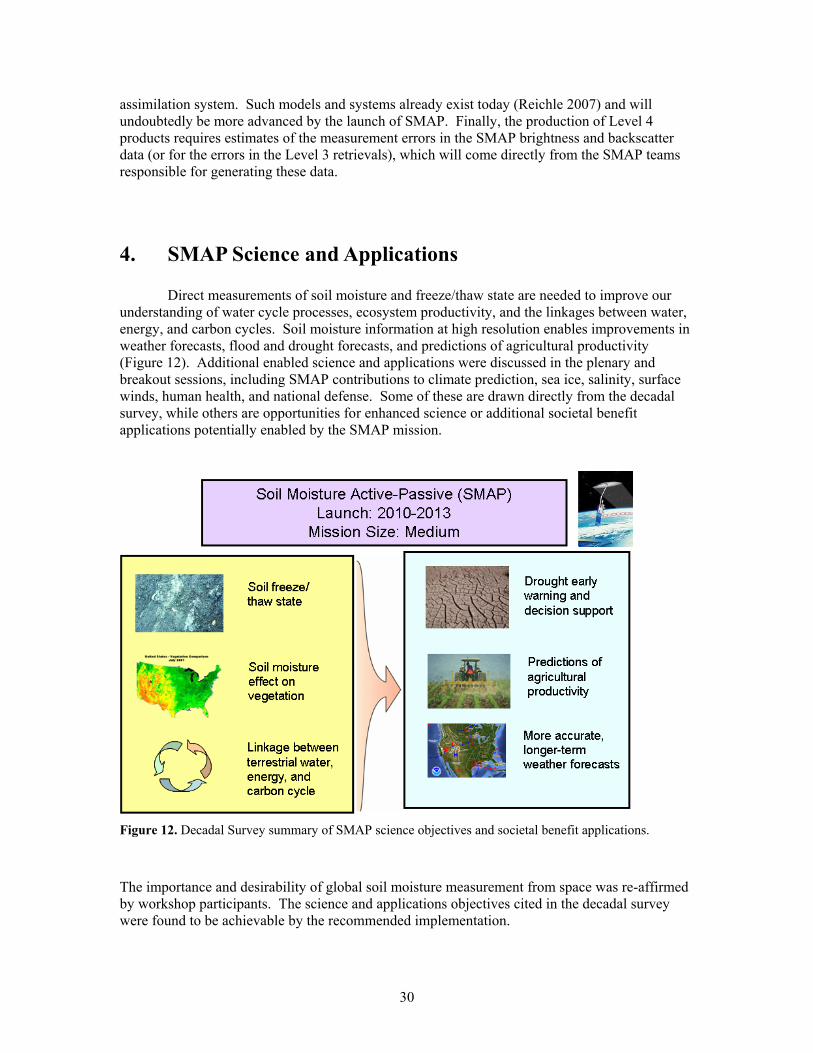
Direct measurements of soil moisture and freeze/thaw state are needed to improve our understanding of water cycle processes, ecosystem productivity, and the linkages between water, energy, and carbon cycles. Soil moisture information at high resolution enables improvements in weather forecasts, flood and drought forecasts, and predictions of agricultural productivity (Figure 12). Additional enabled science and applications were discussed in the plenary and breakout sessions, including SMAP contributions to climate prediction, sea ice, salinity, surface winds, human health, and national defense. Some of these are drawn directly from the decadal survey, while others are opportunities for enhanced science or additional societal benefitapplications potentially enabled by the SMAP mission.
Figure 12. Decadal Survey summary of SMAP science objectives and societal benefit applications.
The importance and desirability of global soil moisture measurement from space was re-affirmed by workshop participants. The science and applications objectives cited in the decadal survey were found to be achievable by the recommended implementation.
30
31
4.1 Enabled Science
SMAP will help characterize the relationship between soil moisture, its freeze/thaw state, and the associated environmental constraints to ecosystem processes including land-atmosphere carbon, water and energy exchange, and vegetation productivity. Workshop participants discussed the science enabled by SMAP in plenary and breakout group discussions, which are summarized here.
4.1.1 Soil Moisture and Freeze/Thaw State
The SMAP mission will provide the first global view of the Earth’s changing soil moisture and land surface freeze/thaw state, which together define the land hydrosphere state. Currently, there are neither spaceborne nor in situ networks capable of measurements that can adequately characterize the global hydrosphere state.
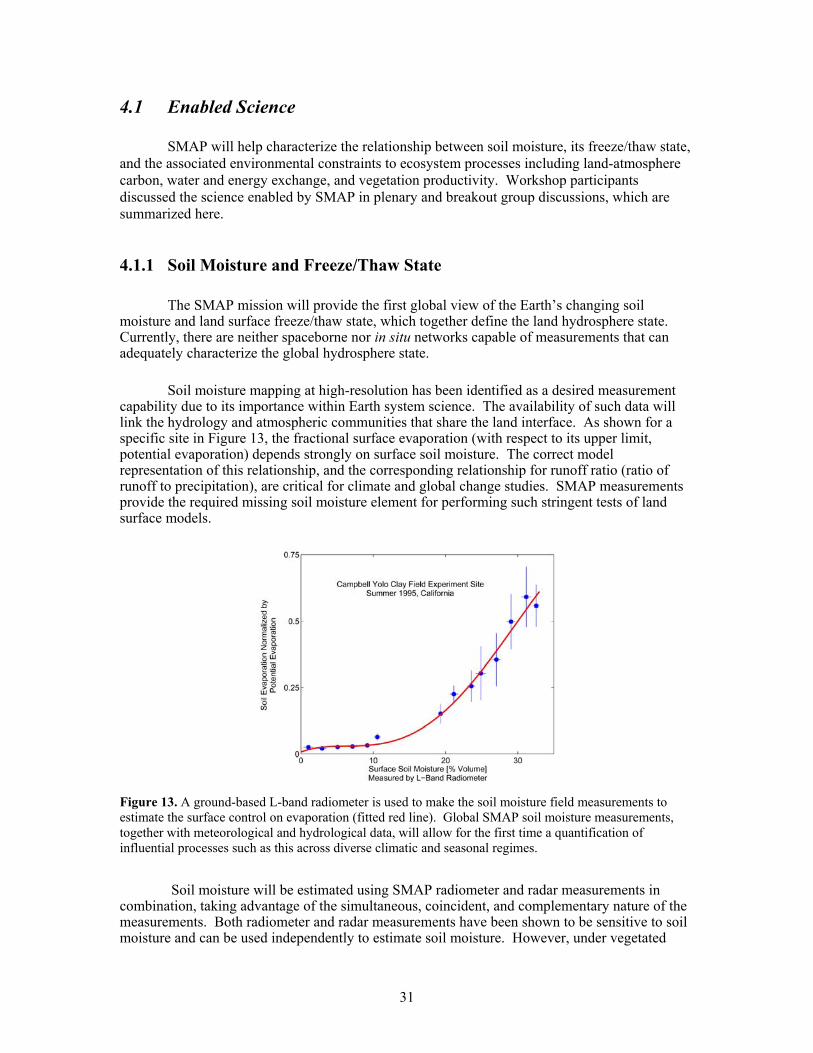
Soil moisture mapping at high-resolution has been identified as a desired measurement capability due to its importance within Earth system science. The availability of such data will link the hydrology and atmospheric communities that share the land interface. As shown for a specific site in Figure 13, the fractional surface evaporation (with respect to its upper limit, potential evaporation) depends strongly on surface soil moisture. The correct model representation of this relationship, and the corresponding relationship for runoff ratio (ratio of runoff to precipitation), are critical for climate and global change studies. SMAP measurements provide the required missing soil moisture element for performing such stringent tests of land surface models.
Figure 13. A ground-based L-band radiometer is used to make the soil moisture field measurements to estimate the surface control on evaporation (fitted red line). Global SMAP soil moisture measurements, together with meteorological and hydrological data, will allow for the first time a quantification of influential processes such as this across diverse climatic and seasonal regimes.
Soil moisture will be estimated using SMAP radiometer and radar measurements in combination, taking advantage of the simultaneous, coincident, and complementary nature of the measurements. Both radiometer and radar measurements have been shown to be sensitive to soil moisture and can be used independently to estimate soil moisture. However, under vegetated

32
conditions, radiometer measurements can potentially provide soil moisture estimates with better absolute accuracy than radar. Radar measurements, on the other hand, have a higher spatial resolution and can provide sub-pixel roughness and vegetation information within the lower-resolution radiometer footprint. Hence, the combination of simultaneous radar and radiometer data can enhance both the resolution capability and accuracy of soil moisture estimates.
To meet soil moisture science hydrometeorology and hydroclimatology goals, spatial resolutions of 10 and 40 km are required, respectively, with volumetric accuracy of ± 0.04 m3m-3. Temporal sampling requirements for surface soil moisture follow from the time scales of surface wetting and drying. Capturing the impacts of storm/interstorm sequences combined with the inertia of surface storage requires a revisit of ~ 3 days.
The SMAP mission will quantify the nature, extent, timing and duration of landscape seasonal freeze/thaw state transitions for improved understanding of ecosystem processes. The physical basis, algorithms, and ecological importance of the SMAP freeze/thaw measurement are well-established from a wide range of field measurements and airborne and satellite active/passive microwave remote sensing. Freeze/thaw state in boreal regions has previously been mapped with spaceborne SARs and scatterometers (e.g., Kimball 2001, Frolking 1999, Way 1997, Rignot 1994). Results demonstrate that these seasonal transitions are spatially heterogeneous and undergo several thaw and refreeze cycles in a season. These characteristics underscore the need for mapping with combined high spatial resolution (~3 km) and temporal resolution, with revisit requirements of ~2 days in boreal regions and ~3 days globally (Running 1999).
L-band radar penetrates vegetation canopies more readily than shorter wavelength radars, providing more backscatter sensitivity to freeze/thaw state transitions throughout the soil-vegetation column. Further, the contrast in dielectric constant of frozen and thawed water is maximized at L-band relative to higher frequencies employed in most current and planned radar missions, yielding higher backscatter sensitivity to dielectric variations in the soil and vegetation (Figure 14). The capability of L-band radar measurements to detect freeze/thaw transitions in a robust way is demonstrated in Figure 15, showing AIRSAR L-band imagery of regions in Alaska used to examine the spatial heterogeneity of springtime thaw. The series of images shows the spatially complex nature of the springtime thaw transition.

Figure 14. The dielectric constant of liquid water and ice as a function of frequency across the microwave spectrum; the dielectric constant of liquid water varies with frequency, whereas that of pure ice is constant.
Figure 15. Large L-band radar backscatter shift (dB) during a freeze-thaw transition event as captured from multi-temporal AIRSAR acquisitions in Bonanza Creek, AK.
Meeting the combined objectives of soil moisture and freeze/thaw requires high spatial resolution and short time lapses between revisits. SMAP will combine the attributes of active and passive microwave sensing to meet the resolution and accuracy requirements for soil moisture
33

and freeze/thaw state observations, providing global mapping of the land hydrosphere state at 3 to 10 km resolution with 2-3 day revisit.
4.1.2 Soil Moisture and Freeze/Thaw Effect on Vegetation
SMAP will provide a direct measure of changes in landscape water content and freeze/thaw status for monitoring terrestrial water mobility controls on ecosystem processes. SMAP freeze/thaw state measurements will also contribute to understanding how ecosystems respond to and affect global environmental change, improving regional mapping and prediction of boreal-arctic ecosystem processes and associated carbon dynamics.
The Land-Use, Ecosystems, and Biodiversity Panel of the decadal survey affirmed the importance of soil moisture measurement to ecosystems science, and provided their observation requirements in their panel chapter which states: “Soil moisture is a key measurement for several disciplines, especially hydrology, where the primary discussion of this mission will be found. We strongly endorse a soil moisture experiment. In order to maximize the value of a soil moisture measurement for ecosystem science, it needs to resolve the time and space scales of variability relevant to ecosystem science. A temporal resolution (repeat sampling interval) of 3-5 days is needed to allow successful assimilation and inference of available water. This time interval is also critical for monitoring the development of plant water limitation and wet intervals associated with rapid and important soil activity. The spatial resolution required must correspond to scales of variability in terrestrial ecosystems, and in the soil moisture anomalies that affect them. This implies spatial resolution on the order of square kilometers to tens of square kilometers.”
SMAP freeze/thaw measurement requirements follow from the need to determine the freeze/thaw status of the aggregate vegetation-soil layer sufficiently to characterize the low-temperature constraint on vegetation net primary productivity and surface-atmosphere CO2 exchange, and with accuracy sufficient to resolve the temporal dynamics of net ecosystem carbon exchange to within 0.05 tons C ha-1(or 3%) over a ~100-day growing season. This results in requirements for minimum spatial resolution ≤3 km and a mean temporal sampling of 2 days or better.
4.1.3 Linking the Terrestrial Water, Energy, and Carbon Cycle
The global water, energy, and carbon cycles are important elements of the world’s ecosystems. Fluxes of these quantities over land are strongly influenced by a surface resistance that is dependent on the soil moisture and surface freeze/thaw state. This resistance exerts the dominant control on evaporation, transpiration, and carbon exchange over most of the global land surface and is a fundamental determinant of the global water, energy, and carbon cycles.
As noted by the decadal survey’s Water Resources and Hydrologic Cycle panel, soil moisture is the key missing observation from the list of water cycle state variables and is the variable that links the water, energy and carbon cycles at land surfaces. Knowledge of soil moisture is a strong constraint on establishing the rates of these cycles and, more importantly, how they co-vary in their dynamics. Since much of the atmosphere’s source/sink for water, energy, and carbon is at the land surface, limits on the flux exchange at the land-atmosphere interface affect the evolution of weather and climate.
34

35
Soil moisture in the extra-tropics and its freeze/thaw state at higher latitudes and upper elevations are often key limiting factors in plant transpiration and land-atmosphere carbon exchange (e.g., Kimball 2004). In seasonally frozen landscapes the timing and cycling of freeze/thaw events is the primary trigger for so-called “green-up” and assimilation of atmospheric carbon into plant biomass. Depending on the timing of freeze/thaw, the same boreal patch can be a net source or net sink of carbon. The high degree of uncertainty in this factor has led to the so-called “missing sink” in carbon cycle science. It is imperative that terrestrial freeze/thaw state dynamics be established at the scale of their spatial and temporal heterogeneity in order to constrain uncertainties of future global change. In order to reduce the uncertainty of net ecosystem exchange of carbon by appreciable amount the freeze/thaw transitions need to be known to within at most one to two days within the year. SMAP will provide enhanced L-band sensitivity and increased spatial resolution so that source/sink hotspots can be observed.
4.1.4 Sea Ice
Satellite remote sensing can provide large-scale descriptions of the state of the Arctic ice cover including basic parameters such as distribution of sea ice classes, lead, polynya, and melt zone, which are necessary to observe and understand the role of the sea ice cover in the global climate system and its utility as a climate change indicator. Sea ice geophysical products are critical inputs into Arctic sea ice albedo model, insolation model, and Community Climate System Model (CCSM) Sea Ice model (CSIM) to address Arctic sea ice mass balance (Perovich 2007, Weatherly 2005). Moreover, the U.S. National Ice Center (NIC), consisting of the Navy, NOAA, and U.S. Coast Guard, indicate that satellite sea ice products at different spatial and temporal resolutions are in demand for operational purposes including support of science field campaigns aboard the newest U.S. Coast Guard icebreaker, the Healy (Nghiem 2005). Satellite products are crucial to Arctic commercial maritime, naval operations, planning and execution of a multitude of national and international field experiments, particularly in view of recent drastic change of Arctic sea ice.
Potential SMAP contributions to sea ice observations were discussed in plenary session and in the enhanced science breakout group. Candidate SMAP sea ice products include sea ice classification, area of sea ice extent, sea ice edge, lead and polynya, melt zone, melt onset date, and freeze-up date for science research and for operational applications. Of particular note is the ability of the SMAP L-band radar to complement other sensing techniques, providing 1-3 km resolution measurements with >90% daily coverage of the Arctic to help bridge the observational gap between synthetic aperture radar (SAR) and scatterometer measurements. This coverage would likely require alterations to the radar mask and data collection scenarios described in the baseline SMAP implementation scenario. SMAP’s lower microwave frequency, multiple polarizations, and insensitivity to snow cover allows for collection of highly complementary SMAP sea ice data over a wide range of weather, wind, and polar snow conditions. The low noise floor of the SMAP radar further allows identification of multiple sea ice classes.
Opportunities for additional science through combination of SMAP radar data with other remote sensing observations, as well as with SMAP radiometry data, are recommended for further exploration during the SMAP formulation process. Operational use of sea ice mapping capability would likely require data latency reductions compared to the SMAP baseline implementation.

4.1.5 Sea Surface Salinity
Ocean salinity modulates the large scale thermohaline circulation, driven by buoyancy, which moves large masses of water and heat around the globe and maintains the present climate. Of the two variables that determine buoyancy (salinity and temperature), currently only temperature is monitored from space. Systematic satellite mapping of the global salinity field is the missing observation needed to more fully understand thermohaline circulation.
Salinity also plays an important role in energy exchange between the ocean and atmosphere. In addition to thermohaline circulation, in areas of strong precipitation fresh water “lenses” (i.e., buoyant stable layers of water) can form on the surface, which insulate the water in the mixed layer below from the atmosphere. This alters the air-sea coupling (energy exchange) and can affect the evolution of tropical intra-seasonal oscillations, monsoons, and the El Niño Southern Oscillation (ENSO). Ocean-atmosphere water fluxes dominate the global hydrologic cycle, accounting for 86% of global evaporation and 78% of global precipitation. Changes in surface salinity reflect changes in surface freshwater forcing. Systematic mapping of the global salinity field will provide data needed to reduce the wide uncertainties in the marine freshwater budget and better understand the global water cycle and how it is changing.
Aquarius, planned for launch in 2010, will be the first mission to measure global sea surface salinity from space. The Aquarius L-band instrument is designed to provide global maps of the sea surface salinity field in the open ocean on a monthly basis with an average accuracy of 0.2 psu and at a spatial resolution of 150 km. The Aquarius mission has a three year baseline mission lifetime, with the potential for 2-4 years in extended mission operations. SMAP data over oceans could provide continuity of the salinity data record post-Aquarius. The SMAP mission’s higher spatial resolution capability (40 km) may provide additional information closer to the coast and sea ice boundaries, and about mixing at ocean fronts, and subduction and upwelling zones. An important example is the Labrador Sea, a source of cold water downwelling in the ocean thermohaline circulation, which is sensitive to the supply of fresh water exchanged from the low salinity coastal currents off Greenland and Canada.
The key performance driver for sea surface salinity measurements from space is the radiometric stability of the L-band instrumentation. To achieve 0.2 psu accuracy, the Aquarius L-band radiometer has to achieve an rms measurement accuracy of 0.15 K over 7 days (time to map the globe). SMAP radiometer stability requirements need to be reviewed to determine whether the baseline SMAP mission meets sea surface salinity science requirements. If necessary, an Aquarius-like design feature with tight thermal control of the radiometer and radar front-end should be considered as a SMAP performance enhancement. SMAP reflector emissivity and pointing knowledge also need to be evaluated for their impact on overall salinity retrieval accuracy.
4.1.6 High Ocean Winds
The SMAP mission has strong potential for tropical cyclone scientific research and operational monitoring. Skillful forecasts of tropical cyclone track and intensity depend on an accurate depiction of the initial conditions of air and sea states in tropical cyclone forecast models (Bender 1993, Hoffman 2004). A primary source of difficulty in past efforts for tropical cyclone forecasts has been the inability to make direct observations of the surface wind field, which is one
36

of the key driving forces for the heat and moisture exchanges between the air and sea surfaces (Dickinson 1996, Hsu 1997, Liu 2000).
Current ocean surface wind satellite programs, including the SeaWinds scatterometer on the QuikSCAT satellite and the Advanced Scatterometer (ASCAT) on the MetOp satellite series, have been providing surface wind measurements at about 20-30 km resolution. Although the L-band (~1 GHz) microwave frequency used by the SMAP mission has weaker response to ocean surface winds than the C-band frequency (5 GHz) used for ASCAT and the Ku-band frequency (13 GHz) used for QuikSCAT, the L-band observations will be much less sensitive to rain, which is frequently associated with high wind regions in tropical storms. In addition, the high resolution (1-3 km) radar measurements from SMAP will enable accurate positioning of the storm center, which is often hard to identify using the low resolution measurements from QuikSCAT or ASCAT. The SMAP mission will fill in the data gap (rain and high resolution) in the QuikSCAT and ASCAT wind observations, and hence will improve short-term and severe weather forecasting capabilities for hurricanes, storm hazards and extreme weather events.
To enable the high ocean wind vector measurement capability, SMAP high-resolution radar observations are needed over both fore and aft portions of the antenna scan to provide two distinct azimuth looks for each point on the ocean surface. The two-look high resolution, multi-polarization radar observations, in conjunction with the coincident passive polarimetric radiometer observations (although at a coarser resolution of 40 km), will allow the retrieval of both ocean surface wind speed and direction. Because of the large size of tropical storms and the uncertainty of prediction of storm locations, it will be necessary to conduct high resolution radar acquisitions over areas within about 500 km from the location of the storm predicted at the time of the SMAP satellite pass. Reduced data latency would likely be required for operational use of severe weather information.
4.2 Enabled Applications
Workshop participants discussed the societal benefit applications enabled by SMAP in plenary and breakout group discussions.
4.2.1 Hydrological Hazards Applications: Drought and Flood
Soil moisture is a key variable in water-related natural hazards. High-resolution observations of soil moisture from the SMAP mission will help to improve both drought and flood forecasts.
As noted in the decadal survey, “there is no global in situ network for soil moisture, and global estimates of soil moisture, and, in turn, plant water stress, must be derived from models. These model predictions (and hence drought monitoring) could be greatly enhanced through assimilation of soil moisture observations.” Direct measurements of global soil moisture from SMAP will provide a valuable data set to directly aid in drought prediction. Indirectly, SMAP data can be used to initialize seasonal forecast models, further improving prediction skill and forecast lead times to enable more effective drought mitigation efforts. At the workshop, presenters from the USDA confirmed the anticipated value of SMAP data for drought monitoring and mitigation.
37

38
Soil moisture and freeze/thaw state are also key parameters in flood forecasting. Once precipitation impacts the land surface it can either infiltrate or become runoff; partitioning is dependent on the soil moisture state at the surface. Seasonal and permanent frost in soils reduce both infiltration into and migration of water through soils, and severely reduce the amount of water than can be stored in soils. By reducing infiltration, frozen soils can dramatically increase the runoff generated from melting snow (Cline 1999). Prediction of floods and flash-floods therefore requires not only precipitation information but also soil moisture and freeze/thaw state information. In the absence of any in situ or current satellite capability to monitor and map soil moisture and freeze/thaw state, agencies such as the National Weather Service hydrologic services produce model or proxy estimates of soil moisture at the surface in order to support operational flood forecasting. A daily national map of Flash-Flood Guidance (FFG) is produced that is an estimate of soil moisture deficit at the surface (Figure 16). This map is used in conjunction with ground-based radar rainfall estimates to produce flood warnings and watches. The FFG data product is evaluated currently at county-level or approximately 30 km average resolution in most parts of the country. SMAP will provide direct observations of soil moisture with an order of magnitude higher resolution. Such data are recognized to be of great value to the development and evaluation of improved FFG and flood warning systems (Crow 2005b). At the workshop, hydrologists from the National Weather Service presented case studies and hind-cast experiments showing that reliable soil moisture estimates improved flood forecast accuracies.
Figure 16. Left Panel: Flash-Flood Guidance (FFG) produced by the NOAA National Weather Service. Right Panel: Drought Severity Index produced by the NOAA Climate Prediction Center. These products could be enhanced significantly using direct observations of soil moisture provided by SMAP.
4.2.2 Ecosystem Services Applications: Agricultural Productivity
Factors that affect soil moisture availability to plants (natural and cropped) go beyond the total of accumulated precipitation and include factors that affect partitioning and losses of water at the surface. Thus, so-called “agricultural drought” or “hydrological drought” can be established even without a deficit in precipitation (or “meteorological drought”). For this reason ecosystem services require direct monitoring of soil moisture to assess ecosystem productivity. SMAP will provide information on water availability for plant productivity and potential yield. Forecasts of agricultural productivity are routinely made by several US agencies in response to diverse information needs. For example, the U.S. Department of Agriculture has developed a Production Estimate and Crop Assessment Division (PECAD) that provides monthly global crop

39
production estimates to meet national agricultural competitiveness and food security needs. The US Air Force Weather Agency (AFWA) produces soil moisture and temperature estimates using its Agricultural Meteorology modeling system (AGRMET). The multi-agency U.S. Drought Monitor in Lincoln, Nebraska produces operational soil moisture deficit and drought assessment data. The National Integrated Drought Information System (NIDIS) is a follow-on multiagency initiative that expands the focus on regional and local-scale drought assessment and hazards forecasting. The NIDIS report (WGA 2004) states that “…soil moisture [is] one of the most critical parameters for understanding drought throughout the country...[however]…the total number of [in situ] sites is not sufficient for understanding soil moisture conditions on a widespread basis.”
These and other soil moisture and related ecosystem productivity data products are model-based and estimate available soil moisture to plants only as a by-product of performing soil water accounting. The availability of direct observations of soil moisture from SMAP will allow significant improvements in the operational crop productivity and crop water stress information systems by providing realistic soil moisture targets for the models. The SMAP observations can also be blended with the model estimates (process known as data assimilation - see Section 3.3.3) to produce enhanced data sets at local and regional scales.
4.2.3 Weather Forecast Applications
The quality of weather forecasts is significantly dependent on the availability of accurate initial states for key atmospheric variables due to the chaotic nature of the atmosphere. Initial states of systems coupled to the atmosphere such as soil moisture over land are also required. To date, significant effort has been concentrated on measuring the initial states of temperature, air density, winds, and water vapor to improve weather forecasts, although it is now recognized that the next significant advances in the quality of weather forecasts will come from constraining water and energy fluxes at the land-atmosphere interface. Numerous hind-cast studies with global weather and regional atmospheric forecast models show that the knowledge of surface soil moisture variations at the scale of over-land severe-weather phenomena is a very promising way to make marked increases in forecast accuracy (Reen 2006, Beljaars 1996, Black 2004, Brabson 2005, Pan 1996, Viterbo 1999).
The soil moisture measurement requirements for weather forecast applications are dictated by the spatial scale of weather formation as well as the temporal dynamics of change in surface soil moisture. The growth of the boundary layer and the formation of clouds and precipitating convection are affected by local circulations that develop over moist and dry patches (Chen 1994, Chen 2001, Desai 2006). For severe weather over land, such as convective storms, regional atmospheric models are implemented at 1 to 10 km scales (Ziegler 1994, Gallus 2000). Soil moisture at these same scales is needed to initialize the models and capture the role of land surfaces in affecting the evolution of weather. The temporal dynamics of soil moisture are characterized by punctuated jumps due to precipitation and exponential drydowns during inter-storm periods. The temporal sampling requirement is set by the dominant precipitation events inter-arrival periods and the time-scales of dissipation (Walker 2004). Capturing the impacts of storm/interstorm sequences combined with the inertia of surface storage requires a revisit of ~ 3 days. The baseline SMAP implementation meets the measurement requirements, though improved latency might increase operational use.

4.2.4 Climate Prediction Applications
The decadal survey lists SMAP as a contributor to the societal challenge of climate prediction. Improved seasonal climate predictions will benefit climate-sensitive socioeconomic activities, including water management, agriculture, and fire, flood, and drought hazards monitoring. SMAP data will significantly enhance the development and evaluation of model surface hydrology parameterizations in prediction models.
Emerging seasonal climate prediction operational applications are now focusing on soil moisture in addition to sea surface temperature as the boundary conditions that affect climate and its predictability on seasonal time-scales (Douville 2004, Yang 2004, Atlas 1993, Koster 2004). This shift to requiring more realistic soil moisture boundary conditions is especially apparent for inner-continental regions, and outside of the tropics where the ocean influence is diminished and local land-atmosphere interactions are greater determinants of hydroclimate. Seasonal predictability is highly dependent on model characteristics. Hence, multiple models need to be included in realistic climate sensitivity tests. Figure 17 shows a multi-model study (Koster 2004) in which a ratio of the ensemble variances for two experimental conditions is used as a metric of soil moisture influence on seasonal precipitation. The plotted hotspots indicate where a global initialization of soil moisture may enhance precipitation prediction skill during Northern Hemisphere summer. Under the assumption that the soil moisture impacts are predominantly local, the hotspots indicate where the routine monitoring of soil moisture, with both ground-based and space-based systems, will yield the greatest return in boreal summer seasonal forecasting.
Figure 17. Land-atmosphere coupling strength diagnostic for boreal summer indicating “hotspot” regions where the impact of soil moisture on precipitation, averaged across twelve models, is greatest. (Insets) Areally averaged coupling strengths for the individual models over the outlined, representative hotspot regions.
40

41
The importance of soil moisture as a key initial condition in climate and seasonal forecast models, and the relevance of the SMAP mission to fulfilling this need, were re-affirmed by workshop presentations and participants.
4.2.5 Human Health Applications
A plenary presentation covered many areas in which SMAP data might be useful for human health applications, including both direct and indirect contributions (e.g., better weather forecasts leading to predictions of virus spreading rates and heat stress; better flood forecasting leading to improved disaster preparation and response; and improved seasonal soil moisture forecasts leading to improved famine early warning systems). Participants also discussed the challenge of information transfer from scientific data to the larger community, including public health officials. Transferring of information (and not just data) is required to unlock the value of scientific data for societal benefit, and this requires the establishment of partnerships and outreach to potential user communities. SMAP data has much to offer the applications community, and these opportunities will need to be considered in more detail as formulation proceeds.
Mapping of environmental and ecosystem conditions allows monitoring and prediction of factors that impact human health. Soil moisture preconditions, for example, are related to heat stress in inner continental regions, where soil moisture information is key to predicting persistent temperature and humidity anomalies because of the effects it has on surface energy partitioning and climate persistence. Global change projections of human heat stress isolate the increased incidences of mid-latitude summer-time soil moisture drying as a major mediator of anticipated change in heat stress in future climates (Delworth 1999).
Another linkage between soil moisture and human health applications can be found in the emerging field of landscape epidemiology. Landscape epidemiology is aimed at identifying and mapping vector habitats for human diseases. Water and soils are often the determining environmental factors in vector population dynamics. For example Patz (1998) finds that at a study site in Kenya, soil moisture is the environmental link to the human-biting rate of malaria vectors. A two-week time lag with soil moisture peak (rather than precipitation or other environmental factors) is due to the length of time it takes for mosquito larvae to develop. Currently a number of operational centers for vector-borne disease early warning systems use proxy or model estimates of soil moisture (e.g., combination of precipitation and vegetation indices). Availability of direct soil moisture information at scales where landscape heterogeneity and atmospheric forcing variability produce anomalies in soil moisture has the potential of opening a new era in landscape epidemiology (Shaman 2005).
A final example of how soil moisture information can directly apply to human health monitoring and prediction systems, especially in developing countries, is the hunger and food production issue. Much of sub-Saharan Africa and South Asia where hunger remains a major human health factor harvests its food from rain-fed agriculture in highly monsoonal (seasonal) conditions. As discussed in previous sections agricultural drought (soil moisture deficit that affects crop productivity) can be established regardless of the presence or severity of meteorological drought (rainfall deficit). Hydrological factors that affect soil moisture anomalies are more complex than simple cumulative precipitation. Most current drought early warning
42
systems use the Palmer Index which is again a proxy soil moisture variable resulting from soil moisture accounting that includes precipitation inputs and evaporation and runoff hydrological loss estimates. SMAP will provide direct measurements of soil moisture on a global basis, which is particularly relevant in developing countries where in situ observations are sparse.
4.2.6 Defense Applications
As a key determinant of terrain trafficability and boundary layer atmospheric conditions, the Armed Forces user community has had long-standing requirements for high resolution soil moisture. Terrain trafficability is a major element of battlefield awareness and it has significant tactical value. The planned Army Future Combat System (FCS) relies heavily on rapid and often autonomous deployment. Trafficability assessment is a major element of FCS and the battlespace awareness decision-support systems include soil moisture and soil strength mapping components.
The Air Force has a requirement for soil moisture to initialize their aviation weather forecast and dust forecast models. Operational benefits include improved forecasts of daytime convection, density altitude, fog formation and dust generation—all of which can have major impacts on planning and executing close air support and the land battle. Density altitude that determines the lift capability of aircraft is significantly dependent on the temperature and humidity profiles in the atmospheric boundary layer. It is known that soil moisture and the partitioning of energy at the land surface is a key determinant of day-to-day variations in the atmospheric boundary layer and its density altitude.
The Navy has requirements for all-weather sea-ice detection which is independent of clouds and solar illumination. U.S. Naval operations require timely and accurate sea ice characterization for safe surface and submarine operations. Potential SMAP contributions to sea ice detection and characterization are discussed in more detail in Section 4.1.4.
4.2.7 NPOESS Applications
The National Polar-orbiting Operational Environmental Satellite System (NPOESS) Integrated Program Office (IPO) has developed a tri-agency set of requirements for the next-generation of polar-orbiting operational environmental satellites.2 Both threshold (minimum performance) and objective (desired performance) measurement attributes are defined for each environmental data record in the IORD-II document. The salient measurement attributes (threshold and objective) for soil moisture in the NPOESS system are shown in Table 6. The applications driving these requirements are principally Army trafficability and numerical weather prediction. Of the NPOESS observation requirements, soil moisture is ranked as a Category 1-A requirement. It is also designated as one of only six Key Performance Parameters (KPP).3
2 The IPO is staffed with personnel from the three agencies, namely the Department of Defense, Department of Commerce, and National Aeronautics and Space Administration (NASA). 3 In the NPOESS Integrated Operational Requirements Document, Key Performance Parameters (KPPs) are defined as “those parameters so significant that failure to meet the threshold is cause for the system to be reevaluated or the program to be reassessed or terminated.” Category A indicates “There is a value to the Government if thresholds are exceeded and/or objectives are approached.”

Table 6. Threshold and objective soil moisture measurement requirements summary for the NPOESS system.
The NPOESS Conical Microwave Imager/Sounder (CMIS) instrument was to provide operational soil moisture measurement meeting the threshold requirement. The Visible/Infrared Imager/Radiometer Suite (VIIRS) was planned to augment CMIS for the clear skies high-resolution soil moisture requirement. However, as a result of the Nunn-McCurdy certification process, CMIS is now being re-competed as a still undefined Microwave/Imager Sounder (MIS) instrument with reduced capability and is not slated to fly until NPOESS C2 platform, which launches no earlier than 2016. The key microwave instrument channel (the lowest frequency at 6 GHz) to be used for soil moisture monitoring will probably not be included in the baseline instrument package.
With “fast-track” development, it is possible that SMAP could provide critical gap-filling measurements for the NPOESS soil moisture KPP. The novel combined radar-radiometer and L-band approach to global soil moisture mapping allows SMAP to far exceed the NPOESS threshold requirements and approach the objective requirements for sensing depth and spatial resolution. At the workshop representatives from the Integrated Program Office (IPO), which manages NPOESS expressed strong interest in seeing this gap-filling capability realized in order to support key DoD and other NPOESS user applications. Although near-real-time data collection is not a science requirement for SMAP, NPOESS users require the minimum possible latency in order to use the data in their operational applications. IPO has significant ground reception and ground data pipelines in place that can be used in a partnership to facilitate near-real-time operation of SMAP.
5. Opportunities for Synergy
Workshop participants identified areas of possible SMAP synergy with currently available or planned science remote sensing missions and in situ measurement programs. Though none of these represent requirements for SMAP success, they present the opportunity for enhancement of the SMAP science mission.
43
5.1 Synergy with other Remote Sensing Missions
Opportunities for synergy between SMAP and the anticipated overlapping missions (SMOS, Aquarius, ALOS, GPM, and GCOM-W) include extensions of the climate records of brightness temperature, backscatter, soil moisture, and salinity measurements. Direct SMAP science team involvement in these synergistic missions would improve the SMAP mission science return.
The ESA Soil Moisture and Ocean Salinity (SMOS) mission, for example, will use an L-band, 2-dimensional interferometric radiometer design providing ~ 50 km resolution (Kerr 2001). New science opportunities arise if data from SMAP and SMOS mission are combined; however, SMOS data alone do not meet the SMAP science requirements. Combined measurements from both missions could improve temporal sampling and would allow for cross-calibration between the single-incidence angle, high precision and stable measurements of SMAP with the multi-angle measurements of SMOS. SMOS is also developing validation resources (e.g., in situ soil measurement, tower and aircraft sensors) that could benefit SMAP.
The Global Precipitation Measurement (GPM) mission holds significant promise for synergy with SMAP. GPM mission team members presented potential synergies in plenary session. While neither mission depends on the other for mission success, enhanced science opportunities are apparent based on concurrent availability of measurements. The GPM Microwave Imager (GMI) 36.5 GHz channel might provide valuable additional source of soil temperature to support SMAP retrievals. Similarly, GPM would benefit from SMAP soil moisture assimilation into models to provide an independent estimate of GPM errors in data-poor regions (Crow 2007). SMAP soil moisture, temperature, and freeze/thaw products can result in improvements in surface emissivities to improve GPM passive microwave retrievals. GPM precipitation measurements combined with SMAP brightness temperature and soil moisture should reduce flux/state errors (Crow 2006) and improve flood forecasts (Crow 2005), respectively. Together, SMAP and GPM could improve water and energy cycle linkages through non-parameterized estimation of the closure function (Salvucci 2001).
5.2 Synergy with Airborne and Ground Measurements
Tower and aircraft sensor measurements provide a critical link across measurement scales that can support global remote sensing observations; they can also establish retrieval accuracy for homogeneous targets. Aircraft and tower-based instruments should also be a key part of the SMAP program. Participants felt these types of projects should have support built-in to the SMAP mission, rather than have to rely on unstable external funding sources.
Airborne synergy discussions at the workshop centered primarily on validation programs rather than application programs. Aircraft simulators are needed for SMAP, both pre-launch and during the mission itself, and for validation and measurement science.
Workshop participants felt that there might be synergy between the SMAP mission and the UAV program, depending on the parameters of that program. Of particular interest to participants was unmanned aerial vehicle (UAV) synthetic aperture radar (SAR), though it was not clear how a passive sensor could be integrated with UAV SAR. Other instruments of note
44
included PALS, which could be used to target critical geographic regions or for algorithm improvement/validation.
In situ networks are invaluable for validation. Relationships with several other programs, including the Consortium of Universities for the Advancement of Hydrological Sciences, Inc. (CUASHI) and the National Ecological Observatory Network (NEON), should be considered.
6. Break-out Session Summaries
Numerous additional topics were discussed in the breakout sessions. For completeness, the discussion topics are briefly noted here and commended to further consideration by the SMAP implementing organization during its formulation phase where appropriate.
6.1 Data Collection Scenario
It is anticipated that the primary SMAP soil moisture and freeze/thaw products would be derived from the morning overpass (ascending pass). The descending overpasses could also be of interest, especially when they can be made over the same location on the same day. Collecting brightness temperatures during descending passes would involve additional minor data processing and storage. Yet, inclusion of the radar data for these passes is not necessary to accomplish primary science objectives.
Participants suggested additional high-resolution radar data could be collected to support enhanced science investigations, perhaps using the differences between AM and PM radar soil moisture measurements to observe diurnal variation in internal/external vegetation water content (high water content in the morning from dew, and dryness in the evening from daytime transpiration), and how the soil temperature gradient affects the soil moisture at the surface. A freeze in the morning during the ascending pass that is thawed by the time of the evening pass could be captured through observations on both passes. Soil moisture retrievals for the PM pass, however, might be less accurate due to the surface temperature effect and difficulty in correcting for Faraday rotation. In addition, most of these suggestions would rely on same day coverage, which would not be frequent or consistent.
Further tower-based studies could be conducted to determine whether the additional data collection would add sufficient value to warrant data collection, processing, and storage.
6.2 Optimal Overpass Times
The optimal overpass time for soil moisture retrieval is well-established; however, several participants expressed interest in revisiting the rationale behind the chosen orbit overpass time. Briefly, soil physics and diurnal variations of soil moisture and temperature make the early morning the optimal time window for soil moisture retrieval. It is difficult to state with precision that 6 am is better than 7 am because there are variations associated with the seasons and the time within an orbit. However, it is clear that this general period is preferred. Additional benefits of
45
selecting a nominal 6 am overpass time are the minimization of potential Faraday rotation and establishing a climate data record with SMOS and Aquarius.
Advantages of other overpass times for a variety of science applications was discussed, including the desire for morning observations of vapor pressure and early afternoon overpass times to observe the maximum vegetation stress response. Measurements at pre-dawn and at the peak temperature of the day were also suggested for consideration. Participants suggested that committees be set up to work this problem from both the scientific perspective and the engineering mission perspective to derive an optimum solution.
As the overpass time rationale had not been collected into a single document for public distribution prior to the workshop, a short white paper was prepared to address these questions, and is included in the online supporting material.4
6.3 Measurement Science and Validation
It should be recognized that in nearly every satellite science mission, the algorithms continue to evolve during development and post launch. Participants perceived a lack of ongoing support for measurement science and validation to improve/enhance SMAP science and algorithms. Although the SMAP study team already has several algorithms that can satisfy the mission objectives, it is anticipated that much more can be achieved if a strong research program is incorporated in SMAP.
To accommodate enhanced science applications of SMAP data without driving up the mission validation program cost, the group recommended retaining the SMAP data product list as defined in the baseline mission, while supporting development of additional products on a research basis as funding opportunities allows.
6.4 Effective Temperature Estimation
There are several alternative approaches that can be used to estimate the effective temperature required for normalizing brightness temperature to emissivity before proceeding with the soil moisture retrieval. These include readily-available weather forecast products and remote sensing observations from other SMAP or non-SMAP sensors. Improvements in effective temperature estimation through direct measurement might provide improvements in soil moisture or freeze thaw (as previously noted in the GPM synergy section). However, it has been demonstrated that the required accuracy can be achieved using the default forecast products. A trade study or OSSE using a combination of simulations and surrogate satellite data could be conducted to evaluate this issue.
The feasibility of incorporating an additional higher frequency (37 GHz) channel as part of the SMAP instrumentation has not been fully explored. This might provide land surface temperature as well as additional downscaling capabilities. There was no clear consensus on the technology limitations of using the SMAP antenna for this purpose, and further investigation is needed to determine feasibility.
4 Supporting material is available online: http://hydrology.jpl.nasa.gov/events/SMAPpresentations/
46
6.5 Within-footprint Heterogeneity
Although fractional land cover information is integral to the generation of SMAP flags and is used by SMAP algorithms, within-footprint heterogeneity characterizations were not explicitly identified as a separate output or interpretative product. The consensus was that this should be provided with the mission products.
The breakout session discussion identified the delineation of water bodies, very rough terrain, forest, urban areas, and perhaps houses or roads, and any other area that would be considered null as part of the information set as valuable to include with the mission data products. These should not be flags for the most advanced users, but rather provided as additional data for research use. There was discussion regarding the best way to identify this type of information, however no decision was made.
6.6 Latency
Real-time or near-real-time delivery would allow operational centers to use SMAP data in an operational manner. Before attempting to satisfy such a demand, a decision would be necessary to determine whether SMAP data should be considered as an operational data set or as an opportunistic data set to evaluate/calibrate/improve existing models. For research or demonstration use, participants indicated that latency is not an issue. For operational use, however, it can be critical.
6.7 Radio Frequency Interference
An RFI mitigation approach must be developed. It appears that there are several RFI mitigation approaches, with no consensus about which is best for SMAP. Therefore, a small RFI working group should study the existing RFI mitigation approaches and develop a plan. If SMOS is launched on schedule, it would serve as a source of information on the levels and patterns of global L-band RFI. This information would be available well before SMAP designs are finalized. It is critical that the SMAP team be involved in the SMOS mission.
6.8 Technology Readiness
The SMAP mission can be implemented using currently existing technologies. The SMAP observatory is capable of producing the science products specified by the decadal survey. However, participants indicated that the Hydros Harris antenna design is not desirable due to the boom blockage. The boom blockage will be removed for the SMAP antenna design.
47
7. Conclusions and Recommendations
The importance and desirability of global soil moisture measurement from space was reaffirmed by workshop participants, and the science and applications objectives cited in the decadal survey were found to be achievable by the recommended implementation.
Several key conclusions resulted from the SMAP workshop:
• There is a stable set of instrument measurement requirements for SMAP that are traceable to science requirements for soil moisture and freeze/thaw.
• The baseline SMAP instrument design is capable of satisfying the science measurement requirements.
• Significant heritage exists from design and risk-reduction work performed during Hydros mission formulation and other technology development activities. This heritage includes studies addressing science applications and algorithms, antenna rotation dynamics, antenna RF performance, and RFI mitigation techniques.
• Heritage and lessons learned can be leveraged from the Aquarius project. This heritage includes both the L-Band radiometer and radar electronics.
• There are no technology “show-stoppers,” and SMAP formulation is positioned to begin where Hydros left off.
Key near-term risk reduction recommendations include:
• Down-selection to single antenna vendor, followed by additional dynamics analyses, including rotating antenna prototype to validate balancing technique.
• Design studies for radiometer digital back-end for RFI suppression.
Next steps identified by the SMAP study team and affirmed by the workshop participants include:
• Continued analysis of the impacts of a longer prime mission duration on parts selection
• Engagement with spacecraft vendors, perhaps through an RFI process
• Continued investigation of partnership opportunities
• Continued investigation of high-resolution radar coverage scenarios
• Participation in the SMOS and Aquarius missions for algorithm development and validation
• Defining the requirements for in situ, tower, and aircraft instrumentation to support SMAP
There was general consensus that SMAP, as it is defined in the decadal survey, can accomplish the intended science. There was also general consensus that SMAP is well-defined, technologically feasible, and ready to be implemented on a “fast track.”
48
References
Atlas, R., N. Wolfson, and J. Terry, 1993: The effects of SST and soil moisture anomalies on GLA model simulations of the 1988 U.S. summer drought. Journal of Climate, 6(11), 2034-2048.
Beljaars, A.C.M., P. Viterbo, M. Miller, and A.K. Betts, 1996: The anomalous rainfall over the USA during July 1993: Sensitivity to land surface parametrization and moisture anomalies. Monthly Weather Review, 124, 362-383.
Bender, M. A., R. J. Ross, R.E. Tuleya, and Y. Kurihara, 1993: Improvements in tropical cyclone track and intensity forecasts using the GFDL initialization system. Monthly Weather Review, 121, 2046-2061.
Black, E., M. Blackburn, G. Harrison, B. Hoskins, and J. Methven, 2004: Factors contributing to the summer 2003 European heatwave. Weather, 59, 217-223.
Brabson, B. B., D. H. Lister, P. D. Jones, and J. P. Palutikof, 2005: Soil moisture and predicted spells of extreme temperatures in Britain. Journal of Geophysical Research, 110D, D05104, doi:10.1029/2004JD005156.
Cahill, A.T., M.B. Parlange, T.J. Jackson, P. O'Neill, T. J. Schmugge, 1999: Evaporation from nonvegetated surfaces: Surface aridity methods and passive microwave remote sensing, Journal of Applied Meteorology, 38(9), 1346-1351.
Chen, F., and R. Avissar, 1994: Impact of land-surface moisture variability on local shallow convective cumulus and precipitation in large-scale models. Journal of Applied Meteorology, 33, 1382-1401.
Chen, F., T.T. Warner, and K. Manning, 2001: Sensitivity of orographic moist convection to landscape variability: A study of the Buffalo Creek, Colorado flash flood case of 1996. Journal of Atmospheric Sciences, 58, 3204–3223.
Cline, D., R. E. Davis, W. Edelstein, J. Hilland, K. McDonald, S. Running, J.B. Way, J. vanZyl, 1999: Cold land processes mission (EX-7) science and technology implementation plan, Report on the NASA Post-2002 Land Surface Hydrology Planning Workshop, Irvine, CA, April 12-14, 1999.
Crow, W. T., S.T.K. Chan, D. Entekhabi, P.R. Houser, A. Hsu, T.J. Jackson, E.G. Njoku, P.E. O'Neill, J. Shi, and X. Zhan, 2005: An Observing System Simulation Experiment for HYDROS radiometer-only soil moisture data products. IEEE Transcations on Remote Sensing and Geoscience, 43(6) 1289-1303.
Crow, W.T., R. Bindlish and T.J. Jackson, 2005b: The added value of spaceborne passive microwave soil moisture retrievals for forecasting rainfall-runoff ratio partitioning, Geophysical Research Letters, 32, L18401, doi: 10.1029/2005GL023543.
Crow, W. T., D. Entekhabi, R.D. Koster, and R.H. Reichle, 2006: Multiple spaceborne water cycle observations would aid modeling. EOS, 87 (15), 149 and 153.
Crow, W.T. and J.D. Bolten, 2007: Estimating precipitation errors using spaceborne surface soil moisture retrievals. Geophysical Research Letters, 34, L08403, doi:10.1029/2007GL029450.
49

Delworth, T.L., J.D. Mahlman and T.R. Knutson, 1999: Changes in Heat Index associated with CO2-induced global warming. Climatic Change, 43, 369-386.
Desai, A.R., K.J. Davis, C. Senff, S. Ismail, E.V. Browell, D.R. Stauffer and B.P. Reen, 2006: A case study on the effects of heterogeneous soil moisture on mesoscale boundary layer structure in the southern Great Plains, USA. Part I: Simple prognostic model. Boundary-Layer Meteorology, 119(2): 195-238, doi:10.1007/s10546-005-9024-6.
Dickinson, S. and R.A. Brown, 1996: A study of near-surface winds in marine cyclones using multiple satellite sensors. Journal of Applied Meteorology, 35(6), 769-781.
Douville, H. and F. Chauvin, 2004: Relevance of soil moisture for seasonal climate predictions: a preliminary study. Climate Dynamics, 16, 719-736.
Entekhabi, D., E. Njoku, P. Houser, M. Spencer, T. Doiron, J. Smith, R. Girard, S. Belair, W. Crow, T. Jackson, Y. Kerr, J. Kimball, R. Koster, K. McDonald, P. O'Neill, T. Pultz, S. Running, J.C. Shi, E. Wood, and J. van Zyl, 2004, The Hydrosphere State (HYDROS) mission concept: An Earth system pathfinder for global mapping of soil moisture and land freeze/thaw. IEEE Transactions on Geoscience and Remote Sensing, 42(10), 2184-2195.
Frolking, S., K. C. McDonald, J. Kimball, J. B. Way, R. Zimmermann, and S. W. Running, 1999: Using the space-borne NASA scatterometer (NSCAT) to determine the frozen and thawed seasons of a boreal landscape. Journal of Geophysical Research, 104 (D22), 27,895-27,907.
Gallus, W. A., and M. Segal, 2000: Sensitivity of forecast rainfall in Texas convective systems to soil moisture and convective parameterizations. Weather and Forecasting, 15, 509-525.
Hoffman, R.N., 2004: Controlling Hurricanes. Scientific American, 291(4), 68-75, October 2004. Holt, T. R., D. Niyogi, F. Chen, K. Manning, M. A. LeMone, and A. Qureshi, 2006: Effect of
Land–Atmosphere Interactions on the IHOP 24–25 May 2002 Convection Case. Monthly Weather Review, 134(1), 113-133.
Hsu, C. S., W. T. Liu, and M. G. Wurtele, 1997: Impact of scatterometer winds on hydrologic forcing and convective heating through surface divergence. Monthly Weather Review, 125(7), 1556-1576.
Kerr, Y.H., P. Waldteufel, J.-P. Wigneron, J.-M. Martinuzzi, J. Font, and M. Berger, 2001: Soil moisture retrieval from space: the Soil Moisture and Ocean Salinity (SMOS) mission. IEEE Transactions on Geoscience and Remote Sensing, 39, 1729-1735.
Kimball, J. S., K. C. McDonald, A. R. Keyser, S. Frolking, and S. W. Running, 2001: Application of the NASA Scatterometer (NSCAT) for determining the daily frozen and non-frozen landscape of Alaska, Remote Sensing of the Environment, 75, 113-126.
Kimball, J.S., K.C. McDonald, S.W. Running, and S. Frolking, 2004: Satellite radar remote sensing of seasonal growing seasons for boreal and subalpine evergreen forests. Remote Sensing of Environment, 90, 243-258.
Koster, R.D., P.A. Dirmeyer, Z. Guo, G. Bonan, E. Chan, P. Cox, C.T. Gordon, S. Kanae, E. Kowalczyk, D. Lawrence, P. Liu, C.-H. Lu, S. Malyshev, B. McAvaney, K. Mitchell, D. Mocko, T. Oki, K. Oleson, A. Pitman, Y.C. Sud, C.M. Taylor, D. Verseghy, R. Vasic, Y. Xue, and T. Yamada, 2004: Regions of strong coupling between soil moisture and precipitation. Science, 305, 1138-1140.
Kumar, S. V., C.D. Peters-Lidard, Y. Tian, P.R. Houser, J. Geiger, S. Olden, L. Lighty, J.L. Eastman, B. Doty, P. Dirmeyer, J. Adams, K. Mitchell, E.F. Wood, and J. Sheffield, 2006: Land information system: An interoperable framework for high resolution land surface modeling. Environmental Modeling and Software, 21(10), 1402-1415.
50
Liu, W. T., Hua Hu, and S. Yueh, 2000: Quikscat and TRMM reveal the interplay between dynamic and hydrologic parameters in Hurricane Floyd. EOS Trans., American Geophysical Union, 81(23), 253-257.
Mason, G. L., G. McWilliams, L. S. Bunch, and S. Greig, 2002: National Polar-orbiting Operational Environmental Satellite System (NPOESS) products for evaluation of mobility. 14th International Conference of the International Society for Terrain-Vehicle Systems, Vicksburg, MS, USA October 20 – 24, 2002.
McDonald, K.C, and J.S. Kimball, 2005: Hydrological application of remote sensing: Freeze-thaw states using both active and passive microwave sensors. Encyclopedia of Hydrological Sciences. Part 5. Remote Sensing. M.G. Anderson and J.J. McDonnell (Eds.), John Wiley & Sons Ltd., doi: 10.1002/0470848944.hsa059a.
Mitchell, K.E., D. Lohmann, P.R. Houser, E.F. Wood, J.C. Schaake, A. Robock, B.A. Cosgrove, J. Sheffield, Q. Duan, L. Luo, R.W. Higgins, R.T. Pinker, J.D. Tarpley, D.P. Lettenmaier, C.H. Marshall, J.K. Entin, M. Pan, W. Shi, V. Koren, J. Meng, B.H. Ramsay, and A.A. Bailey, 2004: The multi-institution North American Land Data Assimilation System (NLDAS): Utilizing multiple GCIP products and partners in a continental distributed hydrological modeling system. Journal of Geophyical Research, 109, D07590.
Nghiem, S.V., Y. Chao, E. Rodriguez, P.P. Li, G. Neumann, D.K. Perovich, J.W. Weatherly, P.Clemente-Colon, H. Eicken, A. Mahoney, 2005: Arctic sea ice and ocean monitoring with satellite scatterometer. Eos Transactions. AGU, 87(36), Ocean Sciences Meeting Supplement, Abstract OS11A-05.
Nghiem, S. V., Y. Chao, G. Neumann, P. Li, D. K. Perovich, T. Street, and P. Clemente-Colon, 2006: Depletion of perennial sea ice in the East Arctic Ocean. Geophysical Research Letters, 33, L17501, doi:10.1029/2006GL027198.
National Research Council (NRC), 2007: Earth Science and Applications from Space: National Imperatives for the Next Decade and Beyond, 400 pages.
National Research Council (NRC), 2001: Under the Weather: Climate, Ecosystems, and Infectious Disease, 160 pages.
NPOESS IPO, 2002: NPOESS Integrated Operational Requirements Document (IORD-II). Available online: http://eic.ipo.noaa.gov/IPOarchive/MAN/IORDII_011402.pdf
Pan, Z., E. Takle, M. Segal, and R. Turner, 1996: Influences of model parameterization schemes on the response of rainfall to soil moisture in the central United States. Monthly Weather Review, 124(8), 1786-1802.
Patz, J.A., K. Strzepek, S. Lele, M. Hedden, S. Greene, and B. Noden, 1998: Predicting key malaria transmission factors, biting and entomological inoculation rates, using modeled soil moisture in Kenya. Tropical Medicine and International Health, 3, 818–827.
Perovich, D.K., S.V. Nghiem, T. Markus, and A. Schweiger, 2007: Seasonal evolution and interannual variability of the solar energy absorbed by the Arctic sea ice-ocean system. Journal of Geophysical Research, 112, C03005, doi:10.1029/2006JC003558.
Reen, B.P., Stauffer, D.R., Davis, K.J. and Desai, A.R., 2006. A case study on the effects of heterogeneous soil moisture on mesoscale boundary layer structure in the southern Great Plains, USA. Part II: Mesoscale modeling. Boundary Layer Meteorology, doi:10.1007/s10546-006-9056-6.
Reichle, R. H., R.D. Koster, P. Liu, S. P.P. Mahanama, E.G. Njoku, and M. Owe, 2007: Comparison and assimilation of global soil moisture retrievals from the Advanced Microwave Scanning Radiometer for the Earth Observing System (AMSR-E) and the
51
Scanning Multichannel Microwave Radiometer (SMMR). Journal of Geophysical Research, 112, D09108, doi:10.1029/2006JD008033.
Rignot, E., and J. Way, 1994: Monitoring freeze/thaw cycles along north-south Alaskan transects using ERS-1 SAR. Remote Sensing of the Environment, 49, 131-137.
Rodell, M., P.R. Houser, U. Jambor, J. Gottschalck, K. Mitchell, C.-J. Meng, K. Arsenault, B. Cosgrove, J. Radakovich, M. Bosilovich, J.K. Entin, J. P. Walker, D. Lohmann, and D. Toll, 2004: The global land data assimilation system. Bulletin of the American Meteorological Society, 85, 381-394.
Running, S. W., J. B. Way, K. C. McDonald, J. S. Kimball, and S. Frolking, 1999: Radar remote sensing proposed for monitoring freeze/thaw transitions in boreal regions. Eos, 80(19), 213, 220-221.
Salvucci, G. D, 2001: Estimating the moisture dependence of root zone water loss using conditionally averaged precipitation. Water Resources Research, 37(5), 1357-1366.
Shaman, J. and J.F. Day, 2005: Achieving operational hydrologic monitoring of mosquito-borne disease. Emerging Infectious Diseases, 11(9), 1343-1350.
Ulaby, F.T, R.K. Moore, and A. K. Fung, 1986: Microwave Remote Sensing, Active and Passive. Vol III: From Theory to Applications. Artec House, Inc. Dedham, MA. 2162 pages.
Viterbo, P., and A.K. Betts, 1999: The impact of the ECMWF reanalysis soil water on forecasts of the July 1993 Mississippi Flood. Journal of Geophysical Research, 104(D16), 19,361-19,366.
Walker, J.P. and P.R. Houser, 2004: Requirements of a global near-surface soil moisture satellite mission: accuracy, repeat time, and spatial resolution. Advances in Water Resources, 27, 785-801.
Way, J.B., E.J.M. Rignot, K.C. McDonald, R. Oren, R. Kwok, G. Bonan, M.C. Dobson, L.A. Viereck, and J.E. Roth, 1994: Evaluating the type and state of Alaska taiga forests with imaging radar for use in ecosystem models. IEEE Transactions on Geoscience and Remote Sensing, 32(2), 353-370.
Way, J. B., R. Zimmermann, E. Rignot, K. McDonald and R. Oren, 1997: Winter and spring thaw as observed with imaging radar at BOREAS. Journal of Geophysical Research, 102(D24), 29673-29684.
Weatherly, J. W., D.K. Perovich, and S.V. Nghiem, 2005: Variability in the Arctic sea ice melt season. J6.7, Proceedings of the 16th Conference on Climate Variability and Change and 8th Conference on Polar Meteorology and Oceanography, 85th Amer. Meteo. Soc. Meeting, San Diego.
Western Governors’ Association (WGA), 2004: Creating a Drought Early Warning System for the 21st Century: The National Integrated Drought Information System, 16 pages.
Yang, F., A. Kumar, and K.M. Lau, 2004: Potential predictability of U.S. summer climate with “perfect” soil moisture. Journal of Hydrometeorology, 5, 883–895.
Ziegler, C. L., W.J. Martin, R.A. Pielke, and R. Walko, 1994: A modeling study of the dryline. Journal of Atmospheric Sciences, 62, 263-285.
52
Appendix A. Acronyms
2DSTAR – Two-dimensional Synthetic Thinned Array Radiometer
A/D – Analog to Digital
ACS – Attitude Control Subsystem
AFWA – Air Force Weather Agency
AGRMET – Agricultural Meteorology (modeling system)
AIRSAR – Airborne Synthetic Aperture Radar
ALOS – Advanced Land Observing Satellite
AO – Announcement of Opportunity
APMIR – Airborne Polarimetric Microwave Imaging Radiometer
ARM CART – Atmospheric Radiation Measurement - Clouds and Radiation Testbed
ASCAT – Advanced Scatterometer
ATBD – Algorithm Theoretical Basis Document
CLASIC – Cloud and Land Surface Interaction Campaign
CMAP – Center Merged Analysis Precipitation
COAMPS - Coupled Ocean/Atmosphere Mesoscale Prediction System
CSA – Canadian Space Agency
CUASHI – Consortium of Universities for the Advancement of Hydrological Science, Inc.
DAAC - Distributed Active Archive Center
DEM – Digital Elevation Model
DoD – Department of Defense
DOE – Department of Energy
ECMWF – European Center for Medium-Range Weather Forecast
EMIRAD – Electromagnetic Institute Radiometer
53

EnKF – Ensemble Kalman Filter
ENSO – El Niño Southern Oscillation
ESSP – Earth System Science Pathfinder
ESTAR – Electronically Scanned Thinned Array Radiometer
FCS – Future Combat System
FEM – Finite Element Model
FFG – Flash-Flood Guidance
FIFE – First ISLSCP (International Satellite Land Surface Climatology Project) Field Experiment
FPGA – Field Programmable Gate Array
GCOM – Global Change Observation Mission
GED – Global Ecosystems Database
GMAO – Global Modeling and Assimilation Office
GMI – GPM Microwave Imager
GPM – Global Precipitation Measurement
GSFC – Goddard Space Flight Center
HAPEX - Hydrology-Atmosphere Pilot Experiment
HW - Hardware
Hydros – Hydrosphere State (Mission)
IIP – Instrument Incubator Program
IPO – Integrated Program Office
ITT – ITT Corporation
JERS-1 - Japanese Earth Resources Satellite
JPL – Jet Propulsion Laboratory
KPP – Key Performance Parameter
LST – Land Surface Temperature
MacHydro – Multisensor Aircraft Campaign Hydrology
54

MIT – Massachusetts Institute of Technology
MLI – Multi-layer Insulation
MODIS – Moderate Resolution Imaging Spectrometer
MW – Microwave
NAFE – National Airborne Field Experiment
NASA – National Aeronautics and Space Administration
NCEP – National Centers for Environmental Prediction
NEON – National Ecological Observatory Network
NGA – National Geospatial-Intelligence Agency
NGDC – National Geophysical Data Center
NGST – Northrop Grumman Space Technology
NIDIS - National Integrated Drought Information System
NOAA – National Oceanic and Atmospheric Administration
NPOESS – National Polar-Orbiting Operational Environmental Satellite System
NRC – National Research Council
NRL – Naval Research Laboratory
OSSE – Observing System Simulation Experiments
PALS – Passive and Active L-band System
PALSAR – Phased Array type L-band Synthetic Aperture Radar
PECAD – Production Estimate and Crop Assessment Division
PBMR – Pushbroom Microwave Radiometer
PLMR – Polarimetric L-band Multibeam Radiometer
PSR – Polarimetric Scanning Radiometer
RF – Radio Frequency
RFI – Radio Frequency Interference
55
SAR – Synthetic Aperture Radar
SGP – Southern Great Plains
SIR-C – Spaceborne Imaging Radar
SMAP – Soil Moisture Active/Passive
SMEX – Soil Moisture Experiment
SMOS – Soil Moisture and Ocean Salinity
SOGS – SMOS Satellite Operations and Ground System
SRTM – Shuttle Radar Topography Mission
SSMI – Special Sensor Microwave Imager
STATSGO – State Soil Geographic database
STP – Space Test Program
TBD – To Be Determined
UAV – Unmanned Aerial Vehicle
UCSB – University of California Santa Barbara
USGS – United States Geological Survey
VIIRS – Visible/Infrared Imager/Radiometer Suite
VISIR – Visible Infrared
WMO – World Meteorological Organization
56
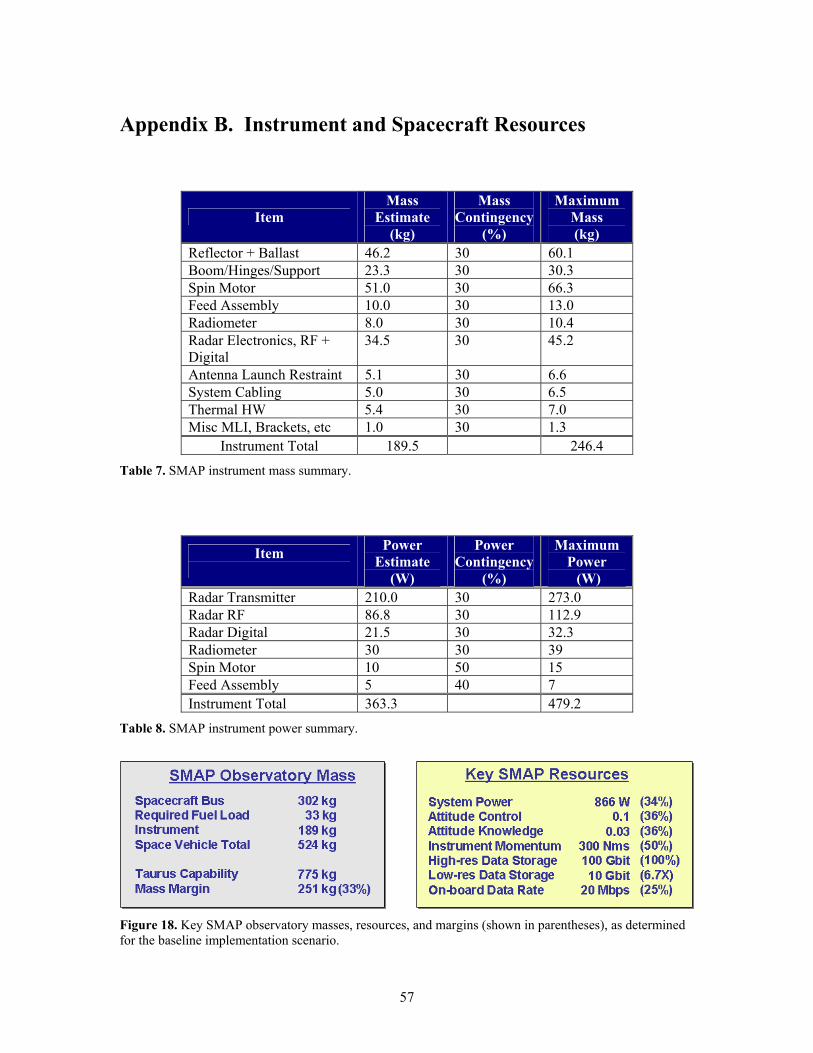
Appendix B. Instrument and Spacecraft Resources
Item Mass
Estimate (kg)
Mass Contingency
(%)
Maximum Mass (kg)
Reflector + Ballast 46.2 30 60.1 Boom/Hinges/Support 23.3 30 30.3 Spin Motor 51.0 30 66.3 Feed Assembly 10.0 30 13.0 Radiometer 8.0 30 10.4 Radar Electronics, RF + Digital
34.5 30 45.2
Antenna Launch Restraint 5.1 30 6.6 System Cabling 5.0 30 6.5 Thermal HW 5.4 30 7.0 Misc MLI, Brackets, etc 1.0 30 1.3
Instrument Total 189.5 246.4
Table 7. SMAP instrument mass summary.
Item Power
Estimate (W)
Power Contingency
(%)
Maximum Power
(W) Radar Transmitter 210.0 30 273.0 Radar RF 86.8 30 112.9 Radar Digital 21.5 30 32.3 Radiometer 30 30 39 Spin Motor 10 50 15 Feed Assembly 5 40 7 Instrument Total 363.3 479.2
Table 8. SMAP instrument power summary.
Figure 18. Key SMAP observatory masses, resources, and margins (shown in parentheses), as determined for the baseline implementation scenario.
57