Embed Size (px)
Citation preview
INTRODUCTION
Salinity is common environmental factor that adversely affect
plant growth and crop production in cultivated areas
worldwide (Singh et al., 2011; Day et al. 2015). Soil salinity
is a major factor for decreasing crop growth and yield due to
osmotic stress (Koksal et al., 2016; ; Sherani et al., 2017;
Wahid et al. 2017) followed by ion toxicity (Rahnama et al.,
2010; James et al., 2011; Akram et al., 2017), hence it may
cause ionic imbalance in plants and changes in nutrient
bioavailability in soil.
Phosphorus deficiency in arable land limits 30-40% of crop
productivity (Vance et al., 2003) and is prevalent in
calcareous soils and arid climates simultaneously with salinity
problem. As salt stress influences the soil condition i.e. EC,
SAR, pH, structure, aeration etc., hence may affect P
availability. Moreover, continued and high rate of application
of P fertilizers could lead to accumulation and transformation
of available soil P fractions into unavailable ones (Lai et al.,
2003). This effect of P application varies with soil type and
climate as well as the amount of P applied (Zhang et al.,
2004).
Phosphorus is present in soils in various forms and the
knowledge of different geochemical fractions of P in soil is
important for determining long term P availability in soil.
Sequential extraction techniques has been widely used for
predicting P bioavailability, leachability and transformations
of different chemical forms in agricultural and polluted soils
(Sui et al., 1999). The inter-relationships among the various
P fractions in various soils are complex. Upon application of
organic and inorganic P sources, the various fractions of P
could be dissolved and form secondary complexes (Hua et al.,
2016). Hence, knowledge about these fractions may increase
our understanding for an efficient P management program.
Salt-affected soils offer more restrictions for P bioavailability
than normal soils (Qadir et al., 2005). It is needed to elucidate
the redistribution of various soil P fractions with different P
application rates that has not been widely studied (Murtaza et
al., 2015). Moreover, the changes in P fractions in salt
affected soils have not been studied widely, particularly in
Pakistan. Sorption of P by soil colloids is the principal factor
influencing plant availability of P mineralized from crop
residues (Jalali and Ranjbar, 2010). In salt-affected soils, P is
one of the major limiting nutrients which often have high
Pak. J. Agri. Sci., Vol. 56(2), 301-312; 2019
ISSN (Print) 0552-9034, ISSN (Online) 2076-0906
DOI: 10.21162/PAKJAS/19.8083
http://www.pakjas.com.pk
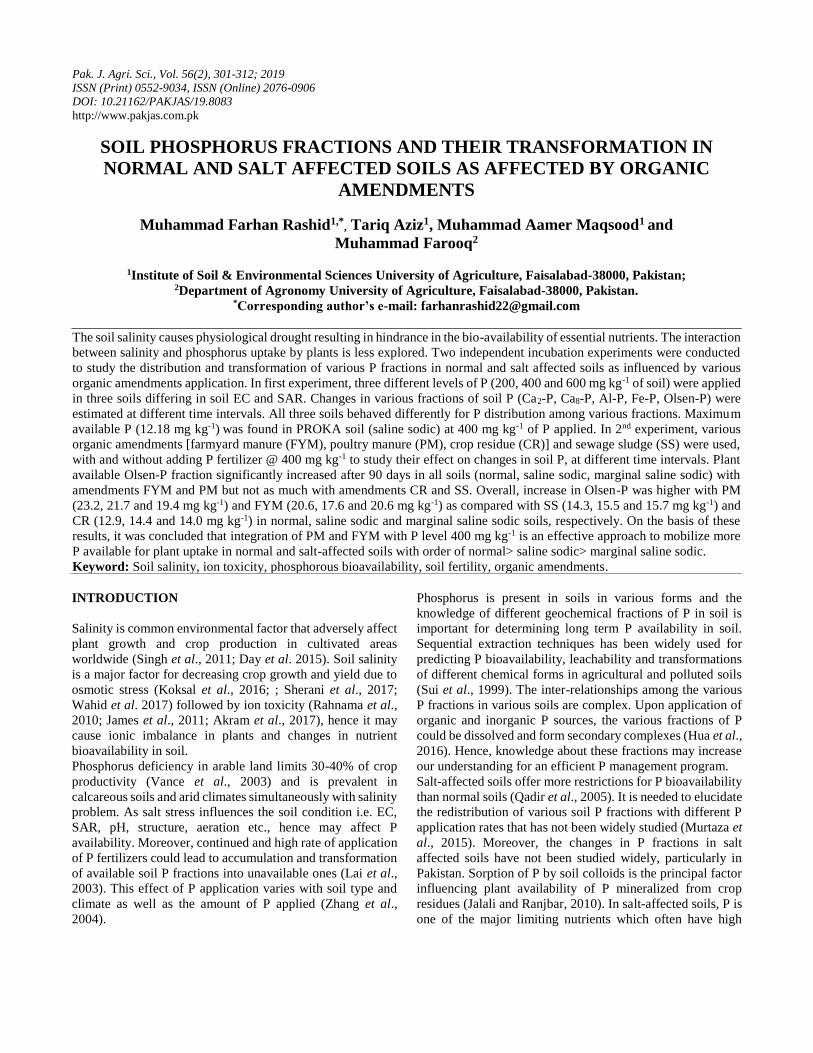
SOIL PHOSPHORUS FRACTIONS AND THEIR TRANSFORMATION IN
NORMAL AND SALT AFFECTED SOILS AS AFFECTED BY ORGANIC
AMENDMENTS
Muhammad Farhan Rashid1,*, Tariq Aziz1, Muhammad Aamer Maqsood1 and
Muhammad Farooq2
1Institute of Soil & Environmental Sciences University of Agriculture, Faisalabad-38000, Pakistan;
2Department of Agronomy University of Agriculture, Faisalabad-38000, Pakistan. *Corresponding author’s e-mail: [email protected]
The soil salinity causes physiological drought resulting in hindrance in the bio-availability of essential nutrients. The interaction
between salinity and phosphorus uptake by plants is less explored. Two independent incubation experiments were conducted
to study the distribution and transformation of various P fractions in normal and salt affected soils as influenced by various
organic amendments application. In first experiment, three different levels of P (200, 400 and 600 mg kg-1 of soil) were applied
in three soils differing in soil EC and SAR. Changes in various fractions of soil P (Ca2-P, Ca8-P, Al-P, Fe-P, Olsen-P) were
estimated at different time intervals. All three soils behaved differently for P distribution among various fractions. Maximum
available P (12.18 mg kg-1) was found in PROKA soil (saline sodic) at 400 mg kg-1 of P applied. In 2nd experiment, various
organic amendments [farmyard manure (FYM), poultry manure (PM), crop residue (CR)] and sewage sludge (SS) were used,
with and without adding P fertilizer @ 400 mg kg-1 to study their effect on changes in soil P, at different time intervals. Plant
available Olsen-P fraction significantly increased after 90 days in all soils (normal, saline sodic, marginal saline sodic) with
amendments FYM and PM but not as much with amendments CR and SS. Overall, increase in Olsen-P was higher with PM
(23.2, 21.7 and 19.4 mg kg-1) and FYM (20.6, 17.6 and 20.6 mg kg-1) as compared with SS (14.3, 15.5 and 15.7 mg kg-1) and
CR (12.9, 14.4 and 14.0 mg kg-1) in normal, saline sodic and marginal saline sodic soils, respectively. On the basis of these
results, it was concluded that integration of PM and FYM with P level 400 mg kg-1 is an effective approach to mobilize more
P available for plant uptake in normal and salt-affected soils with order of normal> saline sodic> marginal saline sodic.
Keyword: Soil salinity, ion toxicity, phosphorous bioavailability, soil fertility, organic amendments.
Rashid, Aziz, Maqsood & Farooq
302
fixing capacity and precipitation reactions with Ca, Al and Fe
oxides, thus transferring into relatively insoluble complexes
(Lai et al., 2003). The P use efficiency in such soils is about
10–15% and can be improved after adding organic
amendments (Tisdale et al. 2012; Sharma et al., 2002).
Calcium phosphate (Ca-P) is the most dominant P fraction in
saline or saline-sodic soils (Meena et al., 2018). In saline
sodic soil, integration of organic amendments, e.g. poultry
manure, crop residue and farmyard manure have shown
increase in reclamation efficiency and availability of nutrients
especially P for plant nutrition (Choudhary et al., 2007; Rawat
et al., 2013; Meena et al., 2018).
The remediation of such soils using organic amendments
(FYM, PM, CR SS) is promising and has shifted the attention
from sole use of chemical fertilizers (Maillard and Angers,
2014). The physico-chemical and biological properties of salt
affected soils could be improved by the application of
chemical and organic fertilizers for sustainable crop
productivity (Ghafoor et al., 2004; Wong et al., 2009).
Fertilization practices combined with organic amendments
could not only sustain but can increase crop yield and soil
fertility (Maillard and Angers, 2014). However, the responses
of soil P availability and P accumulation are variable under
different organic amendments.
The re-distribution of the different P fractions and soil P
availability could be enhanced by organic amendments
(Debicka et al., 2016). However, the transformations of P
forms in soils amended with FYM, PM, CR and sewage
sludge (SS) are not clear, limiting effective P management
practices in the agricultural systems (Audette et al., 2016)
particularly in salt affected soils.
Specific objective of this study was to determine different P
fractions in normal and salt affected soils and their re-
distribution over time with different rates of P fertilizer
application and to determine integrated effect of organic and
inorganic amendments on P availability in three soils
differing in salinity/sodicity stress.
MATERIALS AND METHODS
Two independent studies were conducted in the wire house of
the Institute of Soil and Environmental Sciences (ISES),
University of Agriculture (UAF) Faisalabad (latitude
31.4181, longitude 73.0778), Pakistan. Soil used in
experiment was collected from three different sites differing
in salinity stress, 1) field area of ISES, UAF, 2) PROKA farm,
UAF. Faisalabad, 3) Postgraduate Agriculture Research
Station (PARS), UAF. Faisalabad, Pakistan. Before
conducting experiments, soil was air dried and analyzed for
physico-chemical properties after removing pieces of stone
and straw passing through a 2-mm sieve. The physico-
chemical properties of soils are given in Table 1 and P
fractionation of original soil samples are given in Table 2.
Quantitative measurement of various P fractions was done
following Jiang and Gu (1989). Briefly, Ca2-P was extracted
by NaHCO3, Ca8-P was extracted by NH4-acetate treatment,
the 0.5 N NH4-F treatments extracts aluminum phosphate (Al-
P) and the NaOH–Na2CO3 solution mixture extracts iron
phosphate (Fe-P).
For 1st experiment, each experimental pot was filled with 3 kg
soil of each soil type. Three rates of P (200, 400 and 600 mg
kg-1) were employed using di-ammonium phosphate (DAP)
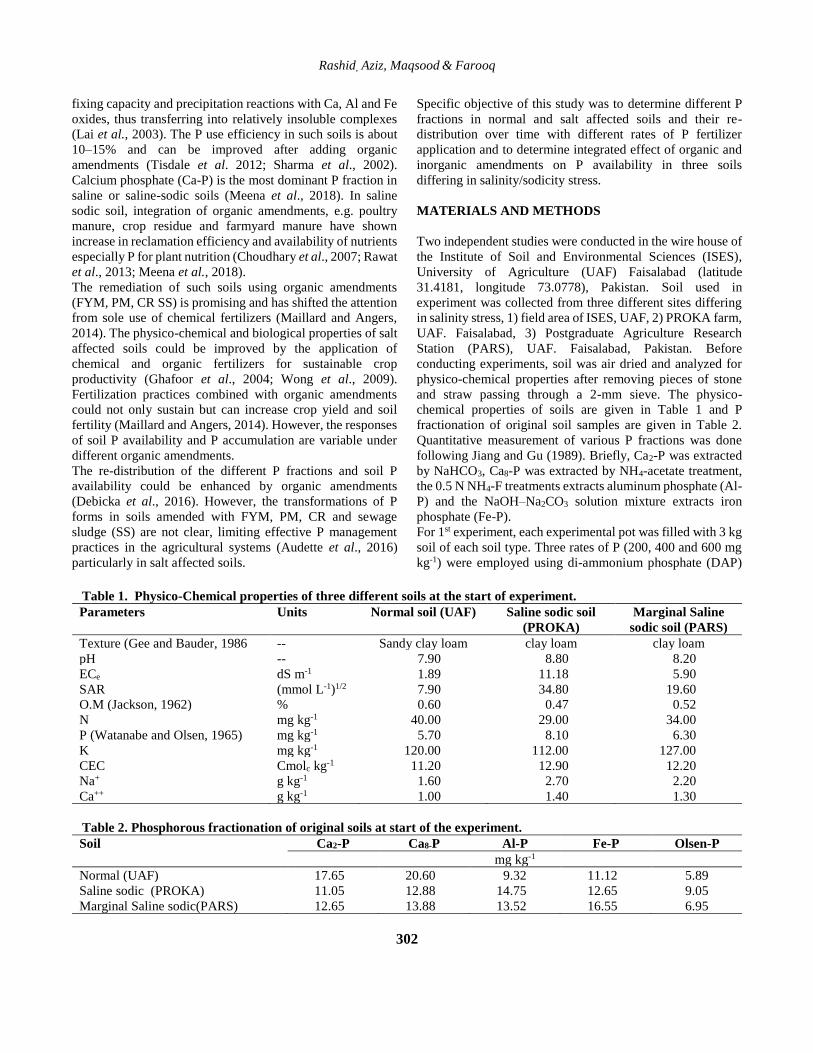
Table 1. Physico-Chemical properties of three different soils at the start of experiment.
Parameters Units Normal soil (UAF) Saline sodic soil
(PROKA)
Marginal Saline
sodic soil (PARS)
Texture (Gee and Bauder, 1986 -- Sandy clay loam clay loam clay loam
pH -- 7.90 8.80 8.20
ECe dS m-1 1.89 11.18 5.90
SAR (mmol L-1)1/2 7.90 34.80 19.60
O.M (Jackson, 1962) % 0.60 0.47 0.52
N mg kg-1 40.00 29.00 34.00
P (Watanabe and Olsen, 1965) mg kg-1 5.70 8.10 6.30
K mg kg-1 120.00 112.00 127.00
CEC Cmolc kg-1 11.20 12.90 12.20
Na+ g kg-1 1.60 2.70 2.20
Ca++ g kg-1 1.00 1.40 1.30
Table 2. Phosphorous fractionation of original soils at start of the experiment.
Soil Ca2-P Ca8-P Al-P Fe-P Olsen-P
mg kg-1
Normal (UAF) 17.65 20.60 9.32 11.12 5.89
Saline sodic (PROKA) 11.05 12.88 14.75 12.65 9.05
Marginal Saline sodic(PARS) 12.65 13.88 13.52 16.55 6.95
Phosphorus fractions and their transformation in soil
303
as P fertilizer source. Samples were placed at room
temperature by using CRD design. Different fractions of P
i.e., (Ca2-P, Ca8-P, Fe-P, Al-P and Olsen-P) were determined
after 0, 5, 10, 15, 30, 60 and 90 days.
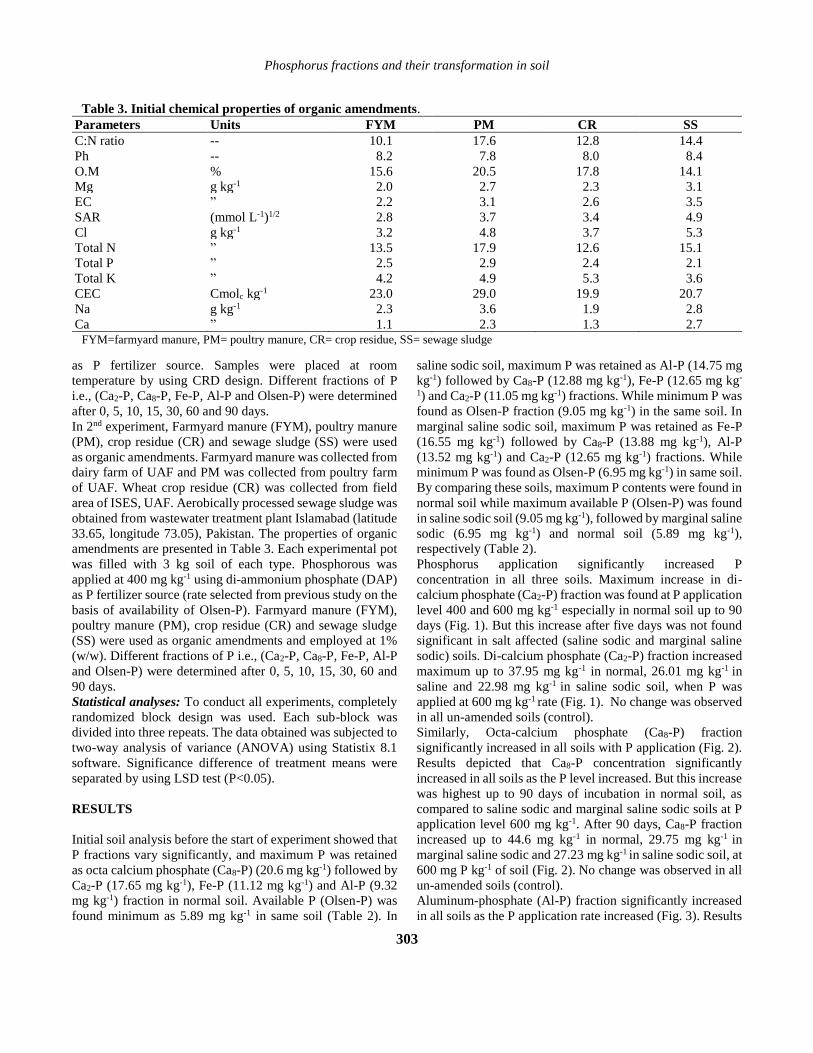
In 2nd experiment, Farmyard manure (FYM), poultry manure
(PM), crop residue (CR) and sewage sludge (SS) were used
as organic amendments. Farmyard manure was collected from
dairy farm of UAF and PM was collected from poultry farm
of UAF. Wheat crop residue (CR) was collected from field
area of ISES, UAF. Aerobically processed sewage sludge was
obtained from wastewater treatment plant Islamabad (latitude
33.65, longitude 73.05), Pakistan. The properties of organic
amendments are presented in Table 3. Each experimental pot
was filled with 3 kg soil of each type. Phosphorous was
applied at 400 mg kg-1 using di-ammonium phosphate (DAP)
as P fertilizer source (rate selected from previous study on the
basis of availability of Olsen-P). Farmyard manure (FYM),
poultry manure (PM), crop residue (CR) and sewage sludge
(SS) were used as organic amendments and employed at 1%
(w/w). Different fractions of P i.e., (Ca2-P, Ca8-P, Fe-P, Al-P
and Olsen-P) were determined after 0, 5, 10, 15, 30, 60 and
90 days.
Statistical analyses: To conduct all experiments, completely
randomized block design was used. Each sub-block was
divided into three repeats. The data obtained was subjected to
two-way analysis of variance (ANOVA) using Statistix 8.1
software. Significance difference of treatment means were
separated by using LSD test (P<0.05).
RESULTS
Initial soil analysis before the start of experiment showed that
P fractions vary significantly, and maximum P was retained
as octa calcium phosphate (Ca8-P) (20.6 mg kg-1) followed by
Ca2-P (17.65 mg kg-1), Fe-P (11.12 mg kg-1) and Al-P (9.32
mg kg-1) fraction in normal soil. Available P (Olsen-P) was
found minimum as 5.89 mg kg-1 in same soil (Table 2). In
saline sodic soil, maximum P was retained as Al-P (14.75 mg
kg-1) followed by Ca8-P (12.88 mg kg-1), Fe-P (12.65 mg kg-
1) and Ca2-P (11.05 mg kg-1) fractions. While minimum P was
found as Olsen-P fraction (9.05 mg kg-1) in the same soil. In
marginal saline sodic soil, maximum P was retained as Fe-P
(16.55 mg kg-1) followed by Ca8-P (13.88 mg kg-1), Al-P
(13.52 mg kg-1) and Ca2-P (12.65 mg kg-1) fractions. While
minimum P was found as Olsen-P (6.95 mg kg-1) in same soil.
By comparing these soils, maximum P contents were found in
normal soil while maximum available P (Olsen-P) was found
in saline sodic soil (9.05 mg kg-1), followed by marginal saline
sodic (6.95 mg kg-1) and normal soil (5.89 mg kg-1),
respectively (Table 2).
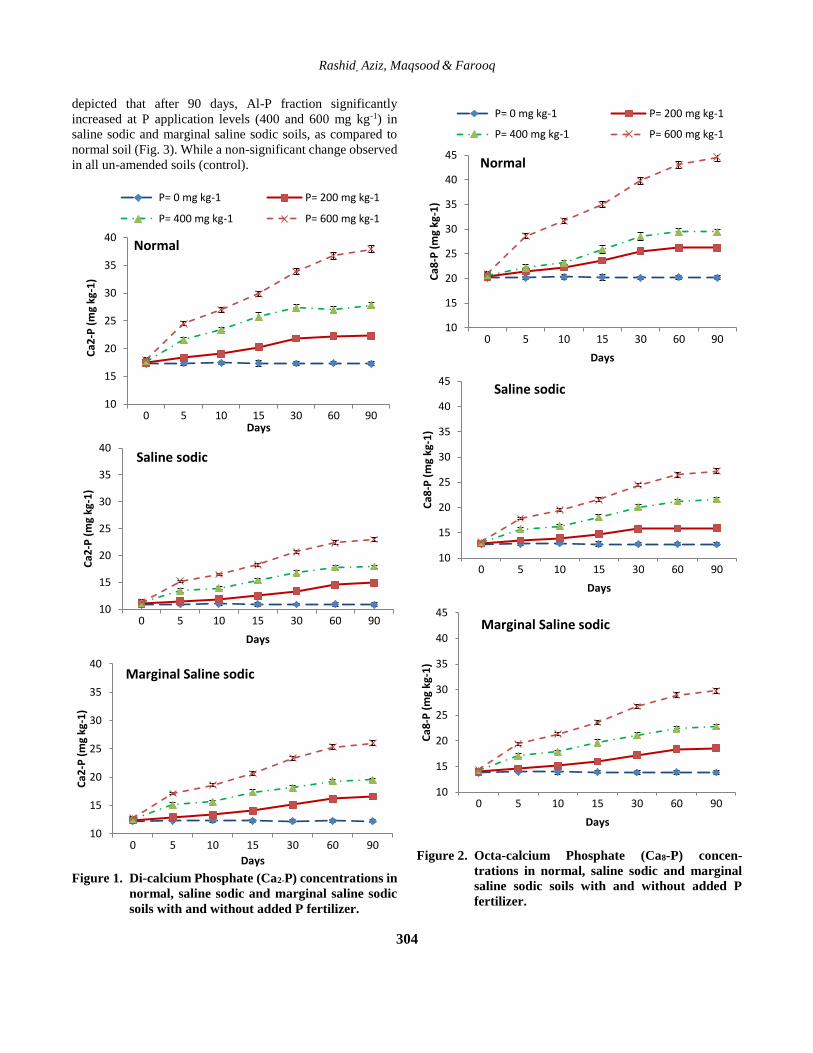
Phosphorus application significantly increased P
concentration in all three soils. Maximum increase in di-
calcium phosphate (Ca2-P) fraction was found at P application
level 400 and 600 mg kg-1 especially in normal soil up to 90
days (Fig. 1). But this increase after five days was not found
significant in salt affected (saline sodic and marginal saline
sodic) soils. Di-calcium phosphate (Ca2-P) fraction increased
maximum up to 37.95 mg kg-1 in normal, 26.01 mg kg-1 in
saline and 22.98 mg kg-1 in saline sodic soil, when P was
applied at 600 mg kg-1 rate (Fig. 1). No change was observed
in all un-amended soils (control).
Similarly, Octa-calcium phosphate (Ca8-P) fraction
significantly increased in all soils with P application (Fig. 2).
Results depicted that Ca8-P concentration significantly
increased in all soils as the P level increased. But this increase
was highest up to 90 days of incubation in normal soil, as
compared to saline sodic and marginal saline sodic soils at P
application level 600 mg kg-1. After 90 days, Ca8-P fraction
increased up to 44.6 mg kg-1 in normal, 29.75 mg kg-1 in
marginal saline sodic and 27.23 mg kg-1 in saline sodic soil, at
600 mg P kg-1 of soil (Fig. 2). No change was observed in all
un-amended soils (control).
Aluminum-phosphate (Al-P) fraction significantly increased
in all soils as the P application rate increased (Fig. 3). Results
Table 3. Initial chemical properties of organic amendments.
Parameters Units FYM PM CR SS
C:N ratio -- 10.1 17.6 12.8 14.4
Ph -- 8.2 7.8 8.0 8.4
O.M % 15.6 20.5 17.8 14.1
Mg g kg-1 2.0 2.7 2.3 3.1
EC ” 2.2 3.1 2.6 3.5
SAR (mmol L-1)1/2 2.8 3.7 3.4 4.9
Cl g kg-1 3.2 4.8 3.7 5.3
Total N ” 13.5 17.9 12.6 15.1
Total P ” 2.5 2.9 2.4 2.1
Total K ” 4.2 4.9 5.3 3.6
CEC Cmolc kg-1 23.0 29.0 19.9 20.7
Na g kg-1 2.3 3.6 1.9 2.8
Ca ” 1.1 2.3 1.3 2.7 FYM=farmyard manure, PM= poultry manure, CR= crop residue, SS= sewage sludge
Rashid, Aziz, Maqsood & Farooq
304
depicted that after 90 days, Al-P fraction significantly
increased at P application levels (400 and 600 mg kg-1) in
saline sodic and marginal saline sodic soils, as compared to
normal soil (Fig. 3). While a non-significant change observed
in all un-amended soils (control).
Figure 1. Di-calcium Phosphate (Ca2-P) concentrations in
normal, saline sodic and marginal saline sodic
soils with and without added P fertilizer.
Figure 2. Octa-calcium Phosphate (Ca8-P) concen-
trations in normal, saline sodic and marginal
saline sodic soils with and without added P
fertilizer.
10
15
20
25
30
35
40
0 5 10 15 30 60 90
Ca2
-P (
mg
kg-1
)
Days
P= 0 mg kg-1 P= 200 mg kg-1
P= 400 mg kg-1 P= 600 mg kg-1
Normal
10
15
20
25
30
35
40
0 5 10 15 30 60 90
Ca2
-P (
mg
kg-1
)
Days
Saline sodic
10
15
20
25
30
35
40
0 5 10 15 30 60 90
Ca2
-P (
mg
kg-1
)
Days
Marginal Saline sodic
10
15
20
25
30
35
40
45
0 5 10 15 30 60 90
Ca8
-P (
mg
kg-1
)
Days
P= 0 mg kg-1 P= 200 mg kg-1
P= 400 mg kg-1 P= 600 mg kg-1
Normal
10
15
20
25
30
35
40
45
0 5 10 15 30 60 90
Ca8
-P (
mg
kg-1
)
Days
Saline sodic
10
15
20
25
30
35
40
45
0 5 10 15 30 60 90
Ca8
-P (
mg
kg-1
)
Days
Marginal Saline sodic

Phosphorus fractions and their transformation in soil
305
Figure 3. Aluminum-Phosphate (Al-P) concentrations in
normal, saline sodic and marginal saline sodic
soils with and without added P fertilizer.
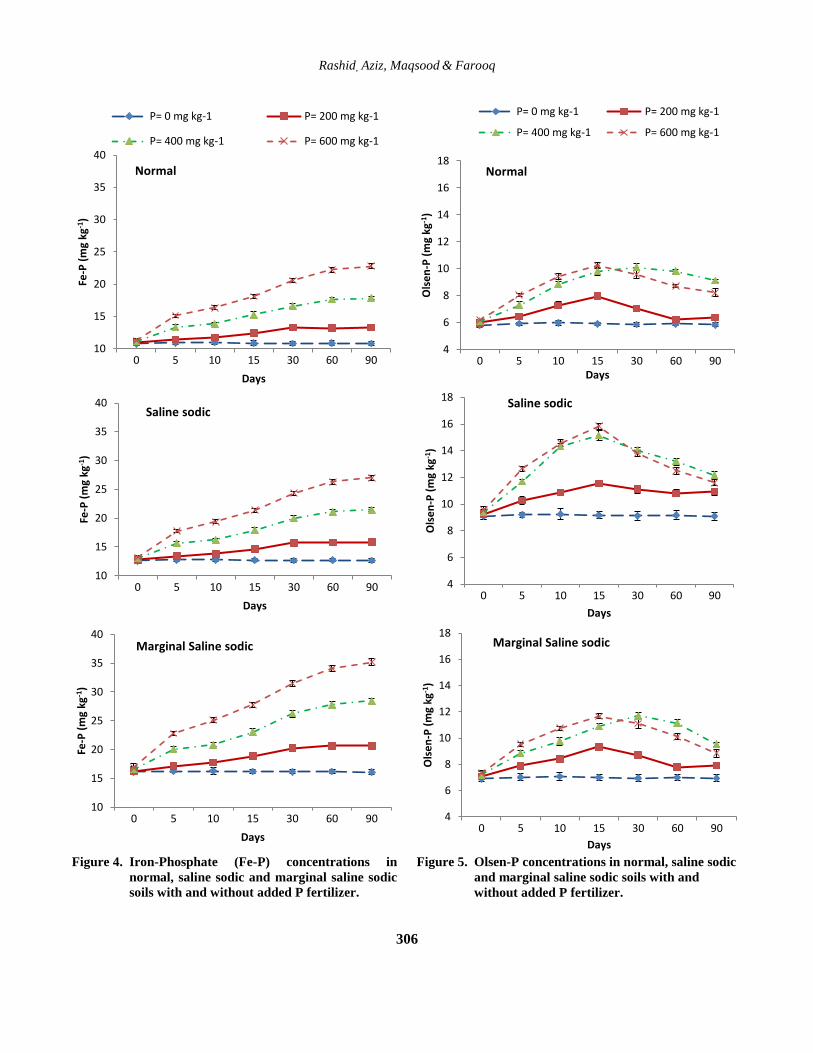
Similar trend was shown in iron phosphate (Fe-P) fraction. It
was significantly increased in all soils as the P application rate
increased (Fig. 4). Results depicted that for initial few days,
Al-P fraction significantly increased in all soils at P
application level (400 and 600 mg kg-1). But this increase was
found highest until 90 days in saline sodic and marginal saline
sodic soils, as compared to normal soil at P application level
600 mg kg-1 of soil. After 90 days, Fe-P fraction increased up
to 35.2 mg kg-1 in marginal saline sodic, 27.03 mg kg-1 in
saline sodic and 22.78 mg kg-1 in normal soil at application of
600 mg P kg-1 of soil (Fig. 4). While a non-significant change
observed in all un-amended soils (control).
On the contrary, Olsen-P fraction showed a different trend for
its availability in all soils, as time proceeded (Fig. 5). It
increased significantly for initial 15 days with P application
in all soils and its value started to decrease after 15 days at all
P application levels (200,400 and 600 mg kg-1 of soil). But its
value decreased slowly until 90 days at P application level 400
mg kg-1 of soil. In general, maximum Olsen-P was found
12.18 mg kg-1 in saline sodic soil, 9.23 mg kg-1 in marginal
saline sodic soil and 9.13 mg kg-1 in normal soil at P
application level 400 mg kg-1 of soil after 90 days (Fig. 5).
While distribution of Olsen P remained same in control (un-
amended soils). So this level of P application (400 mg kg-1)
was used in combination with organic amendments for next
study of 90 days.
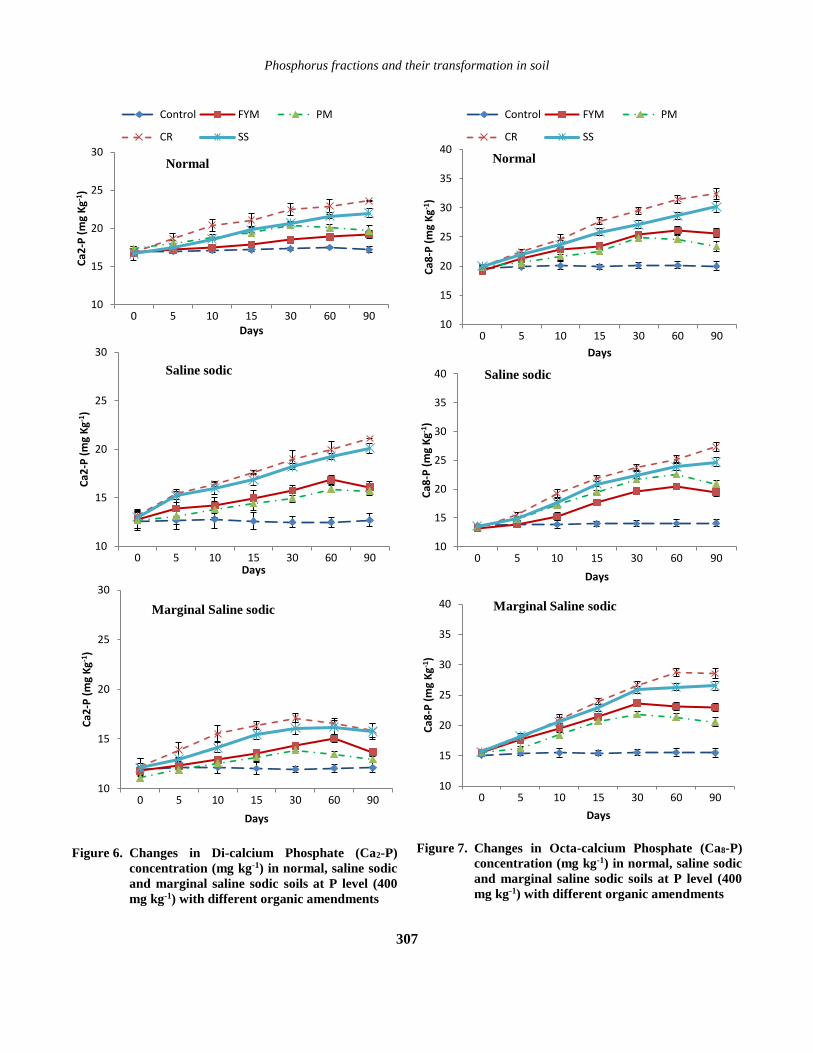
The results after 90 days showed that re-distribution of di-
calcium phosphate (Ca2-P) fraction significantly affected by
different organic amendments application at P application
level 400 mg kg-1 of soil (Fig. 6). Di-calcium phosphate (Ca2-
P) concentration increased linearly with time in normal soil
and highest increase (24.5 mg kg-1) was observed with
application of crop residue (CR). In saline sodic soil, Ca2-P
fraction was increased with sewage sludge amendment for
initial 5 days but afterwards its highest concentration (21.1
mg kg-1) was recorded with CR amendment. In marginal
saline sodic soil, change in Ca2-P concentration was found
variable with initial increase for 30 days. Later on, its
concentration decreased at the end of 90 days with application
of all amendments. In contrast, a non-significant change in
Ca2-P fraction was observed in all un-amended soils (control)
after 90 days.
Concentration of octa-calcium phosphate (Ca8-P) fraction
also differed significantly by different organic amendments at
P level 400 mg kg-1 of soil (Fig. 7). Octa-calcium phosphate
(Ca8-P) concentration was increased linearly with time and
highest increase was observed with CR amendment in normal
and saline sodic soil. Interestingly, its concentration increased
with amendments farm yard manure (FYM) and poultry
manure (PM) for initial 60 days of incubation and then
decreased in all soils. Same trend of Ca8-P distribution was
shown with amendment CR in marginal saline sodic soil. A
non-significant change in Ca8-P fraction was observed in all
un-amended soils.
5
10
15
20
25
30
35
0 5 10 15 30 60 90
Al-
P (
mg
kg-1
)
Days
P= 0 mg kg-1 P= 200 mg kg-1
P= 400 mg kg-1 P= 600 mg kg-1
Normal
5
10
15
20
25
30
35
0 5 10 15 30 60 90
Al-
P (
mg
kg-1
)
Days
Saline sodic
5
10
15
20
25
30
35
0 5 10 15 30 60 90
Al-
P (
mg
kg-1
)
Days
Marginal Saline sodic
Rashid, Aziz, Maqsood & Farooq
306
Figure 4. Iron-Phosphate (Fe-P) concentrations in
normal, saline sodic and marginal saline sodic
soils with and without added P fertilizer.
Figure 5. Olsen-P concentrations in normal, saline sodic
and marginal saline sodic soils with and
without added P fertilizer.
10
15
20
25
30
35
40
0 5 10 15 30 60 90
Fe-P
(m
g kg
-1)
Days
P= 0 mg kg-1 P= 200 mg kg-1
P= 400 mg kg-1 P= 600 mg kg-1
Normal
10
15
20
25
30
35
40
0 5 10 15 30 60 90
Fe-P
(m
g kg
-1)
Days
Saline sodic
10
15
20
25
30
35
40
0 5 10 15 30 60 90
Fe-P
(m
g kg
-1)
Days
Marginal Saline sodic
4
6
8
10
12
14
16
18
0 5 10 15 30 60 90
Ols
en
-P (
mg
kg-1
)
Days
P= 0 mg kg-1 P= 200 mg kg-1
P= 400 mg kg-1 P= 600 mg kg-1
Normal
4
6
8
10
12
14
16
18
0 5 10 15 30 60 90
Ols
en
-P (
mg
kg-1
)
Days
Saline sodic
4
6
8
10
12
14
16
18
0 5 10 15 30 60 90
Ols
en
-P (
mg
kg-1
)
Days
Marginal Saline sodic
Phosphorus fractions and their transformation in soil
307
Figure 6. Changes in Di-calcium Phosphate (Ca2-P)
concentration (mg kg-1) in normal, saline sodic
and marginal saline sodic soils at P level (400
mg kg-1) with different organic amendments
Figure 7. Changes in Octa-calcium Phosphate (Ca8-P)
concentration (mg kg-1) in normal, saline sodic
and marginal saline sodic soils at P level (400
mg kg-1) with different organic amendments
10
15
20
25
30
0 5 10 15 30 60 90
Ca2
-P (
mg
Kg-1
)
Days
Control FYM PM
CR SS
10
15
20
25
30
0 5 10 15 30 60 90
Ca2
-P (
mg
Kg-1
)
Days
10
15
20
25
30
0 5 10 15 30 60 90
Ca2
-P (
mg
Kg-1
)
Days
10
15
20
25
30
35
40
0 5 10 15 30 60 90
Ca8
-P (
mg
Kg-1
)
Days
Control FYM PM
CR SS
Normal
10
15
20
25
30
35
40
0 5 10 15 30 60 90
Ca8
-P (
mg
Kg-1
)
Days
Saline sodic
10
15
20
25
30
35
40
0 5 10 15 30 60 90
Ca8
-P (
mg
Kg-1
)
Days
Marginal Saline sodic
Normal
Saline sodic
Marginal Saline sodic
Rashid, Aziz, Maqsood & Farooq
308
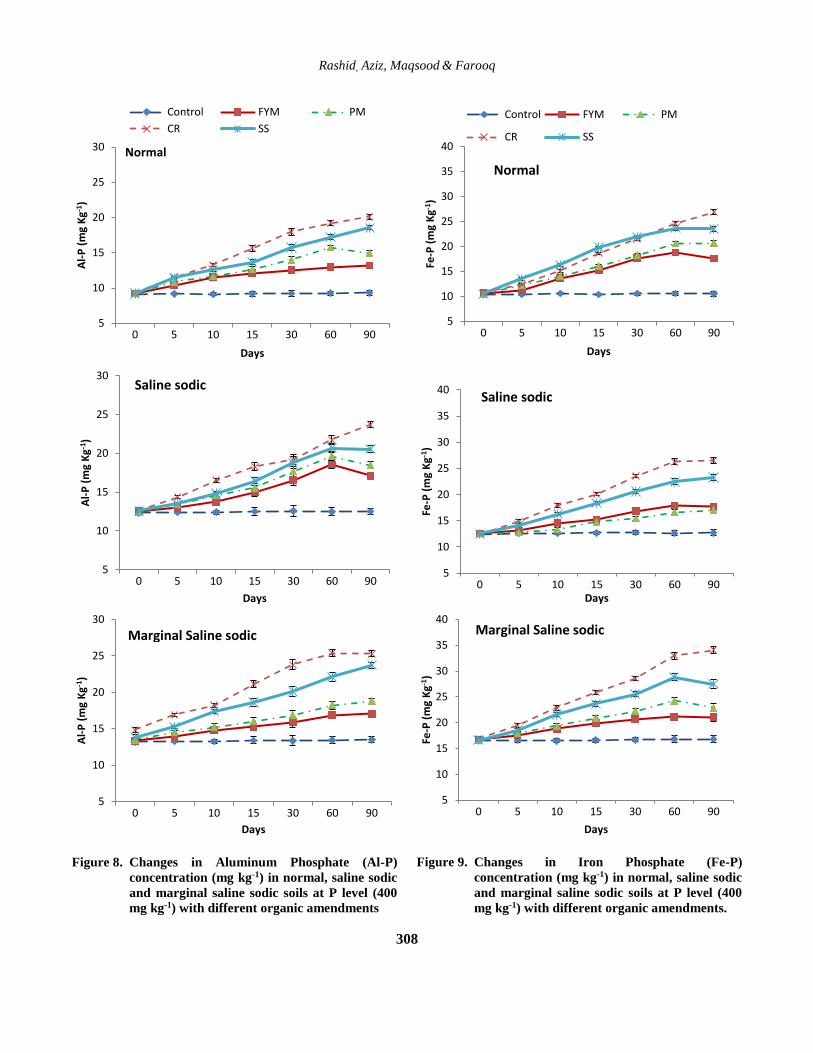
Figure 8. Changes in Aluminum Phosphate (Al-P)
concentration (mg kg-1) in normal, saline sodic
and marginal saline sodic soils at P level (400
mg kg-1) with different organic amendments
Figure 9. Changes in Iron Phosphate (Fe-P)
concentration (mg kg-1) in normal, saline sodic
and marginal saline sodic soils at P level (400
mg kg-1) with different organic amendments.
5
10
15
20
25
30
0 5 10 15 30 60 90
Al-
P (
mg
Kg-1
)
Days
Control FYM PM
CR SS
Normal
5
10
15
20
25
30
0 5 10 15 30 60 90
Al-
P (
mg
Kg-1
)
Days
Saline sodic
5
10
15
20
25
30
0 5 10 15 30 60 90
Al-
P (
mg
Kg-1
)
Days
Marginal Saline sodic
5
10
15
20
25
30
35
40
0 5 10 15 30 60 90
Fe-P
(m
g K
g-1)
Days
Control FYM PM
CR SS
Normal
5
10
15
20
25
30
35
40
0 5 10 15 30 60 90
Fe-P
(m
g K
g-1)
Days
Saline sodic
5
10
15
20
25
30
35
40
0 5 10 15 30 60 90
Fe-P
(m
g K
g-1)
Days
Marginal Saline sodic
Phosphorus fractions and their transformation in soil
309
In general, aluminum phosphate (Al-P) concentration
increased after 90 days but its distribution was different in all
soils with applied amendments. In normal soil, Al-P
concentration increased uniformly with all treatments for
initial 5 days. After that, its concentration increased linearly
with time and found highest with treatments CR and sewage
sludge (SS). While in case of saline sodic soil, Al-P
concentration increased up to 60 days and then decreased with
the application of all treatments except CR. With CR
application, Al-P concentration reached maximum (25 mg
kg-1), but then declined after 60 days. No change in Al-P
fraction was observed in all un-amended soils after 90 days
(Fig. 8).
In normal soil, Fe-P concentration increased up to 60 days and
then decreased in all treatments except CR with a maximum
value 26.6 mg kg-1. In case of saline sodic soil, all treatments
increased Fe-P concentration linearly with time. Marginal
saline sodic soil showed different response with increased Fe-
P concentration for 60 days and then decreased afterwards
with all treatments (Fig. 9).
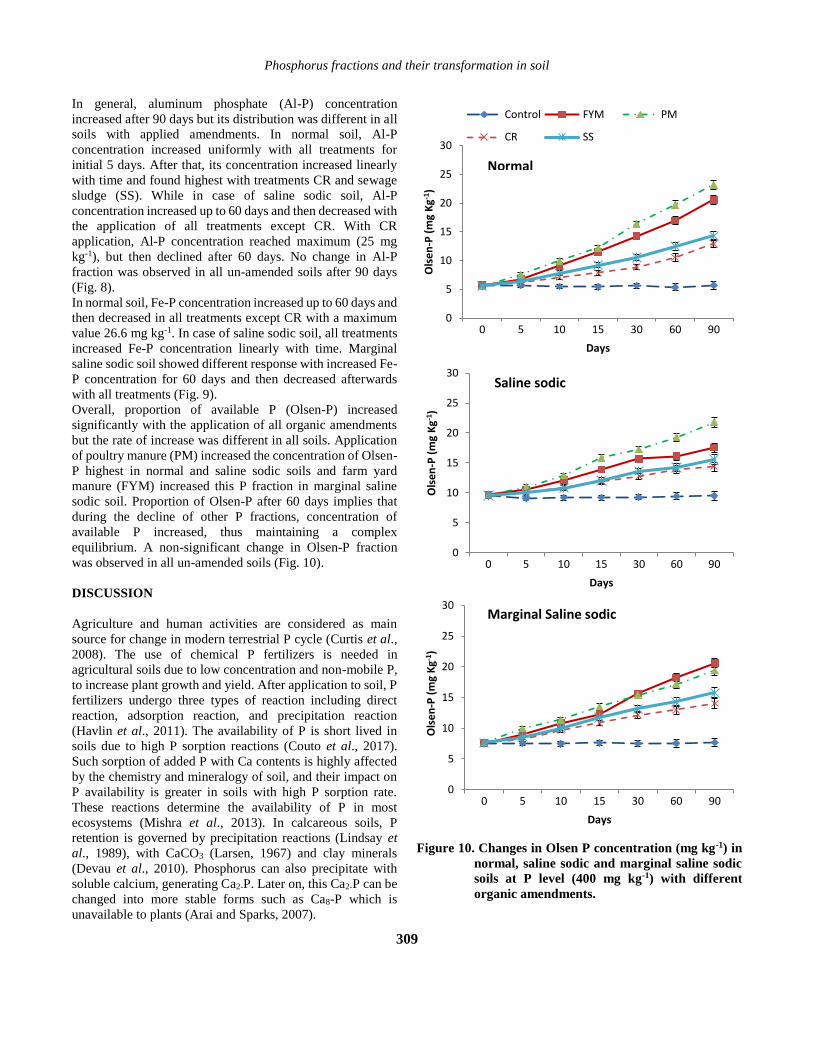
Overall, proportion of available P (Olsen-P) increased
significantly with the application of all organic amendments
but the rate of increase was different in all soils. Application
of poultry manure (PM) increased the concentration of Olsen-
P highest in normal and saline sodic soils and farm yard
manure (FYM) increased this P fraction in marginal saline
sodic soil. Proportion of Olsen-P after 60 days implies that
during the decline of other P fractions, concentration of
available P increased, thus maintaining a complex
equilibrium. A non-significant change in Olsen-P fraction
was observed in all un-amended soils (Fig. 10).
DISCUSSION
Agriculture and human activities are considered as main
source for change in modern terrestrial P cycle (Curtis et al.,
2008). The use of chemical P fertilizers is needed in
agricultural soils due to low concentration and non-mobile P,
to increase plant growth and yield. After application to soil, P
fertilizers undergo three types of reaction including direct
reaction, adsorption reaction, and precipitation reaction
(Havlin et al., 2011). The availability of P is short lived in
soils due to high P sorption reactions (Couto et al., 2017).
Such sorption of added P with Ca contents is highly affected
by the chemistry and mineralogy of soil, and their impact on
P availability is greater in soils with high P sorption rate.
These reactions determine the availability of P in most
ecosystems (Mishra et al., 2013). In calcareous soils, P
retention is governed by precipitation reactions (Lindsay et
al., 1989), with CaCO3 (Larsen, 1967) and clay minerals
(Devau et al., 2010). Phosphorus can also precipitate with
soluble calcium, generating Ca2-P. Later on, this Ca2-P can be
changed into more stable forms such as Ca8-P which is
unavailable to plants (Arai and Sparks, 2007).
Figure 10. Changes in Olsen P concentration (mg kg-1) in
normal, saline sodic and marginal saline sodic
soils at P level (400 mg kg-1) with different
organic amendments.
0
5
10
15
20
25
30
0 5 10 15 30 60 90
Ols
en
-P (
mg
Kg-1
)
Days
Control FYM PM
CR SS
Normal
0
5
10
15
20
25
30
0 5 10 15 30 60 90
Ols
en
-P (
mg
Kg-1
)
Days
Saline sodic
0
5
10
15
20
25
30
0 5 10 15 30 60 90
Ols
en
-P (
mg
Kg-1
)
Days
Marginal Saline sodic
Rashid, Aziz, Maqsood & Farooq
310
Jalali and Ranjbar (2010) reported that different P fractions
might differ remarkably in their bioavailability and chemical
behavior. Hence understanding of these transformations is
needed for proper management of P in calcareous and
problematic soils.
Application of P fertilizer and their combinations with
organic materials generally enhanced the amount of P
fractions in the form of Ca-P, Al-P and solid P significantly
(Singh et al., 2005). Park et al. (2004) reported that compost
significantly increased P fraction Ca-P in comparison to the
control (un-amended soil).
Initially, application of P at 400 and 600 mg kg-1 in normal
soil significantly increased Ca2-P, but rate of increase was
reduced later on after 5 days and remained almost similar till
15 days and both treatments differed significantly after 15
days as increase was very high in case of 600 mg kg-1. Similar
trend was also found by Ca8-P fraction in normal soil but its
rate of increase was higher as compared to Ca2-P at P
application level 600 mg kg-1. Maximum increase in Ca-P
fractions in normal soil as compared to saline sodic and
marginal saline sodic soils might be due to P fixation and
precipitation with CaCO3 and other soil colloids. Similar
results were also reported by Lai et al. (2003), that increased
P fertilizer application directly increased the proportion of
Ca2-P (1.1%-2.2%), Ca8-P (16.6%-32.7%) and Al-P (2.4%-
7.7%) while the proportions of Fe-P (6.3%-7.8%) and
occluded P (2.7%-3.5%) remained stable after the incubation
period. They concluded that progressive mineralization and
immobilization reactions increased when P is added as a
fertilizer. Increase in Ca2-P is less in saline sodic and marginal
saline sodic soils than in normal soil at all P application rates
(Fig. 1). It might be due to increased precipitation reactions
of P with Ca contents and hence P availability was decreased.
The decrease in P availability might be due to its fixation on
soil colloids as P might be fixed on to the surface of Ca/Mg
carbonates, which converts added P into less soluble
phosphate compounds (Ahmad and Khan, 2010). These
fractions can be released via mineralization reactions through
soil organisms and plant roots.
In saline sodic and marginal saline sodic soils, the added P
converted more to Al-P form than in Ca2-P or Ca8-P. It might
be due to the fact that P fixation can be dominantly by Al and
Fe oxides and hydroxides, such as goethite, gibbsite and
hematite (Damon et al., 2014). Iron oxide or Al oxide and clay
minerals have large specific surface areas, which provide
large number of adsorption sites (Arai and Sparks, 2007).
Similar trend was shown by Fe-P in saline sodic and marginal
saline sodic soils at high P application level (600 mg kg-1).
Overall, Olsen-P content in the soil without fertilizer P
application remained same after 90 days. Its concentration
increased for initial 15 days with all P application levels but
then decreased with time in a complex equilibrium. Its
decrease in concentration after 15 days is inconsistent with
the increasing concentration of other P fractions during later
stages. Jalali and Ranjbar (2010) also found a sharp decrease
in Olsen-P within 3 days after P addition.
In this experiment, Olsen-P was found higher at P application
level of 600 mg kg-1 than P application level of 400 mg kg-1
up to 15 days but later on, P application level of 400 mg kg-1
provide higher Olsen P than all other P application levels. It
might be due to adequate P fertilization that provides adequate
P availability. Xie et al. (1991) observed that Olsen-P content
was considerably higher in treatments with animal fertilizer.
Ma et al. (2009) also found that the Olsen-P concentration in
soils increased with P fertilizers application, mainly due to P
fertilization rate and soil pH reactions.
Addition of organic amendments also indirectly influenced
the availability of P within the soil P pool (Chun et al., 2007).
The addition of CR and SS increased Ca-P contents
consistently in all experimental soils, which may be related to
formation of Ca-P complexes through chelation and
precipitation reactions. Organic matter alters soil pH and
increases the net negative charge surfaces in soil, with the net
effect of increased solubility and reduced sorption of P in soil
by increasing P diffusion rate (Cong and Merckx, 2005). In
addition, decomposition of PM and FYM derived organic
residues produce humic and fulvic acid which can compete
with solution P for sorption sites of clay mineral (Meena and
Biswas, 2014). Poultry manure and farmyard manure are rich
in nutrients and enhance P availability in salt affected soil via
solubilization of adsorb P from mineral sites due to which
liable pool of P increased (Mahmoodabadi and Heydarpour,
2014; Oustani et al., 2015) further sewage sludge (SS), also
enhance P nutrition in problem soil (Ashraf et al., 2016).
Greater accumulation of Fe-P and Al-P contents in salt-
affected PROKA and PARS soils demonstrated that organic
P compounds are readily adsorbed onto iron oxides and
aluminum oxides (Anderson et al., 1974). Immobilization of
soil P occurs when the total P of the residue is insufficient to
meet the P requirements of the microbial biomass. Organic
acids generated by the higher microbial activity associated
with composts reduced P adsorption sites and increased
extractable P content in soil-compost mixture (Sikora and
Enkiri, 2003).
On the other hand, increase in Olsen-P fraction after 30 days
of organic amendments application seems to be released from
Ca-P fractions as stated by Wang (2008). The ability of Ca-P
to transform into Olsen-P was greatly enhanced by
application of PM. However, it depends on the P
concentration in the residues as it becomes mineralized
(Damon et al., 2014; Hua et al., 2016).
Conclusion: It is concluded that P distribution in all the three
types of soils has a significant variation at all P fertilizer
levels. Overall, P application at 400 mg kg-1 was found most
effective in enhancing available-P (Olsen-P) in all soils.
Poultry manure and farmyard manure addition enhanced the
release of available P fraction (Olsen-P) for a longer period in
Phosphorus fractions and their transformation in soil
311
all experimental soils as compared to sewage sludge and crop
residue. From both studies, it is concluded that the addition of
PM or FYM at P level 400 mg kg-1 is an effective approach to
mobilize and render more P available for plant uptake.
REFERENCES
Ahmad, M. and M.S. Khan. 2010. Phosphate-solubilizing and
plant-growth-promoting Pseudomonas aeruginosa PS1
improves greengram performance in quizalafop-pethyl
and clodinafop amended soil. Arch. Environ. Contam.
Toxicol. 58:361-372.
Akram, M., M. A. Tanvir, M. T. Siddiqui, M. Iqbal and M.
Qayyum. 2017. Response of Eucalyptus camaldulensis
and Eucalyptus globulus seedlings to different levels of
salinity. J. Glob. Innov. Agric. Soc. Sci. 5:130-136.
Arai, Y. and D.L. Sparks. 2007. Phosphate reaction dynamics
in soils and soil minerals: A multiscale approach. Adv.
Agron. 94:135-179.
Ashraf, I., I. Ahmad, M. Nafees, M.M. Yousaf and B.
Ahmad. 2016. A review on organic farming for
sustainable agricultural production. Pure Appl. Biol.
5:277-286.
Audette, Y., I.P. O'Halloranb and R. Paul Voroney. 2016.
Kinetics of phosphorus forms applied as inorganic and
organic amendments to a calcareous soil. Geoderma
262:119-124.
Choudhary, O.P., G. Kaur and D.K. Benb. 2007 Influence of
long term sodic water irrigation, gypsum, and organic
amendments on soil properties and nitrogen
mineralization kinetics under rice–wheat system.
Commun. Soil Sci. Plant Anal. 38:2717-2731.
Chun, S., H. Rai, M. Nishiyama and S. Matsumoto. 2007.
Using organic matter with chemical amendments to
improve calcareous sodic soil. Commun. Soil Sci. Plant
Anal. 38:205-216.
Cong, P.T. and R. Merckx. 2005. Improving phosphorus
availability in two upland soils of Vietnam using Tithonia
diversifolia H. Plant Soil 269:11-23.
Couto, RR, P.A.A. Ferreira, C.A. Ceretta, C.R. Lourenzi,
D.B. Facco, A. Tassinari, R. Piccin, L. De-Conti, L.C.
Gatiboni, D. Schapanski and G. Brunetto. 2017.
Phosphorus fractions in soil with a long history of
organic waste and mineral fertilizer addition. Bragantia
76:155-66.
Curtis, T. and N.G. Halford. 2014. Food security: the
challenge of increasing wheat yield and the importance
of not compromising food safety. Ann. Appl. Biol.
164:354-372.
Damon, P.M., B. Bowden, T. Rose and Z. Rengel. 2014. Crop
residue contributions to phosphorus pools in agricultural
soils: a review. Soil Biol. Biochem. 74:127-137.
Day, S., J.B. Norton, T.J. Kelleners and C.F. Strom. 2015.
Drastic disturbance of salt-affected soils of a semi-arid
cool desert shrubland. Arid Land Res. Manag. 29:306-
320.
Debicka, M., A. Kocowicz, J. Weber and E. Jamroz. 2016.
Organic matter effects on phosphorus sorption in sandy
soils. Arch. Agr. Soil Sci. 62:840-855.
Devau, N., E. Le-Cadre, P. Hinsinger and F. Gerard. 2010.
A mechanistic model for understanding root-induced
chemical changes controlling phosphorus availability.
Ann. Bot. 105:1183-1197.
Gee, G.W. and J.W. Bauder. 1986. Particle-size analysis. In:
A.L. Page (ed.), Methods of soil analysis, Part 1: Physical
and mineralogical methods, 2nd Ed. American Society
Agronomy, Madison, USA; pp.383-409.
Ghafoor, A., M. Qadir and G. Murtaza. 2004. Salt-affected
Soils: Principles of Management. Allied Book Centre,
Urdu Bazar, Lahore, Pakistan.
Havlin, J.L., S.L. Tisdale, W.L. Nelson and J.D. Beaton.
2011. Soil Fertility and Fertilizers, 8th Ed. Pearson Inc,
New York, USA.
Hua, K., W. Zhangb, Z. Guoa, D. Wanga and O. Oenema.
2016. Evaluating crop response and environmental
impact of the accumulation of phosphorus due to long-
term manuring of vertisol soil in northern China. Agric.
Ecosys. Environ. 219:101-110.
Jackson, M.L. 1962. Soil Chemical Analysis. Constable and
Co Ltd., London, UK.
Jalali, M. and F. Ranjbar. 2010. Aging effects on phosphorus
transformation rate and fractionation in some calcareous
soils. Geoderma 155:101-106.
James, R.A., C. Blake, C.S. Byrt and R. Munns. 2011. Major
genes for NaCl exclusion, Nax1and Nax 2 wheat HKT1;4
and HKT1;5), decrease NaCl accumulation in bread
wheat leaves under saline and water logged conditions. J.
Exp. Bot. 62:2939-2947.
Jiang, B.F. and Y.C. Gu. 1989. A suggested fractionation
scheme of inorganic phosphorus in calcareous soils. Sci.
Agri. Sin. 22:58-66.
Koksal, N., A. Alkan-Torun, I. Kulahlioglu, E. Ertargin and
E. Karalar. 2016. Ion uptake of marigold under saline
growth conditions. Springer Plus 5:139-151
Lai, L., M.D. Hao and L.F. Peng. 2003. The variation of soil
phosphorus of long-term continuous cropping and
management on Loess Plateau. Res. Soil Water Conserv.
10:68-70.
Larsen, S. 1967. Soil phosphorus. Adv. Agron. 19:151-210.
Lindsay, W.L., P.L.G. Vlek and S.H. Chien. 1989. Phosphate
minerals. In: J.B. Dixon and S.B. Weed (eds.), Minerals
in Soil Environment, 2nd Ed. Soil Sci. Society America,
Madison, W.I., USA.
Ma, Y.B., J.M. Li, X.Y. Li, X. Tang, Y.C. Liang, S.M. Huang,
B.R. Wang, H. Liu and X.Y. Yang. 2009. Phosphorus
accumulation and depletion in soils in wheat-maize
cropping systems: Modeling and validation. Field Crop
Res. 110:207-212.
Rashid, Aziz, Maqsood & Farooq
312
Mahmoodabadi, M. and E. Heydarpour. 2014. Sequestration
of organic carbon influenced by the application of straw
residue and farmyard manure in two different soils. Int.
Agrophys. 28:169-176.
Maillard, E. and D.A. Angers. 2014. Animal manure
application and soil organic carbon stocks: A meta-
analysis. Global Change Biol. 20:666-679.
Meena, M.D., B. Narjary, P. Sheoran, H.S. Jat, P.K. Joshi,
A.R. Chinchmalatpure, G. Yadav, R.K. Yadav and M.K.
Meena. 2018. Changes of phosphorus fractions in saline
soil amended with municipal solid waste compost and
mineral fertilizers in a mustard-pearl millet cropping
system. Catena 160:32-40.
Meena, M.D. and D.R. Biswas. 2014. Phosphorus and
potassium transformations in soil amended with enriched
compost and chemical fertilizers in a wheat–soybean
cropping system. Comm. Soil Sci. Plant Anal. 45:624-
652.
Mishra, A., J.K. Tripathi, P. Mehta and V. Rajamani. 2013.
Phosphorus distribution and fractionation during
weathering of amphibolites and gneisses in different
climatic setups of the Kaveri river catchment, India.
Appl. Geochem. 33:73-181.
Murtaza, G., A. Ghafoor, G. Owens, M. Qadir and U.Z.
Kahlon. 2015. Environmental and economic benefits of
saline-sodic soil reclamation using low-quality water and
soil amendments in conjunction with a rice-wheat
cropping system. J. Agron. Crop Sci. 195:124-136.
Oustani, M., M.T. Halilat and H. Chenchouni. 2015. Effect of
poultry manure on the yield and nutriments uptake of
potato under saline conditions of arid regions. Emir. J.
Food Agric. 27:106-120.
Park, M., O. Singvilay, W. Shin, E. Kim, J. Chung and T. Sa.
2004. Effects of long-term compost application on soil
phosphorus status under paddy cropping system. Comm.
Soil Sci. Plant Anal. 35:1635-1644.
Qadir, M., A.D. Noble, J.D. Oster, S. Schubert and A.
Ghafoor. 2005. Driving forces for sodium removal
during phytoremediation of calcareous sodic soils. Soil
Use Manag. 21:173-180.
Rahnama, A., R.A. James, K. Poustini and R. Munns. 2010.
Stomatal conductance as a screen for osmotic stress
tolerance in durum wheat growing in saline soil. Funct.
Plant Biol. 37:255–263.
Rawat, M., A.L. Ramanathan and T. Kuriakose. 2013.
Characterization of municipal solid waste compost
(MSWC) from selected Indian cities-a case study for its
sustainable utilization. J. Environ. Protec. 4:163-171.
Sharma, S.P., S.K, Subehia and P.K. Sharma. 2002. Long-
term effects of chemical fertilizers on soil quality, crop
productivity and sustainability. Department of Soil
Science, CSK HPKV, Palampur, HP, India.
Sherani, J., M.S. Jillani and T. Ahmad. 2017. Ber (Zizyphus
mauritiana L.) production and quality as influenced by
different salinity levels in water. Pak. J. Agri. Sci.
54:645-652. Singh, J.S., V.C. Pandey and D.P. Singh. 2011. Efficient soil
microorganisms: a new dimension for sustainable
agriculture and environmental development. Agric
Ecosyst. Environ. 140:339-353.
Singh, Y., B. Singh and J. Timsina. 2005. Crop residue
management for nutrient cycling and improving soil
productivity in rice-based cropping system in the tropics.
Adv. Agron. 85:269-407.
Sui, Y., M.L. Thompson and C. Shang. 1999. Fractionation of
phosphorus in a Mollisol amended with biosolids. Soil
Sci. Soc. Am. J. 63:174-1180.
Tisdale, S.L., W.L. Nelson, J.D. Beaten and J.L. Havlin.
2012. Soil Fertility and Fertilizers, 8th Ed. Prentice-Hall,
New Delhi, India.
Vance, C.P., C. Uhde-Stone and D.L. Allan. 2003.
Phosphorus acquisition and use: critical adaptations by
plants for securing a nonrenewable resource. New
Phytol. 157:423–447.
Vimal, S.R., J.S. Singh, N.K. Arora and S. Singh. 2017. Soil-
plant-microbe interactions in stressed agriculture
management: A review. Pedosphere 27:177-192.
Wahid, F., M. Alam, I. Ahmad, A.R. Gurmani, M. Sajid, Noor
Ul Amin and A. Ali. 2017. Effect of pre-soaking agents
on salinity stressed cucumber seedlings. Pak. J. Agri. Sci.
54:781-790. Wang, D.Z. 2008. The evolvement rule of soil fertility of
Shajiang black soil under long-term located fertilization.
Mater. Diss. Res. 3:29-31.
Watanabe, F.S. and S.R. Olsen. 1965. Test of an ascorbic acid
method for determining phosphorus in water and
NaHCO3 extracts. Soil Sci. Soc. Am. Proc. 29:677-678.
Wong, V.N.L., R.C. Dalal and R.S.B. Greene. 2009. Carbon
dynamics of sodic and saline soils following gypsum and
organic material additions: a laboratory incubation. Appl.
Soil Eco. 41:29–40.
Xie, R.J., A.F. Mackenzi and I.P.O. Hollaran. 1991. Ligno-
sulfonate effects on phosphate reactions in a clay soil:
Causal modeling. Soil Sci. Soc. Am. J. 55:711-716.
Zhang, T.Q., A.F. MacKenzie, B.C. Liang and C.F. Drury.
2004. Soil test phosphorus and phosphorus fractions with
long-term phosphorus addition and depletion. Soil Sci.
Soc. Am. J. 68:519-528.