Embed Size (px)
Citation preview

Chapter 5 Soil properties of Frankenia habitats
Chapter 5
SOIL PROPERTIES ASSOCIATED WITH THE HABITATS OF CENTRAL AND
SOUTHERN AUSTRALIAN SPECIES OF FRANKENIA L. (FRANKENIACEAE).
Lyndlee C. Easton and Sonia Kleindorfer
ABSTRACT Easton, L.C. & Kleindorfer, S. (In review) Soil properties associated with the habitats of central and southern
Australian species of Frankenia L. (Frankeniaceae). Plant and Soil.
We examine the soil properties (soil texture, soil elements, pH, EC, exchangeable cations, water
content at field capacity, gypsum content, carbonate content) from sites where populations of
Frankenia species naturally occur in central and southern Australia. We test whether any suites of
soil properties are correlated to species distribution. We also test whether any suites of soil
properties are associated with seed packaging strategies (categorically larger-seeded species,
smaller-seeded species). Discriminant Function Analyses revealed that populations clustered into
species groups and into seed packaging categories based on soil properties. The inter-
relationships of water content at field capacity, proportions of exchangeable cations, and gypsum
and/or carbonate content provided the maximum discrimination to identify species clusters. The
additional inter-relationship between pH and the K+:Na+ ratio further clustered populations into
seed packaging categories. We demonstrate that the evolution of seed packaging strategies may
have been directed by soil properties. We discuss this information in the context of considering
the inclusion of Frankenia in salinity remediation, mine-site rehabilitation, or coastal
revegetation projects.
Key words arid zone plants, halophytes, salinity remediation, seed mass/seed number, soil
preferences
79

Chapter 5 Soil properties of Frankenia habitats
INTRODUCTION
Australia has the largest area of saline soils of any continent (Peverill et al. 1999). More
than one third of the country is affected by primary or secondary salinity. Saline soils generally
occur in the arid, semi-arid, and Mediterranean climates where rainfall is highly variable in
timing, duration, and intensity. Available water for plants in these areas is unpredictable and
unreliable. Consequently, Australia has a high number of endemic plant species adapted to cope
with varying degrees of salinity and drought.
Soil characteristics are important in the study of plant ecology as they affect the
likelihood of survival at all life history stages (Meyer 1986). The distribution and abundance of
plant species is governed by their germination requirements, and by a seedling’s ability to survive
to reproductive age. The principal factors affecting these life history stages – especially in arid
regions – are soil-nutrient and soil-water availability (Rivas-Arancibia et al. 2006). Soil-nutrient
availability is highly variable even within populations. Moreover, species vary in their ability to
utilize available soil-nutrients and soil-water, and this in turn is influenced by temperature,
season, dormancy mechanisms, and soil properties. Consequently, there is often substantial inter-
communal diversity in plant species that make up the arid and semi-arid floral communities. As
there is little difference in rainfall and temperature between proximal communities at a given
time, it is suggested that differences in soil properties play an important role in explaining the
differences in inter-communal plant diversity (Rivas-Arancibia et al. 2006).
This paper investigates soil properties from sites where populations of the halophyte plant
genus Frankenia L. occur in central and southern Australia. Data on the ecology of Frankenia
taxa are sparse. Detailed data on soil properties of Frankenia habitats in particular are limited to
Brightmore’s (1979) study on F. laevis L., a European species, and Whalen’s (1987) monograph
of American Frankenia. Soil properties associated with the naturally occurring Australian
Frankenia species have been referred to in only a small number of vegetation surveys (e.g.
Murray 1931; Jessup 1951; Symon 1963; Boyland 1970; Badman 1999).
Although Frankenia species only occur in arid, semi-arid, and Mediterranean climates,
there are differences between species in their reproductive strategies – notably in ovule number
per flower and seed mass. Easton and Kleindorfer (2008a) categorized Frankenia species – based
on seed packaging strategies – into ‘larger-seeded species’ (3–6 ovules per flower; mean seed
80

Chapter 5 Soil properties of Frankenia habitats
mass 400 μg ±12 s.e.), and ‘smaller-seeded species’ (up to 45 ovules per flower; mean seed mass
90 μg ±2 s.e.). The consequences of seed packaging strategies on germination and seedling
establishment in relation to temperature, salinity levels, seed age, and light requirements are
discussed in Chapters 2, 4, and 6. Furthermore, Frankenia species appear to be site specific.
Rarely do they occur in a single community and when they do occur in a single community, the
species are segregated (Easton & Kleindorfer 2008a, 2008b). This segregation may be influenced
by differences in soil properties. Whalen (1987) noted a correlation between Frankenia species in
America and the electrical conductivity (EC), pH, sodicity (ESP), and gypsum content of soils.
Semple and Waterhouse (1994) also noted site specificity for several Australian arid zone
species, including three species of Frankenia, and suggested that it was caused by the different
soluble salt concentrations between the sites.
Secondary salinity is a major problem in Australia with 30% of agricultural land affected
by salinity. One method to ameliorate salinity affected areas is through phytoremediation (Boyko
1966). Salt-tolerant shrubs can lower soil salinity levels by extracting salts from the soil, while
providing groundcover to reduce soil erosion. However, efforts to utilize species in artificial
revegetation have met with mixed success due in part to a lack of knowledge about the specific
germination requirements for the species (Mikhiel et al. 1992). However, knowing the
environmental preferences and limitations of plant species, including soil associations, is vital
when restoring degraded areas (Northcote & Skene 1972).
Although previously not included in reclamation and remediation projects primarily due
to the lack of knowledge on its ecology, Frankenia has the potential to be included in reclamation
and revegetation projects. We examine soil properties, specifically soil texture (particle size), pH,
EC, cation exchange capacity (CEC), exchangeable cation ratios, water content at field capacity,
and the presence of gypsum (CaSO4.2H2O) and carbonate (notably CaCO3), from population sites
of 12 Frankenia species that occur in central and southern Australian. The aim of this study was
to test whether specific suites of soil properties were associated with individual Frankenia
species, and/or with seed packaging strategies. We test the hypothesis (based on overall
Frankenia distribution) that there are differences in soil properties between species. We predict
that (1) smaller-seeded species with high ovule numbers per fruit occur in gypseous soils with a
high sand content and a high EC (highly saline), and (2) that larger-seeded species with low
81

Chapter 5 Soil properties of Frankenia habitats
numbers of ovules per fruit occur in non-gypseous soils with a higher clay content and a lower
EC.
MATERIALS AND METHODS
Test species
Frankenia are cosmopolitan salt-tolerant shrubs, sub-shrubs, or cushion bushes.
Currently, 47 Australian species are recognized and only one, F. pulverulenta L., is not endemic
(Barnsley 1982; Whalen 1986; but see Craigie 2007). In Australia, Frankenia are found south of
the latitude 17°S in Mediterranean, arid, and semi-arid climates (Summerhayes 1930).
Populations often occur in isolated, disjunct pockets and generally cover only several square
metres.
Soil analyses
To examine the soil properties associated with Frankenia habitats, soil to a depth of 15cm
was sampled from five sites per population (see Table 1) in close proximity to Frankenia plants,
following the protocol of Whalen (1987). In general, soil associated with Frankenia had a
negligible A horizon and a deep B horizon with limited stratigraphy. Soil profiles for species of
Australian Frankenia distribution, based on McKenzie et al. (2004) and in accordance with the
Australian Soil Classification (Isbell 1996), were designated Hypercalcic Calcisol, Endosalic
Calcisol, Calcic Solonchak, Vertic Solonchak, Endopetric Plinthosol, or Alcalic Solonetz.
In the laboratory, the five soil samples from each population were mixed to create a single
homogenous representative sample per population. Soils were air dried and then sieved through a
2mm sieve to remove extraneous materials.
Soil elements
Preliminary investigations tested homogeneity in the soil elements from population sites
of eight species occurring in South Australia. Samples from 21 population sites (see Table 1)
representing a cross section of the South Australian distribution of this genus were analysed by
Inductively Coupled Plasma Atomic Emission Spectrometry (ICPAES) after digestion with
82
Chapter 5 Soil properties of Frankenia habitats
nitric/perchloric acid, at Waite Analytical Services, Urrbrae, South Australia. Note that the
resultant potassium values were indicative only because nitric/perchloric acid digestion has the
potential to decrease the fraction of this element due to the precipitation of potassium perchlorate.
Soil properties
Exchangeable cations, pH, and EC were analysed by CSBP, Bibra Lake, Western
Australia. Exchangeable cations were extracted using 1M NH4Cl buffered at pH 8.5 (Rayment &
Higginson 1992). This extraction method was chosen due to the suspected CO3 and gypsum
content in the soil samples. Electrical conductivity (EC) and pH were analysed by 1:5 soil/water
extract (Rayment & Higginson 1992). Cation exchange capacity was calculated as the sum of all
cations. Exchangeable sodium percentage was calculated as the percentage of Na+ in the CEC.
Soil texture, water retention at field capacity, and the presence of gypsum and/or
carbonate for 41 population sites (see Table 1) were analysed at CSIRO Land and Water,
Urrbrae, South Australia. Gypsum content (%) was determined first using the EC conversion
method following the protocol of Burt (2004). The presence of gypsum in soil samples causes
flocculation, thus rendering many soil analyses fallacious. Soil samples identified as containing
gypsum therefore required intensive pretreatment before some analyses could be undertaken (see
below). Each soil sample was partially dispersed by an ultrasonic probe for 15 minutes. Next,
CO3 content was estimated using the ‘fizz test’. Hydrochloric acid was added to dry soil and the
strength of the chemical reaction was recorded categorically as ‘no reaction’, ‘slight reaction’,
‘moderate reaction’, or ‘strong reaction’ (Bowman & Hutka 2002). Soils were then pre-treated to
remove organic matter (by hydrogen peroxide) and CO3 (by acetic acid). This modified method
uses acetic acid rather than hydrochloric acid to remove CO3 because acetic acid has less effect
on sensitive clay materials. Soluble salts (including gypsum) were removed by washing and the
samples dispersed by shaking with sodium hexametaphosphate and sodium carbonate (Method
Code 517.13). This procedure was repeated until the EC of the soil:water sample was <0.4 dS/m.
Soil texture (particle size) analyses were undertaken by dispersion, wet sieving, and pipette sub-
sampling following the protocol of Bowman and Hutka (2002). The sample was wet sieved
through 63μm fine mesh. Pipette sub-samples from the <63μm sample were taken at specified
times and depths relevant to the partition of silt from clay. The >63μm sample was not further
separated and recorded as homogenous sand.
83

Chapter 5 Soil properties of Frankenia habitats
Soil-water retention for determining moisture content was measured by the volumetric
water retention percentage (θv) at field capacity (henceforth noted as ‘θvFC’). This depicts the
plant-available water (Janik et al. 2007). For the initial 23 population sites, θvFC was measured
by pressure plate extractors for a matrix suction of 10 kPa (ψm = -10 kPa) following the protocol
of McKenzie et al. (2002). For the subsequent 18 sites (see Table 1), θvFC was predicted using an
estimate of soil density analysed by Mid Infrared (MIR) spectroscopy. Mid Infrared spectroscopy
is sensitive to soil composition. Volumetric soil retention can be derived via Mid Infrared Partial
Least Squares models from the MIR spectra of soils and from reference data. These are used to
predict the water retention of unknown samples (Janik et al. 2007). Soils for MIR analyses were
prepared and analysed following the protocol of Janik et al. (2007).
Statistical analyses
All analyses were calculated using SPSS Version 15. Means and standard errors of all soil
properties were calculated for each species and for each seed packaging category. Results of the
analyses were subjected to Discriminant Function Analysis (DFA) to examine possible causal
relationships between soil properties and Frankenia species distribution, or seed packaging
strategies (see Meyer et al. 1992). Cadmium was included in the original ICPAES analyses;
however, the amount present in all population samples was less than the limit of detection for
ICPAES, and they were therefore excluded from further analyses.
Discriminant Function Analysis (multivariate ANOVA) was used to provide weightings
for the combination of all soil variables to provide a maximum discrimination between
populations (Dytham 2003). This analysis showed whether any inter-relationships of soil
properties (henceforth called the SPIR effect) identified clusters of species groups, or seed
packaging categories. We also tested whether individual populations would be assigned to the
correct species groups or seed packaging categories if the population was excluded and then
reassigned based on the Discriminant Function scores. This approach gave an overall efficiency
score for the discrimination of groups based in the SPIR effect (Dytham 2003). Wilks lambda –
the proportion of the total variance in the Discriminant Function scores not explained by the
differences among groups – tested the equality of group means between species and between seed
packaging categories. Single factor ANOVA tested for significant differences per individual soil
property, between species and/or seed packaging strategies.
84

Chapter 5 Soil properties of Frankenia habitats
RESULTS
Soil elements
Table 2 lists the mean percentages (±s.e.) of soil elements per species and per seed
packaging category for 21 populations of Frankenia included in this part of the study. Figure 1 is
the scatterplot generated for the soil elements based on DFA results. The Ca component
accounted for the largest absolute correlation and explained 91.1% of the variation between
populations (i.e. the SPIR effect).
There was observable (and statistically significant) clustering of populations into species
based on the SPIR effect (Wilks Lambda: χ2 = 144.04, df = 84, P<0.001). Individually, there were
also significant differences between species clusters for Ca content, as expected due to its
significance in the SPIR effect (F = 32.75, df(7,14) P<0.001), and also K content (F = 3.69, df(7,14)
P<0.05), Fe content (F = 436, df(7,14) P<0.01), and Al content (F = 7.42, df(7,14) P<0.01).
Furthermore, there was observable (and statistically significant) clustering of populations
into seed packaging categories based on the SPIR effect (Wilks Lambda: χ2 = 27.14, df = 14,
P<0.05). The SPIR effect of the S, Al, Mg, and K contents accounted for the largest absolute
correlation. Individually, there was a significant difference between seed packaging categories for
S content (F = 4.70, df(1,20) P<0.05) and Al content (F = 4.39, df(1,20) P<0.05).
Relationships between species and soil properties
Table 3 summarizes the overall means (±s.e.) and range of soil properties for the 41
Frankenia populations included in this part of the study. Table 4 lists the means (±s.e.) for soil
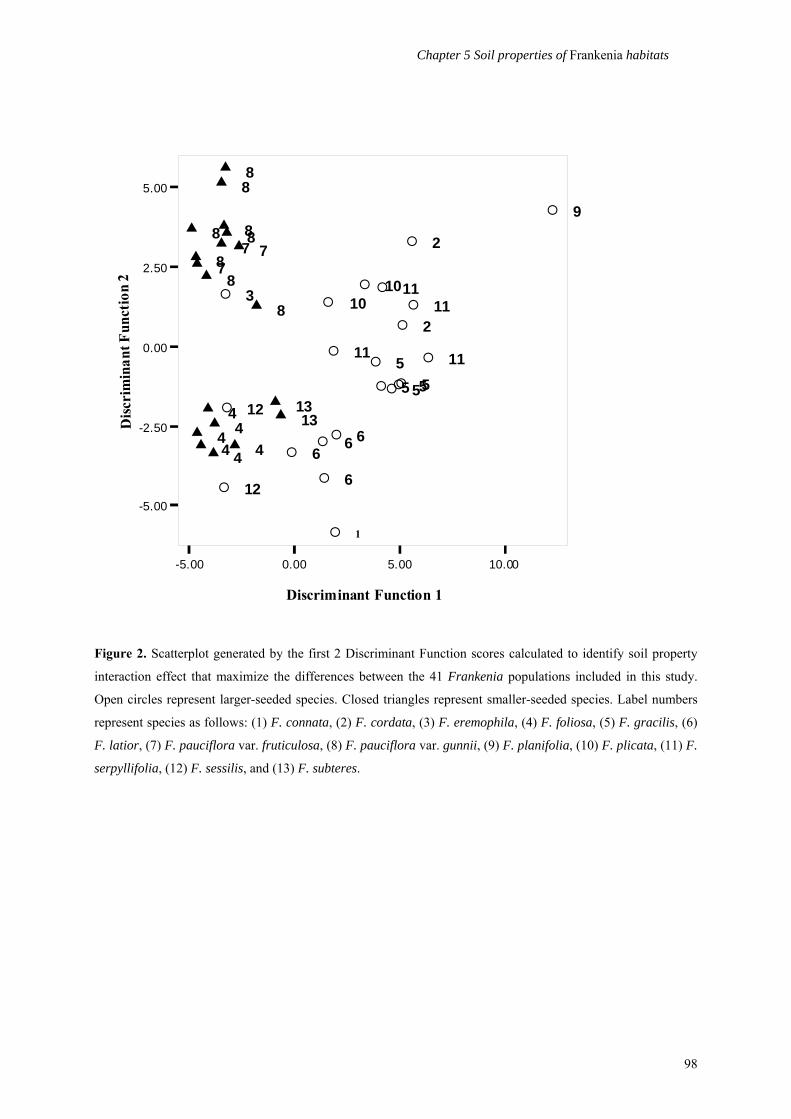
properties per species. Discriminant Function Analyses were calculated to identify which soil
properties would maximize the differences between the 41 populations, and to investigate
whether populations would cluster into species groups and/or seed packaging category based on
soil properties (see Figure 2).
There was an observable (and statistically significant) clustering of populations into
species groups (Wilks Lambda: χ2 = 3.15.57, df = 192, P<0.001). The SPIR effect of the CO3
content, θvFC, and K+:Na+ accounted for the largest absolute correlation and explained 58.3% of
the variation between populations. Individually, there were significant differences between
species clusters in percentage sand content (F = 3.11, df(12,28) P<0.01), percentage clay content (F
85
Chapter 5 Soil properties of Frankenia habitats
= 3.69, df(12,28) P<0.01), CO3 content (F = 9.56, df(12,28) P<0.001), and θvFC (F = 6.46, df(12,28)
P<0.001).
Relationship between seed packaging categories and soil properties
Table 3 also lists the means (±s.e.) of soil properties for Frankenia population sites when
divided into seed packaging categories. The SPIR effect of CO3 content, Mg content, CEC and
pH accounted for the largest absolute correlation. There was observable (and statistically
significant) clustering of larger-seeded species and of smaller-seeded species (Wilks lambda: χ2 =
46.14, df = 16, P<0.001). Independently, there were significant differences between the seed
packaging categories for CO3 content (F = 35.4, df(1,39) P<0.001), CEC (F = 5.95, df(1,39) P<0.05),
θvFC (F = 4.69, df(1,39) P<0.05), pH (F = 5.55, df(1,39) P<0.05), Mg content (F = 5.52, df(1,39)
P<0.05), and K+:Na+ (F = 4.89, df(1,39) P<0.05).
Notable imprecision in the clustering included (1) F. sessilis, a coastal larger-seeded
species, clustering closely to F. foliosa, an inland smaller-seeded species, and (2) F. eremophila,
also a coastal larger-seeded species, clustering within the F. pauciflora varieties, which are
coastal smaller-seeded species.
DISCUSSION
Given the increasing incidence of secondary salinity in Australia, the underpinning aim of
this study was to identify the soil properties of Frankenia species from primary salinity habitats
to ascertain their potential for salinity remediation, mine-site rehabilitation, and/or coastal
revegetation. While the soil properties per se were comparable between Frankenia species, there
was evidence that individual species were affiliated with specific combinations of these soil
properties. Furthermore, there was evidence that seed packaging strategies were also affiliated
with specific combinations of soil properties
Soil elements
Soil element content generated clustering of species and seed packaging categories in the
DFA. Specifically, Ca content was the key predictor for the clustering of species groups, while
86

Chapter 5 Soil properties of Frankenia habitats
the SPIR effect of S content, Mg content, and K content was the key predictor for the clustering
of seed packaging categories. The biological relevance of variation in the soil elements is unclear
because at any instance, only 1% of the total nutrient content of soil is available to plants
(McKenzie et al. 2004). However, Frankenia species have differing requirements for peak
germination and seedling establishment (see Chapter 4). The effect of soil elements (notably Ca
and S) on soil pH, EC, or morphology may impact on seed germination and seedling
establishment. The presence of S in conjunction with high Ca content generally indicates a
gypseous soil. (Note also that low K content is also characteristic of gypseous soils – see Meyer
et al. 1992.) The presence of gypsum in soils at some Frankenia sites was confirmed by its
confounding affects on several of the tests performed in this study – notably the flocculation in
the soil texture analyses.
Gypsophily in arid zone plant species is well documented (e.g. Parsons 1976; Escudero et
al. 2000; Palacio et al. 2007). Frankenia have been associated with gypseous soils in North and
South America. In particular, F. jamesii Torrey ex A. Gray is considered an indicator for the
presence of gypsum (Parsons 1976; Brightmore 1979; Whalen 1987). Gypseous soils have a
relatively high hydraulic conductivity. Thus, soil-water is drawn to the soil surface in response a
gradient created by soil surface evaporation and drying (Meyer et al. 1992; Escudero et al. 2000).
This creates a near surface water regime suitably for shallow rooted and slow establishing species
such as small-seeded Frankenia. Gypsum is also effective at reducing exchangeable unfavourable
Na+ (Peverill et al. 1999). Gypsum exposures are widespread in central and southern Australia
(Bonython & King 1956). Despite this, of all the central and southern Australian Frankenia
species, only F. foliosa (and possibly F. eremophila) showed a bias for gypseous soils. All
populations of F. foliosa occurred in soils that contained substantial gypsum.
Species delineation - θvFC, K+:Na+, and Ca compounds
The SPIR effect of θvFC, K+:Na+ and the Ca compounds (calcium carbonate and gypsum)
were significant predictors for delineating species clusters in the DFA. Water retention at field
capacity is related to soil texture. Soil texture affects the water potential – i.e. how tightly water is
held by the soil. While the effect of ‘soil texture’ per se was not included as a discriminating
factor in the SPIR effect, the independent effects of ‘percentage clay content’ and ‘percentage
sand content’ were significantly different between species clusters. Overall, clay content ranged
87
Chapter 5 Soil properties of Frankenia habitats
from 29% to 52%, and sand content ranged from 25% to 96%. In general, the larger-seeded
species occurred in soils with a higher clay content and lower sand content than smaller-seeded
species. Soils with higher clay content can retain higher θvFC (McKenzie et al. 2004).
However, few Frankenia population sites had a mean θvFC greater than 30%. For this
reason, θvFC related to Frankenia, based on McKenzie et al. (2004), was rated as ‘very poor’.
The few populations that recorded θvFC of greater than 30% – notably the two F. pauciflora
varieties – also had a high CO3 content. The θvFC was estimated by MIR’s for all of the F.
pauciflora populations. Bertrand et al. (2002) demonstrated that the presence of CaCO3 can cause
MIR spectra to become atypical of the remaining calibration set, thereby leading to difficulties in
predictors. Thus, the MIR θvFC values for F. pauciflora in this study may have been over-
estimated.
The θvFC and the way it is utilized by plants influences species distribution, particularly
in arid, semi-arid, and Mediterranean climates. For Frankenia, it appears that the larger-seeded
species have adapted to soils that retain higher θvFC through higher clay content, whereas
smaller-seeded species have adapted to soils that retain higher θvFC through higher proportions
of carbonate compounds (gypsum, calcium carbonate).
The third soil property in the SPIR delineator for species groups was the K+:Na+ ratios.
Many authors have emphasized the importance of CEC and the ratios of these cations – including
K+:Na+ – on vegetation patterns (e.g. Cantero et al. 1998; Rogel et al. 2000), and on germination
and radicle survival (Tobe et al. 2002). Pertinent to the K+:Na+ ratio, Na+ can be toxic to plants:
however, high levels of K+ in the soil depresses Na+ (Ungar 1991; Tobe et al. 2002). The
proportion of K+ was lower for smaller-seeded species than larger-seeded species. The
significance of this finding is discussed below.
Seed packaging strategies delineation – CO3, CEC, and pH
Seed packaging category clusters were delineated in DFA by the SPIR effect of CO3
content, CEC, Mg content, and pH. The CO3 content was five-fold higher for the smaller-seeded
species than larger-seeded species. The CEC was generally two-fold higher for sites with the
smaller-seeded species. The exception was K+, which was lower for smaller-seeded species than
larger-seeded species. Magnesium cations, as with Na+, can be toxic to plants. High levels of
Ca2+ or K+ in the soil can also depress Mg2+ uptake (Ungar 1991; Tobe et al. 2002). High Mg2+
88
Chapter 5 Soil properties of Frankenia habitats
levels may be tolerated by Frankenia species (especially the smaller-seeded species) due to the
reduced uptake of these cations by the high levels of Ca2+. Higher levels of Ca2+ may be
necessary in soils of the smaller-seeded species due to the lower levels of K+ in these soils than in
soils of the larger-seeded species.
The presence of soluble salts – notably CO3 – raises pH. The pH is instrumental in
regulating chemical and biological reactions, including nutrient extraction and absorption. It
appears that smaller-seeded species can tolerate higher pH levels for these reactions.
Role of Frankenia in salinity remediation
In this study, soil salinity levels were analysed in three ways – by EC, by Na+ content, and
by ESP. The EC for Frankenia sites ranged from 0.04 dS/m to 11.4 dS/m. An EC >4 dS/m
indicates saline soil. Furthermore, soil with an EC >8 dS/m can only support salt-tolerant plants.
More populations of the smaller-seeded Frankenia species occurred in saline soils than larger-
seeded species (21% cf. 14%). At EC’s >8 dS/m, this became even more apparent (16% cf.
4.5%). Thus, while Frankenia are salt-tolerant, they are not necessarily obligate halophytes.
Indications are that smaller-seeded species are more salt-tolerant and thus more suitable for
salinity remediation projects.
In contrast to saline regions on other continents, Australian saline soils are NaCl rich
(DeDekker 1983). Consequential problematic ‘sodic’ soils are characterized by poor water
infiltration and poor aeration (which also creates water-logging after rains). This reduces plant-
available water and inhibits seedling emergence and root development. Sodic soils are indicated
as having a Na+ content exceeding 20 cmol(+)/kg (Peverill et al. 1999), or an ESP of >6%
(McKenzie et al. 2004). Soil associated with Frankenia populations had Na+ concentrations
ranging from 0.32 to 49 cmol(+)/kg. The smaller-seeded species generally occurred in sites with
a higher Na+ content than larger-seeded species. The mean ESP per species ranged from 10% (F.
connata) to 56% (F. sessilis). According to the criteria for sodicity as measured by ESP, all
Frankenia populations occurred in sodic soils.
Conclusion
Efforts directed towards artificial revegetation have met with mixed success due in part to
a lack of knowledge about specific germination requirements and soil preferences for the species
89

Chapter 5 Soil properties of Frankenia habitats
included in revegetation projects (Mikhiel et al. 1992). Our results suggest that Frankenia should
be included in salinity remediation, mine-site rehabilitation, and coastal revegetation projects. In
particular, F. foliosa, F. pauciflora, and F. sessilis should be included in general revegetation and
rehabilitation projects (also see Semple & Waterhouse 1994; Barrett & Bennett 1995; Barrett
2006). Frankenia foliosa is particularly suitable due to its wide range of soil tolerances.
Furthermore, its dense cushion-bush habit would make F. foliosa amenable for the prevention of
soil erosion. Bio-geographically, F. foliosa commonly occur in monocultures on the margins of
salt-lakes, and particularly around the mound springs of the Great Artesian Basin. The soils near
mound springs are highly saline and the spring waters are high in CO3 and sulfates (Badman
1999).
The closely related larger-seeded inland species (see Whalen 1986) appear to be adapted
to a more specific combination of soil properties, which include lower salinity levels, higher clay
content and negligible gypsum and/or carbonate content. One of these larger-seeded species (F.
connata) was represented in this study by one population only; however this has shown to be
noteworthy and may have implications for the ongoing phylogenetic and systematic revisions. In
relation to phylogenetic and systematic revisions, Frankenia planifolia Sprague and Summerh. is
suggested to be conspecific with F. serpyllifolia (Whalen 1986), although it is morphologically
distinct in leaf shape and colour, degree of hirsuteness, and flower colour. The F. planifolia
population was not clustered within the F. serpyllifolia populations based on SPIR effects.
Frankenia connata Sprague is closely related to F. latior Sprague and Summerh., separated only
by leaf shape and degree of hirsuteness on the calyx (Whalen 1986). The F. connata population
likewise was not clustered within the F. latior populations based on SPIR effects.
ACKNOWLEDGEMENTS
Thanks to A. Beech M. Smart, S. Forrester and C. Rivers (CSIRO Land and Water, Urrbrae, South
Australia), and L. Palmer (Waite Analytical Services, Urrbrae, South Australia). A. Craigie, T. Chapman, R. Davies,
and D. Mackay assisted with soil collection. Thanks to R. Crozier of Anna Creek Station and P. Barnes of
Murnepeowie Station for access to collect soil. Soil was collected with permission of the Department of Environment
and Heritage (permit z24947), Primary Industries and Resources SA, and the Parks and Wildlife Commission NT
(Permit 20216). This study was funded to LCE by: Native Vegetation Council, Wildlife Conservation Foundation,
Mark Mitchell Research Foundation, Nature Foundation SA Inc, Wildlife Conservation Fund, and the Post-graduate
90

Chapter 5 Soil properties of Frankenia habitats
Development Program, Flinders University, Adelaide. This paper is part of a PhD thesis by LCE at Flinders
University, Adelaide, South Australia.
REFERENCES Badman, F.J. (1999) The Lake Eyre South study: Vegetation. Gillingham Publishing, South Australia.
Barnsley, B. (1982) Frankeniaceae. In: George A.S. (ed.) Flora of Australia Volume 8. Australian Government
Publishing, Canberra. pp 112–146.
Barrett, G. (2006) Vegetation communities on the shores of a salt lake in semi-arid Western Australia. Journal of
Arid Environments 67: 77–89.
Barrett, G.S. & Bennett, I. (1995) Research into revegetation of salt-affected land after mining in the goldfields of
Western Australia. In: Khan, M.A. & Ungar, I. (eds.) Biology of salt tolerant plants. Book Crafters, USA.
Bertrand, I., Janik, L.K., Holloway, R.E., Armstrong, R.D. & McLaughlin, M.J. (2002) The rapid assessment of
concentrations and solid phase associations of macro- and micronutrients in alkaline soils by mid-infrared
diffuse reflectance spectroscopy. Australian Journal of Soil Research 40: 1339–1356.
Bonython, C.W. & King, D. (1956) The occurrence of native sulphur at Lake Eyre. Transactions of the Royal Society
South Australia 79: 121–129.
Bowman, G.M. & Hutka, J. (2002) Particle size analysis. In: McKenzie, N., Coughlan, K. & Cresswell, H. (eds.)
Soil physical measurement and interpretation for land evaluation. CSIRO Publishing, Australia.
Boyko, H. (1966) Salinity and aridity. D.W. Junk Publishing, The Hague.
Boyland, D.E. (1970) Ecological and floristic studies in the Simpson Desert National Park, South Western
Queensland. Proceedings of the Royal Society Queensland 69: 3–17.
Brightmore, D. (1979) Biological flora of the British Isles. Frankenia laevis L. Journal of Ecology 67: 1097–1197.
Burt, R. (2004) Soil survey laboratory methods manual – soil survey investigations report No. 42, Version 4.
Natural Resources Conservation Service. pp 273–277.
Cantero, J., Cisneros, J.M., Zobel, M. & Cantero, A. (1998) Environmental relationships of vegetation patterns in salt
marshes of central Argentina. Folia Geobotanica 33: 133–145.
Craigie, A.I. (2007) Systematic studies of the Australian species of Frankenia L. (Frankeniaceae). PhD thesis,
Flinders University, Adelaide, Australia.
De Dekker, P. (1983) Australian salt lakes: their history, chemistry, and biota – a review. Hydrobiologia 105: 231–
244.
Dytham, C. (2003) Choosing and using statistics: a biologist's guide (2nd ed). Blackwell Publishing.
Easton, L.C. & Kleindorfer, S. (2008a) Germination in two Australian species of Frankenia L., F. serpyllifolia Lindl.
and F. foliosa J.M. Black (Frankeniaceae) – effects of seed mass, seed age, light, and temperature.
Transactions of the Royal Society South Australia 132: 29-40.
Easton, L.C. & Kleindorfer, S. (2008b) Interaction effects of seed mass and temperature on germination in Australian
species of Frankenia L. (Frankeniaceae). Folia Geobotanica 43(4).
91

Chapter 5 Soil properties of Frankenia habitats
Escudero, A., Iriondo, J.M., Olano, J.M., Rubio, A. & Somolinos, R.C. (2000) Factors affecting establishment of a
gypsophyte; the case study of Lepidium subulatum (Brassicaceae). American Journal of Botany 87: 861–
871.
Isbell, R.F. (1996) The Australian soil classification. CSIRO, Melbourne.
Janik, L.J., Merry, R.H., Forrester, S.T., Lanyon, D.M. & Rawson, A. (2007) Rapid prediction of soil water retention
using mid infrared spectroscopy. Soil Science Society America Journal 71: 507–514.
Jessup, R.W. (1951) The soils, geology and vegetation of north-western South Australia. Transactions of the Royal
Society South Australia 74: 189–273.
McKenzie, N., Coughlan, K. & Cresswell, H. (2002) Soil physical measurement and interpretation for land
evaluation. CSIRO Publishing, Australia.
McKenzie, N., Jacquier, D., Isbell, R. & Brown, K. (2004) Australian soils and landscapes: an illustrated
compendium. CSIRO Publishing, Australia.
Meyer, S.E. (1986) The ecology of gypsophile endemism in the eastern Mojave Desert. Ecology 67: 1303–1313.
Meyer, S.E., Garcia Moya, E. & Lagunes-Espinoza, L. (1992) Topographic and soil surface effects on gypsophile
plant community patterns in central Mexico. Journal of Vegetation Science 3: 429–438.
Mikhiel, G.S., Meyer, S. & Pendleton, R.L. (1992) Variation in germination response to temperature and salinity in
shrubby Atriplex species. Journal of Arid Environments 22: 39–49.
Murray, B.J. (1931) A study of the vegetation of the Lake Torrens plateau, South Australia. Transactions of the
Royal Society South Australia 55: 91–112.
Northcote, K.H. & Skene, J.K.M. (1972) Australian soils with saline and sodic properties. Australian Division of
Soils, Soil Publication #27. CSIRO, Australia.
Palacio, S., Escudero, A., Montserrat-Martí, G., Maestro, M., Milla, R. & Albert, M. (2007) Plants living on gypsum:
beyond the specialist model. Annals of Botany 99: 333–343.
Parsons, R.F. (1976) Gypsophily in plants – a review. American Midland Naturalist 91: 1–19.
Peverill, K.I., Sparrow, L.A. & Reuter, D.J. (1999) Soil analysis: an interpretation manual. CSIRO Publishing,
Australia.
Rayment, G.E. & Higginson, F.R. (1992) Australian laboratory handbook of soil and water chemical methods.
Inkata Press, Melbourne.
Rivas-Arancibia, S.P., Montaña, C., Hernández, J.X.V. & Zavala-Hurtado, J.A. (2006) Germination responses of
annual plants to substrate type, rainfall, and temperature in a semi-arid inter-tropical region in Mexico.
Journal of Arid Environments 67: 416–427.
Rogel, J.A., Ariza, F.A. & Silla, R.O. (2000) Soil salinity and moisture gradients and plant zonation in
Mediterranean salt marshes of southeast Spain. Wetlands 20: 357–372.
Semple, W.S. & Waterhouse, D. (1994) Performance of halophytes from semi-arid areas on two saline seepage
scalds of the Central Western slopes of NSW. Cunninghamia 3: 595–608.
Summerhayes, V.S. (1930) A revision of the Australian species of Frankenia. Linnean Journal of Botany 48: 337–
387.
92

Chapter 5 Soil properties of Frankenia habitats
Symon, D.E. (1963) A checklist of flowering plants of the Simpson Desert and its immediate environs. Transactions
of the Royal Society South Australia 93: 17–37.
Tobe, K., Li, X. & Omasa, K. (2002) Effects of sodium, magnesium and calcium salts on seed germination and
radical survival of a halophyte, Kalidium caspicum (Chenopodiaceae). Australian Journal of Botany 50:
163–169.
Ungar, I.A. (1991) Ecophysiology of Vascular Halophytes. CRC Press.
Whalen, M.A. (1986) Frankeniaceae. In: Jessop, J. & Toelken, H.R. (eds.) Flora of South Australia. South
Australia Government Printing Division, Adelaide. pp 873-881.
Whalen, M.A. (1987) Systematics of Frankenia (Frankeniaceae) in North and South America. Systematic Botany
Monographs 17: 1–93.
93

Chapter 5 Soil properties of Frankenia habitats
94
Species Ref. No. Location GPS co-ordinates Site description Frankenia connata LE01025 Roxby Downs, SA a,b,c S30o02’55” E137o04’34’ Frankenia cordata LE05006 Ormiston Gorge, NT b,c,d S23o40’45” E132o42’42” Pink/orange clayey sand, scree LE05011 Curtin Springs, NT b,c,d S25o21’01” E131o50’47” Red sand Frankenia eremophila LE01006 Cactus Beach, SA a,b,c S32o04’49” E132o59’31” Sand dunes Frankenia foliosa LE01004 Finnis Springs, SA a,b,c S29o30’05” E137o24’29” White sand, saline, traventine LE01005 Oodnadatta Track, SA a,b,c NR LE01014 Marree, SA a,c,d S29o39’34” E137o40’19” Pink/orange clayey sand LE01015 Strzelecki Track, SA a,b S29o33’15” E139o25’16” LE01019 Strzelecki Track, SA a,b,c S30o11’54” E138o38’31’ LE02006 Blanche Cup, SA b,c,d S29o27’17” E136o51’25” White gypseous sand, saline Frankenia gracilis LE01002 Roxby Downs, SA a,b S30o03’28” E137o04’00” Red clayey sand LE01012 Roxby Downs, SA b S30o03’28” E137o04’11” LE01033 Beltana, SA a,b NR Red clayey sand, ironstone LE01034 Parachilna, SA a,b NR LE02003 Birdsville Track, SA b,c,d S27o57’30” E138o39’36” Gypsum, ironstone conglomerate LE04003 Salisbury Lake, NSW b,c,d S29o41’16” E142o38’58” Orange clayey sand, saline Frankenia latior LE01003 Woomera, SA a,b S31o19’48” E136o51’44” LE01011 Roxby Downs, SA a,b S30o17’44” E136o56’12” Heavy clay LE01023 Woomera, SA b S30o57’25” E136o54’22” LE01029 Marree, SA a,b S29o38’51” E137o38’17” Clayey sand LE04004 Fords Bridge, NSW b,c,d S29o42’27” E145o28’22” Pale red/brown claypan Frankenia pauciflora var. fruticulosa
LE01010
Thevernard, SA a,d
S32o08’33” E133o40’35”
Low limestone cliff
LE05024 Corney Point, SA b,c,d S34o35’53” E137o00’00” Limestone cliff LE05025 Pt Rickaby, SA b,c,d S34o40’50” E137o29’37” Sand dune LE05026 Pt Gawler, SA b,c,d S34o38’35” E138o26’22” Shelly sand over clayey sand Frankenia pauciflora var. gunnii
LE01001
Goolwa, SA a,b
S35o31’56” E138o49’37”
Saltmarsh
LE03086 Kangaroo Island, SA b,c,d S35o47’22” E137o45’58” Shelly sand LE03087 Kangaroo Island, SA b,c,d S36o03’32” E136o42’06” LE04020 Coorong, SA b,c,d S36o19’47” E139o45’00” Grey boggy, clayey sand LE04021 Coorong, SA b,c S36o03’20” E139o35’21” Clay LE06001 Robe, SA b,c,d S37o00’59” E139o44’32” Sand, base of cliff LE06002 Beachport, SA b,c,d S37o29’02” E139o59’59” Sand LE06003 Kingston SE, SA b,c,d S36o49’45” E139o52’13” Sand Frankenia planifolia LE02011 Evelyn Downs Station, SA b,c,d S28o10’12” E134o24’07” Slope of ironstone scree LE03076 Alandale Station, SA b,d S27o40’38” E135o32’37” Red gibber, sandy wash-away Frankenia plicata LE05009 Anna Creek Station, SA b,c,d S29o38’57” E135o45’19” Gypseous dunes and scree LE05010 Anna Creek Station, SA b,c,d S29o40’22” E135o46’07” Gypsum, limestone, scree Frankenia serpyllifolia LE01018 Strzelecki Track, SA a,b,d S30o02’02” E138o56’51” Red clayey sand LE01022 Pimba, SA a,b S31o18’56” E136o51’11” LE02001 Mt Gason, SA b S27o13’39” E138o45’44” Red ironstone LE02013 Mt Barry Station, SA b,c,d S28o12’40” E134o48’12” Red clay, pebbles, dam run-off LE03077 Oodnadatta Track, SA b S27o38’20” E135o29’58” LE04002 Tibooburra, NSW b,c S29o06’26” E131o55’48” Gibber mesa Frankenia sessilis LE01007 Cactus Beach, SA a,b S32o03’56” E132o59’37” Clayey sand, gypsum, limestone LE01008 Fowlers Bay, SA a,b NR Brown/red silty sand, saline Frankenia subteres LE01017 Moolawattana Station, SA a,b S29o51’01” E139o39’53” Traventine LE01030 Lyndhurst, SA a,b S29o12’38” E138o23’58” White sand, saline
Table 1. Sites of soil collections with Frankenia species association, and a general description of the soil. Superscript ‘a’ indicates soils analysed by ICPAES, superscript ‘b’ indicates soil analysed by CSBP, superscript ‘c’ indicates soil analysed at CSIRO, and superscript ‘d’ indicates water retention at field capacity estimated by MIR analyses. ‘NR’ denotes that this information was not recorded.

Table 2. Percentage (%) means (±s.e.) for soil element content (ICPAES analysis) at sites per Frankenia species, and per seed packaging category. ‘N’ indicates the number
of populations sampled per species (see Table 1 for sites included in ICPAES analysis). Note that zinc, nickel, boron, cobalt and copper percentages are not included, as
content of these elements were <0.00%.
Chapter 5 Soil properties of Frankenia habitats
Species N Calcium Magnesium Sodium Potassium Sulfur Iron Phosphorus Aluminium Manganese Larger-seeded
species 11 13.6 (±5.2) 1.1
(±0.1) 0.3 (±0.1) 0.6 (±0.1) 0.5 (±0.3) 2.3 (±0.5) 0.04 (±0.00) 3.2 (±0.7) 0.030
(±0.006) F. eremophila 1 35.0 1.3 0.3 0.1 2.7 0.4 0.04 0.5 0.008* F. gracilis 3 0.4 (±0.04) 0.9 (±0.1) 0.1 (±0.8) 0.9 (±0.1) 0.03 (±0.0) 3.5 (±0.3) 0.34 (±0.01) 5.0 (±0.0) 0.046
(±0.007) F. latior 2 1.0 (±0.5) 0.9 (±0.1) 0.3
(±0.04) 0.72(±0.2) 0.2 (±0.1) 3.6 (±0.2) 0.05 (±0.01) 4.5 (±1.5) 0.038
(±0.005) F. serpyllifolia 2 2.60(±0.0) 0.9 (±0.1) 0.2 (±0.1) 0.7 (±0.2) 0.7 (±0.6) 3.0 (±0.6) 0.03 (±0.00) 4.8 (±1.2) 0.039
(±0.014) F. sessilis 3 35.3 (±2.4) 1.6 (±0.1) 0.6 (±0.1) 0.12(±0.02) 0.2 (±0.02) 0.3 (±0.1) 0.04 (±0.00) 0.4 (±0.1) 0.008
(±0.002) Smaller-seeded
species 11 8.2 (±0.7) 2.1 (±0.6) 0.6 (±0.2) 0.3 (±0.1) 1.9 (±0.6) 1.5 (±0.4) 0.03 (±0.01) 1.5 (±1.1) 0.025
(±0.010) F. foliosa 7 7.6 (±1.6) 2.5 (±0.8) 0.6 (±0.4) 0.3 (±0.1) 2.6 (±0.8) 1.4 (±0.5) 0.02 (±0.01) 1.4 (±0.4) 0.024
(±0.017) F. pauciflora 2 15.4 (±4.7) 1.0 (±0.1) 0.7 (±0.8) 0.2 (±0.04) 0.1 (±0.02) 1.1 (±0.2) 0.06 (±0.01) 1.1 (±0.0) 0.018
(±0.002) F. subteres 2 3.0 (±2.1) 2.0 (±0.9) 0.3 (±0.1) 0.5 (±0.2) 1.3 (±1.3) 2.2 (±0.9) 0.04 (±0.01) 2.5 (±1.4) 0.034
(±0.001) All Frankenia
species 22 10.9 (±2.8) 1.6 (±0.3) 0.5 (±0.1) 0.4 (±0.1) 1.2 (±0.4) 1.9 (±0.3) 2.4 (±0.4) 0.027
(±0.006)

Chapter 5 Soil properties of Frankenia habitats
Larger-seeded
species Smaller-seeded
species All species Range
Number of populations 22 19 41 41
% sand 65.4 (±4.6) 73.8 (±3.4) 69.3 (±3.0) 25.0 – 96.3
% clay 22.3 (±3.4) 16.3 (±2.2) 19.6 (±2.1) 29.0 – 52.5
% <20μm particles 30.6 (±4.5) 25.0 (±3.2) 28.0 (±2.8) 3.7 – 70.0
EC (dS/m) 1.62 (±0.56) 3.11 (±0.77) 2.31 (±0.47) 0.04 – 11.40
Gypsum 0.37 (±0.24) 2.09 (±1.27) 1.17 (±0.61) 0.00 – 21.80
Carbonate (o) 0.5 (±0.2) 2.2 (±0.2) 0 – 3
Field capacity (Vol %) 21.9 (±1.6) 27.7 (±2.2) 24.6 (±1.4) 6.2 – 40.0
pH 8.22 (±0.13) 8.63 (±0.11) 8.40 (±0.09) 6.90 – 9.80
Calcium (cmol(+)/kg) 11.41 (±1.8) 20.75 (±5.3) 15.74 (±2.7) 2.92 – 93.65
Magnesium (cmol(+)/kg) 3.03 (±0.5) 7.60 (±2.0) 5.15 (±1.0) 0.33 – 28.14
Sodium (cmol(+)/kg) 7.65 (±2.1) 14.00 (±3.4) 10.60 (±2.0) 0.32 – 48.79
Potassium (cmol(+)/kg) 0.86 (±0.1) 0.66 (±0.1) 0.77 (±0.1) 0.12 – 2.28
Ca2+ : Mg2+ 5.0:1 9.2:1 6.85
Ca2+ : Na+ 3.9:1 4.7:1 4.24
K+ : Na+ 0.4:1 0.1:1 0.25
CEC (cmol(+)/kg) 22.95 (±3.4) 43.02 (±7.9) 32.25 (±4.3) 3.82 – 134.16
ESP (%) 27.6 (±4.2) 29.0 (±4.3) 28.3 (±3.0) 2.8 – 83.5
Table 3. Means (± s.e.) for soil properties examined for Australian Frankenia species overall and per seed
packaging strategy. Note that the smaller-seeded species includes two varieties of F. pauciflora (as per Craigie
2007). ‘Range’ indicates the minimum and maximum values recorded for all populations of Frankenia included
in this study.
95

Chapter 5 Soil properties of Frankenia habitats
Species N % sand % clay % <20μm Gypsum Carbonate (o) FC (Vol)% F. connata 1 80.0 * 12.5 * 15 * 0.00 * 0.00 * 6.0 * F. cordata 2 94.5 (±1.9) 3.7 (±0.8) 5.6 (±1.9) 0.00 0.00 26.0 (±10.0) F. eremophila 1 77.7* 13.8 * 22.3 * 0.40 * 3.0* 22.0 * F. foliosa 6 71.1 (±5.4) 13.7 (±2.9) 29.0 (±5.4) 6.6 (±3.5) 1.3 (±0.4) 18.0 (±1.5) F. gracilis 5 62.3 (±9.1) 23.3 (±5.4) 31.9 (±7.9) 0.0 0.00 24.4 (±1.5) F. latior 4 59.1(±10.0) 27.0 (±7.9) 35.0 (±10.5) 0.99 (±1.0) 0.3 (±0.3) 21.8 (±1.5) F. pauciflora f 3 83.7 (±2.3) 8.7 (±0.7) 16.2 (±2.3) 0.00 3.0 (±0.0) 34.3 (±1.2) F. pauciflora g 8 76.2 (±5.5) 17.2 (±4.5) 22.1 (±5.2) 0.00 2.6 (±0.3) 34.8 (±2.6) F. planifolia 1 84.8 * 8.9 * 15.2 * 0.00 * 0.00 * 30.0 * F. plicata 2 79.7 (±3.1) 12.5 (±1.2) 20.3 (±3.1) 0.00 0.00 35.0 (±3.0) F. serpyllifolia 4 36.9 (±4.8) 45.4 (±2.9) 60.7 (±4.7) 0.97(±0.0) 0.5 (±0.5) 21.8 (±2.8) F. sessilis 2 75.9 (±3.4) 8.7 9±0.4) 13.2 (±1.6) 0.00 2.0 (±0.0) 13.0 (±1.0) F. subteres 2 57.5 (±12.5) 20.0 (±0.)0 37.5 (±12.5) 0.00 2.0 (±0.0) 20.5 (±4.5)
Species EC (dS/m) pH Calcium cmol(+)/kg
Magnesium cmol(+)/kg
Sodium cmol(+)/kg
Potassium cmol(+)/kg
F. connata 0.12 * 8.50 * 4.8 * 0.5 * 0.7 * 0.3 * F. cordata 0.48 (±0.15) 8.65 (±0.05) 3.7 (±0.3) 0.8 (±0.1) 2.3 (±0.6) 0.5 (±0.0) F. eremophila 3.11 * 8.00 * 17.1 * 2.0 * 7.5 * 0.5 * F. foliosa 3.82 (±1.40) 8.48 (±0.28) 38.2 (±14.0) 6.7 (±4.4) 17.4 (±7.2) 0.5 (±0.2) F. gracilis 0.35 (±0.10) 8.38 (±0.34) 11.9 (±3.5) 2.4 (±0.8) 2.7 (±0.7) 0.8 (±0.2) F. latior 0.63 (±0.40) 7.88 (±0.35) 9.4 (±3.9) 3.1 (±1.0) 4.2 (±2.4) 0.6 (±0.1) F. pauciflora f 0.82 (±0.10) 8.80 (±0.06) 10.5 (±1.2) 2.5 (±0.7) 3.5 (±0.6) 0.3 (±0.0) F. pauciflora g 3.72 (±1.42) 8.70 (±0.14) 11.2 (±2.2) 11.7 (±3.7) 16.9 (±5.7) 0.9 (±0.3) F. planifolia 0.08 * 7.90 * 4.2 * 1.7 * 1.4 * 1.6 * F. plicata 1.45 (±1.01) 7.95 (±0.35) 8.8 (±2.3) 3.1 (±0.3) 9.5 (±6.8) 0.9 (±0.1) F. serpyllifolia 3.09 (±2.33) 8.25 (±0.47) 17.4 (±6.4) 4.5 (±2.2) 10.8 (±5.1) 1.1 (±0.2) F. sessilis 5.88 (±1.83) 8.40 (±0.20) 16.6 (±2.8) 5.9 (±1.6) 30.8 (±5.9) 1.3 (±0.7) F. subteres 2.03 (±1.62) 8.55 (±0.35) 21.1 (±13.5) 1.9 (±0.1) 8.0 (±5.7) 0.5 (±0.2)
Species Ca2+:Mg2+ Ca2+:Na+ K+:Na+ CEC cmol(+)/kg ESP (%) Seed mass (μg) F. connata 9.1:1 * 7.3:1* 0.5:1* 6.29 * 10.5 * 77 (±3) F. cordata 5.1:1 1.8:1 0.2:1 7.27 (±0.5) 31.3 (±6.3) 35 (±0.9) F. eremophila 8.4:1 * 2.3:1 * 0.1:1 * 27.12 * 27.7 * 45 (±0.8) F. foliosa 20.8:1 10.4:1 0.1:1 63.08 (±19.3) 25.8 (±10.0) 9 (±0.3) F. gracilis 5.7:1 7.3:1 0.6:1 17.92 (±4.5) 19.9 (±7.0) 75 (±2) F. latior 4.7:1 4.1:1 0.4:1 17.32 (±6.6) 18.7 (±5.0) 36 (±1) F. pauciflora f 4.6:1 3.0:1 0.1:1 16.78 (±2.4) 20.8 (±0.5 15 (±0.1) F. pauciflora g 1.4:1 1.4:1 0.1:1 40.69 (±9.4) 36.0 (±6.6) 11 (±0.9) F. planifolia 2.4:1 * 3.0:1 * 1.1:1 * 8.91 * 15.8 * 61 (±1) F. plicata 2.8:1 1.6:1 0.2:1 22.40 (±9.2) 36.1 (±15.5) 30 (±0.7) F. serpyllifolia 5.6:1 3.1:1 0.2:1 33.84 (±4.9) 32.8 (±17.0) 61 (±0.9) F. sessilis 2.9:1 0.5:1 0.0:1 54.52 (±10.9) 56.6 (±0.5) 72 (±18) F. subteres 11.9:1 2.9:1 0.1:1 31.50 (±19.3) 23.0 (±4.0) 15 (±0.6)
Table 4. Means (± s.e.) for soil properties sampled from populations included in this study. (*) denotes where
only 1 population for that species was sampled. ‘N’ is the number of populations sampled per species. Note the
two varieties of F. pauciflora – F. pauciflora var. fruticulosa and F. pauciflora var. gunnii – sensu Craigie
(2007).
96

Chapter 5 Soil properties of Frankenia habitats
-20.00 -10.00 0.00 10.00
Discriminant Function 1
-10.00
-5.00
0.00
5.00
Disc
rim
inan
t Sco
res F
unct
ion
2
A
AA
A
A
A
A
A
A
A
ë
ë
ë
ë
ë
ë
ë
ë
ë
ë
ë
1
111
1
1
23
44
5
666
77
8
8
99 9
Figure 1. Scatterplot generated by the first 2 Discriminant Function scores calculated to identify element
interaction effect that maximize the differences between the 20 Frankenia populations included in this study.
Open circles represent smaller-seeded species. Closed triangles represent larger-seeded species. Label numbers
represent species as follows: (1) F. foliosa, (2) F. pauciflora var. fruticulosa, (3) F. pauciflora var. gunnii, (4) F.
subteres, (5) F. eremophila, (6) F. gracilis, (7) F. latior, (8) F. serpyllifolia, and (9) F. sessilis.
97
Chapter 5 Soil properties of Frankenia habitats
-5.00 0.00 5.00 10.00
Discriminant Function 1
-5.00
-2.50
0.00
2.50
5.00
Disc
rim
inan
t Fun
ctio
n 2
A
A
A
A
ë
ë
ë
ë
ë
ë
AA
A
A
A
A
A
A
A
ëë
ë
ë
ë
ë
ë
ë
ë
ë
ë
A
A
A
A
A
A
A
A
Aë
ë
1
2
2
3
444
4
44
5 5555
6
6
66
7 77
8
8
8
88
888
9
1010
11 11
1111
12
12 1313
Figure 2. Scatterplot generated by the first 2 Discriminant Function scores calculated to identify soil property
interaction effect that maximize the differences between the 41 Frankenia populations included in this study.
Open circles represent larger-seeded species. Closed triangles represent smaller-seeded species. Label numbers
represent species as follows: (1) F. connata, (2) F. cordata, (3) F. eremophila, (4) F. foliosa, (5) F. gracilis, (6)
F. latior, (7) F. pauciflora var. fruticulosa, (8) F. pauciflora var. gunnii, (9) F. planifolia, (10) F. plicata, (11) F.
serpyllifolia, (12) F. sessilis, and (13) F. subteres.
98