Embed Size (px)
Citation preview
203
INTRODUCTION
The changes in land use has long been a prob-lem around Upper Citarum watershed in Bandung district, Indonesia. Declining forest covers oc-curred due to the opening of forest lands for dry farming land and the proliferation of illegal log-ging (Chaidar et al., 2017). Land use conversions often negatively affect the functioning of soil (Emadi et al., 2009; Raiesi and Beheshti, 2014; Saviozzi et al., 2001; Spohn and Giani, 2011). The forests provide soil fertility, soil erosion pro-tection and climate change mitigation (Aticho, 2013). Land conditions in the upper Citarum wa-tershed, have been increasingly critical in recent times, causing various problems, especially the high erosion that is considered to be one of the factors causing river sedimentation and triggering flood disaster. A critical land area that occurred
in the Upper Citarum watershed in 2013 reached 46,543 ha or 20.2% of total upstream area DAS, while in 2015, it increased to 136,872.68 ha or 59.3% of the entire area of an upstream watershed (Ministry of Agriculture, 2015).
Appropriate land management practices need-ed to reduce soil degradation and maintain better soil quality, decrease the critical land and increase land productivity. Agroforestry is a combination of forestry and agronomy to create harmony be-tween the intensification of agriculture and forest conservation (King, 1979, 1976). Agroforestry constitutes the land use systems in which trees or shrubs are grown together with crops, pastures or livestock, and provide an ecological and econom-ic interaction (Young, 1989).
The agroforestry system has been evolving under the influence of various biophysical and socioeconomic factors. Multiple forms of agro-
Journal of Ecological Engineering Received: 2018.07.19Revised: 2018.08.03
Accepted: 2018.09.15Available online: 2018.11.01
Volume 20, Issue 1, January 2019, pages 203–213https://doi.org/10.12911/22998993/93942
Soil Quality under Agroforestry Trees Pattern in Upper Citarum Watershed, Indonesia
Asep Mulyono1,2*, Abraham Suriadikusumah1, Rachmat Harriyanto1, Muhammad Rahman Djuwansah2
1 Soil Science and Land Resources Department, Faculty of Agriculture, Padjadjaran University, Sumedang, 45363, West Java, Indonesia
2 Research Center for Geotechnology, Indonesian Institute of Sciences, Bandung, 40135, West Java, Indonesia
* Corresponding author’s e-mail: [email protected]
ABSTRACT This paper discusses the setting up of a multivariate statistical method in selecting the useful soil quality indica-tors for soil quality assessment under agroforestry pattern. The of soil quality has been recognized as a tool to determine the sustainability of land resources, especially in agroforestry development. The study was carried out at Upper Citarum Watershed of Bandung district, West Java province, Indonesia. The soil samples were taken with purposive sampling under agroforestry pattern. Principal component analysis (PCA) was used as the multivariate statistical method to identify the minimum data set (MDS); scoring of each indicator, and data integration in the index of soil quality. The MDS consisted of four soil chemical indicators and represented 83.6% of the variability of data, i.e., pH, and exchangeable Calcium (exch Ca), organic Carbon (org C), and exchangeable Natrium (exch Na) respectively. The soil quality index (SQI) was categorized under agroforestry pattern as moderate. The artifi-cial agroforestry-based coffee with an intercropping system (timber woods, multi purpose trees and horticultures) provides better soil quality.
Keywords: soil quality, agroforestry, multivariate assessment, PCA, upper citarum watershed.
Journal of Ecological Engineering Vol. 20(1), 2019
204
forestry have long been known in the local land use systems (agroforest) in the Upper Citarum watershed. The locally known kebon tatangkalan is one of the most typical ones and has long been playing a significant role in the entire production system of the agricultural landscape (De Foresta and Michon, 1996; Michon and de Foresta, 1999; Parikesit et al., 2005). The agroforestry was used to increase the land productivity with multi pur-pose tree species, relay-cropping, terracing and contour cultivation, strip and alley cropping (Acharya and Kafle, 2009). The agroforestry sys-tem has the potential to reduce runoff and erosion, maintain better soil organic matter, which im-proves the fertility status of the soil (Nair, 1998). Agroforestry has the potential to maintain the land productivity, and soil fertility, adding to the economic contribution of farmer, also providing a positive impact on the conservation aspect (Hai-riah et al., 2006; León and Osorio, 2014). The soil fertility under agroforestry was high compared to cropland (Kassa et al., 2017) and enhanced the content of natural degradable components in the organic matter (Marinho et al., 2014).
Agroforestry in the Upper Citarum watershed is currently declining from the landscape due to population growth and rapid regional economic development. Serious effort to revitalize this tra-
ditional agroforest is needed to prevent its disap-pearance (Parikesit et al., 2005). However, the dense and critical land in the Upper Citarum wa-tershed has been converted to agroforestry in the last decades. In order to build the agroforestry system in Upper Citarum watershed, evaluating the current condition of soil quality comprehen-sively becomes a necessity to determine the next conservation action.
Soil quality index (SQI) has been recognized as a tool for determining the sustainability of land resources (Karlen et al., 2003). Some researchers have evaluated and proposed various soil quality indicators that readily measured the changes of soil condition (Doran and Parkin, 1994; Karlen et al., 1998; Larson and Pierce, 1994). There are two methods of calculating the soil quality index that is Expert Judgment and Principal Components Analysis (Laishram et al., 2012). The multivariate statistical technique has widely been used for se-lecting effective soil quality indicators. The prin-cipal components analysis (PCA) method is a tool in data reduction to select some of the potential indicators (Qi et al., 2009). The objectives of this study were to find the soil quality indicators with a multivariate statistical method for soil quality assessment and to evaluate the soil quality index (SQI) under the agroforestry pattern.
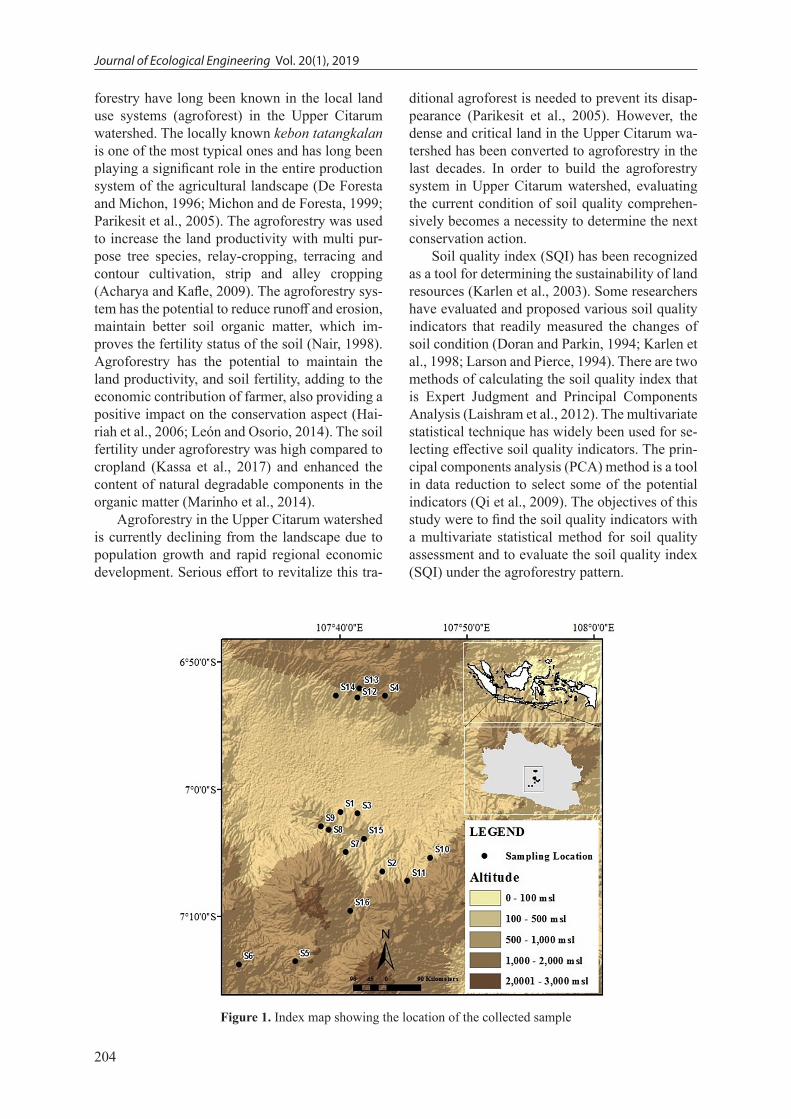
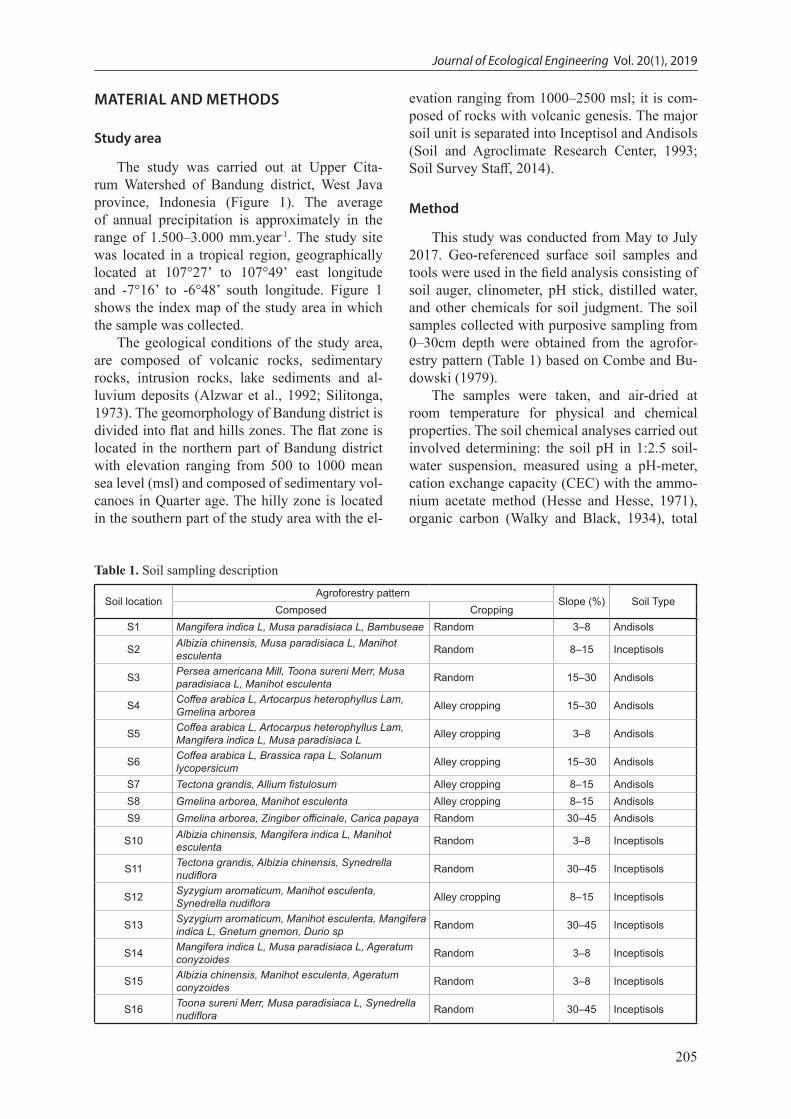
Figure 1. Index map showing the location of the collected sample
205
Journal of Ecological Engineering Vol. 20(1), 2019
MATERIAL AND METHODS
Study area
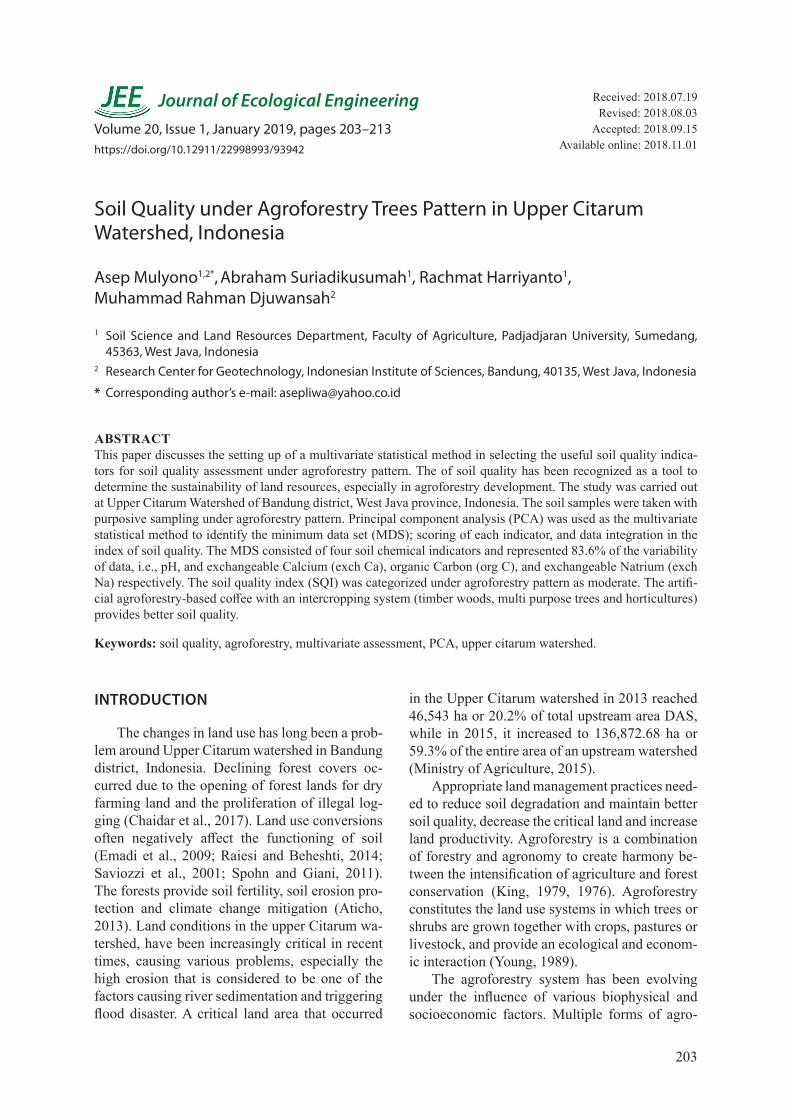
The study was carried out at Upper Cita-rum Watershed of Bandung district, West Java province, Indonesia (Figure 1). The average of annual precipitation is approximately in the range of 1.500–3.000 mm.year-1. The study site was located in a tropical region, geographically located at 107°27’ to 107°49’ east longitude and -7°16’ to -6°48’ south longitude. Figure 1 shows the index map of the study area in which the sample was collected.
The geological conditions of the study area, are composed of volcanic rocks, sedimentary rocks, intrusion rocks, lake sediments and al-luvium deposits (Alzwar et al., 1992; Silitonga, 1973). The geomorphology of Bandung district is divided into flat and hills zones. The flat zone is located in the northern part of Bandung district with elevation ranging from 500 to 1000 mean sea level (msl) and composed of sedimentary vol-canoes in Quarter age. The hilly zone is located in the southern part of the study area with the el-
evation ranging from 1000–2500 msl; it is com-posed of rocks with volcanic genesis. The major soil unit is separated into Inceptisol and Andisols (Soil and Agroclimate Research Center, 1993; Soil Survey Staff, 2014).
Method
This study was conducted from May to July 2017. Geo-referenced surface soil samples and tools were used in the field analysis consisting of soil auger, clinometer, pH stick, distilled water, and other chemicals for soil judgment. The soil samples collected with purposive sampling from 0–30cm depth were obtained from the agrofor-estry pattern (Table 1) based on Combe and Bu-dowski (1979).
The samples were taken, and air-dried at room temperature for physical and chemical properties. The soil chemical analyses carried out involved determining: the soil pH in 1:2.5 soil-water suspension, measured using a pH-meter, cation exchange capacity (CEC) with the ammo-nium acetate method (Hesse and Hesse, 1971), organic carbon (Walky and Black, 1934), total
Table 1. Soil sampling description
Soil locationAgroforestry pattern
Slope (%) Soil TypeComposed Cropping
S1 Mangifera indica L, Musa paradisiaca L, Bambuseae Random 3–8 Andisols
S2 Albizia chinensis, Musa paradisiaca L, Manihot esculenta Random 8–15 Inceptisols
S3 Persea americana Mill, Toona sureni Merr, Musa paradisiaca L, Manihot esculenta Random 15–30 Andisols
S4 Coffea arabica L, Artocarpus heterophyllus Lam, Gmelina arborea Alley cropping 15–30 Andisols
S5 Coffea arabica L, Artocarpus heterophyllus Lam, Mangifera indica L, Musa paradisiaca L Alley cropping 3–8 Andisols
S6 Coffea arabica L, Brassica rapa L, Solanum lycopersicum Alley cropping 15–30 Andisols
S7 Tectona grandis, Allium fistulosum Alley cropping 8–15 AndisolsS8 Gmelina arborea, Manihot esculenta Alley cropping 8–15 AndisolsS9 Gmelina arborea, Zingiber officinale, Carica papaya Random 30–45 Andisols
S10 Albizia chinensis, Mangifera indica L, Manihot esculenta Random 3–8 Inceptisols
S11 Tectona grandis, Albizia chinensis, Synedrella nudiflora Random 30–45 Inceptisols
S12 Syzygium aromaticum, Manihot esculenta, Synedrella nudiflora Alley cropping 8–15 Inceptisols
S13 Syzygium aromaticum, Manihot esculenta, Mangifera indica L, Gnetum gnemon, Durio sp Random 30–45 Inceptisols
S14 Mangifera indica L, Musa paradisiaca L, Ageratum conyzoides Random 3–8 Inceptisols
S15 Albizia chinensis, Manihot esculenta, Ageratum conyzoides Random 3–8 Inceptisols
S16 Toona sureni Merr, Musa paradisiaca L, Synedrella nudiflora Random 30–45 Inceptisols
Journal of Ecological Engineering Vol. 20(1), 2019
206
nitrogen using the Kjeldahl method (Bremner et al., 1996), available phosphorus (Olsen, 1954), available-K using a flamephotometer method, ex-changeable potassium (K), sodium (Na), calcium (Ca), magnesium (Mg) by means of the ammo-nium acetate (1 M NH4OAc at pH 7) extraction method. Soil chemical categorizing was based on the soil chemical standard (Indonesian Soil Research Institute, 2005).
All statistical analysis were performed by means of PAST v.3.18 software (Hammer et al., 2001). In order to synthesize all of the selected parameters, a soil quality index (SQI) was as-sessed by scoring of chosen variables. Determi-nation of the weight of each determinant of soil quality, SQI was calculated using the formula (Andrews et al., 2004; Qi et al., 2009) with the following equation :
𝑆𝑆𝑆𝑆𝑆𝑆 =∑(𝑊𝑊𝑖𝑖 + 𝑆𝑆𝑖𝑖)𝑛𝑛
𝑖𝑖=1 (1)
where Wi = the assigned a weight of each indica-tor, which is gained from a selected prin-cipal component,
Si = the score of the indicator, n = the number of variables in the refined
minimum data set (MDS).
SQI classification was used to determine soil quality status in the study site (Cantú et al., 2007). The high score of SQI indicates that the soil has high quality (Table 2).
RESULT AND DISCUSSION
Soil Attributes
The soil in the study area is composed by 3–31% of sand particles, 12–68% of silt particles and 27–83% of clay particles. The soil texture in the study area was 69% clay (S1, S2, S3, S5, S6, S7, S8, S9, S10, S15, and S16), 25% silty clay
loam (S11, S12, S13, S14), and 6% clay loam (S4). The categorized soil pH was acidic (<5.5) and slightly acidic (5.5–6.5) for all location. The ocation S7 had the lowest value of pH and the maximum pH showed in location S1. Total nitro-gen considered as low to moderate, with the low-est concentration in the location S3 and the maxi-mum showed in the location S4. Organic carbon (org C) was low (2–3%) in the locations S1, S3, S5, S7, S12, and S16, moderate (2–3%) in the lo-cations S2, S6, S9, S14, and S15 and high (2–3%) in the locations S4, S8, and S13.
The available phosphorus (Av-P) was high (41–60 ppm) in the locations S2, S3, S8, and S12 and very high (>60 ppm) in the rest. The avail-able potassium (av-K) was low (10–20 ppm) in the locations S2, S3, S7, S11, and S13, moder-ate (>20–40 ppm) in the locations S14, high (40–60 ppm) in the locations S4, S5, S6, and S13 and very high (>60 ppm) in the rest. The ex-changeable magnesium (exch Mg) in all locations was high (>8 cmol.kg-1). The exchangeable cal-cium (exch Ca) was moderate (6–10 cmol.kg-1) in the locations S1, S2, S8, S9, S11, S15, and S16 and high (>10–20 cmol.kg-1) in the rest.
The exchangeable potassium (exch K) was low (0.1–0.3 cmol.kg-1) in the locations S2, S3, S7, S8, S10, and S14, moderate (>0.3–0.5 cmol.kg-1) in the locations S1, S9, and S15 and high (>0.6–1.0 cmol.kg-1) in the locations S6, S11, S12, S13, and S16, very high (>1.0 cmol.kg-1) in the rest. Base saturation (BS) in all locations was very high (>80%) and cation exchange capacity (CEC) was considered as very low (<5 cmol.kg-1) in the locations S2 and S16, low (5–16 cmol.kg-1) in the locations S1, moderate (>16–25 cmol.kg-1) in the locations S2, S5, S6, S8, S9, S11, S13, and S15, high (>25–40 cmol.kg-1) in the locations S3, S7, S10, and S14.
The statistical methods were applied regard-ing the correlation and classification among the selected soil. The basic statistical analysis was used to determine minimum, mean, maximum, standard deviation, a coefficient of variation (CV), and skewness (Table 3). The coefficient of variation (CV) is classified as weak variability if CV<10%, moderate variability if CV ranged 10–100% and strong variability if CV>100% (Jin et al., 2015). In this study, CV ranged from 10–100%, which is classified as weak to moder-ate variability. Table 3 shows the soil chemical statistical results. The pH was classified as weak variability with CV<10% and other variables
Table 2. Soil quality index (SQI) classification
No SQI Classification SQI Score
1 Very good 0.80 – 1.00
2 Good 0.60 – 0.79
3 Moderate 0.35 – 0.59
4 Low 0.20 – 0.34
5 Very low 0.00 – 0.19
207
Journal of Ecological Engineering Vol. 20(1), 2019
were classified as moderate variability with CV ranging within 10–100%.
The pH and org C have smaller mean val-ues instead of their median values, correspond-ing with their negative skewness. Furthermore, all indicators except pH and org C, have greater mean values instead of their median values, cor-responding with their positive skewness. The av K and exch K exhibit larger variation than other indicators due to their higher CV values. The maximum values of av K and exch K were found in soil with agroforestry composed by Artocar-pus heterophyllus Lam, Coffea arabica L, Man-gifera indica L, Musa paradisiaca L with slope ranged 3–8% (S5). Furthermore, the minimum CV values represented by pH were observed in S7 by mixed food crops (Allium fistulosum) and wood crops (Tectona grandis).
The relationship between soil chemical variables
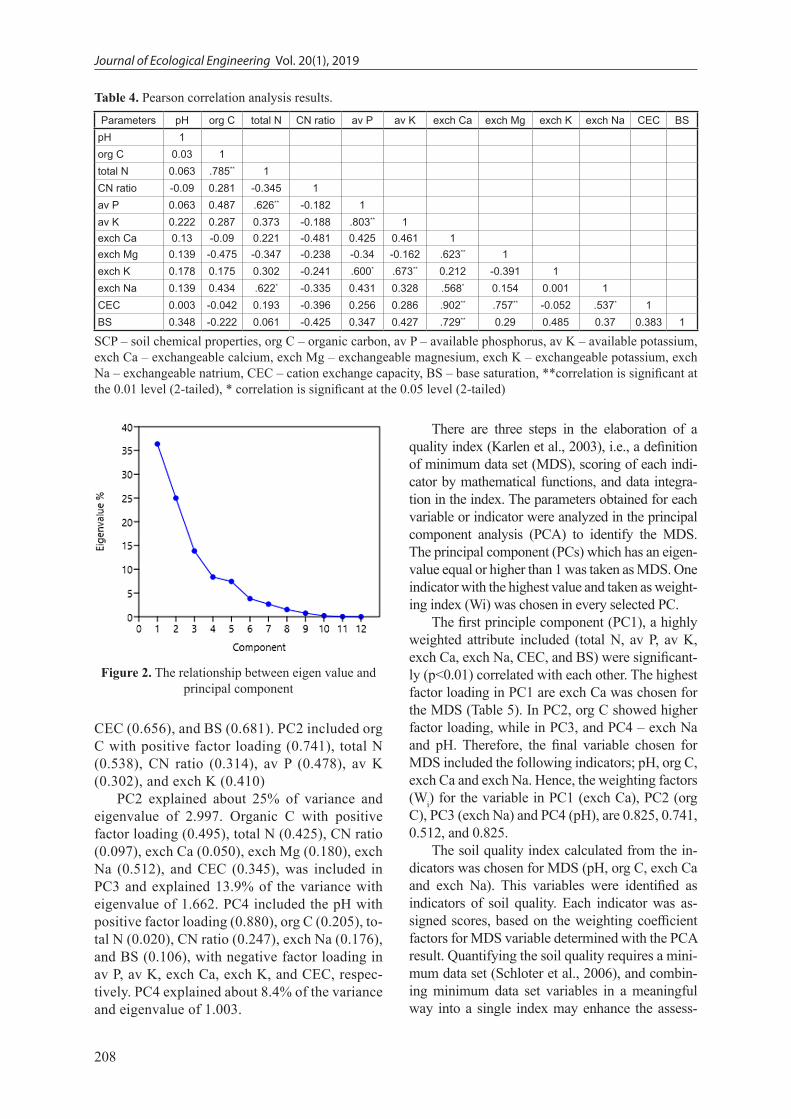
Pearson correlation analysis results of soil chemical data are performed with the confidence level 95% and 99%, to determine the relationship between variables (Li et al., 2013) as described in Table 4. Among the total concentration re-sults, several variables have a positive correla-tion with others. On the other hand, several vari-ables have negative correlation, which indicates that the indicators negatively affect each other. In Table 4, there were positive correlations at sig-nificant levels <0.01 among variables, i.e. total N–org C (0.785), Av-P–total N (0.626), Av K–Av-P (0.803), exch Mg–exch Ca (0.623), exch
K–av K (0.600), CEC–exch Ca (0.902), CEC–exch Mg (0.757), and BS–exch Ca (0.729). Furthermore, positive correlations at significant levels <0.05 among variables, i.e. total exch K–av P (0.600), exch Ca–total N (0.622), exch Na–exch Ca (0.568), and CEC–exch Na (0.537). The highest correlation was between CEC-av Ca (0.902 at significant levels <0.01) and the lowest correlation showed between CEC av Na (0.537) at significant levels <0.05.
PCA, MDS, and SQI clustering
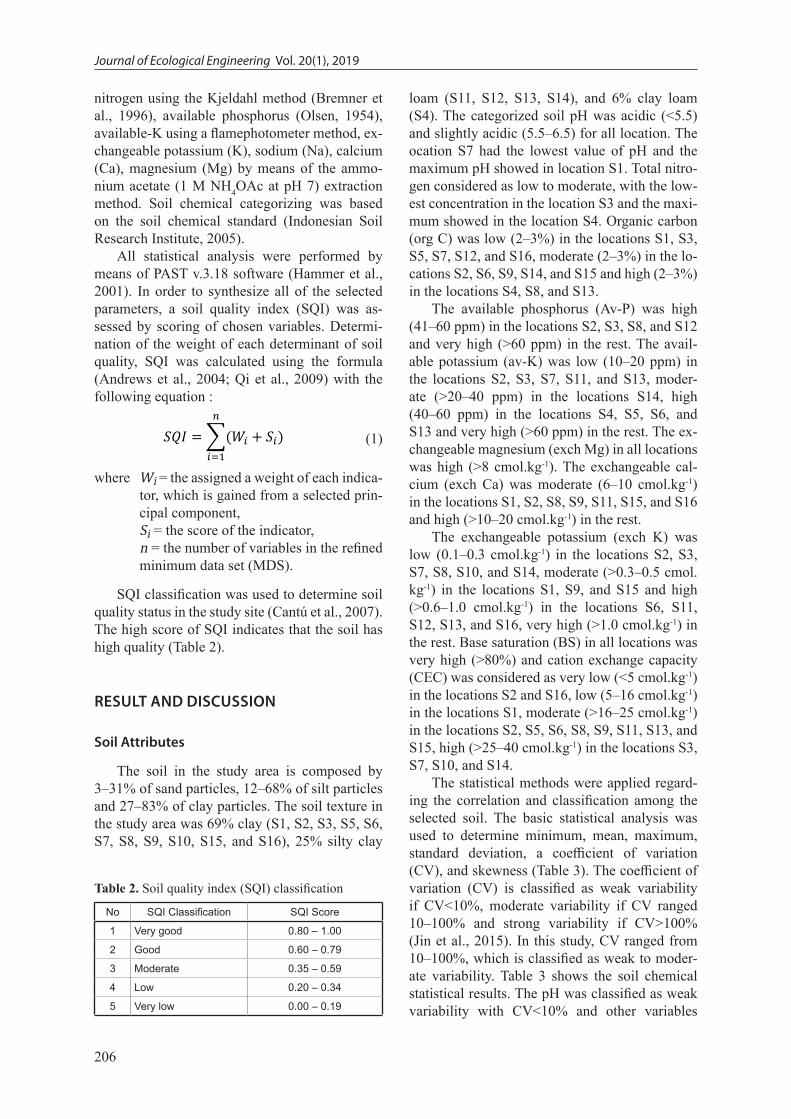
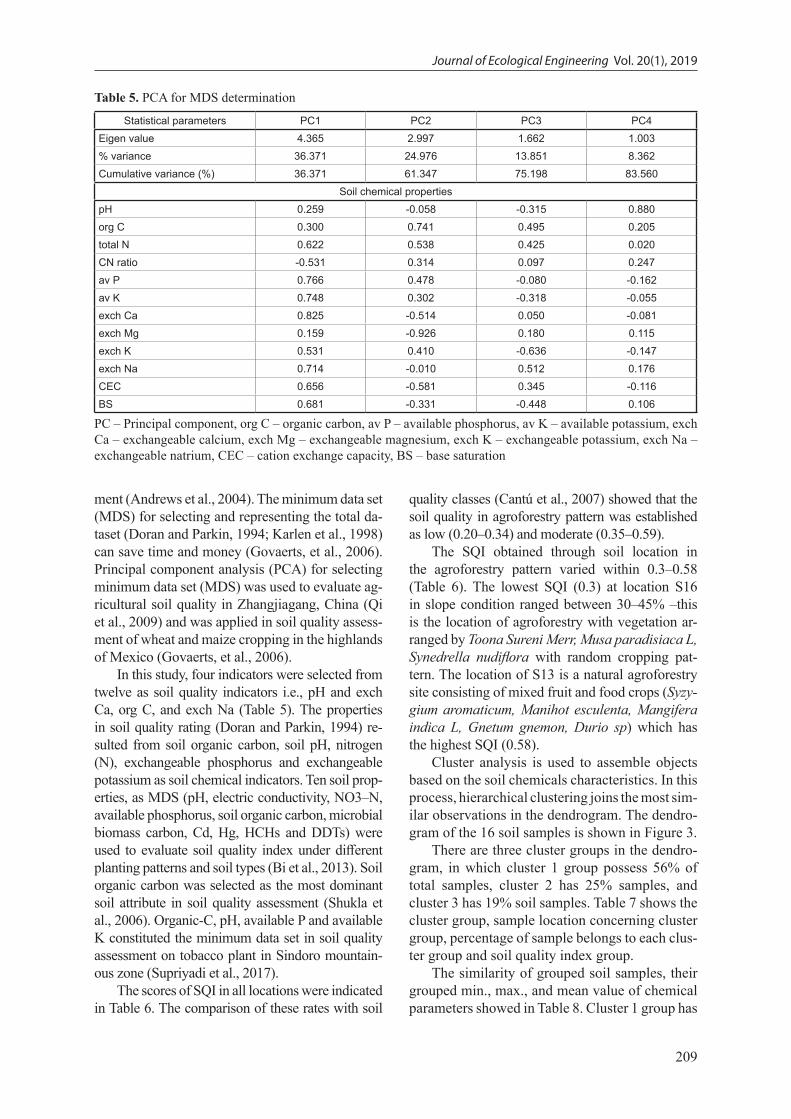
The relationship between the eigenvalue and principal components (PCs) is shown in Figure 2, with an increase in PC, there is a correspond-ing decrease in the eigenvalue. In Figure 2, the increase in PCs up to 4, there was a steep de-cline in eigenvalue. However, after the increase in PC from 4 to 12, there was a gradual decline in the eigenvalue.
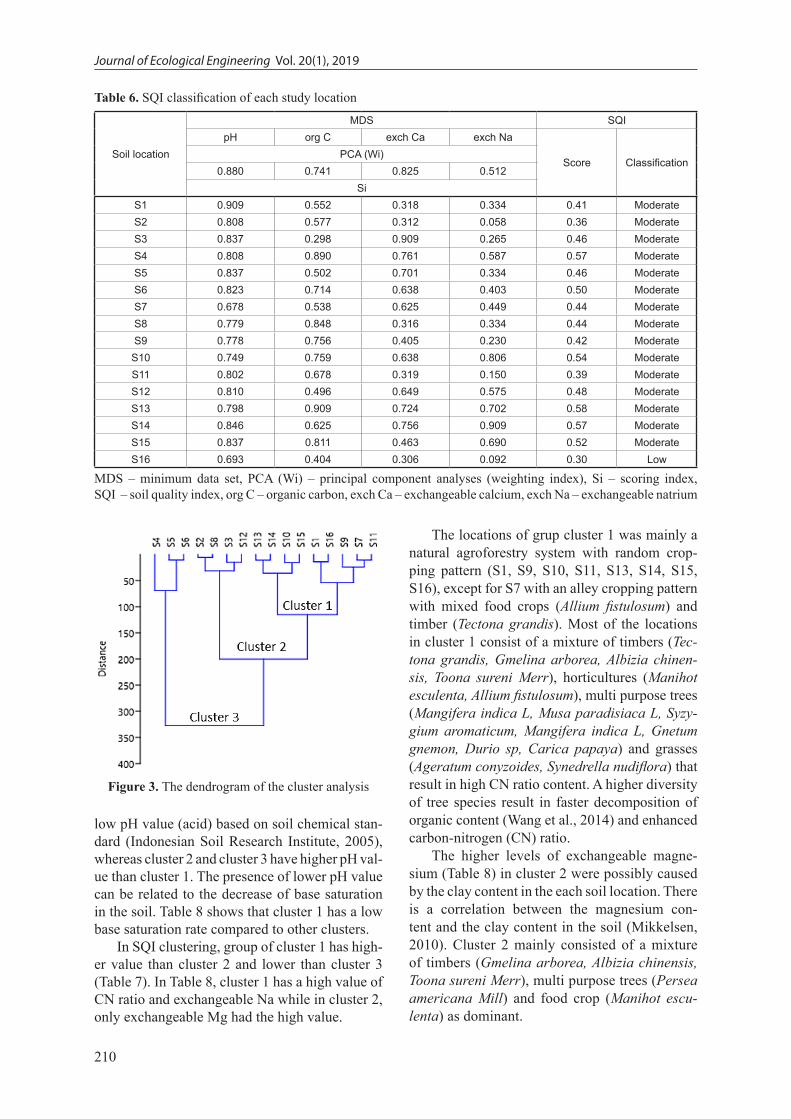
The PCs with the eigenvalue >1 were se-lected for interpretation, and the PCs receiving high eigenvalue and variable with a high weight or factor loading were considered to best repre-sent the soil indicators (Andrews et al., 2004; Brejda et al., 2000). The PCs which were eli-gible as data set included PC1 to PC4 (eigen value ≥1), and represented 83.6% of the data variability (Table 5). PC1 with an eigenvalue of 4.365, explained about 36.4% of the variance (Table 5). The pH with positive factor loading (0.256), org C (0.300), total N (0.622), av P (0.766), av K (0.748), exch Ca (0.825), exch Mg (0.159), exch K (0.531), exch Na (0.714),
Table 3. Soil chemical statistical analysis results.
Parameters Min Max Mean SD Skewness CVpH 4.70 6.30 5.54 0.39 -0.64 7.13org C 1.07 3.26 2.32 0.64 -0.25 27.49total N 0.14 0.40 0.23 0.07 0.87 31.54CN ratio 8.00 17.00 10.19 2.26 1.84 22.16av P 41.65 324.20 141.53 82.17 0.61 58.06av K 8.31 52.16 22.41 15.82 0.83 70.58exch Ca 6.05 17.99 10.93 3.98 0.02 36.40exch Mg 2.33 6.72 3.36 1.12 2.04 33.32exch K 0.12 1.29 0.52 0.38 0.61 72.75exch Na 0.05 0.79 0.38 0.22 0.33 59.31CEC 15.98 36.29 23.35 5.73 0.69 24.55BS 50.00 83.00 64.19 9.62 0.34 14.99
SD – standard deviation, CV – coefficient of variation, org C – organic carbon, av P – available phosphorus, av K – available potassium, exch Ca – exchangeable calcium, exch Mg – exchangeable magnesium, exch K – exchange-able potassium, exch Na – exchangeable natrium, CEC – cation exchange capacity, BS – base saturation.
Journal of Ecological Engineering Vol. 20(1), 2019
208
CEC (0.656), and BS (0.681). PC2 included org C with positive factor loading (0.741), total N (0.538), CN ratio (0.314), av P (0.478), av K (0.302), and exch K (0.410)
PC2 explained about 25% of variance and eigenvalue of 2.997. Organic C with positive factor loading (0.495), total N (0.425), CN ratio (0.097), exch Ca (0.050), exch Mg (0.180), exch Na (0.512), and CEC (0.345), was included in PC3 and explained 13.9% of the variance with eigenvalue of 1.662. PC4 included the pH with positive factor loading (0.880), org C (0.205), to-tal N (0.020), CN ratio (0.247), exch Na (0.176), and BS (0.106), with negative factor loading in av P, av K, exch Ca, exch K, and CEC, respec-tively. PC4 explained about 8.4% of the variance and eigenvalue of 1.003.
There are three steps in the elaboration of a quality index (Karlen et al., 2003), i.e., a definition of minimum data set (MDS), scoring of each indi-cator by mathematical functions, and data integra-tion in the index. The parameters obtained for each variable or indicator were analyzed in the principal component analysis (PCA) to identify the MDS. The principal component (PCs) which has an eigen-value equal or higher than 1 was taken as MDS. One indicator with the highest value and taken as weight-ing index (Wi) was chosen in every selected PC.
The first principle component (PC1), a highly weighted attribute included (total N, av P, av K, exch Ca, exch Na, CEC, and BS) were significant-ly (p<0.01) correlated with each other. The highest factor loading in PC1 are exch Ca was chosen for the MDS (Table 5). In PC2, org C showed higher factor loading, while in PC3, and PC4 – exch Na and pH. Therefore, the final variable chosen for MDS included the following indicators; pH, org C, exch Ca and exch Na. Hence, the weighting factors (Wi) for the variable in PC1 (exch Ca), PC2 (org C), PC3 (exch Na) and PC4 (pH), are 0.825, 0.741, 0.512, and 0.825.
The soil quality index calculated from the in-dicators was chosen for MDS (pH, org C, exch Ca and exch Na). This variables were identified as indicators of soil quality. Each indicator was as-signed scores, based on the weighting coefficient factors for MDS variable determined with the PCA result. Quantifying the soil quality requires a mini-mum data set (Schloter et al., 2006), and combin-ing minimum data set variables in a meaningful way into a single index may enhance the assess-
Table 4. Pearson correlation analysis results.
Parameters pH org C total N CN ratio av P av K exch Ca exch Mg exch K exch Na CEC BSpH 1org C 0.03 1total N 0.063 .785** 1CN ratio -0.09 0.281 -0.345 1av P 0.063 0.487 .626** -0.182 1av K 0.222 0.287 0.373 -0.188 .803** 1exch Ca 0.13 -0.09 0.221 -0.481 0.425 0.461 1exch Mg 0.139 -0.475 -0.347 -0.238 -0.34 -0.162 .623** 1exch K 0.178 0.175 0.302 -0.241 .600* .673** 0.212 -0.391 1exch Na 0.139 0.434 .622* -0.335 0.431 0.328 .568* 0.154 0.001 1CEC 0.003 -0.042 0.193 -0.396 0.256 0.286 .902** .757** -0.052 .537* 1BS 0.348 -0.222 0.061 -0.425 0.347 0.427 .729** 0.29 0.485 0.37 0.383 1
SCP – soil chemical properties, org C – organic carbon, av P – available phosphorus, av K – available potassium, exch Ca – exchangeable calcium, exch Mg – exchangeable magnesium, exch K – exchangeable potassium, exch Na – exchangeable natrium, CEC – cation exchange capacity, BS – base saturation, **correlation is significant at the 0.01 level (2-tailed), * correlation is significant at the 0.05 level (2-tailed)
Figure 2. The relationship between eigen value and principal component
209
Journal of Ecological Engineering Vol. 20(1), 2019
ment (Andrews et al., 2004). The minimum data set (MDS) for selecting and representing the total da-taset (Doran and Parkin, 1994; Karlen et al., 1998) can save time and money (Govaerts, et al., 2006). Principal component analysis (PCA) for selecting minimum data set (MDS) was used to evaluate ag-ricultural soil quality in Zhangjiagang, China (Qi et al., 2009) and was applied in soil quality assess-ment of wheat and maize cropping in the highlands of Mexico (Govaerts, et al., 2006).
In this study, four indicators were selected from twelve as soil quality indicators i.e., pH and exch Ca, org C, and exch Na (Table 5). The properties in soil quality rating (Doran and Parkin, 1994) re-sulted from soil organic carbon, soil pH, nitrogen (N), exchangeable phosphorus and exchangeable potassium as soil chemical indicators. Ten soil prop-erties, as MDS (pH, electric conductivity, NO3–N, available phosphorus, soil organic carbon, microbial biomass carbon, Cd, Hg, HCHs and DDTs) were used to evaluate soil quality index under different planting patterns and soil types (Bi et al., 2013). Soil organic carbon was selected as the most dominant soil attribute in soil quality assessment (Shukla et al., 2006). Organic-C, pH, available P and available K constituted the minimum data set in soil quality assessment on tobacco plant in Sindoro mountain-ous zone (Supriyadi et al., 2017).
The scores of SQI in all locations were indicated in Table 6. The comparison of these rates with soil
quality classes (Cantú et al., 2007) showed that the soil quality in agroforestry pattern was established as low (0.20–0.34) and moderate (0.35–0.59).
The SQI obtained through soil location in the agroforestry pattern varied within 0.3–0.58 (Table 6). The lowest SQI (0.3) at location S16 in slope condition ranged between 30–45% –this is the location of agroforestry with vegetation ar-ranged by Toona Sureni Merr, Musa paradisiaca L, Synedrella nudiflora with random cropping pat-tern. The location of S13 is a natural agroforestry site consisting of mixed fruit and food crops (Syzy-gium aromaticum, Manihot esculenta, Mangifera indica L, Gnetum gnemon, Durio sp) which has the highest SQI (0.58).
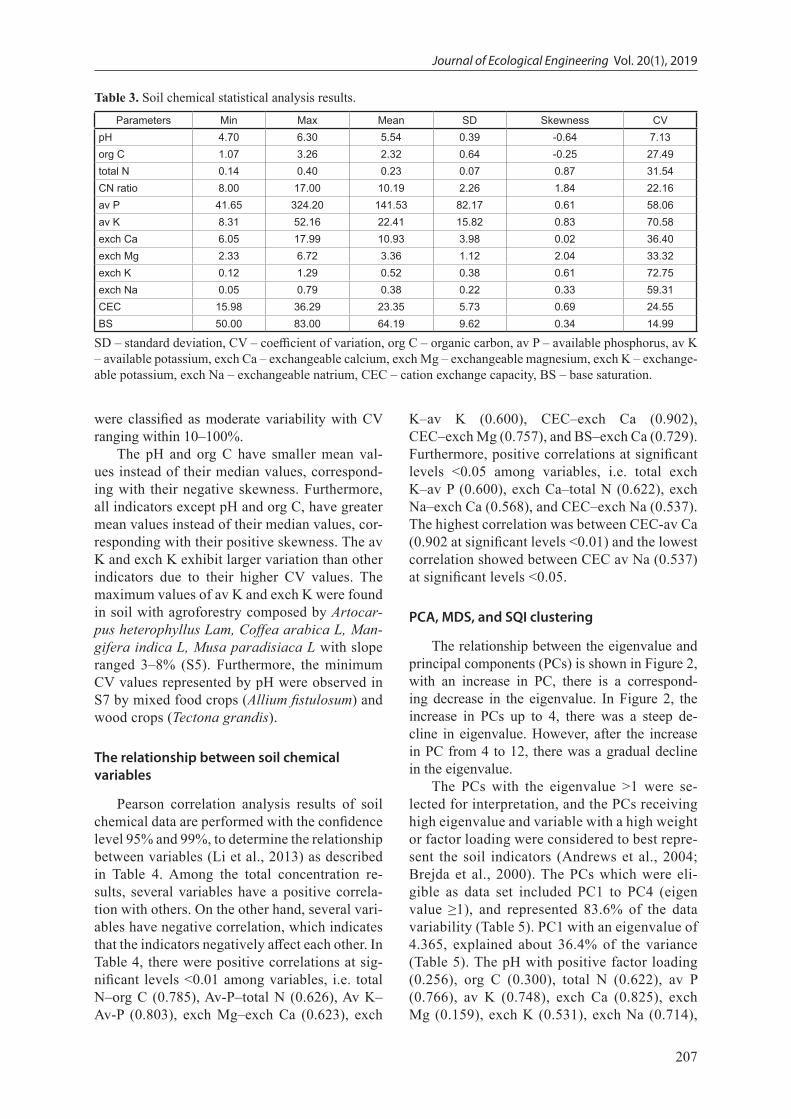
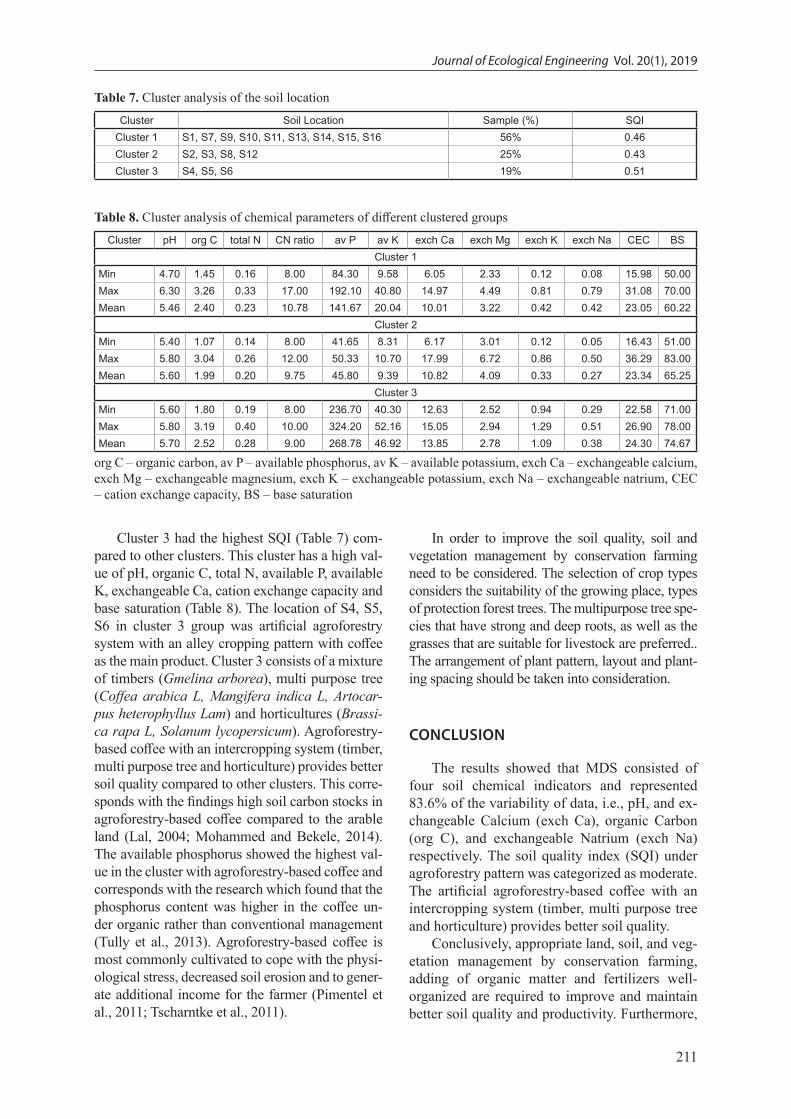
Cluster analysis is used to assemble objects based on the soil chemicals characteristics. In this process, hierarchical clustering joins the most sim-ilar observations in the dendrogram. The dendro-gram of the 16 soil samples is shown in Figure 3.
There are three cluster groups in the dendro-gram, in which cluster 1 group possess 56% of total samples, cluster 2 has 25% samples, and cluster 3 has 19% soil samples. Table 7 shows the cluster group, sample location concerning cluster group, percentage of sample belongs to each clus-ter group and soil quality index group.
The similarity of grouped soil samples, their grouped min., max., and mean value of chemical parameters showed in Table 8. Cluster 1 group has
Table 5. PCA for MDS determination
Statistical parameters PC1 PC2 PC3 PC4Eigen value 4.365 2.997 1.662 1.003% variance 36.371 24.976 13.851 8.362Cumulative variance (%) 36.371 61.347 75.198 83.560
Soil chemical propertiespH 0.259 -0.058 -0.315 0.880org C 0.300 0.741 0.495 0.205total N 0.622 0.538 0.425 0.020CN ratio -0.531 0.314 0.097 0.247av P 0.766 0.478 -0.080 -0.162av K 0.748 0.302 -0.318 -0.055exch Ca 0.825 -0.514 0.050 -0.081exch Mg 0.159 -0.926 0.180 0.115exch K 0.531 0.410 -0.636 -0.147exch Na 0.714 -0.010 0.512 0.176CEC 0.656 -0.581 0.345 -0.116BS 0.681 -0.331 -0.448 0.106
PC – Principal component, org C – organic carbon, av P – available phosphorus, av K – available potassium, exch Ca – exchangeable calcium, exch Mg – exchangeable magnesium, exch K – exchangeable potassium, exch Na – exchangeable natrium, CEC – cation exchange capacity, BS – base saturation
Journal of Ecological Engineering Vol. 20(1), 2019
210
low pH value (acid) based on soil chemical stan-dard (Indonesian Soil Research Institute, 2005), whereas cluster 2 and cluster 3 have higher pH val-ue than cluster 1. The presence of lower pH value can be related to the decrease of base saturation in the soil. Table 8 shows that cluster 1 has a low base saturation rate compared to other clusters.
In SQI clustering, group of cluster 1 has high-er value than cluster 2 and lower than cluster 3 (Table 7). In Table 8, cluster 1 has a high value of CN ratio and exchangeable Na while in cluster 2, only exchangeable Mg had the high value.
The locations of grup cluster 1 was mainly a natural agroforestry system with random crop-ping pattern (S1, S9, S10, S11, S13, S14, S15, S16), except for S7 with an alley cropping pattern with mixed food crops (Allium fistulosum) and timber (Tectona grandis). Most of the locations in cluster 1 consist of a mixture of timbers (Tec-tona grandis, Gmelina arborea, Albizia chinen-sis, Toona sureni Merr), horticultures (Manihot esculenta, Allium fistulosum), multi purpose trees (Mangifera indica L, Musa paradisiaca L, Syzy-gium aromaticum, Mangifera indica L, Gnetum gnemon, Durio sp, Carica papaya) and grasses (Ageratum conyzoides, Synedrella nudiflora) that result in high CN ratio content. A higher diversity of tree species result in faster decomposition of organic content (Wang et al., 2014) and enhanced carbon-nitrogen (CN) ratio.
The higher levels of exchangeable magne-sium (Table 8) in cluster 2 were possibly caused by the clay content in the each soil location. There is a correlation between the magnesium con-tent and the clay content in the soil (Mikkelsen, 2010). Cluster 2 mainly consisted of a mixture of timbers (Gmelina arborea, Albizia chinensis, Toona sureni Merr), multi purpose trees (Persea americana Mill) and food crop (Manihot escu-lenta) as dominant.
Table 6. SQI classification of each study location
Soil location
MDS SQIpH org C exch Ca exch Na
Score ClassificationPCA (Wi)
0.880 0.741 0.825 0.512Si
S1 0.909 0.552 0.318 0.334 0.41 ModerateS2 0.808 0.577 0.312 0.058 0.36 ModerateS3 0.837 0.298 0.909 0.265 0.46 ModerateS4 0.808 0.890 0.761 0.587 0.57 ModerateS5 0.837 0.502 0.701 0.334 0.46 ModerateS6 0.823 0.714 0.638 0.403 0.50 ModerateS7 0.678 0.538 0.625 0.449 0.44 ModerateS8 0.779 0.848 0.316 0.334 0.44 ModerateS9 0.778 0.756 0.405 0.230 0.42 Moderate
S10 0.749 0.759 0.638 0.806 0.54 ModerateS11 0.802 0.678 0.319 0.150 0.39 ModerateS12 0.810 0.496 0.649 0.575 0.48 ModerateS13 0.798 0.909 0.724 0.702 0.58 ModerateS14 0.846 0.625 0.756 0.909 0.57 ModerateS15 0.837 0.811 0.463 0.690 0.52 ModerateS16 0.693 0.404 0.306 0.092 0.30 Low
MDS – minimum data set, PCA (Wi) – principal component analyses (weighting index), Si – scoring index, SQI – soil quality index, org C – organic carbon, exch Ca – exchangeable calcium, exch Na – exchangeable natrium
Figure 3. The dendrogram of the cluster analysis
211
Journal of Ecological Engineering Vol. 20(1), 2019
Cluster 3 had the highest SQI (Table 7) com-pared to other clusters. This cluster has a high val-ue of pH, organic C, total N, available P, available K, exchangeable Ca, cation exchange capacity and base saturation (Table 8). The location of S4, S5, S6 in cluster 3 group was artificial agroforestry system with an alley cropping pattern with coffee as the main product. Cluster 3 consists of a mixture of timbers (Gmelina arborea), multi purpose tree (Coffea arabica L, Mangifera indica L, Artocar-pus heterophyllus Lam) and horticultures (Brassi-ca rapa L, Solanum lycopersicum). Agroforestry-based coffee with an intercropping system (timber, multi purpose tree and horticulture) provides better soil quality compared to other clusters. This corre-sponds with the findings high soil carbon stocks in agroforestry-based coffee compared to the arable land (Lal, 2004; Mohammed and Bekele, 2014). The available phosphorus showed the highest val-ue in the cluster with agroforestry-based coffee and corresponds with the research which found that the phosphorus content was higher in the coffee un-der organic rather than conventional management (Tully et al., 2013). Agroforestry-based coffee is most commonly cultivated to cope with the physi-ological stress, decreased soil erosion and to gener-ate additional income for the farmer (Pimentel et al., 2011; Tscharntke et al., 2011).
In order to improve the soil quality, soil and vegetation management by conservation farming need to be considered. The selection of crop types considers the suitability of the growing place, types of protection forest trees. The multipurpose tree spe-cies that have strong and deep roots, as well as the grasses that are suitable for livestock are preferred.. The arrangement of plant pattern, layout and plant-ing spacing should be taken into consideration.
CONCLUSION
The results showed that MDS consisted of four soil chemical indicators and represented 83.6% of the variability of data, i.e., pH, and ex-changeable Calcium (exch Ca), organic Carbon (org C), and exchangeable Natrium (exch Na) respectively. The soil quality index (SQI) under agroforestry pattern was categorized as moderate. The artificial agroforestry-based coffee with an intercropping system (timber, multi purpose tree and horticulture) provides better soil quality.
Conclusively, appropriate land, soil, and veg-etation management by conservation farming, adding of organic matter and fertilizers well-organized are required to improve and maintain better soil quality and productivity. Furthermore,
Table 7. Cluster analysis of the soil location
Cluster Soil Location Sample (%) SQICluster 1 S1, S7, S9, S10, S11, S13, S14, S15, S16 56% 0.46Cluster 2 S2, S3, S8, S12 25% 0.43Cluster 3 S4, S5, S6 19% 0.51
Table 8. Cluster analysis of chemical parameters of different clustered groups
Cluster pH org C total N CN ratio av P av K exch Ca exch Mg exch K exch Na CEC BSCluster 1
Min 4.70 1.45 0.16 8.00 84.30 9.58 6.05 2.33 0.12 0.08 15.98 50.00Max 6.30 3.26 0.33 17.00 192.10 40.80 14.97 4.49 0.81 0.79 31.08 70.00Mean 5.46 2.40 0.23 10.78 141.67 20.04 10.01 3.22 0.42 0.42 23.05 60.22
Cluster 2Min 5.40 1.07 0.14 8.00 41.65 8.31 6.17 3.01 0.12 0.05 16.43 51.00Max 5.80 3.04 0.26 12.00 50.33 10.70 17.99 6.72 0.86 0.50 36.29 83.00Mean 5.60 1.99 0.20 9.75 45.80 9.39 10.82 4.09 0.33 0.27 23.34 65.25
Cluster 3Min 5.60 1.80 0.19 8.00 236.70 40.30 12.63 2.52 0.94 0.29 22.58 71.00Max 5.80 3.19 0.40 10.00 324.20 52.16 15.05 2.94 1.29 0.51 26.90 78.00Mean 5.70 2.52 0.28 9.00 268.78 46.92 13.85 2.78 1.09 0.38 24.30 74.67
org C – organic carbon, av P – available phosphorus, av K – available potassium, exch Ca – exchangeable calcium, exch Mg – exchangeable magnesium, exch K – exchangeable potassium, exch Na – exchangeable natrium, CEC – cation exchange capacity, BS – base saturation
Journal of Ecological Engineering Vol. 20(1), 2019
212
there is need to investigate the technologies for mapping of soil quality and to monitor the health/quality of the soil from time to time.
Acknowledgements
This research was supported by Saintek-Kemen-ristekdikti Scholarships Programme and Research Centre for Geotechnology LIPI. The author would like to thank our colleagues from Research Centre for Geotechnology (Eko Yulianto, Fajar Lubis, Hen-dra Bakti, Dwi Sarah, Ma’ruf Mukti and Ilham Aris-baya) who provided insight and expertise that greatly assisted the research and helped clarify our ideas.
REFERENCES
1. Acharya A.K. & Kafle N. 2009. Land degradation issues in Nepal and its managment through agro-forestry. The Journal of Agriculture and Environ-ment 10, 115–123.
2. Alzwar M., Akbar N.A., Bachri S. 1992. Geologi-cal Map of Garut and Pameungpeuk Sheet, West Java, scale 1:100.000. Bandung.
3. Andrews S., Karlen D., Cambardella C. 2004. The Soil Management Assessment Framework: A Quan-titative Soil Quality Evaluation Method. Soil Sci-ence Society of America Journal 68, 1945–1962.
4. Aticho A. 2013. Evaluating Organic Carbon Stor-age Capacity of Forest Soil : Case Study in Kafa Zone Bita District, Southwestern Ethiopia. Ameri-can Eurasian Journal of Agriculture and Environ-mental Science 13, 95–100.
5. Bi C.J., Chen Z.L., Wang J., Zhou D. 2013. Quan-titative Assessment of Soil Health Under Different Planting Patterns and Soil Types. Pedosphere 23, 194–204.
6. Brejda J.J., Moorman T.B., Karlen D.L., Dao T.H. 2000. Identification of regional soil quality fac-tors and indicators I. Central and Southern High Plains. Soil Science Society of America Journal 64, 2115–2124.
7. Bremner J.M., Sparks D.L., Page A.L., Helmke P.A., Loeppert R.H., Soltanpour P.N., Tabatabai M.A., Johnston C.T., Sumner M.E. 1996. Nitro-gen-total. Methods of soil analysis. Part 3-Chemi-cal methods. 1085–1121.
8. Cantú M.P., Becker A., Bedano J.C., Schiavo H.F. 2007. Soil quality evaluation using indicators and indices. Ciencia del Suelo 25, 173–178.
9. Chaidar A.N., Soekarno I., Wiyono A., Nugroho J. 2017. Spatial analysis of erosion and land criticali-ty of the upstream citarum watershed. International Journal of GEOMATE 13, 133–140.
10. Combe J. & Budowski G. 1979. Classification of agro-forestry techniques. In: de las Salas G. (Ed.). Pro-ceedings of the Workshop on Agroforestry Systems in Latin America CATIE. Turialba, Costa Rica, 17–47.
11. De Foresta H. & Michon G. 1996. The agroforest alternative to Imperata grasslands: when small-holder agriculture and forestry reach sustainability. Agroforestry Systems 36, 105–120.
12. Doran J.W. & Parkin T.B. 1994. Defining and as-sessing soil quality. In: Doran, J.W.,Coleman, D.C., Bezdicek, D.F., Stewart, B.A. (Eds.), Defining Soil Quality for aSustainable Environment. SSSA Spec. Publ. 35. ASA, Madison, WI, 3–21.
13. Emadi M., Baghernejad M., Memarian H.R. 2009. Effect of land-use change on soil fertility characteris-tics within water-stable aggregates of two cultivated soils in northern Iran. Land Use Policy 26, 452–457.
14. Govaerts B., Sayre K.D., Deckers J. 2006. A mini-mum data set for soil quality assessment of wheat and maize cropping in the highlands of Mexico. Soil and Tillage Research 87, 163–174.
15. Hairiah K., Sulistyani H., Suprayogo D., Purnomo-sidhi P., Widodo R.H., Van Noordwijk M. 2006. Lit-ter layer residence time in forest and coffee agrofor-estry systems in Sumberjaya, West Lampung. Forest Ecology and Management 224, 45–57.
16. Hammer Ø., Harper D.A.T., Ryan P.D. 2001. PAST: Paleontological statistics sofware package for education and data analysis. Palaeontologia Electronica 4, 1–9.
17. Hesse P.R. 1971. A textbook of soil chemical analy-sis, first ed. Chemical Publishing Co., New York.
18. Indonesian Soil Research Institute. 2005. Soil Chemical, Crop, Water and Fertilizer Analysis. Soil Research Institute, Research Agency and Agricul-tural Development, Ministry of Agriculture, Jakarta.
19. Jin Z., Li Z., Li Q., Hu Q., Yang R., Tang H., Li M., Huang B., Zhang J., Li G. 2015. Canonical corre-spondence analysis of soil heavy metal pollution, microflora and enzyme activities in the Pb--Zn mine tailing dam collapse area of Sidi village, SW China. Environmental Earth Sciences 73, 267–274.
20. Karlen D.L., Ditzler C., Andrews S.S. 2003. Soil quality: Why and how? Geoderma 114, 145–156.
21. Karlen D.L., Gardner J.C., Rosek M.J. 1998. A soil quality framework for evaluating the impact of CRP. Journal of Production Agriculture 11, 56–60.
22. Kassa H., Dondeyne S., Poesen J., Frankl A., Nyssen, J. 2017. Impact of deforestation on soil fertility, soil carbon and nitrogen stocks: the case of the Gacheb catchment in the White Nile Basin, Ethiopia. Agricul-ture, Ecosystems & Environment 247, 273–282.
23. King K.F.S. 1979. Agroforestry and the utilisation of fragile ecosystems. Forest Ecology and Man-agement 2, 161–168.
24. King K.F.S. 1976. Agri-silviculture (the taungya
213
Journal of Ecological Engineering Vol. 20(1), 2019
system). University of Ibadan, Ibadan (Nigeria). Department of Forestry.
25. Laishram J., Saxena K.G.G., Maikhuri R.K.K. & Rao, K.S.S. 2012. Soil Quality and Soil Health : A Review. International Journal of Ecology and En-vironmental Sciences 38, 19–37.
26. Lal R. 2004. Soil carbon sequestration impacts on global climate change and food security. Science 304, 1623–1627.
27. Larson W.E. & Pierce F.J. 1994. The dynamics of soil quality as a measurement of sustainable man-agement. Defining soil quality for a sustainable en-vironment 551, 37–51.
28. León J.D. & Osorio N.W. 2014. Role of litter turn-over in soil quality in tropical degraded lands of Colombia. The Scientific World Journal 2014. ar-ticle ID: 693981. Hindawi Publishing Corporation
29. Li P., Zhang T., Wang X. & Yu D. 2013. Development of biological soil quality indicator system for subtropi-cal China. Soil and Tillage Research 126, 112–118.
30. Marinho E.B., de Oliveira A.L., Zandonadi D.B., Benedito L.E.C., de Souza R.B., de Figueiredo C.C. & Busato J.G. 2014. Organic matter pools and nutrient cycling in different coffee production systems in the Brazilian Cerrado. Agroforestry sys-tems 88, 767–778.
31. Michon G. & de Foresta H. 1999. Agro-forests: incorporating a forest vision in agroforestry, in: Buck, L.E., J.P.L. and E.C.M.F. (Ed.), Agroforest-ry in Sustainable Agricultural Systems. CRC Press, Lewis Publishers, pp. 381–406.
32. Mikkelsen R. 2010. Soil and fertilizer magnesium. Better crops 94, 26–28.
33. Ministry of Agriculture. 2015 Integrated Land Conservation Development Management Support. Land Expansion Directorate. Indonesia Ministry of Agriculture.
34. Mohammed A. & Bekele L. 2014. Changes in Carbon Stocks and Sequestration Potential under Native For-est and Adjacent Land use Systems at Gera, South-Western Ethiopia. Global Journal of Science Frontier Research: D Agriculture and Veterinary 14, 11–19.
35. Nair P.K.R. 1998. Directions in tropical agrofor-estry research: past, present, and future, in: Direc-tions in Tropical Agroforestry Research. Springer, 223–245.
36. Olsen S.R. 1954. Estimation of available phosphorus in soils by extraction with sodium bicarbonate. Unit-ed States Department Of Agriculture; Washington.
37. Parikesit, Takeuchi K., Tsunekawa A., Abdoellah O.S. 2005. Kebon tatangkalan: A disappearing agro-forest in the Upper Citarum Watershed, West Java, Indonesia. Agroforestry Systems 63, 171–182.
38. Pimentel, M.S., De-Polli, H., Aquino, A.M. de, Cor-reia, M.E.F., Rouws, J.R.C. 2011. Bioindicators of
soil quality in coffee organic cultivation systems. Pesquisa Agropecuaria Brasileira 46, 545–552.
39. Qi Y., Darilek J.L., Huang B., Zhao Y., Sun W., Gu Z. 2009. Evaluating soil quality indices in an agri-cultural region of Jiangsu Province, China. Geo-derma 149, 325–334.
40. Raiesi F. & Beheshti A. 2014. Soil C turnover, microbial biomass and respiration, and enzymat-ic activities following rangeland conversion to wheat--alfalfa cropping in a semi-arid climate. En-vironmental Earth Sciences 72, 5073–5088.
41. Saviozzi A., Levi-Minzi R., Cardelli R., Riffaldi R. 2001. A comparison of soil quality in adjacent cul-tivated, forest and native grassland soils. Plant and Soil 233, 251–259.
42. Shukla M.K., Lal R., Ebinger M. 2006. Determin-ing soil quality indicators by factor analysis. Soil and Tillage Research 87, 194–204.
43. Silitonga P.H. 1973. Geological Map of Bandung Sheet, West Java, Scale 1:100.000. Bandung.
44. Soil and Agroclimate Research Center. 1993. Soil Map of Citarum Watershed, West Java, Scale 1:100.000. Bogor.
45. Soil Survey Staff. 2014. Keys to Soil Taxonomy. 12th edition, USDA. Soil Conservation Service.
46. Spohn M. & Giani L. 2011. Impacts of land use change on soil aggregation and aggregate stabiliz-ing compounds as dependent on time. Soil Biology and Biochemistry 43, 1081–1088.
47. Supriyadi S., Purwanto P., Sarijan A., Mekiuw Y., Us-tiatik R., Prahesti R.R. 2017. The assessment of soil quality at paddy fields in Merauke, Indonesia. Bul-garian Journal of Agricultural Science 23, 443–448.
48. Tscharntke T., Clough, Y., Bhagwat S.A., Buchori D., Faust H., Hertel D., Hölscher D., Juhrbandt J., Kessler M., Perfecto I. 2011. Multifunctional shade-tree management in tropical agroforestry landscapes – a review. Journal of Applied Ecology 48, 619–629.
49. Tully K.L., Lawrence D., Wood S.A. 2013. Organi-cally managed coffee agroforests have larger soil phosphorus but smaller soil nitrogen pools than conventionally managed agroforests. Biogeochem-istry 115, 385–397.
50. Walky A. & Black I.A. 1934. An examination of De-gtjareff method for determining soil organic matter and proposed modification of the Chromic acid titra-tion method. Journal Soil Science 37, 29–38.
51. Wang Y., Chang S.X., Fang S., Tian, Y. 2014. Con-trasting decomposition rates and nutrient release patterns in mixed vs singular species litter in agro-forestry systems. Journal of Soils and Sediments 14, 1071–1081.
52. Young A. 1989. Agroforestry for soil conserva-tion. Science and Practice of Agroforestry No. 4, ICRAFT, Nairobi.