Embed Size (px)
Citation preview

Soil Salinity ProcessesUnder Drainwater Reuse inthe Nile Delta, Egypt
C L AbbottD E D El Quosy
HR Wallingford in collaboration with the Water Management ResearchInstitute, Cairo
Report OD/133March 1996


Soil Salinity Processes Under DrainwaterReuse in the Nile Delta, Egypt
C L AbbottD E D El Quosy
HR Wallingford in collaboration with the Water Management Research Institute,Cairo
Report OD/133March 1996
����Address and Registered Office: HR Wallingford Ltd. Howbery Park, Wallingford, OXON OX10 8BATel: +44 (0) 1491 835381 Fax: +44 (0) 1491 832233
Registered in England No. 2562099. HR Wallingford is a wholly owned subsidiary of HR Wallingford Group Ltd.

���� ii OD/133 06/06/02 10:15


���� iv OD/133 06/06/02 10:15

���� v OD/133 06/06/02 10:15
Summary
Soil Salinity Processes Under Drainwater Reuse in the Nile Delta, Egypt
C L Abbott D E D El Quosy
Report OD/133March 1996
In many parts of the world agricultural drainage water is reused for irrigation.Although the practice can bring significant benefits to watershort areas, it can alsolead to accumulation of salts and toxins in soils, with detrimental consequences toagricultural production. Reuse areas contribute to the estimated 20 millionhectares of agricultural land worldwide that are affected by salinity (Hamdy,1988). In these areas, crops suffer large yield reductions and soil suitability foragriculture can be reduced to the point where farmers are forced to abandon land.
In many cases this scenario is avoidable with an understanding of the processesinvolved in salinity accumulation, and the implementation of appropriatemanagement techniques to control salinity and toxin build up. In the DrainwaterReuse Effects Project, the processes of salt accumulation and movement underdrainwater reuse have been studied and management guidelines developed tominimise adverse effects.
This report presents results from the second fieldwork component of the project(known as the microstudy). This has been carried out in the Nile Delta, Egypt,where increasing demands on a limited water supply have necessitated the reuse ofdrainage water for irrigation. Processes of salt accumulation and movement inworking farmers' fields of this region have been studied in situ. Information on saltleaching and diffusion processes from this study has been used to develop andimprove predictions of salinity buildup under drainwater reuse.
The microstudy monitored salt and water movement in a typical farmer's field onthe Nubariya Scheme in the western Nile Delta, which had been reusing salinedrainwater for irrigation for over ten years. Detailed investigation over a one yearperiod has provided information on the processes occurring and on how verysaline drainwater can be successfully used for agricultural production with theadoption of appropriate management methods.
It was estimated that about 62 tonnes of salt were added to the 2 hectare fieldduring the study. In the summer season the vast majority of applied salt remainedin the soil profile. Very little water and salts went to deep percolation. During thefallow period, mass flow of water and salts was negligible and the only process ofsalt movement was diffusion. In the winter season there were six significantleaching events which removed 93% of the applied salt in the soil profile to deeppercolation.
The process of leaching during the winter crop season was critical in successfuluse of drainwater for crop production in the study area. Soil salinity levels wereacceptable and crop yields were good. However, the investigation was not longenough to show whether or not soil salinity levels in the soil were graduallyincreasing as a trend from year to year. The long term sustainability of the saltbalance cannot be guaranteed since shallow groundwater levels can be quicklyraised at any time, bringing salt back into the root zone by capillary rise anddiffusion.

���� vi OD/133 06/06/02 10:15

���� vii OD/133 06/06/02 10:15
ContentsTitle page iContract iiiSummary vContents vii
1. Introduction ................................................................................................ 11.1 Background ................................................................................... 11.2 Drainwater reuse in Egypt ............................................................. 11.3 Project aims ................................................................................... 1
2. Drainwater reuse and salt accumulation in agriculture soils ...................... 32.1 Hazards of drainwater reuse .......................................................... 32.2 Salinity accumulation in soils of the Nile Delta ............................ 32.3 Processes of salinity accumulation................................................ 42.4 Methods of predicting salinity accumulation ................................ 4
2.4.1 Rhoades and Merrill Relation........................................... 42.4.2 Ayers and Westcot Relation ............................................. 52.4.3 Rhoades Relation.............................................................. 52.4.4 Hoffman and Van Genuchten Equation ........................... 62.4.5 Computer Models ............................................................. 6
3. Microstudy methodology............................................................................ 7Aims of the Microstudy.............................................................................. 73.2 Location......................................................................................... 73.3 Study field layout .......................................................................... 73.4 Monitoring programme ................................................................. 8
4. Results and discussion................................................................................ 94.1 Seasonal land use........................................................................... 9
4.1.1 Summer crop .................................................................... 94.1.2 Fallow period.................................................................... 94.1.3 Winter crop....................................................................... 9
4.2 Soil properties................................................................................ 94.2.1 Textural analysis............................................................... 94.2.2 Infiltration rate.................................................................. 94.2.3 Soil moisture release curves and field capacity moisture
content ............................................................................ 104.3 Water inputs and outputs ............................................................. 10
4.3.1 Irrigation......................................................................... 104.3.2 Rainfall ........................................................................... 114.3.3 Groundwater and capillary rise ...................................... 114.3.4 Subsurface drainage ....................................................... 114.3.5 Crop water abstractions and bare soil evaporation......... 11
4.4 Water movement in the soil profile ............................................. 114.4.1 Horizontal....................................................................... 114.4.2 Vertical ........................................................................... 11
4.5 Leaching fraction determination.................................................. 124.6 Salt inputs and outputs ................................................................ 14
4.6.1 Irrigation......................................................................... 144.6.2 Soil salinity levels .......................................................... 14

���� viii OD/133 06/06/02 10:15
Contents continued
4.6.3 Salt balance .....................................................................154.7 Application of predictive methods to study results ......................15
5. Conclusions ...............................................................................................17
6. Acknowledgements ...................................................................................19
7. References .................................................................................................20
TablesTable 1 Summary table indicating the effect of soil salinity on crop yields......3Table 2 Concentration factors (X) for predicting soil salinity (ECe) from the
irrigation water salinity (ECw) and the leaching fraction (LF). ............5Table 3 Electrical conductivity of soil water (saturation paste extract) at
steady-state compared to that of irrigation water (Fc)...........................6Table 4 Leaching events during the study and amounts of water going to
deep percolation..................................................................................13Table 5 Seasonal water applications, deep percolation amounts and leaching
fractions ..............................................................................................13Table 6 Seasonal salt balance for the study field.............................................15
AppendicesAppendix 1 Gravimetric soil moisture determinationAppendix 2 Calibration of neutron probeAppendix 3 Mercury manometer tensiometersAppendix 4 Soil salinity determinationAppendix 5 EM38 measurementsAppendix 6 Irrigation applicationsAppendix 7 RainfallAppendix 8 Deep percolation calculationAppendix 9 Salt balance calculations (see section 4.6.3)

���� 1 OD/133 06/06/02 10:15
1. INTRODUCTION
1.1 BackgroundThe use of marginal quality water for irrigation is becoming more and more widespread across the world.There is not always enough good quality water available to meet demands from agriculture, domestic useand industry. One strategy to increase available water resources is to reuse agricultural drainage water forirrigation. Reuse of drainage water is already extensively practised in countries such as Egypt, Pakistanand the USA.
The reuse of drainage water for irrigation involves the application of water that is inherently of lowerquality than fresh water. Water that has passed through the agricultural system may contain increasedlevels of salts, toxic ions, heavy metals and organic residues. The entry of these pollutants into watercourses, and accumulation in soils poses a threat to agricultural production and the environment.
1.2 Drainwater reuse in EgyptThe 1959 treaty with Sudan fixed Egypt's share of the Nile water at 55.5 billion m3/yr (Amer and deRidder, 1989). It is currently approaching full utilisation of this allocation and demands are high.Drainwater reuse is a major component of the country's water strategy. It is the largest source of irrigationwater after the river Nile and contributes an estimated 4 billion m3/yr to the agricultural sector. Currentpolicies are based on increasing this figure to 7 billion m3/yr. by the year 2000 (Abdel Dayem and Abu-Zeid, 1991). Drainage water reuse occurs along the Nile Valley because all drains lead back to the mainriver course. In the southern part of the Nile Delta drainwater is mixed with fresh water and used forirrigation. In the northern Nile Delta, the amount of drainwater increases but the irrigation area is less.Additionally the soils are heavier and more saline. The national strategy is therefore to use drainwater inthe irrigation of reclaimed lands in the eastern and western fringes of the Nile Delta. Major initiativesinclude the Salam Canal project in the east and the Omoum Reuse Project in the west. The Salam Canalwill irrigate 78,000 hectares west of the Suez Canal and about 168,000 hectares in the Sinai Peninsula withblended drainage water. The Omoum Reuse Project will put drainage water into the Nubaria Canal whichis used to irrigate 420,000 hectares of reclaimed agricultural land in the western Nile Delta.
1.3 Project aimsThe Overseas Development Unit of HR Wallingford is carrying out research in collaboration with theWater Management Research Institute, WMRI, (previously known as the Water Distribution and IrrigationSystems Research Institute, WDISRI) of the National Water Research Centre, Egypt into the effects ofdrainwater reuse and the development of practical guidelines for safe reuse. The work has been carried outwith funding from the UK Overseas Development Administration. Project fieldwork was undertaken inagricultural areas of the Nile Delta, Egypt between 1992 and 1995. As part of their ongoing researchprogramme, WMRI are continuing with aspects of the fieldwork.
The project has comprised the following stages:
a) An assessment of the effects to date of irrigating with drainwater on Nile Delta soils. Levels ofsalinity in the soil profile were determined at locations selected to cover a range of soil types foundin the Nile Delta. This phase of the project has been called the macrostudy and is presented in HRreport OD/TN71 (Abbott and El-Quosy, 1995).
b) A study to determine processes of salt accumulation in the soil profile following the reuse ofdrainwater for irrigation. A detailed study was carried out in the Western Nile Delta, in a farmer'sfield which was typical of the region. Salt and water distribution and movement was monitored toprovide information on accumulation of salts in soils and acceptable salinity levels in applieddrainage water. This phase of the project was known as the microstudy and is presented in this report.

���� 2 OD/133 06/06/02 10:15
c) The development of practical guidelines on the safe use of drainage water for irrigation. This hasculminated in the development of an assessment procedure for safe reuse of drainwater to bepresented in a future report.
d) The development of a suitable field technique for measuring environmental contamination levelsin the water system, that will contribute to assessments of current levels of pollution. The projecthas assessed methods of measuring pesticide and pathogen levels in the field. This work is reportedin Girard (1993) and Retournay (1995).
���� 3 OD/133 06/06/02 10:15
2. DRAINWATER REUSE AND SALT ACCUMULATION IN AGRICULTURE SOILS
2.1 Hazards of drainwater reuseThe reuse of agricultural drainage water for irrigation involves the application to soils and crops of waterthat is inherently of lower quality than freshwater. Water that has passed through the agricultural systemmay contain increased levels of salts, toxic ions, heavy metals and residues such as pesticides. In areassuch as the Nile Delta, the most serious threat to sustainable agriculture posed by drainwater reuse comesfrom the recycling of salts. Soil salinisation is the prime reason for abandonment of agricultural land inirrigated areas of the world (Hinnawi and Hashmi, 1987). The accumulation of salts in soils can lead tosevere soil damage and reduction in crop growth and yields.
Sustainable agriculture is dependent on fertile soils. The clay fraction present in soils is subject to physico-chemical interactions with salt ions, which can alter soil structure and hydraulic properties. Monovalentions (particularly sodium) have a destabilising effect and their presence in irrigation water is ofconsiderable concern.
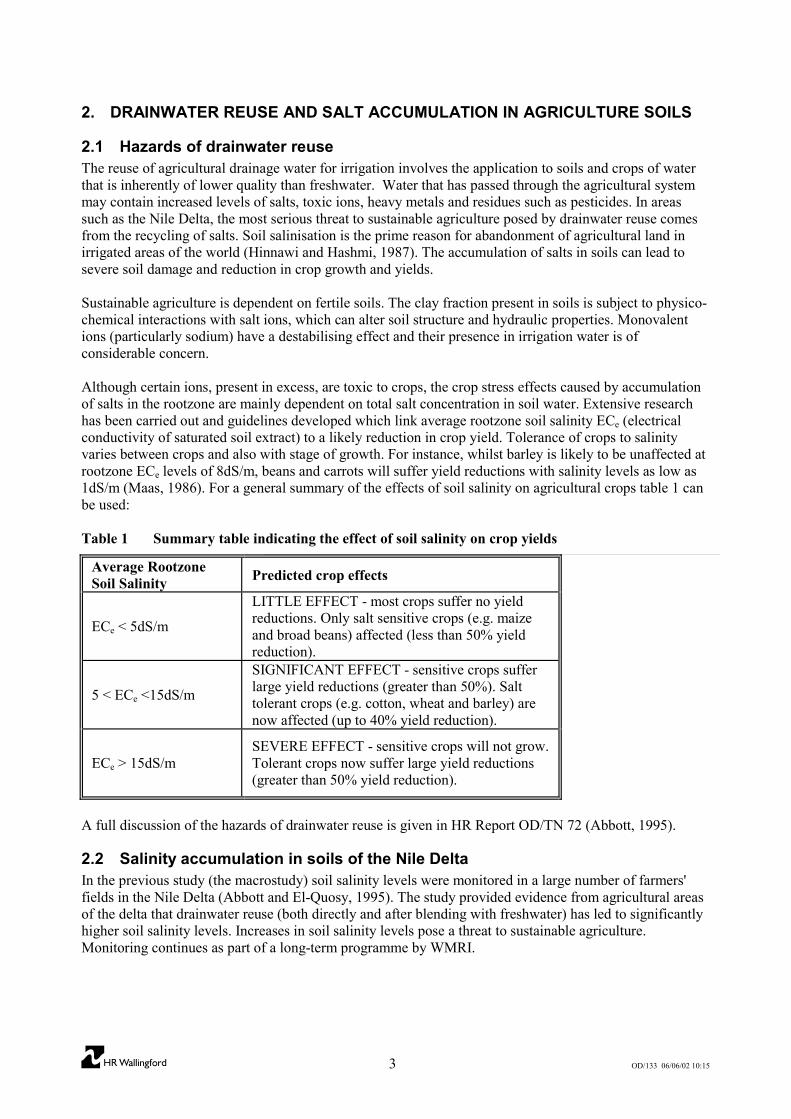
Although certain ions, present in excess, are toxic to crops, the crop stress effects caused by accumulationof salts in the rootzone are mainly dependent on total salt concentration in soil water. Extensive researchhas been carried out and guidelines developed which link average rootzone soil salinity ECe (electricalconductivity of saturated soil extract) to a likely reduction in crop yield. Tolerance of crops to salinityvaries between crops and also with stage of growth. For instance, whilst barley is likely to be unaffected atrootzone ECe levels of 8dS/m, beans and carrots will suffer yield reductions with salinity levels as low as1dS/m (Maas, 1986). For a general summary of the effects of soil salinity on agricultural crops table 1 canbe used:
Table 1 Summary table indicating the effect of soil salinity on crop yields
Average RootzoneSoil Salinity Predicted crop effects
ECe < 5dS/m
LITTLE EFFECT - most crops suffer no yieldreductions. Only salt sensitive crops (e.g. maizeand broad beans) affected (less than 50% yieldreduction).
5 < ECe <15dS/m
SIGNIFICANT EFFECT - sensitive crops sufferlarge yield reductions (greater than 50%). Salttolerant crops (e.g. cotton, wheat and barley) arenow affected (up to 40% yield reduction).
ECe > 15dS/mSEVERE EFFECT - sensitive crops will not grow.Tolerant crops now suffer large yield reductions(greater than 50% yield reduction).
A full discussion of the hazards of drainwater reuse is given in HR Report OD/TN 72 (Abbott, 1995).
2.2 Salinity accumulation in soils of the Nile DeltaIn the previous study (the macrostudy) soil salinity levels were monitored in a large number of farmers'fields in the Nile Delta (Abbott and El-Quosy, 1995). The study provided evidence from agricultural areasof the delta that drainwater reuse (both directly and after blending with freshwater) has led to significantlyhigher soil salinity levels. Increases in soil salinity levels pose a threat to sustainable agriculture.Monitoring continues as part of a long-term programme by WMRI.
���� 4 OD/133 06/06/02 10:15
Large amounts of salt are accumulated in the soil profile throughout the root zone during periods of peakdemand due to high evapotranspiration rates and shortage of supply. During low demand periods, morewater is available and leaching can take place. However, if it is only possible to achieve partial leaching,long-term salinity build-up may take place.
To understand whether this is occurring there is a need for long-term regular monitoring to be carried out.If the trend is occurring, then simple methods that can be utilised by farmers throughout the effected partsof the Nile Delta need to be developed. An example of this could be to encourage farmers to leach at theend of crop seasons, particularly after summer harvest, when water is more plentiful.
2.3 Processes of salinity accumulationSolute transport is governed by the processes of convection (viscous movement of the soil solution or massflow) and diffusion (movement of ions within the soil solution along a concentration gradient). In a wetpermeable soil, mass flow is likely to be the dominant mechanism for salt movement through the profile.The other process, diffusion, is the random movement of ions in the soil solution and redistributes saltsfrom areas of high concentration to areas of low concentration. Although diffusion occurs in both wet anddry soils, it is only likely to be the main process of salt movement when the soil is dry and the mass flowof water and salts is relatively small.
2.4 Methods of predicting salinity accumulationSalt contained in irrigation water applied to agricultural lands has three possible fates. It can:
i) leave the soil profile via a subsurface drainage system;
ii) be carried through the soil profile to enter deep groundwater, or
iii) accumulate in the soil profile.
Although both movement of salts into groundwater and entry of salts into drainage systems necessitatecareful management, it is the third possibility, the accumulation of salts in the soil profile that poses animmediate threat to crop production and soil fertility.
The salinity level which develops in the soil profile under irrigation depends on many factors including soiltype, level of salinity in the applied water, and the fraction of water and salts moving through the soilprofile to drainage and deep percolation.
The fraction of applied water that passes through the entire rooting zone and percolates below is called theleaching fraction (Ayers and Westcot, 1985).
surface at the applied water ofdepth totalzoneroot thebelow leached water ofdepth = (LF)Fraction Leaching
After several years of irrigation (with drainwater or other saline water source), the salt accumulation in thesoil approaches an equilibrium concentration depending predominantly on the salinity of the applied waterand the leaching fraction.
This level of steady-state soil salinity can be estimated using several methods:
2.4.1 Rhoades and Merrill RelationThe Rhoades and Merrill relation was developed to estimate the leaching requirement (LR), with a givensalinity of irrigation water (ECw) and an acceptable soil salinity level (ECe). As the terms leaching fraction

���� 5 OD/133 06/06/02 10:15
(LF) and leaching requirement (LR) are interchangeable, the relation can also be used to estimate soilsalinity (ECe) levels achieved with irrigation water of salinity ECw and a given leaching fraction (LF).The relation is given as (Rhoades and Merrill, 1976):
EC - )EC5(EC = LR
we
w
ECw = salinity of applied irrigation water (dS/m)ECe = average soil salinity in rootzone (saturated soil extract basis, dS/m)LR = leaching requirement/fraction
2.4.2 Ayers and Westcot RelationThis simple equation is used for predicting the soil salinity expected after several years of irrigation withwater of salinity ECw:
X x EC = EC we
ECe is soil salinity (electrical conductivity of saturated extract, dS/m)ECw is applied water salinity (electrical conductivity, dS/m)X is a concentration factor dependent on the leaching fraction, given in the table below:
Table 2 Concentration factors (X) for predicting soil salinity (ECe) from the irrigation watersalinity (ECw) and the leaching fraction (LF).
Leaching Fraction (LF) Concentration Factor(X)
0.05 3.20.1 2.1
0.15 1.60.2 1.3
0.25 1.20.3 10.4 0.90.5 0.80.6 0.70.7 0.60.8 0.6
Ayers and Westcot, 1989
The method assumes a crop water use pattern of 40%-30%-20%-10% through the rootzone.
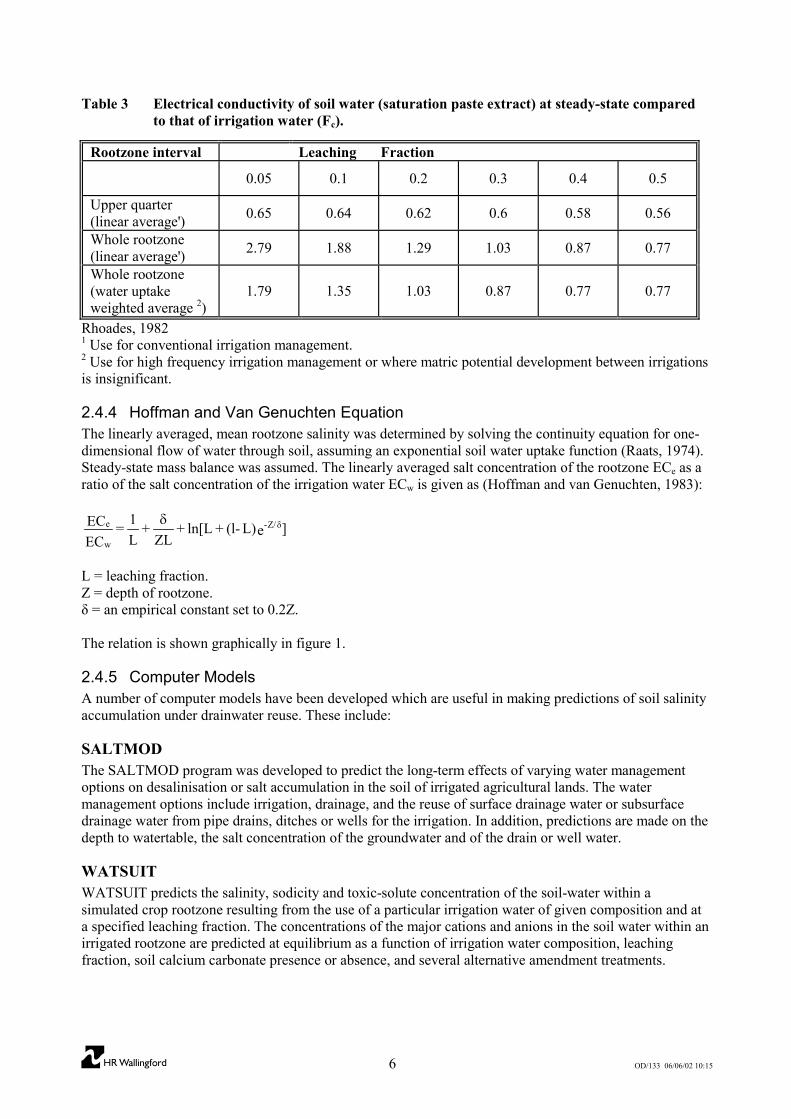
2.4.3 Rhoades RelationSteady-state soil water salinity (ECe) is estimated by multiplying the electrical conductivity of theirrigation water (ECw) by a relative concentration factor, Fc, appropriate to the leaching fraction and depthin the rootzone (Rhoades, 1982):-
Values of Fc are given in the table below:
F x EC = EC cwe
���� 6 OD/133 06/06/02 10:15
Table 3 Electrical conductivity of soil water (saturation paste extract) at steady-state comparedto that of irrigation water (Fc).
Rootzone interval Leaching Fraction
0.05 0.1 0.2 0.3 0.4 0.5
Upper quarter(linear average') 0.65 0.64 0.62 0.6 0.58 0.56
Whole rootzone(linear average') 2.79 1.88 1.29 1.03 0.87 0.77
Whole rootzone(water uptakeweighted average 2)
1.79 1.35 1.03 0.87 0.77 0.77
Rhoades, 19821 Use for conventional irrigation management.2 Use for high frequency irrigation management or where matric potential development between irrigationsis insignificant.
2.4.4 Hoffman and Van Genuchten EquationThe linearly averaged, mean rootzone salinity was determined by solving the continuity equation for one-dimensional flow of water through soil, assuming an exponential soil water uptake function (Raats, 1974).Steady-state mass balance was assumed. The linearly averaged salt concentration of the rootzone ECe as aratio of the salt concentration of the irrigation water ECw is given as (Hoffman and van Genuchten, 1983):
]eL)(l- + ln[L + ZL
+ L1 =
ECEC Z/-
w
e ��
L = leaching fraction.Z = depth of rootzone.δ = an empirical constant set to 0.2Z.
The relation is shown graphically in figure 1.
2.4.5 Computer ModelsA number of computer models have been developed which are useful in making predictions of soil salinityaccumulation under drainwater reuse. These include:
SALTMODThe SALTMOD program was developed to predict the long-term effects of varying water managementoptions on desalinisation or salt accumulation in the soil of irrigated agricultural lands. The watermanagement options include irrigation, drainage, and the reuse of surface drainage water or subsurfacedrainage water from pipe drains, ditches or wells for the irrigation. In addition, predictions are made on thedepth to watertable, the salt concentration of the groundwater and of the drain or well water.
WATSUITWATSUIT predicts the salinity, sodicity and toxic-solute concentration of the soil-water within asimulated crop rootzone resulting from the use of a particular irrigation water of given composition and ata specified leaching fraction. The concentrations of the major cations and anions in the soil water within anirrigated rootzone are predicted at equilibrium as a function of irrigation water composition, leachingfraction, soil calcium carbonate presence or absence, and several alternative amendment treatments.

���� 7 OD/133 06/06/02 10:15
3. MICROSTUDY METHODOLOGY
3.1 Aims of the MicrostudyThe main fieldwork from the project provided quantitative evidence that the reuse of agricultural drainagewater (both directly and after blending with fresh Nile water) has led to increased salinity levels in farmer'sfields of the Nile Delta (Abbott and El-Quosy, 1995). Without careful management, crop production willbe reduced and agricultural land will be degraded.
To implement appropriate management techniques to control soil salinity and toxic ion buildup, it isnecessary to have an understanding of processes of salt accumulation under drainwater reuse and be able tomake predictions about likely accumulation over time. The aims of the microstudy were thus:
1) to investigate the processes occurring in an agricultural field representative of the Nile Delta wheredrainwater is reused for irrigation, and
2) to provide data and information to develop and test a predictive procedure for salt accumulation underdrainwater reuse over time.
This report presents results from the study and discusses processes of salt accumulation and movementoccurring under drainwater reuse. Testing of predictive procedures on the study findings is also presented.
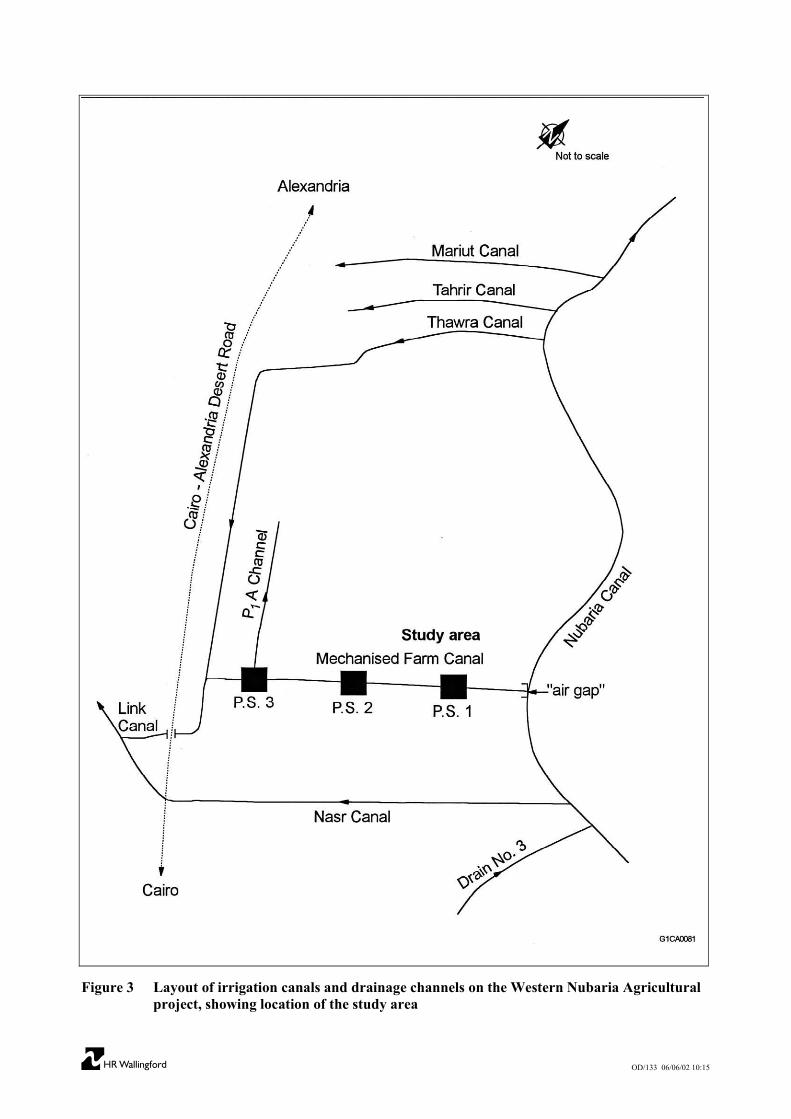
3.2 LocationThe Nubaria Canal is fed from the Rossetta Branch of the Nile and conveys water to reclaimed lands in thewestern Nile Delta. It has enabled large areas of desert land to be utilised for agricultural production. Thisincludes 4,000 hectares of land in the Western Nubaria Agricultural Project (figure 2) which was reclaimedin the 1960s. Within the project some areas of land receive water via the Mechanised Farm Canal (figure3) which branches off the Nubaria Canal downstream of a number of major drains. Water in the canalconsequently contains a large proportion of drainage water and is quite saline (ECw is from 3-5 dS/m).
Situated on the western fringes of the Nile Delta, the area has a desert climate with high daytime and lownight-time temperatures. Precipitation is low and usually occurs only in the winter months (October toJanuary). Soils are predominantly sand in composition with a high calcium carbonate content.
As in other parts of the Delta, there are two main growing seasons per year. The winter season runs fromOctober to May and the summer season from April/May until October. The most common winter crops inthe area are wheat, broad beans, barley and berseem. Watermelon, maize, cotton and sunflower are themost common summer crops.
A typical agricultural field was selected from the area, on which traditional farming methods were used,including surface irrigation in furrows and basins. Farming operations (including weeding and surface soilcultivation) were mostly carried out by hand. Agricultural crops were grown mainly for sale to the localmarkets and those in the nearby city of Alexandria.
The field was approximately 2 hectares in size with a deep watertable and an existing subsurface drainagesystem. The site was instrumented to monitor inputs of water and salt to the field and their movementwithin the soil profile. Monitoring was carried out over the year between April 1994 and April 1995.
3.3 Study field layoutThe study field was situated north of the Mechanised Farm Canal just downstream of Pumping StationNumber 1 (Figure 3). Water for irrigation was lifted by diesel pump into a small concrete lined channel(meska) leading into the field. Irrigation water was then distributed about the field via furrows or in basins,depending on the crop grown. A subsurface drainage system was present at about 1.5 metres depth,although natural drainage kept the watertable at 3-4m depth.

���� 8 OD/133 06/06/02 10:15
3.4 Monitoring programmeThe field's total cropped area was 1.85ha (Figure 4). The instrumentation was installed in April 1994 tostudy water and salt application to the field and movement through the soil profile. The parametersmeasured were:
Irrigation Water ApplicationWater application rate was measured by a Cut-throat Flume situated as shown in figure 4. Time ofapplication was also recorded.
Irrigation Water SalinityA handheld electrical conductivity meter was used to measure salt content of irrigation water. Temperatureadjustment was automatic.
Salinity is given by:
TDS = 44.84 + (633 x ECw)
TDS is total dissolved salts in parts per million (ppm) and ECw is electrical conductivity in deci Siemensper metre (dS/m).
Soil MoistureGravimetric soil samples down to 1.6m were taken from six positions once per week (see appendix 1). Aneutron probe was used to measure moisture contents from two access tubes (figure 4) down to 1.6m on aweekly basis. Neutron probe calibration is shown in appendix 2.
Soil Water PotentialTwo profiles of six tensiometers were installed in the study field (figure 4). Installation depths were 0.15m,0.3m, 0.4m, 0.8m, 1.2m and 1.6m. These were monitored daily in the crop seasons and every two days inthe fallow period.
The tensiometers measured total and matric potential of water in the soil profile at different depths. Thetotal potential values were used to indicate direction of water movement in the soil profile and the matricpotential values were used to give a measure of soil wetness (see appendix 3).
Soil SalinitySoil samples were taken down to 1.6m depth from six positions on a weekly basis. Saturated soil extractsalinity (ECe) was determined (see appendix 4) at eight depths. An electromagnetic survey instrument(EM38) was used to monitor bulk soil conductivity (ECa) in the soil profile at five set positions twice aweek (see appendix 5).
DrainflowA flow gauge/water sampler was attached to the subsurface lateral drain where it entered the maindrain.Salinity of drainflow was determined with an electrical conductivity meter.
Depth to WatertableTwo piezometers were installed in the field (figure 4) down to 3m depth to monitor watertable depth andsalinity.
Evaporation and RainfallA class 'A' evaporation pan and a raingauge were installed nearby, both of which were monitored each day.
���� 9 OD/133 06/06/02 10:15
4. RESULTS AND DISCUSSION
The study ran from April 1994 to April 1995. For ease of analysis, days were numbered from 20th April1994, which was taken as day 1.
4.1 Seasonal land useThe year of study was divided into three seasons. These were two crop seasons with a fallow season inbetween. The first crop grown in the study field was watermelon which is a summer crop in Egypt. It wasplanted mid April and harvested between 19th July and 24th August (day 91 to day 127). The field wasthen left fallow until November 5th (day 200) when winter wheat was planted. This crop was harvested onMay 3rd (day 379).
4.1.1 Summer cropWatermelon is a common summer crop on the fringes of the Nile Delta as it is well suited to the desertclimate. It prefers hot, dry conditions with mean daily temperatures of 22 to 30oC and a sandy loam soil. Itis moderately sensitive to salinity. The international guideline on yield decrease due to salinity is shown infigure 5.
The watermelon crop was planted on the tops of furrows spaced about a metre apart. Irrigation applicationswere via the furrows. The watermelon root system was deep and extensive down to a depth of 1.5 to 2m.
4.1.2 Fallow periodThe study field was left fallow between August and November. There were no irrigation applicationsduring this period.
4.1.3 Winter cropWheat is a common winter crop throughout the Delta. It can be grown on a wide range of soils but mediumtextures are preferred. The crop is relatively tolerant to salinity but the ECe should not exceed 4dS/m in theupper soil layer during germination. The international guideline on salinity yield reductions is given infigure 5.
The winter wheat crop was planted in 100m2 basins. Irrigation water was applied to the basins via earthchannels through the field. Although the normal rooting depth for winter wheat is 1.2m, in deep soils (suchas the study field), roots may reach 1.5 to 2m.
4.2 Soil properties
4.2.1 Textural analysisSoil samples were taken down to 1.6m depth. Gravel (diameter > 2mm) was present at all depths (about10% by weight). The remaining soil fraction was analysed for particle size distribution. Results are shownin figure 6. The soil was predominantly sand in composition (about 95%) with a small percentage ofsilt/clay (about 5%). Variation in texture with depth was small, although there was a slight increase in theproportion of smaller soil particles with depth.
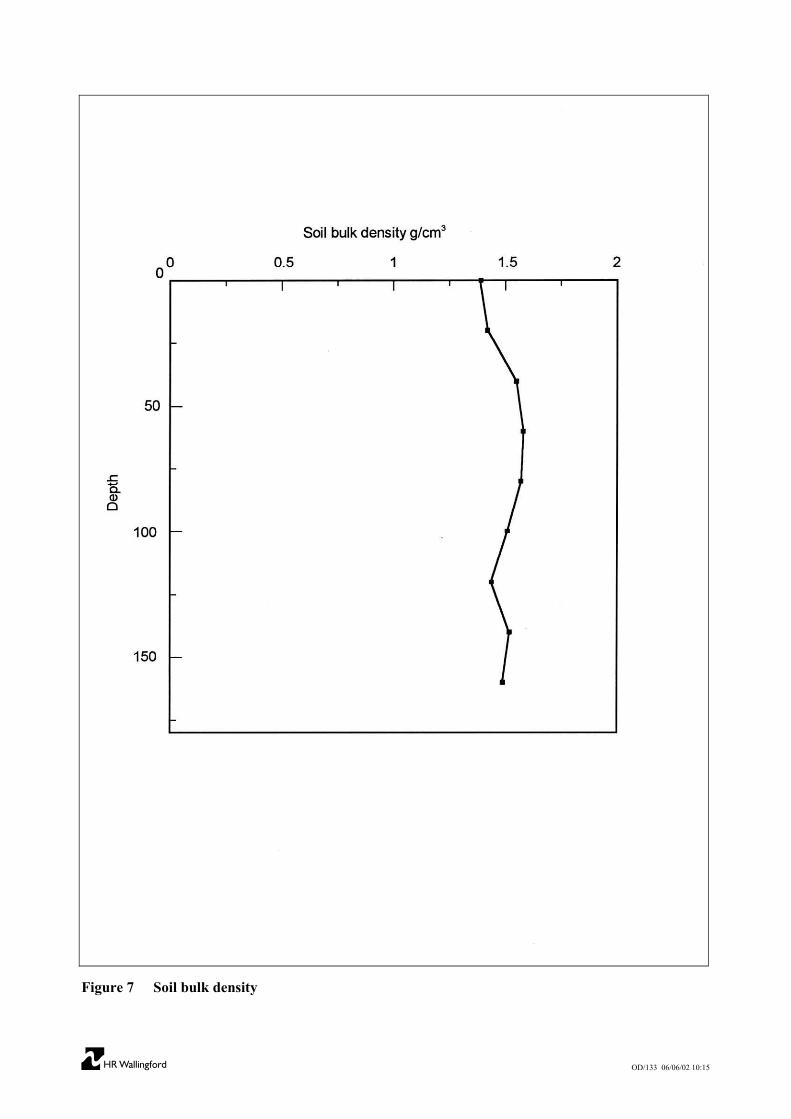
Bulk density was also determined at all depths, shown in figure 7. It was lowest at the soil surface due toloosening of soil layers by cultivation. Bulk density did not vary greatly with depth and the average valuewas 1.51g/cm3.
4.2.2 Infiltration rateSoils with a high sand content are usually very permeable with high values for infiltration rate andhydraulic conductivity. Saturated hydraulic conductivity rate may be several metres per day.

���� 10 OD/133 06/06/02 10:15
Double ring infiltrometer tests were carried out at the soil surface at the study site. Figure 8 shows thatsteady-state infiltration was achieved in about three hours and was approximately 120mm/hr, confirmingthe high permeability of the soil.
4.2.3 Soil moisture release curves and field capacity moisture contentSoil moisture release curves were prepared in situ for the study site using coinciding soil moisture andpotential measurements at five depths in the soil profile. These curves indicate how much water will be lostfrom the soil profile for a given decrease in potential caused by, for example, root water abstraction orgravity drainage. As the pressure potential in a soil decreases, the largest pores empty of water first,followed by successively smaller pores.
Figure 9 shows the derived curves from the study site. Several conclusions can be drawn:
1) Most water was removed from the soil at very low suctions, probably between saturation (0 cmH2O)and -50 cmH2O. As the soil dried beyond this it became increasingly difficult to extract water. Thus,the soil is characterised by large pores which hold most water. It is very permeable and dries outrapidly following water application. As expected for a sandy soil, it drains quickly and has a smallwater holding capacity.
2) The moisture content for a given potential value became higher with depth. This implies there aretextural differences with depth. The soil's water holding capacity increased with depth, implying ahigher percentage of small pores. This is borne out to some extent by the textural analysis whichindicated increasing proportions of fine soil particles with depth.
3) The curves can be used to estimate a moisture content for field capacity of the soil profile. Thisapproximates to the amount of water in the profile after it has been fully wetted and all gravitationalwater has drained away, usually in a day or two. It is an important parameter in irrigated agriculture forthe following reasons:
a) It has a critical bearing on irrigation scheduling. If the soil has a low field capacity moisturecontent, then irrigation applications should be small and frequent, otherwise large amounts ofwater will be lost to deep percolation or drainage. If the field capacity moisture content is high,irrigations can be larger and less frequent due to the increased storage potential of the soil, butoverwetting the profile and waterlogging the crop should be avoided.
b) It controls amounts of water going to deep percolation. In agricultural areas where deeppercolation and leaching of solutes is desirable (such as drainwater reuse areas), the fieldcapacity moisture content must be exceeded to facilitate deep percolation.
To determine a value of field capacity moisture content for the study site, a water release curve wasprepared for the whole soil profile (figure 10). The large scatter of data was due to hysteresis (moisturecontent at a given potential varies depending on whether the soil is wetting or drying), and the use of datafrom different depths to get one relation. Definitions of field capacity matric potential vary between -50and -200 cmH2O. From figure 10 this equates to a moisture content of between 18 and 22% by volume.This is a low moisture content for field capacity and highlights the poor water holding capacity of this soiland the ease with which deep percolation and leaching can occur.
4.3 Water inputs and outputs
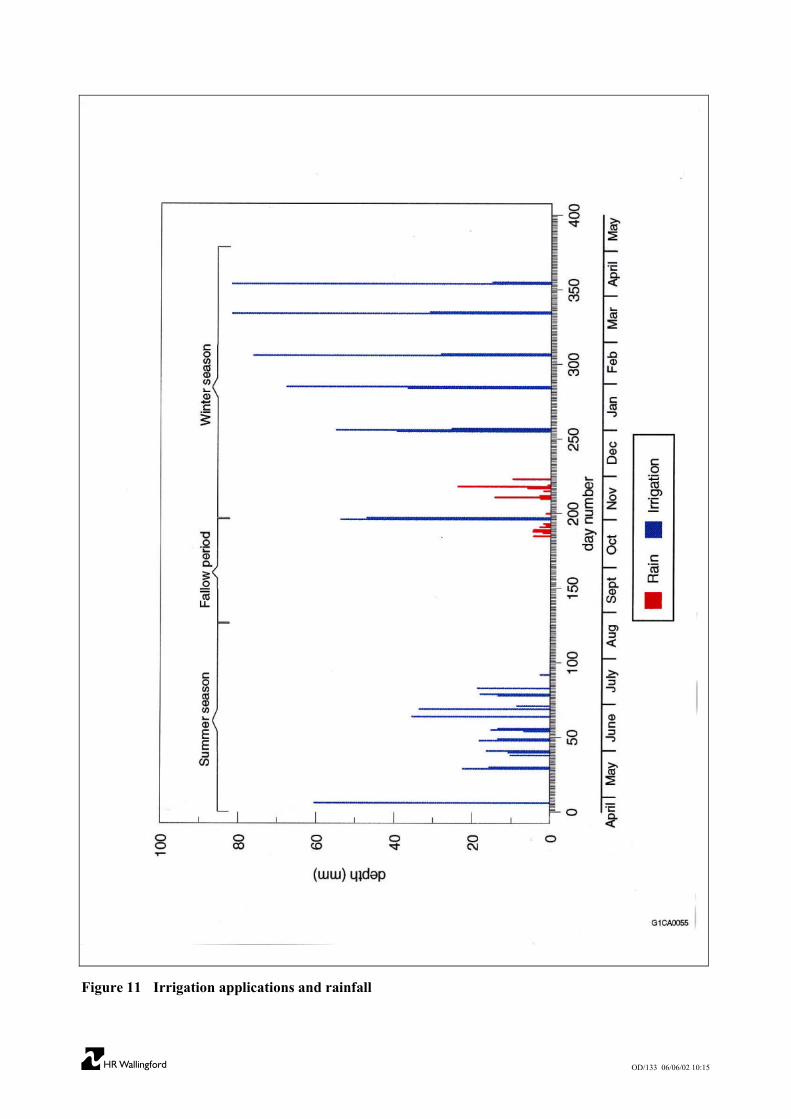
4.3.1 IrrigationIrrigation applications are shown in appendix 6 and in figure 11. Total irrigation application was 333mmfor the watermelon crop (4 months) and 639mm for the wheat crop (5 months).

���� 11 OD/133 06/06/02 10:15
4.3.2 RainfallRainfall occurred between day 185 and day 223 (21st October and 28th November) and is detailed inappendix 7 and also shown on figure 11. The total was 84.4mm.
4.3.3 Groundwater and capillary riseGroundwater levels in the region were 3-4m below the soil surface, although there were significant localvariations. The piezometers installed in the study field at 3m depth remained dry during the study showingthat the watertable remained below this depth. Capillary rise of water and salts from below 3m is not likelyin a sandy soil and was thus assumed to be negligible.
4.3.4 Subsurface drainageNo subsurface drainflow was recorded during the study. The system remained dry so no water or salts leftthe field via this route.
4.3.5 Crop water abstractions and bare soil evaporationAn attempt was made to estimate crop evapotranspiration rates from evaporation pan measurements madeadjacent to the study site. Unfortunately the data were spurious and this approach was abandoned.
Bare soil evaporation was not monitored.
4.4 Water movement in the soil profile
4.4.1 HorizontalThe field was surrounded by similar agricultural land and the soil profile remained unsaturated throughout.Horizontal movement of water in the soil profile was thus assumed to be negligible during the study.
4.4.2 VerticalSoil wetness and water movement during the study are shown in figures 12 and 13. Figure 12 shows matricpotential measurements during the study. This figure gives a good indication of soil wetness in the profileduring the study period. Figure 13 shows total potential values which give information on water movementduring the study. The soil response to water inputs (irrigation and drainage) is clearly shown.
The year long study was divided into three distinct periods:
1) The summer season from day 1 (20th April) to day 127 (24th August), when the watermelon crop wasgrown.
2) The fallow period from day 127-196 (24th August to 1st November) with no cops and no irrigation.
3) The winter season from day 196 (1st November) to the end of the year, when irrigation resumed and awinter wheat crop was grown.
The soil profile was clearly wetter during the two crop seasons (with irrigation and rainfall) and drierduring the fallow period when there were no water applications.
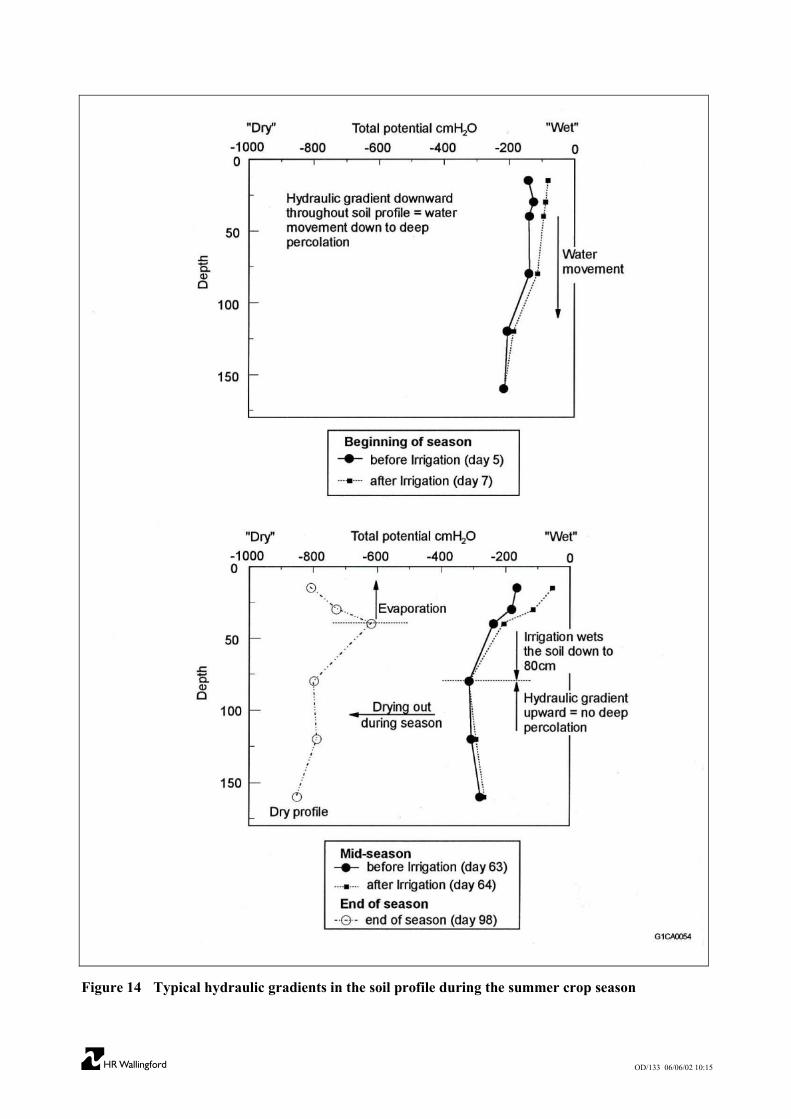
Summer Crop SeasonIrrigation inputs during the summer season showed up clearly as an increase in matric potential of the soildown to 80cm (figure 12). The soil below 80cm depth was little affected by water applications at the soilsurface. The only irrigation application which affected the soil below 80cm was the first and largest(60mm). Figure 14 shows that this irrigation application promoted water movement to deep percolation. Itwas the only leaching event during the summer season. The lower soil profile dried out evenly during the

���� 12 OD/133 06/06/02 10:15
second half of the season due to root water abstractions by the maturing watermelon crop. Hydraulicgradients (figure 13 and figure 14) in the surface layers were generally downward. The frequency ofirrigation applications (18 applications over three months) prevented the formation of significant upwardgradients in the shallow soil layers, except at the end of the season. Strong gradients did not develop in thedeeper profile and there was little evidence of deep percolation during the period. Typical profiles areshown in figure 14.
Fallow SeasonFollowing the final summer irrigation on day 83 (11th July) and harvesting of the watermelon crop the restof the soil profile dried out. After a period of water redistribution within the profile, matric potential values(figure 12) became stable for the fallow period. The profile during this time was very dry due to highevaporation rates over the dry summer and no water applications. The apparent moisture at 160cm depthwas most likely due to instrument error (quite likely when potentials are so low) and soil at this depth canbe presumed to be as dry as the rest of the profile. Hydraulic gradients were small over this period. (Figure15 shows a typical profile). Hydraulic conductivities were also very low at these low moisture contents, sowater movement was negligible during this season.
Winter Crop SeasonThe first major application of water during the winter wheat season was on day 196 (1st November)). Theprofile wetted up rapidly down to 80cm depth (figure 11) but it took a further 3-4 weeks for the deeperprofile to wet up fully. During this period water movement was slow. Deep percolation was not possibleuntil about day 220 (25th November) when a downward gradient through the soil profile was established.Figure 16 shows typical profiles.
Once the whole profile had been rewetted a pattern was established. Irrigation applications during thewinter wheat season were fewer (only 13 applications over five months) and larger than for the summercrop season. Soil moisture response and movement were thus different. In general the whole soil profilewetted up quickly following irrigation to near saturation (figure 12). For the winter crop, strong downwardhydraulic gradients (figure 13) and high hydraulic conductivities allowed water to move rapidly to thedeeper soil layers and deep percolation. Between irrigations the soil dried out from surface evaporation andincreasingly, as the wheat developed, from root water abstraction.
There was clearly water going to deep percolation during the winter wheat season. The potential dataindicated five significant leaching events during the season and several smaller events. Each of theseevents would have removed salts from the soil.
4.5 Leaching fraction determinationSoil moisture potential measurements from the study indicated movement of water to deep percolationduring the study, particularly during the winter wheat season. As there was no drainflow during the study,this was the major route by which salts left the study field. This leaching of salts out of the soil profilewould thus have had a significant impact on soil salinity levels.
To determine the frequency and magnitude of leaching events it is necessary to examine each waterapplication (irrigation or rainfall) in turn and determine whether deep percolation occurred and estimate theamount of water concerned.
Significant deep percolation and leaching can only occur if the soil moisture content is above fieldcapacity.
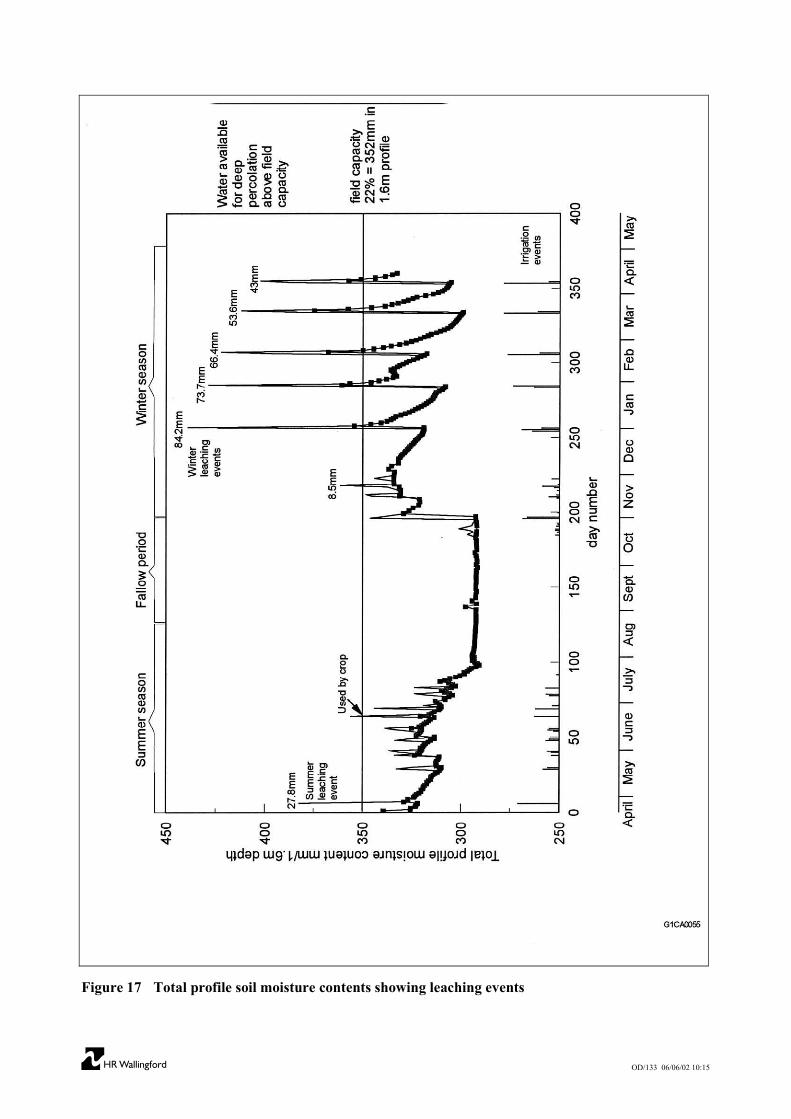
Figure 17 shows total profile volumetric moisture contents (down to 1.6m) for the study (details inappendix 8). The figure shows that when irrigation was applied or rain occurred the profile wetted up veryquickly. Initial drying out was also rapid for about two days (particularly in the winter wheat season)before progressing more slowly.

���� 13 OD/133 06/06/02 10:15
It was estimated from figure 17 that "field capacity" for the study field corresponded to a volumetricmoisture content of about 22% (moisture content of 352mm in a soil profile down to 1.6m depth), whichagrees well with the estimate from the soil profile moisture release curve. Any water added to the soilabove 22% (352mm) would be utilised by the crop over a 1-2 day period or have gone through the soilprofile to deep percolation.
Figure 17 also shows the calculated moisture contents of the soil profile immediately following irrigationor rainfall. It is clear to see when irrigation (or rainfall) took the moisture content above field capacity anddeep percolation was possible. There were two occasions during the summer crop, none during the fallowseason when the soil moisture content was always below field capacity, and six occasions during thewinter crop. Table 4 shows the likely amounts of water going to deep percolation on each of theseoccasions (appendix 8).
Table 4 Leaching events during the study and amounts of water going to deep percolation
Day numberwhen fieldcapacity
moisture contentwas exceeded
Water addedabove field
capacitymoisture content
(mm)
MonthEstimated 2 daycrop water use
(mm)
Deep Percolation(mm)
6 30 April 2.2 27.829 4 June 7.6 0
Summer total 27.8218 9 Nov 0.48 8.5257 87 Jan 2.8 84.2285 76.5 Jan 2.8 73.7307 70 Feb 3.6 66.4335 60 Mar 6.4 53.6355 50 April 7 43
Winter total 329.4
Table 4 indicates that there was one leaching event during the summer crop season, very near the start,when 27.8mm of water was estimated to have gone to deep percolation. This was caused by the irrigationon day 6 of 60mm (largest of the summer season, see section 4.4.2). There were six leaching events duringthe winter crop season, giving a total of 329.4mm water going to deep percolation. The first one (smallest)was caused by the rainfall event on day 218. The other five (larger events) were due to irrigationapplications. This agrees well with the tensiometer indications of deep percolation discussed in section4.4.2. The seasonal leaching fractions are shown in table 5.
Table 5 Seasonal water applications, deep percolation amounts and leaching fractions
SeasonIrrigation
and effectiverain (mm)
Deep Percolationmm Leaching Fraction
Summer 332.6 27.8 0.08Winter 673.3 329.4 0.49Total 1005.9 357.2 0.36
There was little deep percolation during the summer season and the vast majority (92%) of leaching thusoccurred in the winter season. As this was the main mechanism by which salts left the soil profile, wewould expect added salts to accumulate during the summer season and then be leached downward duringthe winter season.

���� 14 OD/133 06/06/02 10:15
4.6 Salt inputs and outputs
4.6.1 IrrigationIrrigation water provided the only salt input to the study field. Salinity (ECw) of irrigation applications isdetailed in appendix 6. The average salinity of the applied water was 5.38 dS/m (approximately 3450ppm). Water of this salinity is considered (Ayers and Westcot, 1985) unsuitable for agriculture as it poses a'severe' threat to production.
The total amount of salt added to the study field (see appendix 9) was 62.1 tonnes. This comprised 21.2tonnes during the summer season, none in the fallow season and 40.9 tonnes during the winter crop season.
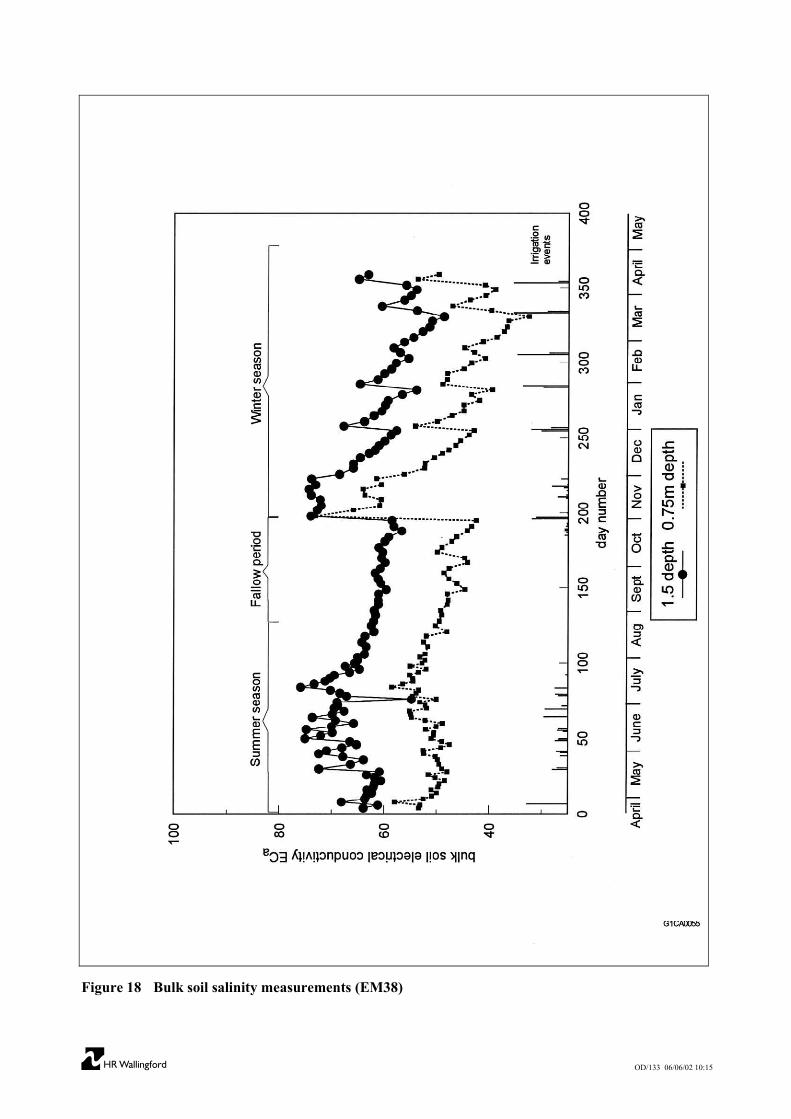
The effect of irrigation applications on soil salinity is illustrated by figure 18, which shows bulk soilelectrical conductivity (ECa) measurements from 0.7m and 1.5m depth across the field (see appendix 5).Soil salinity was always greater at the base (1.5m) of the soil profile. During the summer crop season, allirrigation applications, except the first, caused an increase in soil salinity. In the fallow period, fluctuationsin soil salinity were reduced as there were no irrigation applications. The figure indicates a gradualdecrease in soil salinity over the fallow period, which is probably due to diffusion processes taking saltsdeeper into the soil. The early irrigation applications of the winter crop season increased soil salinity asthere was no leaching, but subsequent applications promoted leaching and soil salinity levels reducedagain.
4.6.2 Soil salinity levelsSoil salinity levels were determined on a weekly basis from eight depths down to 1.6m. Figure 19 showsECe (electrical conductivity of saturated soil extract) values for the upper soil profile (0-1.0m depth) andfor the lower soil profile (1.2-1.6m depth) throughout the study.
Figure 19 shows that salinity levels in the upper soil profile were fairly stable throughout the year with ECevalues around 5-10 dS/m. Salinity in the lower soil profile was generally slightly higher except during thesummer season when ECe values averaged about 20 dS/m. Thus salts appeared to accumulate in the lowersoil profile during the summer season, but not during the fallow period or winter wheat season.
The likely effects on crops of these salinity levels are shown in Figure 20 in terms of the salinity classesdiscussed earlier. These were:
ECe < 5 dS/m - Little crop effect
ECe = 5-15 dS/m - Significant crop effect
ECe > 15 dS/m - Severe crop effect
Figure 20 clearly shows that during the summer crop season large portions of the soil profile (up to 60%)exhibited salinity levels that would be generally expected to pose a severe threat to crop growth and yield.These high salinity areas persisted for the whole crop season, only disappearing at the end. During harvestof the summer crop, soil salinity decreased although no leaching was observed. There was some movementof water (section 4.4.2) during the watermelon harvesting period, which may have enabled salts to moveout of the soil profile, but it is more likely that the salts moved downward predominantly by diffusionprocesses during this period.
Soil salinity was relatively stable during the fallow season with the whole profile exhibiting moderatelysignificant levels of salinity. There was no mass flow of water and salts during the fallow period, anddiffusion would be the only mechanism by which high soil salinity areas would be removed.

���� 15 OD/133 06/06/02 10:15
In the winter season the soil profile was dominated by soil of low salinity (little crop effect expected),suggesting a significant movement of salts out of the soil profile. Significant leaching events occurredduring the winter crop season, which carried salts below the soil profile to deep percolation. Althoughportions of high salinity soil occurred during the season they were shortlived.
The average soil salinity (ECe) for the soil profile was 12.6 dS/m for summer, 8.4 dS/m for the fallowperiod and 6.4 dS/m for winter.
4.6.3 Salt balanceIt was estimated that a total of 62.1 tonnes salt (see appendix 9) was added in the irrigation water to thestudy field during the two crop seasons. As there was no drainage during the study, this salt would eitherhave accumulated in the soil profile, or left the field via deep percolation or diffusion to deeper layers. Asalt balance was calculated for the crop seasons (there were no water or salt additions during the fallowperiod and no deep percolation) in the study field. The results are summarised below (details inAppendix 9):
Table 6 Seasonal salt balance for the study field
Salt added(tonnes)
Change insoil saltcontent(tonnes)
Salt to DeepPercolation
(tonnes)
Water toDeep
Percolation(mm)
Salinity ofDeep
Percolationwater(dS/m)
SummerCropSeason
21.2 +20.8 (98%) 0.4 (2%) 28 11.5
WinterCropSeason
40.9 +2.8 (7%) 38.1 (93%) 329 9.8
Total 62.1 +23.6 38.4 357 9.1
For the summer crop season, 98% of salt added with the irrigation water remained in the soil profile. Only0.4 tonnes left the soil by deep percolation (and diffusion at the end of the season). This was expected asthere was only one leaching event during the season which was small (28mm).
The winter crop season was quite different. 40.9 tonnes salt was added to the land but the salt accumulationwas only 2.8 tonnes. This was due to the large number of salt leaching events which occurred during thisseason. There were six significant events with a total of 329mm of water going to deep percolation. Thiswater removed an estimated 38.4 tonnes salt from the soil profile.
Salinity content of deep percolation water was high. During the summer season it was estimated to beabout 11.5 dS/m and for the winter season the average salinity was 9.8 dS/m.
4.7 Application of predictive methods to study resultsDrainwater reuse has been practised in the study area for over ten years. It is thus possible that steady-statesoil salinity levels have been attained, especially as the soil is very permeable and free draining. There wasnot a great variation in soil salinity levels during the study (figure 19). The average rootzone (taken as 0-1.6m) soil salinity (ECe) over the year was 8.6 dS/m. For the summer season it was 12.6 dS/m (whenleaching was very small) and for the winter season (when leaching was much higher) it was 6.4 dS/m. Theapplied water salinity (ECw) was very stable, averaging 5.38 dS/m for the whole year, and the two cropseasons.

���� 16 OD/133 06/06/02 10:15
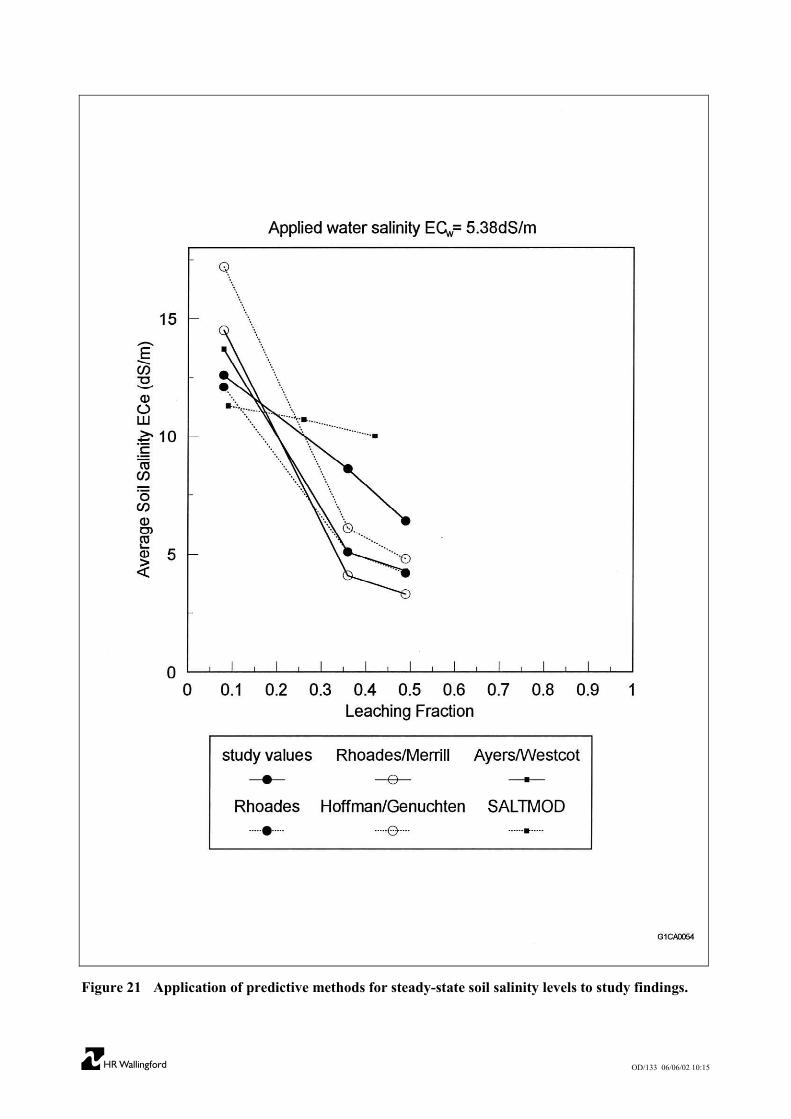
The predictive methods described in section 4.2 (except WATSUIT) were applied to the study findings.The results are summarised in table 7.
Table 7 Application of predictive methods for steady-state soil salinity levels to study findingsPeriod Summer Winter Whole Year
EC average(dS/m) 5.38 5.38 5.38
LeachingFraction (LF) 0.08 0.49 0.36
Study results
EC average 12.6 6.4 8.6Rhoades andMerrill 14.5 3.3 4.1
Ayers andWestcot 13.7 4.3 5.1
Rhoades 12.1 4.2 5.1Hoffman andvan Genuchten 17.2 4.8 6.1
PredictiveMethods andEC predicted
SALTMOD 11.3 (LF=0.09) 10.0 (LF=0.42) 10.7(LF=0.26)
These results are shown graphically in figure 21. All five predictive methods gave reasonable estimates ofsoil salinity levels at the study site, for the year as a whole and for the separate crop seasons. This isprobably because drainwater reuse had been practised for some time and an equilibrium situation had beenestablished. Also the soil had a low clay content (ie. physico-chemical reactions with clay particles wouldbe minimal) and was highly permeable and freely draining (leaching efficiencies should thus be very high).
At the lowest leaching fraction (0.08), the Rhoades relation and the SALTMOD model gave the closestpredictions. For a leaching fraction of 0.36, the Hoffman and van Genuchten equation and SALTMODgave the best predictions, and for the highest leaching fraction (0.49) the Hoffman and van Genuchtenequation gave the closest prediction.

���� 17 OD/133 06/06/02 10:15
5. CONCLUSIONS
The microstudy was a detailed investigation into the processes of salt accumulation and movement underdrainwater reuse. It was carried out in a farmer's field in the western Nile Delta, about 2 hectares in sizeand typical of those in the region.
The region is a reclaimed desert area which has a harsh arid climate and sandy soils. Soil permeability atthe study site was high and the field capacity moisture content was low. Storage of water in the soil profilewas thus poor. In areas where water scarcity is an issue (and leaching is not required to remove salts orother pollutants), such soils can be very wasteful of irrigation water. They are generally not well suited totraditional surface methods of irrigation, where large amounts of water are applied. They are better adaptedto modern irrigation methods (e.g. drip) where small amounts of water can be applied accurately andfrequently.
There were three seasons in the study field during the year of investigation. During the summer cropseason, of approximately 4 months, watermelon was grown with 18 applications of irrigation (10 "gifts"see appendix 6). This was followed by a fallow season of about 3 months when no crop was grown and noirrigation was applied. The winter crop was wheat grown over the last 5 months. There was some rainfallat the beginning of this season and 13 irrigation applications (6 "gifts").
The drainage water used for irrigation in the study field was very saline. The average salinity was over 5dS/m which is about 3200ppm. Water of this salinity is generally not considered suitable for agriculturalproduction.
Average rootzone soil salinity (ECe) levels during the two crop seasons were 12.6 dS/m for the summerseason and 6.4 dS/m for the winter season. Both crops reached maturity and produced good yields,although the international guidelines on crop yield reduction due to salinity predict 100% yield reductionfor the watermelon crop for ECe levels greater than 10 dS/m. It has been suggested by a number ofresearchers that these guidelines are conservative and this would certainly seem to be the case in thisinstance.
It was estimated that 62 tonnes of salt were added to the field during the study. In the summer season thevast majority of applied salt remained in the soil profile. Very little water and salts went to deeppercolation. During the fallow period, mass flow of water and salts was negligible and the only process ofsalt movement was diffusion. Most of the salt applied in the winter season was taken through the soilprofile to deep percolation. There were six significant leaching events during the winter which took 49% ofapplied water and 93% of applied salt out of the soil profile.
Five predictive methods for steady-state soil salinity determination were applied to the study findings. Allmethods gave reasonable agreement between predicted levels and actual levels recorded during the study.This is probably because drainwater reuse had been practised for some time and an equilibrium situationhad been established. Also the soil at the study site had low clay content (ie physico-chemical reactionswith clay particles would be minimal) and was highly permeable and freely draining (leaching efficienciesshould thus be very high). The best predictions were given by the methods of Rhoades, Hoffman and VanGenuchten, and the SALTMOD computer model.
The process of leaching during the winter crop season is critical in successful use of drainwater for cropproduction in the area. Leaching of salts is only sustainable with availability of extra irrigation water andthe presence of deep groundwater.
Over the year of study it was estimated that over 350mm of water and 38 tonnes of salt went through thesoil profile to the subsoil. This could lead to two problems:

���� 18 OD/133 06/06/02 10:15
1) Salinisation of groundwater. This is known to be only 3-4m deep. Groundwater is extracted by farmersin the area to use for irrigation and domestic purposes. Salinisation of groundwater will occur ifdrainwater reuse continues to add salts to the soil profile and carry them downward by deeppercolation.
2) Elevation of groundwater. Continued percolation of water to the groundwater may raise levels towardsthe rootzone. This will hamper both leaching and diffusion processes and bring extra salts into therootzone via secondary salinisation.
The salinity of drainwater being reused for irrigation in this area was high. However, the study has shownthat this water can be successfully used for agriculture with the adoption of appropriate managementtechniques. Leaching is the key to salinity control in the area, with diffusion playing a minor role inmaintaining acceptable soil salinity levels. Nevertheless, there is a danger that leaching may not be able toprevent long-term salinity build-up in areas such as this; an alternative method of control is to ensure thatthe salinity of mixed water used for irrigation is not excessive.

���� 19 OD/133 06/06/02 10:15
6. ACKNOWLEDGEMENTS
The Drainwater Reuse Effects Project is a collaborative programme between the Water ManagementResearch Institute (WMRI) of the Water Research Centre, Cairo, Egypt and the Overseas DevelopmentUnit (ODU) of HR Wallingford.
The project is being carried out within ODU's Soil Salinity and Drainage Section headed by Mr G.R.Pearce with support and funding provided by the UK Overseas Development Administration (ODA).
The director of WMRI is Dr D.E.D El-Quosy, and the head of the ODU is Dr K. Sanmuganathan. Thanksare also due to Engineer Amer and Engineer Bayoumi of WMRI. The microstudy is indebted to EngineerEzzat Badie and Ahmed Abdel Sattar of the Western Beheira Office, Engineer Abdallah Mohamed Abo ElAzem and Engineer Mohamed Refat Fraag of Wadi El Natrun and the farmer who kindly allowed usaccess to his land.
The assistance of the British Council in Cairo, particularly Dr Edwards and Mr Nazif is gratefullyacknowledged. Thanks are also due to N Hasnip for her assistance with report production.
���� 20 OD/133 06/06/02 10:15
7. REFERENCES
Abbott, C.L. 1995. A Management Tool for Drainwater Reuse, Stage 1: The Assessment Procedure. HRWallingford Report No OD/TN72.
Abbott, C.L. and El-Quosy, D.E.D. 1995. Soil Salinity Levels due to Reuse of Drainage Water in the NileDelta, Egypt. HR Wallingford Report No OD/TN71.
Amer & de Ridder
Ayers, R.S. and Westcot, D.W. 1985. Water quality for agriculture. FAO Irrigation and Drainage Paper 29.
Doorenbos and Kassam 1986. Yield Response to Water. FAO irrigation and drainage paper 33.
Girard, L. 1993. Water Quality Assessment and Monitoring in the Nile Delta, Egypt. ENGEES,Strasbourg, ODU HR Wallingford Report.
Hamdy, A. 1988. Research work at Bari Institute for reuse of low quality water and its impact on soils andcrops. Reuse Conference, Egypt.
Hinnawi, E.El and Hashmi, M.H. 1987. The State of the Environment, United Nations EnvironmentProgramme, Butterworth Scientific, Guildford, UK.
Hoffman, G J and Van Genuchten, M. Th. 1983. Water management for salimity control. In: Limitationsto Efficient Water Use in Crop Production Amer. Soc. Agron. Monograph
Maas, E.V. 1886. Salt Tolerance of Plants. Applied Agricultural Research Vol.1, no1, pp12-26.
Raats, P.A.C. 1974. Steady flows of water and salt in uniform soil profiles with plant roots. Soil Sci, Soc,Amer. Proc. 38: 717-722
Retournay, S. 1995. Drainwater Reuse for Irrigation - A Two Part Water Quality Assessment. ENGEES,Strasbourg, ODU HR Wallingford Report.
Rhoades, J.D., Shouse, P.J., Alves, W.J., Manteghi, N.A. and Lesch, S.M. 1990. Determining soil salinityfrom soil electrical conductivity using different models and estimates. Soil Sci. Soc. Am. J. 54:46-54.
Rhoades, J.D. and Merrill, S. D. 1976 Assessing the suitability of water for irrigation: Theoretical andempirical approaches. In: Prognosis of salinity and Alkalinity. FAO Soils Bulletin 31.
Smedema, L.K. and Rycroft, D.W. 1983. Land Drainage - planning and design of agricultural drainagesystems. Batsford Academic.
Rhoades, J.D. 1982. Reclamation and management of salt-affected soils after drainage.

���� OD/133 06/06/02 10:15
Appendices

���� OD/133 06/06/02 10:15

���� OD/133 06/06/02 10:15
Appendix 1
Gravimetric soil moisture determination

���� OD/133 06/06/02 10:15

���� OD/133 06/06/02 10:15
Appendix 1 Gravimetric soil moisture determination
Soil samples were augured from six positions in the study on a random basis once a week during the studyperiod. Sampling depths were 0.2m, 0.4m, 0.6m, 0.8m, 1m, 1.2m, 1.4m and 1.6m. Gravimetric soilmoisture was determined by weighing and oven drying.
m +mm =
ws
wg�
θg = gravimetric moisture contentmw = mass waterms = mass of oven dry soil

���� OD/133 06/06/02 10:15

���� OD/133 06/06/02 10:15
Appendix 2
Calibration of neutron probe

���� OD/133 06/06/02 10:15

���� OD/133 06/06/02 10:15
Appendix 2 Calibration of neutron probe
The CPN 503DR neutron probe was calibrated with volumetric soil moisture samples taken on 29th April1995.
Neutron probe measures volumetric soil moisture content, calculated as below:
MVF = [a x Rc/Rs] + b
MVF is moisture volume fraction %Rc is the count rate in the soilRs is the standard count ratea is a site specific constantb is a site specific constant
Figure 22 shows the obtained calibration line for which:
a = 68.841b = 8.65r2 = 0.9

���� OD/133 06/06/02 10:15

���� OD/133 06/06/02 10:15
Appendix 3
Mercury manometer tensiometers

���� OD/133 06/06/02 10:15

���� OD/133 06/06/02 10:15
Appendix 3 Mercury manometer tensiometers
Two profiles of mercury manometer tensiometers were installed in the study field to measure totalpotential. Installation depths were 0.15m, 0.3m, 0.4m, 0.8m, 1.2m and 1.6m.
Total potential is defined as:
Ψ total = Ψ grav + Ψ mat + Ψos
where
Ψ total = total potential (cmH20)
Ψ grav = gravitational potential (cmH20)
Ψ mat = matric potential (cmH20)
Ψ os = osmotic potential (cmH20)
Gravimetric potential is due to elevation above a datum.Matric potential is due to surface water tension forces in pore structure.Osmotic potential is caused by salts in soil water.
Matric potential values give a measure of the wetness of the soil at a given depth. A matric potential valueof 0 cm H2O indicates saturation at the soil surface. Readings become more negative as the soil dries out.
Total potential measurements are used to indicate direction of water movement within the soil profile.Water moves along potential gradients from high potential to low potential.

���� OD/133 06/06/02 10:15

���� OD/133 06/06/02 10:15
Appendix 4
Soil salinity determination

���� OD/133 06/06/02 10:15
���� OD/133 06/06/02 10:15
Appendix 4 Soil salinity determination
Samples taken for gravimetric soil moisture were also used to determine soil salinity at eight depthsthrough the soil profile. Six random positions were used once a week at depths 0.2m, 0.4m, 0.6m, 0.8m,1m, 1.2m, 1.4m and 1.6m.
Soil water extracts were prepared from the samples using 40g of oven dry soil and 200g distilled water(known as a 1:5 extract). The extracts were left to stand, filtered and then analysed. Samples were analysedfor total salt content by determining the electrical conductivity (EC5) of the extract.
To obtain electrical conductivity of saturated extracts (ECe), an inverse linear relation was assumedbetween the EC value and the soil moisture content(θ), as suggested by Smedema and Rycroft (1983).
ie. EC5 = θ5/θsp x ECe
where θsp is the moisture content of the soil extract at saturation point, and θ5is the moisture content of the1:5 extract.
For the study site:-
θ5 = 500%
θsp = 41%
ECe = 12 x EC5

���� OD/133 06/06/02 10:15

���� OD/133 06/06/02 10:15
Appendix 5
EM38 measurements

���� OD/133 06/06/02 10:15

���� OD/133 06/06/02 10:15
Appendix 5 EM38 measurements
A Geonics electromagnetic instrument (EM38) was used to measure bulk soil electrical conductivity (ECa)in five positions in the study field twice per week. The EM38 measures predominantly the average soilsalinity up to 0.7 and 1.5m of the ground layers when placed in horizontal and vertical positions on theground surface respectively. (Around 70% of the signal response arises from these depths.)
Calibration of ECa measurements with ECe levels was not attempted at the fieldsite. The calibrationrelation of Rhoades 1990 was used to obtain ECe levels:
ECa mS/m ECe dS/m
20 1.18
31 1.83
41 2.42
54 3.19
90 5.34
269 15.96
Transformation from soil electrical conductivity (ECa) measured with horizontal EM38 to electricalconductivity of saturation extract (ECe).

���� OD/133 06/06/02 10:15

���� OD/133 06/06/02 10:15
Appendix 6
Irrigation applications

���� OD/133 06/06/02 10:15

���� OD/133 06/06/02 10:15
Appendix 6 Irrigation applications
Summer Crop Season Winter Crop Season
Date DayNo
IrrigationTime (hrs)
Depth(mm)
EC(dS/m)
Date DayNo
IrrigationTime (hrs)
Depth(mm)
EC(dS/m)
25/4 6 10 60.32 6.7 1/11 196 12 53.71 5.9
18/5 29 5 22.38 5.5 2/11 197 10.8 47.07 5.9
19/5 30 3.5 15.66 5.6 30/12 255 7.0 39.5 5.7
27/5 38 2 10.12 5.1 31/12 256 9.8 55.02 5.8
29/5 40 2.5 10.7 5.0 1/1 257 4.5 25.39 5.7
30/5 41 3.5 16.35 5.1 28/1 284 6.5 36.68 5.6
6/6 48 5.5 18.19 6.2 29/1 285 12.0 67.72 5.0
7/6 49 3 13.43 5.9 19/2 306 13.5 76.18 5.5
12/6 54 1.5 6.71 5.6 20/2 307 5.0 28.22 5.6
13/6 55 3 15.18 6 19/3 334 14.5 81.83 4.8
14/6 56 3 13.43 5.2 20/3 335 5.5 31.04 5.1
22/6 64 7 35.42 0.8 8/4 354 14.5 81.83 5.0
27/6 69 7.5 33.57 6.0 9/4 355 2.5 15.08 5.3
29/6 71 2 8.56 5.9
6/7 78 3 13.43 5.5
7/7 79 4 17.9 6.0
11/7 83 4 18.68 5.9
20/7 92 0.35 2.6 6.0
Note: Each irrigation application was assumed to cover the whole cropped area. It is usual practice thatirrigation applications on consecutive days (e.g. day 29 and 30) would cover half the field at a time. Anirrigation "gift" thus covered the whole cropped area in 2-3 days. There were 10 "gifts" during the summerseason and 6 "gifts" during the winter season. As can be seen from the table each gift is grouped.

���� OD/133 06/06/02 10:15

���� OD/133 06/06/02 10:15
Appendix 7
Rainfall

���� OD/133 06/06/02 10:15

���� OD/133 06/06/02 10:15
Appendix 7 Rainfall
Date Day Number Rainfall (mm) Effective Rainfall (mm)
21/10 185 4.4 -
23/10 187 2 -
24/10 188 4.6 -
25/10 189 4.4 -
27/10 191 2.8 -
28/10 192 1.2 -
29/10 193 1.8 -
5/11 200 1.2 -
15/11 210 2.6 -
16/11 211 14.4 9.4
17/11 212 2.8 -
20/11 215 1.8 -
22/11 217 6 1
23/11 218 23.8 18.8
24/11 219 0.8 -
28.11 223 9.8 4.8
Total 84.4 34
Note: Effective rainfall for each event = Rainfall in event - 5mm

���� OD/133 06/06/02 10:15

���� OD/133 06/06/02 10:15
Appendix 8
Deep percolation calculation

���� OD/133 06/06/02 10:15

���� OD/133 06/06/02 10:15
Appendix 8 Deep percolation calculation
Moisture contentsTensiometer measurements of matric potential were converted to moisture content (mvf) for the whole soilprofile using the derived soil moisture release curve (figure 10).
The relation between soil matric potential and moisture content is of a power relation form:-
Y = axb
Y = matric potential
x = moisture content
For the study site soil, it was found:
a = 28.15b = -0.07
Figure 17 shows total profile soil moisture contents for the study year. Peaks are due to irrigationapplications or rainfall. Water potentially available for deep percolation is depth of water (mm) in the soilabove field capacity moisture content. Field capacity (section 4.2.3) = 22% for a soil profile of 1.6m, i.e.field capacity equals 352mm.

���� OD/133 06/06/02 10:15
Estim
ated
2-d
ay c
rop
wat
er u
sage
Cro
p w
ater
use
figu
res f
or E
gypt
giv
en a
s:-
JF
MA
MJ
JA
SO
ND
Uni
tsTo
tal
Whe
at17
623
140
344
114
3-
--
--
3018
5m
3 /F/m
onth
1609
Wat
erM
elon
--
--
139
483
538
428
412
--
-m
3 /F/m
onth
2000
Whe
at42
5596
105
34-
--
--
744
mm
/mon
th38
0
Wat
erM
elon
--
--
3311
512
810
298
--
-m
m/m
onth
476
Whe
at2.
83.
66.
47.
02.
2-
--
--
0.4
2.9
Wat
erM
elon
--
--
2.2
7.6
8.6
6.8
6.6
--
-
mm
/2 d
ays
mm
/2 d
ays
F =
fedd
an =
0.4
2ha
Val
ues u
sed
in T
able
4
Dee
p pe
rcol
atio
n th
en c
alcu
late
d (f
or e
ach
leac
hing
eve
nt) a
s bel
ow:-
Dee
p pe
rcol
atio
n (m
m) =
[Wat
er a
dded
to so
il ab
ove
field
cap
acity
] - [2
day
cro
p w
ater
requ
irem
ent].

���� OD/133 06/06/02 10:15
Appendix 9
Salt balance calculations (see section 4.6.3)

���� OD/133 06/06/02 10:15

���� OD/133 06/06/02 10:15
Appendix 9 Salt balance calculations (see section 4.6.3)
For the study field the salt balance was simplified to:-
Salt applied buildup of salt leachedin irrigation = salt in + downward bywater soil profile deep percolation
assumptions:
- no salt left field via subsurface drains (there was no drain flow)- there was no horizontal flow of salts- diffusion is small and can be included in deep percolation term
Salt applied in irrigation water
Irrigation water applied insummer and winter = 332.6mm + 639.3mm
= 0.972m
Irrigation water appliedto field area of 18500m2 = 0.972 x 18500m3
= 17982m3
Salt concentration = 5.38 ds/m= (633x5.38) + 44.8 g/m3
= 3450g/m3
Total salt added = 17982 x 3450gm= 62.1 x 10⁶gm= 62.1 tonnes
For summer season:
water added = 0.333m x 18500m2 = 6160m3
salt added = 6160m3 x 3450gm/m3 = 21.2 tonnes
For winter season:
water added = 0.639m x 18500m2 = 11821m3
salt added = 11821m3 x 3450gm/m3 = 40.9 tonnes
Buildup of salt in soil profile
Salt content of soil (profile to 1.6m) at start of year (day 8):-
EC5 average = 0.5 ds/m(where EC5 is the extract of 40g (0.04kg) soil + 200 ml water)
= (0.5 X 633) + 44.8kg/m3
1000 = 0.362 kg/m3
So for 200 ml water:

���� OD/133 06/06/02 10:15
Salt content = 200 x 10-6 x 0.362kg= 7.24 x 10⁻⁵kg salt per 0.04kg soil in field
Total mass of field = 18500 x 1.6x 1.51 x 103 kg/m3 = 4.47 x 10⁷ kg
So salt in whole field at start of year tonnes10 x 7.24 x 0.044.47 = 5-
= 80907 kg (80.9 tonnes)In a similar manner:-
Day number average EC5 (ds/m) salt content (kg)
8 0.5 80,907
127 0.648 101,786
375 0.668 104,615
By difference between salt content of the field, it can be seen:-
During summer season, the soil gained 20,879 kg saltDuring winter season, the soil gained 2,829 kg salt
Total gain in salt for = 23,708 kgyear
Therefore the salt removed from the soil profile by deep percolation was:-
- in summer season = 21256 - 20879 = 378 kg- in winter season = 40888 - 2829 = 38059 kg
Therefore the salinity of the deep percolation water was:-
- in summer season = 378kg salt in 28mm water= 378 kg/m3
0.0028 x 18500
= 7297 ppm
= 7297 - 44.8 dS/m 633
= 11.5 dS/m
- in winter season = 38059 kg salt in 329mm water= 38059 kg/m3
0.329 x 18500
= 6250ppm
= 6250 - 44.8 dS/m 633
= 9.8 dS/m

���� OD/133 06/06/02 10:15
Therefore salt removed to deep percolation in watermelon crop = 378kgand salt removed to deep percolation in wheat crop = 38,061kgSo the amounts of salt being removed to deep percolation can be calculated. Therefore the salinity of thedeep percolation water can be calculated.
The deep percolation (DPL) was 28mm for melon and 329mm for wheat.Therefore DPL for melon had a salt content of 11.5 dS/m, and DPL for wheat had a salt content of 9.8dS/m.

���� OD/133 06/06/02 10:15

���� OD/133 06/06/02 10:15
Figures

���� OD/133 06/06/02 10:15

���� OD/133 06/06/02 10:15
Figure 1 Mean root zone soil salinity as a function of applied water and leaching fraction

���� OD/133 06/06/02 10:15
Figure 2 Map of the Nile Delta, Egypt, showing location of the Western Nubaria AgriculturalProject, and main irrigation and drainage canals
���� OD/133 06/06/02 10:15
Figure 3 Layout of irrigation canals and drainage channels on the Western Nubaria Agriculturalproject, showing location of the study area

���� OD/133 06/06/02 10:15
Figure 4 Study field layout

���� OD/133 06/06/02 10:15
Figure 5 Relative salt tolerance of crops

���� OD/133 06/06/02 10:15
Figure 6 Soil texture
���� OD/133 06/06/02 10:15
Figure 7 Soil bulk density

���� OD/133 06/06/02 10:15
Figure 8 Infiltration rate at study site

���� OD/133 06/06/02 10:15
Figure 9 Soil moisture release curves at different depths

���� OD/133 06/06/02 10:15
Figure 10 Whole profile soil moisture release curve
���� OD/133 06/06/02 10:15
Figure 11 Irrigation applications and rainfall

���� OD/133 06/06/02 10:15
Figure 12 Matric potential (soil "wetness") at different depths in the soil profile

���� OD/133 06/06/02 10:15
Figure 13 Total potential (water movement) at different depths in the soil profile
���� OD/133 06/06/02 10:15
Figure 14 Typical hydraulic gradients in the soil profile during the summer crop season

���� OD/133 06/06/02 10:15
Figure 15 Typical hydraulic gradient in the soil profile during the fallow period

���� OD/133 06/06/02 10:15
Figure 16 Typical hydraulic gradients in the soil profile during the winter crop season
���� OD/133 06/06/02 10:15
Figure 17 Total profile soil moisture contents showing leaching events
���� OD/133 06/06/02 10:15
Figure 18 Bulk soil salinity measurements (EM38)

���� OD/133 06/06/02 10:15
Figure 19 Soil salinity levels (saturated extract) for the upper and lower soil profiles

���� OD/133 06/06/02 10:15
Figure 20 Soil salinity levels in terms of likely crop effects
���� OD/133 06/06/02 10:15
Figure 21 Application of predictive methods for steady-state soil salinity levels to study findings.

���� OD/133 06/06/02 10:15
Figure 22 Neutron probe calibration