Embed Size (px)
Citation preview
United StatesDepartment ofAgriculture
NaturalResourcesConservationService
In cooperation withNew Jersey AgriculturalExperiment Station;Rutgers, The StateUniversity of New Jersey;New Jersey Departmentof Agriculture, State SoilConservation Committee;and Salem County SoilConservation District
Soil Survey ofSalem County,New Jersey

i
Soil Survey of Salem County, New Jersey
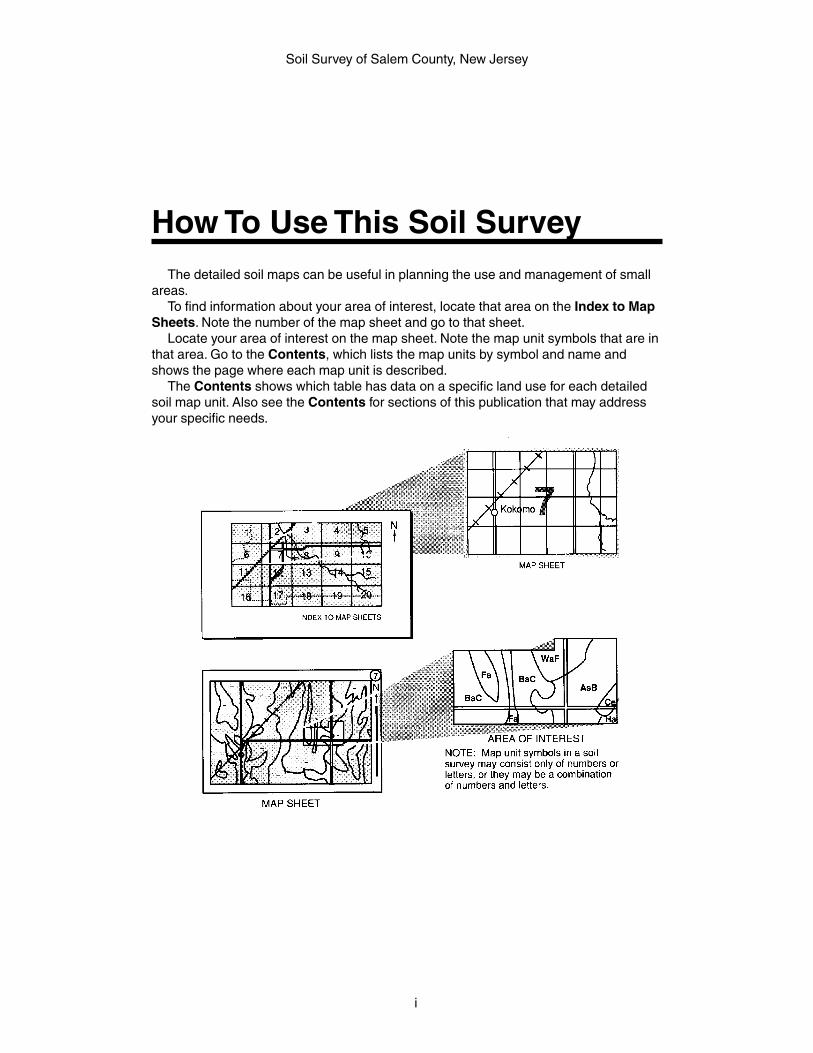
How To Use This Soil SurveyThe detailed soil maps can be useful in planning the use and management of small
areas.To find information about your area of interest, locate that area on the Index to Map
Sheets. Note the number of the map sheet and go to that sheet.Locate your area of interest on the map sheet. Note the map unit symbols that are in
that area. Go to the Contents, which lists the map units by symbol and name andshows the page where each map unit is described.
The Contents shows which table has data on a specific land use for each detailedsoil map unit. Also see the Contents for sections of this publication that may addressyour specific needs.

Soil Survey of Salem County, New Jersey
ii
Additional information about the Nation’s natural resources is available onlinefrom the Natural Resources Conservation Service at http://www.nrcs.usda.gov.
This soil survey is a publication of the National Cooperative Soil Survey, a joint effortof the United States Department of Agriculture and other Federal agencies, Stateagencies including the Agricultural Experiment Stations, and local agencies. TheNatural Resources Conservation Service (formerly the Soil Conservation Service) hasleadership for the Federal part of the National Cooperative Soil Survey.
Major fieldwork for this soil survey was completed in 1996. Soil names anddescriptions were approved in 2004. Unless otherwise indicated, statements in thispublication refer to conditions in the survey area in 1996. This survey was madecooperatively by the Natural Resources Conservation Service; the New JerseyAgricultural Experiment Station; Rutgers, The State University of New Jersey; the NewJersey Department of Agriculture, State Soil Conservation Committee; and the SalemCounty Soil Conservation District.
Soil maps in this survey may be copied without permission. Enlargement of thesemaps, however, could cause misunderstanding of the detail of mapping. If enlarged,maps do not show the small areas of contrasting soils that could have been shown at alarger scale.
The U.S. Department of Agriculture (USDA) prohibits discrimination in all itsprograms and activities on the basis of race, color, national origin, age, disability, or,where applicable, sex, marital status, familial status, parental status, religion, sexualorientation, genetic information, or political beliefs; as a means of reprisal; or becauseall or part of an individual’s income is derived from any public assistance program. (Notall prohibited bases apply to all programs.) Persons with disabilities who requirealternative means for communication of program information (Braille, large print,audiotape, etc.) should contact USDA’s TARGET Center at 202-720-2600 (voice andTDD).
To file a complaint of discrimination, write USDA, Director, Office of Civil Rights,Room 326W, Whitten Building, 14th and Independence Avenue SW, Washington, DC20250-9410, or call 202-720-5964 (voice or TDD). USDA is an equal opportunityprovider and employer.
Cover: Minimum tillage in an area of Downer sandy loam, 2 to 5 percent slopes, used for rowcrops.
iii
Soil Survey of Salem County, New Jersey
How To Use This Soil Survey ....................................................................................... iForeword ..................................................................................................................... ixGeneral Nature of the County ...................................................................................... 1
Land Use ................................................................................................................. 1Geology and Physiography ...................................................................................... 2Climate ..................................................................................................................... 3
How This Survey Was Made ........................................................................................ 3Survey Procedures .................................................................................................. 5
Detailed Soil Map Units ............................................................................................. 7AdkB—Adelphia sandy loam, 2 to 5 percent slopes ............................................... 8AhmB—Alloway sandy loam, 2 to 5 percent slopes ................................................ 9AhpB—Alloway loam, 2 to 5 percent slopes .......................................................... 10AhpC—Alloway loam, 5 to 10 percent slopes ....................................................... 10AhrA—Alloway silt loam, 0 to 2 percent slopes ..................................................... 11AhrB—Alloway silt loam, 2 to 5 percent slopes ..................................................... 12ApbAv—Appoquinimink-Broadkill complex, 0 to 1 percent slopes, very
frequently flooded ............................................................................................ 13AucB—Aura loamy sand, 0 to 5 percent slopes .................................................... 14AugB—Aura sandy loam, 2 to 5 percent slopes .................................................... 15AugC—Aura sandy loam, 5 to 10 percent slopes .................................................. 16AuhB—Aura gravelly sandy loam, 2 to 5 percent slopes ....................................... 17AuhC—Aura gravelly sandy loam, 5 to 10 percent slopes .................................... 17AupA—Aura loam, 0 to 2 percent slopes ............................................................... 19AupB—Aura loam, 2 to 5 percent slopes ............................................................... 19BEXAS—Berryland and Mullica soils, 0 to 2 percent slopes, occasionally
flooded............................................................................................................. 20ChsAt—Chicone silt loam, 0 to 1 percent slopes, frequently flooded ................... 22ChtA—Chillum silt loam, 0 to 2 percent slopes ..................................................... 22ChtB—Chillum silt loam, 2 to 5 percent slopes ..................................................... 23DocB—Downer loamy sand, 0 to 5 percent slopes ............................................... 24DocC—Downer loamy sand, 5 to 10 percent slopes ............................................. 25DoeA—Downer sandy loam, 0 to 2 percent slopes ............................................... 25DoeB—Downer sandy loam, 2 to 5 percent slopes ............................................... 26DopB—Downer-Galestown complex, 0 to 5 percent slopes ................................. 27DouB—Downer-Urban land complex, 0 to 5 percent slopes ................................. 28EveB—Evesboro sand, 0 to 5 percent slopes ....................................................... 29EveC—Evesboro sand, 5 to 10 percent slopes ..................................................... 30FmhAt—Fluvaquents, loamy, 0 to 3 percent slopes, frequently flooded ............... 30FodB—Fort Mott loamy sand, 0 to 5 percent slopes ............................................. 31GabB—Galestown sand, 0 to 5 percent slopes .................................................... 32GamB—Galloway loamy sand, 0 to 5 percent slopes ........................................... 33HbmB—Hammonton loamy sand, 0 to 5 percent slopes ...................................... 34HboA—Hammonton sandy loam, 0 to 2 percent slopes ....................................... 34HbrB—Hammonton-Urban land complex, 0 to 2 percent slopes .......................... 35
Contents
iv
Soil Survey of Salem County, New Jersey
KeoC—Keyport loam, 5 to 10 percent slopes ....................................................... 36MakAt—Manahawkin muck, 0 to 2 percent slopes, frequently flooded ................. 37MamnAv—Mannington-Nanticoke complex, 0 to 1 percent slopes, very
frequently flooded ............................................................................................ 38MasB—Marlton silt loam, 2 to 5 percent slopes .................................................... 39MasC—Marlton silt loam, 5 to 10 percent slopes .................................................. 39MbrA—Matapeake silt loam, 0 to 2 percent slopes ............................................... 40MbrB—Matapeake silt loam, 2 to 5 percent slopes ............................................... 41MbrC—Matapeake silt loam, 5 to 10 percent slopes ............................................. 42MbuA—Mattapex silt loam, 0 to 2 percent slopes ................................................. 43MbuB—Mattapex silt loam, 2 to 5 percent slopes ................................................. 43MbxB—Mattapex-Urban land complex, 0 to 5 percent slopes .............................. 44MutA—Muttontown sandy loam, 0 to 2 percent slopes ......................................... 45OTKA—Othello and Fallsington soils, 0 to 2 percent slopes ................................. 46OTMA—Othello, Fallsington, and Trussum soils, 0 to 2 percent slopes ................ 47PEEAR—Pedricktown, Askecksy, and Mullica soils, 0 to 2 percent slopes,
rarely flooded .................................................................................................. 48PHG—Pits, sand and gravel .................................................................................. 50PHM—Pits, clay ..................................................................................................... 51SacA—Sassafras sandy loam, 0 to 2 percent slopes ........................................... 51SacB—Sassafras sandy loam, 2 to 5 percent slopes ........................................... 52SacC—Sassafras sandy loam, 5 to 10 percent slopes ......................................... 53SafA—Sassafras loam, 0 to 2 percent slopes ....................................................... 54SanA—Sassafras-Woodstown complex, 0 to 2 percent slopes ............................ 54ShnA—Sharptown silt loam, 0 to 2 percent slopes ............................................... 56ShnB—Sharptown silt loam, 2 to 5 percent slopes ............................................... 56SwtB—Swedesboro loamy sand, 0 to 5 percent slopes ........................................ 57SwtC—Swedesboro loamy sand, 5 to 10 percent
slopes .............................................................................................................. 58TrkAv—Transquaking mucky peat, 0 to 1 percent slopes, very frequently
flooded............................................................................................................. 59UddfB—Udorthents, dredged fine material, 0 to 8 percent slopes ........................ 59UdrB—Udorthents, refuse substratum, 0 to 8 percent slopes ............................... 60UdsB—Udorthents, sandy substratum, 0 to 8 percent slopes .............................. 61UR—Urban land .................................................................................................... 61WATER—Water ..................................................................................................... 62WoeA—Woodstown sandy loam, 0 to 2 percent slopes ........................................ 62
Use and Management of the Soils .......................................................................... 65Interpretive Ratings ............................................................................................... 65
Rating Class Terms ........................................................................................... 65Numerical Ratings ............................................................................................. 65
Crops and Pasture ................................................................................................. 66Cropland ............................................................................................................ 66Pasture and Hayland ......................................................................................... 69
v
Soil Survey of Salem County, New Jersey
Ornamental Crops ............................................................................................. 70Orchards ............................................................................................................ 71Yields per Acre .................................................................................................. 72Land Capability Classification ........................................................................... 72
Prime Farmland and Other Important Farmlands .................................................. 73Agricultural Waste Management ............................................................................ 74Forestland Productivity and Management ............................................................. 76Recreation ............................................................................................................. 77Wildlife Habitat ....................................................................................................... 79Hydric Soils ............................................................................................................ 81Engineering ........................................................................................................... 83
Building Site Development ................................................................................ 83Sanitary Facilities .............................................................................................. 85Construction Materials ...................................................................................... 87Water Management ........................................................................................... 88
Soil Properties .......................................................................................................... 91Engineering Index Properties ................................................................................ 91Physical Properties ................................................................................................ 92Chemical Properties .............................................................................................. 94Soil Features .......................................................................................................... 95Water Features ...................................................................................................... 96
Classification of the Soils ....................................................................................... 99Soil Series and Their Morphology .............................................................................. 99
Adelphia Series ................................................................................................... 100Alloway Series ..................................................................................................... 102Appoquinimink Series .......................................................................................... 104Askecksy Series .................................................................................................. 106Aura Series .......................................................................................................... 107Berryland Series .................................................................................................. 110Broadkill Series .................................................................................................... 111Chicone Series .................................................................................................... 113Chillum Series ..................................................................................................... 114Downer Series ..................................................................................................... 115Evesboro Series .................................................................................................. 117Fallsington Series ................................................................................................ 118Fluvaquents ......................................................................................................... 120Fort Mott Series ................................................................................................... 121Galestown Series ................................................................................................ 123Galloway Series ................................................................................................... 125Hammonton Series .............................................................................................. 126Keyport Series ..................................................................................................... 128Manahawkin Series ............................................................................................. 130Mannington Series ............................................................................................... 131Marlton Series ..................................................................................................... 133
vi
Soil Survey of Salem County, New Jersey
Matapeake Series ................................................................................................ 135Mattapex Series ................................................................................................... 136Mullica Series ...................................................................................................... 138Muttontown Series ............................................................................................... 140Nanticoke Series ................................................................................................. 142Othello Series ...................................................................................................... 143Pedricktown Series .............................................................................................. 145Sassafras Series ................................................................................................. 146Sharptown Series ................................................................................................ 148Swedesboro Series ............................................................................................. 150Transquaking Series ............................................................................................ 151Trussum Series .................................................................................................... 152Udorthents ........................................................................................................... 154Woodstown Series ............................................................................................... 154
Formation of the Soils ........................................................................................... 157Factors of Soil Formation ..................................................................................... 157
Parent Material ................................................................................................ 157Climate ............................................................................................................ 158Plant and Animal Life ....................................................................................... 158Relief ............................................................................................................... 159Time................................................................................................................. 159
Processes of Horizon Differentiation ................................................................... 162References .............................................................................................................. 163Glossary .................................................................................................................. 165Tables ...................................................................................................................... 183
Table 1.—Temperature and Precipitation ............................................................ 184Table 2.—Freeze Dates in Spring and Fall .......................................................... 185Table 3.—Growing Season .................................................................................. 185Table 4.—Acreage and Proportionate Extent of the Soils ................................... 186Table 5.—Land Capability and Yields per Acre of Crops in Irrigated and
Nonirrigated Areas ........................................................................................ 188Table 6.—Acreage by Capability Class and Subclass ......................................... 194Table 7.—Prime Farmland and Other Important Farmlands ............................... 195Table 8a.—Agricultural Waste Management (Part 1) .......................................... 196Table 8b.—Agricultural Waste Management (Part 2) ........................................... 206Table 9.—Forestland Productivity ........................................................................ 217Table 10a.—Recreational Development (Part 1) ................................................. 225Table 10b.—Recreational Development (Part 2) ................................................. 232Table 11.—Wildlife Habitat ................................................................................... 238Table 12.—Hydric Soils ........................................................................................ 245Table 13a.—Building Site Development (Part 1) ................................................. 254Table 13b.—Building Site Development (Part 2) .................................................. 260Table 14.—Sanitary Facilities .............................................................................. 268Table 15.—Disposal Fields .................................................................................. 278
vii
Soil Survey of Salem County, New Jersey
Issued June 2008
Table 16a.—Construction Materials (Part 1) ....................................................... 287Table 16b.—Construction Materials (Part 2) ........................................................ 294Table 17.—Water Management ........................................................................... 303Table 18.—Engineering Index Properties ............................................................ 311Table 19.—Physical Properties of the Soils ......................................................... 335Table 20.—Chemical Properties of the Soils ....................................................... 348Table 21.—Soil Features ..................................................................................... 358Table 22.—Water Features .................................................................................. 364Table 23.—Classification of the Soils .................................................................. 372Table 24.—Relationship Between Major Landforms, Soil Characteristics, and
Drainage of Soils ........................................................................................... 373

ix
Soil Survey of Salem County, New Jersey
This soil survey contains information that affects land use planning in this surveyarea. It contains predictions of soil behavior for selected land uses. The survey alsohighlights soil limitations, improvements needed to overcome the limitations, and theimpact of selected land uses on the environment.
This soil survey is designed for many different users. Farmers, foresters, andagronomists can use it to evaluate the potential of the soil and the managementneeded for maximum food and fiber production. Planners, community officials,engineers, developers, builders, and home buyers can use the survey to plan landuse, select sites for construction, and identify special practices needed to ensureproper performance. Conservationists, teachers, students, and specialists inrecreation, wildlife management, waste disposal, and pollution control can use thesurvey to help them understand, protect, and enhance the environment.
Various land use regulations of Federal, State, and local governments may imposespecial restrictions on land use or land treatment. The information in this report isintended to identify soil properties that are used in making various land use or landtreatment decisions. Statements made in this report are intended to help the landusers identify and reduce the effects of soil limitations on various land uses. Thelandowner or user is responsible for identifying and complying with existing laws andregulations.
Great differences in soil properties can occur within short distances. Some soilsare seasonally wet or subject to flooding. Some are shallow to bedrock. Some are toounstable to be used as a foundation for buildings or roads. Clayey or wet soils arepoorly suited to use as septic tank absorption fields. A high water table makes a soilpoorly suited to basements or underground installations.
These and many other soil properties that affect land use are described in this soilsurvey. The location of each soil is shown on the detailed soil maps. Each soil in thesurvey area is described. Information on specific uses is given for each soil. Help inusing this publication and additional information are available at the local office of theNatural Resources Conservation Service or the Cooperative Extension Service.
Thomas DrewesState ConservationistNatural Resources Conservation Service
Foreword

1
Soil Survey of Salem County, New Jersey
Project supervision by Lenore Matula Vasilas andThornton J.F. Hole, Natural Resources Conservation Service
Fieldwork by Scott C. Keenan, Natural Resources ConservationService
Final manuscript by Edwin Muñiz, Natural ResourcesConservation Service
United States Department of Agriculture, Natural ResourcesConservation Service,in cooperation withthe New Jersey Agricultural Experiment Station; Rutgers, TheState University of New Jersey; the New Jersey Departmentof Agriculture, State Soil Conservation Committee; and theSalem County Soil Conservation District
Soil Survey of
Salem County, New Jersey
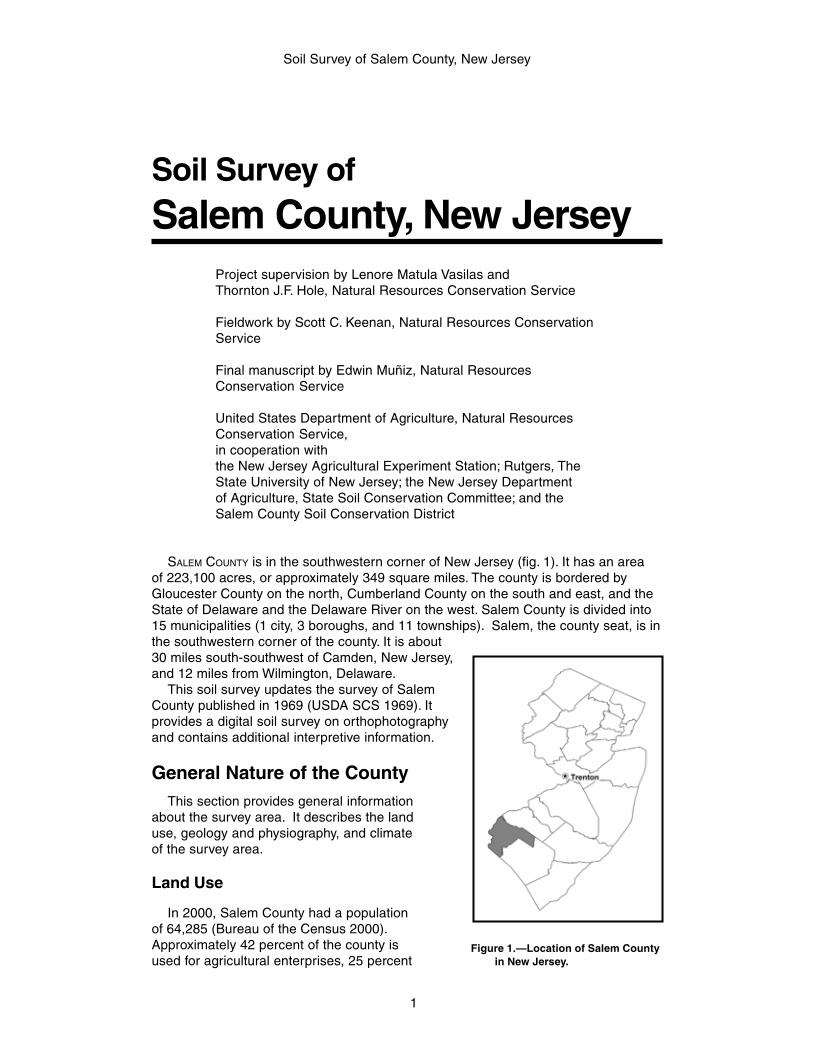
SALEM COUNTY is in the southwestern corner of New Jersey (fig. 1). It has an areaof 223,100 acres, or approximately 349 square miles. The county is bordered byGloucester County on the north, Cumberland County on the south and east, and theState of Delaware and the Delaware River on the west. Salem County is divided into15 municipalities (1 city, 3 boroughs, and 11 townships). Salem, the county seat, is inthe southwestern corner of the county. It is about30 miles south-southwest of Camden, New Jersey,and 12 miles from Wilmington, Delaware.
This soil survey updates the survey of SalemCounty published in 1969 (USDA SCS 1969). Itprovides a digital soil survey on orthophotographyand contains additional interpretive information.
General Nature of the CountyThis section provides general information
about the survey area. It describes the landuse, geology and physiography, and climateof the survey area.
Land Use
In 2000, Salem County had a populationof 64,285 (Bureau of the Census 2000).Approximately 42 percent of the county isused for agricultural enterprises, 25 percent
Figure 1.—Location of Salem Countyin New Jersey.
Soil Survey of Salem County, New Jersey
2
is used as wetlands, 17 percent is forested, 9 percent is urbanized, and the remaining7 percent is barren land (New Jersey Department of Environmental Protection 1986).The areas used for agricultural purposes are distributed throughout the county. In2002, the primary agricultural products were livestock and poultry, vegetables,orchard crops, silage, and grain (USDA NASS 2004).
Geology and Physiography
Max Olynyk, state geologist, Natural Resources Conservation Service, helped to prepare this section.
Salem County is located within the Atlantic Coastal Plain Physiographic Province.It is underlain by unconsolidated coastal plain deposits of Quaternary, Tertiary, andCretaceous age. These deposits are composed of alternating clay, silt, sand, andgravel and are underlain by crystalline rocks of Early Paleozoic or Late Precambrianage. They range in thickness from about 200 feet in the northwestern part of thecounty to about 2,400 feet in the extreme southeastern part of the county.
The Late Precambrian Wissahickon Formation is composed of schist and gneiss.These metamorphic rocks are generally characterized by having significant amountsof mica, quartz, feldspar, garnet, and chlorite.
Overlaying the Wissahickon Formation are several important aquifers. They are, inorder from bottom to top, the Potomac Group and Raritan and Magothy Formations,the Wenonah Formation and Mount Laurel Sand, the Vincentown Formation, theCohansey Sand, and the Cape May Formation.
The Potomac Group and Raritan Formation of early Cretaceous age are largelycontinental (formed from nonmarine deposits), while the Magothy Formation is bothcontinental and marine in origin. The Potomac Group consists of interbedded sand,gravelly sand, and clay. The Raritan Formation is composed of sand, gravel, andsome clay, while the Magothy Formation consists of alternating beds of pyritic andlignitic dark clay and white, micaceous quartz sand and fine gravel. The combinedthickness of these formations reaches 1,000 feet in the southeastern part of thecounty.
The Wenonah Formation and overlying Mount Laurel Sand are of Cretaceous age.While the Wenonah Formation is characterized by micaceous sand that isoccasionally lignitic and glauconitic, the medium to coarse grained glauconitic sandsof the Mount Laurel Sand are much less micaceous and lignitic. The combinedthickness of the formations is approximately 80 to 100 feet.
The Vincentown Formation of the Paleocene Epoch is a slightly clayey, mediumgrained sand. Quartz and feldspar are major constituents, and glauconite, mica,and pyrite are minor constituents. The Vincentown Formation is well known for beinghighly fossiliferous. The maximum thickness of the formation is approximately160 feet.
The Kirkwood Formation of the Miocene Epoch overlies formations from theEocene and Paleocene Epochs. It typically consists of dark clay having some silt andlayers of fine grained sand with some areas of primary clays. Occasionally, finegrained sands may include beds of coarse grained sand with abundant glauconite.The Kirkwood Formation is overlain by the Cohansey Sand or material from theQuaternary age.
The Cohansey Sand of the Miocene and Pliocene Epochs underlies approximately25 percent of Salem County. This medium to coarse grained sand containsoccasional lenses of gravel and clay. A dip to the southeast ranges from 6 to 16 feetper mile. The thickness of this formation may reach 200 feet in the eastern part ofSalem County.
The Cohansey Sand is the uppermost Tertiary Period Formation in the New JerseyCoastal Plain. It lies between the Kirkwood Formation and other younger deposits ofthe Pleistocene Epoch, which include the Cape May Formation. The medium to
Soil Survey of Salem County, New Jersey
3
coarse grained sands of the Cape May Formation are interspersed with abundantquantities of gravel but minor amounts of clay. The formation may reach a thickness of150 feet in the southwestern part of Salem County (Rosenau and others 1969).
The relief of Salem County is low, and slopes are relatively gentle. The pre-Quaternary deposits dip gently to the southeast. A 4-mile strip of tidal marshbordering the Delaware River has elevations of generally less than 10 feet. Fartherinland, the land surface rises gradually to gently rolling hills. The highest areas are inthe eastern part of the county where elevations reach 160 feet.
Salem County is drained by a network of streams, the largest of which, the SalemRiver, flows into the Delaware River. The extreme eastern part of the county isdrained by the Maurice River, which flows southward through Cumberland County tothe Delaware Bay. Other major streams discharge into the Delaware River.
Climate
Prepared by the National Water and Climate Center, Natural Resources Conservation Service, inPortland, Oregon.
Table 1 gives data on temperature and precipitation for the survey area asrecorded at Woodstown, New Jersey in the period 1961-90. Table 2 shows probabledates of the first freeze in fall and the last freeze in spring. Table 3 provides data onlength of the growing season.
In winter, the average temperature is 33.7 degrees F and the average dailyminimum temperature is 24.7 degrees. The lowest temperature on record, whichoccurred on January 22, 1984, is -13 degrees. In summer, the average temperature is74.2 degrees and the average daily maximum temperature is 85.7 degrees. Thehighest recorded temperature, which occurred on July 3, 1966, is 103 degrees.
Growing degree days are shown in table 1. They are equivalent to “heat units.”During the month, growing degree days accumulate by the amount that the averagetemperature each day exceeds a base temperature (50 degrees F). The normalmonthly accumulation is used to schedule single or successive plantings of a cropbetween the last freeze in spring and the first freeze in fall.
The total annual precipitation is 44.04 inches. Of this, about 23.5 inches, or53 percent, usually falls in April through September. The growing season for mostcrops falls within this period. In 2 years out of 10, the rainfall in April throughSeptember is less than 12.78 inches. The heaviest 1-day rainfall during the period ofrecord was 6.92 inches on September 12, 1960. Thunderstorms occur on about30 days each year, and most occur in June, July, and August.
The average seasonal snowfall is 19.2 inches. The greatest snow depth at any onetime during the period of record was 25 inches. On the average, 19 days of the yearhave at least 1 inch of snow on the ground. The number of such days varies greatlyfrom year to year. The heaviest 1-day snowfall on record was 17.0 inches onFebruary 19, 1979.
The average relative humidity in midafternoon is about 55 percent. Humidity ishigher at night, and the average at dawn is about 78 percent. The sun shines62 percent of the time possible in summer and 51 percent in winter. The prevailingwind is from the northwest from October to April and from the south the remainder ofthe year. Average windspeed is highest, 11 miles per hour, in March and April.
How This Survey Was MadeThis survey was made to provide information about the soils and miscellaneous
areas in the survey area. The information includes a description of the soils andmiscellaneous areas and their location and a discussion of their suitability, limitations,and management for specified uses. Soil scientists observed the steepness, length,
Soil Survey of Salem County, New Jersey
4
and shape of the slopes; the general pattern of drainage; and the kinds of crops andnative plants. They dug many holes to study the soil profile, which is the sequence ofnatural layers, or horizons, in a soil. The profile extends from the surface down intothe unconsolidated material in which the soil formed. The unconsolidated material isdevoid of roots and other living organisms and has not been changed by otherbiological activity.
The soils and miscellaneous areas in the survey area are in an orderly pattern thatis related to the geology, landforms, relief, climate, and natural vegetation of the area.Each kind of soil and miscellaneous area is associated with a particular kind oflandform or with a segment of the landform. By observing the soils and miscellaneousareas in the survey area and relating their position to specific segments of thelandform, a soil scientist develops a concept or model of how they were formed. Thus,during mapping, this model enables the soil scientist to predict with a considerabledegree of accuracy the kind of soil or miscellaneous area at a specific location on thelandscape.
Commonly, individual soils on the landscape merge into one another as theircharacteristics gradually change. To construct an accurate soil map, however, soilscientists must determine the boundaries between the soils. They can observe only alimited number of soil profiles. Nevertheless, these observations, supplemented by anunderstanding of the soil-vegetation-landscape relationship, are sufficient to verifypredictions of the kinds of soil in an area and to determine the boundaries.
Soil scientists recorded the characteristics of the soil profiles that they studied.They noted soil color, texture, size and shape of soil aggregates, kind and amount ofrock fragments, distribution of plant roots, reaction, and other features that enablethem to identify soils. After describing the soils in the survey area and determiningtheir properties, the soil scientists assigned the soils to taxonomic classes (units).Taxonomic classes are concepts. Each taxonomic class has a set of soilcharacteristics with precisely defined limits. The classes are used as a basis forcomparison to classify soils systematically. Soil taxonomy, the system of taxonomicclassification used in the United States, is based mainly on the kind and character ofsoil properties and the arrangement of horizons within the profile. After the soilscientists classified and named the soils in the survey area, they compared theindividual soils with similar soils in the same taxonomic class in other areas so thatthey could confirm data and assemble additional data based on experience andresearch.
While a soil survey is in progress, samples of some of the soils in the areagenerally are collected for laboratory analyses and for engineering tests. Soilscientists interpret the data from these analyses and tests as well as the field-observed characteristics and the soil properties to determine the expected behaviorof the soils under different uses. Interpretations for all of the soils are field testedthrough observation of the soils in different uses and under different levels ofmanagement. Some interpretations are modified to fit local conditions, and some newinterpretations are developed to meet local needs. Data are assembled from othersources, such as research information, production records, and field experience ofspecialists. For example, data on crop yields under defined levels of management areassembled from farm records and from field or plot experiments on the same kinds ofsoil.
Predictions about soil behavior are based not only on soil properties but also onsuch variables as climate and biological activity. Soil conditions are predictable overlong periods of time, but they are not predictable from year to year. For example, soilscientists can predict with a fairly high degree of accuracy that a given soil will have ahigh water table within certain depths in most years, but they cannot predict that ahigh water table will always be at a specific level in the soil on a specific date.
Soil Survey of Salem County, New Jersey
5
After soil scientists located and identified the significant natural bodies of soil in thesurvey area, they drew the boundaries of these bodies on aerial photographs andidentified each as a specific map unit. Aerial photographs show trees, buildings,fields, roads, and rivers, all of which help in locating boundaries accurately.
Survey Procedures
The general procedures followed in making this survey are described in the“National Soil Survey Handbook” of the Natural Resources Conservation Service andin the “Soil Survey Manual” (Soil Survey Division Staff 1993; USDA NRCS 1996).
Before fieldwork began, preliminary boundaries of slopes and landforms wereplotted stereoscopically on aerial photographs taken in 1996 and 1997 at a scale of1:24,000. U.S. Geological Survey geologic and topographic maps, at a scale of1:24,000, were also used. Map units were then designed according to the pattern ofsoils interpreted from aerial photographs, maps, and field observations.
Two levels of mapping intensity were used in this survey. More closely spacedobservations were made on the landforms where the soils are used for agriculture,timber production, or urban development. Less closely spaced observations weremade in forested wetlands and tidal flats where access was difficult. For either level ofmapping intensity, the information about the soils can be used to determine soilmanagement and to predict the suitability of the soils for various uses.
Traverses were made on foot. The soils were examined at intervals ranging from afew hundred feet to about 0.25 mile, depending on the landform and soil pattern.Observations of special features, such as landforms, vegetation, and evidence offlooding, were made continuously without regard to spacing. Soil boundaries weredetermined on the basis of soil examinations, observations, and aerial photointerpretation. In many areas, such as those where flood plains intersect with knolls,these boundaries are precise because of an abrupt change in the landform. The soilswere examined with the aid of a hand probe, a bucket auger, or a spade to a depth ofabout 3 to 5 feet. The typical pedons were observed in pits dug by hand.
Soil boundaries were plotted stereoscopically on the basis of parent material,landform, and relief. Many of these boundaries cannot be exact because they fallwithin a zone of gradual change between landforms, such as an area where thelowest part of a flat begins to become a slight depression. Much intermingling of thesoils occurs in these zones.

7
Soil Survey of Salem County, New Jersey
The map units delineated on the detailed soil maps in this survey represent thesoils or miscellaneous areas in the survey area. The map unit descriptions in thissection, along with the maps, can be used to determine the suitability and potential ofa unit for specific uses. They also can be used to plan the management needed forthose uses.
A map unit delineation on a soil map represents an area dominated by one ormore major kinds of soil or miscellaneous areas. A map unit is identified and namedaccording to the taxonomic classification of the dominant soils. Within a taxonomicclass there are precisely defined limits for the properties of the soils. On thelandscape, however, the soils are natural phenomena, and they have thecharacteristic variability of all natural phenomena. Thus, the range of some observedproperties may extend beyond the limits defined for a taxonomic class. Areas of soilsof a single taxonomic class rarely, if ever, can be mapped without including areas ofother taxonomic classes. Consequently, every map unit is made up of the soils ormiscellaneous areas for which it is named and some minor components that belongto taxonomic classes other than those of the major soils.
Most minor soils have properties similar to those of the dominant soil or soils in themap unit, and thus they do not affect use and management. These are callednoncontrasting, or similar, components. They may or may not be mentioned in aparticular map unit description. Other minor components, however, have propertiesand behavioral characteristics divergent enough to affect use or to require differentmanagement. These are called contrasting, or dissimilar, components. They generallyare in small areas and could not be mapped separately because of the scale used.Some small areas of strongly contrasting soils or miscellaneous areas are identifiedby a special symbol on the maps. The contrasting components are mentioned in themap unit descriptions. A few areas of minor components may not have beenobserved, and consequently they are not mentioned in the descriptions, especiallywhere the pattern was so complex that it was impractical to make enoughobservations to identify all the soils and miscellaneous areas on the landscape.
The presence of minor components in a map unit in no way diminishes theusefulness or accuracy of the data. The objective of mapping is not to delineate puretaxonomic classes but rather to separate the landscape into landforms or landformsegments that have similar use and management requirements. The delineation ofsuch segments on the map provides sufficient information for the development ofresource plans. If intensive use of small areas is planned, however, onsiteinvestigation is needed to define and locate the soils and miscellaneous areas.
An identifying symbol precedes the map unit name in the map unit descriptions.Each description includes general facts about the unit and gives the principal hazardsand limitations to be considered in planning for specific uses.
Soils that have profiles that are almost alike make up a soil series. Except fordifferences in texture of the surface layer, all the soils of a series have major horizonsthat are similar in composition, thickness, and arrangement.
Soils of one series can differ in texture of the surface layer, slope, stoniness,salinity, degree of erosion, and other characteristics that affect their use. On the basis
Detailed Soil Map Units
Soil Survey of Salem County, New Jersey
8
of such differences, a soil series is divided into soil phases. Most of the areas shownon the detailed soil maps are phases of soil series. The name of a soil phasecommonly indicates a feature that affects use or management. For example,Manahawkin muck, 0 to 2 percent slopes, frequently flooded, is a phase of theManahawkin series.
Some map units are made up of two or more major soils or miscellaneous areas.These map units are complexes or undifferentiated groups.
A complex consists of two or more soils or miscellaneous areas in such an intricatepattern or in such small areas that they cannot be shown separately on the maps.The pattern and proportion of the soils or miscellaneous areas are somewhat similarin all areas. Downer-Galestown complex, 0 to 5 percent slopes, is an example.
An undifferentiated group is made up of two or more soils or miscellaneous areasthat could be mapped individually but are mapped as one unit because similarinterpretations can be made for use and management. The pattern and proportion ofthe soils or miscellaneous areas in a mapped area are not uniform. An area can bemade up of only one of the major soils or miscellaneous areas, or it can be made upof all of them. Berryland and Mullica soils, 0 to 2 percent slopes, occasionally flooded,is an undifferentiated group in this survey area.
This survey includes miscellaneous areas. Such areas have little or no soil materialand support little or no vegetation. The map unit Pits, sand and gravel, is an example.
Table 4 gives the acreage and proportionate extent of each map unit. Other tablesgive properties of the soils and the limitations, capabilities, and potentials for manyuses. The Glossary defines many of the terms used in describing the soils ormiscellaneous areas.
AdkB—Adelphia sandy loam, 2 to 5 percent slopesSetting
Landscape: North Atlantic Coastal PlainLandform: Low hills
Composition
Adelphia and similar soils: 85 percentMinor components: 15 percent
Description of the Adelphia Soil
Typical profileSurface layer:Ap—0 to 10 inches; sandy loam
Subsoil:BA—10 to 14 inches; sandy loamBt—14 to 56 inches; sandy clay loam
Substratum:C—56 to 72 inches; stratified loamy sand and sandy loam
Properties and qualitiesDrainage class: Moderately well drainedParent material: Glauconite-bearing loamy eolian deposits or glauconite-bearing
loamy fluviomarine deposits, or bothPermeability: Moderate to rapidAvailable water capacity: High
Soil Survey of Salem County, New Jersey
9
Reaction: Extremely acid to strongly acidDepth to the seasonal high water table: 18 to 42 inches
Interpretive groupsLand capability classification (in nonirrigated areas): 2wHydrologic group: C
Minor Components
• The poorly drained Shrewsbury soils that have a similar content of glauconite; onthe lower landforms
• The well drained Freehold soils that have a lower content of glauconite; on theslightly higher landforms
AhmB—Alloway sandy loam, 2 to 5 percent slopesSetting
Landscape: North Atlantic Coastal PlainLandform: Ridges
Composition
Alloway and similar soils: 90 percentMinor components: 10 percent
Description of the Alloway Soil
Typical profileSurface layer:Ap—0 to 10 inches; sandy loam
Subsoil:Bt1—10 to 18 inches; loamBt2—18 to 24 inches; silty clay loamBt3—24 to 39 inches; clayBt4—39 to 49 inches; clay
Substratum:C—49 to 72 inches; clay
Properties and qualitiesDrainage class: Moderately well drainedParent material: Silty and clayey eolian deposits or fluviomarine deposits, or bothPermeability: Slow to moderateAvailable water capacity: HighReaction: Very strongly acid to slightly acidDepth to the seasonal high water table: 18 to 42 inches
Interpretive groupsLand capability classification (in nonirrigated areas): 2eHydrologic group: B
Minor Components
• The well drained Sassafras soils that have a fine-loamy particle-size control section;on the higher ridges and hillslopes
• The moderately well drained Woodstown soils that have a fine-loamy particle-sizecontrol section; on similar landforms
Soil Survey of Salem County, New Jersey
10
AhpB—Alloway loam, 2 to 5 percent slopesSetting
Landscape: North Atlantic Coastal PlainLandform: Ridges
Composition
Alloway and similar soils: 90 percentMinor components: 10 percent
Description of the Alloway Soil
Typical profileSurface layer:Ap—0 to 10 inches; loam
Subsoil:Bt1—10 to 18 inches; loamBt2—18 to 24 inches; silty clay loamBt3—24 to 39 inches; clayBt4—39 to 49 inches; clay
Substratum:C—49 to 72 inches; clay
Properties and qualitiesDrainage class: Moderately well drainedParent material: Silty and clayey eolian deposits or fluviomarine deposits, or bothPermeability: Slow to moderateAvailable water capacity: HighReaction: Very strongly acid to slightly acidDepth to the seasonal high water table: 18 to 42 inches
Interpretive groupsLand capability classification (in nonirrigated areas): 2wHydrologic group: B
Minor Components
• The well drained Sassafras soils that have a fine-loamy particle-size control section;on the higher ridges and hillslopes
• The moderately well drained Woodstown soils that have a fine-loamy particle-sizecontrol section; on similar landforms
AhpC—Alloway loam, 5 to 10 percent slopesSetting
Landscape: North Atlantic Coastal PlainLandform: Ridges
Composition
Alloway and similar soils: 90 percentMinor components: 10 percent
Description of the Alloway Soil
Typical profileSurface layer:Ap—0 to 10 inches; loam
Soil Survey of Salem County, New Jersey
11
Subsoil:Bt1—10 to 18 inches; loamBt2—18 to 24 inches; silty clay loamBt3—24 to 39 inches; clayBt4—39 to 49 inches; clay
Substratum:C—49 to 72 inches; clay
Properties and qualitiesDrainage class: Moderately well drainedParent material: Silty and clayey eolian deposits or fluviomarine deposits, or bothPermeability: Slow to moderateAvailable water capacity: HighReaction: Very strongly acid to slightly acidDepth to the seasonal high water table: 18 to 42 inches
Interpretive groupsLand capability classification (in nonirrigated areas): 3eHydrologic group: B
Minor Components
• The well drained Sassafras soils that have a fine-loamy particle-size control section;on the higher ridges and hillslopes
• The moderately well drained Woodstown soils that have a fine-loamy particle-sizecontrol section; on similar landforms
AhrA—Alloway silt loam, 0 to 2 percent slopesSetting
Landscape: North Atlantic Coastal PlainLandform: Ridges
Composition
Alloway and similar soils: 90 percentMinor components: 10 percent
Description of the Alloway Soil
Typical profileSurface layer:Ap—0 to 11 inches; silt loam
Subsoil:Bt1—11 to 18 inches; silty clay loamBt2—18 to 24 inches; silty clay loamBt3—24 to 32 inches; clay loamBt4—32 to 39 inches; clay loamBt5—39 to 48 inches; clay loamBt6—48 to 65 inches; clay
Substratum:C—65 to 80 inches; clay
Properties and qualitiesDrainage class: Moderately well drainedParent material: Silty and clayey eolian deposits or fluviomarine deposits, or
both
Soil Survey of Salem County, New Jersey
12
Permeability: Slow and moderately slowAvailable water capacity: HighReaction: Very strongly acid to slightly acidDepth to the seasonal high water table: 18 to 42 inches
Interpretive groupsLand capability classification (in nonirrigated areas): 2wHydrologic group: B
Minor Components
• The poorly drained Trussum soils that have a seasonal high water table within adepth of 12 inches; in the lower lying landscape positions
AhrB—Alloway silt loam, 2 to 5 percent slopesSetting
Landscape: North Atlantic Coastal PlainLandform: Ridges
Composition
Alloway and similar soils: 90 percentMinor components: 10 percent
Description of the Alloway Soil
Typical profileSurface layer:Ap—0 to 11 inches; silt loam
Subsoil:Bt1—11 to 18 inches; silty clay loamBt2—18 to 24 inches; silty clay loamBt3—24 to 32 inches; clay loamBt4—32 to 39 inches; clay loamBt5—39 to 48 inches; clay loamBt6—48 to 65 inches; clay
Substratum:C—65 to 80 inches; clay
Properties and qualitiesDrainage class: Moderately well drainedParent material: Silty and clayey eolian deposits or fluviomarine deposits, or
bothPermeability: Slow and moderately slowAvailable water capacity: HighReaction: Very strongly acid to slightly acidDepth to the seasonal high water table: 18 to 42 inches
Interpretive groupsLand capability classification (in nonirrigated areas): 2eHydrologic group: B
Minor Components
• The poorly drained Trussum soils that have a seasonal high water table within adepth of 12 inches; in the lower lying landscape positions
Soil Survey of Salem County, New Jersey
13
ApbAv—Appoquinimink-Broadkill complex, 0 to 1 percentslopes, very frequently flooded
Setting
Landscape: North Atlantic Coastal PlainLandform: Tidal flats
Composition
Appoquinimink and similar soils: 60 percentBroadkill and similar soils: 30 percentMinor components: 10 percent
Description of the Appoquinimink Soil
Typical profileSurface layer:Ag—0 to 6 inches; mucky silt loam
Substratum:Cg1—6 to 21 inches; silt loamCg2—21 to 32 inches; silt loamOa—32 to 43 inches; muckOe—43 to 80 inches; mucky peat
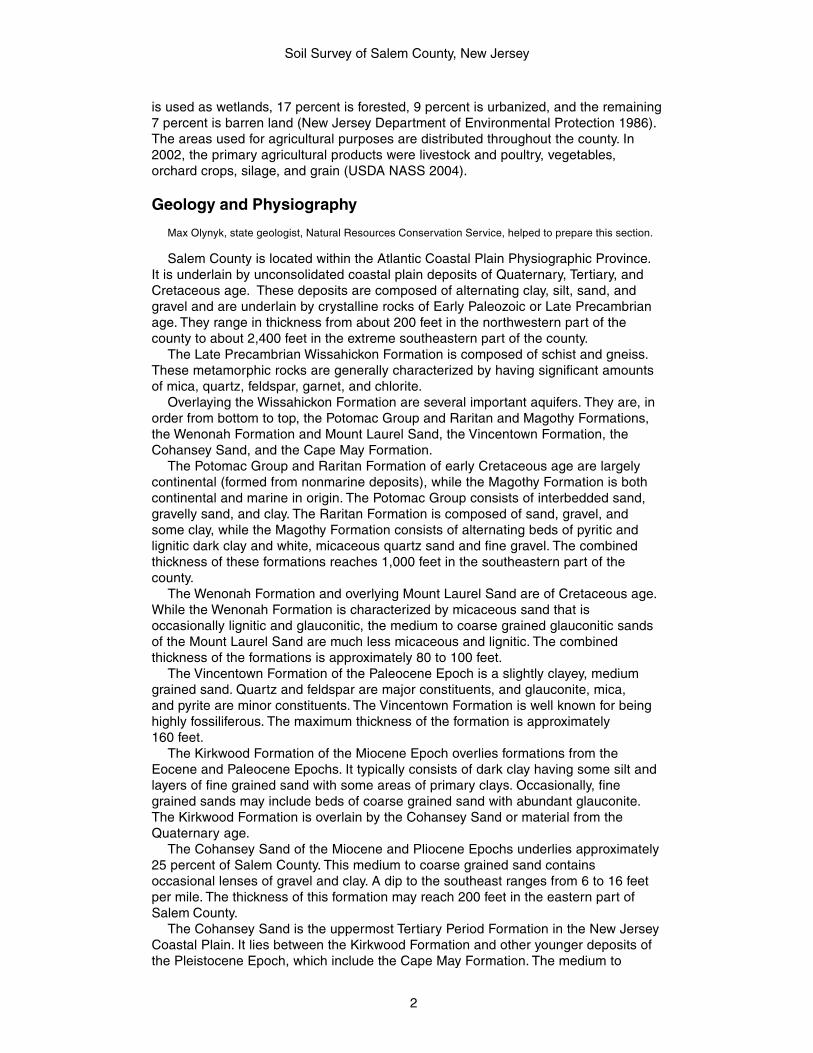
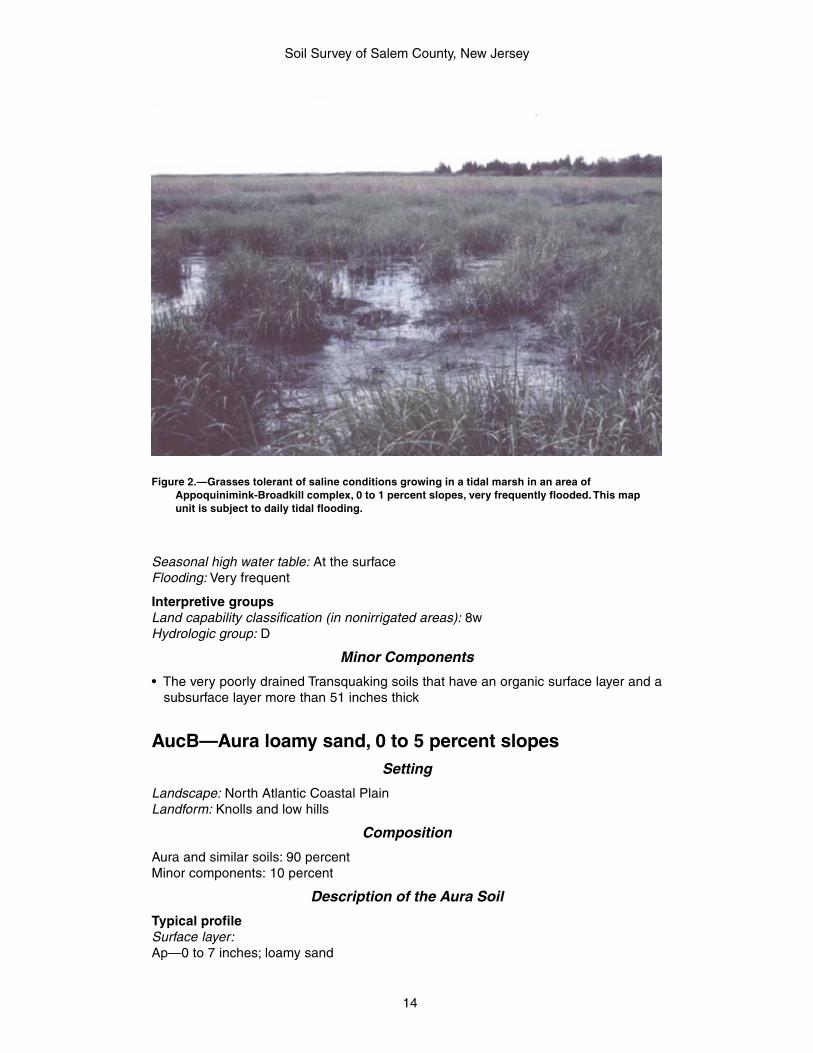
Properties and qualitiesDrainage class: Very poorly drainedParent material: Loamy fluviomarine deposits over herbaceous organic materialPermeability: ModerateAvailable water capacity: Very highReaction: Moderately acid to neutral (unincubated)Ponding depth: 0 to 12 inches above the surfaceSeasonal high water table: At the surfaceFlooding: Very frequent (fig. 2)
Interpretive groupsLand capability classification (in nonirrigated areas): 8wHydrologic group: D
Description of the Broadkill Soil
Typical profileSurface layer:Oe—0 to 6 inches; mucky peatAg—6 to 10 inches; silt loam
Substratum:Cg1—10 to 30 inches; silt loamCg2—30 to 45 inches; silty clay loam2Cg—45 to 72 inches; sandy loam
Properties and qualitiesDrainage class: Very poorly drainedParent material: Loamy marine depositsPermeability: Moderate to rapidAvailable water capacity: Very highReaction: Moderately acid to neutral (unincubated)Ponding depth: 0 to 12 inches above the surface
Soil Survey of Salem County, New Jersey
14
Seasonal high water table: At the surfaceFlooding: Very frequent
Interpretive groupsLand capability classification (in nonirrigated areas): 8wHydrologic group: D
Minor Components
• The very poorly drained Transquaking soils that have an organic surface layer and asubsurface layer more than 51 inches thick
AucB—Aura loamy sand, 0 to 5 percent slopesSetting
Landscape: North Atlantic Coastal PlainLandform: Knolls and low hills
Composition
Aura and similar soils: 90 percentMinor components: 10 percent
Description of the Aura Soil
Typical profileSurface layer:Ap—0 to 7 inches; loamy sand
Figure 2.—Grasses tolerant of saline conditions growing in a tidal marsh in an area ofAppoquinimink-Broadkill complex, 0 to 1 percent slopes, very frequently flooded. This mapunit is subject to daily tidal flooding.
Soil Survey of Salem County, New Jersey
15
Subsoil:Bt—7 to 22 inches; coarse sandy loam2Btx1—22 to 28 inches; gravelly coarse sandy loam2Btx2—28 to 59 inches; gravelly sandy clay loam
Substratum:2C—59 to 80 inches; gravelly loamy coarse sand
Properties and qualitiesDrainage class: Well drainedParent material: Old loamy alluvium or old gravelly alluviumPermeability: Moderately slow to rapidAvailable water capacity: Very lowReaction: Extremely acid to slightly acidDepth to a fragipan: 15 to 40 inchesDepth to the seasonal high water table: More than 6 feet
Interpretive groupsLand capability classification (in nonirrigated areas): 2sHydrologic group: B
Minor Components
• Sassafras soils that do not have a fragipan and have a fine-loamy particle-sizecontrol section; on the slightly lower parts of similar landforms
• The moderately well drained Woodstown soils that have a seasonal high water tableat a depth of 18 to 42 inches and do not have a fragipan; on the lower landforms
AugB—Aura sandy loam, 2 to 5 percent slopesSetting
Landscape: North Atlantic Coastal PlainLandform: Knolls and low hills
Composition
Aura and similar soils: 85 percentMinor components: 15 percent
Description of the Aura Soil
Typical profileSurface layer:Ap—0 to 8 inches; sandy loam
Subsoil:Bt1—8 to 13 inches; coarse sandy loamBt2—13 to 22 inches; coarse sandy loam2Btx1—22 to 28 inches; gravelly coarse sandy loam2Btx2—28 to 44 inches; gravelly sandy clay loam2Btx3—44 to 59 inches; gravelly sandy clay loam
Substratum:2C—59 to 80 inches; gravelly loamy coarse sand
Properties and qualitiesDrainage class: Well drainedParent material: Old loamy alluvium or old gravelly alluviumPermeability: Moderately slow to moderately rapid
Soil Survey of Salem County, New Jersey
16
Available water capacity: Very lowReaction: Extremely acid and very strongly acidDepth to a fragipan: 15 to 40 inchesDepth to the seasonal high water table: More than 6 feet
Interpretive groupsLand capability classification (in nonirrigated areas): 2eHydrologic group: B
Minor Components
• Sassafras soils that do not have a fragipan and have a fine-loamy particle-sizecontrol section; on the slightly lower parts of similar landforms
• Downer soils that do not have a fragipan; on the lower landforms• The moderately well drained Woodstown soils that have a seasonal high water
table at a depth of 18 to 42 inches and do not have a fragipan; on the lowerlandforms
AugC—Aura sandy loam, 5 to 10 percent slopesSetting
Landscape: North Atlantic Coastal PlainLandform: Low hills
Composition
Aura and similar soils: 90 percentMinor components: 10 percent
Description of the Aura Soil
Typical profileSurface layer:Ap—0 to 8 inches; sandy loam
Subsoil:Bt1—8 to 13 inches; coarse sandy loamBt2—13 to 22 inches; coarse sandy loam2Btx1—22 to 28 inches; gravelly coarse sandy loam2Btx2—28 to 44 inches; gravelly sandy clay loam2Btx3—44 to 59 inches; gravelly sandy clay loam
Substratum:2C—59 to 80 inches; gravelly loamy coarse sand
Properties and qualitiesDrainage class: Well drainedParent material: Old loamy alluvium or old gravelly alluviumPermeability: Moderately slow to moderately rapidAvailable water capacity: Very lowReaction: Extremely acid and very strongly acidDepth to a fragipan: 15 to 40 inchesDepth to the seasonal high water table: More than 6 feet
Interpretive groupsLand capability classification (in nonirrigated areas): 3eHydrologic group: B
Soil Survey of Salem County, New Jersey
17
Minor Components
• Sassafras soils that do not have a fragipan and have a fine-loamy particle-sizecontrol section; on the slightly lower parts of similar landforms
• Downer soils that do not have a fragipan; on the lower landforms
AuhB—Aura gravelly sandy loam, 2 to 5 percent slopesSetting
Landscape: North Atlantic Coastal PlainLandform: Knolls and low hills
Composition
Aura and similar soils: 90 percentMinor components: 10 percent
Description of the Aura Soil
Typical profileSurface layer:A—0 to 8 inches; gravelly sandy loam
Subsoil:BA—8 to 12 inches; gravelly sandy loamBt—12 to 20 inches; gravelly sandy clay loam2Btx—20 to 36 inches; gravelly sandy clay loam
Substratum:2C1—36 to 40 inches; gravelly sand2C2—40 to 72 inches; gravelly sand
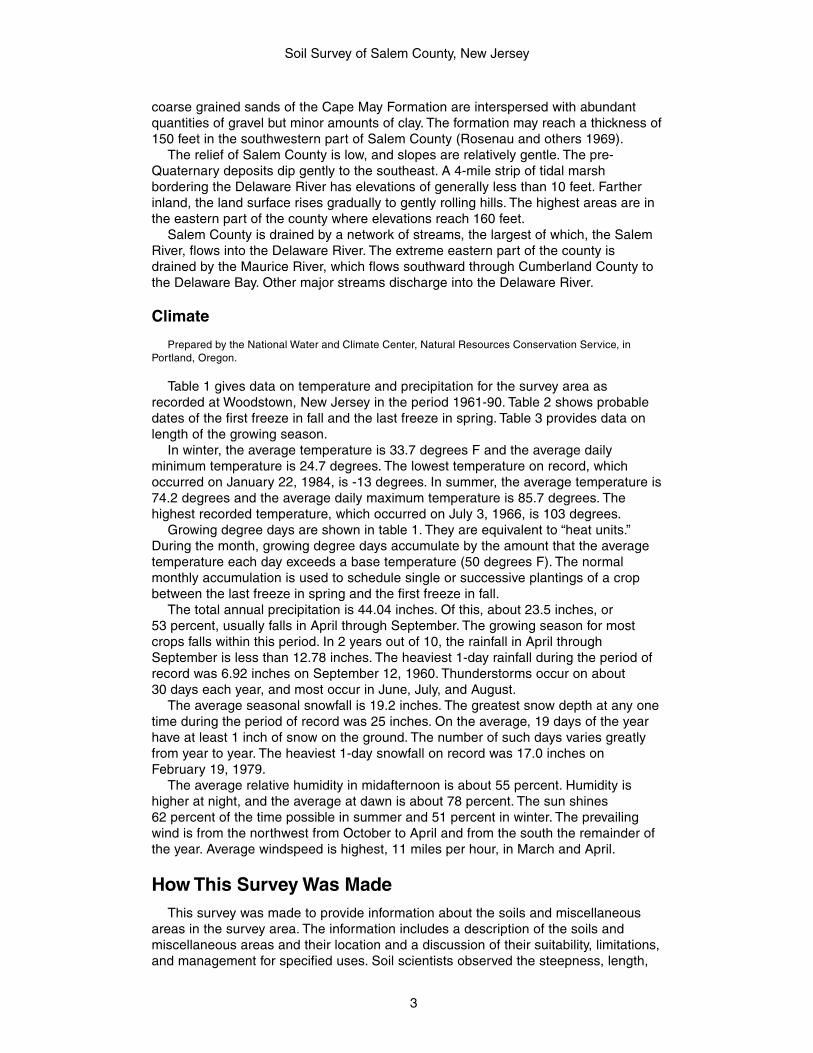
Properties and qualitiesDrainage class: Well drainedParent material: Old loamy alluvium or old gravelly alluvium (fig. 3)Permeability: Moderately slow to rapidAvailable water capacity: Very lowReaction: Extremely acid and very strongly acidDepth to a fragipan: 15 to 40 inchesDepth to the seasonal high water table: More than 6 feet
Interpretive groupsLand capability classification (in nonirrigated areas): 2eHydrologic group: B
Minor Components
• Sassafras soils that do not have a fragipan and have a fine-loamy particle-sizecontrol section; on the slightly lower parts of similar landforms
• Downer soils that do not have a fragipan; on the lower landforms
AuhC—Aura gravelly sandy loam, 5 to 10 percent slopesSetting
Landscape: North Atlantic Coastal PlainLandform: Knolls and low hills
Soil Survey of Salem County, New Jersey
18
Composition
Aura and similar soils: 90 percentMinor components: 10 percent
Description of the Aura SoilTypical profileSurface layer:A—0 to 8 inches; gravelly sandy loam
Subsoil:BA—8 to 12 inches; gravelly sandy loamBt—12 to 20 inches; gravelly sandy clay loam2Btx—20 to 36 inches; gravelly sandy clay loam
Substratum:2C1—36 to 40 inches; gravelly sand2C2—40 to 72 inches; gravelly sand
Properties and qualitiesDrainage class: Well drainedParent material: Old loamy alluvium or old gravelly alluviumPermeability: Moderately slow to rapidAvailable water capacity: Very lowReaction: Extremely acid and very strongly acidDepth to a fragipan: 15 to 40 inchesDepth to the seasonal high water table: More than 6 feet
Interpretive groupsLand capability classification (in nonirrigated areas): 3eHydrologic group: B
Minor Components
• Sassafras soils that do not have a fragipan and have a fine-loamy particle-sizecontrol section; on the slightly lower parts of similar landforms
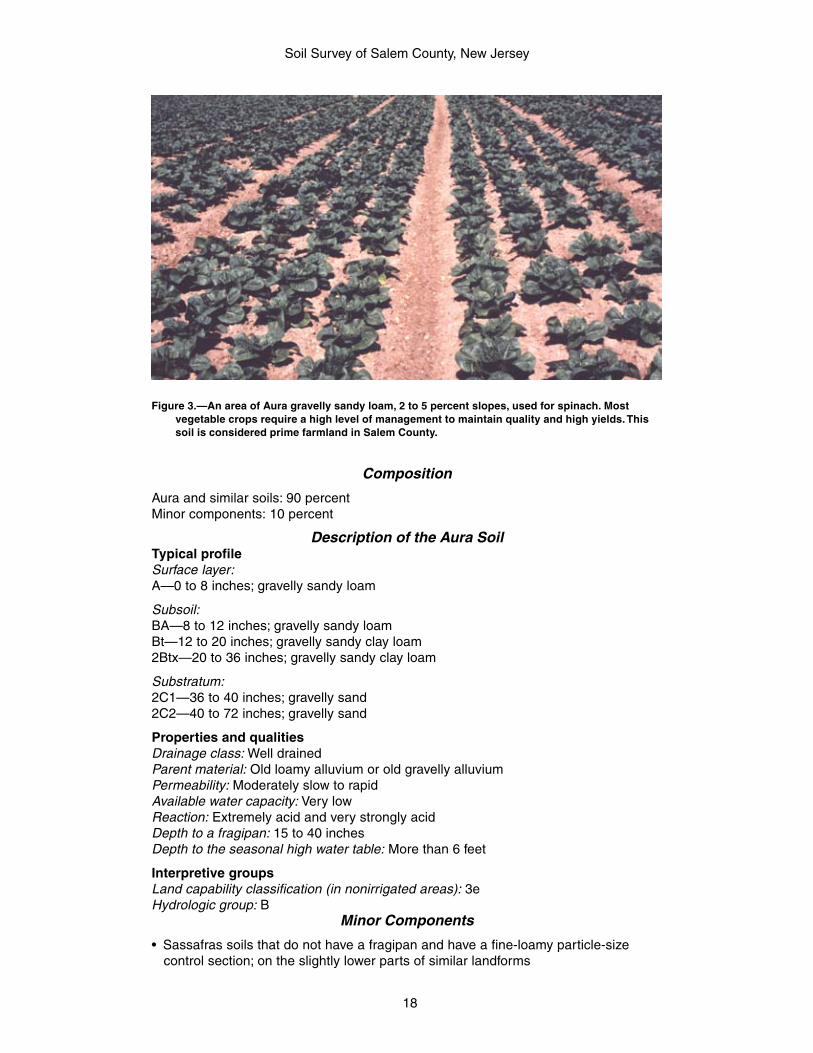
Figure 3.—An area of Aura gravelly sandy loam, 2 to 5 percent slopes, used for spinach. Mostvegetable crops require a high level of management to maintain quality and high yields. Thissoil is considered prime farmland in Salem County.
Soil Survey of Salem County, New Jersey
19
• Downer soils that do not have a fragipan; on the lower landforms
AupA—Aura loam, 0 to 2 percent slopesSetting
Landscape: North Atlantic Coastal PlainLandform: Knolls and low hills
Composition
Aura and similar soils: 85 percentMinor components: 15 percent
Description of the Aura SoilTypical profileSurface layer:Ap—0 to 8 inches; loam
Subsoil:Bt1—8 to 13 inches; coarse sandy loamBt2—13 to 22 inches; coarse sandy loam2Btx1—22 to 28 inches; gravelly coarse sandy loam2Btx2—28 to 44 inches; gravelly sandy clay loam2Btx3—44 to 59 inches; gravelly sandy clay loam
Substratum:2C—59 to 80 inches; gravelly loamy coarse sand
Properties and qualitiesDrainage class: Well drainedParent material: Old loamy alluvium or old gravelly alluviumPermeability: Moderately slow to moderately rapidAvailable water capacity: Very lowReaction: Extremely acid to slightly acidDepth to a fragipan: 15 to 40 inchesDepth to the seasonal high water table: More than 6 feet
Interpretive groupsLand capability classification (in nonirrigated areas): 1Hydrologic group: B
Minor Components
• Sassafras soils that do not have a fragipan and have a fine-loamy particle-sizecontrol section; on the slightly lower parts of similar landforms
• Downer soils that do not have a fragipan; on the lower landforms• The moderately well drained Woodstown soils that have a seasonal high water table
at a depth of 18 to 42 inches and do not have a fragipan; on the lower landforms
AupB—Aura loam, 2 to 5 percent slopesSetting
Landscape: North Atlantic Coastal PlainLandform: Knolls and low hills
Composition
Aura and similar soils: 85 percentMinor components: 15 percent
Soil Survey of Salem County, New Jersey
20
Description of the Aura Soil
Typical profileSurface layer:Ap—0 to 8 inches; loam
Subsoil:Bt1—8 to 13 inches; coarse sandy loamBt2—13 to 22 inches; coarse sandy loam2Btx1—22 to 28 inches; gravelly coarse sandy loam2Btx2—28 to 44 inches; gravelly sandy clay loam2Btx3—44 to 59 inches; gravelly sandy clay loam
Substratum:2C—59 to 80 inches; gravelly loamy coarse sand
Properties and qualitiesDrainage class: Well drainedParent material: Old loamy alluvium or old gravelly alluviumPermeability: Moderately slow to moderately rapidAvailable water capacity: Very lowReaction: Extremely acid to slightly acidDepth to a fragipan: 15 to 40 inchesDepth to the seasonal high water table: More than 6 feet
Interpretive groupsLand capability classification (in nonirrigated areas): 2eHydrologic group: B
Minor Components
• Sassafras soils that do not have a fragipan and have a fine-loamy particle-sizecontrol section; on the slightly lower parts of similar landforms
• Downer soils that do not have a fragipan; on the lower landforms• The moderately well drained Woodstown soils that have a seasonal high water
table at a depth of 18 to 42 inches and do not have a fragipan; on the lowerlandforms
BEXAS—Berryland and Mullica soils, 0 to 2 percentslopes, occasionally flooded
Setting
Landscape: North Atlantic Coastal PlainLandform: Depressions, drainageways, and flats
Composition
Berryland and similar soils: 50 percentMullica and similar soils: 40 percentMinor components: 10 percent
Description of the Berryland Soil
Typical profileSurface layer:Ag—0 to 11 inches; sand
Soil Survey of Salem County, New Jersey
21
Subsoil:Bh—11 to 19 inches; sandBg—19 to 32 inches; sandB'h—32 to 40 inches; sand
Substratum:Cg1—40 to 44 inches; sandCg2—44 to 80 inches; stratified sand to sandy loam
Properties and qualitiesDrainage class: Very poorly drainedParent material: Sandy fluviomarine depositsPermeability: RapidAvailable water capacity: LowReaction: Extremely acid to strongly acidPonding depth: 0 to 12 inches above the surfaceSeasonal high water table: Within a depth of 6 inchesFlooding: Occasional
Interpretive groupsLand capability classification (in nonirrigated areas): 5wHydrologic group: B/D
Description of the Mullica Soil
Typical profileSurface layer:Oe—0 to 2 inches; mucky peatAg—2 to 9 inches; sandy loam
Subsoil:Bg1—9 to 14 inches; sandy loamBg2—14 to 28 inches; sandy loam
Substratum:Cg1—28 to 31 inches; loamy sandCg2—31 to 40 inches; sandCg3—40 to 80 inches; gravelly loamy sand
Properties and qualitiesDrainage class: Very poorly drainedParent material: Sandy fluviomarine deposits or loamy fluviomarine deposits, or bothPermeability: Moderately rapid and rapidAvailable water capacity: ModerateReaction: Extremely acid and very strongly acidPonding depth: 0 to 12 inches above the surfaceSeasonal high water table: Within a depth of 6 inchesFlooding: Occasional
Interpretive groupsLand capability classification (in nonirrigated areas): 4wHydrologic group: D
Minor Components
• The very poorly drained, organic Manahawkin soils; on the lower landforms• The poorly drained Atsion soils that do not have an umbric epipedon; on the slightly
higher landforms
Soil Survey of Salem County, New Jersey
22
ChsAt—Chicone silt loam, 0 to 1 percent slopes,frequently flooded
Setting
Landscape: North Atlantic Coastal PlainLandform: Flood plains
Composition
Chicone and similar soils: 95 percentMinor components: 5 percent
Description of the Chicone Soil
Typical profileSurface layer:A—0 to 5 inches; silt loam
Substratum:Cg1—5 to 20 inches; silt loamCg2—20 to 28 inches; silt loamOe—28 to 65 inches; mucky peatC'g—65 to 80 inches; sand
Properties and qualitiesDrainage class: Very poorly drainedParent material: Silty alluvium over organic woody materialsPermeability: Moderate to rapidAvailable water capacity: Very highReaction: Extremely acid to strongly acidPonding depth: 0 to 12 inches above the surfaceSeasonal high water table: Within a depth of 6 inchesFlooding: Frequent
Interpretive groupsLand capability classification (in nonirrigated areas): 5wHydrologic group: D
Minor Components
• The very poorly drained, organic Manahawkin soils; on the lower landforms
ChtA—Chillum silt loam, 0 to 2 percent slopesSetting
Landscape: North Atlantic Coastal PlainLandform: Ridges and terraces
Composition
Chillum and similar soils: 85 percentMinor components: 15 percent
Description of the Chillum SoilTypical profileSurface layer:Ap—0 to 10 inches; silt loam
Subsoil:Bt1—10 to 15 inches; silt loam
Soil Survey of Salem County, New Jersey
23
Bt2—15 to 28 inches; silt loamBt3—28 to 34 inches; silt loamBC—34 to 38 inches; loam
Substratum:2C1—38 to 61 inches; sandy loam2C2—61 to 66 inches; sandy loam3C3—66 to 72 inches; sand
Properties and qualitiesDrainage class: Well drainedParent material: Silty eolian deposits over loamy marine depositsPermeability: Moderate to rapidAvailable water capacity: HighReaction: Extremely acid to strongly acidDepth to the seasonal high water table: More than 6 feet
Interpretive groupsLand capability classification (in nonirrigated areas): 1Hydrologic group: B
Minor Components
• Matapeake soils that do not have a dense, compact 2C horizon that is firm or veryfirm; on similar landforms
• The moderately well drained Mattapex soils that do not have a dense, compact2C horizon that is firm or very firm and have a seasonal high water table at a depthof 18 to 36 inches; on the slightly lower landforms
ChtB—Chillum silt loam, 2 to 5 percent slopesSetting
Landscape: North Atlantic Coastal PlainLandform: Ridges and terraces
Composition
Chillum and similar soils: 85 percentMinor components: 15 percent
Description of the Chillum Soil
Typical profileSurface layer:Ap—0 to 10 inches; silt loam
Subsoil:Bt1—10 to 15 inches; silt loamBt2—15 to 28 inches; silt loamBt3—28 to 34 inches; silt loamBC—34 to 38 inches; loam
Substratum:2C1—38 to 61 inches; sandy loam2C2—61 to 66 inches; sandy loam3C3—66 to 72 inches; sand
Properties and qualitiesDrainage class: Well drainedParent material: Silty eolian deposits over loamy marine deposits
Soil Survey of Salem County, New Jersey
24
Permeability: Moderate to rapidAvailable water capacity: HighReaction: Extremely acid to strongly acidDepth to the seasonal high water table: More than 6 feet
Interpretive groupsLand capability classification (in nonirrigated areas): 2eHydrologic group: B
Minor Components
• Matapeake soils that do not have a dense, compact 2C horizon that is firm or veryfirm; on similar landforms
• The moderately well drained Mattapex soils that do not have a dense, compact2C horizon that is firm or very firm and have a seasonal high water table at a depthof 18 to 36 inches; on the slightly lower landforms
DocB—Downer loamy sand, 0 to 5 percent slopesSetting
Landscape: North Atlantic Coastal PlainLandform: Knolls and low hills
Composition
Downer and similar soils: 80 percentMinor components: 20 percent
Description of the Downer Soil
Typical profileSurface layer:Ap—0 to 10 inches; loamy sand
Subsoil:BA—10 to 16 inches; loamy sandBt—16 to 36 inches; sandy loam
Substratum:C1—36 to 48 inches; loamy sandC2—48 to 80 inches; stratified sand to sandy loam
Properties and qualitiesDrainage class: Well drainedParent material: Loamy or gravelly fluviomarine deposits, or bothPermeability: Moderately rapid and rapidAvailable water capacity: ModerateReaction: Extremely acid to neutralDepth to the seasonal high water table: More than 6 feet
Interpretive groupsLand capability classification (in nonirrigated areas): 2sHydrologic group: B
Minor Components
• Sassafras soils that have a fine-loamy particle-size control section; on similarlandforms
• Evesboro soils that have a sandy particle-size control section and do not have anargillic horizon; on the slightly higher landforms
Soil Survey of Salem County, New Jersey
25
• Hammonton soils that have low-chroma depletions and have a seasonal high watertable at a depth of 18 to 42 inches; in the lower lying landscape positions
DocC—Downer loamy sand, 5 to 10 percent slopesSetting
Landscape: North Atlantic Coastal PlainLandform: Flats, knolls, and low hills
Composition
Downer and similar soils: 85 percentMinor components: 15 percent
Description of the Downer Soil
Typical profileSurface layer:Ap—0 to 10 inches; loamy sand
Subsoil:BA—10 to 16 inches; loamy sandBt—16 to 36 inches; sandy loam
Substratum:C1—36 to 48 inches; loamy sandC2—48 to 80 inches; stratified sand to sandy loam
Properties and qualitiesDrainage class: Well drainedParent material: Loamy or gravelly fluviomarine deposits, or bothPermeability: Moderately rapid and rapidAvailable water capacity: ModerateReaction: Extremely acid to neutralDepth to the seasonal high water table: More than 6 feet
Interpretive groupsLand capability classification (in nonirrigated areas): 3eHydrologic group: B
Minor Components
• Sassafras soils that have a fine-loamy particle-size control section; on similarlandforms
• Evesboro soils that have a sandy particle-size control section and do not have anargillic horizon; on the slightly higher landforms
• Hammonton soils that have low-chroma depletions and have a seasonal high watertable at a depth of 18 to 42 inches; in the lower lying landscape positions
DoeA—Downer sandy loam, 0 to 2 percent slopesSetting
Landscape: North Atlantic Coastal PlainLandform: Knolls and low hills
Composition
Downer and similar soils: 85 percentMinor components: 15 percent
Soil Survey of Salem County, New Jersey
26
Description of the Downer Soil
Typical profileSurface layer:Ap—0 to 10 inches; sandy loam
Subsoil:Bt1—10 to 16 inches; sandy loamBt2—16 to 36 inches; sandy loam
Substratum:C1—36 to 48 inches; loamy sandC2—48 to 80 inches; stratified sand to sandy loam
Properties and qualitiesDrainage class: Well drainedParent material: Loamy or gravelly fluviomarine deposits, or bothPermeability: Moderately rapid and rapidAvailable water capacity: ModerateReaction: Extremely acid to neutralDepth to the seasonal high water table: More than 6 feet
Interpretive groupsLand capability classification (in nonirrigated areas): 1Hydrologic group: B
Minor Components
• Sassafras soils that have a fine-loamy particle-size control section; on similarlandforms
• Woodstown soils that have a seasonal high water table at a depth of 18 to42 inches and have a fine-loamy particle-size control section; on similar landforms
DoeB—Downer sandy loam, 2 to 5 percent slopesSetting
Landscape: North Atlantic Coastal PlainLandform: Knolls and low hills
Composition
Downer and similar soils: 90 percentMinor components: 10 percent
Description of the Downer Soil
Typical profileSurface layer:Ap—0 to 10 inches; sandy loam
Subsoil:Bt1—10 to 16 inches; sandy loamBt2—16 to 36 inches; sandy loam
Substratum:C1—36 to 48 inches; loamy sandC2—48 to 80 inches; stratified sand to sandy loam
Properties and qualitiesDrainage class: Well drainedParent material: Loamy or gravelly fluviomarine deposits, or both
Soil Survey of Salem County, New Jersey
27
Permeability: Moderately rapid and rapidAvailable water capacity: ModerateReaction: Extremely acid to neutralDepth to the seasonal high water table: More than 6 feet
Interpretive groupsLand capability classification (in nonirrigated areas): 2eHydrologic group: B
Minor Components
• Sassafras soils that have a fine-loamy particle-size control section; on similarlandforms
• Woodstown soils that have a seasonal high water table at a depth of 18 to42 inches and have a fine-loamy particle-size control section; on similarlandforms
DopB—Downer-Galestown complex, 0 to 5 percent slopesSetting
Landscape: North Atlantic Coastal PlainLandform: Flats, knolls, and low hills
Composition
Downer and similar soils: 55 percentGalestown and similar soils: 35 percentMinor components: 10 percent
Description of the Downer Soil
Typical profileSurface layer:Ap—0 to 10 inches; loamy sand
Subsoil:BA—10 to 16 inches; loamy sandBt—16 to 36 inches; sandy loam
Substratum:C1—36 to 48 inches; loamy sandC2—48 to 80 inches; stratified sand to sandy loam
Properties and qualitiesDrainage class: Well drainedParent material: Loamy or gravelly fluviomarine deposits, or bothPermeability: Moderately rapid and rapidAvailable water capacity: ModerateReaction: Extremely acid to neutralDepth to the seasonal high water table: More than 6 feet
Interpretive groupsLand capability classification (in nonirrigated areas): 2sHydrologic group: B
Description of the Galestown Soil
Typical profileSurface layer:A—0 to 10 inches; loamy sand
Soil Survey of Salem County, New Jersey
28
Subsoil:Bt—10 to 50 inches; loamy sand
Substratum:C—50 to 72 inches; gravelly loamy sand
Properties and qualitiesDrainage class: Somewhat excessively drainedParent material: Sandy marine depositsPermeability: RapidAvailable water capacity: LowReaction: Extremely acid to strongly acidDepth to the seasonal high water table: More than 6 feet
Interpretive groupsLand capability classification (in nonirrigated areas): 3sHydrologic group: A
Minor Components
• Evesboro soils that have a sandy particle-size control section and do not have anargillic horizon; on the slightly higher landforms
• Hammonton soils that have low-chroma depletions and have a seasonal high watertable at a depth of 18 to 42 inches; in the lower lying landscape positions
DouB—Downer-Urban land complex, 0 to 5 percent slopesSetting
Landscape: North Atlantic Coastal PlainLandform: Knolls and low hills
Composition
Downer and similar soils: 60 percentUrban land and similar components: 30 percentMinor components: 10 percent
Description of the Downer Soil
Typical profileSurface layer:Ap—0 to 10 inches; sandy loam
Subsoil:Bt1—10 to 16 inches; sandy loamBt2—16 to 36 inches; sandy loam
Substratum:C1—36 to 48 inches; loamy sandC2—48 to 80 inches; stratified sand to sandy loam
Properties and qualitiesDrainage class: Well drainedParent material: Loamy or gravelly fluviomarine deposits, or bothPermeability: Moderately rapid and rapidAvailable water capacity: ModerateReaction: Extremely acid to slightly acidDepth to the seasonal high water table: More than 6 feet
Soil Survey of Salem County, New Jersey
29
Interpretive groupsLand capability classification (in nonirrigated areas): 2eHydrologic group: B
Description of Urban Land
Urban land consists of areas where much of the soil surface is covered withasphalt, concrete, buildings, or other impervious cover. A description of the typicalsequence, depth, and composition of the soil material is not provided because thesoil material varies greatly from place to place.
Interpretive groupsLand capability classification (in nonirrigated areas): 8sHydrologic group: Not specified
Minor Components
• Sassafras soils that have a fine-loamy particle-size control section; on similarlandforms
• Woodstown soils that have a seasonal high water table at a depth of 18 to42 inches and have a fine-loamy particle-size control section; on similar landforms
EveB—Evesboro sand, 0 to 5 percent slopesSetting
Landscape: North Atlantic Coastal PlainLandform: Knolls and low hills
Composition
Evesboro and similar soils: 80 percentMinor components: 20 percent
Description of the Evesboro Soil
Typical profileSurface layer:A—0 to 4 inches; sand
Subsurface layer:AB—4 to 17 inches; sand
Subsoil:Bw—17 to 31 inches; sand
Substratum:C—31 to 80 inches; stratified loamy sand and sand
Properties and qualitiesDrainage class: Excessively drainedParent material: Sandy eolian deposits or sandy fluviomarine deposits, or bothPermeability: RapidAvailable water capacity: LowReaction: Extremely acid and very strongly acidDepth to the seasonal high water table: More than 6 feet
Interpretive groupsLand capability classification (in nonirrigated areas): 7sHydrologic group: A
Soil Survey of Salem County, New Jersey
30
Minor Components
• Downer soils that have a coarse-loamy particle-size control section and have anargillic horizon; on similar landforms
• The moderately well drained Lakehurst soils that have a seasonal high water tableat a depth of 18 to 42 inches and have a thin spodic horizon; on the lowerlandforms
EveC—Evesboro sand, 5 to 10 percent slopesSetting
Landscape: North Atlantic Coastal PlainLandform: Knolls and low hills
Composition
Evesboro and similar soils: 95 percentMinor components: 5 percent
Description of the Evesboro Soil
Typical profileSurface layer:A—0 to 4 inches; sand
Subsurface layer:AB—4 to 17 inches; sand
Subsoil:Bw—17 to 31 inches; sand
Substratum:C—31 to 80 inches; stratified loamy sand and sand
Properties and qualitiesDrainage class: Excessively drainedParent material: Sandy eolian deposits or sandy fluviomarine deposits, or bothPermeability: RapidAvailable water capacity: LowReaction: Extremely acid and very strongly acidDepth to the seasonal high water table: More than 6 feet
Interpretive groupsLand capability classification (in nonirrigated areas): 7sHydrologic group: A
Minor Components
• Downer soils that have a coarse-loamy particle-size control section and have anargillic horizon; on similar landforms
FmhAt—Fluvaquents, loamy, 0 to 3 percent slopes,frequently flooded
Setting
Landscape: North Atlantic Coastal PlainLandform: Flood plains
Soil Survey of Salem County, New Jersey
31
Composition
Fluvaquents and similar soils: 90 percentMinor components: 10 percent
Description of the Fluvaquents
Typical profileSurface layer:A1—0 to 5 inches; loamA2—5 to 12 inches; silt loam
Substratum:C1—12 to 18 inches; sandy clay loamC2—18 to 24 inches; sandy clay loamC3—24 to 60 inches; sandy loam
Properties and qualitiesDrainage class: Somewhat poorly drainedParent material: Loamy alluviumPermeability: Moderate and moderately rapidAvailable water capacity: ModerateReaction: Strongly acid to neutralPonding depth: 0 to 6 inches above the surfaceDepth to the seasonal high water table: 6 to 18 inchesFlooding: Frequent
Interpretive groupsLand capability classification (in nonirrigated areas): 5wHydrologic group: B/D
Minor Components
• Udifluvents; on the higher landforms• Poorly drained Fluvaquents; on the lower landforms
FodB—Fort Mott loamy sand, 0 to 5 percent slopesSetting
Landscape: North Atlantic Coastal PlainLandform: Ridges and terraces
Composition
Fort Mott and similar soils: 85 percentMinor components: 15 percent
Description of the Fort Mott Soil
Typical profileSurface layer:Ap—0 to 8 inches; loamy sand
Subsurface layer:E—8 to 30 inches; loamy sand
Subsoil:BE—30 to 33 inches; sandy loamBt—33 to 49 inches; sandy loam
Soil Survey of Salem County, New Jersey
32
Substratum:C—49 to 72 inches; loamy sand
Properties and qualitiesDrainage class: Well drainedParent material: Sandy eolian deposits or fluviomarine deposits, or bothPermeability: Moderately rapid and rapidAvailable water capacity: LowReaction: Extremely acid to strongly acidDepth to the seasonal high water table: More than 6 feet
Interpretive groupsLand capability classification (in nonirrigated areas): 3sHydrologic group: A
Minor Components
• Downer soils that do not have a 20- to 40-inch-thick sandy surface layer and have acoarse-loamy particle-size control section; on similar landforms
• Galestown soils that have a sandy particle-size control section; on the slightlyhigher landforms
GabB—Galestown sand, 0 to 5 percent slopesSetting
Landscape: North Atlantic Coastal PlainLandform: Ridges and terraces
Composition
Galestown and similar soils: 85 percentMinor components: 15 percent
Description of the Galestown Soil
Typical profileSurface layer:Ap—0 to 10 inches; sandA—10 to 23 inches; loamy sand
Subsoil:Bt—23 to 30 inches; loamy sandBC—30 to 38 inches; loamy sand
Substratum:C—38 to 60 inches; sand
Properties and qualitiesDrainage class: Somewhat excessively drainedParent material: Sandy marine depositsPermeability: RapidAvailable water capacity: LowReaction: Extremely acid to strongly acidDepth to the seasonal high water table: More than 6 feet
Interpretive groupsLand capability classification (in nonirrigated areas): 7s
Soil Survey of Salem County, New Jersey
33
Hydrologic group: A
Minor Components
• The well drained Downer soils that have a coarse-loamy particle-size controlsection; on similar landforms
• Aura soils that have a fine-loamy particle-size control section and have a fragipan;on similar landforms
• The moderately well drained Galloway soils; on similar landforms
GamB—Galloway loamy sand, 0 to 5 percent slopesSetting
Landscape: North Atlantic Coastal PlainLandform: Depressions, flats, and terraces
Composition
Galloway and similar soils: 85 percentMinor components: 15 percent
Description of the Galloway SoilTypical profileSurface layer:A—0 to 2 inches; loamy sand
Subsurface layer:E—2 to 10 inches; loamy sand
Subsoil:Bw1—10 to 24 inches; loamy sandBw2—24 to 36 inches; loamy sand
Substratum:Cg1—36 to 52 inches; sandCg2—52 to 60 inches; sand
Properties and qualitiesDrainage class: Somewhat poorly drainedParent material: Unconsolidated sandy marine depositsPermeability: RapidAvailable water capacity: LowReaction: Extremely acid and very strongly acidDepth to the seasonal high water table: 12 to 18 inches
Interpretive groupsLand capability classification (in nonirrigated areas): 3wHydrologic group: A
Minor Components
• The poorly drained Atsion soils that are Spodosols having thicker A, E, and Bhhorizons; on similar landforms
• The well drained Downer soils that have a coarse-loamy particle-size controlsection; on the higher landforms
• The very poorly drained Mullica soils that have a coarse-loamy particle-size controlsection; on the lower landforms
Soil Survey of Salem County, New Jersey
34
HbmB—Hammonton loamy sand, 0 to 5 percent slopesSetting
Landscape: North Atlantic Coastal PlainLandform: Depressions and flats
Composition
Hammonton and similar soils: 80 percentMinor components: 20 percent
Description of the Hammonton Soil
Typical profileSurface layer:Ap—0 to 8 inches; loamy sand
Subsurface layer:E—8 to 18 inches; loamy sand
Subsoil:Bt—18 to 36 inches; sandy loam
Substratum:C—36 to 80 inches; sand
Properties and qualitiesDrainage class: Moderately well drainedParent material: Coarse-loamy fluviomarine depositsPermeability: Moderately rapid and rapidAvailable water capacity: ModerateReaction: Extremely acid to moderately acidDepth to the seasonal high water table: 18 to 42 inches
Interpretive groupsLand capability classification (in nonirrigated areas): 2wHydrologic group: B
Minor Components
• Downer soils that have a seasonal high water table at a depth of more than72 inches; on the slightly higher landforms
• Glassboro soils that have a seasonal high water table at a depth of 12 to 18 inches;on the slightly higher landforms
HboA—Hammonton sandy loam, 0 to 2 percent slopesSetting
Landscape: North Atlantic Coastal PlainLandform: Depressions and flats
Composition
Hammonton and similar soils: 85 percentMinor components: 15 percent
Description of the Hammonton Soil
Typical profileSurface layer:Ap—0 to 8 inches; sandy loam
Soil Survey of Salem County, New Jersey
35
Subsurface layer:E—8 to 18 inches; sandy loam
Subsoil:Bt—18 to 36 inches; sandy loam
Substratum:C—36 to 60 inches; sand
Properties and qualitiesDrainage class: Moderately well drainedParent material: Coarse-loamy fluviomarine depositsPermeability: Moderately rapid and rapidAvailable water capacity: ModerateReaction: Extremely acid to strongly acidDepth to the seasonal high water table: 18 to 42 inches
Interpretive groupsLand capability classification (in nonirrigated areas): 2wHydrologic group: B
Minor Components
• Mullica soils that have a seasonal high water table within a depth of 12 inches; onthe lower landforms
• Atsion soils that have a seasonal high water table at a depth of 6 to 12 inches andhave a sandy particle-size control section; on the lower landforms
HbrB—Hammonton-Urban land complex, 0 to 2 percentslopes
Setting
Landscape: North Atlantic Coastal PlainLandform: Depressions and flats
Composition
Hammonton and similar soils: 70 percentUrban land and similar components: 20 percentMinor components: 10 percent
Description of the Hammonton Soil
Typical profileSurface layer:Ap—0 to 8 inches; loamy sand
Subsurface layer:E—8 to 18 inches; loamy sand
Subsoil:Bt—18 to 36 inches; sandy loam
Substratum:C—36 to 80 inches; sand
Properties and qualitiesDrainage class: Moderately well drainedParent material: Coarse-loamy fluviomarine depositsPermeability: Moderately rapid and rapid
Soil Survey of Salem County, New Jersey
36
Available water capacity: ModerateReaction: Extremely acid to moderately acidDepth to the seasonal high water table: 18 to 42 inches
Interpretive groupsLand capability classification (in nonirrigated areas): 2wHydrologic group: B
Description of Urban Land
Urban land consists of areas where much of the soil surface is covered withasphalt, concrete, buildings, or other impervious cover. A description of the typicalsequence, depth, and composition of the soil material is not provided because thesoil material varies greatly from place to place.
Interpretive groupsLand capability classification (in nonirrigated areas): 8sHydrologic group: Not specified
Minor Components
• Downer soils that have a seasonal high water table at a depth of more than72 inches; on the slightly higher landforms
• Glassboro soils that have a seasonal high water table at a depth of 12 to 18 inches;on the slightly higher landforms
KeoC—Keyport loam, 5 to 10 percent slopesSetting
Landscape: North Atlantic Coastal PlainLandform: Depressions, flats, and knolls
Composition
Keyport and similar soils: 90 percentMinor components: 10 percent
Description of the Keyport Soil
Typical profileSurface layer:Ap—0 to 10 inches; loam
Subsoil:BA—10 to 16 inches; loamBt—16 to 24 inches; clay loamBC—24 to 38 inches; clay loam
Substratum:C—38 to 60 inches; clay loam
Properties and qualitiesDrainage class: Moderately well drainedParent material: Clayey marine depositsPermeability: Slow to moderateAvailable water capacity: HighReaction: Extremely acid to strongly acidDepth to the seasonal high water table: 18 to 42 inches
Soil Survey of Salem County, New Jersey
37
Interpretive groupsLand capability classification (in nonirrigated areas): 3eHydrologic group: C
Minor Components
• Sassafras soils that have a seasonal high water table at a depth of more than72 inches and have a fine-loamy particle-size control section; on the slightly higherlandforms
• Collington soils that have a fine-loamy particle-size control section; on similarlandforms
MakAt—Manahawkin muck, 0 to 2 percent slopes,frequently flooded
Setting
Landscape: North Atlantic Coastal PlainLandform: Flood plains and swamps
Composition
Manahawkin and similar soils: 85 percentMinor components: 15 percent
Description of the Manahawkin Soil
Typical profileSurface layer:Oa1—0 to 13 inches; muckOa2—13 to 26 inches; muckOa3—26 to 47 inches; muck
Substratum:Cg—47 to 80 inches; sand
Properties and qualitiesDrainage class: Very poorly drainedParent material: Organic, woody material over sandy alluviumPermeability: RapidAvailable water capacity: Very highReaction: Very strongly acid to moderately acidPonding depth: 0 to 12 inches above the surfaceSeasonal high water table: Within a depth of 6 inchesFlooding: Frequent
Interpretive groupsLand capability classification (in nonirrigated areas): 7wHydrologic group: D
Minor Components
• The poorly drained Atsion soils, which are mineral soils with a spodic horizon and asandy particle-size control section; on the higher landforms
• The very poorly drained Berryland soils, which are mineral soils with a spodichorizon and a sandy particle-size control section; on the slightly higher landforms
• The very poorly drained Mullica soils, which are mineral soils with a coarse-loamyparticle-size control section; on the slightly higher landforms
Soil Survey of Salem County, New Jersey
38
MamnAv—Mannington-Nanticoke complex, 0 to 1 percentslopes, very frequently flooded
Setting
Landscape: North Atlantic Coastal PlainLandform: Tidal flats
Composition
Mannington and similar soils: 55 percentNanticoke and similar soils: 35 percentMinor components: 10 percent
Description of the Mannington Soil
Typical profileSurface layer:Ag—0 to 14 inches; mucky silt loam
Substratum:Cg—14 to 32 inches; silt loamOa—32 to 42 inches; muckOe—42 to 52 inches; mucky peatC'g1—52 to 62 inches; mucky silt loamC'g2—62 to 90 inches; silt loam
Properties and qualitiesDrainage class: Very poorly drainedParent material: Silty estuarine deposits over organic, herbaceous materialsPermeability: Moderately slow and moderateAvailable water capacity: Very highReaction: Moderately acid to neutralPonding depth: 0 to 12 inches above the surfaceSeasonal high water table: Within a depth of 6 inchesFlooding: Very frequent
Interpretive groupsLand capability classification (in nonirrigated areas): 8wHydrologic group: D
Description of the Nanticoke Soil
Typical profileSurface layer:Ag—0 to 5 inches; mucky silt loam
Substratum:Cg1—5 to 50 inches; silt loamCg2—50 to 80 inches; silt loam
Properties and qualitiesDrainage class: Very poorly drainedParent material: Silty estuarine depositsPermeability: Moderately slowAvailable water capacity: HighReaction: Moderately acid to neutralPonding depth: 0 to 12 inches above the surfaceSeasonal high water table: Within a depth of 6 inches
Soil Survey of Salem County, New Jersey
39
Flooding: Very frequent
Interpretive groupsLand capability classification (in nonirrigated areas): 8wHydrologic group: D
Minor Components
• Udorthents; in areas disturbed by human activity
MasB—Marlton silt loam, 2 to 5 percent slopesSetting
Landscape: North Atlantic Coastal PlainLandform: Ridges
Composition
Marlton and similar soils: 90 percentMinor components: 10 percent
Description of the Marlton Soil
Typical profileSurface layer:A—0 to 10 inches; silt loam
Subsoil:Bt1—10 to 24 inches; clayBt2—24 to 30 inches; clayBt3—30 to 44 inches; clay
Substratum:C—44 to 72 inches; stratified sandy loam to clay
Properties and qualitiesDrainage class: Moderately well drainedParent material: Glauconitic clayey marine depositsPermeability: Slow to moderateAvailable water capacity: ModerateReaction: Extremely acid to strongly acidDepth to the seasonal high water table: 18 to 42 inches
Interpretive groupsLand capability classification (in nonirrigated areas): 2eHydrologic group: C
Minor Components
• Sharptown soils that have a seasonal high water table at a depth of 18 to 42 inchesand have a fine-silty particle-size control section; on the slightly lower landforms
• The well drained Alloway soils that have a fine particle-size control section and donot contain glauconite; on similar landforms
MasC—Marlton silt loam, 5 to 10 percent slopesSetting
Landscape: North Atlantic Coastal Plain
Soil Survey of Salem County, New Jersey
40
Landform: Ridges
Composition
Marlton and similar soils: 90 percentMinor components: 10 percent
Description of the Marlton Soil
Typical profileSurface layer:Ap—0 to 7 inches; silt loam
Subsurface layer:E—7 to 11 inches; silt loam
Subsoil:BA—11 to 17 inches; silt loamBt—17 to 28 inches; sandy clayBC—28 to 40 inches; sandy clay
Substratum:C—40 to 72 inches; stratified sandy loam to clay
Properties and qualitiesDrainage class: Moderately well drainedParent material: Glauconitic clayey marine depositsPermeability: Slow to moderateAvailable water capacity: ModerateReaction: Extremely acid to strongly acidDepth to the seasonal high water table: 18 to 42 inches
Interpretive groupsLand capability classification (in nonirrigated areas): 3eHydrologic group: C
Minor Components
• Sharptown soils that have a seasonal high water table at a depth of 18 to 42 inchesand have a fine-silty particle-size control section; on the slightly lower landforms
• The well drained Alloway soils that have a fine particle-size control section and donot contain glauconite; on similar landforms
MbrA—Matapeake silt loam, 0 to 2 percent slopesSetting
Landscape: North Atlantic Coastal PlainLandform: Flats, ridges, and terraces
Composition
Matapeake and similar soils: 90 percentMinor components: 10 percent
Description of the Matapeake Soil
Typical profileSurface layer:Ap—0 to 10 inches; silt loam
Soil Survey of Salem County, New Jersey
41
Subsoil:Bt1—10 to 25 inches; silt loamBt2—25 to 33 inches; silt loam
Substratum:2C1—33 to 50 inches; stratified sandy loam and loamy sand2C2—50 to 72 inches; sand
Properties and qualitiesDrainage class: Well drainedParent material: Silty eolian deposits over marine deposits or silty eolian deposits
over coarse fluviomarine deposits, or bothPermeability: Moderate and moderately rapidAvailable water capacity: HighReaction: Extremely acid to strongly acidDepth to the seasonal high water table: More than 6 feet
Interpretive groupsLand capability classification (in nonirrigated areas): 1Hydrologic group: B
Minor Components
• Chillum soils having a dense compact 2C horizon that is firm or very firm; on similarlandforms
• The moderately well drained Mattapex soils that have a seasonal high water tableat a depth of 18 to 36 inches; on the slightly lower landforms
MbrB—Matapeake silt loam, 2 to 5 percent slopesSetting
Landscape: North Atlantic Coastal PlainLandform: Flats, ridges, and terraces
Composition
Matapeake and similar soils: 90 percentMinor components: 10 percent
Description of the Matapeake Soil
Typical profileSurface layer:Ap—0 to 10 inches; silt loam
Subsoil:Bt1—10 to 25 inches; silt loamBt2—25 to 33 inches; silt loam
Substratum:2C1—33 to 50 inches; stratified sandy loam and loamy sand2C2—50 to 72 inches; sand
Properties and qualitiesDrainage class: Well drainedParent material: Silty eolian deposits over marine deposits or silty eolian deposits
over coarse fluviomarine deposits, or both
Soil Survey of Salem County, New Jersey
42
Permeability: Moderate and moderately rapidAvailable water capacity: HighReaction: Extremely acid to strongly acidDepth to the seasonal high water table: More than 6 feet
Interpretive groupsLand capability classification (in nonirrigated areas): 2eHydrologic group: B
Minor Components
• Chillum soils having a dense compact 2C horizon that is firm or very firm; on similarlandforms
• Aura soils that have a fragipan and a fine-loamy particle-size control section; onsimilar landforms
MbrC—Matapeake silt loam, 5 to 10 percent slopesSetting
Landscape: North Atlantic Coastal PlainLandform: Flats, ridges, and terraces
Composition
Matapeake and similar soils: 90 percentMinor components: 10 percent
Description of the Matapeake Soil
Typical profileSurface layer:Ap—0 to 10 inches; silt loam
Subsoil:Bt1—10 to 25 inches; silt loamBt2—25 to 33 inches; silt loam
Substratum:2C1—33 to 50 inches; stratified sandy loam and loamy sand2C2—50 to 72 inches; sand
Properties and qualitiesDrainage class: Well drainedParent material: Silty eolian deposits over marine deposits or silty eolian deposits
over coarse fluviomarine deposits, or bothPermeability: Moderate and moderately rapidAvailable water capacity: HighReaction: Extremely acid to strongly acidDepth to the seasonal high water table: More than 6 feet
Interpretive groupsLand capability classification (in nonirrigated areas): 3eHydrologic group: B
Minor Components
• Chillum soils having a dense compact 2C horizon that is firm or very firm; on similarlandforms
• Aura soils that have a fragipan and a fine-loamy particle-size control section; onsimilar landforms
Soil Survey of Salem County, New Jersey
43
MbuA—Mattapex silt loam, 0 to 2 percent slopesSetting
Landscape: North Atlantic Coastal PlainLandform: Flats, ridges, and terraces
Composition
Mattapex and similar soils: 95 percentMinor components: 5 percent
Description of the Mattapex SoilTypical profileSurface layer:A—0 to 7 inches; silt loam
Subsoil:Bt1—7 to 18 inches; silt loamBt2—18 to 33 inches; silty clay loamBt3—33 to 40 inches; silty clay loam
Substratum:2C—40 to 72 inches; loamy sand
Properties and qualitiesDrainage class: Moderately well drainedParent material: Silty eolian deposits over coarser fluviomarine depositsPermeability: Moderate to rapidAvailable water capacity: HighReaction: Extremely acid to strongly acidDepth to the seasonal high water table: 18 to 42 inches
Interpretive groupsLand capability classification (in nonirrigated areas): 2wHydrologic group: C
Minor Components
• The poorly drained Othello soils that have a seasonal high water table within adepth of 12 inches; in the lower lying landscape positions
MbuB—Mattapex silt loam, 2 to 5 percent slopesSetting
Landscape: North Atlantic Coastal PlainLandform: Flats, ridges, and terraces
Composition
Mattapex and similar soils: 95 percentMinor components: 5 percent
Description of the Mattapex Soil
Typical profileSurface layer:Ap—0 to 9 inches; silt loam
Subsoil:BA—9 to 12 inches; silt loam
Soil Survey of Salem County, New Jersey
44
Bt—12 to 52 inches; silt loam
Substratum:2C1—52 to 56 inches; stratified loamy sand and fine sandy loam2C2—56 to 72 inches; stratified sand and loamy sand
Properties and qualitiesDrainage class: Moderately well drainedParent material: Silty eolian deposits over coarser fluviomarine depositsPermeability: Moderate to rapidAvailable water capacity: HighReaction: Extremely acid to strongly acidDepth to the seasonal high water table: 18 to 42 inches
Interpretive groupsLand capability classification (in nonirrigated areas): 2eHydrologic group: C
Minor Components
• The poorly drained Othello soils that have a seasonal high water table within adepth of 12 inches; in the lower lying landscape positions
MbxB—Mattapex-Urban land complex, 0 to 5 percentslopes
Setting
Landscape: North Atlantic Coastal PlainLandform: Flats, ridges, and terraces
Composition
Mattapex and similar soils: 60 percentUrban land and similar components: 35 percentMinor components: 5 percent
Description of the Mattapex Soil
Typical profileSurface layer:Ap—0 to 10 inches; silt loam
Subsoil:Bt—10 to 18 inches; silt loam
Substratum:2C1—18 to 40 inches; fine sandy loam2C2—40 to 72 inches; stratified sand to sandy loam
Properties and qualitiesDrainage class: Moderately well drainedParent material: Silty eolian deposits over coarser fluviomarine depositsPermeability: Moderate to rapidAvailable water capacity: ModerateReaction: Extremely acid to strongly acidDepth to the seasonal high water table: 18 to 42 inches
Interpretive groupsLand capability classification (in nonirrigated areas): 2e
Soil Survey of Salem County, New Jersey
45
Hydrologic group: C
Description of Urban Land
Urban land consists of areas where much of the soil surface is covered withasphalt, concrete, buildings, or other impervious cover. A description of the typicalsequence, depth, and composition of the soil material is not provided because thesoil material varies greatly from place to place.
Interpretive groupsLand capability classification (in nonirrigated areas): 8sHydrologic group: Not specified
Minor Components
• The poorly drained Othello soils that have a seasonal high water table within adepth of 12 inches; in the lower lying landscape positions
MutA—Muttontown sandy loam, 0 to 2 percent slopesSetting
Landscape: North Atlantic Coastal PlainLandform: Depressions, flats, and terraces
Composition
Muttontown and similar soils: 95 percentMinor components: 5 percent
Description of the Muttontown Soil
Typical profileSurface layer:Oe—0 to 2 inches; moderately decomposed plant materialA1—2 to 3 inches; sandy loamA2—3 to 7 inches; sandy loam
Subsoil:Bt1—7 to 20 inches; sandy loamBt2—20 to 38 inches; sandy clay loamBCg—38 to 57 inches; stratified sandy loam and sandy clay loam
Substratum:Cg—57 to 72 inches; sandy clay
Properties and qualitiesDrainage class: Moderately well drainedParent material: Sandy or loamy fluviomarine deposits, or bothPermeability: Moderately rapid and rapidAvailable water capacity: HighReaction: Extremely acid to slightly acidDepth to the seasonal high water table: 18 to 42 inches
Interpretive groupsLand capability classification (in nonirrigated areas): 2wHydrologic group: B
Minor Components
• The poorly drained Fallsington soils that have a fine-loamy particle-size controlsection; in the lower lying landscape positions
Soil Survey of Salem County, New Jersey
46
OTKA—Othello and Fallsington soils, 0 to 2 percentslopes
Setting
Landscape: North Atlantic Coastal PlainLandform: Depressions and flats
Composition
Othello and similar soils: 55 percentFallsington and similar soils: 45 percent
Description of the Othello Soil
Typical profileSurface layer:Oe—0 to 1 inch; mucky peatA—1 to 13 inches; silt loam
Subsoil:Btg1—13 to 32 inches; silt loamBtg2—32 to 40 inches; silty clay loam
Substratum:2C1—40 to 60 inches; loamy sand2C2—60 to 80 inches; sand
Properties and qualitiesDrainage class: Poorly drainedParent material: Silty eolian deposits over fluviomarine depositsPermeability: Moderate to rapidAvailable water capacity: HighReaction: Extremely acid to strongly acidSeasonal high water table: Within a depth of 12 inches
Interpretive groupsLand capability classification (in nonirrigated areas): 3wHydrologic group: C/D
Description of the Fallsington Soil
Typical profileSurface layer:Oe—0 to 2 inches; mucky peatA—2 to 5 inches; loam
Subsurface layer:E—5 to 8 inches; sandy loam
Subsoil:Btg1—8 to 14 inches; sandy loamBtg2—14 to 31 inches; sandy clay loam
Substratum:Cg1—31 to 62 inches; sandCg2—62 to 80 inches; gravelly sand
Properties and qualitiesDrainage class: Poorly drainedParent material: Loamy fluviomarine depositsPermeability: Moderate to rapid
Soil Survey of Salem County, New Jersey
47
Available water capacity: ModerateReaction: Extremely acid to strongly acidSeasonal high water table: Within a depth of 12 inches
Interpretive groupsLand capability classification (in nonirrigated areas): 3wHydrologic group: B/D
Minor Components
• There are no minor components that have significant differences from the majorcomponents in this map unit.
OTMA—Othello, Fallsington, and Trussum soils, 0 to2 percent slopes
Setting
Landscape: North Atlantic Coastal PlainLandform: Depressions
Composition
Othello and similar soils: 45 percentFallsington and similar soils: 35 percentTrussum and similar soils: 20 percent
Description of the Othello Soil
Typical profileSurface layer:Oe—0 to 1 inch; mucky peatA—1 to 13 inches; silt loam
Subsoil:Btg1—13 to 32 inches; silt loamBtg2—32 to 40 inches; silty clay loam
Substratum:2C1—40 to 60 inches; loamy sand2C2—60 to 80 inches; sand
Properties and qualitiesDrainage class: Poorly drainedParent material: Silty eolian deposits over fluviomarine depositsPermeability: Moderate to rapidAvailable water capacity: HighReaction: Extremely acid to strongly acidSeasonal high water table: Within a depth of 12 inches
Interpretive groupsLand capability classification (in nonirrigated areas): 3wHydrologic group: C/D
Description of the Fallsington Soil
Typical profileSurface layer:Oe—0 to 2 inches; mucky peatA—2 to 5 inches; loam
Subsurface layer:E—5 to 8 inches; sandy loam
Soil Survey of Salem County, New Jersey
48
Subsoil:Btg1—8 to 14 inches; sandy loamBtg2—14 to 31 inches; sandy clay loam
Substratum:Cg1—31 to 62 inches; sandCg2—62 to 80 inches; gravelly sand
Properties and qualitiesDrainage class: Poorly drainedParent material: Loamy fluviomarine depositsPermeability: Moderate to rapidAvailable water capacity: ModerateReaction: Extremely acid to strongly acidSeasonal high water table: Within a depth of 12 inches
Interpretive groupsLand capability classification (in nonirrigated areas): 3wHydrologic group: B/D
Description of the Trussum Soil
Typical profileSurface layer:Ap—0 to 12 inches; loam
Subsoil:Bt1—12 to 25 inches; loamBt2—25 to 35 inches; clayBt3—35 to 60 inches; clayBt4—60 to 66 inches; sandy clay loamBt5—66 to 72 inches; sandy clay loam
Properties and qualitiesDrainage class: Poorly drainedParent material: Clayey marine depositsPermeability: Slow to moderateAvailable water capacity: HighReaction: Extremely acid to strongly acidSeasonal high water table: Within a depth of 12 inches
Interpretive groupsLand capability classification (in nonirrigated areas): 4wHydrologic group: C/D
Minor Components
• There are no minor components that have significant differences from the majorcomponents in this map unit.
PEEAR—Pedricktown, Askecksy, and Mullica soils, 0 to2 percent slopes, rarely flooded
Setting
Landscape: North Atlantic Coastal PlainLandform: Depressions, flats, and flood plains
Soil Survey of Salem County, New Jersey
49
Composition
Pedricktown and similar soils: 45 percentAskecksy and similar soils: 35 percentMullica and similar soils: 20 percent
Description of the Pedricktown SoilTypical profileSurface layer:Oe—0 to 2 inches; mucky peatAg—2 to 9 inches; silt loam
Substratum:Cg1—9 to 22 inches; sandy loamCg2—22 to 36 inches; loamy sandCg3—36 to 40 inches; sandy clay loamCg4—40 to 49 inches; sandy loamCg5—49 to 56 inches; loamy sandCg6—56 to 72 inches; sand
Properties and qualitiesDrainage class: Very poorly drainedParent material: Loamy and sandy fluviomarine depositsPermeability: Moderate to rapidAvailable water capacity: ModerateReaction: Extremely acid to slightly acidPonding depth: 0 to 6 inches above the surfaceSeasonal high water table: Within a depth of 6 inchesFlooding: Rare
Interpretive groupsLand capability classification (in nonirrigated areas): 4wHydrologic group: D
Description of the Askecksy SoilTypical profileSurface layer:Ag—0 to 9 inches; loamy sand
Substratum:Cg1—9 to 11 inches; sandCg2—11 to 28 inches; sandCg3—28 to 31 inches; sandCg4—31 to 80 inches; sand
Properties and qualitiesDrainage class: Poorly drainedParent material: Sandy fluviomarine depositsPermeability: RapidAvailable water capacity: LowReaction: Extremely acid to strongly acidPonding depth: 0 to 6 inches above the surfaceSeasonal high water table: Within a depth of 12 inchesFlooding: Rare
Interpretive groupsLand capability classification (in nonirrigated areas): 4w
Soil Survey of Salem County, New Jersey
50
Hydrologic group: A/DDescription of the Mullica Soil
Typical profileSurface layer:Oe—0 to 2 inches; mucky peatAg—2 to 9 inches; sandy loam
Subsoil:Bg1—9 to 14 inches; sandy loamBg2—14 to 28 inches; sandy loam
Substratum:Cg1—28 to 31 inches; loamy sandCg2—31 to 40 inches; sandCg3—40 to 80 inches; gravelly loamy sand
Properties and qualitiesDrainage class: Very poorly drainedParent material: Sandy or loamy fluviomarine deposits, or bothPermeability: Moderately rapid and rapidAvailable water capacity: ModerateReaction: Extremely acid and very strongly acidPonding depth: 0 to 6 inches above the surfaceSeasonal high water table: Within a depth of 6 inchesFlooding: Rare
Interpretive groupsLand capability classification (in nonirrigated areas): 4wHydrologic group: D
Minor Components
• There are no minor components that have significant differences from the majorcomponents in this map unit.
PHG—Pits, sand and gravelSetting
Slope: Nearly levelLandscape: North Atlantic Coastal PlainAnthropogenic feature: Gravel pit
Composition
Pits, sand and gravel, and similar components: 100 percent
Description of Pits
This map unit consists of open excavations, or pits, from which soil material hasbeen removed for use as construction material or road aggregate. The pits commonlyhave steep, unstable slope faces. Some are filled with water. Most are mined for sandor gravel, or both. A few have been mined for materials high in glauconite. Adescription of the typical sequence, depth, and composition of the soil material is notprovided because the material varies greatly from place to place, and the majorproperties and qualities are not given because the soil properties vary too much.
Interpretive groupsLand capability classification (in nonirrigated areas): 8sHydrologic group: Not specified
Soil Survey of Salem County, New Jersey
51
PHM—Pits, claySetting
Slope: Nearly levelLandscape: North Atlantic Coastal PlainAnthropogenic feature: Clay pit
Composition
Pits, clay, and similar components: 100 percent
Description of Pits
This map unit consists of open excavations, or pits, from which soil material hasbeen removed for use as construction material or for other uses. The pits commonlyhave steep, unstable slope faces. Some are filled with water. Most are mined for clay.A few have been mined for materials high in glauconite. A description of the typicalsequence, depth, and composition of the soil material is not provided because thematerial varies greatly from place to place, and the major properties and qualities arenot given because the soil properties vary too much.
Interpretive groupsLand capability classification (in nonirrigated areas): 3wHydrologic group: C
SacA—Sassafras sandy loam, 0 to 2 percent slopesSetting
Landscape: North Atlantic Coastal PlainLandform: Knolls and low hills
Composition
Sassafras and similar soils: 80 percentMinor components: 20 percent
Description of the Sassafras Soil
Typical profileSurface layer:Ap—0 to 12 inches; sandy loam
Subsoil:Bt1—12 to 18 inches; sandy loamBt2—18 to 28 inches; sandy clay loamBC—28 to 40 inches; loamy sand
Substratum:C1—40 to 58 inches; sandC2—58 to 80 inches; sand
Properties and qualitiesDrainage class: Well drained (fig. 4)Parent material: Loamy or gravelly fluviomarine deposits, or bothPermeability: Moderate to rapidAvailable water capacity: ModerateReaction: Extremely acid to neutralDepth to the seasonal high water table: More than 6 feet
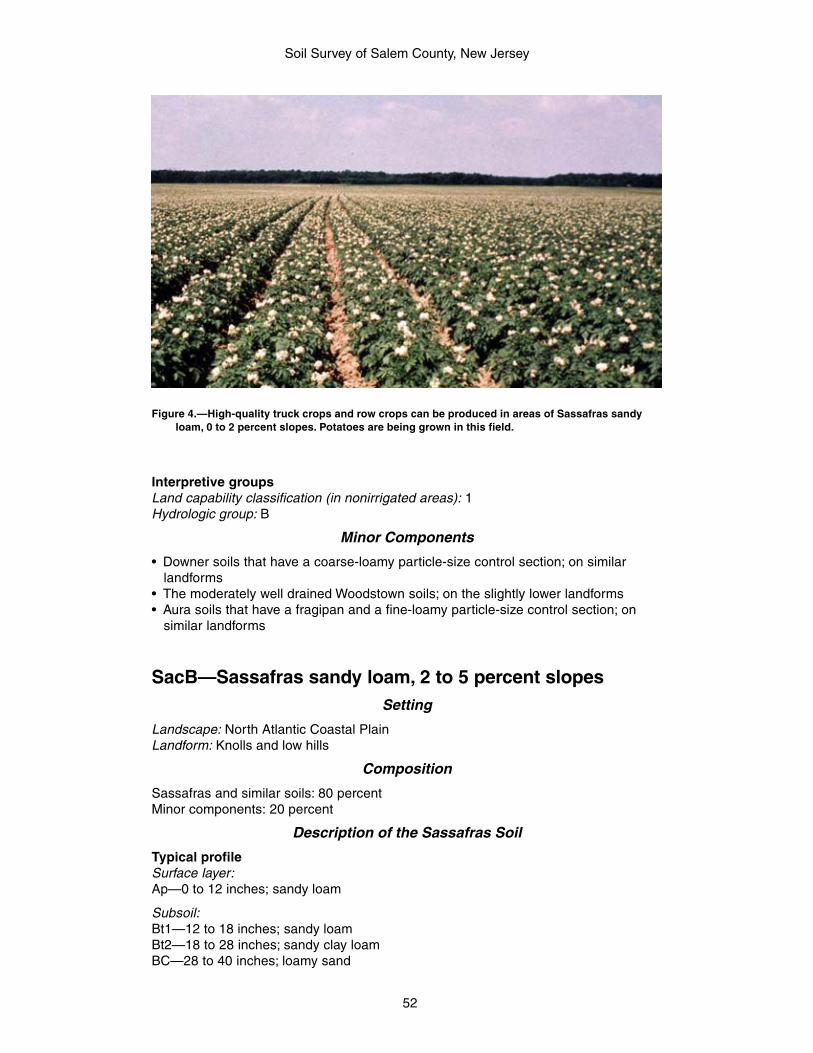
Soil Survey of Salem County, New Jersey
52
Interpretive groupsLand capability classification (in nonirrigated areas): 1Hydrologic group: B
Minor Components
• Downer soils that have a coarse-loamy particle-size control section; on similarlandforms
• The moderately well drained Woodstown soils; on the slightly lower landforms• Aura soils that have a fragipan and a fine-loamy particle-size control section; on
similar landforms
SacB—Sassafras sandy loam, 2 to 5 percent slopesSetting
Landscape: North Atlantic Coastal PlainLandform: Knolls and low hills
Composition
Sassafras and similar soils: 80 percentMinor components: 20 percent
Description of the Sassafras Soil
Typical profileSurface layer:Ap—0 to 12 inches; sandy loam
Subsoil:Bt1—12 to 18 inches; sandy loamBt2—18 to 28 inches; sandy clay loamBC—28 to 40 inches; loamy sand
Figure 4.—High-quality truck crops and row crops can be produced in areas of Sassafras sandyloam, 0 to 2 percent slopes. Potatoes are being grown in this field.
Soil Survey of Salem County, New Jersey
53
Substratum:C1—40 to 58 inches; sandC2—58 to 80 inches; sand
Properties and qualitiesDrainage class: Well drainedParent material: Loamy or gravelly fluviomarine deposits, or bothPermeability: Moderate to rapidAvailable water capacity: ModerateReaction: Extremely acid to neutralDepth to the seasonal high water table: More than 6 feet
Interpretive groupsLand capability classification (in nonirrigated areas): 2eHydrologic group: B
Minor Components
• Downer soils that have a coarse-loamy particle-size control section; on similarlandforms
• The moderately well drained Woodstown soils; on the slightly lower landforms• Aura soils that have a fragipan and a fine-loamy particle-size control section; on
similar landforms
SacC—Sassafras sandy loam, 5 to 10 percent slopesSetting
Landscape: North Atlantic Coastal PlainLandform: Knolls and low hills
Composition
Sassafras and similar soils: 90 percentMinor components: 10 percent
Description of the Sassafras Soil
Typical profileSurface layer:Ap—0 to 12 inches; sandy loam
Subsoil:Bt1—12 to 18 inches; sandy loamBt2—18 to 28 inches; sandy clay loamBC—28 to 40 inches; loamy sand
Substratum:C1—40 to 58 inches; sandC2—58 to 80 inches; sand
Properties and qualitiesDrainage class: Well drainedParent material: Loamy or gravelly fluviomarine deposits, or bothPermeability: Moderate to rapidAvailable water capacity: ModerateReaction: Extremely acid to neutralDepth to the seasonal high water table: More than 6 feet
Interpretive groupsLand capability classification (in nonirrigated areas): 3e
Soil Survey of Salem County, New Jersey
54
Hydrologic group: B
Minor Components
• Downer soils that have a coarse-loamy particle-size control section; on similarlandforms
• Aura soils that have a fragipan and a fine-loamy particle-size control section; onsimilar landforms
SafA—Sassafras loam, 0 to 2 percent slopesSetting
Landscape: North Atlantic Coastal PlainLandform: Flats, knolls, and low hills
Composition
Sassafras and similar soils: 90 percentMinor components: 10 percent
Description of the Sassafras Soil
Typical profileSurface layer:Ap—0 to 8 inches; loam
Subsurface layer:AB—8 to 12 inches; loam
Subsoil:Bt1—12 to 25 inches; sandy clay loamBt2—25 to 31 inches; sandy clay loamBC—31 to 42 inches; gravelly sandy loam
Substratum:C—42 to 60 inches; gravelly loamy sand
Properties and qualitiesDrainage class: Well drainedParent material: Loamy or gravelly fluviomarine deposits, or bothPermeability: Moderate to rapidAvailable water capacity: ModerateReaction: Extremely acid to strongly acidDepth to the seasonal high water table: More than 6 feet
Interpretive groupsLand capability classification (in nonirrigated areas): 1Hydrologic group: B
Minor Components
• The moderately well drained Woodstown soils; on the slightly lower landforms• The poorly drained Fallsington soils; on the lower landforms
SanA—Sassafras-Woodstown complex, 0 to 2 percentslopes
Setting
Landscape: North Atlantic Coastal PlainLandform: Flats, knolls, and low hills
Soil Survey of Salem County, New Jersey
55
Composition
Sassafras and similar soils: 60 percentWoodstown and similar soils: 40 percent
Description of the Sassafras SoilTypical profileSurface layer:Ap—0 to 12 inches; sandy loam
Subsoil:Bt1—12 to 18 inches; sandy loamBt2—18 to 28 inches; sandy clay loamBC—28 to 40 inches; loamy sand
Substratum:C1—40 to 58 inches; sandC2—58 to 80 inches; sand
Properties and qualitiesDrainage class: Well drainedParent material: Loamy or gravelly fluviomarine deposits, or bothPermeability: Moderate to rapidAvailable water capacity: ModerateReaction: Extremely acid to neutralDepth to the seasonal high water table: More than 6 feet
Interpretive groupsLand capability classification (in nonirrigated areas): 2eHydrologic group: B
Description of the Woodstown SoilTypical profileSurface layer:Ap—0 to 11 inches; sandy loam
Subsoil:BA—11 to 17 inches; sandy loamBt—17 to 23 inches; sandy loamBC—23 to 30 inches; sandy loam
Substratum:C—30 to 48 inches; sandy loam2C—48 to 60 inches; stratified loamy sand and sandy loam
Properties and qualitiesDrainage class: Moderately well drainedParent material: Old alluvium or sandy marine deposits, or bothPermeability: Moderately rapidAvailable water capacity: ModerateReaction: Extremely acid to strongly acidDepth to the seasonal high water table: 18 to 42 inches
Interpretive groupsLand capability classification (in nonirrigated areas): 2wHydrologic group: C
Minor Components
• There are no minor components that have significant differences from the majorcomponents in this map unit.
Soil Survey of Salem County, New Jersey
56
ShnA—Sharptown silt loam, 0 to 2 percent slopesSetting
Landscape: North Atlantic Coastal PlainLandform: Ridges and terraces
Composition
Sharptown and similar soils: 95 percentMinor components: 5 percent
Description of the Sharptown Soil
Typical profileSurface layer:Ap—0 to 10 inches; silt loam
Subsoil:Bt1—10 to 20 inches; silt loamBt2—20 to 23 inches; silt loamBt3—23 to 38 inches; silt loamBC—38 to 44 inches; loam
Substratum:2C1—44 to 46 inches; sandy loam2C2—46 to 50 inches; silt loam2C3—50 to 58 inches; loam2C4—58 to 72 inches; silt loam
Properties and qualitiesDrainage class: Moderately well drainedParent material: Silty eolian deposits over glauconitic loamy marine depositsPermeability: Moderately slow and moderateAvailable water capacity: HighReaction: Extremely acid to strongly acidDepth to the seasonal high water table: 18 to 42 inches
Interpretive groupsLand capability classification (in nonirrigated areas): 2wHydrologic group: C
Minor Components
• The poorly drained Othello soils; on the lower landforms
ShnB—Sharptown silt loam, 2 to 5 percent slopesSetting
Landscape: North Atlantic Coastal PlainLandform: Ridges and terraces
Composition
Sharptown and similar soils: 95 percentMinor components: 5 percent
Description of the Sharptown Soil
Typical profileSurface layer:Ap—0 to 10 inches; silt loam
Soil Survey of Salem County, New Jersey
57
Subsoil:Bt1—10 to 20 inches; silt loamBt2—20 to 23 inches; silt loamBt3—23 to 38 inches; silt loamBC—38 to 44 inches; loam
Substratum:2C1—44 to 46 inches; sandy loam2C2—46 to 50 inches; silt loam2C3—50 to 58 inches; loam2C4—58 to 72 inches; silt loam
Properties and qualitiesDrainage class: Moderately well drainedParent material: Silty eolian deposits over glauconitic loamy marine depositsPermeability: Moderately slow and moderateAvailable water capacity: HighReaction: Extremely acid to strongly acidDepth to the seasonal high water table: 18 to 42 inches
Interpretive groupsLand capability classification (in nonirrigated areas): 2eHydrologic group: C
Minor Components
• The poorly drained Othello soils; on the lower landforms
SwtB—Swedesboro loamy sand, 0 to 5 percent slopesSetting
Landscape: North Atlantic Coastal PlainLandform: Ridges and terraces
Composition
Swedesboro and similar soils: 90 percentMinor components: 10 percent
Description of the Swedesboro Soil
Typical profileSurface layer:Ap—0 to 10 inches; loamy sand
Subsoil:BA—10 to 14 inches; loamy sandBt1—14 to 26 inches; sandy loamBt2—26 to 30 inches; sandy clay loamBt3—30 to 40 inches; fine sandy loamBC—40 to 46 inches; loamy fine sand
Substratum:2C1—46 to 54 inches; sand2C2—54 to 72 inches; sand
Properties and qualitiesDrainage class: Well drainedParent material: Glauconitic sandy marine deposits or glauconitic loamy marine
deposits, or both
Soil Survey of Salem County, New Jersey
58
Permeability: Moderately rapid and rapidAvailable water capacity: LowReaction: Extremely acid to strongly acidDepth to the seasonal high water table: More than 6 feet
Interpretive groupsLand capability classification (in nonirrigated areas): 2sHydrologic group: B
Minor Components
• The moderately well drained Sharptown soils that have a fine-silty particle-sizecontrol section; on similar landforms
• Woodstown soils that have a seasonal high water table at a depth of 18 to42 inches and a fine-loamy particle-size control section that does not containglauconite; on the slightly lower landforms
SwtC—Swedesboro loamy sand, 5 to 10 percentslopes
Setting
Landscape: North Atlantic Coastal PlainLandform: Ridges and terraces
Composition
Swedesboro and similar soils: 90 percentMinor components: 10 percent
Description of the Swedesboro Soil
Typical profileSurface layer:Ap—0 to 10 inches; loamy sand
Subsoil:BA—10 to 14 inches; loamy sandBt1—14 to 26 inches; sandy loamBt2—26 to 30 inches; sandy clay loamBt3—30 to 40 inches; fine sandy loamBC—40 to 46 inches; loamy fine sand
Substratum:2C1—46 to 54 inches; sand2C2—54 to 72 inches; sand
Properties and qualitiesDrainage class: Well drainedParent material: Glauconitic sandy marine deposits or glauconitic loamy marine
deposits, or bothPermeability: Moderately rapid and rapidAvailable water capacity: LowReaction: Extremely acid to strongly acidDepth to the seasonal high water table: More than 6 feet
Interpretive groupsLand capability classification (in nonirrigated areas): 3eHydrologic group: B
Soil Survey of Salem County, New Jersey
59
Minor Components
• The moderately well drained Sharptown soils that have a fine-silty particle-sizecontrol section; on similar landforms
• Woodstown soils that have a seasonal high water table at a depth of 18 to42 inches and a fine-loamy particle-size control section that does not containglauconite; on the slightly lower landforms
TrkAv—Transquaking mucky peat, 0 to 1 percent slopes,very frequently flooded
Setting
Landscape: North Atlantic Coastal PlainLandform: Tidal flats
Composition
Transquaking and similar soils: 90 percentMinor components: 10 percent
Description of the Transquaking Soil
Typical profileOe1—0 to 14 inches; mucky peatOe2—14 to 30 inches; mucky peatOe3—30 to 45 inches; mucky peatOe4—45 to 70 inches; mucky peatOa—70 to 90 inches; muck
Properties and qualitiesDrainage class: Very poorly drainedParent material: Herbaceous organic material over loamy sedimentsPermeability: SlowAvailable water capacity: Very highReaction: Slightly acid to neutral (unincubated)Ponding depth: 0 to 12 inches above the surfaceSeasonal high water table: At the surfaceFlooding: Very frequent
Interpretive groupsLand capability classification (in nonirrigated areas): 8wHydrologic group: D
Minor Components
• Broadkill soils that do not have organic layers more than 8 inches thick in the upper72 inches; on similar landforms
• Appoquinimink soils that formed in loamy fluvial sediments, high in silt, overlyingdominantly herbaceous organic material
UddfB—Udorthents, dredged fine material, 0 to 8 percentslopes
Setting
Landscape: North Atlantic Coastal PlainAnthropogenic feature: Hydraulic fills and constructed leveesLandform: Depressions
Soil Survey of Salem County, New Jersey
60
Composition
Udorthents and similar soils: 90 percentMinor components: 10 percent
Description of the Udorthents
Typical profileSurface layer:A—0 to 12 inches; loam
Substratum:C—12 to 72 inches; clay
Properties and qualitiesDrainage class: Well drainedParent material: Dredged fill or excavated borrow materials derived from river
channels, pits, or previously unaltered soilsPermeability: Slow to moderateAvailable water capacity: HighReaction: Very strongly acid to slightly acidDepth to the seasonal high water table: More than 6 feet
Interpretive groupsLand capability classification (in nonirrigated areas): 7sHydrologic group: D
Minor Components
• Urban land• Water
UdrB—Udorthents, refuse substratum, 0 to 8 percentslopes
Setting
Landscape: North Atlantic Coastal PlainAnthropogenic feature: FillLandform: Low hills
Composition
Udorthents and similar soils: 100 percent
Description of the Udorthents
Typical profileC—0 to 60 inches; silt loam
Properties and qualitiesDrainage class: Well drainedParent material: Silty material overlying refuse material transported by human
activityPermeability: HighAvailable water capacity: HighReaction: Moderately acid to neutral
Soil Survey of Salem County, New Jersey
61
Depth to the seasonal high water table: More than 6 feet
Interpretive groupsLand capability classification (in nonirrigated areas): 7sHydrologic group: D
Minor Components
• There are no minor components that have significant differences from the majorcomponent in this map unit.
UdsB—Udorthents, sandy substratum, 0 to 8 percentslopes
Setting
Landscape: North Atlantic Coastal PlainAnthropogenic feature: Borrow area; upper layers of natural soil have been removed
for other purposes (roads, railroads, etc.)Landform: Depression
Composition
Udorthents and similar soils: 100 percent
Description of the Udorthents
Typical profileSurface layer:A—0 to 12 inches; loam
Substratum:C—12 to 72 inches; very gravelly sand
Properties and qualitiesDrainage class: Well drainedParent material: Sandy and gravelly material from the substratum of natural soilsPermeability: Moderate to rapidAvailable water capacity: LowReaction: Very strongly acid to slightly alkalineDepth to the seasonal high water table: More than 6 feet
Interpretive groupsLand capability classification (in nonirrigated areas): 7sHydrologic group: B
Minor Components
• There are no minor components that have significant differences from the majorcomponent in this map unit.
UR—Urban landSetting
Slope: Nearly levelLandscape: North Atlantic Coastal PlainAnthropogenic feature: Urban land
Soil Survey of Salem County, New Jersey
62
Composition
Urban land and similar components: 95 percentMinor components: 5 percent
Description of Urban Land
Urban land consists of areas where much of the soil surface is covered withasphalt, concrete, buildings, or other impervious cover. A description of the typicalsequence, depth, and composition of the soil material is not provided because thesoil material varies greatly from place to place.
Interpretive groupsLand capability classification (in nonirrigated areas): 8sHydrologic group: Not specified
Minor Components
• Udorthents that generally consist of loamy material in the upper part of the profileand sandy to loamy material mixed with household and industrial refuse in thelower part
WATER—WaterThis map unit consists of areas inundated with water for most of the year. It
generally includes rivers, ponds, or lakes.
WoeA—Woodstown sandy loam, 0 to 2 percent slopesSetting
Landscape: North Atlantic Coastal PlainLandform: Depressions, flats, ridges, and terraces
Composition
Woodstown and similar soils: 80 percentMinor components: 20 percent
Description of the Woodstown Soil
Typical profileSurface layer:Ap—0 to 8 inches; sandy loam
Subsoil:Bt1—8 to 26 inches; sandy loamBt2—26 to 30 inches; sandy clay loamBt3—30 to 36 inches; sandy loam
Substratum:C—36 to 80 inches; loamy sand
Properties and qualitiesDrainage class: Moderately well drainedParent material: Old alluvium or sandy marine deposits, or bothPermeability: Moderate to rapidAvailable water capacity: ModerateReaction: Extremely acid to neutralDepth to the seasonal high water table: 18 to 42 inches

Soil Survey of Salem County, New Jersey
63
Interpretive groupsLand capability classification (in nonirrigated areas): 2wHydrologic group: C
Minor Components
• The well drained Downer soils that have a coarse-loamy particle-size controlsection; on the slightly higher landforms
• The poorly drained Fallsington soils; on the lower landforms• The well drained Sassafras soils that have a fine-loamy particle-size control section;
on the slightly higher landforms

65
Soil Survey of Salem County, New Jersey
This soil survey is an inventory and evaluation of the soils in the survey area. It canbe used to adjust land uses to the limitations and potentials of natural resources andthe environment. Also, it can help to prevent soil-related failures in land uses.
In preparing a soil survey, soil scientists, conservationists, engineers, and otherscollect extensive field data about the nature and behavioral characteristics of thesoils. They collect data on erosion, droughtiness, flooding, and other factors thataffect various soil uses and management. Field experience and collected data on soilproperties and performance are used as a basis in predicting soil behavior.
Information in this section can be used to plan the use and management of soilsfor crops and pasture; as forestland; as sites for buildings, sanitary facilities, highwaysand other transportation systems, and parks and other recreational facilities; foragricultural waste management; and as wildlife habitat. It can be used to identify thepotentials and limitations of each soil for specific land uses and to help preventconstruction failures caused by unfavorable soil properties.
Planners and others using soil survey information can evaluate the effect ofspecific land uses on productivity and on the environment in all or part of the surveyarea. The survey can help planners to maintain or create a land use pattern inharmony with the natural soil.
Contractors can use this survey to locate sources of sand and gravel, roadfill, andtopsoil. They can use it to identify areas where bedrock, wetness, or very firm soillayers can cause difficulty in excavation.
Health officials, highway officials, engineers, and others may also find this surveyuseful. The survey can help them plan the safe disposal of wastes and locate sites forpavements, sidewalks, campgrounds, playgrounds, lawns, and trees and shrubs.
Interpretive Ratings
The interpretive tables in this survey rate the soils in the survey area for varioususes. Many of the tables identify the limitations that affect specified uses and indicatethe severity of those limitations. The ratings in these tables are both verbal andnumerical.
Rating Class Terms
Rating classes are expressed in the tables in terms that indicate the extent towhich the soils are limited by all of the soil features that affect a specified use or interms that indicate the suitability of the soils for the use. Thus, the tables may showlimitation classes or suitability classes. Terms for the limitation classes are not limited,somewhat limited, and very limited. The suitability ratings are expressed as wellsuited, moderately suited, poorly suited, and unsuited or as good, fair, and poor.
Numerical Ratings
Numerical ratings in the tables indicate the relative severity of individual limitations.The ratings are shown as decimal fractions ranging from 0.00 to 1.00. They indicategradations between the point at which a soil feature has the greatest negative impact
Use and Management of the Soils
Soil Survey of Salem County, New Jersey
66
on the use and the point at which the soil feature is not a limitation. The limitationsappear in order from the most limiting to the least limiting. Thus, if more than onelimitation is identified, the most severe limitation is listed first and the least severe oneis listed last.
Crops and Pasture
Mona Peterson, district conservationist, Natural Resources Conservation Service, helped to preparethis section.
General management needed for crops and pasture is suggested in this section.The estimated yields of the main crops are listed, the system of land capabilityclassification used by the Natural Resources Conservation Service is explained, andprime farmland and other important farmland are described.
Planners of management systems for individual fields or farms should consider thedetailed information given in the description of each soil under the heading “DetailedSoil Map Units.” Specific information can be obtained from the local office of theNatural Resources Conservation Service or the Cooperative Extension Service.
Federal and state regulations stipulate that any area designated as a wetlandcannot be altered without prior approval. Contact the local office of the NaturalResources Conservation Service for identification of hydric soils and potentialwetlands.
Conditions are favorable for crops and pasture in Salem County. Soil suitability anda favorable climate increase the potential for the production of many field crops thatare not commonly grown in the county.
Corn and soybeans are the row crops dominantly grown in the county. Grainsorghum and similar crops can also be grown profitably if economic conditions arefavorable. Wheat is the most commonly grown close-growing crop, and barley andoats are also suitable for planting. Specialty crops include vegetables, small fruits,tree fruits, and many nursery plants (fig. 5). Some areas are used for melons,strawberries, sweet corn, tomatoes, peppers, or other vegetables or small fruits.Apples and peaches are the most common tree fruits.
Soils that have good natural drainage and warm up early in spring are especiallywell suited to many vegetables and small fruits. They include the Downer andSassafras soils in areas that have slopes of less than 5 percent. Most of the welldrained soils in the survey area are suited to orchard crops and nursery plants. Soilsin low areas, such as depressions, lower flats, and drainageways where frost isfrequent and air drainage is poor, generally are poorly suited to early vegetables,small fruits, and orchard crops.
The latest information about specialty crops can be obtained at the local office ofthe Cooperative Extension Service or the Natural Resources Conservation Service.
The nearly level and gently sloping soils in Salem County generally are well suitedto row crops and vegetables. Most of the row crops and vegetables are grown inareas of soils in the higher landscape positions because wetness typically is alimitation of the soils in the lower landscape positions.
Some areas that are idle, wooded, or pastured have good potential for use ascropland. Crop production could be increased considerably by applying the latesttechnology and management practices to all of the cropland in the survey area. Theinformation in this soil survey can facilitate the application of such technology andmanagement practices.
Cropland
The management considerations in areas of cropland in Salem County includecontrolling erosion, installing drainage systems, improving soil fertility, applying asystem of weed control, and improving tilth.
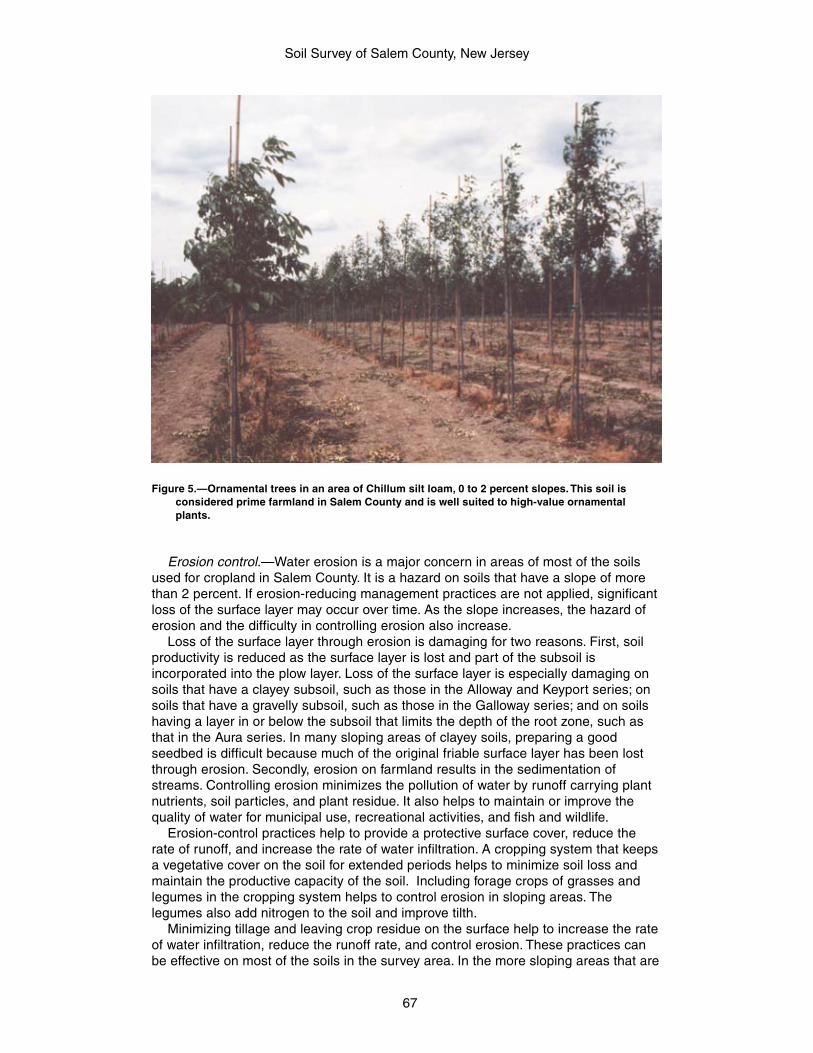
Soil Survey of Salem County, New Jersey
67
Erosion control.—Water erosion is a major concern in areas of most of the soilsused for cropland in Salem County. It is a hazard on soils that have a slope of morethan 2 percent. If erosion-reducing management practices are not applied, significantloss of the surface layer may occur over time. As the slope increases, the hazard oferosion and the difficulty in controlling erosion also increase.
Loss of the surface layer through erosion is damaging for two reasons. First, soilproductivity is reduced as the surface layer is lost and part of the subsoil isincorporated into the plow layer. Loss of the surface layer is especially damaging onsoils that have a clayey subsoil, such as those in the Alloway and Keyport series; onsoils that have a gravelly subsoil, such as those in the Galloway series; and on soilshaving a layer in or below the subsoil that limits the depth of the root zone, such asthat in the Aura series. In many sloping areas of clayey soils, preparing a goodseedbed is difficult because much of the original friable surface layer has been lostthrough erosion. Secondly, erosion on farmland results in the sedimentation ofstreams. Controlling erosion minimizes the pollution of water by runoff carrying plantnutrients, soil particles, and plant residue. It also helps to maintain or improve thequality of water for municipal use, recreational activities, and fish and wildlife.
Erosion-control practices help to provide a protective surface cover, reduce therate of runoff, and increase the rate of water infiltration. A cropping system that keepsa vegetative cover on the soil for extended periods helps to minimize soil loss andmaintain the productive capacity of the soil. Including forage crops of grasses andlegumes in the cropping system helps to control erosion in sloping areas. Thelegumes also add nitrogen to the soil and improve tilth.
Minimizing tillage and leaving crop residue on the surface help to increase the rateof water infiltration, reduce the runoff rate, and control erosion. These practices canbe effective on most of the soils in the survey area. In the more sloping areas that are
Figure 5.—Ornamental trees in an area of Chillum silt loam, 0 to 2 percent slopes. This soil isconsidered prime farmland in Salem County and is well suited to high-value ornamentalplants.
Soil Survey of Salem County, New Jersey
68
used for corn or are double cropped with soybeans, no-till farming helps to controlerosion.
Terraces and diversions shorten the length of slopes and thus minimize erosioncaused by runoff. They are most effective on well drained soils and less effective onwetter soils that may become excessively wet in terrace channels.
Information about erosion-control measures for each kind of soil is available at thelocal office of the Natural Resources Conservation Service.
Water management.—Water management involves improving soil drainage andretaining soil moisture.
Excessive wetness is a management concern on cropland in Salem County. Wetsoils limit equipment use and crop selection. They are poorly aerated and are slowerto warm in the spring than better drained soils, and the crops grown on these soilsare often susceptible to disease and pest management problems. Somewhat poorlydrained and poorly drained soils are so wet that many crops are damaged duringmost years unless a drainage system is installed.
The design of both surface and subsurface drainage systems varies according tothe kind of soil. A combination of surface drains and tile drains is generally needed inmore intensively row cropped areas of the somewhat poorly drained soils. Drainsshould be installed at closer intervals in the more slowly permeable soils than in themore rapidly permeable soils.
Managing drainage in conformance with regulations concerning wetlands mayrequire special permits and extra planning. The local office of the Natural ResourcesConservation Service should be contacted for identification of hydric soils andpotential wetlands.
Tidal areas are subject to daily tidal flooding. Flash flooding as a result of intensiverainfall can occur on flood plains at any time of the year.
Soil fertility.—The soils in Salem County generally are low in natural fertility and arenaturally acid. Additions of lime and fertilizer are needed for the production of mostkinds of crops.
The liming requirement is a major management concern in areas of cropland. Theacidity level in a soil affects the availability of many nutrients to plants and the activityof beneficial bacteria. Lime neutralizes exchangeable aluminum in the soil and thuscounteracts the adverse effects of high levels of aluminum on many crops. Limingadds calcium (from calcitic lime) or calcium and magnesium (from dolomitic lime) tothe soil. A soil test is a guide to what amount and kind of lime should be used. Thedesired pH levels may differ, depending on the soil properties and the crop to begrown.
Nitrogen fertilizer is required for most crops. It generally is not required, however,for clover, in some rotations of soybeans, and for alfalfa that is established. Soil testscan also indicate the need for phosphorus and potassium fertilizer. Phosphorus andpotassium levels can build up in the soil if applications of these nutrients exceed cropdemands.
Weed control.—Applying herbicides for weed control is a common practice oncropland in the county. It decreases the need for tillage and is an integral part ofmodern farming. Selected soil properties, such as organic matter content and textureof the surface layer, affect the rate of herbicide application. Estimates of both of theseproperties were determined for the soils in this county and are provided in table 18,“Engineering Index Properties,” and table 19, “Physical Properties of the Soils.”
In some areas the organic matter content projected for a soil is outside the rangeshown in the table. It can be higher in soils that have received large amounts ofanimal or human waste. Soils that have recently been brought into cultivation mayhave a higher content of organic matter in the surface layer than similar soils thathave been cultivated for a long time. A lower content of organic matter is commonwhere the surface layer has been partly or completely removed by erosion or if the
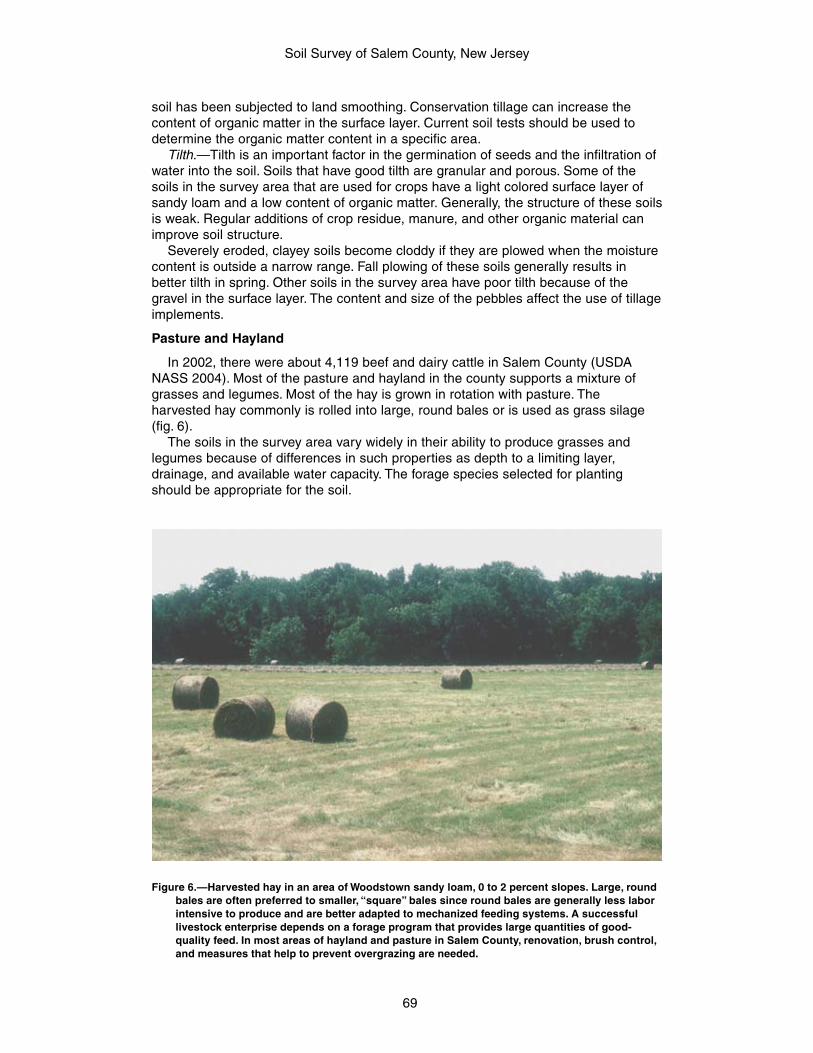
Soil Survey of Salem County, New Jersey
69
soil has been subjected to land smoothing. Conservation tillage can increase thecontent of organic matter in the surface layer. Current soil tests should be used todetermine the organic matter content in a specific area.
Tilth.—Tilth is an important factor in the germination of seeds and the infiltration ofwater into the soil. Soils that have good tilth are granular and porous. Some of thesoils in the survey area that are used for crops have a light colored surface layer ofsandy loam and a low content of organic matter. Generally, the structure of these soilsis weak. Regular additions of crop residue, manure, and other organic material canimprove soil structure.
Severely eroded, clayey soils become cloddy if they are plowed when the moisturecontent is outside a narrow range. Fall plowing of these soils generally results inbetter tilth in spring. Other soils in the survey area have poor tilth because of thegravel in the surface layer. The content and size of the pebbles affect the use of tillageimplements.
Pasture and Hayland
In 2002, there were about 4,119 beef and dairy cattle in Salem County (USDANASS 2004). Most of the pasture and hayland in the county supports a mixture ofgrasses and legumes. Most of the hay is grown in rotation with pasture. Theharvested hay commonly is rolled into large, round bales or is used as grass silage(fig. 6).
The soils in the survey area vary widely in their ability to produce grasses andlegumes because of differences in such properties as depth to a limiting layer,drainage, and available water capacity. The forage species selected for plantingshould be appropriate for the soil.
Figure 6.—Harvested hay in an area of Woodstown sandy loam, 0 to 2 percent slopes. Large, roundbales are often preferred to smaller, “square” bales since round bales are generally less laborintensive to produce and are better adapted to mechanized feeding systems. A successfullivestock enterprise depends on a forage program that provides large quantities of good-quality feed. In most areas of hayland and pasture in Salem County, renovation, brush control,and measures that help to prevent overgrazing are needed.
Soil Survey of Salem County, New Jersey
70
The nearly level and gently sloping, well drained soils are well suited to the highestproducing crops, such as corn for grain and silage, alfalfa, or a mixture of alfalfa andorchardgrass or orchardgrass and timothy. Sod-farming grasses, such as tall fescueand orchardgrass, help to minimize erosion in the steeper areas. Alfalfa should beseeded with cool-season grasses in areas where a root-limiting layer is at a depth ofat least 2 feet and the soil is well drained. The wetter soils are better suited to clover-grass mixtures or to pure stands of clover or grasses. Legumes can be establishedthrough renovation in areas that support sod-forming grasses.
The intended use should be considered when forage species are selected.Selected species should provide maximum quality and versatility in the forageprogram. Legumes generally produce higher quality feed than grasses. They shouldbe grown to the maximum extent possible. The taller legumes, such as alfalfa and redclover, are more versatile than legumes that are used primarily for grazing, such aswhite clover. Orchardgrass, timothy, and tall fescue are best suited to use as hay andsilage.
Tall fescue is an important cool-season grass. It is suited to a wide range of soilconditions and is grown for both pasture and hay. The growth that occurs from Augustthrough November commonly accumulates in the field and is used for grazing in latefall and in winter. For maximum production, nitrogen fertilizer should be applied duringthe period when the grass is accumulating. The rate of application should be basedon the desired level of production.
Warm-season grasses that are planted from early April through late May help tosupplement cool-season grasses. They grow well during warm periods, especiallyfrom mid-June through September, when the growth of cool-season grasses is low.Examples of warm-season grasses are switchgrass, big bluestem, indiangrass, andCaucasian bluestem.
Renovation can increase forage yields in areas that have a good stand of grass.This process involves partially destroying the sod, usually by application ofherbicides, and then applying lime and fertilizer and seeding desirable forage species.Adding legumes to the stand of grass provides high-quality feed. Legumes increasesummer production and transfer, or “fix,” nitrogen from the air into the soil. Undergrowing conditions, alfalfa can fix 200 to 300 pounds of nitrogen per acre per year;red clover, 100 to 200 pounds; and ladino clover, 100 to 150 pounds. An acre ofannual forage legumes, such as vetch, can fix 75 to 100 pounds of nitrogen per year.
Additional information about managing pasture and hayland can be obtained at thelocal office of the Natural Resources Conservation Service or the CooperativeExtension Service.
Ornamental Crops
The ornamental crops grown in Salem County include Christmas trees and manyspecies of native trees, shrubs, and herbaceous plants used in landscaping, such asmountain laurel, rhododendron, hemlock, and boxwood. Important Christmas treespecies are Scotch pine, white spruce, blue spruce, and Norway spruce. Also grownare hybrid trees and shrubs, including holly, juniper, and yew.
Ornamental crops grow well on the well drained, loamy soils in the county. Theyshould be protected from northwestern winds in winter, especially when the crops areon the higher landforms. The content of clay in the soil should be 15 to 30 percent foroptimum ball and burlap harvesting.
Sandy soils that have a clay content of less than 15 percent are more difficult touse for ornamental species that are ball and burlap harvested. These soils do notcling together and thus ball poorly. Soils that have a clay content of more than30 percent can only be dug when their water content is within a narrow range. Soilsthat are wet, are in natural drainageways, or have a clay content of more than30 percent also are difficult to use for ornamental species. They hold excess moisture
Soil Survey of Salem County, New Jersey
71
around roots which results in poor growth and encourages phytophthora root disease.Sites should be selected in areas having an adequate supply of water that can beused to spray or irrigate the plants. Disturbing as little of the planting area as possiblehelps to prevent excessive erosion. Leaving areas between plants and between rowsin permanent sod helps to control erosion and to provide a path for equipment.Planting in a grid arrangement allows easy access by equipment used for mowingand spraying.
Access roads should be carefully planned and constructed. If possible, they shouldnot be constructed in natural drainageways, in wet areas, or where, because of theslope, the roadbed grade would be more than 10 percent. They should be surfaced orseeded with perennial vegetation as soon as possible after construction. Lime andfertilizer should be applied regularly to maintain the sod. Cut and fill slopes should bestabilized with vegetation as soon as possible.
Because of insufficient natural fertility, the soils in Salem County cannot quicklyproduce ornamentals. They are typically low in nitrogen and phosphorus and, wherefertilizers have been previously applied, often high in potassium. Some soils are tooacid for ornamental crops, especially for hybrid ornamentals and some tree species.Application rates for lime and fertilizer should be determined by soil tests and bytissue analysis of the crop.
Herbicides should only be applied by banding or spot treatment. The content oforganic matter, the texture of the surface layer, and the depth to a seasonal highwater table affect the amount of herbicide used and the frequency of application. Theeffectiveness of herbicides is reduced in eroded soils that have a higher content ofclay in the surface layer. Soil wetness associated with seeps and springs can alsoreduce the effectiveness of herbicides. These soil limitations are described under theheading “Detailed Soil Map Units.”
Orchards
Orchards in Salem County produce several varieties of apples and peaches. Thefruit is grown primarily for the fresh market and the juice market. All varieties requireintensive management and high maintenance.
A uniform, sloping topography allows for good drainage. Sites that are gullied orhave ravines or abrupt changes in slope should not be selected. Trees planted inareas of soils that are wet, subject to flooding, affected by seeps, or in naturaldrainageways produce low yields and are more susceptible to disease. Orchardsshould be established near an adequate supply of water that can be used to spray orirrigate the crops. The best sites are in areas of well drained soils.
The layout of an orchard should include outlets for water flowing into the orchardfrom higher areas and water flowing out of the orchard. Field borders and diversionsthat empty into grassed waterways dispose of water without causing erosion. Sodshould be used between rows of trees and on all roads and erosion-controlstructures. It should be established as soon as possible after construction. Rows oftrees should be planted on the contour and as nearly parallel to each other aspossible. This arrangement helps to control erosion and allows easy access. Accessroads are very important. Short or dead-end roads make access with equipmentdifficult, and roads with sharp turns or grades of more than 10 percent should not beconstructed. Wet areas and natural drainageways should be avoided as sites forroads. If these areas are unavoidable, earth-berm water bars and culverts should beinstalled.
The soils in Salem County have insufficient natural fertility to sustain high-producing orchards. They are too acid and are typically low in nitrogen andphosphorus. Application rates for lime and fertilizer should be determined by tissueanalysis of the trees and by soil analysis. Lime and fertilizer should be applied toaccess roads and erosion-control structures to help maintain the sod.
Soil Survey of Salem County, New Jersey
72
Yields per Acre
The average yields per acre that can be expected of the principal crops under ahigh level of management are shown in table 5. In any given year, yields may behigher or lower than those indicated in the table because of variations in rainfall andother climatic factors. The land capability classification of map units in the survey areaalso is shown in the table.
The yields are based mainly on the experience and records of farmers,conservationists, and extension agents. Available yield data from nearby counties andresults of field trials and demonstrations also are considered.
The management needed to obtain the indicated yields of the various cropsdepends on the kind of soil and the crop. Management can include drainage, erosioncontrol, and protection from flooding; the proper planting and seeding rates; suitablehigh-yielding crop varieties; appropriate and timely tillage; control of weeds, plantdiseases, and harmful insects; favorable soil reaction and optimum levels of nitrogen,phosphorus, potassium, and trace elements for each crop; effective use of cropresidue, barnyard manure, and green manure crops; and harvesting that ensures thesmallest possible loss.
For yields of irrigated crops, it is assumed that the irrigation system is adapted tothe soils and to the crops grown, that good-quality irrigation water is uniformly appliedas needed, and that tillage is kept to a minimum.
The estimated yields reflect the productive capacity of each soil for each of theprincipal crops. Yields are likely to increase as new production technology isdeveloped. The productivity of a given soil compared with that of other soils, however,is not likely to change.
Crops other than those shown in table 5 are grown in the survey area, butestimated yields are not listed because the acreage of such crops is small. The localoffice of the Natural Resources Conservation Service or of the Cooperative ExtensionService can provide information about the management and productivity of the soilsfor those crops.
Land Capability Classification
Land capability classification shows, in a general way, the suitability of soils formost kinds of field crops. Crops that require special management are excluded. Thesoils are grouped according to their limitations for field crops, the risk of damage ifthey are used for crops, and the way they respond to management. The criteria usedin grouping the soils do not include major and generally expensive landforming thatwould change slope, depth, or other characteristics of the soils, nor do they includepossible but unlikely major reclamation projects. Capability classification is not asubstitute for interpretations designed to show suitability and limitations of groups ofsoils for forestland or for engineering purposes.
In the capability system, soils are generally grouped at three levels—capabilityclass, subclass, and unit.
Capability classes, the broadest groups, are designated by the numbers 1 through8. The numbers indicate progressively greater limitations and narrower choices forpractical use. The classes are defined as follows:
Class 1 soils have slight limitations that restrict their use.Class 2 soils have moderate limitations that restrict the choice of plants or that
require moderate conservation practices.Class 3 soils have severe limitations that restrict the choice of plants or that require
special conservation practices, or both.Class 4 soils have very severe limitations that restrict the choice of plants or that
require very careful management, or both.Class 5 soils are subject to little or no erosion but have other limitations, impractical to
remove, that restrict their use mainly to pasture, forestland, or wildlife habitat.
Soil Survey of Salem County, New Jersey
73
Class 6 soils have severe limitations that make them generally unsuitable forcultivation and that restrict their use mainly to pasture, forestland, or wildlife habitat.
Class 7 soils have very severe limitations that make them unsuitable for cultivationand that restrict their use mainly to grazing, forestland, or wildlife habitat.
Class 8 soils and miscellaneous areas have limitations that preclude commercialplant production and that restrict their use to recreational purposes, wildlife habitat,watershed, or esthetic purposes.
Capability subclasses are soil groups within one class. They are designated byadding a small letter, e, w, s, or c, to the class numeral, for example, 2e. The letter eshows that the main hazard is the risk of erosion unless close-growing plant cover ismaintained; w shows that water in or on the soil interferes with plant growth orcultivation (in some soils the wetness can be partly corrected by artificial drainage); sshows that the soil is limited mainly because it is shallow, droughty, or stony; and c,used in only some parts of the United States, shows that the chief limitation is climatethat is very cold or very dry.
In class 1 there are no subclasses because the soils of this class have fewlimitations. Class 5 contains only the subclasses indicated by w, s, or c because thesoils in class 5 are subject to little or no erosion. They have other limitations thatrestrict their use to pasture, forestland, wildlife habitat, or recreation.
The acreage of soils in each capability class or subclass is shown in table 6. Theacreage listed as “Unclassified” includes that of the minor components in theindividual map units, any water areas of significant size, and other miscellaneousareas. Minor components were not assigned a land capability class because they areof minimal extent in the map unit. The capability classification of map units in thissurvey area is given in the section “Detailed Soil Map Units” and in the yields table.
Prime Farmland and Other Important Farmlands
Table 7 lists the map units in the survey area that are considered prime farmland,unique farmland, and farmland of statewide importance. This list does not constitute arecommendation for a particular land use.
In an effort to identify the extent and location of important farmlands, the NaturalResources Conservation Service, in cooperation with other interested Federal, State,and local government organizations, has inventoried land that can be used for theproduction of the Nation’s food supply.
Prime farmland is one of several kinds of important farmland defined by the U.S.Department of Agriculture. It is of major importance in meeting the Nation’s short- andlong-range needs for food and fiber. Because the supply of high-quality farmland islimited, the U.S. Department of Agriculture recognizes that responsible levels ofgovernment, as well as individuals, should encourage and facilitate the wise use ofour Nation’s prime farmland.
Prime farmland, as defined by the U.S. Department of Agriculture, is land that hasthe best combination of physical and chemical characteristics for producing food,feed, forage, fiber, and oilseed crops and is available for these uses. It could becultivated land, pastureland, forestland, or other land, but it is not urban or built-upland or water areas. The soil qualities, growing season, and moisture supply arethose needed for the soil to economically produce sustained high yields of cropswhen proper management, including water management, and acceptable farmingmethods are applied. In general, prime farmland has an adequate and dependablesupply of moisture from precipitation or irrigation, a favorable temperature andgrowing season, acceptable acidity or alkalinity, an acceptable salt and sodiumcontent, and few or no rocks. It is permeable to water and air. It is not excessivelyerodible or saturated with water for long periods, and it either is not frequently floodedduring the growing season or is protected from flooding. Slope ranges mainly from
Soil Survey of Salem County, New Jersey
74
0 to 6 percent. More detailed information about the criteria for prime farmland isavailable at the local office of the Natural Resources Conservation Service.
About 88,272 acres, or nearly 40 percent of Salem County, would meet therequirements for prime farmland if an adequate and dependable supply of irrigationwater were available.
Unique farmland is land other than prime farmland that is used for the productionof specific high-value food and fiber crops, such as citrus, tree nuts, olives,cranberries, and other fruits and vegetables. It has the special combination of soilquality, growing season, moisture supply, temperature, humidity, air drainage,elevation, and aspect needed for the soil to economically produce sustainable highyields of these crops when properly managed. The water supply is dependable and ofadequate quality. Nearness to markets is an additional consideration. Uniquefarmland is not based on national criteria. It commonly is in areas where there is aspecial microclimate, such as the wine country in California.
In some areas, land that does not meet the criteria for prime farmland isconsidered to be farmland of statewide importance for the production of food, feed,fiber, forage, and oilseed crops. The criteria for defining and delineating farmland ofstatewide importance are determined by the appropriate State agencies. Generally,this land includes areas of soils that nearly meet the requirements for prime farmlandand that economically produce high yields of crops when treated and managedaccording to acceptable farming methods. Some areas may produce as high a yieldas prime farmland if conditions are favorable. Farmland of statewide importance mayinclude tracts of land that have been designated for agriculture by State law.
A recent trend in land use in some parts of the survey area has been the loss ofsome prime farmland to industrial and urban uses. The loss of prime farmland toother uses puts pressure on marginal lands, which generally are more erodible,droughty, and less productive and cannot be easily cultivated.
The map units in the survey area that are considered prime farmland are listed intable 7. This list does not constitute a recommendation for a particular land use. Onsome soils included in the list, measures that overcome a hazard or limitation, suchas flooding, wetness, and droughtiness, are needed. Onsite evaluation is needed todetermine whether or not the hazard or limitation has been overcome by correctivemeasures. The extent of each listed map unit is shown in table 4. The location isshown on the detailed soil maps. The soil qualities that affect use and managementare described under the heading “Detailed Soil Map Units.”
Agricultural Waste Management
Soil properties are important considerations in areas where soils are used as sitesfor the treatment and disposal of organic waste and wastewater. Selection of soilswith properties that favor waste management can help to prevent environmentaldamage.
Tables 8a and 8b show the degree and kind of soil limitations affecting thetreatment of agricultural waste, including municipal and food-processing wastewaterand effluent from lagoons or storage ponds. Municipal wastewater is the wastestream from a municipality. It contains domestic waste and may contain industrialwaste. It may have received primary or secondary treatment. It is rarely untreatedsewage. Food-processing wastewater results from the preparation of fruits,vegetables, milk, cheese, and meats for public consumption. In places it is high incontent of sodium and chloride. In the context of these tables, the effluent in lagoonsand storage ponds is from facilities used to treat or store food-processing wastewateror domestic or animal waste. Domestic and food-processing wastewater is very dilute,and the effluent from the facilities that treat or store it commonly is very low in contentof carbonaceous and nitrogenous material; the content of nitrogen commonly ranges
Soil Survey of Salem County, New Jersey
75
from 10 to 30 milligrams per liter. The wastewater from animal waste treatmentlagoons or storage ponds, however, has much higher concentrations of thesematerials, mainly because the manure has not been diluted as much as the domesticwaste. The content of nitrogen in this wastewater generally ranges from 50 to2,000 milligrams per liter. When wastewater is applied, checks should be made toensure that nitrogen, heavy metals, and salts are not added in excessive amounts.
The ratings in the tables are for waste management systems that not only disposeof and treat organic waste or wastewater but also are beneficial to crops (applicationof manure and food-processing waste and application of sewage sludge) and forwaste management systems that are designed only for the purpose of wastewaterdisposal and treatment (rapid infiltration of wastewater and slow rate treatment ofwastewater).
The ratings are both verbal and numerical. Rating class terms indicate the extentto which the soils are limited by all of the soil features that affect agricultural wastemanagement. Not limited indicates that the soil has features that are very favorablefor the specified use. Good performance and very low maintenance can be expected.Somewhat limited indicates that the soil has features that are moderately favorable forthe specified use. The limitations can be overcome or minimized by special planning,design, or installation. Fair performance and moderate maintenance can be expected.Very limited indicates that the soil has one or more features that are unfavorable forthe specified use. The limitations generally cannot be overcome without major soilreclamation, special design, or expensive installation procedures. Poor performanceand high maintenance can be expected.
Numerical ratings in the tables indicate the severity of individual limitations. Theratings are shown as decimal fractions ranging from 0.01 to 1.00. They indicategradations between the point at which a soil feature has the greatest negative impacton the use (1.00) and the point at which the soil feature is not a limitation (0.00).
Application of manure and food-processing waste not only disposes of wastematerial but also can improve crop production by increasing the supply of nutrients inthe soils where the material is applied. Manure is the excrement of livestock andpoultry, and food-processing waste is damaged fruit and vegetables and the peelings,stems, leaves, pits, and soil particles removed in food preparation. The manure andfood-processing waste are either solid, slurry, or liquid. Their nitrogen content varies.A high content of nitrogen limits the application rate. Toxic or otherwise dangerouswastes, such as those mixed with the lye used in food processing, are not consideredin the ratings.
The ratings are based on the soil properties that affect absorption, plant growth,microbial activity, erodibility, the rate at which the waste is applied, and the method bywhich the waste is applied. The properties that affect absorption include permeability,depth to a water table, ponding, the sodium adsorption ratio, depth to a fragipan, andavailable water capacity. The properties that affect plant growth and microbial activityinclude reaction, the sodium adsorption ratio, salinity, and bulk density. The winderodibility group, the soil erodibility factor K, and slope are considered in estimatingthe likelihood that wind erosion or water erosion will transport the waste material fromthe application site. A water table, ponding, and flooding can hinder the application ofwaste. Permanently frozen soils are unsuitable for waste treatment.
Application of sewage sludge not only disposes of waste material but also canimprove crop production by increasing the supply of nutrients in the soils where thematerial is applied. In the context of this table, sewage sludge is the residual productof the treatment of municipal sewage. The solid component consists mainly of cellmass, primarily bacteria cells that developed during secondary treatment and haveincorporated soluble organics into their own bodies. The sludge has small amounts ofsand, silt, and other solid debris. The content of nitrogen varies. Some sludge hasconstituents that are toxic to plants or hazardous to the food chain, such as heavy
Soil Survey of Salem County, New Jersey
76
metals and exotic organic compounds, and should be analyzed chemically prior touse.
The content of water in the sludge ranges from about 98 percent to less than40 percent. The sludge is considered liquid if it is more than about 90 percent water,slurry if it is about 50 to 90 percent water, and solid if it is less than about 50 percentwater.
The ratings in the table are based on the soil properties that affect absorption,plant growth, microbial activity, erodibility, the rate at which the sludge is applied, andthe method by which the sludge is applied. The properties that affect absorption, plantgrowth, and microbial activity include permeability, depth to a water table, ponding,the sodium adsorption ratio, depth to a fragipan, available water capacity, reaction,salinity, and bulk density. The wind erodibility group, the soil erodibility factor K, andslope are considered in estimating the likelihood that wind erosion or water erosionwill transport the waste material from the application site. Stones, cobbles, a watertable, ponding, and flooding can hinder the application of sludge.
Rapid infiltration of wastewater is a process in which wastewater applied in a levelbasin at a rate of 4 to 120 inches per week percolates through the soil. Thewastewater may eventually reach the ground water. The application rate commonlyexceeds the rate needed for irrigation of cropland. Vegetation is not a necessary partof the treatment; hence, the basins may or may not be vegetated. The thickness of thesoil material needed for proper treatment of the wastewater is more than 72 inches.As a result, geologic and hydrologic investigation is needed to ensure proper designand performance and to determine the risk of ground-water pollution.
The ratings in the table are based on the soil properties that affect the risk ofpollution and the design, construction, and performance of the system. Depth to awater table, ponding, flooding, and depth to a fragipan affect the risk of pollution andthe design and construction of the system. Slope also affects design andconstruction. Permeability and reaction affect performance.
Slow rate treatment of wastewater is a process in which wastewater is applied toland at a rate normally between 0.5 inch and 4.0 inches per week. The applicationrate commonly exceeds the rate needed for irrigation of cropland. The appliedwastewater is treated as it moves through the soil. Much of the treated water maypercolate to the ground water, and some enters the atmosphere throughevapotranspiration. The applied water generally is not allowed to run off the surface.Waterlogging is prevented either through control of the application rate or through theuse of tile drains, or both.
The ratings in the table are based on the soil properties that affect absorption,plant growth, microbial activity, erodibility, and the application of waste. The propertiesthat affect absorption include the sodium adsorption ratio, depth to a water table,ponding, available water capacity, permeability, depth to a fragipan, reaction, thecation-exchange capacity, and slope. Reaction, the sodium adsorption ratio, salinity,and bulk density affect plant growth and microbial activity. The wind erodibility group,the soil erodibility factor K, and slope are considered in estimating the likelihood ofwind erosion or water erosion. A water table, ponding, and flooding can hinder theapplication of waste.
Forestland Productivity and Management
Albert Coffey, forester, Natural Resources Conservation Service, helped to prepare this section.
Owners of woodland in Salem County have many objectives. These objectivesinclude producing timber; conserving wildlife, soil, and water; preserving estheticvalues; and providing opportunities for recreational activities. Public demand for cleanwater and recreational areas creates pressures and opportunities for owners ofwoodland.
Soil Survey of Salem County, New Jersey
77
Soils influence the distribution and growth of tree species in Salem County. Forexample, Atlantic white cedar grows well in areas of very poorly drained organic soils.Sweetgum, yellow-poplar, and red maple are adapted to grow in areas of poorlydrained or very poorly drained mineral soils, such as those in the Fallsington, Mullica,and Othello series. White oak, scarlet oak, and black oak grow in areas of welldrained soils that have moderate moisture content, such as those in the Chillum,Sassafras, and Downer series. Post oak, pitch pine, and chestnut oak grow in areasof soils with low moisture content, such as those in the sandy Evesboro andGalestown series. Pitch pine is also adapted to poorly drained and very poorlydrained sandy soils, such as those in the Askecksy and Berryland series, which canalso become droughty in the summer as the seasonal high water table is lowered.Soil serves as a reservoir for moisture, provides an anchor for roots, and suppliesmost of the available nutrients. These three qualities are directly or indirectly affectedby organic matter content, reaction, fertility, drainage, texture, structure, depth, andlandscape position.
The ability of a soil to serve as a reservoir for moisture, as measured by theavailable water capacity, is primarily influenced by texture, organic matter content,rooting depth, and content of rock fragments. Because of the fairly evenly distributed,abundant summer rainfall in Salem County, the available water capacity is a limitationaffecting tree growth mainly on sandy, excessively drained or somewhat excessivelydrained soils, such as those in the Evesboro and Galestown series.
The available supply of nutrients for tree growth is affected by several soilproperties. Mineral horizons in the soil are important. Mineralization of humusreleases nitrogen and other nutrients to plants. Calcium, magnesium, and potassiumare held within the humus. Very small amounts of these nutrients are made availableby the weathering of clay and silt particles. Most of the upland soils have beenleached and contain only small amounts of nutrients below the surface layer. Soilsthat have a thin surface layer must be carefully managed during site preparation sothat the surface layer is not removed or degraded.
The living plant community is part of the nutrient reservoir. The decomposition ofleaves, stems, and other organic material recycles the nutrients that haveaccumulated in the forest ecosystem. Fire, excessive trampling by livestock, anderosion can result in the loss of these nutrients. Woodland management shouldinclude prevention of wildfires and protection from overgrazing.
In table 9, the potential productivity of merchantable or common trees on a soil isexpressed as a site index and as a volume number. The site index is the averageheight, in feet, that dominant and codominant trees of a given species attain in aspecified number of years. The site index applies to fully stocked, even-aged,unmanaged stands. Commonly grown trees are those that forest managers generallyfavor in intermediate or improvement cuttings. They are selected on the basis ofgrowth rate, quality, value, and marketability. More detailed information regarding siteindex is available in the “National Forestry Manual,” which is available in local officesof the Natural Resources Conservation Service or on the Internet.
The volume of wood fiber, a number, is the yield likely to be produced by the mostimportant tree species. This number, expressed as cubic feet per acre per year andcalculated at the age of culmination of the mean annual increment (CMAI), indicatesthe amount of fiber produced in a fully stocked, even-aged, unmanaged stand.
Trees to manage are those that are preferred for planting, seeding, or naturalregeneration and those that remain in the stand after thinning or partial harvest.
Recreation
The soils of the survey area are rated in tables 10a and 10b according tolimitations that affect their suitability for recreation. The ratings are both verbal and
Soil Survey of Salem County, New Jersey
78
numerical. Rating class terms indicate the extent to which the soils are limited by allof the soil features that affect the recreational uses. Not limited indicates that the soilhas features that are very favorable for the specified use. Good performance and verylow maintenance can be expected. Somewhat limited indicates that the soil hasfeatures that are moderately favorable for the specified use. The limitations can beovercome or minimized by special planning, design, or installation. Fair performanceand moderate maintenance can be expected. Very limited indicates that the soil hasone or more features that are unfavorable for the specified use. The limitationsgenerally cannot be overcome without major soil reclamation, special design, orexpensive installation procedures. Poor performance and high maintenance can beexpected.
Numerical ratings in the tables indicate the severity of individual limitations. Theratings are shown as decimal fractions ranging from 0.01 to 1.00. They indicategradations between the point at which a soil feature has the greatest negative impacton the use (1.00) and the point at which the soil feature is not a limitation (0.00).
The ratings in the tables are based on restrictive soil features, such as wetness,slope, and texture of the surface layer. Susceptibility to flooding is considered. Notconsidered in the ratings, but important in evaluating a site, are the location andaccessibility of the area, the size and shape of the area and its scenic quality,vegetation, access to water, potential water impoundment sites, and access to publicsewer lines. The capacity of the soil to absorb septic tank effluent and the ability ofthe soil to support vegetation also are important. Soils that are subject to flooding arelimited for recreational uses by the duration and intensity of flooding and the seasonwhen flooding occurs. In planning recreational facilities, onsite assessment of theheight, duration, intensity, and frequency of flooding is essential.
The information in tables 10a and 10b can be supplemented by other informationin this survey, for example, interpretations for building site development, constructionmaterials, sanitary facilities, disposal fields, and water management.
Camp areas require site preparation, such as shaping and leveling the tent andparking areas, stabilizing roads and intensively used areas, and installing sanitaryfacilities and utility lines. Camp areas are subject to heavy foot traffic and somevehicular traffic. The ratings are based on the soil properties that affect the ease ofdeveloping camp areas and the performance of the areas after development. Slopeand depth to a fragipan are the main concerns affecting the development of campareas. The soil properties that affect the performance of the areas after developmentare those that influence trafficability and promote the growth of vegetation, especiallyin heavily used areas. For good trafficability, the surface of camp areas should absorbrainfall readily, remain firm under heavy foot traffic, and not be dusty when dry. Thesoil properties that influence trafficability are texture of the surface layer, depth to awater table, ponding, flooding, and permeability. The soil properties that affect thegrowth of plants are depth to a fragipan, permeability, and toxic substances in thesoil.
Picnic areas are subject to heavy foot traffic. Most vehicular traffic is confined toaccess roads and parking areas. The ratings are based on the soil properties thataffect the ease of developing picnic areas and that influence trafficability and thegrowth of vegetation after development. Slope is the main concern affecting thedevelopment of picnic areas. For good trafficability, the surface of picnic areas shouldabsorb rainfall readily, remain firm under heavy foot traffic, and not be dusty when dry.The soil properties that influence trafficability are texture of the surface layer, depth toa water table, ponding, flooding, and permeability. The soil properties that affect thegrowth of plants are depth to a fragipan, permeability, and toxic substances in thesoil.
Playgrounds require soils that are nearly level, are free of stones, and canwithstand intensive foot traffic. The ratings are based on the soil properties that affect
Soil Survey of Salem County, New Jersey
79
the ease of developing playgrounds and that influence trafficability and the growth ofvegetation after development. Slope is the main concern affecting the development ofplaygrounds. For good trafficability, the surface of the playgrounds should absorbrainfall readily, remain firm under heavy foot traffic, and not be dusty when dry. Thesoil properties that influence trafficability are texture of the surface layer, depth to awater table, ponding, flooding, and permeability. The soil properties that affect thegrowth of plants are depth to a fragipan, permeability, and toxic substances in thesoil.
Paths and trails for hiking and horseback riding should require little or no slopemodification through cutting and filling. The ratings are based on the soil propertiesthat affect trafficability and erodibility. These properties are depth to a water table,ponding, flooding, slope, and texture of the surface layer.
Off-road motorcycle trails require little or no site preparation. They are not coveredwith surfacing material or vegetation. Considerable compaction of the soil material islikely. The ratings are based on the soil properties that influence erodibility,trafficability, dustiness, and the ease of revegetation. These properties are slope,depth to a water table, ponding, flooding, and texture of the surface layer.
Golf fairways are subject to heavy foot traffic and some light vehicular traffic.Cutting or filling may be required. Irrigation is not considered in the ratings. Theratings are based on the soil properties that affect plant growth and trafficability aftervegetation is established. The properties that affect plant growth are reaction, depthto a water table, ponding, depth to a fragipan, the available water capacity in theupper 40 inches, the content of salts, and sulfidic materials. The properties that affecttrafficability are flooding, depth to a water table, ponding, slope, stoniness, and theamount of sand, clay, or organic matter in the surface layer. The suitability of the soilfor traps, tees, roughs, and greens is not considered in the ratings.
Wildlife Habitat
The soils of Salem County are capable of supporting diverse vegetativecommunities and wildlife habitat. The interspersing of cropland, idle fields, andborders of hardwood and pine forest provide diverse plant communities, or “edges,”utilized by many wildlife species. Other wildlife, including small, isolated reptile andamphibian populations, require more specialized wetland habitats. Hydric soils, suchas those in the Mullica, Manahawkin, Chicone, and Berryland series, can support theunique vegetation and habitat needed for these wildlife species.
The wildlife populations in Salem County can be maintained or increased throughcareful land-use planning, improvement of existing habitat, habitat preservation, andcontinued public education. Most of the wildlife habitat in the county is privatelyowned; therefore, much of the initiative to maintain or improve the wildlife populationsin the county ultimately depends on the cooperation and awareness of individuallandowners. Public sponsored programs can provide incentives to private individualsfor wildlife conservation, ensuring that adequate wildlife populations exist for theenjoyment of future generations.
Soils affect the kind and amount of vegetation that is available to wildlife as foodand cover. They also affect the construction of water impoundments. The kind andabundance of wildlife depend largely on the amount and distribution of food, cover,and water. Wildlife habitat can be created or improved by planting appropriatevegetation, by maintaining the existing plant cover, or by promoting the naturalestablishment of desirable plants.
In table 11, the soils in the survey area are rated according to their potential forproviding habitat for various kinds of wildlife. This information can be used in planningparks, wildlife refuges, nature study areas, and other developments for wildlife; inselecting soils that are suitable for establishing, improving, or maintaining specific
Soil Survey of Salem County, New Jersey
80
elements of wildlife habitat; and in determining the intensity of management neededfor each element of the habitat.
The potential of the soil is rated good, fair, poor, or very poor. A rating of goodindicates that the element or kind of habitat is easily established, improved, ormaintained. Few or no limitations affect management, and satisfactory results can beexpected. A rating of fair indicates that the element or kind of habitat can beestablished, improved, or maintained in most places. Moderately intensivemanagement is required for satisfactory results. A rating of poor indicates thatlimitations are severe for the designated element or kind of habitat. Habitat can becreated, improved, or maintained in most places, but management is difficult andmust be intensive. A rating of very poor indicates that restrictions for the element orkind of habitat are very severe and that unsatisfactory results can be expected.Creating, improving, or maintaining habitat is impractical or impossible.
The elements of wildlife habitat are described in the following paragraphs.Grain and seed crops are domestic grains and seed-producing herbaceous plants.
Soil properties and features that affect the growth of grain and seed crops are depthof the root zone, texture of the surface layer, available water capacity, wetness, slope,and flooding. Soil temperature and soil moisture also are considerations. Examples ofgrain and seed crops are corn, wheat, oats, and barley.
Grasses and legumes are domestic perennial grasses and herbaceous legumes.Soil properties and features that affect the growth of grasses and legumes are depthof the root zone, texture of the surface layer, available water capacity, wetness,surface stoniness, flooding, and slope. Soil temperature and soil moisture also areconsiderations. Examples of grasses and legumes are fescue, bromegrass, clover,and alfalfa.
Wild herbaceous plants are native or naturally established grasses and forbs,including weeds. Soil properties and features that affect the growth of these plantsare depth of the root zone, texture of the surface layer, available water capacity,wetness, and flooding. Soil temperature and soil moisture also are considerations.Examples of wild herbaceous plants are bluestem, goldenrod, beggarweed, andswitchgrass.
Hardwood trees and woody understory produce nuts or other fruit, buds, catkins,twigs, bark, and foliage. Soil properties and features that affect the growth ofhardwood trees and shrubs are depth of the root zone, available water capacity, andwetness. Examples of these plants are oak, poplar, cherry, sweetgum, red maple,apple, dogwood, and hickory. Examples of fruit-producing shrubs that are suitable forplanting on soils rated good are blackberry and blueberry.
Coniferous plants furnish browse and seeds. Soil properties and features thataffect the growth of coniferous trees, shrubs, and ground cover are depth of the rootzone, available water capacity, and wetness. Examples of coniferous plants are pitchpine, Atlantic white cedar, red cedar, and juniper.
Shrubs are bushy woody plants that produce fruit, buds, twigs, bark, and foliage.Soil properties and features that affect the growth of shrubs are depth of the rootzone, available water capacity, salinity, and soil moisture. Examples of shrubs areblackberry, blueberry, laurel, and shadbush.
Wetland plants are annual and perennial wild herbaceous plants that grow onmoist or wet sites. Submerged or floating aquatic plants are excluded. Soil propertiesand features affecting wetland plants are texture of the surface layer, wetness,reaction, salinity, and slope. Examples of wetland plants are smartweed, wildrice,saltgrass, cordgrass, rushes, sedges, and reeds.
Shallow water areas have an average depth of less than 2 feet. Some are naturallywet areas. Others are created by dams, levees, or other water-control structures. Soilproperties and features affecting shallow water areas are wetness, slope, and

Soil Survey of Salem County, New Jersey
81
permeability. Examples of shallow water areas are marshes and waterfowl feedingareas.
The habitat for various kinds of wildlife is described in the following paragraphs.Habitat for openland wildlife consists of cropland, pasture, meadows, and areas
that are overgrown with grasses, herbs, shrubs, and vines. These areas producegrain and seed crops, grasses and legumes, and wild herbaceous plants. Wildlifeattracted to these areas include bobwhite quail, pheasant, meadowlark, field sparrow,cottontail, and red fox.
Habitat for woodland wildlife consists of areas of deciduous and/or coniferousplants and associated grasses, legumes, and wild herbaceous plants. Wildlifeattracted to these areas include wild turkey, ruffed grouse, woodcock, thrushes,woodpeckers, squirrels, gray fox, raccoon, and deer.
Habitat for wetland wildlife consists of open, marshy or swampy shallow waterareas. Some of the wildlife attracted to such areas are ducks, geese, herons, shorebirds, muskrat, osprey, and beaver.
Hydric Soils
In this section, hydric soils are defined and described. The hydric soils in thesurvey area are listed in table 12. This list can help in planning land uses; however,onsite investigation is recommended to determine the hydric soils on a specific site(National Research Council 1995; Hurt, Whited, and Pringle 2002).
The three essential characteristics of wetlands are hydrophytic vegetation, hydricsoils, and wetland hydrology (Cowardin and others 1979; U.S. Army Corps ofEngineers 1987; National Research Council 1995; Tiner 1985). Criteria for each of thecharacteristics must be met for areas to be identified as wetlands. Undrained hydricsoils that have natural vegetation should support a dominant population of ecologicalwetland plant species (fig. 7). Hydric soils that have been converted to other usesshould be capable of being restored to wetlands.
Figure 7.—Hydrophytic vegetation is dominant in this area of Transquaking mucky peat, 0 to1 percent slopes, very frequently flooded. This particular type of vegetation is speciallyadapted to prolonged or permanent wet soil conditions that occur in the Transquaking soils.This area is an estuarine tidal marsh during high tide.
Soil Survey of Salem County, New Jersey
82
Hydric soils are defined by the National Technical Committee for Hydric Soils(NTCHS) as soils that formed under conditions of saturation, flooding, or pondinglong enough during the growing season to develop anaerobic conditions in the upperpart (Federal Register 1994). These soils, under natural conditions, are eithersaturated or inundated long enough during the growing season to support the growthand reproduction of hydrophytic vegetation.
The NTCHS definition identifies general soil properties that are associated withwetness. In order to determine whether a specific soil is a hydric soil or nonhydricsoil, however, more specific information, such as information about the depth andduration of the water table, is needed. Thus, criteria that identify those estimated soilproperties unique to hydric soils have been established (Federal Register 2002).These criteria are used to identify map unit components that normally are associatedwith wetlands. The criteria used are selected estimated soil properties that aredescribed in “Soil Taxonomy” (Soil Survey Staff 1999) and “Keys to Soil Taxonomy”(Soil Survey Staff 2003) and in the “Soil Survey Manual” (Soil Survey Division Staff 1993).
If soils are wet enough for a long enough period to be considered hydric, theyshould exhibit certain properties that can be easily observed in the field. These visibleproperties are indicators of hydric soils. The indicators used to make onsitedeterminations of hydric soils in this survey area are specified in “Field Indicators ofHydric Soils in the United States” (Hurt, Whited, and Pringle 2002).
Hydric soils are identified by examining and describing the soil to a depth of about20 inches. This depth may be greater if determination of an appropriate indicator sorequires. It is always recommended that soils be excavated and described to thedepth necessary for an understanding of the redoximorphic processes. Then, usingthe completed soil descriptions, soil scientists can compare the soil features requiredby each indicator and specify which indicators have been matched with the conditionsobserved in the soil. The soil can be identified as a hydric soil if at least one of theapproved indicators is present.
Map units that are dominantly made up of hydric soils may have small areas, orinclusions, of nonhydric soils in the higher positions on the landform, and map unitsdominantly made up of nonhydric soils may have inclusions of hydric soils in thelower positions on the landform.
The criteria for hydric soils are represented by codes in the table (for example,2B3). Definitions for the codes are as follows:
1. All Histels except for Folistels, and Histosols except for Folists.2. Soils in Aquic suborders, great groups, or subgroups, Albolls suborder,
Historthels great group, Histoturbels great group, Pachic subgroups, or Cumulicsubgroups that:A. are somewhat poorly drained and have a water table at the surface (0.0 feet)
during the growing season, orB. are poorly drained or very poorly drained and have either:
1) a water table at the surface (0.0 feet) during the growing season iftextures are coarse sand, sand, or fine sand in all layers within a depthof 20 inches, or
2) a water table at a depth of 0.5 foot or less during the growing season ifpermeability is equal to or greater than 6.0 in/hr in all layers within adepth of 20 inches, or
3) a water table at a depth of 1.0 foot or less during the growing season ifpermeability is less than 6.0 in/hr in any layer within a depth of 20 inches.
3. Soils that are frequently ponded for long or very long duration during the growingseason.
4. Soils that are frequently flooded for long or very long duration during the growingseason.
Soil Survey of Salem County, New Jersey
83
Engineering
This section provides information for planning land uses related to urbandevelopment and to water management. Soils are rated for various uses, and themost limiting features are identified. Ratings are given for building site development,sanitary facilities, construction materials, and water management. The ratings arebased on observed performance of the soils and on the data in the tables describedunder the heading “Soil Properties.”
Information in this section is intended for land use planning, for evaluating land usealternatives, and for planning site investigations prior to design and construction. Theinformation, however, has limitations. For example, estimates and other datagenerally apply only to that part of the soil between the surface and a depth of 5 to7 feet. Because of the map scale, small areas of different soils may be included withinthe mapped areas of a specific soil.
The information is not site specific and does not eliminate the need for onsiteinvestigation of the soils or for testing and analysis by personnel experienced in thedesign and construction of engineering works.
Government ordinances and regulations that restrict certain land uses or imposespecific design criteria were not considered in preparing the information in thissection. Local ordinances and regulations should be considered in planning, in siteselection, and in design.
Soil properties, site features, and observed performance were considered indetermining the ratings in this section. During the fieldwork for this soil survey,determinations were made about particle-size distribution, liquid limit, plasticity index,soil reaction, soil wetness, depth to a water table, ponding, slope, likelihood offlooding, natural soil structure aggregation, and soil density. Data were collectedabout kinds of clay minerals, mineralogy of the sand and silt fractions, and the kindsof adsorbed cations. Estimates were made for erodibility, permeability, corrosivity,shrink-swell potential, available water capacity, and other behavioral characteristicsaffecting engineering uses.
This information can be used to evaluate the potential of areas for residential,commercial, industrial, and recreational uses; make preliminary estimates ofconstruction conditions; evaluate alternative routes for roads, streets, highways,pipelines, and underground cables; evaluate alternative sites for sanitary landfills,septic tank absorption fields, and sewage lagoons; plan detailed onsite investigationsof soils and geology; locate potential sources of gravel, sand, earthfill, and topsoil;plan drainage systems, irrigation systems, ponds, terraces, and other structures forsoil and water conservation; and predict performance of proposed small structuresand pavements by comparing the performance of existing similar structures on thesame or similar soils.
The information in the tables, along with the soil maps, the soil descriptions, andother data provided in this survey, can be used to make additional interpretations.
Some of the terms used in this soil survey have a special meaning in soil scienceand are defined in the Glossary.
Building Site Development
Soil properties influence the development of building sites, including the selectionof the site, the design of the structure, construction, performance after construction,and maintenance. Tables 13a and 13b show the degree and kind of soil limitationsthat affect dwellings with and without basements, small commercial buildings, localroads and streets, shallow excavations, and lawns and landscaping.
The ratings in the tables are both verbal and numerical. Rating class terms indicatethe extent to which the soils are limited by all of the soil features that affect buildingsite development. Not limited indicates that the soil has features that are very
Soil Survey of Salem County, New Jersey
84
favorable for the specified use. Good performance and very low maintenance can beexpected. Somewhat limited indicates that the soil has features that are moderatelyfavorable for the specified use. The limitations can be overcome or minimized byspecial planning, design, or installation. Fair performance and moderate maintenancecan be expected. Very limited indicates that the soil has one or more features that areunfavorable for the specified use. The limitations generally cannot be overcomewithout major soil reclamation, special design, or expensive installation procedures.Poor performance and high maintenance can be expected.
Numerical ratings in the tables indicate the severity of individual limitations. Theratings are shown as decimal fractions ranging from 0.01 to 1.00. They indicategradations between the point at which a soil feature has the greatest negative impacton the use (1.00) and the point at which the soil feature is not a limitation (0.00).
Dwellings are single-family houses of three stories or less. For dwellings withoutbasements, the foundation is assumed to consist of spread footings of reinforcedconcrete built on undisturbed soil at a depth of 2 feet or at the depth of maximum frostpenetration, whichever is deeper. For dwellings with basements, the foundation isassumed to consist of spread footings of reinforced concrete built on undisturbed soilat a depth of about 7 feet. The ratings for dwellings are based on the soil propertiesthat affect the capacity of the soil to support a load without movement and on theproperties that affect excavation and construction costs. The properties that affect theload-supporting capacity include depth to a water table, ponding, flooding,subsidence, linear extensibility (shrink-swell potential), and compressibility.Compressibility is inferred from the Unified classification. The properties that affectthe ease and amount of excavation include depth to a water table, ponding, flooding,slope, depth to a fragipan, and the amount and size of rock fragments.
Small commercial buildings are structures that are less than three stories high anddo not have basements. The foundation is assumed to consist of spread footings ofreinforced concrete built on undisturbed soil at a depth of 2 feet or at the depth ofmaximum frost penetration, whichever is deeper. The ratings are based on the soilproperties that affect the capacity of the soil to support a load without movement andon the properties that affect excavation and construction costs. The properties thataffect the load-supporting capacity include depth to a water table, ponding, flooding,subsidence, linear extensibility (shrink-swell potential), and compressibility (which isinferred from the Unified classification). The properties that affect the ease andamount of excavation include flooding, depth to a water table, ponding, slope, depthto a fragipan, and the amount and size of rock fragments.
Local roads and streets have an all-weather surface and carry automobile and lighttruck traffic all year. They have a subgrade of cut or fill soil material; a base of gravel,crushed rock, or soil material stabilized by lime or cement; and a surface of flexiblematerial (asphalt), rigid material (concrete), or gravel with a binder. The ratings arebased on the soil properties that affect the ease of excavation and grading and thetraffic-supporting capacity. The properties that affect the ease of excavation andgrading are depth to a fragipan, depth to a water table, ponding, flooding, and slope.The properties that affect the traffic-supporting capacity are soil strength (as inferredfrom the AASHTO group index number), subsidence, linear extensibility (shrink-swellpotential), the potential for frost action, depth to a water table, and ponding.
Shallow excavations are trenches or holes dug to a maximum depth of 5 or 6 feetfor graves, utility lines, open ditches, or other purposes. The ratings are based on thesoil properties that influence the ease of digging and the resistance to sloughing.Depth to a fragipan and dense layers influence the ease of digging, filling, andcompacting. Depth to the seasonal high water table, flooding, and ponding mayrestrict the period when excavations can be made. Slope influences the ease of usingmachinery. Soil texture, depth to the water table, and linear extensibility (shrink-swellpotential) influence the resistance to sloughing.
Soil Survey of Salem County, New Jersey
85
Lawns and landscaping require soils on which turf and ornamental trees andshrubs can be established and maintained. Irrigation is not considered in the ratings.The ratings are based on the soil properties that affect plant growth and trafficabilityafter vegetation is established. The properties that affect plant growth are reaction,depth to a water table, ponding, depth to a fragipan, the available water capacity inthe upper 40 inches, the content of salts, and sulfidic materials. The properties thataffect trafficability are flooding, depth to a water table, ponding, slope, and the amountof sand, clay, or organic matter in the surface layer.
Sanitary Facilities
Tables 14 and 15 show the degree and kind of soil limitations that affect septic tankabsorption fields, sewage lagoons, and disposal field areas as they apply to NewJersey regulations. The ratings are both verbal and numerical. Rating class termsindicate the extent to which the soils are limited by all of the soil features that affectthese uses. Not limited indicates that the soil has features that are very favorable forthe specified use. Good performance and very low maintenance can be expected.Somewhat limited indicates that the soil has features that are moderately favorable forthe specified use. The limitations can be overcome or minimized by special planning,design, or installation. Fair performance and moderate maintenance can be expected.Very limited indicates that the soil has one or more features that are unfavorable forthe specified use. The limitations generally cannot be overcome without major soilreclamation, special design, or expensive installation procedures. Poor performanceand high maintenance can be expected.
Numerical ratings in the tables indicate the severity of individual limitations. Theratings are shown as decimal fractions ranging from 0.01 to 1.00. They indicategradations between the point at which a soil feature has the greatest negative impacton the use (1.00) and the point at which the soil feature is not a limitation (0.00).
Septic tank absorption fields are areas in which effluent from a septic tank isdistributed into the soil through subsurface tiles or perforated pipe. Only that part ofthe soil between depths of 24 and 60 inches is evaluated. The ratings are based onthe soil properties that affect absorption of the effluent, construction and maintenanceof the system, and public health. Permeability, depth to a water table, ponding, depthto a restrictive horizon, and flooding affect absorption of the effluent. Stones, ice, anda restrictive horizon interfere with installation. Subsidence interferes with installationand maintenance. Excessive slope may cause lateral seepage and surfacing of theeffluent in downslope areas. These ratings are based on soil parameters that are notspecific to any particular state but were developed to provide general suitabilitythroughout the United States.
Some soils are underlain by loose sand and gravel at a depth of less than 4 feetbelow the distribution lines. In these soils the absorption field may not adequatelyfilter the effluent, particularly when the system is new. As a result, the ground watermay become contaminated.
Sewage lagoons are shallow ponds constructed to hold sewage while aerobicbacteria decompose the solid and liquid wastes. Lagoons should have a nearly levelfloor surrounded by cut slopes or embankments of compacted soil. Nearly impervioussoil material for the lagoon floor and sides is required to minimize seepage andcontamination of ground water. Considered in the ratings are slope, permeability,depth to a water table, ponding, depth to a restrictive horizon, flooding, and content oforganic matter.
Soil permeability is a critical property affecting the suitability for sewage lagoons.Most porous soils eventually become sealed when they are used as sites for sewagelagoons. Until sealing occurs, however, the hazard of pollution is severe. Soils thathave a permeability rate of more than 2 inches per hour are too porous for the properfunctioning of sewage lagoons. In these soils, seepage of the effluent can result in
Soil Survey of Salem County, New Jersey
86
contamination of the ground water. Ground-water contamination is also a hazard ifthe water table is high enough to raise the level of sewage in the lagoon or iffloodwater overtops the lagoon.
A high content of organic matter is detrimental to proper functioning of the lagoonbecause it inhibits aerobic activity. Slope and restrictive horizons can causeconstruction problems, and large stones can hinder compaction of the lagoon floor. Ifthe lagoon is to be uniformly deep throughout, the slope must be gentle enough andthe soil material must be thick enough over the restrictive horizon to make landsmoothing practical.
Table 15 provides ratings for sewage disposal field areas based on New Jerseyregulations regarding on-lot sewage disposal systems. Disposal field refers to areaswhere sewage effluent is discharged into the ground for additional treatment anddisposal (New Jersey Department of Environmental Protection 1999). In this process,most of the suspended solids in the effluent are retained in the septic tank. The septictank effluent, now much lower in suspended solids, is further treated in the soil, bothby physical filtering and by biological treatment, mainly by bacteria. The treatedeffluent is disposed of through downward movement through the soil or throughlateral (horizontal) movement in soil layers above hydraulically restrictive layers. Thesoil is evaluated from the surface to a depth of 300 centimeters, or about 10 feet. Soildata maintained by U.S. Department of Agriculture, Natural Resources ConservationService, is for soil material to a depth of only 203 cm, or 80 inches, and soilproperties are evaluated to this depth. Ratings provided in table 15 are based on thesoil properties that affect the absorption of the effluent, construction, and pollution ofground water and surface water. Zone of saturation (an apparent or a perched watertable), permeability, a restrictive layer and the substratum, and the percentage ofcoarse fragments affect the absorption and treatment of the effluent.
Because of public health concerns, depth to the zone of saturation is a major factorin determining soil suitability for disposal field areas. A limited depth to the zone ofsaturation limits the ability of the soil to remove pathogens, nutrients, and other wastecomponents and increases the risk of ground-water contamination.
Massive bedrock and hydraulically restrictive or slowly permeable horizons orsubstrata can slow downward movement of sewage effluent. The effluent can buildup, or “mound,” causing prolonged saturated conditions. Lateral seepage of untreatedor minimally treated effluent may result, creating a greater risk of surface watercontamination.
Very rapid permeability associated with fractured bedrock or excessively coarsehorizons or substrata may not provide adequate filtering capability for effectivetreatment of effluent, resulting in ground-water contamination.
Following are brief descriptions of the primary disposal system types permitted inNew Jersey.
Conventional installation type (C).—The disposal bed or individual disposal trenchis installed in an excavated area of natural soil.
Soil replacement type.—The disposal bed or individual disposal trench is installedon top of or in suitable fill material that was added to an excavated area that is belowthe original soil surface. In a bottom-lined soil replacement installation, or SRB, the fillmaterial underlies the disposal field only. In a fill-enclosed soil replacementinstallation, or SRE, it underlies the disposal field and is added along the sides of thedisposal bed.
Mound installation type (M).—The disposal field is installed in suitable fill materialthat has been mounded above the original soil surface.
Interceptor drain (C drain).—Although not an actual type of disposal system,interceptor drains are installed in sloping areas to intercept laterally moving groundwater that is perched above a hydraulically restrictive horizon. The drains are installedin areas higher on the landscape and along the sides of disposal systems in order to
Soil Survey of Salem County, New Jersey
87
reduce the amount of perched water entering the disposal system and therebyincrease the functionality of the system.
Since these different types of disposal systems are used for various soil and siteconditions, refer to NJAC 7: 9A, “Standards for Individual Subsurface SewageDisposal Systems,” for more detailed and specific explanations, definitions, andrequirements for each of these systems and further explanation of the New Jerseysuitability classes described in the following paragraphs (New Jersey Department ofEnvironmental Protection 1999).
The Roman numerals I, II, and III in the codes are indicative of the severity of thelimitation (I is least limiting, and III is most limiting). In general, the severity of alimitation increases as the depth to the limiting condition decreases.
Water table refers to a saturated zone in the soil. The code Wr refers to a regionalwater table, and the code Wp refers to a perched water table.
The term “horizon” refers to a layer of soil or rock material in a soil boring or pitthat differs from the layers of soil above and below it in one or more soilmorphological characteristics, including color, texture, content of rock fragments,structure, consistence, and redoximorphic features. The code Hc refers to anexcessively coarse textured horizon, and the code Hr refers to a hydraulicallyrestrictive horizon.
The term “substratum” refers to the part of the soil below the solum where soilformation processes are generally not significant. It is the deepest layer of soil or rockmaterial observed in a soil boring or pit. The upper boundary of the layer is visible, butthe lower boundary is undetermined. The layer is expected, however, to extendthrough the required depth of evaluation (10 feet). The code Sc refers to anexcessively coarse textured layer, and the code Sr refers to a hydraulically restrictivelayer.
Construction Materials
Tables 16a and 16b give information about the soils as potential sources of gravel,sand, reclamation material, roadfill, and topsoil. Normal compaction, minorprocessing, and other standard construction practices are assumed.
Sand and gravel are natural aggregates suitable for commercial use with aminimum of processing. They are used in many kinds of construction. Specificationsfor each use vary widely. In table 16a, only the likelihood of finding material in suitablequantity is evaluated. The suitability of the material for specific purposes is notevaluated, nor are factors that affect excavation of the material. The properties usedto evaluate the soil as a source of sand or gravel are gradation of grain sizes (asindicated by the Unified classification of the soil), the thickness of suitable material,and the content of rock fragments. If the bottom layer of the soil contains sand orgravel, the soil is considered a likely source regardless of thickness. The assumptionis that the sand or gravel layer below the depth of observation exceeds the minimumthickness.
The soils are rated good, fair, or poor as potential sources of sand and gravel. Arating of good or fair means that the source material is likely to be in or below the soil.The bottom layer and the thickest layer of the soils are assigned numerical ratings.These ratings indicate the likelihood that the layer is a source of sand or gravel. Thenumber 0.00 indicates that the layer is a poor source. The number 1.00 indicates thatthe layer is a good source. A number between 0.00 and 1.00 indicates the degree towhich the layer is a likely source.
The soils are rated good, fair, or poor as potential sources of reclamation material,roadfill, and topsoil. The features that limit the soils as sources of these materials arespecified in the tables. The numerical ratings given after the specified featuresindicate the degree to which the features limit the soils as sources of reclamationmaterial, roadfill, or topsoil. The lower the number, the greater the limitation.
Soil Survey of Salem County, New Jersey
88
Reclamation material is used in areas that have been drastically disturbed bysurface mining or similar activities. When these areas are reclaimed, layers of soilmaterial or unconsolidated geological material, or both, are replaced in a verticalsequence. The reconstructed soil favors plant growth. The ratings in the table do notapply to quarries and other mined areas that require an offsite source ofreconstruction material. The ratings are based on the soil properties that affecterosion and stability of the surface and the productive potential of the reconstructedsoil. These properties include the content of sodium, salts, and calcium carbonate;reaction; available water capacity; erodibility; texture; content of rock fragments; andcontent of organic matter and other features that affect fertility.
Roadfill is soil material that is excavated in one place and used in roadembankments in another place. In this table, the soils are rated as a source of roadfillfor low embankments, generally less than 6 feet high and less exacting in design thanhigher embankments.
The ratings are for the whole soil, from the surface to a depth of about 5 feet. It isassumed that soil layers will be mixed when the soil material is excavated andspread.
The ratings are based on the amount of suitable material and on soil propertiesthat affect the ease of excavation and the performance of the material after it is inplace. The thickness of the suitable material is a major consideration. The ease ofexcavation is affected by large stones, depth to a water table, and slope. How well thesoil performs in place after it has been compacted and drained is determined by itsstrength (as inferred from the AASHTO classification of the soil) and linearextensibility (shrink-swell potential).
Topsoil is used to cover an area so that vegetation can be established andmaintained. The upper 40 inches of a soil is evaluated for use as topsoil. Alsoevaluated is the reclamation potential of the borrow area. The ratings are based onthe soil properties that affect plant growth; the ease of excavating, loading, andspreading the material; and reclamation of the borrow area. Toxic substances, soilreaction, and the properties that are inferred from soil texture, such as availablewater capacity and fertility, affect plant growth. The ease of excavating, loading, andspreading is affected by rock fragments, slope, depth to a water table, soil texture,and thickness of suitable material. Reclamation of the borrow area is affected byslope, depth to a water table, rock fragments, depth to a fragipan, and toxic material.
The surface layer of most soils is generally preferred for topsoil because of itsorganic matter content. Organic matter greatly increases the absorption and retentionof moisture and nutrients for plant growth.
Water Management
Table 17 gives information on the soil properties and site features that affect watermanagement. The degree and kind of soil limitations are given for pond reservoirareas; embankments, dikes, and levees; and aquifer-fed excavated ponds. The ratingsare both verbal and numerical. Rating class terms indicate the extent to which thesoils are limited by all of the soil features that affect these uses. Not limited indicatesthat the soil has features that are very favorable for the specified use. Goodperformance and very low maintenance can be expected. Somewhat limited indicatesthat the soil has features that are moderately favorable for the specified use. Thelimitations can be overcome or minimized by special planning, design, or installation.Fair performance and moderate maintenance can be expected. Very limited indicatesthat the soil has one or more features that are unfavorable for the specified use. Thelimitations generally cannot be overcome without major soil reclamation, specialdesign, or expensive installation procedures. Poor performance and highmaintenance can be expected.
Soil Survey of Salem County, New Jersey
89
Numerical ratings in the tables indicate the severity of individual limitations. Theratings are shown as decimal fractions ranging from 0.01 to 1.00. They indicategradations between the point at which a soil feature has the greatest negative impacton the use (1.00) and the point at which the soil feature is not a limitation (0.00).
Pond reservoir areas hold water behind a dam or embankment. Soils best suited tothis use have low seepage potential in the upper 60 inches. The seepage potential isdetermined by the permeability of the soil and the depth to fractured bedrock or otherpermeable material. Excessive slope can affect the storage capacity of the reservoirarea.
Embankments, dikes, and levees are raised structures of soil material, generallyless than 20 feet high, constructed to impound water or to protect land againstoverflow. Embankments that have zoned construction (core and shell) are notconsidered. In this table, the soils are rated as a source of material for embankmentfill. The ratings apply to the soil material below the surface layer to a depth of about5 feet. It is assumed that soil layers will be uniformly mixed and compacted duringconstruction.
The ratings do not indicate the ability of the natural soil to support an embankment.Soil properties to a depth even greater than the height of the embankment can affectperformance and safety of the embankment. Generally, deeper onsite investigation isneeded to determine these properties.
Soil material in embankments must be resistant to seepage, piping, and erosionand have favorable compaction characteristics. Unfavorable features include less than5 feet of suitable material and a high content of stones or boulders, organic matter, orsalts or sodium. A high water table affects the amount of usable material. It alsoaffects trafficability.
Aquifer-fed excavated ponds are pits or dugouts that extend to a ground-wateraquifer or to a depth below a permanent water table. Excluded are ponds that are fedonly by surface runoff and embankment ponds that impound water 3 feet or moreabove the original surface. Excavated ponds are affected by depth to a permanentwater table, permeability of the aquifer, and quality of the water as inferred from thesalinity of the soil. Depth to bedrock and the content of large stones affect the ease ofexcavation.

91
Soil Survey of Salem County, New Jersey
Data relating to soil properties are collected during the course of the soil survey.Soil properties are ascertained by field examination of the soils and by laboratory
index testing of some benchmark soils. Established standard procedures arefollowed. During the survey, many shallow borings are made and examined to identifyand classify the soils and to delineate them on the soil maps. Samples are taken fromsome typical profiles and tested in the laboratory to determine particle-sizedistribution, plasticity, and compaction characteristics.
Estimates of soil properties are based on field examinations, on laboratory tests ofsamples from the survey area, and on laboratory tests of samples of similar soils innearby areas. Tests verify field observations, verify properties that cannot beestimated accurately by field observation, and help to characterize key soils.
The estimates of soil properties are shown in tables. They include engineeringindex properties, physical and chemical properties, and pertinent soil and waterfeatures.
Engineering Index Properties
Table 18 gives the engineering classifications and the range of index properties forthe layers of each soil in the survey area.
Depth to the upper and lower boundaries of each layer is indicated.Texture is given in the standard terms used by the U.S. Department of Agriculture.
These terms are defined according to percentages of sand, silt, and clay in thefraction of the soil that is less than 2 millimeters in diameter. “Loam,” for example, issoil that is 7 to 27 percent clay, 28 to 50 percent silt, and less than 52 percent sand. Ifthe content of particles coarser than sand is 15 percent or more, an appropriatemodifier is added, for example, “gravelly.” Textural terms are defined in the Glossary.
Classification of the soils is determined according to the Unified soil classificationsystem (ASTM 2005) and the system adopted by the American Association of StateHighway and Transportation Officials (AASHTO 2004).
The Unified system classifies soils according to properties that affect their use asconstruction material. Soils are classified according to particle-size distribution of thefraction less than 3 inches in diameter and according to plasticity index, liquid limit,and organic matter content. Sandy and gravelly soils are identified as GW, GP, GM,GC, SW, SP, SM, and SC; silty and clayey soils as ML, CL, OL, MH, CH, and OH; andhighly organic soils as PT. Soils exhibiting engineering properties of two groups canhave a dual classification, for example, CL-ML.
The AASHTO system classifies soils according to those properties that affectroadway construction and maintenance. In this system, the fraction of a mineral soilthat is less than 3 inches in diameter is classified in one of seven groups from A-1through A-7 on the basis of particle-size distribution, liquid limit, and plasticity index.Soils in group A-1 are coarse grained and low in content of fines (silt and clay). At theother extreme, soils in group A-7 are fine grained. Highly organic soils are classifiedin group A-8 on the basis of visual inspection.
Soil Properties
Soil Survey of Salem County, New Jersey
92
If laboratory data are available, the A-1, A-2, and A-7 groups are further classifiedas A-1-a, A-1-b, A-2-4, A-2-5, A-2-6, A-2-7, A-7-5, or A-7-6. As an additionalrefinement, the suitability of a soil as subgrade material can be indicated by a groupindex number. Group index numbers range from 0 for the best subgrade material to20 or higher for the poorest.
Rock fragments larger than 10 inches in diameter and 3 to 10 inches in diameterare indicated as a percentage of the total soil on a dry-weight basis. The percentagesare estimates determined mainly by converting volume percentage in the field toweight percentage.
Percentage (of soil particles) passing designated sieves is the percentage of thesoil fraction less than 3 inches in diameter based on an ovendry weight. The sieves,numbers 4, 10, 40, and 200 (USA Standard Series), have openings of 4.76, 2.00,0.420, and 0.074 millimeters, respectively. Estimates are based on laboratory tests ofsoils sampled in the survey area and in nearby areas and on estimates made in thefield.
Liquid limit and plasticity index (Atterberg limits) indicate the plasticitycharacteristics of a soil. The estimates are based on test data from the survey area orfrom nearby areas and on field examination.
The estimates of particle-size distribution, liquid limit, and plasticity index aregenerally rounded to the nearest 5 percent. Thus, if the ranges of gradation andAtterberg limits extend a marginal amount (1 or 2 percentage points) acrossclassification boundaries, the classification in the marginal zone is generally omittedin the table.
Physical Properties
Table 19 shows estimates of some physical characteristics and features that affectsoil behavior. These estimates are given for the layers of each soil in the survey area.The estimates are based on field observations and on test data for these and similarsoils.
Depth to the upper and lower boundaries of each layer is indicated.Particle size is the effective diameter of a soil particle as measured by
sedimentation, sieving, or micrometric methods. Particle sizes are expressed asclasses with specific effective diameter class limits. The broad classes are sand, silt,and clay, ranging from the larger to the smaller.
Sand as a soil separate consists of mineral soil particles that are 0.05 millimeter to2 millimeters in diameter. In table 19, the estimated sand content of each soil layer isgiven as a percentage, by weight, of the soil material that is less than 2 millimeters indiameter.
Silt as a soil separate consists of mineral soil particles that are 0.002 to0.05 millimeter in diameter. In table 19, the estimated silt content of each soil layer isgiven as a percentage, by weight, of the soil material that is less than 2 millimeters indiameter.
Clay as a soil separate consists of mineral soil particles that are less than0.002 millimeter in diameter. In table 19, the estimated clay content of each soil layeris given as a percentage, by weight, of the soil material that is less than 2 millimetersin diameter.
The content of sand, silt, and clay affects the physical behavior of a soil. Particlesize is important for engineering and agronomic interpretations, for determination ofsoil hydrologic qualities, and for soil classification.
The amount and kind of clay affect the fertility and physical condition of the soiland the ability of the soil to adsorb cations and to retain moisture. They influenceshrink-swell potential, permeability, plasticity, the ease of soil dispersion, and other
Soil Survey of Salem County, New Jersey
93
soil properties. The amount and kind of clay in a soil also affect tillage andearthmoving operations.
Moist bulk density is the weight of soil (ovendry) per unit volume. Volume ismeasured when the soil is at field moisture capacity, that is, the moisture content at1/3- or 1/10-bar (33kPa or 10kPa) moisture tension. Weight is determined after the soilis dried at 105 degrees C. In the table, the estimated moist bulk density of each soilhorizon is expressed in grams per cubic centimeter of soil material that is less than2 millimeters in diameter. Bulk density data are used to compute shrink-swellpotential, available water capacity, total pore space, and other soil properties. Themoist bulk density of a soil indicates the pore space available for water and roots.Depending on soil texture, a bulk density of more than 1.4 can restrict water storageand root penetration. Moist bulk density is influenced by texture, kind of clay, contentof organic matter, and soil structure.
Permeability (Ksat ) refers to the ability of a soil to transmit water or air. The term“permeability,” as used in soil surveys, indicates saturated hydraulic conductivity(K
sat ). The estimates in the table indicate the rate of water movement, in inches per
hour, when the soil is saturated. They are based on soil characteristics observed inthe field, particularly structure, porosity, and texture. Permeability is considered in thedesign of soil drainage systems and septic tank absorption fields.
Available water capacity refers to the quantity of water that the soil is capable ofstoring for use by plants. The capacity for water storage is given in inches of water perinch of soil for each soil layer. The capacity varies, depending on soil properties thataffect retention of water. The most important properties are the content of organicmatter, soil texture, bulk density, and soil structure. Available water capacity is animportant factor in the choice of plants or crops to be grown and in the design andmanagement of irrigation systems. Available water capacity is not an estimate of thequantity of water actually available to plants at any given time.
Linear extensibility refers to the change in length of an unconfined clod as moisturecontent is decreased from a moist to a dry state. It is an expression of the volumechange between the water content of the clod at 1/3- or 1/10-bar tension (33kPa or10kPa tension) and oven dryness. The volume change is reported in the table aspercent change for the whole soil. Volume change is influenced by the amount andtype of clay minerals in the soil.
Linear extensibility is used to determine the shrink-swell potential of soils. Theshrink-swell potential is low if the soil has a linear extensibility of less than 3 percent;moderate if 3 to 6 percent; high if 6 to 9 percent; and very high if more than 9 percent.If the linear extensibility is more than 3, shrinking and swelling can cause damage tobuildings, roads, and other structures and to plant roots. Special design commonly isneeded.
Organic matter is the plant and animal residue in the soil at various stages ofdecomposition. In table 19, the estimated content of organic matter is expressed as apercentage, by weight, of the soil material that is less than 2 millimeters in diameter.
The content of organic matter in a soil can be maintained by returning crop residueto the soil. Organic matter has a positive effect on available water capacity, waterinfiltration, soil organism activity, and tilth. It is a source of nitrogen and other nutrientsfor crops and soil organisms.
Erosion factors are shown in the table as the K factor (Kw and Kf) and the T factor.Erosion factor K indicates the susceptibility of a soil to sheet and rill erosion by water.Factor K is one of several factors used in the Universal Soil Loss Equation (USLE)and the Revised Universal Soil Loss Equation (RUSLE) to predict the averageannual rate of soil loss by sheet and rill erosion in tons per acre per year. Theestimates are based primarily on percentage of silt, sand, and organic matter andon soil structure and permeability. Values of K range from 0.02 to 0.69. Other factors
Soil Survey of Salem County, New Jersey
94
being equal, the higher the value, the more susceptible the soil is to sheet and rillerosion by water.
Erosion factor Kw indicates the erodibility of the whole soil. The estimates aremodified by the presence of rock fragments.
Erosion factor Kf indicates the erodibility of the fine-earth fraction, or the materialless than 2 millimeters in size.
Erosion factor T is an estimate of the maximum average annual rate of soil erosionby wind or water that can occur without affecting crop productivity over a sustainedperiod. The rate is in tons per acre per year.
Wind erodibility groups are made up of soils that have similar properties affectingtheir susceptibility to wind erosion in cultivated areas. The soils assigned to group 1are the most susceptible to wind erosion, and those assigned to group 8 are the leastsusceptible. The groups are as follows:
1. Coarse sands, sands, fine sands, and very fine sands.2. Loamy coarse sands, loamy sands, loamy fine sands, loamy very fine sands,
ash material, and sapric soil material.3. Coarse sandy loams, sandy loams, fine sandy loams, and very fine sandy
loams.4L. Calcareous loams, silt loams, clay loams, and silty clay loams.4. Clays, silty clays, noncalcareous clay loams, and silty clay loams that are more
than 35 percent clay.5. Noncalcareous loams and silt loams that are less than 20 percent clay and
sandy clay loams, sandy clays, and hemic soil material.6. Noncalcareous loams and silt loams that are more than 20 percent clay and
noncalcareous clay loams that are less than 35 percent clay.7. Silts, noncalcareous silty clay loams that are less than 35 percent clay, and
fibric soil material.8. Soils that are not subject to wind erosion because of rock fragments on the
surface or because of surface wetness.Wind erodibility index is a numerical value indicating the susceptibility of soil to
wind erosion, or the tons per acre per year that can be expected to be lost to winderosion. There is a close correlation between wind erosion and the texture of thesurface layer, the size and durability of surface clods, rock fragments, organic matter,and a calcareous reaction. Soil moisture and frozen soil layers also influence winderosion.
Chemical Properties
Table 20 shows estimates of some chemical characteristics and features that affectsoil behavior. These estimates are given for the layers of each soil in the survey area.The estimates are based on field observations and on test data for these and similarsoils.
Depth to the upper and lower boundaries of each layer is indicated.Cation-exchange capacity is the total amount of extractable bases that can be held
by the soil, expressed in terms of milliquivalents per 100 grams of soil at neutrality(pH 7.0) or at some other stated pH value. Soils having a low cation-exchangecapacity hold fewer cations and may require more frequent applications of fertilizerthan soils having a high cation-exchange capacity. The ability to retain cationsreduces the hazard of ground-water pollution.
Effective cation-exchange capacity refers to the sum of extractable bases plusaluminum expressed in terms of milliquivalents per 100 grams of soil. It is determinedfor soils that have pH of less than 5.5.
Soil reaction is a measure of acidity or alkalinity. The pH of each soil horizon isbased on many field tests. For many soils, values have been verified by laboratory
Soil Survey of Salem County, New Jersey
95
analyses. Soil reaction is important in selecting crops and other plants, in evaluatingsoil amendments for fertility and stabilization, and in determining the risk of corrosion.
Salinity is a measure of soluble salts in the soil at saturation. It is expressedas the electrical conductivity of the saturation extract, in millimhos per centimeter at25 degrees C. Estimates are based on field and laboratory measurements atrepresentative sites of nonirrigated soils. The salinity of irrigated soils is affected bythe quality of the irrigation water and by the frequency of water application. Hence,the salinity of soils in individual fields can differ greatly from the value given in thetable. Salinity affects the suitability of a soil for crop production, the stability of soil ifused as construction material, and the potential of the soil to corrode metal andconcrete. It does not affect most of the soils in Salem County. Soils in theAppoquinimink, Broadkill, Manahawkin, Mannington, Nanticoke, and Transquakingseries are the only soils for which estimated soluble salt levels can be provided.Seawater is the source of salinity in these soils.
Sodium adsorption ratio (SAR) is a measure of the amount of sodium (Na) relativeto calcium (Ca) and magnesium (Mg) in the water extract from saturated soil paste. Itis the ratio of the Na concentration divided by the square root of one-half of the Ca +Mg concentration. Soils that have SAR values of 13 or more may be characterized byan increased dispersion of organic matter and clay particles, reduced permeabilityand aeration, and a general degradation of soil structure.
Soil Features
Table 21 gives estimates of various soil features. The estimates are used in landuse planning that involves engineering considerations.
A restrictive layer is a nearly continuous layer that has one or more physical,chemical, or thermal properties that significantly impede the movement of water andair through the soil or that restrict roots or otherwise provide an unfavorable rootenvironment. Examples are fragipans and dense layers. The table indicates thehardness and thickness of the restrictive layer, both of which significantly affect theease of excavation. Depth to top is the vertical distance from the soil surface to theupper boundary of the restrictive layer.
Subsidence is the settlement of organic soils or of saturated mineral soils of verylow density. Subsidence generally results from either desiccation and shrinkage oroxidation of organic material, or both, following drainage. Subsidence takes placegradually, usually over a period of several years. The table shows the expected initialsubsidence, which usually is a result of drainage, and total subsidence, which resultsfrom a combination of factors.
Potential for frost action is the likelihood of upward or lateral expansion of the soilcaused by the formation of segregated ice lenses (frost heave) and the subsequentcollapse of the soil and loss of strength on thawing. Frost action occurs whenmoisture moves into the freezing zone of the soil. Temperature, texture, density,permeability, content of organic matter, and depth to the water table are the mostimportant factors considered in evaluating the potential for frost action. It is assumedthat the soil is not insulated by vegetation or snow and is not artificially drained. Siltyand highly structured, clayey soils that have a high water table in winter are the mostsusceptible to frost action. Well drained, very gravelly, or very sandy soils are theleast susceptible. Frost heave and low soil strength during thawing cause damage topavements and other rigid structures.
Risk of corrosion pertains to potential soil-induced electrochemical or chemicalaction that corrodes or weakens uncoated steel or concrete. The rate of corrosion ofuncoated steel is related to such factors as soil moisture, particle-size distribution,acidity, and electrical conductivity of the soil. The rate of corrosion of concrete isbased mainly on the sulfate and sodium content, texture, moisture content, and
Soil Survey of Salem County, New Jersey
96
acidity of the soil. Special site examination and design may be needed if thecombination of factors results in a severe hazard of corrosion. The steel or concrete ininstallations that intersect soil boundaries or soil layers is more susceptible tocorrosion than the steel or concrete in installations that are entirely within one kind ofsoil or within one soil layer.
For uncoated steel, the risk of corrosion, expressed as low, moderate, or high, isbased on soil drainage class, total acidity, electrical resistivity near field capacity, andelectrical conductivity of the saturation extract.
For concrete, the risk of corrosion also is expressed as low, moderate, or high. It isbased on soil texture, acidity, and amount of sulfates in the saturation extract.
Water Features
Table 22 gives estimates of various water features. The estimates are used in landuse planning that involves engineering considerations.
Hydrologic soil groups are based on estimates of runoff potential. Soils areassigned to one of four groups according to the rate of water infiltration when the soilsare not protected by vegetation, are thoroughly wet, and receive precipitation fromlong-duration storms.
The four hydrologic soil groups are:Group A. Soils having a high infiltration rate (low runoff potential) when
thoroughly wet. These consist mainly of deep, well drained to excessively drainedsands or gravelly sands. These soils have a high rate of water transmission.
Group B. Soils having a moderate infiltration rate when thoroughly wet. Theseconsist chiefly of moderately deep or deep, moderately well drained or well drainedsoils that have moderately fine texture to moderately coarse texture. These soils havea moderate rate of water transmission.
Group C. Soils having a slow infiltration rate when thoroughly wet. These consistchiefly of soils having a layer that impedes the downward movement of water or soilsof moderately fine texture or fine texture. These soils have a slow rate of watertransmission.
Group D. Soils having a very slow infiltration rate (high runoff potential) whenthoroughly wet. These consist chiefly of clays that have a high shrink-swell potential,soils that have a high water table, soils that have a claypan or clay layer at or near thesurface, and soils that are shallow over nearly impervious material. These soils havea very slow rate of water transmission.
If a soil is assigned to a dual hydrologic group (A/D, B/D, or C/D), the first letter isfor drained areas and the second is for undrained areas.
Surface runoff refers to the loss of water from an area by flow over the landsurface. Surface runoff classes are based on slope, climate, and vegetative cover. It isassumed that the surface of the soil is bare and that the retention of surface waterresulting from irregularities in the ground surface is minimal. The classes arenegligible, very low, low, medium, high, and very high.
The months in the table indicate the portion of the year in which the feature is mostlikely to be a concern.
Water table refers to a saturated zone in the soil. The table indicates, by month,depth to the top (upper limit) and base (lower limit) of the saturated zone in mostyears. Estimates of the upper and lower limits are based mainly on observations ofthe water table at selected sites and on evidence of a saturated zone, namely grayishcolors or mottles (redoximorphic features) in the soil. A saturated zone that lasts forless than a month is not considered a water table.
Ponding is standing water in a closed depression. Unless a drainage system isinstalled, the water is removed only by percolation, transpiration, or evaporation.Table 22 indicates surface water depth and the duration and frequency of ponding.
Soil Survey of Salem County, New Jersey
97
Duration is expressed as very brief if less than 2 days, brief if 2 to 7 days, long if 7 to30 days, and very long if more than 30 days. Frequency is expressed as none, rare,occasional, and frequent. None means that ponding is not probable; rare that it isunlikely but possible under unusual weather conditions (the chance of ponding isnearly 0 percent to 5 percent in any year); occasional that it occurs, on the average,once or less in 2 years (the chance of ponding is 5 to 50 percent in any year); andfrequent that it occurs, on the average, more than once in 2 years (the chance ofponding is more than 50 percent in any year).
Flooding is the temporary inundation of an area caused by overflowing streams, byrunoff from adjacent slopes, or by tides. Water standing for short periods after rainfallor snowmelt is not considered flooding, and water standing in swamps and marshesis considered ponding rather than flooding.
Duration and frequency are estimated. Duration is expressed as extremely brief if0.1 hour to 4 hours, very brief if 4 hours to 2 days, brief if 2 to 7 days, long if 7 to30 days, and very long if more than 30 days. Frequency is expressed as none, veryrare, rare, occasional, frequent, and very frequent. None means that flooding is notprobable; very rare that it is very unlikely but possible under extremely unusualweather conditions (the chance of flooding is less than 1 percent in any year); rarethat it is unlikely but possible under unusual weather conditions (the chance offlooding is 1 to 5 percent in any year); occasional that it occurs infrequently undernormal weather conditions (the chance of flooding is 5 to 50 percent in any year);frequent that it is likely to occur often under normal weather conditions (the chance offlooding is more than 50 percent in any year but is less than 50 percent in all monthsin any year); and very frequent that it is likely to occur very often under normalweather conditions (the chance of flooding is more than 50 percent in all months ofany year).
The information is based on evidence in the soil profile, namely thin strata ofgravel, sand, silt, or clay deposited by floodwater; irregular decrease in organic mattercontent with increasing depth; and little or no horizon development.
Also considered are local information about the extent and levels of flooding andthe relation of each soil on the landscape to historic floods. Information on the extentof flooding based on soil data is less specific than that provided by detailedengineering surveys that delineate flood-prone areas at specific flood frequencylevels.

99
Soil Survey of Salem County, New Jersey
The system of soil classification used by the National Cooperative Soil Surveyhas six categories (Soil Survey Staff 1999, 2003). Beginning with the broadest,these categories are the order, suborder, great group, subgroup, family, and series.Classification is based on soil properties observed in the field or inferred from thoseobservations or from laboratory measurements. Table 23 shows the classification ofthe soils in the survey area. The categories are defined in the following paragraphs.
ORDER. Twelve soil orders are recognized. The differences among orders reflectthe dominant soil-forming processes and the degree of soil formation. Each order isidentified by a word ending in sol. An example is Ultisol.
SUBORDER. Each order is divided into suborders primarily on the basis ofproperties that influence soil genesis and are important to plant growth or propertiesthat reflect the most important variables within the orders. The last syllable in thename of a suborder indicates the order. An example is Udults (Ud, meaning humid,plus ult, from Ultisol).
GREAT GROUP. Each suborder is divided into great groups on the basis of closesimilarities in kind, arrangement, and degree of development of pedogenic horizons;soil moisture and temperature regimes; type of saturation; and base status. Eachgreat group is identified by the name of a suborder and by a prefix that indicates aproperty of the soil. An example is Hapludults (Hapl, meaning minimal horizonation,plus udult, the suborder of the Ultisols that has a udic moisture regime).
SUBGROUP. Each great group has a typic subgroup. Other subgroups areintergrades or extragrades. The typic subgroup is the central concept of the greatgroup; it is not necessarily the most extensive. Intergrades are transitions to otherorders, suborders, or great groups. Extragrades have some properties that are notrepresentative of the great group but do not indicate transitions to any othertaxonomic class. Each subgroup is identified by one or more adjectives preceding thename of the great group. The adjective Typic identifies the subgroup that typifies thegreat group. An example is Typic Hapludults.
FAMILY. Families are established within a subgroup on the basis of physical andchemical properties and other characteristics that affect management. Generally, theproperties are those of horizons below plow depth where there is much biologicalactivity. Among the properties and characteristics considered are particle-size class,mineralogy class, cation-exchange activity class, soil temperature regime, soil depth,and reaction class. A family name consists of the name of a subgroup preceded byterms that indicate soil properties. An example is coarse-loamy, siliceous, semiactive,mesic Typic Hapludults.
SERIES. The series consists of soils within a family that have horizons similar incolor, texture, structure, reaction, consistence, mineral and chemical composition,and arrangement in the profile.
Soil Series and Their MorphologyIn this section, each soil series recognized in the survey area is described.
Characteristics of the soil and the material in which it formed are identified for each
Classification of the Soils
Soil Survey of Salem County, New Jersey
100
series. A pedon, a small three-dimensional area of soil, that is typical of the series inthe survey area is described. The detailed description of each soil horizon followsstandards in the “Soil Survey Manual” (Soil Survey Division Staff 1993). Many of thetechnical terms used in the descriptions are defined in “Soil Taxonomy” (Soil SurveyStaff 1999) and in “Keys to Soil Taxonomy” (Soil Survey Staff 2003). Unless otherwiseindicated, colors in the descriptions are for moist soil. Following the pedon descriptionis the range of important characteristics of the soils in the series.
For soils listed as minor components in the “Detailed Soil Map Units” section butnot included in this section, the soil series pedon description and range incharacteristics are available on the Internet at <http://ortho.ftw.nrcs.usda.gov/cgi-bin/osd/osdname.cgi>.
Adelphia SeriesDrainage class: Moderately well drainedPermeability: Moderate to rapidLandscape: North Atlantic Coastal PlainLandform: Low hillsParent material: Glauconite-bearing loamy eolian deposits or glauconite-bearing
loamy fluviomarine deposits, or bothSlope range: 2 to 5 percent
Taxonomic class: Fine-loamy, mixed, active, mesic Aquic Hapludults
Typical Pedon
Adelphia sandy loam, in an area of Adelphia sandy loam, 2 to 5 percent slopes, inSalem County, New Jersey; about 0.9 mile north of the intersection of Long BridgeRoad and Route 623, about 0.5 mile northeast of Route 623, and 0.25 mile southof Canton Cemetery, along the west side of Smick Road, in a cultivated field; USGSCanton topographic quadrangle; lat. 39 degrees 28 minutes 38 seconds N. andlong. 75 degrees 24 minutes 43 seconds W.
Ap—0 to 10 inches; dark grayish brown (10YR 4/2) sandy loam; moderate mediumgranular structure; friable; nonsticky, nonplastic; common fine roots; slightly acid;abrupt smooth boundary.
BE—10 to 16 inches; very pale brown (10YR 7/3) sandy loam; weak mediumsubangular blocky structure; friable; nonsticky, nonplastic; common very fine andfine roots; 1 percent faint clay bridging between sand grains; 1 percent prominentyellowish brown (10YR 5/8) masses of accumulated iron and manganese oxidewith clear boundaries throughout; slightly acid; gradual smooth boundary.
Bt1—16 to 26 inches; light yellowish brown (2.5Y 6/4) sandy loam; weak mediumsubangular blocky structure; friable; nonsticky, nonplastic; common very fine andfine roots; 10 percent faint clay films on faces of peds and in pores and10 percent faint clay bridging between sand grains; 1 percent prominent irregularbrownish yellow (10YR 6/8) masses of accumulated iron and manganese oxidewith clear boundaries throughout; 10 percent glauconite pellets; moderately acid;clear smooth boundary.
Bt2—26 to 30 inches; yellowish brown (10YR 5/6) sandy clay loam; moderate mediumsubangular blocky structure; friable; slightly sticky, slightly plastic; common veryfine and fine roots; 10 percent faint clay films on faces of peds and in pores and10 percent faint clay bridging between sand grains; 1 percent distinct irregularlight yellowish brown (10YR 6/4) masses of accumulated iron and manganeseoxide with clear boundaries throughout; 10 percent glauconite pellets; moderatelyacid; gradual smooth boundary.
Soil Survey of Salem County, New Jersey
101
Bt3—30 to 38 inches; yellowish brown (10YR 5/6) sandy clay loam; moderate mediumsubangular blocky structure; friable; slightly sticky, slightly plastic; 15 percent faintclay films on faces of peds and in pores and 15 percent faint clay bridgingbetween sand grains; 2 percent distinct irregular yellowish brown (10YR 5/8)masses of accumulated iron and manganese oxide with clear boundariesthroughout; 2 percent distinct irregular light brownish gray (2.5Y 6/2) irondepletions with clear boundaries throughout; 10 percent glauconite pellets;moderately acid; clear smooth boundary.
Bt4—38 to 46 inches; yellowish brown (10YR 5/6) gravelly sandy clay loam; moderatemedium subangular blocky structure; friable; slightly sticky, slightly plastic;15 percent faint clay films on faces of peds and in pores and 15 percent faint claybridging between sand grains; 1 percent prominent irregular light brownish gray(2.5Y 6/2) iron depletions with clear boundaries throughout; 10 percent glauconitepellets; 18 percent rounded indurated quartzite fragments; moderately acid;gradual smooth boundary.
Bt5—46 to 56 inches; brownish yellow (10YR 6/6) gravelly sandy clay loam; moderatemedium subangular blocky structure; friable; slightly sticky, slightly plastic;15 percent faint clay films on faces of peds and in pores and 15 percent faint claybridging between sand grains; 1 percent distinct irregular yellowish brown (10YR5/8) masses of accumulated iron and manganese oxide with clear boundariesthroughout; 1 percent prominent irregular light brownish gray (2.5Y 6/2) irondepletions with clear boundaries throughout; 10 percent glauconite pellets;20 percent rounded indurated quartzite fragments; moderately acid; clear smoothboundary.
C1—56 to 62 inches; brownish yellow (10YR 6/6) sandy loam; massive; friable;nonsticky, nonplastic; 1 percent medium prominent irregular pale red (2.5YR 6/2)iron depletions with diffuse boundaries throughout; 10 percent glauconite pellets;moderately acid; clear smooth boundary.
C2—62 to 69 inches; light olive brown (2.5Y 5/6) fine sandy loam; massive; friable;nonsticky, nonplastic; 1 percent medium prominent irregular pale red (2.5YR 6/2)iron depletions with diffuse boundaries throughout; 10 percent glauconite pellets;moderately acid; clear smooth boundary.
C3—69 to 72 inches; light yellowish brown (2.5Y 6/4) fine sandy loam; massive;friable; nonsticky, nonplastic; 1 percent medium distinct irregular pale red (2.5YR6/2) iron depletions with diffuse boundaries throughout; 10 percent glauconitepellets; moderately acid.
Range in Characteristics
Depth to bedrock: More than 72 inchesDepth to the seasonal high water table: 18 to 42 inches (January to April)Content of rock fragments: 0 to 5 percent, by volume, to a depth of 40 inches; 0 to
30 percent below 40 inchesReaction: In unlimed areas, extremely acid to strongly acid throughoutContent of glauconite: 0 to 10 percent, by volume, glauconite pellets in the A and E
horizons, 10 to 20 percent in the B horizon, and 2 to 40 percent in the C horizon
O horizon (if it occurs):Color—hue of 5YR to 10YR, value of 2 to 4, and chroma of 1 to 3Type of organic soil material—slightly decomposed to highly decomposed plant
material
A or Ap horizon:Color—hue of 7.5YR to 2.5Y, value of 3 or 4, and chroma of 1 to 4Texture—loamy fine sand, sandy loam, fine sandy loam, loam, or silt loam
Soil Survey of Salem County, New Jersey
102
E horizon (if it occurs):Color—hue of 7.5YR to 2.5Y, value of 4 to 8, and chroma of 1 to 4Texture—loamy fine sand, sandy loam, fine sandy loam, loam, or silt loam
BA or BE horizon:Color—hue of 7.5YR to 2.5Y, value of 4 to 8, and chroma of 3 to 8Texture—sandy loam, fine sandy loam, loam, or silt loam
Bt horizon:Color—hue of 7.5YR to 5Y, value of 4 to 6, and chroma of 3 to 6Texture of the fine-earth fraction—fine sandy loam, sandy loam, sandy clay loam,
clay loam, or loamRedoximorphic features—iron depletions in shades of olive, gray, or white and
masses of accumulated iron and manganese oxide in shades of red, brown,yellow, or olive
BC horizon (if it occurs):Color—hue of 7.5YR to 5Y, value of 4 or 5, and chroma of 3 to 6Texture of the fine-earth fraction—fine sandy loam, sandy loam, sandy clay loam,
clay loam, or loamRedoximorphic features—iron depletions in shades of olive, gray, or white and
masses of accumulated iron and manganese oxide in shades of red, brown,yellow, or olive
BCg horizon (if it occurs):Color—hue of 10YR to 5G, value of 4 to 8, and chroma of 1 or 2 or is neutral with
value of 4 to 8Texture of the fine-earth fraction—loamy sand, sandy loam, or fine sandy loam or
stratified with these texturesRedoximorphic features—iron depletions in shades of olive, gray, or white and
masses of accumulated iron and manganese oxide in shades of red, brown,yellow, or olive
C horizon:Color—hue of 10YR to 5Y, value of 4 or 5, and chroma of 3 to 8Texture of the fine-earth fraction—loamy sand, sandy loam, or fine sandy loam or
stratified with these textures; clay loam or silty clay loam subhorizons in somepedons
Redoximorphic features—iron depletions in shades of olive, gray, or white andmasses of accumulated iron and manganese oxide in shades of red, brown,yellow, or olive
Cg horizon (if it occurs):Color—hue of 10YR to 5G, value of 4 to 8, and chroma of 1 or 2 or is neutral with
value of 4 to 8Texture—loamy sand, sandy loam, or fine sandy loam or stratified with these
textures; clay loam or silty clay loam subhorizons in some pedonsRedoximorphic features—iron depletions in shades of olive, gray, or white and
masses of accumulated iron and manganese oxide in shades of red, brown,yellow, or olive
Alloway SeriesDrainage class: Moderately well drainedPermeability: Slow and moderately slowLandscape: North Atlantic Coastal Plain
Soil Survey of Salem County, New Jersey
103
Landform: Broad ridgesParent material: Silty and clayey eolian deposits or fluviomarine deposits, or bothSlope range: 0 to 10 percent
Taxonomic class: Fine, mixed, active, mesic Aquic Paleudults
Typical Pedon
Alloway silt loam, in an area of Alloway silt loam, 2 to 5 percent slopes, in SalemCounty, New Jersey; about 0.15 mile west of Swedes Bridge Road at a point 0.1 milesouth of the intersection of Portertown Road and Swedes Bridge Road, in a cultivatedarea; USGS Salem topographic quadrangle; lat. 39 degrees 36 minutes 00 secondsN. and long. 75 degrees 22 minutes 51 seconds W.
Ap—0 to 11 inches; dark yellowish brown (10YR 4/4) silt loam, yellowish brown(10YR 5/4) dry; strong medium and coarse granular structure; friable; moderatelysticky, moderately plastic; few fine and medium roots; slightly acid; abrupt smoothboundary.
Bt1—11 to 18 inches; yellowish brown (10YR 5/6) silty clay loam; strong coarsesubangular blocky structure parting to strong medium subangular blocky; firm;very sticky, very plastic; few very fine and fine roots; 35 percent faint clay films;slightly acid; clear smooth boundary.
Bt2—18 to 24 inches; yellowish brown (10YR 5/8) silty clay loam; strong fine andmedium subangular blocky structure; firm; very sticky, very plastic; few very fineand fine roots; 35 percent faint clay films; slightly acid; clear smooth boundary.
Bt3—24 to 32 inches; yellowish brown (10YR 5/6) clay loam; strong medium andcoarse subangular blocky structure; friable; moderately sticky, moderately plastic;few very fine and fine roots; 35 percent faint clay films; 1 percent fine prominentirregular light gray (10YR 7/1) iron depletions with clear boundaries throughout;1 percent fine distinct irregular strong brown (7.5YR 5/8) masses of accumulatediron and manganese oxide with diffuse boundaries throughout; 10 percentrounded fine to coarse quartzite fragments; moderately acid; clear smoothboundary.
Bt4—32 to 39 inches; reddish yellow (7.5YR 6/8) clay loam; strong medium andcoarse subangular blocky structure; friable; moderately sticky, moderately plastic;few very fine and fine roots; 35 percent faint clay films; 10 percent fine prominentirregular light gray (10YR 7/1) iron depletions with clear boundaries throughout;5 percent rounded medium quartzite fragments; moderately acid; gradual smoothboundary.
Bt5—39 to 48 inches; reddish yellow (7.5YR 6/8) clay loam; strong medium andcoarse subangular blocky structure; friable; very sticky, very plastic; few very fineand fine roots; 35 percent faint clay films; 10 percent fine prominent irregularpinkish gray (7.5YR 7/2) iron depletions with clear boundaries throughout;moderately acid; clear smooth boundary.
C—48 to 65 inches; reddish yellow (7.5YR 6/8) clay; massive; friable; very sticky, veryplastic; few very fine and fine roots; 35 percent faint clay films; 10 percent fineprominent irregular pinkish gray (7.5YR 7/2) iron depletions with clear boundariesthroughout; moderately acid; clear smooth boundary.
Cg—65 to 80 inches; light gray (10YR 7/2) clay; massive; friable; very sticky, veryplastic; few very fine and fine roots; 35 percent faint clay films; 10 percent fineprominent irregular yellowish red (5YR 5/6) masses of accumulated iron andmanganese oxide with diffuse boundaries throughout; moderately acid.
Range in Characteristics
Depth to bedrock: More than 80 inchesDepth to the seasonal high water table: 18 to 42 inches (January to April)
Soil Survey of Salem County, New Jersey
104
Content of rock fragments: 0 to 15 percent, by volume, throughout the profile; mostlyrounded quartzite gravel
Reaction: In unlimed areas, extremely acid to strongly acid throughout
Ap or A horizon:Color—hue of 7.5YR to 2.5Y, value of 2 to 6, and chroma of 1 to 4Texture of the fine-earth fraction—sandy loam, loam, or silt loam
E, BE, or BA horizon (if it occurs):Color—hue of 7.5YR to 2.5Y, value of 4 to 6, and chroma of 3 to 6Texture of the fine-earth fraction—sandy clay loam, sandy loam, loam, or silt loam
Bt horizon:Color—hue of 5YR to 10YR, value of 4 to 7, and chroma of 3 to 8Texture of the fine-earth fraction—sandy clay loam, sandy clay, clay, clay loam,
silt loam, silty clay loam, or silty clayRedoximorphic features—iron depletions in shades of white or gray and masses
of accumulated iron and manganese oxide in shades of red, brown, yellow, orolive
Btg horizon:Color—hue of 5YR to 10YR, value of 4 to 7, and chroma of 1 or 2 or is neutral
with value of 4 to 7Texture of the fine-earth fraction—sandy clay loam, sandy clay, clay, clay loam,
silt loam, silty clay loam, or silty clayRedoximorphic features—iron depletions in shades of white or gray and masses
of accumulated iron and manganese oxide in shades of red, brown, yellow, orolive
BC horizon (if it occurs):Color—hue of 2.5YR to 10YR, value of 4 to 8, and chroma of 3 to 8Texture of the fine-earth fraction—sandy clay loam, sandy clay, clay, clay loam,
silt loam, silty clay loam, or silty clayRedoximorphic features—iron depletions in shades of white or gray and masses
of accumulated iron and manganese oxide in shades of red, brown, yellow, orolive
C horizon (if it occurs):Color—hue of 2.5YR to 10YR, value of 2 to 7, and chroma of 3 to 8Texture of the fine-earth fraction—ranges from loamy sand to clayRedoximorphic features—iron depletions in shades of white or gray and masses
of accumulated iron and manganese oxide in shades of red, brown, yellow, orolive
Cg horizon (if it occurs):Color—hue of 2.5YR to 10YR, value of 3 to 7, and chroma of 1 or 2 or is neutral
with value of 2 to 7Texture of the fine-earth fraction—ranges from loamy sand to clayRedoximorphic features—iron depletions in shades of white or gray and masses
of accumulated iron and manganese oxide in shades of red, brown, yellow, orolive
Appoquinimink SeriesDrainage class: Very poorly drainedPermeability: ModerateLandscape: North Atlantic Coastal Plain
Soil Survey of Salem County, New Jersey
105
Landform: Tidal flatsParent material: Loamy fluviomarine deposits over herbaceous organic materialSlope range: 0 to 1 percent
Taxonomic class: Fine-silty, mixed, active, nonacid, mesic Thapto-Histic Sulfaquents
Typical Pedon
Appoquinimink mucky silt loam, in an area of Appoquinimink-Broadkill complex, 0 to1 percent slopes, very frequently flooded, in Cape May County, New Jersey; 1.8 mileswest of South Dennis, 2,300 feet southwest of a boat ramp on Dennis Creek at theend of Jakes Landing Road, and 300 feet west and 400 feet north of Dennis Creekat a sharp bend in the creek, in a tidal marsh; USGS Woodbine topographicquadrangle; lat. 39 degrees 10 minutes 32 seconds N. and long. 74 degrees51 minutes 32 seconds W.
Ag—0 to 12 inches; very dark gray (5Y 3/1) mucky silt loam; massive; friable; slightlysticky, slightly plastic; many fine roots; neutral; clear smooth boundary.
Cg—12 to 30 inches; dark gray (5Y 4/1) silt loam; massive; friable; slightly sticky,slightly plastic; neutral; abrupt smooth boundary.
Oe—30 to 70 inches; dark olive gray (5Y 3/2) mucky peat; 40 percent fiber, rubbed;neutral; abrupt smooth boundary.
C'g—70 to 90 inches; dark gray (5Y 4/1) silt loam; massive; friable; slightly sticky,slightly plastic; neutral.
Range in Characteristics
Depth to bedrock: More than 90 inchesSeasonal high water table: At the surface (January to December); flooded by tidal
waters twice dailyDepth to underlying organic layers: 16 to 40 inchesContent of fragments: 0 to 10 percent, by volume, in the mineral layers, mostly shells
and shell fragments; none in the organic horizonElectrical conductivity throughout the profile: More than 8 millimhos per centimeterReaction: Slightly acid to slightly alkaline when wet or moist; ultra acid or extremely
acid within 20 inches of the surface after moist incubationOther features: n-value typically more than 1.0 but ranges from 0.7 to more than 1.0
Ag horizon:Color—hue of 10YR to 5GY, value of 2 to 4, and chroma of 1 or 2 or is neutral
with value of 2 to 4Texture—mucky silt loam, silt loam, or silty clay loamOrganic matter content—5 to 15 percent
Cg horizon:Color—hue of 10YR to 5GY, value of 2 to 6, and chroma of 1 or 2 or is neutral
with value of 2 to 6Texture—silt loam, silty clay loam, or mucky silt loamOrganic matter content—1 to 10 percent
O horizon:Color—hue of 5YR to 2.5Y, value of 2 to 5, and chroma of 1 to 4 or is neutral with
value of 2 to 5Type of organic soil material—muck or mucky peat (sapric or hemic soil
materials); fiber content after rubbing ranges from 5 to 50 percent of the soilvolume
Content of mineral material—10 to 70 percent by weight; lenses of silt, silt loam,or very fine sand in some pedons
Soil Survey of Salem County, New Jersey
106
C'g horizon:Color—hue of 10YR to 5GY, value of 2 to 6, and chroma of 1 or 2 or is neutral
with value of 2 to 6Texture—silt loam, mucky silt loam, loam, very fine sandy loam, fine sandy loam,
or sandy loamOrganic matter content—1 to 10 percent; thin lenses of organic soil material less
than 8 inches thick in some pedons
Askecksy SeriesDrainage class: Poorly drainedPermeability: RapidLandscape: North Atlantic Coastal PlainLandform: Depressions, flood plains, and flatsParent material: Sandy fluviomarine depositsSlope range: 0 to 2 percent
Taxonomic class: Siliceous, mesic Typic Psammaquents
Typical Pedon
Askecksy loamy sand, in an area of Pedricktown, Askecksy, and Mullica soils, 0 to2 percent slopes, rarely flooded, in Salem County, New Jersey; about 750 feetnortheast along New Road from the intersection of Perkintown Road and New Road,687 feet east on New Road, in a wooded area; USGS Penns Grove topographicquadrangle; lat. 39 degrees 44 minutes 37.10 seconds N. and long. 75 degrees25 minutes 51.47 seconds W.
Ag—0 to 9 inches; black (10YR 2/1) loamy sand; single grain; loose; nonsticky,nonplastic; common very fine and fine roots and few medium and coarse roots;extremely acid; clear wavy boundary.
Cg1—9 to 11 inches; dark gray (10YR 4/1) sand; single grain; loose; nonsticky,nonplastic; 1 percent fine prominent brownish yellow (10YR 6/6) masses ofaccumulated iron and manganese oxide with clear boundaries throughout;2 percent rounded fine to coarse quartzite fragments; extremely acid; gradualwavy boundary.
Cg2—11 to 28 inches; light brownish gray (10YR 6/2) sand; single grain; loose;nonsticky, nonplastic; 1 percent fine prominent brownish yellow (10YR 6/6)masses of accumulated iron and manganese oxide with clear boundariesthroughout; 2 percent rounded fine to coarse quartzite fragments; very stronglyacid; clear smooth boundary.
Cg3—28 to 31 inches; very dark grayish brown (10YR 3/2) sand; single grain; loose;nonsticky, nonplastic; 15 percent medium prominent light olive gray (5Y 6/2) irondepletions with clear boundaries throughout; 2 percent rounded fine to mediumquartzite fragments; extremely acid; clear smooth boundary.
Cg4—31 to 80 inches; light brownish gray (10YR 6/2) sand; single grain; loose;nonsticky, nonplastic; 1 percent fine prominent brownish yellow (10YR 6/6)masses of accumulated iron and manganese oxide with clear boundariesthroughout; 2 percent fine distinct masses of accumulated iron and manganeseoxide with clear boundaries throughout; 2 percent rounded fine to mediumquartzite fragments; very strongly acid.
Range in Characteristics
Depth to bedrock: More than 80 inchesDepth to a 2C horizon (if it occurs): More than 50 inchesSeasonal high water table: Within a depth of 12 inches (December to May)
Soil Survey of Salem County, New Jersey
107
Content of rock fragments: 0 to 5 percent, by volume, in the A horizon and 0 to20 percent in the C horizon; mostly rounded quartz gravel
Electrical conductivity: 0 to 4 millimhos per centimeter in the A horizon and less than2 millimhos per centimeter in the C horizon
Reaction: In unlimed areas, extremely acid to strongly acid
A or Ap horizon:Color—hue of 10YR or 2.5Y, value of 2 to 6, and chroma of 1 or 2Texture—loamy sand, loamy fine sand, or sand
Ab horizon (if it occurs):Color—hue of 10YR to 5Y, value of 2 to 4, and chroma of 1 to 4Texture—loamy sand, loamy fine sand, or sand
Cg horizon:Color—hue of 10YR to 5GY, value of 4 to 7, and chroma of 1 or 2 or is neutral
with value of 4 to 7Texture of the fine-earth fraction—loamy sand, loamy fine sand, or fine to coarse
sandRedoximorphic features—iron depletions in shades of olive, gray, or white and
masses of accumulated iron and manganese oxide in shades of red, brown,yellow, or olive
2C horizon (if it occurs):Color—lower in value and chroma than the overlying horizonTexture of the fine-earth fraction—silt loam to sandy clay loam; commonly
stratified with textures ranging from silty clay loam to coarse sandRedoximorphic features—iron depletions in shades of olive, gray, or white and
masses of accumulated iron and manganese oxide in shades of red, brown,yellow, or olive
Aura SeriesDrainage class: Well drainedPermeability: Moderately slow in the fragipanLandscape: North Atlantic Coastal PlainLandform: Knolls and low hillsParent material: Loamy or gravelly old alluvium, or both (fig. 8)Slope range: 0 to 10 percent
Taxonomic class: Coarse-loamy, siliceous, semiactive, mesic Typic Fragiudults
Typical Pedon
Aura sandy loam, in an area of Aura sandy loam, 2 to 5 percent slopes, in GloucesterCounty, New Jersey; 0.5 mile northeast of Bluebell, from the intersection of VictoriaAvenue and Tuckahoe Road, in a cultivated field; USGS Buena topographicquadrangle; lat. 39 degrees 34 minutes 23 seconds N. and long. 74 degrees58 minutes 10 seconds W.
Ap—0 to 8 inches; dark yellowish brown (10YR 3/4) sandy loam, dark grayish brown(10YR 4/2) dry; moderate fine granular structure; friable; many fine and mediumroots; extremely acid; abrupt smooth boundary.
Bt1—8 to 13 inches; strong brown (7.5YR 5/6) coarse sandy loam; 1 percent fine faintstrong brown (7.5YR 4/6) and 1 percent medium distinct very pale brown (10YR7/4) mottles; weak medium subangular blocky structure; friable; many fine roots;30 percent distinct clay bridging between sand grains; 5 percent rounded fine tocoarse quartzite fragments; extremely acid; gradual wavy boundary.
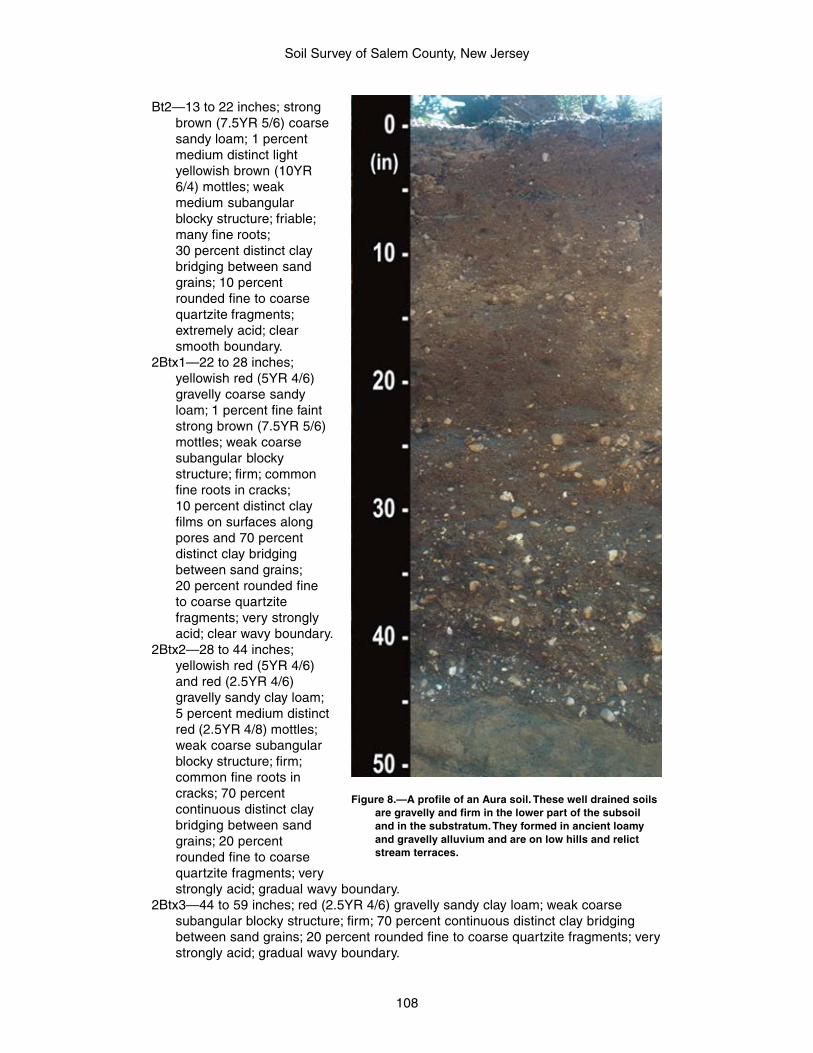
Soil Survey of Salem County, New Jersey
108
Bt2—13 to 22 inches; strongbrown (7.5YR 5/6) coarsesandy loam; 1 percentmedium distinct lightyellowish brown (10YR6/4) mottles; weakmedium subangularblocky structure; friable;many fine roots;30 percent distinct claybridging between sandgrains; 10 percentrounded fine to coarsequartzite fragments;extremely acid; clearsmooth boundary.
2Btx1—22 to 28 inches;yellowish red (5YR 4/6)gravelly coarse sandyloam; 1 percent fine faintstrong brown (7.5YR 5/6)mottles; weak coarsesubangular blockystructure; firm; commonfine roots in cracks;10 percent distinct clayfilms on surfaces alongpores and 70 percentdistinct clay bridgingbetween sand grains;20 percent rounded fineto coarse quartzitefragments; very stronglyacid; clear wavy boundary.
2Btx2—28 to 44 inches;yellowish red (5YR 4/6)and red (2.5YR 4/6)gravelly sandy clay loam;5 percent medium distinctred (2.5YR 4/8) mottles;weak coarse subangularblocky structure; firm;common fine roots incracks; 70 percentcontinuous distinct claybridging between sandgrains; 20 percentrounded fine to coarsequartzite fragments; verystrongly acid; gradual wavy boundary.
2Btx3—44 to 59 inches; red (2.5YR 4/6) gravelly sandy clay loam; weak coarsesubangular blocky structure; firm; 70 percent continuous distinct clay bridgingbetween sand grains; 20 percent rounded fine to coarse quartzite fragments; verystrongly acid; gradual wavy boundary.
Figure 8.—A profile of an Aura soil. These well drained soilsare gravelly and firm in the lower part of the subsoiland in the substratum. They formed in ancient loamyand gravelly alluvium and are on low hills and relictstream terraces.
Soil Survey of Salem County, New Jersey
109
2C—59 to 80 inches; yellowish red (5YR 4/8) gravelly loamy coarse sand; massive;very firm; 20 percent rounded fine to coarse quartzite fragments; very stronglyacid.
Range in Characteristics
Depth to bedrock: More than 80 inchesDepth to the fragipan: 15 to 40 inchesDepth to lithologic discontinuity (if it occurs): 15 to 40 inches to coarser textured
materialsSilt content above the lithologic discontinuity: 20 to 45 percentSilt content below the lithologic discontinuity: Less than 20 percentDepth to a seasonal high water table: More than 72 inchesContent of rock fragments: 0 to 20 percent, by volume, in the A, E, and Bt horizons;
10 to 50 percent in the Btx horizon; and 0 to 50 percent in the C horizon; mostlyrounded quartzite gravel and none to few rounded igneous and metamorphicpebbles and cobbles
Reaction: In unlimed areas, extremely acid or very strongly acid throughoutOther features: Microsequence of thin A, E, and Bh horizons (micropodzol) typical in
pedons in wooded areas; total thickness of A, E, and Bh microsequence less than6 inches; thickness of individual horizons less than 2 inches
O horizon (if it occurs):Color—hue of 5YR to 10YR, value of 2 to 4, and chroma of 1 to 3Type of organic soil material—slightly decomposed to highly decomposed plant
material
A horizon (if it occurs):Color—hue of 7.5YR to 2.5Y, value of 3 to 5, and chroma of 1 to 4Texture of the fine-earth fraction—loamy sand, coarse sandy loam, sandy loam,
or loam
Ap horizon:Color—hue of 7.5YR to 2.5Y, value of 4 to 6, and chroma of 2 to 4Texture of the fine-earth fraction—loamy sand, coarse sandy loam, sandy loam,
or loam
BE or E horizon (if it occurs):Color—hue of 10YR or 2.5Y, value of 5 to 8, and chroma of 1 to 6Texture of the fine-earth fraction—loamy sand, coarse sandy loam, sandy loam,
or loam
Bh horizon (if it occurs):Color—hue of 5YR to 10YR, value of 4 to 6, and chroma of 4 to 6Texture of the fine-earth fraction—loamy sand, coarse sandy loam, sandy loam,
or loam
BA horizon (if it occurs):Color—hue of 5YR to 10YR, value of 4 to 6, and chroma of 3 to 8Texture of the fine-earth fraction—coarse sandy loam, sandy loam, or loamMottles—discontinuous bands, patches, or variegations in shades of brown or
red
Bt horizon:Color—hue of 5YR to 10YR, value of 4 to 6, and chroma of 4 to 8Texture of the fine-earth fraction—coarse sandy loam, sandy loam, loam, or
sandy clay loamMottles—none to few discontinuous bands, patches, or variegations in shades of
brown or red
Soil Survey of Salem County, New Jersey
110
2Btx or Btx horizon:Color—hue of 2.5YR to 7.5YR, value of 4 to 6, and chroma of 4 to 8Texture of the fine-earth fraction—coarse sandy loam, sandy loam, or sandy clay
loamMottles—few to common discontinuous bands, patches, or variegations in shades
of brown or red
2BC or BC horizon (if it occurs):Color—hue of 2.5YR to 10YR, value of 4 to 6, and chroma of 4 to 8Texture of the fine-earth fraction—coarse sandy loam, sandy loam, loam, or
sandy clay loam; commonly stratifiedMottles—few to common discontinuous bands, patches, or variegations in shades
of brown or red
2C or C horizon:Color—hue of 2.5YR to 10YR, value of 4 to 6, and chroma of 4 to 8Texture of the fine-earth fraction—sand, loamy sand, loamy coarse sand, coarse
sandy loam, sandy loam, sandy clay loam, or stratified with these texturesMottles—few to common discontinuous bands, patches, or variegations in shades
of brown or red
Berryland SeriesDrainage class: Very poorly drainedPermeability: RapidLandscape: North Atlantic Coastal PlainLandform: Flats, depressions, and drainagewaysParent material: Sandy fluviomarine depositsSlope range: 0 to 2 percent
Taxonomic class: Sandy, siliceous, mesic Typic Alaquods
Typical Pedon
Berryland sand, in an area of Berryland and Mullica soils, 0 to 2 percent slopes,occasionally flooded, in Cape May County, New Jersey; 0.6 mile east of CedarSwamp Creek on Tuckahoe Road, 0.3 mile southeast on Butter Road to powerline, 1,200 feet south along the power line, in a wooded area; USGS Marmoratopographic quadrangle; lat. 39 degrees 15 minutes 10 seconds N. andlong. 74 degrees 41 minutes 31 seconds W.
Ag—0 to 11 inches; very dark gray (10YR 3/1) sand; weak fine granular structure;very friable; nonsticky, nonplastic; many fine roots; 5 percent rounded fine tocoarse quartzite fragments; extremely acid; clear wavy boundary.
Bh—11 to 19 inches; dark reddish brown (5YR 3/2) sand; massive; firm; nonsticky,nonplastic; common fine roots; organic stains on sand and gravel; extremely acid;clear irregular boundary.
Bg—19 to 32 inches; gray (5Y 6/1) sand; single grain; loose; nonsticky, nonplastic; fewfine roots; 15 percent medium distinct irregular pale yellow (5Y 8/3) masses ofaccumulated iron and manganese oxide with diffuse boundaries throughout;5 percent rounded fine to coarse quartzite fragments; very strongly acid; clearwavy boundary.
B'h—32 to 40 inches; dark reddish brown (5YR 2/2) sand; single grain; firm; nonsticky,nonplastic; few fine and medium roots; 12 percent rounded fine to coarsequartzite fragments; extremely acid; abrupt wavy boundary.
Cg1—40 to 44 inches; gray (10YR 6/1) sand; single grain; loose; nonsticky,nonplastic; very strongly acid; abrupt wavy boundary.
Soil Survey of Salem County, New Jersey
111
Cg2—44 to 80 inches; gray (10YR 6/1) stratified sand and sandy loam; single grain;loose; nonsticky, nonplastic; very strongly acid.
Range in Characteristics
Depth to bedrock: More than 72 inchesSeasonal high water table: Within a depth of 6 inchesDepth to spodic horizon: 10 to 16 inchesContent of rock fragments: 0 to 14 percent, by volume, throughout the profile; mostly
rounded quartzite gravelReaction: In unlimed areas, extremely acid to strongly acid throughout the profileOther features: One or more Bh horizons below the Bg horizon in some pedons;
same range in color, structure, and rupture resistance as described for the firstBh horizon; not included in series criteria
O horizon (if it occurs):Color—hue of 5YR to 10YR, value of 2 or 3, and chroma of 1 to 3Type of organic soil material—mucky peat or muck; may include a thin surface
layer of peat
A, Ag, or Ap horizon:Color—hue of 5YR to 2.5Y, value of 2 or 3, and chroma of 1 or 2 or is neutral with
value of 2 or 3Texture—coarse sand, sand, fine sand, or loamy sand; thin surface layer with
mucky or peaty texture modifiers in some pedons
Eg horizon (if it occurs):Color—hue of 10YR or 2.5Y, value of 5 or 6, and chroma of 1 or 2 or is neutral
with value of 5 or 6Texture—coarse sand, sand, fine sand, or loamy sand
Bh horizon:Color—hue of 5YR to 10YR, value of 2 to 4, and chroma of 2 to 4Texture—loamy sand or sandAdditional feature—firm nodules that range from noncemented to strongly
cemented and are hard or very hard when dry in some pedons
Bg horizon:Color—hue of 10YR to 5Y, value of 4 to 6, and chroma of 1 to 3 or is neutral with
value of 4 to 6Texture—loamy sand or sandRedoximorphic features—iron depletions in shades of olive, gray, or white and
masses of accumulated iron and manganese oxide in shades of red, brown,yellow, or olive
Cg horizon:Color—hue of 10YR to 5Y, value of 4 to 6, and chroma of 1 to 3Texture—sand or loamy sand; commonly stratified with finer textured material
below a depth of 40 inches
Broadkill SeriesDrainage class: Very poorly drainedPermeability: Moderate to rapidLandscape: North Atlantic Coastal PlainLandform: Tidal flatsParent material: Loamy marine depositsSlope range: 0 to 1 percent
Soil Survey of Salem County, New Jersey
112
Taxonomic class: Fine-silty, mixed, active, nonacid, mesic Typic Sulfaquents
Typical Pedon
Broadkill silt loam, in an area of Appoquinimink-Broadkill complex, 0 to 1 percentslopes, very frequently flooded, in Cumberland County, New Jersey; about 1,300 feetnorth of the bridge over the Maurice River at Mauricetown, 200 feet northwest of theriver, in a tidal marsh; USGS Port Elizabeth topographic quadrangle; lat. 39 degrees17 minutes 23 seconds N. and long. 74 degrees 59 minutes 18 seconds W.
Oe—0 to 6 inches; weak red (2.5YR 4/2) mucky peat; 25 percent fiber, rubbed;neutral; abrupt smooth boundary.
Ag—6 to 10 inches; very dark gray (10YR 3/1) silt loam; massive; very friable; slightlysticky, slightly plastic; many fine roots; neutral; gradual smooth boundary.
Cg1—10 to 30 inches; dark gray (5YR 4/1) silt loam; massive; friable; slightly sticky,slightly plastic; neutral; clear smooth boundary.
Cg2—30 to 45 inches; very dark gray (5YR 3/1) silty clay loam; massive; friable;moderately sticky, moderately plastic; neutral; clear smooth boundary.
2Cg—45 to 72 inches; dark gray (5Y 4/1) sandy loam; massive; friable; slightly sticky,slightly plastic; neutral.
Range in Characteristics
Depth to bedrock: More than 72 inchesSeasonal high water table: At the surface (January to December); flooded by tidal
waters twice dailyDepth to underlying organic layers: More than 40 inchesContent of rock fragments: None within a depth of 40 inches; 0 to 5 percent, by
volume, below 40 inchesElectrical conductivity throughout the profile: More than 16 millimhos per
centimeterReaction: Slightly acid to slightly alkaline when wet or moist; ultra acid or
extremely acid within a depth of 20 inches after moist incubationOther features: Jarosite mottles form in many pedons upon exposure of soil
material to air; n-value of 0.7 or more within a depth of 40 inches; n-valuevaries below 40 inches
O horizon:Color—hue of 7.5YR to 5Y, value of 2 to 4, and chroma of 1 or 2Type of organic soil material—mucky peat or peat; commonly, more than
60 percent live roots and stems
Ag horizon:Color—hue of 5YR to 5BG, value of 2 to 4, and chroma of 1 or 2 or is neutral
with value of 2 to 4Texture—silt loam, silty clay loam, silty clay, or the mucky analogs of these
texturesOrganic matter content—2 to 12 percent
Cg horizon:Color—hue of 5YR to 5BG, value of 2 to 7, and chroma of 1 or 2 or is neutral
with value of 2 to 7Texture above a depth of 40 inches—silt loam or silty clay loam; may contain
thin lenses of organic or coarse textured soil materialsTexture below 40 inches—silty clay loam, silt loam, loam, sandy loam, loamy
sand, or sand
Soil Survey of Salem County, New Jersey
113
Chicone SeriesDrainage class: Very poorly drainedPermeability: Moderate to rapidLandscape: North Atlantic Coastal PlainLandform: Flood plainsParent material: Silty alluvium over organic woody materialsSlope range: 0 to 1 percent
Taxonomic class: Coarse-silty, mixed, active, acid, mesic Thapto-Histic Fluvaquents
Typical Pedon
Chicone silt loam, in an area of Chicone silt loam, 0 to 1 percent slopes, frequentlyflooded, in Salem County, New Jersey; near Salem River, 1,264 feet northwest ofthe intersection of Sharptown-Auburn Road and Harding Highway, 1,552 feet southon Harding Highway, in a wooded area; USGS Woodstown topographic quadrangle;lat. 39 degrees 39 minutes 23.21 seconds N. and long. 75 degrees 22 minutes24.03 seconds W.
A—0 to 5 inches; brown (7.5YR 4/3) silt loam; moderate fine granular structure;friable; slightly sticky, slightly plastic; many fine and medium roots; 1 percent fineprominent irregular yellowish red (5YR 4/6) masses of accumulated iron andmanganese oxide with clear boundaries throughout; 1 percent fine faint irregularbrown (7.5YR 4/2) iron depletions with clear boundaries throughout; moderatelyacid; abrupt smooth boundary.
Cg1—5 to 20 inches; dark brown (7.5YR 3/2) silt loam; moderate medium subangularblocky structure; friable; slightly sticky, slightly plastic; common fine roots;1 percent fine distinct irregular brown (7.5YR 4/4) masses of accumulated ironand manganese oxide with clear boundaries throughout; moderately acid; abruptsmooth boundary.
Cg2—20 to 28 inches; dark brown (7.5YR 3/2) silt loam; moderate mediumsubangular blocky structure; friable; slightly sticky, slightly plastic; few fine roots;moderately acid; abrupt smooth boundary.
Oe—28 to 65 inches; black (10YR 2/1) mucky peat; massive; 20 percent fiber, rubbed;moderately acid; gradual smooth boundary.
C'g—65 to 80 inches; gray (10YR 6/1) sand; single grain; loose; strongly acid.
Range in Characteristics
Depth to bedrock: More than 80 inchesSeasonal high water table: Within a depth of 6 inchesContent of rock fragments: 0 to 1 percent, by volume, in the O horizon; 0 to 2 percent
in the A and Cg horizons; and 0 to 20 percent in the C'g horizon; mostly roundedquartzite gravel
Depth to buried organic soil materials: 16 to 40 inchesReaction: Extremely acid to strongly acid
A horizon:Color—hue of 10YR or 7.5YR, value of 2 to 4, and chroma of 1 to 3Texture—mucky silt loam, mucky loam, or silt loam
Cg horizon:Color—hue of 10YR or 7.5YR, value of 2 to 5, and chroma of 1 or 2 or is neutral
with value of 2 to 5
Soil Survey of Salem County, New Jersey
114
Texture—loam, silt loam, or mucky silt loam; thin layers of sandy loam or loam insome pedons
Oa or Oe horizon:Color—hue of 5YR to 10YR, value of 2 or 3, and chroma of 1 or is neutral with
value of 2 to 4Type of organic soil material—muck or mucky peatContent of mineral material—20 to 40 percent, by weight
C'g horizon:Color—hue of 10YR or 2.5Y, value of 6 or 7, and chroma of 1 or 2 or is neutral
with value of 4 to 8Texture of the fine-earth fraction—sand or loamy sand; thin layers of silt loam or
loam in some pedons
Chillum SeriesDrainage class: Well drainedPermeability: Moderate to rapidLandscape: North Atlantic Coastal PlainLandform: Upland terraces and broad ridgesParent material: Silty eolian deposits over loamy marine depositsSlope range: 0 to 5 percent
Taxonomic class: Fine-silty, mixed, semiactive, mesic Typic Hapludults
Typical Pedon
Chillum silt loam, in an area of Chillum silt loam, 2 to 5 percent slopes, in SalemCounty, New Jersey; 0.63 mile southeast of the intersection of Aldine-Pole TavernRoad and Doretown-Shirley Road, and 0.43 mile northwest of the intersection ofBridgeston-Pole Tavern Road and Newkirk Station Road, in a cultivated field; USGSElmer topographic quadrangle; lat. 39 degrees 36 minutes 19 seconds N. andlong. 75 degrees 14 minutes 37 seconds W.
Ap—0 to 10 inches; dark grayish brown (10YR 4/2) silt loam; strong medium andcoarse subangular blocky structure; friable; slightly sticky, slightly plastic; commonfine and medium roots; slightly acid; abrupt smooth boundary.
Bt1—10 to 15 inches; strong brown (7.5YR 5/6) silt loam; moderate medium andcoarse subangular blocky structure; friable; slightly sticky, slightly plastic; commonfine roots; 10 percent faint clay films; slightly acid; clear smooth boundary.
Bt2—15 to 28 inches; strong brown (7.5YR 4/6) silt loam; moderate medium andcoarse subangular blocky structure; friable; moderately sticky, moderately plastic;common fine roots; 10 percent faint clay films; very strongly acid; clear smoothboundary.
Bt3—28 to 34 inches; strong brown (7.5YR 5/6) silt loam; moderate mediumsubangular blocky structure; friable; slightly sticky, slightly plastic; common fineroots; 30 percent faint clay films; very strongly acid; clear smooth boundary.
Bt4—34 to 38 inches; strong brown (7.5YR 4/6) loam; weak medium subangularblocky structure; very friable; slightly sticky, slightly plastic; common fine roots;10 percent faint clay films; very strongly acid; clear smooth boundary.
2C1—38 to 61 inches; strong brown (7.5YR 5/6) sandy loam; massive; firm; nonsticky,nonplastic; 10 percent rounded fine to coarse quartzite fragments; very stronglyacid; clear smooth boundary.
2C2—61 to 66 inches; yellowish brown (10YR 5/6) sandy loam; massive; firm;nonsticky, nonplastic; 1 percent medium prominent irregular light gray (10YR 7/2)
Soil Survey of Salem County, New Jersey
115
iron depletions with diffuse boundaries throughout; 10 percent rounded fine tocoarse quartzite fragments; strongly acid; clear smooth boundary.
3C3—66 to 72 inches; yellowish red (5YR 5/8) sand; single grain; loose; nonsticky,nonplastic; 5 percent rounded fine to coarse quartzite fragments; strongly acid.
Range in Characteristics
Thickness of the solum: 20 to 40 inchesDepth to bedrock: More than 72 inchesDepth to a seasonal high water table: More than 72 inchesDepth to lithologic discontinuity (if it occurs): 15 to 40 inches to coarser textured
materialsContent of rock fragments: 0 to 60 percent, by volume, in the A and E horizons; 0 to
1 percent in the B horizon; and 10 to 80 percent in the 2C horizons; mostly quartzpebbles
Reaction: In unlimed areas, extremely acid to strongly acid throughout the profile
A or Ap horizon (if it occurs):Color—hue of 10YR, value of 3 or 4, and chroma of 1 to 3Texture of the fine-earth fraction—silt loam or loam
E horizon (if it occurs):Color—hue of 10YR, value of 4 to 6, and chroma of 3 to 5Texture of the fine-earth fraction—silt loam or loam
Bt horizon:Color—hue of 7.5YR or 10YR, value of 4 or 5, and chroma of 4 to 6Texture—silt loam or silty clay loam
C horizon:Color—hue of 5YR to 2.5Y, value of 4 to 7, and chroma of 3 to 6Texture of the fine-earth fraction—sand, sandy loam, or loam
Downer SeriesDrainage class: Well drainedPermeability: Moderately rapid and rapidLandscape: North Atlantic Coastal PlainLandform: Knolls and low hillsParent material: Loamy or gravelly fluviomarine deposits, or bothSlope range: 0 to 10 percent
Taxonomic class: Coarse-loamy, siliceous, semiactive, mesic Typic Hapludults
Typical Pedon
Downer loamy sand, in an area of Downer loamy sand, 0 to 5 percent slopes, inCumberland County, New Jersey; 1,650 feet west of the intersection of Trench Road(County Road 699) and Cubby Hollow Road, 660 feet north of Trench Road, in acultivated field; USGS Port Elizabeth topographic quadrangle; lat. 39 degrees22 minutes 30 seconds N. and long. 74 degrees 58 minutes 35 seconds W.
Ap—0 to 10 inches; dark grayish brown (10YR 4/2) loamy sand; weak fine granularstructure; very friable; nonsticky, nonplastic; many fine roots; slightly acid; abruptsmooth boundary.
BA—10 to 16 inches; yellowish brown (10YR 5/6) loamy sand; weak mediumsubangular blocky structure; very friable; nonsticky, nonplastic; common fineroots; slightly acid; clear wavy boundary.
Soil Survey of Salem County, New Jersey
116
Bt—16 to 36 inches; yellowish brown (10YR 5/6) sandy loam; weak mediumsubangular blocky structure; friable; nonsticky, nonplastic; common fine roots;clay bridging between sand grains; 5 percent rounded fine to coarse quartzitefragments; moderately acid; clear wavy boundary.
C1—36 to 48 inches; yellowish brown (10YR 5/6) loamy sand; single grain; loose;nonsticky, nonplastic; common fine roots; 10 percent rounded fine to coarsequartzite fragments; very strongly acid; clear smooth boundary.
C2—48 to 72 inches; 90 percent light yellowish brown (10YR 6/4) sand and10 percent strong brown (7.5YR 5/6) sandy loam lenses; single grain; loose;nonsticky, nonplastic; 10 percent rounded fine to coarse quartzite fragments; verystrongly acid.
Range in Characteristics
Depth to bedrock: More than 72 inchesDepth to a seasonal high water table: More than 72 inchesContent of rock fragments: 0 to 25 percent, by volume, throughout the profile; mostly
fine and medium quartzite pebbles, ironstone, or less commonly chert pebblesReaction: In unlimed areas, extremely acid to strongly acid throughout the profileOther features: Microsequence of A, E, and Bh horizons (micropodzol) typical in
undisturbed pedons; total thickness of A, E, and Bh microsequence less than6 inches; individual horizons less than 2 inches thick
O horizon (if it occurs):Color—hue of 7.5YR or 10YR, value of 3 or 4, and chroma of 1 or 2Type of organic soil material—moderately decomposed or highly decomposed
plant material
Ap or A horizon:Color—hue of 7.5YR to 2.5Y, value of 3 to 5, and chroma of 2 to 4Texture of the fine-earth fraction—loamy sand or sandy loam
E horizon (if it occurs):Color—hue of 7.5YR to 2.5Y, value of 5 to 7, and chroma of 1 to 6Texture of the fine-earth fraction—sand, loamy sand, or sandy loamThickness of horizon—less than 6 inches
Bh horizon (if it occurs):Color—hue of 5YR to 10YR, value of 4 to 6, and chroma of 4 to 6Texture of the fine-earth fraction—sandy loam or loamy sand
BA or BE horizon:Color—hue of 7.5YR to 2.5Y, value of 4 to 6, and chroma of 3 to 6Texture of the fine-earth fraction—sand, loamy sand, loamy coarse sand, or
sandy loam
Bt horizon:Color—hue of 7.5YR to 2.5Y, value of 4 to 6, and chroma of 4 to 8Texture of the fine-earth fraction—sandy loam; thin subhorizons of sandy clay
loam, loam, or loamy sand in some pedons
BC horizon (if it occurs):Color—hue of 7.5YR to 2.5Y, value of 4 to 6, and chroma of 4 to 8Texture of the fine-earth fraction—sand, loamy sand, or sandy loam; thin
subhorizons with coarser textures in some pedons
C horizon:Color—hue of 7.5YR to 2.5Y, value of 5 to 7, and chroma of 4 to 8; thin bands or
variegations in shades of these colors in some pedons
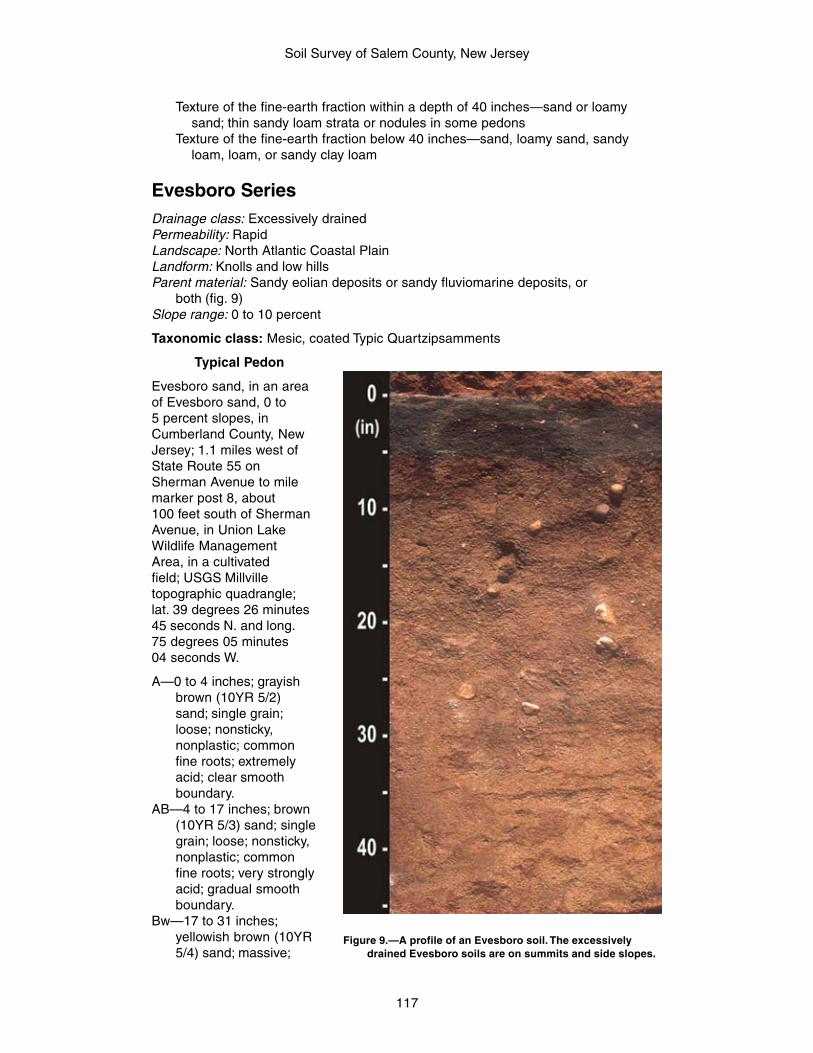
Soil Survey of Salem County, New Jersey
117
Texture of the fine-earth fraction within a depth of 40 inches—sand or loamysand; thin sandy loam strata or nodules in some pedons
Texture of the fine-earth fraction below 40 inches—sand, loamy sand, sandyloam, loam, or sandy clay loam
Evesboro SeriesDrainage class: Excessively drainedPermeability: RapidLandscape: North Atlantic Coastal PlainLandform: Knolls and low hillsParent material: Sandy eolian deposits or sandy fluviomarine deposits, or
both (fig. 9)Slope range: 0 to 10 percent
Taxonomic class: Mesic, coated Typic Quartzipsamments
Typical Pedon
Evesboro sand, in an areaof Evesboro sand, 0 to5 percent slopes, inCumberland County, NewJersey; 1.1 miles west ofState Route 55 onSherman Avenue to milemarker post 8, about100 feet south of ShermanAvenue, in Union LakeWildlife ManagementArea, in a cultivatedfield; USGS Millvilletopographic quadrangle;lat. 39 degrees 26 minutes45 seconds N. and long.75 degrees 05 minutes04 seconds W.
A—0 to 4 inches; grayishbrown (10YR 5/2)sand; single grain;loose; nonsticky,nonplastic; commonfine roots; extremelyacid; clear smoothboundary.
AB—4 to 17 inches; brown(10YR 5/3) sand; singlegrain; loose; nonsticky,nonplastic; commonfine roots; very stronglyacid; gradual smoothboundary.
Bw—17 to 31 inches;yellowish brown (10YR5/4) sand; massive;
Figure 9.—A profile of an Evesboro soil. The excessivelydrained Evesboro soils are on summits and side slopes.
Soil Survey of Salem County, New Jersey
118
very friable; nonsticky, nonplastic; common fine and medium roots; strongly acid;gradual smooth boundary.
C—31 to 80 inches; stratified loamy sand and sand, 50 percent light yellowish brown(10YR 6/4) and 50 percent yellowish brown (10YR 5/4); single grain; loose;nonsticky, nonplastic; common very fine roots; 3 percent rounded fine to coarsequartzite fragments; strongly acid.
Range in Characteristics
Thickness of the solum: 10 to 48 inchesDepth to bedrock: More than 80 inchesDepth to a seasonal high water table: More than 72 inchesContent of rock fragments: 0 to 25 percent, by volume, throughout the profile; mostly
rounded quartzose pebbles; layers with more than 15 percent gravel generallyless than 1 foot thick
Reaction: In unlimed areas, extremely acid or very strongly acid throughout the profile
O horizon (if it occurs):Type of organic soil material—slightly decomposed or moderately decomposed
plant material
A or Ap horizon:Color—hue of 10YR, value of 3 to 6, and chroma of 1 to 4Texture of the fine-earth fraction—sand
AB, BA, or E horizon:Color—hue of 10YR, value of 5 or 6, and chroma of 2 to 6Texture of the fine-earth fraction—sand
Bw horizon:Color—hue of 5YR to 2.5Y, value of 4 to 6, and chroma of 4 to 8Texture of the fine-earth fraction—sand or loamy sand
C horizon:Color—hue of 7.5YR to 2.5Y, value of 4 to 7, and chroma of 1 to 6Texture of the fine-earth fraction—stratified loamy sand to sand, sand, or loamy
sand; sandy loam at a depth of more than 40 inches in some pedons
Fallsington SeriesDrainage class: Poorly drainedPermeability: Moderate to rapidLandscape: North Atlantic Coastal PlainLandform: Flats and depressionsParent material: Loamy fluviomarine depositsSlope range: 0 to 2 percent
Taxonomic class: Fine-loamy, mixed, active, mesic Typic Endoaquults
Typical Pedon
Fallsington mucky peat, in an area of Othello and Fallsington soils, 0 to 2 percentslopes, in Cumberland County, New Jersey; 0.4 mile southwest of Center Groveon Cedarville Road, 30 feet north of the road, in a wooded area; USGS Cedarvilletopographic quadrangle; lat. 39 degrees 16 minutes 40 seconds N. andlong. 75 degrees 10 minutes 56 seconds W.
Oe—0 to 2 inches; dark reddish brown (5YR 2.5/2) mucky peat; moderate mediumgranular structure; very friable; many fine roots; extremely acid; abrupt smoothboundary.
Soil Survey of Salem County, New Jersey
119
A—2 to 5 inches; very dark brown (10YR 2/2) loam; moderate fine and mediumgranular structure; friable; nonsticky, nonplastic; many fine roots; 3 percentrounded fine to coarse quartzite fragments; extremely acid; clear smoothboundary.
E—5 to 8 inches; brown (10YR 5/3) sandy loam; moderate fine and mediumsubangular blocky structure; friable; nonsticky, nonplastic; many fine and mediumroots; 5 percent rounded fine to coarse quartzite fragments; extremely acid; clearsmooth boundary.
Btg1—8 to 14 inches; grayish brown (2.5Y 5/2) sandy loam; moderate mediumsubangular blocky structure; friable; slightly sticky, slightly plastic; common fineroots; 5 percent rounded fine to coarse quartzite fragments; very strongly acid;clear wavy boundary.
Btg2—14 to 31 inches; light brownish gray (2.5Y 6/2) sandy clay loam; moderatemedium subangular blocky structure; firm; moderately sticky, moderately plastic;15 percent medium prominent irregular yellowish brown (10YR 5/8) masses ofaccumulated iron and manganese oxide with clear boundaries throughout;10 percent rounded fine to coarse quartzite fragments; very strongly acid; abruptsmooth boundary.
Cg1—31 to 62 inches; light brownish gray (10YR 6/2) sand; single grain; loose;nonsticky, nonplastic; 5 percent rounded fine to coarse quartzite fragments; verystrongly acid; abrupt smooth boundary.
Cg2—62 to 80 inches; light brownish gray (10YR 6/2) gravelly sand; single grain;loose; nonsticky, nonplastic; 20 percent rounded fine to coarse quartzitefragments; very strongly acid.
Range in Characteristics
Depth to bedrock: More than 80 inchesSeasonal high water table: Within a depth of 12 inches (December to May)Content of rock fragments: 0 to 10 percent, by volume, throughout the profile; mostly
rounded or subrounded gravelReaction: In unlimed areas, extremely acid to strongly acid throughout the profile
O horizon:Color—hue of 5YR to 10YR, value of 2 to 4, and chroma of 1 to 3Type of organic soil material—peat ranging to muck
A or Ap horizon:Color—hue of 10YR to 5Y, value of 2 to 6, and chroma of 1 to 3Texture—sandy loam, fine sandy loam, very fine sandy loam, or loam
Eg or E horizon:Color—hue of 10YR to 5Y, value of 4 to 6, and chroma of 1 or 2 or is neutral
with value of 4 to 8Texture—sandy loam, fine sandy loam, very fine sandy loam, or loam
Btg or BCtg horizon:Color—hue of 10YR to 5Y, value of 3 to 7, and chroma of 1 or 2 or is neutral
with value of 4 to 8; value of 3 or 4 limited to a depth of more than30 inches
Texture—sandy clay loam, loam, or sandy loamRedoximorphic features—iron depletions in shades of olive, gray, or white and
masses of accumulated iron and manganese oxide in shades of red, brown,yellow, or olive
BCg horizon (if it occurs):Color—hue of 10YR to 5Y, value of 4 to 7, and chroma of 1 or 2 or is neutral
with value of 4 to 8
Soil Survey of Salem County, New Jersey
120
Texture—loamy sand, sandy loam, or sandy clay loam; stratified with layers ofvery fine sandy loam or fine sandy loam in some pedons; buried horizons inthe lower part of the substratum in some pedons
Redoximorphic features—iron depletions in shades of olive, gray, or white andmasses of accumulated iron and manganese oxide in shades of red, brown,yellow, or olive
C horizon (if it occurs):Color—hue of 10YR to 5Y, value of 4 to 7, and chroma of 3 or 4Texture—sand, loamy sand, sandy loam, or sandy clay loam; stratified with layers
of very fine sandy loam or fine sandy loam in some pedons; buried horizons inthe lower part of the substratum in some pedons
Redoximorphic features—iron depletions in shades of olive, gray, or white andmasses of accumulated iron and manganese oxide in shades of red, brown,yellow, or olive
Cg horizon:Color—hue of 10YR to 5Y, value of 4 to 7, and chroma of 1 or 2 or is neutral with
value of 4 to 8Texture—sand, loamy sand, sandy loam, or sandy clay loam; stratified with layers
of very fine sandy loam or fine sandy loam in some pedons; buried horizons inthe lower part of the substratum in some pedons
Redoximorphic features—iron depletions in shades of olive, gray, or white andmasses of accumulated iron and manganese oxide in shades of red, brown,yellow, or olive
FluvaquentsDrainage class: Somewhat poorly drainedPermeability: Moderate and moderately rapidLandscape: North Atlantic Coastal PlainLandform: Flood plainsParent material: Loamy alluviumSlope range: 0 to 3 percent
Taxonomic class: Fluvaquents
Typical Pedon
Fluvaquents, in an area of Fluvaquents, loamy, 0 to 3 percent slopes, frequentlyflooded, in Gloucester County, New Jersey; about 2.7 miles southwest onSwedesboro Road from the intersection of Swedesboro Road and Democrat Road,2.0 miles southeast of the intersection of Swedesboro Road and Tomlin Road onTomlin Road, 1,500 feet southwest along a railroad track, 100 feet south of therailroad track, in a wooded area; USGS Bridgeport topographic quadrangle;lat. 39 degrees 46 minutes 33 seconds N. and long. 75 degrees 16 minutes36 seconds W.
A—0 to 5 inches; very dark grayish brown (10YR 3/2) loam; moderate fine granularstructure; friable; 1 percent fine prominent red (2.5YR 4/6) masses ofaccumulated iron and manganese oxide; strongly acid; clear smooth boundary.
AB—5 to 12 inches; dark gray (10YR 4/1) silt loam; moderate fine granular structure;friable; 30 percent fine prominent red (2.5YR 4/6) masses of accumulated ironand manganese oxide; strongly acid; clear smooth boundary.
Bw1—12 to 18 inches; grayish brown (2.5Y 5/2) sandy clay loam; massive; friable;30 percent medium prominent yellowish red (5YR 4/6) masses of accumulatediron and manganese oxide; strongly acid; clear wavy boundary.
Soil Survey of Salem County, New Jersey
121
Bw2—18 to 24 inches; dark yellowish brown (10YR 4/6) sandy clay loam;massive; friable; 30 percent medium faint strong brown (7.5YR 4/6) massesof accumulated iron and manganese oxide; 15 percent medium prominentlight brownish gray (2.5Y 6/2) iron depletions; strongly acid; gradual wavyboundary.
C—24 to 50 inches; light brownish gray (2.5Y 6/2) sandy loam; massive; friable;30 percent medium prominent strong brown (7.5YR 4/6) masses of accumulatediron and manganese oxide; strongly acid.
Range in Characteristics
Thickness of the solum: 6 to 30 inches or moreDepth to bedrock: More than 50 inchesDepth to the seasonal high water table: 6 to 18 inches (September to May)Reaction: Very strongly acid to moderately acid
A horizon:Color—hue of 7.5YR to 2.5Y, value of 2 to 4, and chroma of 1 to 6Texture—variesRedoximorphic features—masses of accumulated iron and manganese oxide in
shades of dark redStructure—weak to moderate fine granular
AB horizon:Color—hue of 7.5YR to 2.5Y, value of 2 to 4, and chroma of 1 to 6Texture—variesRedoximorphic features—iron depletions in shades of light brownish gray and
masses of accumulated iron and manganese oxide in shades of strong brownto yellowish red
Structure—massive
Bw horizon:Color—hue of 7.5YR to 2.5Y, value of 3 to 5, and chroma of 3 to 6Texture—variesRedoximorphic features—iron depletions in shades of light brownish gray and
masses of accumulated iron and manganese oxide in shades of strong brownto yellowish red
Structure—massive
C horizon:Color—hue of 7.5YR to 2.5Y, value of 4 to 7, and chroma of 2 to 6Texture—variesRedoximorphic features—masses of accumulated iron and manganese oxide in
shades of dark brownStructure—massive
Fort Mott SeriesDrainage class: Well drainedPermeability: Moderately rapid and rapidLandscape: North Atlantic Coastal PlainLandform: Terraces and ridgesParent material: Sandy eolian deposits or fluviomarine deposits, or both
(fig. 10)Slope range: 0 to 5 percent
Taxonomic class: Loamy, siliceous, semiactive, mesic Arenic Hapludults
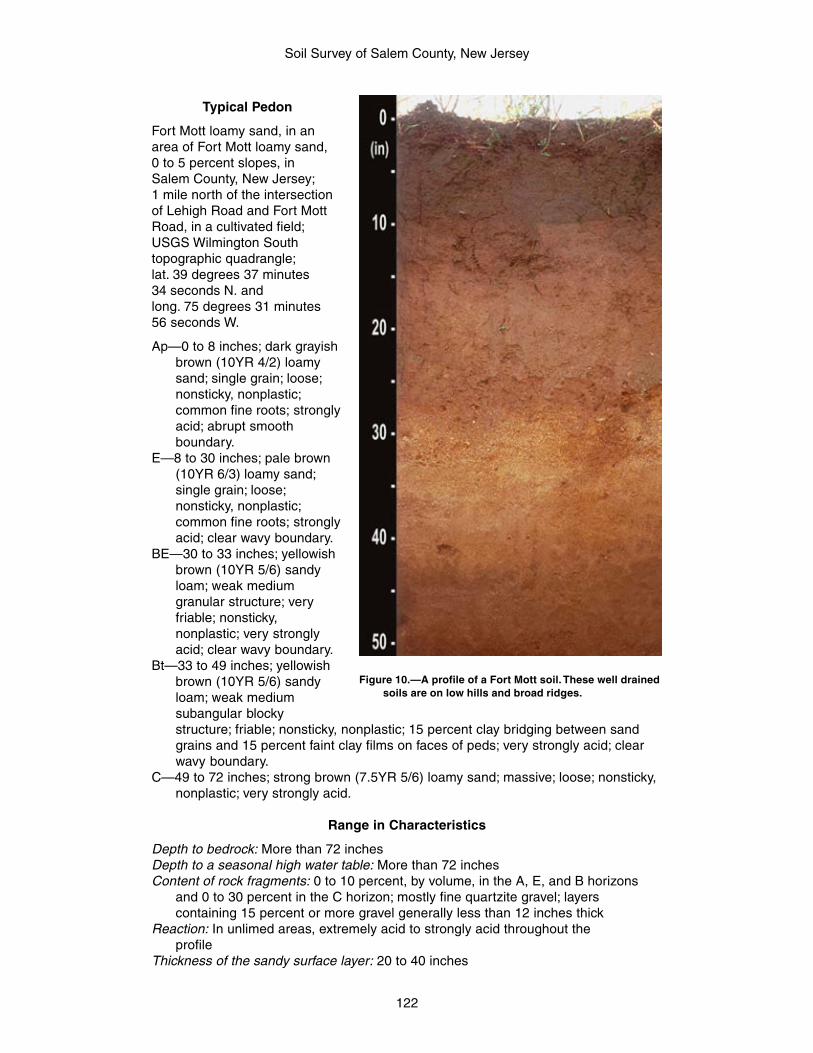
Soil Survey of Salem County, New Jersey
122
Typical Pedon
Fort Mott loamy sand, in anarea of Fort Mott loamy sand,0 to 5 percent slopes, inSalem County, New Jersey;1 mile north of the intersectionof Lehigh Road and Fort MottRoad, in a cultivated field;USGS Wilmington Southtopographic quadrangle;lat. 39 degrees 37 minutes34 seconds N. andlong. 75 degrees 31 minutes56 seconds W.
Ap—0 to 8 inches; dark grayishbrown (10YR 4/2) loamysand; single grain; loose;nonsticky, nonplastic;common fine roots; stronglyacid; abrupt smoothboundary.
E—8 to 30 inches; pale brown(10YR 6/3) loamy sand;single grain; loose;nonsticky, nonplastic;common fine roots; stronglyacid; clear wavy boundary.
BE—30 to 33 inches; yellowishbrown (10YR 5/6) sandyloam; weak mediumgranular structure; veryfriable; nonsticky,nonplastic; very stronglyacid; clear wavy boundary.
Bt—33 to 49 inches; yellowishbrown (10YR 5/6) sandyloam; weak mediumsubangular blockystructure; friable; nonsticky, nonplastic; 15 percent clay bridging between sandgrains and 15 percent faint clay films on faces of peds; very strongly acid; clearwavy boundary.
C—49 to 72 inches; strong brown (7.5YR 5/6) loamy sand; massive; loose; nonsticky,nonplastic; very strongly acid.
Range in Characteristics
Depth to bedrock: More than 72 inchesDepth to a seasonal high water table: More than 72 inchesContent of rock fragments: 0 to 10 percent, by volume, in the A, E, and B horizons
and 0 to 30 percent in the C horizon; mostly fine quartzite gravel; layerscontaining 15 percent or more gravel generally less than 12 inches thick
Reaction: In unlimed areas, extremely acid to strongly acid throughout theprofile
Thickness of the sandy surface layer: 20 to 40 inches
Figure 10.—A profile of a Fort Mott soil. These well drainedsoils are on low hills and broad ridges.
Soil Survey of Salem County, New Jersey
123
Other features: Microsequence of A, E, and Bh horizons (micropodzol) typical inpedons in wooded areas; total thickness of the A, E, and Bh horizons less than6 inches; individual horizons less than 2 inches thick; weighted average of clay inthe particle-size control section from 12 to 25 percent, typically 15 to 20 percent
O horizon (if it occurs):Color—hue of 5YR to 10YR, value of 2 to 4, and chroma of 1 to 3Type of organic soil material—highly decomposed to slightly decomposed plant
material
A horizon (if it occurs):Color—hue of 7.5YR to 2.5Y, value of 3 or 4, and chroma of 1 to 3Texture—fine sand, sand, or loamy sand
Ap horizon:Color—hue of 7.5YR to 2.5Y, value of 3 to 5, and chroma of 2 to 4Texture—fine sand, sand, or loamy sand
E or E' horizon:Color—hue of 7.5YR to 2.5Y, value of 5 or 6, and chroma of 1 to 6Texture—loamy fine sand, sand, or loamy sand
BE horizon:Color—hue of 7.5YR or 10YR, value of 4 to 6, and chroma of 4 to 8Texture—loamy sand, sandy loam, or fine sandy loam
Bh horizon (if it occurs):Color—hue of 5YR to 10YR, value of 4 or 5, and chroma of 3 to 6Texture—loamy sand or sandy loam
Bt horizon:Color—hue of 5YR to 10YR, value of 4 to 7, and chroma of 3 to 8Texture—fine sandy loam, sandy loam, loam, coarse sandy loam, or sandy clay
loam
BC horizon (if it occurs):Color—hue of 7.5YR or 10YR, value of 4 or 5, and chroma of 4 to 8Texture—loamy sand or sandy loam; thin subhorizons of sand in some pedons
C horizon:Color—hue of 7.5YR to 2.5Y, value of 4 to 8, and chroma of 3 to 8Texture of the fine-earth fraction—stratified sand, fine sand, loamy coarse sand,
or loamy sand including thin layers of sandy loam or fine sandy loam
Galestown SeriesDrainage class: Somewhat excessively drainedPermeability: RapidLandscape: North Atlantic Coastal PlainLandform: Broad ridges and upland terracesParent material: Sandy marine depositsSlope range: 0 to 5 percent
Taxonomic class: Siliceous, mesic Psammentic Hapludults
Typical Pedon
Galestown sand, in an area of Galestown sand, 0 to 5 percent slopes, in SalemCounty, New Jersey; 1.6 miles southeast of the intersection of Tattletown JerichoRoad and Route 49, about 0.3 mile southwest of Route 49, in a wooded area;
Soil Survey of Salem County, New Jersey
124
USGS Salem topographic quadrangle; lat. 39 degrees 32 minutes 04 seconds N. andlong. 75 degrees 22 minutes 57 seconds W.
Oi—0 to 2 inches; dark reddish brown (5YR 3/2) undecomposed organic material;abrupt smooth boundary.
E—2 to 4 inches; pale brown (10YR 6/3) sand; single grain; loose; nonsticky,nonplastic; many fine and medium roots; strongly acid; clear smooth boundary.
Bt1—4 to 18 inches; reddish yellow (7.5YR 6/6) loamy sand; single grain; loose;nonsticky, nonplastic; many very fine and fine roots; 10 percent faint clay films;strongly acid; clear smooth boundary.
Bt2—18 to 48 inches; reddish yellow (7.5YR 6/6) stratified loamy sand and sandyloam; weak medium subangular blocky structure; friable; nonsticky, nonplastic;common very fine and fine roots; 35 percent clay films and 35 percent claybridging between sand grains; very strongly acid; clear smooth boundary.
C—48 to 72 inches; pale brown (10YR 6/3) sand; single grain; loose; nonsticky,nonplastic; very strongly acid.
Range in Characteristics
Thickness of the solum: 30 to 60 inchesDepth to bedrock: More than 72 inchesDepth to a seasonal high water table: More than 72 inchesContent of rock fragments: 0 to 20 percent in the A and B horizons and 0 to
30 percent in the C horizon; mostly quartz pebblesContent of stones: 0 to 5 percent, by volume, in the A horizonReaction: In unlimed areas, extremely acid to strongly acid throughout the profile
O horizon:Color—hue of 5YR to 10YR, value of 2 to 4, and chroma of 1 to 3Type of organic soil material—highly decomposed to slightly decomposed plant
material
Ap horizon (if it occurs):Color—hue of 7.5YR to 2.5Y, value of 3 to 5, and chroma of 2 to 4Texture of the fine-earth fraction—loamy sand or sand
A horizon (if it occurs):Color—hue of 7.5YR to 2.5Y, value of 2 to 4, and chroma of 1 or 2Texture of the fine-earth fraction—loamy sand or sandNote—Horizon generally less than 4 inches thick
E horizon:Color—hue of 7.5YR to 2.5Y, value of 5 or 6, and chroma of 1 to 6Texture of the fine-earth fraction—loamy sand or sand
Bt horizon:Color—hue of 5YR to 2.5Y, value of 4 to 6, and chroma of 4 to 8Texture of the fine-earth fraction—loamy sand or sand
BC horizon:Color—hue of 5YR to 2.5Y, value of 4 to 8, and chroma of 4 to 8Texture of the fine-earth fraction—loamy sand or sand
C horizon:Color—hue of 7.5YR to 2.5Y, value of 4 to 8, and chroma of 3 to 8Texture of the fine-earth fraction—sand or loamy sand; texture varies below a
depth of 65 inches; thin strata of finer textured material in some pedons
Soil Survey of Salem County, New Jersey
125
Galloway SeriesDrainage class: Somewhat poorly drainedPermeability: RapidLandscape: North Atlantic Coastal PlainLandform: Flats, terraces, and depressionsParent material: Unconsolidated sandy marine depositsSlope range: 0 to 5 percent
Taxonomic class: Mesic, coated Aquic Quartzipsamments
Typical Pedon
Galloway loamy sand, in an area of Galloway loamy sand, 0 to 5 percent slopes, inCumberland County, New Jersey; 0.1 mile south of the intersection of Ackley Roadand Buckshutem Road on Buckshutem Road, 50 feet east of road, in theEdward G. Bevan Wildlife Management Area, in a cultivated field; USGS DividingCreek topographic quadrangle; lat. 39 degrees 18 minutes 48 seconds N. andlong. 75 degrees 00 minutes 34 seconds W.
Ap—0 to 9 inches; dark grayish brown (10YR 4/2) loamy sand; single grain; loose;nonsticky, nonplastic; many fine roots; slightly acid; abrupt smooth boundary.
Bw—9 to 28 inches; light yellowish brown (10YR 6/4) loamy sand; single grain;loose; nonsticky, nonplastic; 70 percent silt coatings on sand and gravel;1 percent fine distinct irregular brownish yellow (10YR 6/6) masses ofaccumulated iron and manganese oxide with diffuse boundaries throughout;moderately acid; clear smooth boundary.
Cg1—28 to 58 inches; pale yellow (2.5Y 8/2) gravelly sand; single grain; loose;nonsticky, nonplastic; 15 percent medium prominent irregular light yellowishbrown (10YR 6/4) masses of accumulated iron and manganese oxide with clearboundaries throughout; 20 percent rounded fine to medium quartzite fragments;very strongly acid; abrupt smooth boundary.
Cg2—58 to 72 inches; white (2.5Y 8/1) sand; single grain; loose; nonsticky,nonplastic; 5 percent rounded fine to coarse quartzite fragments; very stronglyacid.
Range in Characteristics
Thickness of the solum: 35 to 44 inchesDepth to bedrock: More than 72 inchesDepth to the seasonal high water table: 24 to 48 inches (December to April)Reaction: In unlimed areas, extremely acid to strongly acid throughout the profileContent of rock fragments: 0 to 5 percent, by volume, in the O, A, E, and B horizons
and 0 to 35 percent in the C horizon; mostly fine rounded quartzite gravelOther features: Thin microsequence of A, E, and Bh horizons in some pedons; total
thickness of the A, E, and Bh horizons less than 5 inches; individual horizons lessthan 2 inches thick
O horizon (if it occurs):Color—hue of 5YR to 10YR, value of 2 to 4, and chroma of 1 to 3Type of organic soil material—highly decomposed to slightly decomposed plant
material
A or Ap horizon:Color—hue of 10YR or 2.5Y, value of 3 to 6, and chroma of 1 to 4Texture—loamy sand or sand
Soil Survey of Salem County, New Jersey
126
E horizon (if it occurs):Color—hue of 10YR or 2.5Y, value of 5 or 6, and chroma of 1 to 3Texture—loamy sand or sand
Bh horizon (if it occurs):Color—hue of 5YR or 7.5YR, value of 4 to 6, and chroma of 4 to 6Texture—loamy sand
Bw horizon:Color—hue of 7.5YR to 5Y, value of 5 to 7, and chroma of 3 to 6Texture—loamy sand in the upper part of the horizon and loamy sand or sand in
the lower partRedoximorphic features—iron depletions in shades of gray between depths of
24 and 40 inches and masses of accumulated iron and manganese oxide inshades of red, brown, yellow, or olive
Cg horizon:Color—hue of 10YR to 5Y, value of 5 to 7, and chroma of 1 or 2 or is neutral in
hue and has value of 5 to 7Redoximorphic features—iron depletions in shades of gray and masses of
accumulated iron and manganese oxide in shades of red, brown, yellow, orolive
Texture of the fine-earth fraction—loamy sand or sand
Hammonton SeriesDrainage class: Moderately well drainedPermeability: Moderately rapid and rapidLandscape: North Atlantic Coastal PlainLandform: Depressions and flatsParent material: Coarse-loamy fluviomarine depositsSlope range: 0 to 5 percent
Taxonomic class: Coarse-loamy, siliceous, semiactive, mesic Aquic Hapludults
Typical Pedon
Hammonton sandy loam, in an area of Hammonton sandy loam, 0 to 2 percentslopes, in Salem County, New Jersey; 0.8 mile southeast of the intersection ofRoute 130 and Perkintown Road, 200 feet southwest of Perkintown Road, in acultivated field; USGS Marcus Hook topographic quadrangle; lat. 39 degrees45 minutes 28 seconds N. and long. 75 degrees 26 minutes 10 seconds W.
Ap—0 to 10 inches; dark grayish brown (10YR 4/2) sandy loam; moderate mediumgranular structure; friable; nonsticky, nonplastic; many fine roots; moderately acid;abrupt smooth boundary.
Bt1—10 to 16 inches; brownish yellow (10YR 6/6) sandy loam; moderate medium andcoarse subangular blocky structure; friable; nonsticky, nonplastic; common fineroots; patchy faint clay films and patchy faint clay bridging between sand grains;moderately acid; clear smooth boundary.
Bt2—16 to 25 inches; yellowish brown (10YR 5/6) sandy loam; moderate mediumsubangular blocky structure; friable; nonsticky, nonplastic; common fine roots;patchy faint clay films and patchy faint clay bridging between sand grains; verystrongly acid; clear smooth boundary.
Bt3—25 to 34 inches; yellowish brown (10YR 5/6) sandy loam; weak mediumsubangular blocky structure; friable; nonsticky, nonplastic; clay bridging betweensand grains; 10 percent medium prominent irregular light brownish gray (10YR
Soil Survey of Salem County, New Jersey
127
6/2) iron depletions with clear boundaries throughout; very strongly acid; clearwavy boundary.
C—34 to 58 inches; yellowish brown (10YR 5/4) sand; single grain; loose; nonsticky,nonplastic; 15 percent medium distinct irregular light brownish gray (10YR 6/2)iron depletions with clear boundaries throughout; very strongly acid; clear smoothboundary.
Cg—58 to 72 inches; light brownish gray (10YR 6/2) sand; loose; nonsticky,nonplastic; 1 percent medium faint irregular white (10YR 8/1) iron depletions withclear boundaries throughout; 1 percent medium prominent irregular yellowishbrown (10YR 5/6) masses of accumulated iron and manganese oxide with clearboundaries throughout; very strongly acid.
Range in Characteristics
Depth to bedrock: More than 72 inchesDepth to the seasonal high water table: 18 to 42 inches (December to May)Content of rock fragments: 0 to 20 percent, by volume, in the A and B horizons and
0 to 40 percent in the C horizon; mostly quartzite pebblesReaction: In unlimed areas, extremely acid to strongly acid throughout the profileOther features: Microsequence of A, E, and Bh horizons (micropodzol) typical in
wooded areas; total thickness of microsequence less than 6 inches; individualhorizons less than 2 inches thick
O horizon (if it occurs):Color—hue of 5YR to 10YR, value of 2 to 4, and chroma of 1 to 4Type of organic soil material—highly decomposed to slightly decomposed plant
material
A horizon (if it occurs):Color—hue of 10YR to 5Y, value of 3 or 4, and chroma of 1 to 4 or is neutral with
value of 3 to 6Texture of the fine-earth fraction—loamy sand or sandy loamNote—horizon 2 to 6 inches thick
Ap horizon:Color—hue of 10YR to 5Y, value of 3 to 6, and chroma of 2 to 4 or is neutral with
value of 3 to 6Texture of the fine-earth fraction—loamy sand or sandy loam
BE or E horizon (if it occurs):Color—hue of 10YR to 5Y, value of 4 to 7, and chroma of 2 to 8Texture of the fine-earth fraction—loamy sand or sandy loam
Bh horizon (if it occurs):Color—hue of 5YR to 10YR, value of 4 to 6, and chroma of 3 to 6Texture of the fine-earth fraction—loamy sand or sandy loam
Bt horizon:Color—hue of 7.5YR to 5Y, value of 4 to 7, and chroma of 3 to 8Texture of the fine-earth fraction—commonly sandy loam; thin subhorizons of
sandy clay loam or loamy sand in some pedonsRedoximorphic features—iron depletions in shades of olive, gray, or white and
masses of accumulated iron and manganese oxide in shades of red, brown,yellow, or olive
Btg horizon (if it occurs):Color—hue of 7.5YR to 5Y, value of 4 to 7, and chroma of 1 or 2 or is neutral with
value of 4 to 7
Soil Survey of Salem County, New Jersey
128
Texture of the fine-earth fraction—dominantly sandy loam; thin subhorizons ofsandy clay loam or loamy sand in some pedons
Redoximorphic features—iron depletions in shades of olive, gray, or white andmasses of accumulated iron and manganese oxide in shades of red, brown,yellow, or olive
BC horizon (if it occurs):Color—hue of 7.5YR to 5Y, value of 4 to 8, and chroma of 3 to 8Texture of the fine-earth fraction—loamy sand or sandy loam; thin subhorizons of
sandy clay loam in some pedons
BCg horizon (if it occurs):Color—hue of 7.5YR to 5Y, value of 4 to 8, and chroma of 1 or 2 or is neutral with
value of 4 to 8Texture of the fine-earth fraction—loamy sand or sandy loam; thin subhorizons of
sandy clay loam in some pedons
C horizon:Color—hue of 7.5YR to 5Y, value of 5 to 8, and chroma of 3 to 8Texture of the fine-earth fraction above a depth of 40 inches—loamy sand or
sand; thin strata of sandy clay loam in some pedonsTexture of the fine-earth fraction below a depth of 40 inches—sand, coarse sand,
loamy coarse sand, loamy sand, sandy loam, loam, or sandy clay loamRedoximorphic features—iron depletions in shades of olive, gray, or white and
masses of accumulated iron and manganese oxide in shades of red, brown,yellow, or olive
Cg horizon:Color—hue of 7.5YR to 5Y, value of 5 to 8, and chroma of 1 or 2 or is neutral with
value of 4 to 8Texture of the fine-earth fraction above a depth of 40 inches—commonly loamy
sand or sand; thin strata of sandy clay loam in some pedonsTexture of the fine-earth fraction below a depth of 40 inches—commonly sand,
loamy sand, sandy loam, loam, or sandy clay loam; thin strata of sandy clay insome pedons
Redoximorphic features—iron depletions in shades of olive, gray, or white andmasses of accumulated iron and manganese oxide in shades of red, brown,yellow, or olive
Keyport SeriesDrainage class: Moderately well drained (fig. 11)Permeability: Very slowLandscape: North Atlantic Coastal PlainLandform: Flats, depressions, and knollsParent material: Clayey marine depositsSlope range: 5 to 10 percent
Taxonomic class: Fine, mixed, semiactive, mesic Aquic Hapludults
Typical Pedon
Keyport loam, in an area of Keyport loam, 5 to 10 percent slopes, in Salem County,New Jersey; about 0.5 mile southeast of the intersection of Woodstown Road andHarrisonville Ferrel Road and 1 mile southwest of the intersection of HarrisonvilleFerrel Road and Lincoln Mill Road, in a cultivated field; USGS Woodstowntopographic quadrangle; lat. 39 degrees 40 minutes 47.43 seconds N. andlong. 75 degrees 15 minutes 36.01 seconds W.
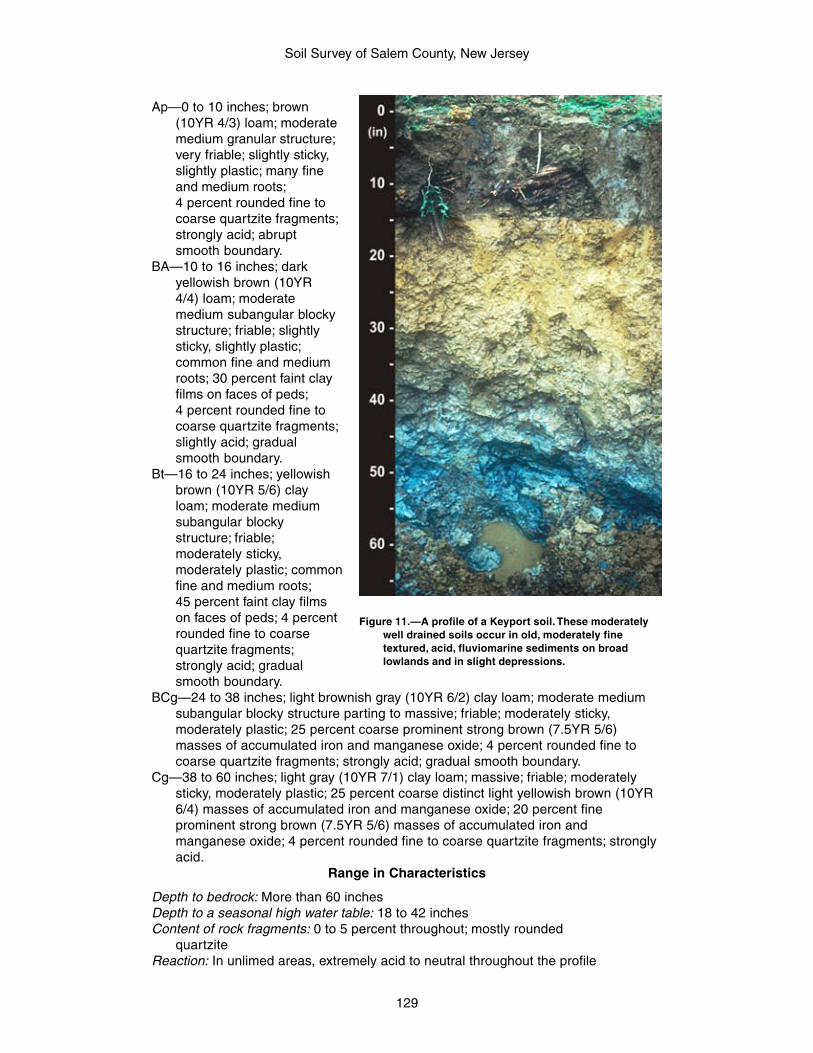
Soil Survey of Salem County, New Jersey
129
Ap—0 to 10 inches; brown(10YR 4/3) loam; moderatemedium granular structure;very friable; slightly sticky,slightly plastic; many fineand medium roots;4 percent rounded fine tocoarse quartzite fragments;strongly acid; abruptsmooth boundary.
BA—10 to 16 inches; darkyellowish brown (10YR4/4) loam; moderatemedium subangular blockystructure; friable; slightlysticky, slightly plastic;common fine and mediumroots; 30 percent faint clayfilms on faces of peds;4 percent rounded fine tocoarse quartzite fragments;slightly acid; gradualsmooth boundary.
Bt—16 to 24 inches; yellowishbrown (10YR 5/6) clayloam; moderate mediumsubangular blockystructure; friable;moderately sticky,moderately plastic; commonfine and medium roots;45 percent faint clay filmson faces of peds; 4 percentrounded fine to coarsequartzite fragments;strongly acid; gradualsmooth boundary.
BCg—24 to 38 inches; light brownish gray (10YR 6/2) clay loam; moderate mediumsubangular blocky structure parting to massive; friable; moderately sticky,moderately plastic; 25 percent coarse prominent strong brown (7.5YR 5/6)masses of accumulated iron and manganese oxide; 4 percent rounded fine tocoarse quartzite fragments; strongly acid; gradual smooth boundary.
Cg—38 to 60 inches; light gray (10YR 7/1) clay loam; massive; friable; moderatelysticky, moderately plastic; 25 percent coarse distinct light yellowish brown (10YR6/4) masses of accumulated iron and manganese oxide; 20 percent fineprominent strong brown (7.5YR 5/6) masses of accumulated iron andmanganese oxide; 4 percent rounded fine to coarse quartzite fragments; stronglyacid.
Range in Characteristics
Depth to bedrock: More than 60 inchesDepth to a seasonal high water table: 18 to 42 inchesContent of rock fragments: 0 to 5 percent throughout; mostly rounded
quartziteReaction: In unlimed areas, extremely acid to neutral throughout the profile
Figure 11.—A profile of a Keyport soil. These moderatelywell drained soils occur in old, moderately finetextured, acid, fluviomarine sediments on broadlowlands and in slight depressions.
Soil Survey of Salem County, New Jersey
130
O horizon (if it occurs):Type of organic soil material—slightly decomposed or moderately decomposed
plant material
A or Ap horizon:Color—hue of 10YR or 2.5Y, value of 4 to 6, and chroma of 2 to 4Texture—sandy loam, loam, or sandy clay loam
Bt horizon:Color—hue of 5YR to 2.5Y, value of 4 to 7, and chroma of 1 to 8 or is neutral
with value of 4 to 7Texture—clay, silty clay, clay loam, or silty clay loamRedoximorphic features (if they occur)—masses of accumulated iron and
manganese oxide in shades of red, yellow, or brown and iron depletions inshades of gray
BCg horizon:Color—hue of 10YR to 5Y, value of 2 to 7, and chroma of 1 to 8 or is neutral
with value of 2 to 7Texture—clay, silty clay, clay loam, or silty clay loamRedoximorphic features (if they occur)—masses of accumulated iron and
manganese oxide in shades of red, yellow, or brown and iron depletions inshades of gray
Cg horizon:Color—hue of 10YR to 5Y, value of 2 to 7, and chroma of 1 to 8 or is neutral
with value of 2 to 7Texture—silty clay loam, clay loam, or stratified silty clay loam to loamy sandRedoximorphic features (if they occur)—masses of accumulated iron and
manganese oxide in shades of red, yellow, or brown and iron depletions inshades of gray
Manahawkin SeriesDrainage class: Very poorly drainedPermeability: RapidLandscape: North Atlantic Coastal PlainLandform: Flood plains and swampsParent material: Organic, woody material over sandy alluviumSlope range: 0 to 2 percent
Taxonomic class: Sandy or sandy-skeletal, siliceous, dysic, mesic TerricHaplosaprists
Typical Pedon
Manahawkin muck, in an area of Manahawkin muck, 0 to 2 percent slopes,frequently flooded, in Salem County, New Jersey; near Pittsgrove, northwest ofParvin State Park, south of Centerton Pond, 0.5 mile south of the intersection ofRoutes 553 and 540, about 200 yards southeast of Route 553, in a wooded area;USGS Elmer topographic quadrangle; lat. 39 degrees 31 minutes 29 seconds N.and long. 75 degrees 10 minutes 08 seconds W.
Oa1—0 to 7 inches; black (10YR 2/1) muck; moderate medium granular structure;10 percent fiber, unrubbed; 2 percent fiber, rubbed; many fine roots; extremelyacid; clear smooth boundary.
Oa2—7 to 28 inches; very dark brown (10YR 2/2) muck; weak medium granularstructure; 10 percent fiber, unrubbed; 2 percent fiber, rubbed; common fine roots;very strongly acid; clear smooth boundary.
Soil Survey of Salem County, New Jersey
131
Oa3—28 to 39 inches; very dark brown (10YR 2/2) muck; massive; 15 percent fiber,unrubbed; 2 percent fiber, rubbed; 10 percent fine to coarse wood fragments;very strongly acid; abrupt smooth boundary.
Cg1—39 to 46 inches; grayish brown (10YR 5/2) gravelly sand; single grain; loose;nonsticky, nonplastic; 20 percent rounded fine to coarse quartzite fragments;very strongly acid; abrupt smooth boundary.
Cg2—46 to 72 inches; gray (10YR 6/1) gravelly sand; single grain; loose; nonsticky,nonplastic; 20 percent rounded fine to coarse quartzite fragments; very stronglyacid.
Range in Characteristics
Depth to bedrock: More than 72 inchesSeasonal high water table: Within a depth of 6 inches (October to July)Thickness of the organic horizons: 16 to 51 inches of mostly sapric materialMineral content of the organic horizons: 5 to 80 percentContent of woody fragments: 0 to 50 percent, by volume, in the organic layers; mostly
twigs, branches, or logs that range in size from 1/8 inch to 20 inches in diameterand completely break down when rubbed or crushed
Content of rock fragments: 0 to 50 percent, by volume, in the Cg horizon; mostly finepebbles
Reaction: Extremely acid or very strongly acid in the surface layer and verystrongly acid or strongly acid in the lower organic horizons and in the mineralsubstratum
Other features: Subhorizons or a surface layer of hemic material up to 10 inches thickin some pedons
Oa horizon:Color—hue of 5YR to 10YR, value of 2 or 3, and chroma of 1 or 2 or is neutral
with value of 2 or 3; similar colors when broken face and rubbed but may differone or two units in value or chroma
Type of organic soil material—typically muck (sapric material) but includesindividual layers of mucky peat (hemic material), especially at the surface
Cg horizon:Color—hue of 7.5YR or 10YR, value of 2 to 5, and chroma of 1 to 4 or is neutral
with value of 2 to 5Texture of the fine-earth fraction—sand, fine sand, loamy sand, or loamy fine
sand
Mannington SeriesDrainage class: Very poorly drainedPermeability: Moderately slow and moderateLandscape: North Atlantic Coastal PlainLandform: Tidal flats (fig. 12)Parent material: Silty estuarine deposits over organic, herbaceous materialsSlope range: 0 to 1 percent
Taxonomic class: Fine-silty, mixed, active, nonacid, mesic Thapto-HisticHydraquents
Typical Pedon
Mannington mucky silt loam, in an area of Mannington-Nanticoke complex, 0 to1 percent slopes, very frequently flooded, in Salem County, New Jersey; 0.75 milesouth of the state boat ramp, off Hook Road in Kates Creek Meadow, in an estuarinetidal marsh; USGS Penns Grove topographic quadrangle; lat. 39 degrees 37 minutes43 seconds N. and long. 75 degrees 28 minutes 41 seconds W.
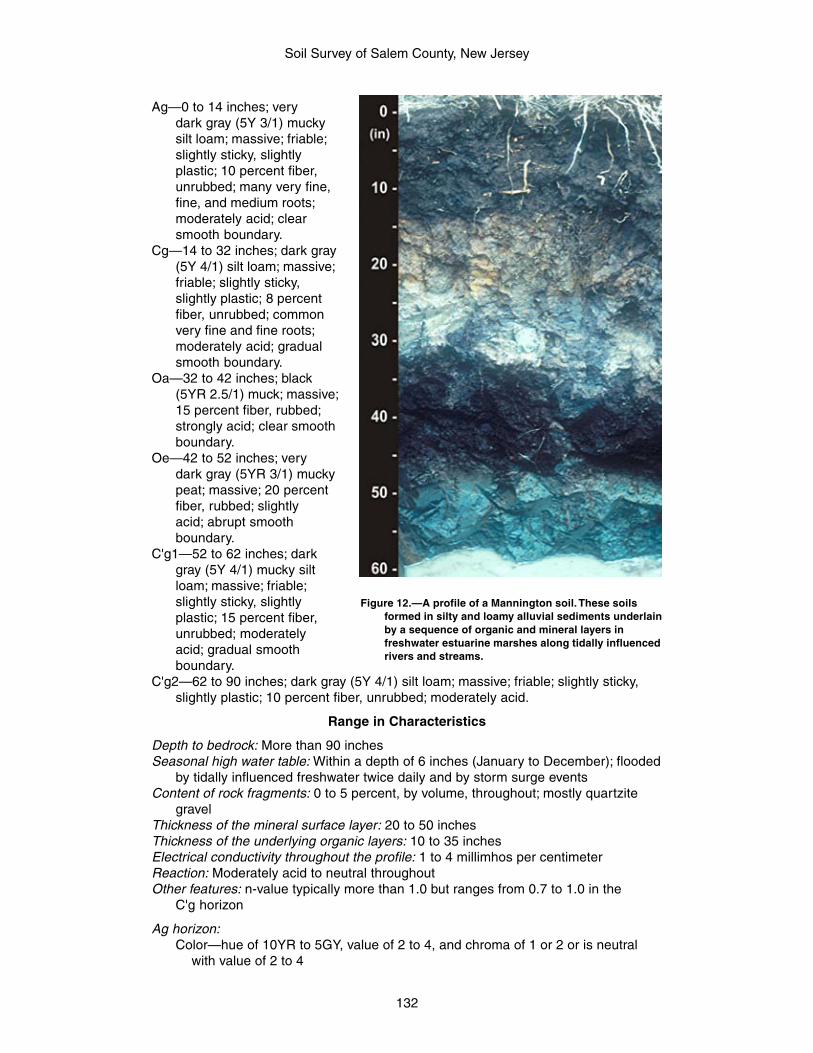
Soil Survey of Salem County, New Jersey
132
Ag—0 to 14 inches; verydark gray (5Y 3/1) muckysilt loam; massive; friable;slightly sticky, slightlyplastic; 10 percent fiber,unrubbed; many very fine,fine, and medium roots;moderately acid; clearsmooth boundary.
Cg—14 to 32 inches; dark gray(5Y 4/1) silt loam; massive;friable; slightly sticky,slightly plastic; 8 percentfiber, unrubbed; commonvery fine and fine roots;moderately acid; gradualsmooth boundary.
Oa—32 to 42 inches; black(5YR 2.5/1) muck; massive;15 percent fiber, rubbed;strongly acid; clear smoothboundary.
Oe—42 to 52 inches; verydark gray (5YR 3/1) muckypeat; massive; 20 percentfiber, rubbed; slightlyacid; abrupt smoothboundary.
C'g1—52 to 62 inches; darkgray (5Y 4/1) mucky siltloam; massive; friable;slightly sticky, slightlyplastic; 15 percent fiber,unrubbed; moderatelyacid; gradual smoothboundary.
C'g2—62 to 90 inches; dark gray (5Y 4/1) silt loam; massive; friable; slightly sticky,slightly plastic; 10 percent fiber, unrubbed; moderately acid.
Range in Characteristics
Depth to bedrock: More than 90 inchesSeasonal high water table: Within a depth of 6 inches (January to December); flooded
by tidally influenced freshwater twice daily and by storm surge eventsContent of rock fragments: 0 to 5 percent, by volume, throughout; mostly quartzite
gravelThickness of the mineral surface layer: 20 to 50 inchesThickness of the underlying organic layers: 10 to 35 inchesElectrical conductivity throughout the profile: 1 to 4 millimhos per centimeterReaction: Moderately acid to neutral throughoutOther features: n-value typically more than 1.0 but ranges from 0.7 to 1.0 in the
C'g horizon
Ag horizon:Color—hue of 10YR to 5GY, value of 2 to 4, and chroma of 1 or 2 or is neutral
with value of 2 to 4
Figure 12.—A profile of a Mannington soil. These soilsformed in silty and loamy alluvial sediments underlainby a sequence of organic and mineral layers infreshwater estuarine marshes along tidally influencedrivers and streams.
Soil Survey of Salem County, New Jersey
133
Texture—silt loam or mucky silt loamRedoximorphic features—iron depletions in shades of white or gray and masses
of accumulated iron and manganese oxide in shades of red, brown, yellow, orolive
Organic matter content—2 to 12 percent
Cg horizon:Color—hue of 7.5YR to 5GY, value of 3 to 6, and chroma of 1 or 2 or is neutral
with value of 4 to 6Texture—silt loam, mucky silt loam, or silty clay loamRedoximorphic features—iron depletions in shades of white or gray and masses
of accumulated iron and manganese oxide in shades of red, brown, yellow, orolive
Organic matter content—2 to 12 percent
Oa or Oe horizon:Color—hue of 5YR to 10YR, value of 2 or 3, and chroma of 1 or 2 or is neutral
with value of 2 or 3Type of organic soil material—muck or mucky peat (sapric or hemic soil material)Mineral matter content—10 to 50 percent
C'g horizon:Color—hue of 10YR to 5GY, value of 3 to 6, and chroma of 1 or 2 or is neutral
with value of 4 to 6Texture—silt loam, mucky silt loam, or silty clay loam; thin strata of sandy loam,
fine sandy loam, or very fine sandy loam in some pedons; less than 1-inch-thick strata of sand or organic material in other pedons
Redoximorphic features—iron depletions in shades of white or gray and massesof accumulated iron and manganese oxide in shades of red, brown, yellow, orolive
Organic matter content—2 to 12 percent
Marlton SeriesDrainage class: Moderately well drainedPermeability: Slow to moderateLandscape: North Atlantic Coastal PlainLandform: RidgesParent material: Glauconitic clayey marine depositsSlope range: 2 to 10 percent
Taxonomic class: Fine, glauconitic, mesic Oxyaquic Hapludults
Taxadjunct statement: The Marlton soils in Salem County are taxadjuncts to theseries because they generally do not have iron depletions with chroma of 2 or lessand value of 4 or more in the upper 24 inches of the argillic horizon.
Typical Pedon
Marlton silt loam, in an area of Marlton silt loam, 2 to 5 percent slopes, in SalemCounty, New Jersey; 1.25 miles north of Route 40 on Sharptown Auburn Road,0.15 mile east of the road, in a cultivated field; USGS Woodstown topographicquadrangle; lat. 39 degrees 40 minutes 42 seconds N. and long. 75 degrees22 minutes 04 seconds W.
Ap—0 to 8 inches; dark grayish brown (2.5Y 4/2) silt loam; moderate fine granularstructure; friable; slightly sticky, slightly plastic; many medium roots; moderatelyacid; abrupt smooth boundary.
Soil Survey of Salem County, New Jersey
134
BAt—8 to 11 inches; light olive brown (2.5Y 5/6) silt loam; strong fine and mediumsubangular blocky structure; friable; slightly sticky, slightly plastic; common fineroots; 30 percent faint clay films; moderately acid; clear wavy boundary.
2Bt1—11 to 16 inches; olive yellow (2.5Y 6/6) clay; strong medium prismaticstructure; friable; very sticky, very plastic; common fine roots; 70 percent faint clayfilms; 10 percent fine prominent irregular olive (5Y 5/4) and yellowish red (5Y 5/8)masses of accumulated iron and manganese oxide with clear boundariesthroughout; very strongly acid; gradual wavy boundary.
2Bt2—16 to 28 inches; dark olive gray (5Y 3/2) clay; strong coarse prismaticstructure; friable; very sticky, very plastic; common fine roots; 80 percent faint clayfilms; 15 percent fine prominent irregular yellowish red (5YR 5/8) nodules of ironand manganese oxide with clear boundaries throughout; very strongly acid;gradual smooth boundary.
2C—28 to 72 inches; dark olive gray (5Y 3/2) sandy loam; massive; friable; nonsticky,slightly plastic; very strongly acid.
Range in Characteristics
Depth to bedrock: More than 72 inchesDepth to the seasonal high water table: 18 to 42 inches (October to June)Content of rock fragments: 0 to 20 percent, by volume, throughout; mostly quartzite
with occasional ironstone, mostly fine or medium in size; thin strata with 20 to35 percent fragments in the subsoil in some pedons
Reaction: In unlimed areas, extremely acid to strongly acid throughout; stratified blackor greenish black layers within the C horizon may be ultra acid upon exposure toair
Content of glauconite: 2 to 20 percent pellets, by volume, in the A horizon and morethan 20 percent in the B and C horizons
Ap or A horizon:Color—hue of 5Y to 10YR, value of 3 or 4, and chroma of 2 to 4Texture of the fine-earth fraction—sandy loam, fine sandy loam, loam, or silt
loam
BA or BE horizon:Color—hue of 5Y to 10YR, value of 4 to 6, and chroma of 2 to 4Texture of the fine-earth fraction—sandy loam, fine sandy loam, loam, or silt loam
2Bt horizon:Color—hue of 2.5Y or 5Y, value of 3 to 5, and chroma of 3 to 6 or hue of 5GY to
5G, value of 2.5 to 6, and chroma of 1 or 2Texture of the fine-earth fraction—clay, sandy clay, or sandy clay loamRedoximorphic features—masses of accumulated iron and manganese oxide in
shades of red, yellow, brown, or olive and iron depletions in shades of olive orbrown; gray or grayish brown iron depletions with chroma of 2 or less in thelower part of the 2Bt horizon, 24 inches below the upper boundary, in somepedons; difficult to distinguish iron depletions in most pedons because of themasking effects of the dark olive and dark greenish parent materials
2BC horizon (if it occurs):Color—hue of 2.5Y or 5Y, value of 3 to 5, and chroma of 3 to 6 or hue of 5GY to
5G, value of 2.5 to 6, and chroma of 1 or 2Texture of the fine-earth fraction—sandy clay, sandy clay loam, loam, or sandy
loamRedoximorphic features—masses of accumulated iron and manganese oxide in
shades of red, yellow, brown, or olive and iron depletions in shades of olive orbrown; gray or grayish brown iron depletions with chroma of 2 or less in some
Soil Survey of Salem County, New Jersey
135
pedons; difficult to distinguish iron depletions in most pedons because ofmasking effects of the dark olive and dark greenish parent material
2C horizon:Color—hue of 2.5Y or 5Y, value of 3 to 5, and chroma of 3 to 6 or hue of 10Y to
5G, value of 2.5 to 6, and chroma of 1 or 2Texture of the fine-earth fraction—sandy loam, sandy clay loam, sandy clay, or
clay and is commonly stratified with sandy texturesRedoximorphic features (if they occur)—masses of accumulated iron and
manganese oxide in shades of red, yellow, brown, or olive and iron depletionsin shades of olive or brown; gray or grayish brown iron depletions with chromaof 2 or less in some pedons; difficult to distinguish iron depletions in mostpedons because of the masking effects of the dark olive and dark greenishparent materials
Matapeake SeriesDrainage class: Well drainedPermeability: Moderate and moderately rapidLandscape: North Atlantic Coastal PlainLandform: Broad ridges, upland flats, and upland terracesParent material: Silty eolian deposits over marine deposits or silty eolian deposits
over coarse fluviomarine deposits, or bothSlope range: 0 to 10 percent
Taxonomic class: Fine-silty, mixed, semiactive, mesic Typic Hapludults
Typical Pedon
Matapeake silt loam, in an area of Matapeake silt loam, 0 to 2 percent slopes, inSalem County, New Jersey; in Hopewell, 1.1 miles east of the intersection ofButtonwood Road and Cohansey Road, 100 feet north of Buttonwood Road, in acultivated field; USGS Elmer topographic quadrangle; lat. 39 degrees 35 minutes36 seconds N. and long. 75 degrees 12 minutes 30 seconds W.
Ap—0 to 10 inches; dark yellowish brown (10YR 4/4) silt loam; moderate fine granularstructure; friable; slightly sticky, slightly plastic; strongly acid; clear smoothboundary.
Bt1—10 to 25 inches; yellowish brown (10YR 5/6) silt loam; moderate mediumsubangular blocky structure; friable; slightly sticky, slightly plastic; 15 percent faintclay films; moderately acid; clear smooth boundary.
Bt2—25 to 33 inches; strong brown (7.5YR 5/6) silt loam; moderate mediumsubangular blocky structure; friable; slightly sticky, slightly plastic; 15 percent faintclay films; moderately acid; abrupt smooth boundary.
2C1—33 to 50 inches; brownish yellow (10YR 6/6) stratified sandy loam and loamysand; massive; friable; nonsticky, nonplastic; moderately acid; clear smoothboundary.
2C2—50 to 72 inches; brownish yellow (10YR 6/6) sand; single grain; loose;nonsticky, nonplastic; moderately acid.
Range in Characteristics
Thickness of the solum: 24 to 60 inchesDepth to bedrock: More than 72 inchesDepth to a seasonal high water table: Dominantly more than 72 inches; an apparent
seasonal high water table at a depth of 48 to 72 inches in some pedons atelevations of less than 25 feet
Soil Survey of Salem County, New Jersey
136
Depth to lithologic discontinuity: 30 to 40 inchesContent of rock fragments: Less than 5 percent, by volume, in the A and
Bt horizons and 0 to 10 percent in the 2BC and 2C horizons; mostly quartzpebbles
Reaction: In unlimed areas, extremely acid to strongly acid throughoutOther features: Transition from the fine-silty Bt horizon to the sandy 2C horizon
more than 5 inches thick
Ap horizon:Color—hue of 10YR or 2.5Y, value of 4 to 6, and chroma of 2 to 6Texture—silt loam, loam, or fine sandy loam
A horizon (if it occurs):Color—hue of 10YR or 2.5Y, value of 3 or 4, and chroma of 1 to 3; value of 3 or
less if horizon less than 7 inches thickTexture—silt loam, loam, or fine sandy loam
E horizon (if it occurs):Color—hue of 10YR or 2.5Y, value of 5 or 6, and chroma of 4 to 6Texture—silt loam, loam, or fine sandy loam
Bt horizon:Color—hue of 7.5YR or 10YR, value of 4 or 5, and chroma of 4 to 8Texture—silt loam or silty clay loam
2BC horizon (if it occurs):Color—hue of 7.5YR or 10YR, value of 4 to 6, and chroma of 4 to 8Texture—loam, fine sandy loam, or sandy loam
2C horizon:Color—hue of 5YR to 5Y, value of 4 to 7, and chroma of 3 to 8; streaks of clean
sand with chroma of 3 or less in some pedonsTexture—fine sandy loam, sandy loam, loamy fine sand, loamy sand, or sand;
thin gravelly strata less than 1 foot thick in some pedons
Mattapex SeriesDrainage class: Moderately well drainedPermeability: Moderate to rapidLandscape: North Atlantic Coastal PlainLandform: Upland terraces, upland flats, and broad ridgesParent material: Silty eolian deposits over coarser fluviomarine depositsSlope range: 0 to 5 percent
Taxonomic class: Fine-silty, mixed, active, mesic Aquic Hapludults
Typical Pedon
Mattapex silt loam, in an area of Mattapex silt loam, 0 to 2 percent slopes, in SalemCounty, New Jersey; 1.2 miles southeast of the intersection of Harmersville PecksCorner Road and Tattletown Jericho Road, 0.5 mile west of Tattletown Jericho Road,south of dirt road, in a cultivated field; USGS Elmer topographic quadrangle;lat. 39 degrees 35 minutes 31 seconds N. and long. 75 degrees 12 minutes30 seconds W.
Ap—0 to 7 inches; dark yellowish brown (10YR 4/4) silt loam; weak medium granularstructure; friable; slightly sticky, slightly plastic; many fine and medium roots;slightly acid; clear smooth boundary.
Soil Survey of Salem County, New Jersey
137
Bt1—7 to 18 inches; brownish yellow (10YR 6/6) silt loam; weak medium subangularblocky structure; friable; slightly sticky, slightly plastic; common fine and mediumroots; 15 percent faint clay films; moderately acid; clear smooth boundary.
Bt2—18 to 33 inches; yellowish brown (10YR 5/6) silty clay loam; moderate mediumsubangular blocky structure; friable; slightly sticky, slightly plastic; common veryfine and fine roots; 15 percent faint clay films; moderately acid; gradual smoothboundary.
Bt3—33 to 40 inches; yellowish brown (10YR 5/6) silty clay loam; moderate mediumsubangular blocky structure; friable; moderately sticky, moderately plastic;common very fine and fine roots; 15 percent faint clay films; 10 percent mediumprominent irregular light brownish gray (10YR 6/2) iron depletions with clearboundaries throughout; moderately acid; gradual smooth boundary.
2C—40 to 72 inches; yellowish brown (10YR 5/6) loamy sand; single grain; loose;nonsticky, nonplastic; 10 percent medium prominent irregular light brownish gray(10YR 6/2) iron depletions with clear boundaries throughout; moderately acid.
Range in Characteristics
Thickness of the solum: 24 to 48 inchesDepth to bedrock: More than 72 inchesDepth to a seasonal high water table: 18 to 36 inches (January to April)Depth to lithologic discontinuity: 30 to 50 inchesContent of rock fragments: 0 to 5 percent, by volume, throughout; individual horizons,
generally less than 12 inches thick, range to 20 percentReaction: In unlimed areas, extremely acid to strongly acid throughout the profile
A or Ap horizon:Color—hue of 10YR or 2.5Y, value of 3 to 5, and chroma of 1 to 4Texture—silt loam, loam, or fine sandy loam
E or BE horizon (if it occurs):Color—hue of 10YR or 2.5Y, value of 5 or 6, and chroma of 3 or 4Texture—silt loam, loam, or fine sandy loamRedoximorphic features—masses of accumulated iron and manganese oxide in
shades of red, brown, yellow, or olive
Bt horizon:Color—hue of 7.5YR to 2.5Y, value of 5 or 6, and chroma of 3 to 8Texture—silt loam or silty clay loam, with 18 to 30 percent clay and more than
50 percent silt in the particle-size control sectionRedoximorphic features—iron depletions in shades of olive, gray, or white and
masses of accumulated iron and manganese oxide in shades of red, brown,yellow, or olive
Btg horizon (if it occurs):Color—hue of 10YR to 5Y, value of 5 to 7, and chroma of 1 or 2Texture—silt loam or silty clay loamRedoximorphic features—iron depletions in shades of olive, gray, or white and
masses of accumulated iron and manganese oxide in shades of red, brown,yellow, or olive
2BC horizon (if it occurs):Color—hue of 10YR or 2.5Y, value of 5 or 6, and chroma of 3 to 6Texture—loam, fine sandy loam, sandy clay loam, or loamy sandRedoximorphic features—iron depletions in shades of olive or gray and masses
of accumulated iron and manganese oxide in shades of red, brown, yellow, orolive
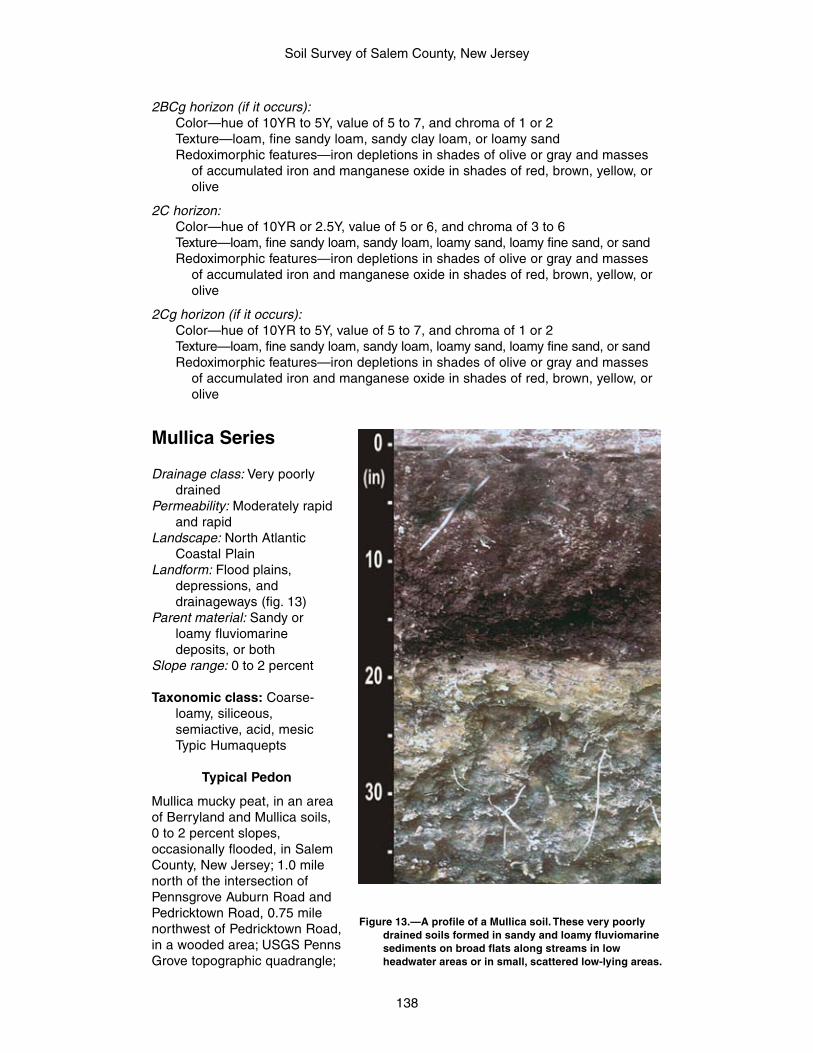
Soil Survey of Salem County, New Jersey
138
2BCg horizon (if it occurs):Color—hue of 10YR to 5Y, value of 5 to 7, and chroma of 1 or 2Texture—loam, fine sandy loam, sandy clay loam, or loamy sandRedoximorphic features—iron depletions in shades of olive or gray and masses
of accumulated iron and manganese oxide in shades of red, brown, yellow, orolive
2C horizon:Color—hue of 10YR or 2.5Y, value of 5 or 6, and chroma of 3 to 6Texture—loam, fine sandy loam, sandy loam, loamy sand, loamy fine sand, or sandRedoximorphic features—iron depletions in shades of olive or gray and masses
of accumulated iron and manganese oxide in shades of red, brown, yellow, orolive
2Cg horizon (if it occurs):Color—hue of 10YR to 5Y, value of 5 to 7, and chroma of 1 or 2Texture—loam, fine sandy loam, sandy loam, loamy sand, loamy fine sand, or sandRedoximorphic features—iron depletions in shades of olive or gray and masses
of accumulated iron and manganese oxide in shades of red, brown, yellow, orolive
Mullica Series
Drainage class: Very poorlydrained
Permeability: Moderately rapidand rapid
Landscape: North AtlanticCoastal Plain
Landform: Flood plains,depressions, anddrainageways (fig. 13)
Parent material: Sandy orloamy fluviomarinedeposits, or both
Slope range: 0 to 2 percent
Taxonomic class: Coarse-loamy, siliceous,semiactive, acid, mesicTypic Humaquepts
Typical Pedon
Mullica mucky peat, in an areaof Berryland and Mullica soils,0 to 2 percent slopes,occasionally flooded, in SalemCounty, New Jersey; 1.0 milenorth of the intersection ofPennsgrove Auburn Road andPedricktown Road, 0.75 milenorthwest of Pedricktown Road,in a wooded area; USGS PennsGrove topographic quadrangle;
Figure 13.—A profile of a Mullica soil. These very poorlydrained soils formed in sandy and loamy fluviomarinesediments on broad flats along streams in lowheadwater areas or in small, scattered low-lying areas.
Soil Survey of Salem County, New Jersey
139
lat. 39 degrees 44 minutes 09 seconds N. and long. 75 degrees 26 minutes23 seconds W.
Oa—0 to 4 inches; dark reddish brown (5YR 3/2) muck; massive; extremely acid;abrupt smooth boundary.
Ag—4 to 20 inches; very dark gray (10YR 3/1) sandy loam; moderate mediumsubangular blocky structure; friable; nonsticky, nonplastic; common fine andmedium roots; extremely acid; clear smooth boundary.
Bg1—20 to 28 inches; dark grayish brown (10YR 4/2) sandy loam; moderate mediumsubangular blocky structure; friable; nonsticky, nonplastic; common very fine andfine roots; extremely acid; clear smooth boundary.
Bg2—28 to 34 inches; dark yellowish brown (10YR 3/4) sandy loam; moderatemedium subangular blocky structure; friable; nonsticky, nonplastic; common veryfine and fine roots; 1 percent medium distinct irregular dark grayish brown (10YR4/2) iron depletions with diffuse boundaries throughout; very strongly acid; abruptsmooth boundary.
Cg1—34 to 40 inches; light brownish gray (10YR 6/2) loamy sand; single grain; loose;nonsticky, nonplastic; 15 percent fine prominent irregular yellowish brown (10YR5/6) masses of accumulated iron and manganese oxide with clear boundariesthroughout; very strongly acid; abrupt smooth boundary.
Cg2—40 to 45 inches; light brownish gray (10YR 6/2) sandy clay loam; massive;friable; slightly sticky, slightly plastic; 15 percent fine prominent irregular darkyellowish brown (10YR 4/6) masses of accumulated iron and manganeseoxide with clear boundaries throughout; very strongly acid; abrupt smoothboundary.
Cg3—45 to 72 inches; light brownish gray (10YR 6/2) loamy sand; single grain; loose;nonsticky, nonplastic; very strongly acid.
Range in Characteristics
Thickness of the solum: 20 to 40 inchesDepth to bedrock: More than 72 inchesSeasonal high water table: Within a depth of 6 inchesContent of rock fragments: 0 to 15 percent, by volume, in the A, E, and B horizons
and 0 to 35 percent in the C horizon; mostly fine pebblesReaction: In unlimed areas, extremely acid or very strongly acid throughout the
profile
Oi horizon (if it occurs):Type of organic soil material—peat (fibric soil materials) or slightly decomposed
woody plant material
Oe or Oa horizon:Color—hue of 5YR to 10YR, value of 3 to 6, and chroma of 1 or 2 or is neutral
with value of 4 to 6Type of organic soil material—mucky peat (hemic soil materials) or muck (sapric
soil materials)
Ag or Ap horizon:Color—hue of 10YR to 5Y, value of 2 or 3, and chroma of 1 or 2 or is neutral with
value of 2 or 3Texture of the fine-earth fraction—loam, sandy loam, or loamy sandOrganic matter content—2 to 20 percent
Eg or BEg horizon (if it occurs):Color—hue of 10YR to 5Y, value of 4 to 6, and chroma of 1 or 2 or is neutral with
value of 4 to 6Texture of the fine-earth fraction—sandy loam or loamy sand
Soil Survey of Salem County, New Jersey
140
Bg horizon:Color—hue of 10YR to 5Y, value of 3 to 6, and chroma of 1 or 2 or is neutral with
value of 3 to 6Texture of the fine-earth fraction—sandy loam; thin strata of loamy sand or sandy
clay loam in some pedonsRedoximorphic features—iron depletions in shades of olive, gray, or white and
masses of accumulated iron and manganese oxide in shades of red, brown,yellow, or olive
BCg horizon (if it occurs):Color—hue of 10YR to 5Y, value of 3 to 6, and chroma 1 or 2 or is neutral with
value of 3 to 6Texture of the fine-earth fraction—sandy loam or loamy sand; thin strata of loam
or sandy clay loam in some pedonsRedoximorphic features—iron depletions in shades of olive, gray, or white and
masses of accumulated iron and manganese oxide in shades of red, brown,yellow, or olive
Cg horizon:Color—hue of 10YR or 2.5Y, value of 3 to 6, and chroma of 1 or 2 or is neutral
with value of 3 to 6Texture of the fine-earth fraction—dominantly sand or loamy sand, but thin strata
of sandy loam or sandy clay loam common below a depth of 40 inchesRedoximorphic features—iron depletions in shades of olive, gray, or white and
masses of accumulated iron and manganese oxide in shades of red, brown,yellow, or olive
Muttontown SeriesDrainage class: Moderately well drainedPermeability: Moderately rapid and rapidLandscape: North Atlantic Coastal PlainLandform: Shallow depressions, terraces, and flatsParent material: Sandy or loamy fluviomarine deposits, or bothSlope range: 0 to 2 percent
Taxonomic class: Coarse-loamy, mixed, semiactive, mesic Aquic Hapludults
Typical Pedon
Muttontown sandy loam, in an area of Muttontown sandy loam, 0 to 2 percent slopes,in Salem County, New Jersey; near Woodmere, 800 feet east of the intersection ofPerry Road and Hamersville Pecks Corner Road, 0.45 mile north of Pecks CornerRoad, in a wooded area; USGS Salem topographic quadrangle; lat. 39 degrees30 minutes 34 seconds N. and long. 75 degrees 24 minutes 12 seconds W.
Oe—0 to 2 inches; dark brown (7.5YR 3/4) moderately decomposed plant material;weak fine granular structure; many fine roots; slightly acid; abrupt smoothboundary.
A1—2 to 3 inches; very dark grayish brown (10YR 3/2) sandy loam; weak mediumsubangular blocky structure; friable; slightly sticky, slightly plastic; common fineand medium roots; slightly acid; gradual smooth boundary.
A2—3 to 7 inches; dark grayish brown (10YR 4/2) sandy loam; weak mediumsubangular blocky structure; friable; slightly sticky, slightly plastic; common fineand medium roots; slightly acid; gradual smooth boundary.
Bt1—7 to 20 inches; light yellowish brown (10YR 6/4) sandy loam; moderatemedium subangular blocky structure; friable; slightly sticky, slightly plastic;
Soil Survey of Salem County, New Jersey
141
common fine, medium, and coarse roots; 15 percent faint clay films and30 percent clay bridging between sand grains; moderately acid; gradual smoothboundary.
Bt2—20 to 38 inches; yellowish brown (10YR 5/8) sandy clay loam; moderate mediumsubangular blocky structure; friable; slightly sticky, slightly plastic; common fineand medium roots; 30 percent faint clay films and 30 percent clay bridgingbetween sand grains; 15 percent fine prominent irregular light brownish gray(10YR 6/2) iron depletions with clear boundaries throughout; 15 percent finedistinct irregular yellowish brown (10YR 5/6) masses of accumulated iron andmanganese oxide with clear boundaries throughout; moderately acid; gradualsmooth boundary.
BC—38 to 57 inches; light gray (10YR 7/1) stratified sandy loam and sandy clay loam;weak medium subangular blocky structure parting to moderate mediumsubangular blocky; friable; slightly sticky, slightly plastic; 15 percent mediumprominent irregular yellowish brown (10YR 5/6) masses of accumulated iron andmanganese oxide with clear boundaries throughout; moderately acid; gradualsmooth boundary.
C—57 to 72 inches; light gray (10YR 7/1) sandy clay; moderate medium subangularblocky structure; friable; slightly sticky, slightly plastic; 15 percent mediumprominent irregular brownish yellow (10YR 6/6) and strong brown (7.5YR 5/6)masses of accumulated iron and manganese oxide with clear boundariesthroughout; moderately acid.
Range in Characteristics
Depth to bedrock: More than 72 inchesDepth to a seasonal high water table: 18 to 42 inches (January to April)Content of rock fragments: 0 to 10 percent, by volume, throughout the profile; mostly
quartzite gravelReaction: In unlimed areas, extremely acid to strongly acid throughout the profile
Oe or Oa horizon:Color—hue of 7.5YR or 10YR, value of 2 or 3, and chroma of 1 or 2Type of organic soil material—highly decomposed or moderately decomposed
plant material
A or AB horizon:Color—hue of 10YR or 2.5Y, value of 3 to 5, and chroma of 1 to 4Texture—loamy sand or sandy loam
BA or BE horizon (if it occurs):Color—hue of 7.5YR to 2.5Y, value of 4 or 5, and chroma of 2 to 4Texture—loamy sand or sandy loam
Bt horizon:Color—hue of 7.5YR to 2.5Y, value of 4 to 6, and chroma of 4 to 8Texture—loamy sand, sandy loam, or sandy clay loamRedoximorphic features—iron depletions in shades of white or gray and masses
of accumulated iron and manganese oxide in shades of red, brown, yellow, orolive
BC horizon:Color—hue of 7.5YR to 2.5Y, value of 4 to 7, and chroma of 3 to 8Texture—sandy loam, sandy clay loam, sandy clay, or stratified with these
texturesRedoximorphic features (if they occur)—iron depletions in shades of white or gray
and masses of accumulated iron and manganese oxide in shades of red,brown, yellow, or olive
Soil Survey of Salem County, New Jersey
142
BCg horizon (if it occurs):Color—hue of 7.5YR to 2.5Y, value of 4 to 7, and chroma of 1 or 2 or is neutral
with value of 4 to 7Texture—sandy loam, sandy clay loam, sandy clay, or stratified with these
texturesRedoximorphic features—iron depletions in shades of white or gray and masses
of accumulated iron and manganese oxide in shades of red, brown, yellow, orolive
C horizon:Color—hue of 7.5YR to 2.5Y, value of 4 to 7, and chroma of 3 to 6Texture—sandy clay loam, sandy clay, or stratified sandy clay loam and sandy
clayRedoximorphic features (if they occur)—iron depletions in shades of white or gray
and masses of accumulated iron and manganese oxide in shades of red,brown, yellow, or olive
Cg horizon (if it occurs):Color—hue of 7.5YR to 5Y, value of 4 to 7, and chroma of 1 or 2 or is neutral with
value of 4 to 7Texture—sandy loam, sandy clay loam, sandy clay, or stratified with these
texturesRedoximorphic features (if they occur)—iron depletions in shades of white or gray
and masses of accumulated iron and manganese oxide in shades of red,brown, yellow, or olive
Nanticoke SeriesDrainage class: Very poorly drainedPermeability: Moderately slowLandscape: North Atlantic Coastal PlainLandform: Tidal flatsParent material: Silty estuarine depositsSlope range: 0 to 1 percent
Taxonomic class: Fine-silty, mixed, active, nonacid, mesic Typic Hydraquents
Typical Pedon
Nanticoke mucky silt loam, in an area of Mannington-Nanticoke complex, 0 to1 percent slopes, very frequently flooded, in Salem County, New Jersey; 1.5 mileswest of Slapes Corner, 0.5 mile northwest of Mt. Zion Church Cemetery, in the middleof Pine Island Meadow, in an estuarine tidal marsh; USGS Canton topographicquadrangle; lat. 39 degrees 28 minutes 27 seconds N. and long. 75 degrees27 minutes 58 seconds W.
Ag—0 to 5 inches; very dark gray (10YR 3/1) mucky silt loam; massive; friable; slightlysticky, slightly plastic; 10 percent fiber, unrubbed; moderately acid; clear smoothboundary.
Cg1—5 to 50 inches; very dark gray (5Y 3/1) silt loam; massive; friable; slightly sticky,slightly plastic; 5 percent fiber, unrubbed; moderately acid; gradual smoothboundary.
Cg2—50 to 80 inches; dark gray (5Y 4/1) silt loam; massive; friable; slightly sticky,slightly plastic; moderately acid.
Range in Characteristics
Depth to bedrock: More than 80 inches
Soil Survey of Salem County, New Jersey
143
High water table: Within a depth of 6 inches (January to December); flooded by tidallyinfluenced fresh water twice daily and by storm surge events
Content of rock fragments: Less than 2 percent, by volume, throughout the profileReaction: Moderately acid to neutral throughoutElectrical conductivity throughout the profile: 1 to 4 millimhos per centimeterOther features: n-value typically more than 1.0 but ranges from 0.7 to 1.0 in the lower
part of the Cg horizon
Ag horizon:Color—hue of 10YR to 5GY, value of 2 or 3, and chroma of 1 or 2 or is neutral
with value of 2 to 4Texture—silt loam or mucky silt loamOrganic matter content—3 to 10 percent
Cg horizon:Color—hue of 2.5Y to 5GY, value of 3 or 4, and chroma of 1 or 2 or is neutral with
value of 3 to 5Texture—silt loam, silty clay loam, or very fine sandy loam; stratified with thin
sandy layers less than 1 inch thick in some pedonsOrganic matter content—0.5 to 5 percent; stratified with thin organic layers in
some pedons
Othello SeriesDrainage class: Poorly drainedPermeability: Moderate to rapidLandscape: North Atlantic Coastal PlainLandform: Flats and depressionsParent material: Silty eolian deposits over fluviomarine depositsSlope range: 0 to 2 percent
Taxonomic class: Fine-silty, mixed, active, mesic Typic Endoaquults
Typical Pedon
Othello silt loam, in an area of Othello and Fallsington soils, 0 to 2 percent slopes, inSalem County, New Jersey; 0.44 mile northeast of the intersection of Pole Tavern-Monroeville Road and Alderman Road, in a wooded area; USGS Elmer topographicquadrangle; lat. 39 degrees 37 minutes 15 seconds N. and long. 75 degrees12 minutes 45 seconds W.
Oe—0 to 1 inch; dark reddish brown (5YR 3/2) mucky peat; 70 percent fiber, rubbed;weak medium subangular blocky structure; extremely acid; abrupt smoothboundary.
A—1 to 13 inches; brown (7.5YR 4/2) silt loam; moderate medium subangular blockystructure; friable; nonsticky, slightly plastic; many fine and medium roots;1 percent fine prominent irregular strong brown (7.5YR 5/6) masses ofaccumulated iron and manganese oxide with clear boundaries throughout;extremely acid; abrupt smooth boundary.
Btg1—13 to 32 inches; light brownish gray (10YR 6/2) silt loam; moderate mediumsubangular blocky structure; friable; slightly sticky, slightly plastic; common veryfine and fine roots; 45 percent faint clay films; 15 percent medium distinct irregularyellowish brown (10YR 5/4) masses of accumulated iron and manganese oxidewith clear boundaries throughout; extremely acid; gradual smooth boundary.
Btg2—32 to 40 inches; gray (10YR 5/1) silty clay loam; strong medium subangularblocky structure; friable; slightly sticky, slightly plastic; common very fine and fineroots; 45 percent faint clay films; 15 percent medium prominent irregular brownish
Soil Survey of Salem County, New Jersey
144
yellow (10YR 6/6) masses of accumulated iron and manganese oxide with clearboundaries throughout; very strongly acid; gradual smooth boundary.
2C1—40 to 60 inches; brownish yellow (10YR 6/6) loamy sand; single grain; loose;nonsticky, nonplastic; 30 percent fine and medium prominent irregular gray(N 6/0) iron depletions with clear boundaries throughout; 30 percent fine andmedium distinct irregular strong brown (7.5YR 5/8) masses of accumulated ironand manganese oxide with clear boundaries throughout; very strongly acid;gradual smooth boundary.
2C2—60 to 80 inches; pale brown (10YR 6/3) sand; single grain; loose; nonsticky,nonplastic; 35 percent fine and medium prominent irregular gray (N 6/0) irondepletions with clear boundaries throughout; 35 percent fine and mediumprominent irregular strong brown (7.5YR 5/8) masses of accumulated iron andmanganese oxide with clear boundaries throughout; very strongly acid.
Range in Characteristics
Thickness of the solum: 24 to 50 inchesDepth to bedrock: More than 80 inchesSeasonal high water table: Within a depth of 12 inches (January to April)Depth to lithologic discontinuity: 25 to 40 inchesContent of rock fragments: 0 to 5 percent, by volume, in the A horizon, 0 to
10 percent in the B horizon, and 0 to 20 percent in the C horizon; mostly quartzpebbles
Reaction: In unlimed areas, extremely acid to strongly acid throughout
Oe or Oa horizon:Color—hue of 5YR to 10YR, value of 2 to 4, and chroma of 1 or 2Type of organic soil material—mucky peat or muck
A horizon:Color—hue of 7.5YR to 5Y, value of 3 or 4, and chroma of 1 to 3Texture—silt loam, mucky silt loam, fine sandy loam, or silty clay loam
Ap horizon (if it occurs):Color—hue of 7.5YR to 5Y, value of 4 or 5, and chroma of 1 to 3Texture—silt loam, mucky silt loam, fine sandy loam, or silty clay loam
E or Eg horizon (if it occurs):Color—hue of 10YR to 5Y, value of 5 to 7, and chroma of 1 to 3Texture—silt loam, fine sandy loam, or silty clay loam
Btg horizon:Color—hue of 10YR to 5Y, value of 5 to 7, and chroma of 1 or 2 or is neutral with
value of 5 to 7Texture—silt loam or silty clay loamRedoximorphic features—iron depletions in shades of olive or gray and masses
of accumulated iron and manganese oxide in shades of red, brown, yellow, orolive
2Cg horizon (if it occurs):Color—hue of 10YR to 5Y, value of 4 to 7, and chroma of 1 or 2 or is neutral with
value of 4 to 8Texture of the fine-earth fraction—sand, loamy sand, loamy fine sand, or sandy
loamRedoximorphic features—iron depletions in shades of olive or gray and masses
of accumulated iron and manganese oxide in shades of red, brown, yellow, orolive
Soil Survey of Salem County, New Jersey
145
2C horizon:Color—hue of 10YR to 5Y, value of 4 to 8, and chroma of 3 or 4Texture of the fine-earth fraction—sand, loamy sand, loamy fine sand, or sandy
loam; thin strata of finer textured material in some pedonsRedoximorphic features—iron depletions in shades of olive or gray and masses
of accumulated iron and manganese oxide in shades of red, brown, yellow, orolive
Pedricktown SeriesDrainage class: Very poorly drainedPermeability: Moderate to rapidLandscape: North Atlantic Coastal PlainLandform: Depressions, broad flats, and flood plainsParent material: Loamy and sandy fluviomarine depositsSlope range: 0 to 2 percent
Taxonomic class: Coarse-loamy, mixed, active, acid, mesic HumaquepticFluvaquents
Typical Pedon
Pedricktown mucky peat, in an area of Pedricktown, Askecksy, and Mullica soils,0 to 2 percent slopes, rarely flooded, in Salem County, New Jersey; about 750 feetnortheast along New Road from the intersection of Perkintown Road and New Road,630 feet east on New Road, in a wooded area; USGS Penns Grove topographicquadrangle; lat. 39 degrees 44 minutes 36.63 seconds N. and long. 75 degrees25 minutes 52.14 seconds W.
Oe—0 to 2 inches; very dark gray (10YR 3/1) mucky peat; very strongly acid; abruptsmooth boundary.
Ag—2 to 9 inches; black (N 2/0) silt loam; weak medium subangular blocky structureparting to weak fine granular; friable; nonsticky, slightly plastic; strongly acid; clearsmooth boundary.
Cg1—9 to 22 inches; dark gray (10YR 4/1) sandy loam; massive; friable; nonsticky,nonplastic; strongly acid; clear smooth boundary.
Cg2—22 to 36 inches; reddish gray (2.5YR 5/1) loamy sand; single grain; loose;nonsticky, nonplastic; 35 percent coarse prominent strong brown (7.5YR 5/6)masses of accumulated iron and manganese oxide with clear boundariesthroughout; strongly acid; clear smooth boundary.
Cg3—36 to 40 inches; dark gray (5Y 4/1) sandy clay loam; massive; firm; slightlysticky, nonplastic; 35 percent medium prominent dark yellowish brown (10YR 4/6)masses of accumulated iron and manganese oxide lining pores; strongly acid;clear smooth boundary.
Cg4—40 to 49 inches; dark gray (5Y 4/1) sandy loam; massive; friable; nonsticky,nonplastic; 15 percent medium prominent strong brown (7.5YR 5/6) masses ofaccumulated iron and manganese oxide with clear boundaries throughout;strongly acid; clear smooth boundary.
Cg5—49 to 56 inches; greenish gray (5GY 5/1) loamy sand; single grain; loose;nonsticky, nonplastic; 35 percent coarse prominent strong brown (7.5YR 5/6)masses of accumulated iron and manganese oxide with clear boundariesthroughout; strongly acid; clear smooth boundary.
Cg6—56 to 72 inches; gray (2.5Y 5/1) sand; single grain; loose; nonsticky,nonplastic; 35 percent coarse prominent strong brown (7.5YR 5/6) masses
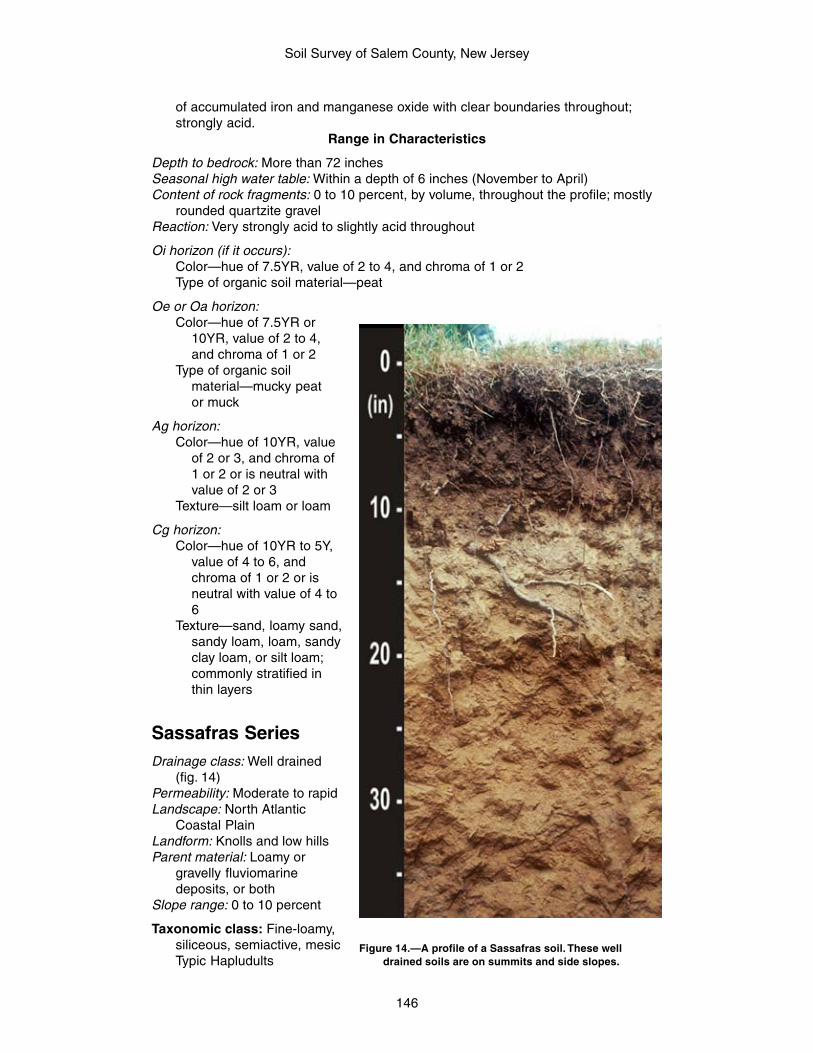
Soil Survey of Salem County, New Jersey
146
of accumulated iron and manganese oxide with clear boundaries throughout;strongly acid.
Range in Characteristics
Depth to bedrock: More than 72 inchesSeasonal high water table: Within a depth of 6 inches (November to April)Content of rock fragments: 0 to 10 percent, by volume, throughout the profile; mostly
rounded quartzite gravelReaction: Very strongly acid to slightly acid throughout
Oi horizon (if it occurs):Color—hue of 7.5YR, value of 2 to 4, and chroma of 1 or 2Type of organic soil material—peat
Oe or Oa horizon:Color—hue of 7.5YR or
10YR, value of 2 to 4,and chroma of 1 or 2
Type of organic soilmaterial—mucky peator muck
Ag horizon:Color—hue of 10YR, value
of 2 or 3, and chroma of1 or 2 or is neutral withvalue of 2 or 3
Texture—silt loam or loam
Cg horizon:Color—hue of 10YR to 5Y,
value of 4 to 6, andchroma of 1 or 2 or isneutral with value of 4 to6
Texture—sand, loamy sand,sandy loam, loam, sandyclay loam, or silt loam;commonly stratified inthin layers
Sassafras SeriesDrainage class: Well drained
(fig. 14)Permeability: Moderate to rapidLandscape: North Atlantic
Coastal PlainLandform: Knolls and low hillsParent material: Loamy or
gravelly fluviomarinedeposits, or both
Slope range: 0 to 10 percent
Taxonomic class: Fine-loamy,siliceous, semiactive, mesicTypic Hapludults
Figure 14.—A profile of a Sassafras soil. These welldrained soils are on summits and side slopes.
Soil Survey of Salem County, New Jersey
147
Typical Pedon
Sassafras sandy loam, in an area of Sassafras sandy loam, 0 to 2 percent slopes,in Salem County, New Jersey; located 0.9 mile northwest of the intersection of LongBridge Road and Canton Road, 0.5 mile northeast of Canton Road and 0.25 milesoutheast of Canton Cemetery along the road, in a cultivated field; USGSCanton topographic quadrangle; lat. 39 degrees 28 minutes 38 seconds N. andlong. 75 degrees 24 minutes 43 seconds W.
Ap—0 to 4 inches; dark yellowish brown (10YR 4/4) sandy loam; moderate mediumgranular structure; friable; nonsticky, nonplastic; common fine roots; slightly acid;abrupt smooth boundary.
Bt1—4 to 16 inches; light yellowish brown (10YR 6/4) sandy loam; moderate mediumsubangular blocky structure; friable; slightly sticky, slightly plastic; common veryfine and fine roots; 15 percent faint clay films and 15 percent clay bridgingbetween sand grains; slightly acid; clear smooth boundary.
Bt2—16 to 22 inches; strong brown (7.5YR 5/6) sandy loam; moderate mediumsubangular blocky structure; friable; slightly sticky, slightly plastic; common veryfine and fine roots; 15 percent faint clay films and 30 percent clay bridgingbetween sand grains; moderately acid; clear smooth boundary.
Bt3—22 to 45 inches; yellowish red (5YR 5/6) sandy clay loam; moderate mediumsubangular blocky structure; friable; slightly sticky, slightly plastic; common veryfine and fine roots; 15 percent faint clay films and 30 percent clay bridgingbetween sand grains; moderately acid; clear smooth boundary.
C1—45 to 55 inches; strong brown (7.5YR 5/6) sandy loam; moderate mediumsubangular blocky structure; friable; nonsticky, nonplastic; 1 percent medium faintirregular very pale brown (10YR 7/4) masses of accumulated iron andmanganese oxide with diffuse boundaries throughout; moderately acid; clearsmooth boundary.
C2—55 to 72 inches; pink (7.5YR 7/4) sand; single grain; loose; nonsticky, nonplastic;1 percent medium distinct irregular strong brown (7.5YR 5/6) masses ofaccumulated iron and manganese oxide with diffuse boundaries throughout;moderately acid.
Range in Characteristics
Thickness of the solum: 25 to 50 inchesDepth to bedrock: More than 72 inchesDepth to a seasonal high water table: More than 72 inchesContent of rock fragments: 0 to 20 percent, by volume, in the A and B horizons and
0 to 30 percent in the C horizon; mostly quartz pebblesReaction: In unlimed areas, extremely acid to strongly acid throughout
Ap horizon:Color—hue of 7.5YR to 2.5Y, value of 4 or 5, and chroma of 2 to 4Texture of the fine-earth fraction—loam, fine sandy loam, sandy loam, loamy fine
sand, or loamy sand
A horizon (if it occurs):Color—hue of 7.5YR to 2.5Y, value of 2 to 4, and chroma of 1 to 4Thickness—1 to 4 inchesTexture of the fine-earth fraction—loam, fine sandy loam, sandy loam, loamy fine
sand, or loamy sand
E horizon (if it occurs):Color—hue of 7.5YR to 2.5Y, value of 4 to 6, and chroma of 2 to 4Texture of the fine-earth fraction—fine sandy loam, sandy loam, loamy fine sand,
or loamy sand
Soil Survey of Salem County, New Jersey
148
BA or BE horizon (if it occurs):Color—hue of 7.5YR to 2.5Y, value of 4 to 6, and chroma of 4 to 8Texture of the fine-earth fraction—loam, fine sandy loam, sandy loam, or sandy
clay loam
Bt horizon:Color—5YR to 2.5Y, value of 4 to 6, and chroma of 4 to 8Texture of the fine-earth fraction—loam, sandy loam, or sandy clay loam with a
weighted average silt content of 20 to 35 percent
BC horizon (if it occurs):Color—7.5YR to 2.5Y, value of 5 or 6, and chroma of 4 to 8Texture of the fine-earth fraction—loamy sand, loamy fine sand, fine sandy loam,
or sandy loam
C horizon:Color—hue of 7.5YR to 2.5Y, value of 4 to 8, and chroma of 3 to 8 or variegated
in shades of these colorsTexture of the fine-earth fraction—sandy loam, loamy sand, or sand; transition to
sand more than 5 inchesRedoximorphic features—iron depletions in shades of olive or gray and masses
of accumulated iron and manganese oxide in shades of red, brown, yellow, orolive below a depth of 72 inches
Sharptown SeriesDrainage class: Moderately well drainedPermeability: Moderately slow and moderateLandscape: North Atlantic Coastal PlainLandform: Upland terraces and broad ridgesParent material: Silty eolian deposits over glauconitic loamy marine depositsSlope range: 0 to 5 percent
Taxonomic class: Fine-silty, mixed, active, mesic Aquic Hapludults
Typical Pedon
Sharptown silt loam, in an area of Sharptown silt loam, 0 to 2 percent slopes, inSalem County, New Jersey; 0.25 mile south and 250 feet west of the intersection ofKings Highway and Featherbed Lane, in the Cowtown Rodeo pasture; USGSWoodstown topographic quadrangle; lat. 39 degrees 40 minutes 28 seconds N. andlong. 75 degrees 21 minutes 44 seconds W.
Ap—0 to 10 inches; dark grayish brown (10YR 4/2) sandy loam; strong fine granularstructure; friable; slightly sticky, slightly plastic; many fine roots; very strongly acid;abrupt smooth boundary.
Bt1—10 to 20 inches; yellowish brown (10YR 5/6) silt loam; moderate mediumsubangular blocky structure; friable; slightly sticky, slightly plastic; many fine roots;60 percent faint clay films; very strongly acid; clear smooth boundary.
Bt2—20 to 23 inches; brown (7.5YR 5/4) silt loam; moderate fine subangular blockystructure parting to strong medium subangular blocky; friable; slightly sticky,slightly plastic; common fine roots; 30 percent distinct clay films; 1 percentmedium prominent irregular pale yellow (2.5Y 7/4) masses of accumulated ironand manganese oxide with diffuse boundaries throughout; 5 percent glauconitepellets; very strongly acid; clear smooth boundary.
Bt3—23 to 38 inches; brown (7.5YR 5/4) silt loam; weak coarse prismatic structureparting to moderate coarse subangular blocky; friable; slightly sticky, slightly
Soil Survey of Salem County, New Jersey
149
plastic; common fine roots; 30 percent prominent clay films; 15 percent mediumprominent irregular light gray (2.5Y 7/2) iron depletions with clear boundaries inthe matrix; 5 percent glauconite pellets; very strongly acid; clear smoothboundary.
BC—38 to 44 inches; strong brown (7.5YR 5/8) loam; massive; friable; slightly sticky,nonplastic; common fine roots; 15 percent medium prominent irregular gray(10YR 5/1) iron depletions with clear boundaries in matrix; 15 percent fineprominent irregular light olive brown (2.5Y 5/4) masses of accumulated iron andmanganese oxide throughout with diffuse boundaries; 15 percent glauconitepellets; very strongly acid; clear smooth boundary.
2C1—44 to 46 inches; light olive brown (2.5Y 5/6) sandy loam; massive; friable;nonsticky, nonplastic; 30 percent medium prominent irregular light gray (10YR7/1) iron depletions with clear boundaries in matrix; 30 percent fine prominentirregular brown (7.5YR 5/4) masses of accumulated iron and manganese oxidewith diffuse boundaries throughout; 25 percent glauconite pellets; very stronglyacid; abrupt smooth boundary.
2C2—46 to 50 inches; yellowish brown (10YR 5/4) silt loam; massive; friable; slightlysticky, slightly plastic; 30 percent medium distinct irregular light gray (10YR 7/1)iron depletions with clear boundaries in matrix; 30 percent medium faint irregularbrown (7.5YR 5/4) masses of accumulated iron and manganese oxide withdiffuse boundaries; 30 percent glauconite pellets; very strongly acid; gradualsmooth boundary.
2C3—50 to 58 inches; strong brown (7.5YR 4/6) loam; massive; friable;nonsticky, nonplastic; 30 percent medium prominent irregular light gray(10YR 7/1) and light brownish gray (2.5Y 6/2) iron depletions in matrix withclear boundaries; 40 percent glauconite pellets; very strongly acid; gradualsmooth boundary.
2C4—58 to 72 inches; light brownish gray (2.5Y 6/2) silt loam; massive; friable;slightly sticky, slightly plastic; 30 percent medium prominent irregular strongbrown (7.5YR 4/6) masses of accumulated iron and manganese oxide withclear boundaries throughout; 15 percent medium distinct irregular olive gray(5Y 5/2) iron depletions in matrix with diffuse boundaries; 45 percent glauconitepellets; very strongly acid.
Range in Characteristics
Thickness of the solum: 20 to 48 inchesDepth to bedrock: More than 72 inchesDepth to the seasonal high water table: 18 to 42 inches (January to April)Depth to lithologic discontinuity: 30 to 50 inchesContent of rock fragments: Less than 5 percent, by volume, in the A horizon and less
than 10 percent in the B and C horizons; mostly quartzite gravelReaction: In unlimed areas, extremely acid to strongly acid throughoutContent of glauconite: 0 to 5 percent, by volume, in the A and B horizons and 10 to
50 percent in the 2C horizon
A or Ap horizon:Color—hue of 7.5YR to 2.5Y, value of 4 or 5, and chroma of 2 to 4Texture—silt loam or loam
BA or BE horizon (if it occurs):Color—hue of 7.5YR to 2.5Y, value of 4 to 6, and chroma of 3 or 4Texture—silt loam or loam
Bt horizon:Color—hue of 7.5YR to 2.5Y, value of 5 to 8, and chroma of 4 to 8Texture—silt loam or silty clay loam
Soil Survey of Salem County, New Jersey
150
Redoximorphic features—iron depletions in shades of olive, gray, or white andmasses of accumulated iron and manganese oxide in shades of red, brown,yellow, or olive
BC horizon:Color—hue of 7.5YR to 2.5Y, value of 4 to 8, and chroma of 3 to 8Texture—silt loam, loam, or silty clay loamRedoximorphic features—iron depletions in shades of olive, gray, or white and
masses of accumulated iron and manganese oxide in shades of red, brown,yellow, or olive
2C horizon:Color—7.5YR to 5Y, value of 4 to 8, and chroma of 3 to 6Texture—sandy loam, sandy clay loam, loam, silt loam, or silty clay loamRedoximorphic features—iron depletions in shades of olive, gray, or white and
masses of accumulated iron and manganese oxide in shades of red, brown,yellow, or olive
Swedesboro SeriesDrainage class: Well drainedPermeability: Moderately rapid and rapidLandscape: North Atlantic Coastal PlainLandform: Broad ridges and upland terracesParent material: Glauconitic sandy marine deposits or glauconitic loamy marine
deposits, or bothSlope range: 0 to 10 percent
Taxonomic class: Coarse-loamy, mixed, semiactive, mesic Typic Hapludults
Typical Pedon
Swedesboro loamy sand, in an area of Swedesboro loamy sand, 0 to 5 percentslopes, in Salem County, New Jersey; 0.5 mile north of the intersection of AuburnWoodstown Road and Sharptown-Auburn Road, 0.06 mile east of Auburn WoodstownRoad, in a cultivated field; USGS Woodstown topographic quadrangle; lat. 39 degrees42 minutes 47 seconds N. and long. 75 degrees 22 minutes 24 seconds W.
Ap—0 to 10 inches; olive brown (2.5Y 4/4) loamy sand; single grain; loose; nonsticky,nonplastic; common fine roots; strongly acid; clear smooth boundary.
BA—10 to 14 inches; light olive brown (2.5Y 5/6) loamy sand; weak fine subangularblocky structure; friable; nonsticky, nonplastic; common fine roots; clay bridgingbetween sand grains; strongly acid; clear smooth boundary.
Bt1—14 to 26 inches; olive yellow (2.5Y 6/6) sandy loam; weak medium subangularblocky structure; friable; nonsticky, nonplastic; common fine roots; 10 percent faintclay films and 10 percent faint clay bridging between sand grains; strongly acid;clear smooth boundary.
Bt2—26 to 30 inches; olive yellow (2.5Y 6/6) sandy clay loam; moderate mediumsubangular blocky structure; friable; slightly sticky, slightly plastic; common fineroots; 30 percent faint clay films and 30 percent faint clay bridging between sandgrains; very strongly acid; abrupt smooth boundary.
Bt3—30 to 40 inches; brownish yellow (10YR 6/6) fine sandy loam; moderate mediumsubangular blocky structure; friable; slightly sticky, slightly plastic; common fineroots; 10 percent faint clay films; very strongly acid; clear smooth boundary.
BC—40 to 46 inches; olive yellow (2.5Y 6/8) loamy fine sand; massive; friable;nonsticky, nonplastic; very strongly acid; clear smooth boundary.
Soil Survey of Salem County, New Jersey
151
2C1—46 to 54 inches; olive yellow (2.5Y 6/8) sand; single grain; loose; nonsticky,nonplastic; very strongly acid; gradual smooth boundary.
2C2—54 to 72 inches; pale yellow (2.5Y 7/4) sand; single grain; loose; nonsticky,nonplastic; 5 percent medium prominent irregular olive brown (2.5Y 5/8) massesof accumulated iron and manganese oxide with diffuse boundaries throughout;very strongly acid.
Range in Characteristics
Thickness of the solum: 30 to 60 inchesDepth to bedrock: More than 72 inchesDepth to a seasonal high water table: More than 72 inchesContent of rock fragments: Less than 5 percent throughout the profile; mostly fine
quartzite gravelReaction: In unlimed areas, extremely acid to strongly acid throughoutContent of glauconite: 1 to 10 percent, by volume, in the A and B horizons and 5 to
15 percent in the C horizon
A or Ap horizon:Color—hue of 10YR or 2.5Y, value of 4 or 5, and chroma of 2 to 6Texture—loamy sand or sandy loam
BA or BE horizon:Color—hue of 10YR or 2.5Y, value of 4 to 6, and chroma of 3 or 4Texture—loamy sand or sandy loam
Bt horizon:Color—hue of 7.5YR to 2.5Y, value of 4 to 6, and chroma of 4 to 8Texture—sandy loam, fine sandy loam, or sandy clay loam
BC horizon:Color—hue of 7.5YR to 2.5Y, value of 4 to 6, and chroma of 4 to 6Texture—loamy fine sand or loamy sand
C horizon:Color—hue of 7.5YR to 2.5Y, value of 4 to 7, and chroma of 4 to 8Texture—sand or loamy sand
Transquaking SeriesDrainage class: Very poorly drainedPermeability: SlowLandscape: North Atlantic Coastal PlainLandform: Tidal flatsParent material: Herbaceous organic material over loamy mineral sedimentsSlope range: 0 to 1 percent
Taxonomic class: Euic, mesic Typic Sulfihemists
Typical Pedon
Transquaking mucky peat, in an area of Transquaking mucky peat, 0 to 1 percentslopes, very frequently flooded, in Salem County, New Jersey; located 0.1 mile eastof Hope Creek, 0.06 mile north of Alloway Creek Neck Road, in a tidal marsh; USGSCanton topographic quadrangle; lat. 39 degrees 27 minutes 34 seconds N. and long.75 degrees 29 minutes 55 seconds W.
Oe1—0 to 14 inches; black (5YR 2.5/1) mucky peat; 70 percent fiber, rubbed; neutral;gradual smooth boundary.
Soil Survey of Salem County, New Jersey
152
Oe2—14 to 30 inches; dark reddish brown (5YR 3/2) mucky peat; 50 percent fiber,rubbed; neutral; clear smooth boundary.
Oe3—30 to 45 inches; dark reddish brown (5YR 3/2) mucky peat; 30 percent fiber,rubbed; neutral; clear smooth boundary.
Oe4—45 to 70 inches; dark reddish brown (5YR 3/2) mucky peat; 25 percent fiber,rubbed; neutral; clear smooth boundary.
Oa—70 to 90 inches; very dark brown (10YR 2/2) muck; 5 percent fiber, rubbed;neutral.
Range in Characteristics
Thickness of the organic horizons: 52 to 80 inches or moreDepth to bedrock: More than 90 inchesHigh water table: At the surface (January to December)Reaction: Slightly acid or neutral in the natural state; ultra acid or extremely acid upon
dryingElectrical conductivity throughout the profile: More than 8 millimhos per centimeter;
typically more than 16 millimhos per centimeterMineral content of the organic horizons: 20 to 70 percent, by weight; thin layers of silt
and very fine sand in the organic horizons of some pedonsOther features: n-value typically more than 1.0
Oi or Oa horizon:Color—hue of 5YR to 10YR, value of 2 to 4, and chroma of 1 to 3Type of organic soil material—peat (fibric soil material) or mucky peat (hemic soil
material)
Oe or Oa horizon:Color—hue of 5YR to 2.5Y, value of 2 to 5, and chroma of 1 to 4Type of organic soil material—mucky peat (hemic soil material) or muck (sapric
soil material)
Oa horizon:Color—hue of 10YR to 5Y, value of 2 to 4, and chroma of 1 or 2Type of organic soil material—muck (sapric soil material)
Cg horizon (if it occurs):Color—hue of 10YR to 5GY, value of 3 or 4, and chroma of 1 or 2 or is neutral
with value of 3 or 4Texture—silt loam, silty clay loam, or silty clay; stratified thin sandy mineral layers
less than 1 inch thick within the horizon in some pedonsOrganic matter content—1 to 20 percent; stratified thin organic layers within the
mineral horizon in some pedons
Trussum SeriesDrainage class: Poorly drainedPermeability: Slow to moderateLandscape: North Atlantic Coastal PlainLandform: DepressionsParent material: Clayey marine depositsSlope range: 0 to 2 percent
Taxonomic class: Fine, mixed, active, mesic Typic Paleaquults
Typical Pedon
Trussum loam, in an area of Othello, Fallsington, and Trussum soils, 0 to 2 percentslopes, in Salem County, New Jersey; located 0.8 mile north of the intersection of
Soil Survey of Salem County, New Jersey
153
Clancey Road and Quinton-Mannington Road, 0.1 mile east of Quinton-ManningtonRoad, in a cultivated field; USGS Salem topographic quadrangle; lat. 39 degrees35 minutes 00 seconds N. and long. 75 degrees 24 minutes 50 seconds W.
Ap—0 to 12 inches; dark grayish brown (10YR 4/2) loam; moderate medium granularstructure; friable; slightly sticky, slightly plastic; many fine and medium roots;moderately acid; abrupt smooth boundary.
Btg—12 to 25 inches; dark grayish brown (10YR 4/2) loam; moderate mediumsubangular blocky structure; friable; slightly sticky, slightly plastic; common veryfine and fine roots; 30 percent faint clay films; 1 percent fine distinct irregularyellowish brown (10YR 5/4) masses of accumulated iron and manganese oxidewith clear boundaries throughout; moderately acid; abrupt smooth boundary.
Bt1—25 to 35 inches; strong brown (7.5YR 5/6) clay; strong medium subangularblocky structure; friable; moderately sticky, very plastic; 30 percent faint clay films;30 percent fine and medium prominent irregular pinkish gray (7.5YR 6/2) irondepletions with clear boundaries throughout; strongly acid; gradual smoothboundary.
Bt2—35 to 60 inches; brown (7.5YR 5/4) clay; moderate medium subangular blockystructure; friable; very sticky, very plastic; 30 percent faint clay films; 30 percentfine and medium distinct irregular pale red (7.5R 7/2) iron depletions with clearboundaries throughout; strongly acid; gradual smooth boundary.
Bt3—60 to 66 inches; yellowish red (5YR 5/6) sandy clay loam; moderate mediumsubangular blocky structure; friable; slightly sticky, slightly plastic; 15 percent faintclay films; 30 percent fine and medium prominent irregular pinkish gray (7.5YR6/2) iron depletions with clear boundaries throughout; strongly acid; gradualsmooth boundary.
Bt4—66 to 72 inches; light brown (7.5YR 6/4) sandy clay loam; moderate mediumsubangular blocky structure; friable; slightly sticky, slightly plastic; 15 percent faintclay films; 15 percent fine and medium distinct irregular pinkish gray (7.5YR 6/2)iron depletions with clear boundaries throughout; 15 percent fine and mediumprominent irregular yellowish red (5YR 5/8) masses of accumulated iron andmanganese oxide with clear boundaries throughout; strongly acid.
Range in Characteristics
Depth to bedrock: More than 72 inchesSeasonal high water table: Within a depth of 12 inches (November to May)Content of rock fragments: 0 to 10 percent, by volume, throughout the profile; mostly
fine gravelReaction: In unlimed areas, extremely acid to strongly acid throughout
A or Ap horizon:Color—hue of 10YR or 2.5Y, value of 3 or 4, and chroma of 1 to 3Texture—silt loam, loam, or fine sandy loam
E or Eg horizon (if it occurs):Color—hue of 10YR or 2.5Y, value of 4 to 6, and chroma of 1 or 2 or is neutral
with value of 3 to 8Texture—silt loam, loam, or fine sandy loamRedoximorphic features—iron depletions in shades of olive, gray, or white and
masses of accumulated iron and manganese oxide in shades of red, brown,yellow, or olive
Btg horizon:Color—hue of 10YR or 2.5Y, value of 4 to 8, and chroma of 1 or 2 or is neutral
with value of 4 to 8Texture—clay, silty clay, silty clay loam, or clay loam
Soil Survey of Salem County, New Jersey
154
Redoximorphic features—iron depletions in shades of olive, gray, or white andmasses of accumulated iron and manganese oxide in shades of red, brown,yellow, or olive
BCg horizon (if it occurs):Color—hue of 10YR to 5Y, value of 4 to 7, and chroma of 1 or 2 or is neutral with
value of 4 to 8Texture—clay, sandy clay, clay loam, or sandy clay loamRedoximorphic features—iron depletions in shades of olive, gray, or white and
masses of accumulated iron and manganese oxide in shades of red, brown,yellow, or olive
Cg horizon (if it occurs):Color—hue of 10YR to 5Y, value of 4 to 7, and chroma of 1 or 2 or is neutral with
value of 4 to 7Texture—ranges from loamy sand to sandy clay loamRedoximorphic features—iron depletions in shades of olive, gray, or white and
masses of accumulated iron and manganese oxide in shades of red, brown,yellow, or olive
UdorthentsLandscape: North Atlantic Coastal PlainLandform: The natural landform greatly altered by the addition or removal of earthy
materials in most areasParent material: Dredged fill materials or excavated borrow materials derived from
river channels, pits, or previously unaltered soilsSlope range: 0 to 8 percent
Taxonomic class: UdorthentsTypical Pedon
Udorthents are in areas where the natural soil properties and qualities have beengreatly altered by excavation, extensive grading, or filling. A typical pedon andsequence, depth, and composition of the layers of these soils cannot be givenbecause the soil properties vary. Excavated or fill areas are mainly where earthymaterials have been removed or pumped from river channels for use as foundationmaterials for roads or buildings, general urban development, or landfills.
Range in Characteristics
Because soil properties vary so much, a typical range in characteristics cannot begiven.
Woodstown SeriesDrainage class: Moderately well drainedPermeability: Moderate to rapidLandscape: North Atlantic Coastal PlainLandform: Shallow depressions, broad ridges, flats, and upland terracesParent material: Old alluvium or sandy marine deposits, or bothSlope range: 0 to 2 percent
Taxonomic class: Fine-loamy, mixed, active, mesic Aquic Hapludults
Typical Pedon
Woodstown sandy loam, in an area of Woodstown sandy loam, 0 to 2 percent slopes,in Salem County, New Jersey; 0.75 mile northwest of the intersection of Long Bridge
Soil Survey of Salem County, New Jersey
155
Road and Canton Road, 0.3 mile northeast of Canton Road, and 0.38 mile northeastof Canton Cemetery along the road, in a cultivated field; USGS Canton topographicquadrangle; lat. 39 degrees 29 minutes 05 seconds N. and long. 75 degrees24 minutes 30 seconds W.
Ap—0 to 10 inches; dark yellowish brown (10YR 4/4) sandy loam; moderate mediumgranular structure; friable; nonsticky, nonplastic; common fine roots; slightly acid;abrupt smooth boundary.
Bt1—10 to 18 inches; light yellowish brown (10YR 6/4) sandy loam; moderatemedium subangular blocky structure; friable; slightly sticky, slightly plastic;common very fine and fine roots; 10 percent faint clay films and 30 percent claybridging between sand grains; slightly acid; clear smooth boundary.
Bt2—18 to 22 inches; yellowish brown (10YR 5/6) sandy loam; moderate mediumsubangular blocky structure; friable; slightly sticky, slightly plastic; common veryfine and fine roots; clay bridging between sand grains and 15 percent faint clayfilms; 1 percent medium distinct irregular very pale brown (10YR 7/4) masses ofaccumulated iron and manganese oxide with diffuse boundaries throughout;slightly acid; clear smooth boundary.
Bt3—22 to 40 inches; yellowish brown (10YR 5/6) sandy clay loam; moderate mediumsubangular blocky structure; friable; slightly sticky, slightly plastic; common veryfine and fine roots; 15 percent faint clay films and 30 percent clay bridgingbetween sand grains; 1 percent medium prominent irregular light gray (10YR 7/2)iron depletions with clear boundaries throughout; moderately acid; clear smoothboundary.
BC—40 to 54 inches; yellowish brown (10YR 5/6) sandy loam; moderate mediumsubangular blocky structure; friable; nonsticky, nonplastic; 15 percent mediumprominent irregular light gray (10YR 7/2) iron depletions with clear boundariesthroughout; moderately acid; clear smooth boundary.
C—54 to 64 inches; brownish yellow (10YR 6/6) sand; single grain; loose; nonsticky,nonplastic; 15 percent medium prominent irregular light gray (10YR 7/1) irondepletions with clear boundaries throughout; moderately acid; gradual smoothboundary.
Cg—64 to 72 inches; light gray (10YR 7/1) sand; single grain; loose; nonsticky,nonplastic; 15 percent medium prominent irregular brownish yellow (10YR 6/6)masses of accumulated iron and manganese oxide with clear boundariesthroughout; moderately acid.
Range in Characteristics
Thickness of the solum: 24 to 45 inchesDepth to bedrock: More than 72 inchesDepth to the seasonal high water table: 18 to 42 inches (January to April)Content of rock fragments: 0 to 15 percent, by volume, in the A, E, and B horizons
and 0 to 20 percent in the C horizon; mostly quartz pebblesReaction: In unlimed areas, extremely acid to strongly acid throughout
A horizon (if it occurs):Color—hue of 10YR or 2.5Y, value of 3 or 4, and chroma of 1 to 4Texture of the fine-earth fraction—loam, fine sandy loam, or sandy loam
Ap horizon:Color—hue of 10YR or 2.5Y, value of 4 to 6, and chroma of 2 to 4Texture of the fine-earth fraction—loam, fine sandy loam, or sandy loam
E horizon (if it occurs):Color—hue of 10YR or 2.5Y, value of 5 or 6, and chroma of 2 to 4Texture of the fine-earth fraction—fine sandy loam or sandy loam
Soil Survey of Salem County, New Jersey
156
BE or BA horizon (if it occurs):Color—hue of 10YR or 2.5Y, value of 5 or 6, and chroma of 4 to 8Texture of the fine-earth fraction—loam, sandy loam, or fine sandy loam
Bt horizon:Color—hue of 10YR or 2.5Y, value of 5 or 6, and chroma of 4 to 8Texture of the fine-earth fraction—sandy clay loam or loam; less commonly,
sandy loam, fine sandy loam, or clay loamRedoximorphic features—iron depletions in shades of olive, gray, or white and
masses of accumulated iron and manganese oxide in shades of red, brown,yellow, or olive
BC horizon:Color—hue of 10YR or 2.5Y, value of 4 to 6, and chroma of 4 to 8Texture of the fine-earth fraction—sandy clay loam, loam, sandy loam, or fine
sandy loamRedoximorphic features—iron depletions in shades of olive, gray, or white and
masses of accumulated iron and manganese oxide in shades of red, brown,yellow, or olive
BCg horizon (if it occurs):Color—hue of 10YR to 5Y, value of 4 to 8, and chroma of 1 or 2 or is neutral with
value of 4 to 8Texture of the fine-earth fraction—sandy loam, loamy sand, or sand; thin strata of
fine sandy clay loam, silt loam, or sandy clay loam in some pedonsRedoximorphic features—iron depletions in shades of olive, gray, or white and
masses of accumulated iron and manganese oxide in shades of red, brown,yellow, or olive
C horizon:Color—hue of 10YR to 5Y, value of 4 to 8, and chroma of 3 to 8Texture of the fine-earth fraction—sandy loam, loamy sand, or sand; thin strata of
fine sandy clay loam, silt loam, or sandy clay loam in some pedonsRedoximorphic features—iron depletions in shades of olive, gray, or white and
masses of accumulated iron and manganese oxide in shades of red, brown,yellow, or olive
Cg horizon:Color—hue of 10YR to 5Y, value of 4 to 8, and chroma of 1 or 2 or is neutral with
value of 4 to 8Texture of the fine-earth fraction—sandy loam, loamy sand, or sand; thin strata of
fine sandy clay loam, silt loam, or sandy clay loam in some pedonsRedoximorphic features—iron depletions in shades of olive, gray, or white and
masses of accumulated iron and manganese oxide in shades of red, brown,yellow, or olive
157
Soil Survey of Salem County, New Jersey
This section describes the factors of soil formation and relates them to the soils inSalem County. It also discusses the processes of horizon differentiation.
Factors of Soil Formation
The soils in Salem County formed by processes of the environment acting upongeologic agents, such as marine sediments, fluviomarine sediments, and alluvialsediments. The characteristics of a soil are determined by the combined influence ofparent material, climate, plant and animal life, landform position, and time. These fivefactors are responsible for the profile development and chemical properties thatdifferentiate soils (Jenny 1941). Figures 15, 16, and 17 illustrate some of thevariations in the relationship between soils, landform position, and parent materialthat occur in Salem County. Table 24 shows the relationship of soil characteristics,major landforms, and drainage.
Parent Material
Parent material is the unconsolidated mass in which a soil forms. In Salem County,it is a major factor in determining what kind of soil forms and can be correlated tosome degree to geologic formations.
Parent material is largely responsible for the chemical and mineralogicalcomposition of soils and for the major differences among the soils of the county. Majordifferences in parent material, such as differences in texture and soil color, can beobserved in the field. Less distinct differences, such as differences in mineralogicalcomposition, can be determined only by careful laboratory analysis.
Nearly all of the soils of Salem County formed in marine sediments, fluviomarinedeposits, alluvial deposits, or organic deposits or in a combination of these parentmaterials. Although the glaciers did not reach as far south as Salem County,meltwater from the glaciers and alluvium from ancient rivers probably covered most ofthe county and mixed the materials of the older marine deposits. Rounded quartzitegravel, believed to be of Pleistocene age and older, can be found in all parts of thecounty, including areas at the highest elevations. Although not abundant throughoutthe county, it is locally present in significant amounts.
The most recent deposits are of the Holocene Epoch, which began approximately10,000 years ago. Four main types of deposits are associated with this epoch—freshwater swamp or marsh, consisting primarily of muck and peat (organicmaterials), sand, silt, and gravel; tidal or salt marsh, consisting of muck and peat, silt,clay, and sand; dune fields, consisting of coarse grained to fine grained sand and siltdeposited and reworked by wind action; and artificial fill, consisting of human-deposited materials having widely varying properties.
During the Pleistocene Epoch, the climate of Salem County was much colder thanit is now and the sea level fluctuated greatly. When the water level was low, mucherosion by wind and water reworked the original soil deposits (Newell and others1995). Except for this mixing, the soils of the county are closely related to the parentmaterial from which they formed.
Formation of the Soils
Soil Survey of Salem County, New Jersey
158
Climate
Climate, particularly precipitation and temperature, affects the physical, chemical,and biological relationships in the soil. It influences the rate at which the sedimentsand deposits weather and organic matter decomposes. The amount of leaching in asoil is related to the amount of rainfall and the movement of water through the soil.The effects of climate also control the kinds of plants and animals living in and on thesoil. Temperature influences the kind and growth of organisms and the speed ofchemical and physical reactions in the soil.
Salem County has a warm, humid climate. It is in a part of the coastal plain in NewJersey where elevation ranges from sea level to about 160 feet. The climate promotesactive chemical processes, which result in the decomposition of organic matter andthe weathering of sediments and deposits. The effects of climate are reflected in thesoils of the county. Mild temperatures throughout the year and abundant rainfallcreate conditions that allow rapid decomposition of organic matter and considerableleaching of soluble bases. Because variations in the climate of the county are small,climate has probably not caused major local differences among soils. It has mainlyaffected the formation of soils in the county by altering the parent material throughchanges in temperature and in the amount of precipitation and through influences onplant and animal life.
Climatic changes were most dramatic during and after the ice age. Meltwater andthe formation of rivers from glaciers to the north were responsible for the mixing ofthe soil materials in Salem County. High winds during this period were probablyresponsible for some sand deposits, from which Evesboro and similar soils eventuallyformed.
During the time that the soils were forming and being mixed by glacial meltwater,water covered many low areas of the county. Soils in these water-covered areasdeveloped a thick accumulation of organic matter, which is apparent in the dark,organic-rich surface layer of soils, such as in the Manahawkin series. Uniform graycolors (gleying) in the subsoil generally indicate that iron oxides could not form insoils that developed in the water-covered areas. Other soils that formed in the higherpositions on the landscape generally were well drained, developed a less organic-richsurface layer, and had iron oxides that freely formed brighter colors.
Plant and Animal Life
Plants and animals influence the formation and differentiation of soil horizons. Thetype and number of organisms in and on the soil are determined in part by climateand in part by the nature of the soil material, the landform position, and the age of thesoil. Bacteria, fungi, and other micro-organisms aid in the weathering of sedimentsand deposits and in the decomposition of organic matter. The plants and animalsliving in an area are the primary sources of organic material for the soils in that area.
Plants largely determine the kinds and amounts of organic matter that are addedto a soil under normal conditions and the way in which the organic matter is added.They also influence the leaching processes that occur in soils and the changes inbase status. Plant growth and subsequent decomposition effectively redistribute basicnutrients such as calcium and magnesium throughout the soil.
Animals convert complex compounds into simpler forms, add organic matter to thesoil, and modify certain chemical and physical properties of soil. In Salem County,most of the organic material accumulates on the soil surface. It is acted upon bymicro-organisms, fungi, insects, earthworms, and other forms of life and by directchemical reaction. It is mixed with the uppermost mineral part of the soil by theactivities of earthworms and other small invertebrates.
The effects of human activity on the soils are most noticeable in areas where thesoils have eroded or have been drained, excavated, or filled. Cultivating the soils,applying fertilizer, and landscaping also change soil properties and characteristics.
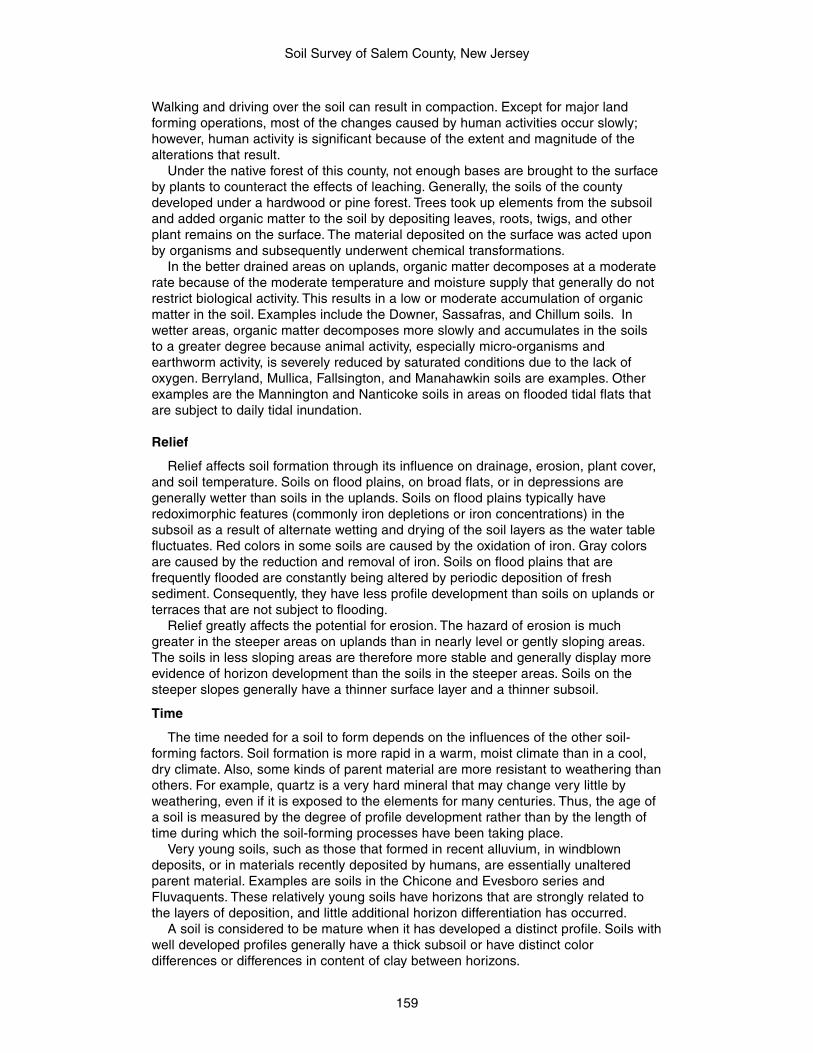
Soil Survey of Salem County, New Jersey
159
Walking and driving over the soil can result in compaction. Except for major landforming operations, most of the changes caused by human activities occur slowly;however, human activity is significant because of the extent and magnitude of thealterations that result.
Under the native forest of this county, not enough bases are brought to the surfaceby plants to counteract the effects of leaching. Generally, the soils of the countydeveloped under a hardwood or pine forest. Trees took up elements from the subsoiland added organic matter to the soil by depositing leaves, roots, twigs, and otherplant remains on the surface. The material deposited on the surface was acted uponby organisms and subsequently underwent chemical transformations.
In the better drained areas on uplands, organic matter decomposes at a moderaterate because of the moderate temperature and moisture supply that generally do notrestrict biological activity. This results in a low or moderate accumulation of organicmatter in the soil. Examples include the Downer, Sassafras, and Chillum soils. Inwetter areas, organic matter decomposes more slowly and accumulates in the soilsto a greater degree because animal activity, especially micro-organisms andearthworm activity, is severely reduced by saturated conditions due to the lack ofoxygen. Berryland, Mullica, Fallsington, and Manahawkin soils are examples. Otherexamples are the Mannington and Nanticoke soils in areas on flooded tidal flats thatare subject to daily tidal inundation.
Relief
Relief affects soil formation through its influence on drainage, erosion, plant cover,and soil temperature. Soils on flood plains, on broad flats, or in depressions aregenerally wetter than soils in the uplands. Soils on flood plains typically haveredoximorphic features (commonly iron depletions or iron concentrations) in thesubsoil as a result of alternate wetting and drying of the soil layers as the water tablefluctuates. Red colors in some soils are caused by the oxidation of iron. Gray colorsare caused by the reduction and removal of iron. Soils on flood plains that arefrequently flooded are constantly being altered by periodic deposition of freshsediment. Consequently, they have less profile development than soils on uplands orterraces that are not subject to flooding.
Relief greatly affects the potential for erosion. The hazard of erosion is muchgreater in the steeper areas on uplands than in nearly level or gently sloping areas.The soils in less sloping areas are therefore more stable and generally display moreevidence of horizon development than the soils in the steeper areas. Soils on thesteeper slopes generally have a thinner surface layer and a thinner subsoil.
Time
The time needed for a soil to form depends on the influences of the other soil-forming factors. Soil formation is more rapid in a warm, moist climate than in a cool,dry climate. Also, some kinds of parent material are more resistant to weathering thanothers. For example, quartz is a very hard mineral that may change very little byweathering, even if it is exposed to the elements for many centuries. Thus, the age ofa soil is measured by the degree of profile development rather than by the length oftime during which the soil-forming processes have been taking place.
Very young soils, such as those that formed in recent alluvium, in windblowndeposits, or in materials recently deposited by humans, are essentially unalteredparent material. Examples are soils in the Chicone and Evesboro series andFluvaquents. These relatively young soils have horizons that are strongly related tothe layers of deposition, and little additional horizon differentiation has occurred.
A soil is considered to be mature when it has developed a distinct profile. Soils withwell developed profiles generally have a thick subsoil or have distinct colordifferences or differences in content of clay between horizons.
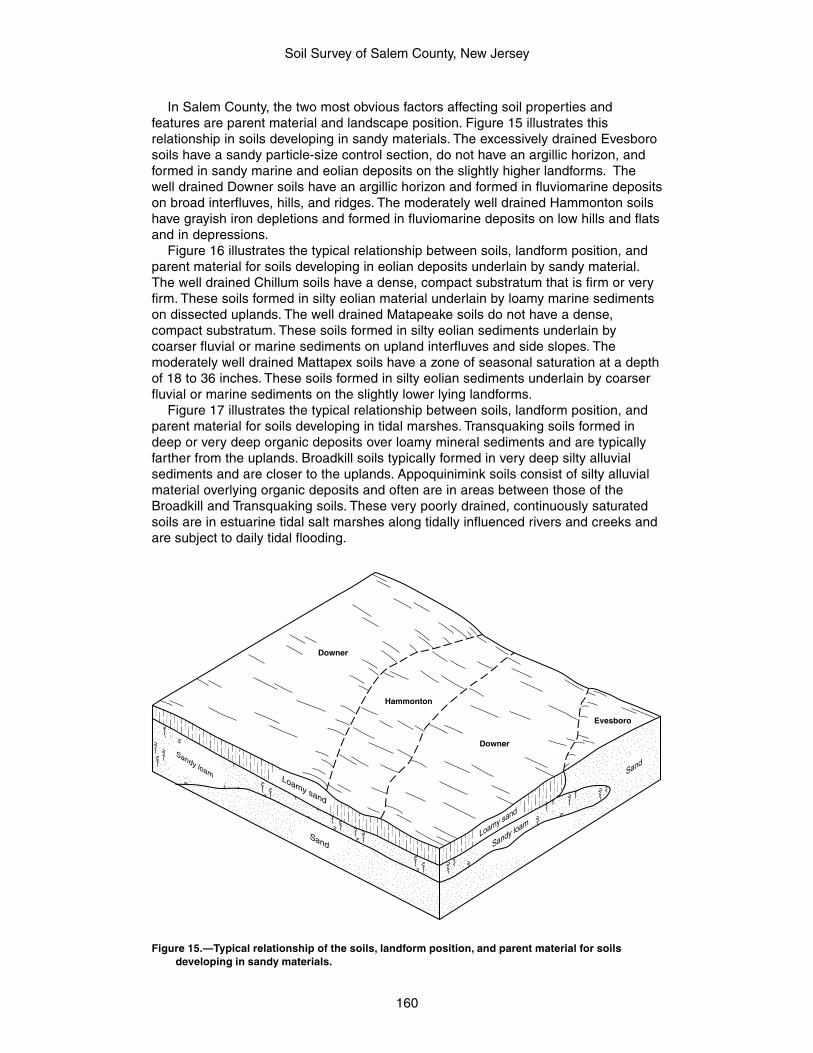
Soil Survey of Salem County, New Jersey
160
In Salem County, the two most obvious factors affecting soil properties andfeatures are parent material and landscape position. Figure 15 illustrates thisrelationship in soils developing in sandy materials. The excessively drained Evesborosoils have a sandy particle-size control section, do not have an argillic horizon, andformed in sandy marine and eolian deposits on the slightly higher landforms. Thewell drained Downer soils have an argillic horizon and formed in fluviomarine depositson broad interfluves, hills, and ridges. The moderately well drained Hammonton soilshave grayish iron depletions and formed in fluviomarine deposits on low hills and flatsand in depressions.
Figure 16 illustrates the typical relationship between soils, landform position, andparent material for soils developing in eolian deposits underlain by sandy material.The well drained Chillum soils have a dense, compact substratum that is firm or veryfirm. These soils formed in silty eolian material underlain by loamy marine sedimentson dissected uplands. The well drained Matapeake soils do not have a dense,compact substratum. These soils formed in silty eolian sediments underlain bycoarser fluvial or marine sediments on upland interfluves and side slopes. Themoderately well drained Mattapex soils have a zone of seasonal saturation at a depthof 18 to 36 inches. These soils formed in silty eolian sediments underlain by coarserfluvial or marine sediments on the slightly lower lying landforms.
Figure 17 illustrates the typical relationship between soils, landform position, andparent material for soils developing in tidal marshes. Transquaking soils formed indeep or very deep organic deposits over loamy mineral sediments and are typicallyfarther from the uplands. Broadkill soils typically formed in very deep silty alluvialsediments and are closer to the uplands. Appoquinimink soils consist of silty alluvialmaterial overlying organic deposits and often are in areas between those of theBroadkill and Transquaking soils. These very poorly drained, continuously saturatedsoils are in estuarine tidal salt marshes along tidally influenced rivers and creeks andare subject to daily tidal flooding.
Evesboro
Hammonton
Downer
Downer
Sand
Loamy sand
Sandy loam Sand
Sandy loamLoamy sand
Figure 15.—Typical relationship of the soils, landform position, and parent material for soilsdeveloping in sandy materials.
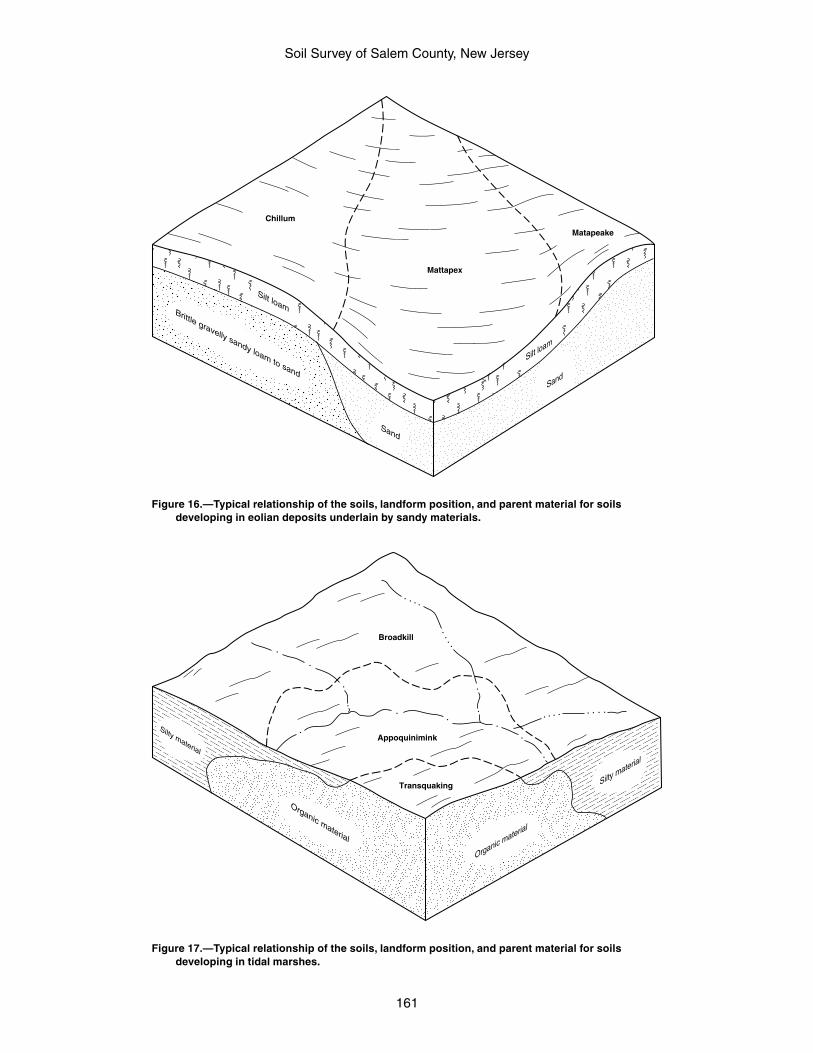
Soil Survey of Salem County, New Jersey
161
Matapeake
Mattapex
Chillum
Sand
Silt loamBrittle gravelly sandy loam to sand
Sand
Silt loam
Figure 16.—Typical relationship of the soils, landform position, and parent material for soilsdeveloping in eolian deposits underlain by sandy materials.
Transquaking
Appoquinimink
Broadkill
Organic material
Silty material
Organic material
Silty material
Figure 17.—Typical relationship of the soils, landform position, and parent material for soilsdeveloping in tidal marshes.
Soil Survey of Salem County, New Jersey
162
Processes of Horizon Differentiation
One or more soil-forming processes are involved in the formation of soil horizons.These processes are the accumulation of organic matter; the leaching of carbonatesand other soluble material; the chemical weathering, mainly by hydrolysis, of primaryminerals into silicate clay minerals; the translocation of silicate clay and some silt-sized particles from one horizon to another; and the reduction and transfer of iron.
These processes have been active in the formation of most of the soils in SalemCounty. The interaction of the first four processes is indicated by the stronglyexpressed horizons in Aura and Sassafras soils. All five processes have been activein the formation of the poorly drained Othello and moderately well drainedWoodstown soils, where iron transformation is evident as shown by the grayishcolors, which are due to iron reduction, and the yellowish or reddish colors, which aredue to iron oxidation.
Organic matter accumulation is evident in nearly all of the soils in the survey area.Most of the soils contain low to moderate amounts of organic matter in the surfacelayer. The content of organic matter ranges from low, as in the excessively drainedEvesboro soils, to high, as in the very poorly drained Manahawkin, Mannington, andNanticoke soils, where the soil is saturated near the surface for long periods of timeand decomposition of organic matter is much slower.
The translocation of clay minerals is an important process in the development ofmany soils in the survey area. As clay minerals are removed from the A horizon, theyaccumulate initially as clay films on the faces of peds, in pores, and in root channelsin the B horizon. Over time the clay coatings are incorporated into the matrix of theB horizon. Plant and animal activity aids in this physical mixing.
As silicate clay forms from primary minerals, some iron is commonly released ashydrated oxides. These oxides are generally red, and even if they occur in smallamounts, they give the soil material a brownish color. They are largely responsible forthe strong brown, yellowish brown, or reddish brown colors that are dominant in thesubsoil of many soils in the survey area. In other soils, such as those in the Marlton,Sharptown, and Swedesboro series, the color of the subsoil or substratum tends tobe more olive or greenish because the parent material contains significant amountsof greenish glauconite, which often dominates the color of a developing subsoil.
The reduction and transfer of iron have occurred in all of the soils that are notcharacterized by good natural drainage. Soil features associated with chemicallyreduced iron are referred to as redoximorphic features. In poorly drained and verypoorly drained soils, seasonal saturation from water occurs for long periods at or nearthe soil surface. The reduction of iron is most intense in near-surface horizons sincethese horizons generally have higher amounts of organic matter than lower horizonsand organic matter is a source of food for micro-organisms. When the soil issaturated, micro-organisms rapidly deplete the oxygen in the soil, resulting in thereduction of iron. When saturated conditions drop to greater depths, generally duringthe warmer months, the reduced iron often reoxidizes, forming yellowish or reddishzones or masses. In poorly drained and very poorly drained soils such as those in theOthello, Fallsington, and Mullica series, the redoximorphic features are evidenced byreddish masses of reoxidized iron occurring in an essentially gray matrix in thesubsoil.
In somewhat poorly drained and moderately well drained soils, seasonal saturationfrom water occurs for shorter periods and at deeper depths below the soil surface. Insoils such as those in the Woodstown, Hammonton, and Galloway series, theredoximorphic features are evidenced by gray iron or clay depletions and reddishmasses of reoxidized iron occurring in an essentially yellow or brown matrix within thesubsoil. A gray matrix commonly occurs in the lower part of the subsoil or in thesubstratum of somewhat poorly drained soils.
163
Soil Survey of Salem County, New Jersey
American Association of State Highway and Transportation Officials (AASHTO). 2004.Standard specifications for transportation materials and methods of sampling andtesting. 24th edition.
American Society for Testing and Materials (ASTM). 2005. Standard classification ofsoils for engineering purposes. ASTM Standard D 2487-00.
Cowardin, L.M., V. Carter, F.C. Golet, and E.T. LaRoe. 1979. Classification of wetlandsand deep-water habitats of the United States. U.S. Fish and Wildlife Service FWS/OBS-79/31.
Federal Register. July 13, 1994. Changes in hydric soils of the United States.
Federal Register. September 18, 2002. Hydric soils of the United States.
Hurt, G.W., P.M. Whited, and R.F. Pringle, editors. Version 5.0, 2002. Field indicatorsof hydric soils in the United States.
Jenny, Hans. 1941. Factors of soil formation.
National Research Council. 1995. Wetlands: Characteristics and boundaries.
Newell, W.L., D.S. Powars, J.P. Owens, and J.S. Schindler. 1995. Surficial geologymap of New Jersey, southern sheet. U.S. Geological Survey and the New JerseyGeological Survey.
New Jersey Department of Environmental Protection, Division of Water Quality,Bureau of Nonpoint Pollution Control. 1999. Standards for individual subsurfacesewage disposal systems. State of New Jersey Administrative Code N.J.A.C. 7: 9A.
New Jersey Department of Environmental Protection, Office of Information ResourcesManagement, Bureau of Geographic Information and Analysis. 1986. Land use/landcover for Salem County, New Jersey.
Rosenau, J.C., S.M. Lang, G.S. Hilton, and J.G. Rooney. 1969. Geology and ground-water resources of Salem County, New Jersey. U.S. Geological Survey SpecialReport No. 33.
Soil Survey Division Staff. 1993. Soil survey manual. Soil Conservation Service. U.S.Department of Agriculture Handbook 18.
Soil Survey Staff. 1999. Soil taxonomy: A basic system of soil classification for makingand interpreting soil surveys. 2nd edition. Natural Resources Conservation Service.U.S. Department of Agriculture Handbook 436.
References
Soil Survey of Salem County, New Jersey
164
Soil Survey Staff. 2003. Keys to soil taxonomy. 9th edition. U.S. Department ofAgriculture, Natural Resources Conservation Service.
Tiner, R.W., Jr. 1985. Wetlands of Delaware. U.S. Fish and Wildlife Service andDelaware Department of Natural Resources and Environmental Control, WetlandsSection.
United States Army Corps of Engineers, Environmental Laboratory. 1987. Corps ofEngineers wetlands delineation manual. Waterways Experiment Station TechnicalReport Y-87-1.
United States Department of Agriculture, National Agricultural Statistics Service.2004. 2002 census of agriculture, New Jersey county level data, volume 1, chapter 2.
United States Department of Agriculture, Natural Resources Conservation Service.1996. National soil survey handbook, title 430-VI. (Available in the State Office of theNatural Resources Conservation Service at Somerset, New Jersey.)
United States Department of Agriculture, Soil Conservation Service. 1969. Soil surveyof Salem County, New Jersey.
United States Department of Commerce, Bureau of the Census. 2000. Census 2000summary file 1 (SF1), New Jersey.
165
Soil Survey of Salem County, New Jersey
ABC soil. A soil having an A, a B, and a C horizon.Ablation till. Loose, permeable till deposited during the final downwasting of glacial
ice. Lenses of crudely sorted sand and gravel are common.AC soil. A soil having only an A and a C horizon. Commonly, such soil formed in
recent alluvium or on steep, rocky slopes.Aeration, soil. The exchange of air in soil with air from the atmosphere. The air in a
well aerated soil is similar to that in the atmosphere; the air in a poorly aeratedsoil is considerably higher in carbon dioxide and lower in oxygen.
Aggregate, soil. Many fine particles held in a single mass or cluster. Natural soilaggregates, such as granules, blocks, or prisms, are called peds. Clods areaggregates produced by tillage or logging.
Alluvium. Material, such as sand, silt, or clay, deposited on land by streams.Alpha,alpha-dipyridyl. A dye that when dissolved in 1N ammonium acetate is used
to detect the presence of reduced iron (Fe II) in the soil. A positive reactionindicates a type of redoximorphic feature.
Animal unit month (AUM). The amount of forage required by one mature cow ofapproximately 1,000 pounds weight, with or without a calf, for 1 month.
Aquic conditions. Current soil wetness characterized by saturation, reduction, andredoximorphic features.
Argillic horizon. A subsoil horizon characterized by an accumulation of illuvial clay.Aspect. The direction in which a slope faces.Association, soil. A group of soils or miscellaneous areas geographically associated
in a characteristic repeating pattern and defined and delineated as a single mapunit.
Available water capacity (available moisture capacity). The capacity of soils tohold water available for use by most plants. It is commonly defined as thedifference between the amount of soil water at field moisture capacity and theamount at wilting point. It is commonly expressed as inches of water per inch ofsoil. The capacity, in inches, in a 60-inch profile or to a limiting layer is expressedas:
Very low .............................................................. 0 to 3
Low ...................................................................... 3 to 6
Moderate ............................................................. 6 to 9
High ................................................................... 9 to 12
Very high ................................................ more than 12
Backslope. The position that forms the steepest and generally linear, middle portionof a hillslope. In profile, backslopes are commonly bounded by a convex shoulderabove and a concave footslope below.
Basal area. The area of a cross section of a tree, generally referring to the section atbreast height and measured outside the bark. It is a measure of stand density,commonly expressed in square feet.
Glossary
Soil Survey of Salem County, New Jersey
166
Base saturation. The degree to which material having cation-exchange properties issaturated with exchangeable bases (sum of Ca, Mg, Na, and K), expressed as apercentage of the total cation-exchange capacity.
Base slope. A geomorphic component of hills consisting of the concave to linear(perpendicular to the contour) slope that, regardless of the lateral shape, formsan apron or wedge at the bottom of a hillside dominated by colluvium and slope-wash sediments (for example, slope alluvium).
Bedding planes. Fine strata, less than 5 millimeters thick, in unconsolidated alluvial,eolian, lacustrine, or marine sediment.
Bedding system. A drainage system made by plowing, grading, or otherwiseshaping the surface of a flat field. It consists of a series of low ridges separatedby shallow, parallel dead furrows.
Bench terrace. A raised, level or nearly level strip of earth constructed on or nearlyon a contour, supported by a barrier of rocks or similar material, and designed tomake the soil suitable for tillage and to prevent accelerated erosion.
Bisequum. Two sequences of soil horizons, each of which consists of an illuvialhorizon and the overlying eluvial horizons.
Blowout. A shallow depression from which all or most of the soil material has beenremoved by the wind. A blowout has a flat or irregular floor formed by a resistantlayer or by an accumulation of pebbles or cobbles. In some blowouts the watertable is exposed.
Bottom land. The normal flood plain of a stream, subject to flooding.Breaks. The steep and very steep broken land at the border of an upland summit that
is dissected by ravines.Breast height. An average height of 4.5 feet above the ground surface; the point on a
tree where diameter measurements are ordinarily taken.Brush management. Use of mechanical, chemical, or biological methods to make
conditions favorable for reseeding or to reduce or eliminate competition fromwoody vegetation and thus allow understory grasses and forbs to recover. Brushmanagement increases forage production and thus reduces the hazard oferosion. It can improve the habitat for some species of wildlife.
Cable yarding. A method of moving felled trees to a nearby central area for transportto a processing facility. Most cable yarding systems involve use of a drum, a pole,and wire cables in an arrangement similar to that of a rod and reel used forfishing. To reduce friction and soil disturbance, felled trees generally are reeled inwhile one end is lifted or the entire log is suspended.
Canopy. The leafy crown of trees or shrubs. (See Crown.)Capillary water. Water held as a film around soil particles and in tiny spaces between
particles. Surface tension is the adhesive force that holds capillary water in thesoil.
Catena. A sequence, or “chain,” of soils on a landscape that formed in similar kinds ofparent material but have different characteristics as a result of differences in reliefand drainage.
Cation. An ion carrying a positive charge of electricity. The common soil cations arecalcium, potassium, magnesium, sodium, and hydrogen.
Cation-exchange capacity. The total amount of exchangeable cations that can beheld by the soil, expressed in terms of milliquivalents per 100 grams of soil atneutrality (pH 7.0) or at some other stated pH value. The term, as applied to soils,is synonymous with base-exchange capacity but is more precise in meaning.
Catsteps. Very small, irregular terraces on steep hillsides, especially in pasture,formed by the trampling of cattle or the slippage of saturated soil.
Cement rock. Shaly limestone used in the manufacture of cement.Channery soil material. Soil material that has, by volume, 15 to 35 percent thin,
flat fragments of sandstone, shale, slate, limestone, or schist as much as
Soil Survey of Salem County, New Jersey
167
6 inches (15 centimeters) along the longest axis. A single piece is called achanner.
Chemical treatment. Control of unwanted vegetation through the use of chemicals.Chiseling. Tillage with an implement having one or more soil-penetrating points
that shatter or loosen hard, compacted layers to a depth below normal plowdepth.
Clay. As a soil separate, the mineral soil particles less than 0.002 millimeter indiameter. As a soil textural class, soil material that is 40 percent or more clay,less than 45 percent sand, and less than 40 percent silt.
Clay depletions. Low-chroma zones having a low content of iron, manganese, andclay because of the chemical reduction of iron and manganese and the removalof iron, manganese, and clay. A type of redoximorphic depletion.
Clay film. A thin coating of oriented clay on the surface of a soil aggregate or liningpores or root channels. Synonyms: clay coating, clay skin.
Claypan. A slowly permeable soil horizon that contains much more clay than thehorizons above it. A claypan is commonly hard when dry and plastic or stiff whenwet.
Climax plant community. The stabilized plant community on a particular site. Theplant cover reproduces itself and does not change so long as the environmentremains the same.
Coarse textured soil. Sand or loamy sand.Cobble (or cobblestone). A rounded or partly rounded fragment of rock 3 to
10 inches (7.6 to 25 centimeters) in diameter.Cobbly soil material. Material that has 15 to 35 percent, by volume, rounded or
partially rounded rock fragments 3 to 10 inches (7.6 to 25 centimeters) indiameter. Very cobbly soil material has 35 to 60 percent of these rock fragments,and extremely cobbly soil material has more than 60 percent.
COLE (coefficient of linear extensibility). See Linear extensibility.Complex slope. Irregular or variable slope. Planning or establishing terraces,
diversions, and other water-control structures on a complex slope isdifficult.
Complex, soil. A map unit of two or more kinds of soil or miscellaneous areas insuch an intricate pattern or so small in area that it is not practical to map themseparately at the selected scale of mapping. The pattern and proportion of thesoils or miscellaneous areas are somewhat similar in all areas.
Concretions. Cemented bodies with crude internal symmetry organized around apoint, a line, or a plane. They typically take the form of concentric layers visible tothe naked eye. Calcium carbonate, iron oxide, and manganese oxide are commoncompounds making up concretions. If formed in place, concretions of iron oxideor manganese oxide are generally considered a type of redoximorphicconcentration.
Congeliturbate. Soil material disturbed by frost action.Conglomerate. A coarse grained, clastic rock composed of rounded or subangular
rock fragments more than 2 millimeters in diameter. It commonly has a matrix ofsand and finer textured material. Conglomerate is the consolidated equivalent ofgravel.
Conservation cropping system. Growing crops in combination with needed culturaland management practices. In a good conservation cropping system, the soil-improving crops and practices more than offset the effects of the soil-depletingcrops and practices. Cropping systems are needed on all tilled soils. Soil-improving practices in a conservation cropping system include the use ofrotations that contain grasses and legumes and the return of crop residue to thesoil. Other practices include the use of green manure crops of grasses andlegumes, proper tillage, adequate fertilization, and weed and pest control.
Soil Survey of Salem County, New Jersey
168
Conservation tillage. A tillage system that does not invert the soil and that leaves aprotective amount of crop residue on the surface throughout the year.
Consistence, soil. Refers to the degree of cohesion and adhesion of soil materialand its resistance to deformation when ruptured. Consistence includes resistanceof soil material to rupture and to penetration; plasticity, toughness, and stickinessof puddled soil material; and the manner in which the soil material behaves whensubject to compression. Terms describing consistence are defined in the “SoilSurvey Manual.”
Contour stripcropping. Growing crops in strips that follow the contour. Strips ofgrass or close-growing crops are alternated with strips of clean-tilled crops orsummer fallow.
Control section. The part of the soil on which classification is based. The thicknessvaries among different kinds of soil, but for many it is that part of the soil profilebetween depths of 10 inches and 40 or 80 inches.
Coppice dune. A small dune of fine grained soil material stabilized around shrubs orsmall trees.
Coprogenous earth (sedimentary peat). Fecal material deposited in water byaquatic organisms.
Corrosion. Soil-induced electrochemical or chemical action that dissolves orweakens concrete or uncoated steel.
Cover crop. A close-growing crop grown primarily to improve and protect the soilbetween periods of regular crop production, or a crop grown between trees andvines in orchards and vineyards.
Cropping system. Growing crops according to a planned system of rotation andmanagement practices.
Crop residue management. Returning crop residue to the soil, which helps tomaintain soil structure, organic matter content, and fertility and helps to controlerosion.
Cross-slope farming. Deliberately conducting farming operations on slopingfarmland in such a way that tillage is across the general slope.
Crown. The upper part of a tree or shrub, including the living branches and theirfoliage.
Culmination of the mean annual increment (CMAI). The average annual increaseper acre in the volume of a stand. Computed by dividing the total volume of thestand by its age. As the stand increases in age, the mean annual incrementcontinues to increase until mortality begins to reduce the rate of increase. Thepoint where the stand reaches its maximum annual rate of growth is called theculmination of the mean annual increment.
Cutbanks cave (in tables). The walls of excavations tend to cave in or slough.Decreasers. The most heavily grazed climax range plants. Because they are the
most palatable, they are the first to be destroyed by overgrazing.Deferred grazing. Postponing grazing or resting grazing land for a prescribed period.Delta. A body of alluvium having a surface that is nearly flat and fan shaped;
deposited at or near the mouth of a river or stream where it enters a body ofrelatively quiet water, generally a sea or lake.
Dense layer (in tables). A very firm, massive layer that has a bulk density of morethan 1.8 grams per cubic centimeter. Such a layer affects the ease of digging andcan affect filling and compacting.
Depth, soil. Generally, the thickness of the soil over bedrock. Very deep soils aremore than 60 inches deep over bedrock; deep soils, 40 to 60 inches; moderatelydeep, 20 to 40 inches; shallow, 10 to 20 inches; and very shallow, less than10 inches.
Diversion (or diversion terrace). A ridge of earth, generally a terrace, built to protectdownslope areas by diverting runoff from its natural course.
Soil Survey of Salem County, New Jersey
169
Divided-slope farming. A form of field stripcropping in which crops are grown in asystematic arrangement of two strips, or bands, across the slope to reduce thehazard of water erosion. One strip is in a close-growing crop that providesprotection from erosion, and the other strip is in a crop that provides lessprotection from erosion. This practice is used where slopes are not long enoughto permit a full stripcropping pattern to be used.
Drainage class (natural). Refers to the frequency and duration of wet periods underconditions similar to those under which the soil formed. Alterations of the waterregime by human activities, either through drainage or irrigation, are not aconsideration unless they have significantly changed the morphology of the soil.Seven classes of natural soil drainage are recognized—excessively drained,somewhat excessively drained, well drained, moderately well drained, somewhatpoorly drained, poorly drained, and very poorly drained. These classes aredefined in the “Soil Survey Manual.”
Drainage, surface. Runoff, or surface flow of water, from an area.Draw. A small stream valley that generally is more open and has broader bottom land
than a ravine or gulch.Duff. A generally firm organic layer on the surface of mineral soils. It consists of fallen
plant material that is in the process of decomposition and includes everythingfrom the litter on the surface to underlying pure humus.
Ecological site. An area where climate, soil, and relief are sufficiently uniform toproduce a distinct natural plant community. An ecological site is the product of allthe environmental factors responsible for its development. It is typified by anassociation of species that differ from those on other ecological sites in kindand/or proportion of species or in total production.
Eluviation. The movement of material in true solution or colloidal suspension fromone place to another within the soil. Soil horizons that have lost material througheluviation are eluvial; those that have received material are illuvial.
Endosaturation. A type of saturation of the soil in which all horizons between theupper boundary of saturation and a depth of 2 meters are saturated.
Eolian soil material. Earthy parent material accumulated through wind action;commonly refers to sandy material in dunes or to loess in blankets on thesurface.
Ephemeral stream. A stream, or reach of a stream, that flows only in direct responseto precipitation. It receives no long-continued supply from melting snow or othersource, and its channel is above the water table at all times.
Episaturation. A type of saturation indicating a perched water table in a soil in whichsaturated layers are underlain by one or more unsaturated layers within 2 metersof the surface.
Erosion. The wearing away of the land surface by water, wind, ice, or other geologicagents and by such processes as gravitational creep.Erosion (geologic). Erosion caused by geologic processes acting over longgeologic periods and resulting in the wearing away of mountains and the buildingup of such landscape features as flood plains and coastal plains. Synonym:natural erosion.Erosion (accelerated). Erosion much more rapid than geologic erosion, mainly asa result of human or animal activities or of a catastrophe in nature, such as a fire,that exposes the surface.
Erosion pavement. A layer of gravel or stones that remains on the surface after fineparticles are removed by sheet or rill erosion.
Extrusive rock. Igneous rock derived from deep-seated molten matter (magma)emplaced on the earth’s surface.
Fallow. Cropland left idle in order to restore productivity through accumulation ofmoisture. Summer fallow is common in regions of limited rainfall where cereal
Soil Survey of Salem County, New Jersey
170
grain is grown. The soil is tilled for at least one growing season for weed controland decomposition of plant residue.
Fan terrace. A relict alluvial fan, no longer a site of active deposition, incised byyounger and lower alluvial surfaces.
Fertility, soil. The quality that enables a soil to provide plant nutrients, inadequate amounts and in proper balance, for the growth of specifiedplants when light, moisture, temperature, tilth, and other growth factorsare favorable.
Fibric soil material (peat). The least decomposed of all organic soil material. Peatcontains a large amount of well preserved fiber that is readily identifiableaccording to botanical origin. Peat has the lowest bulk density and the highestwater content at saturation of all organic soil material.
Field moisture capacity. The moisture content of a soil, expressed as a percentageof the ovendry weight, after the gravitational, or free, water has drained away; thefield moisture content 2 or 3 days after a soaking rain; also called normal fieldcapacity, normal moisture capacity, or capillary capacity.
Fill slope. A sloping surface consisting of excavated soil material from a road cut. Itcommonly is on the downhill side of the road.
Fine earth. That portion of the soil consisting of particles less than 2 millimeters indiameter. Particles and rock fragments 2 millimeters in diameter or larger are notincluded.
Fine textured soil. Sandy clay, silty clay, or clay.Firebreak. Area cleared of flammable material to stop or help control creeping or
running fires. It also serves as a line from which to work and to facilitate themovement of firefighters and equipment. Designated roads also serve asfirebreaks.
First bottom. The normal flood plain of a stream, subject to frequent or occasionalflooding.
Flaggy soil material. Material that has, by volume, 15 to 35 percent flagstones. Veryflaggy soil material has 35 to 60 percent flagstones, and extremely flaggy soilmaterial has more than 60 percent flagstones.
Flagstone. A thin fragment of sandstone, limestone, slate, shale, or (rarely) schist 6to 15 inches (15 to 38 centimeters) long.
Flood plain. A nearly level alluvial plain that borders a stream and is subject toflooding unless protected artificially.
Fluvial. Of or pertaining to rivers; produced by river action, as a fluvial plain.Foothill. A steeply sloping upland that has relief of as much as 1,000 feet
(300 meters) and fringes a mountain range or high-plateau escarpment.Footslope. The position that forms the inner, gently inclined surface at the base of a
hillslope. In profile, footslopes are commonly concave. A footslope is a transitionzone between upslope sites of erosion and transport (shoulders and backslopes)and downslope sites of deposition (toeslopes).
Forb. Any herbaceous plant not a grass or a sedge.Forest cover. All trees and other woody plants (underbrush) covering the ground in a
forest.Forest type. A stand of trees similar in composition and development because of
given physical and biological factors by which it may be differentiated from otherstands.
Fragipan. A loamy, brittle subsurface horizon low in porosity and content of organicmatter and low or moderate in clay but high in silt or very fine sand. A fragipanappears cemented and restricts roots. When dry, it is hard or very hard and has ahigher bulk density than the horizon or horizons above. When moist, it tends torupture suddenly under pressure rather than to deform slowly.
Soil Survey of Salem County, New Jersey
171
Genesis, soil. The mode of origin of the soil. Refers especially to the processes orsoil-forming factors responsible for the formation of the solum, or true soil, fromthe unconsolidated parent material.
Glauconite. A greenish mineral closely related to micas and essentially a hydrouspotassium iron silicate. It is a locally important mineral found in certain coastalplain marine sediments and is locally refered to as “greensand” or “marl.” Itcommonly occurs in soils as sand size “pellets.” New Jersey glauconite classesare based on percent glauconite by volume either in the mineralogy controlsection or upper part of the B horizon of a soil. They are as follows:
Very low ................................................ 0 to 2 percent
Low ...................................................... 2 to 10 percent
Moderate ........................................... 10 to 20 percent
High ................................................... 20 to 40 percent
Very high ................................... more than 40 percent
Glauconitic. Refers to soil or parent materials that contain glauconite.Gleyed soil. Soil that formed under poor drainage, resulting in the reduction of iron
and other elements in the profile and in gray colors.Graded stripcropping. Growing crops in strips that grade toward a protected
waterway.Grassed waterway. A natural or constructed waterway, typically broad and shallow,
seeded to grass as protection against erosion. Conducts surface water away fromcropland.
Gravel. Rounded or angular fragments of rock as much as 3 inches (2 millimeters to7.6 centimeters) in diameter. An individual piece is a pebble.
Gravelly soil material. Material that has 15 to 35 percent, by volume, rounded orangular rock fragments, not prominently flattened, as much as 3 inches(7.6 centimeters) in diameter.
Green manure crop (agronomy). A soil-improving crop grown to be plowed under inan early stage of maturity or soon after maturity.
Ground water. Water filling all the unblocked pores of the material below the watertable.
Gully. A miniature valley with steep sides cut by running water and through whichwater ordinarily runs only after rainfall. The distinction between a gully and a rill isone of depth. A gully generally is an obstacle to farm machinery and is too deepto be obliterated by ordinary tillage; a rill is of lesser depth and can be smoothedover by ordinary tillage.
Hard to reclaim (in tables). Reclamation is difficult after the removal of soil forconstruction and other uses. Revegetation and erosion control are extremelydifficult.
Head out. To form a flower head.Head slope. A geomorphic component of hills consisting of a laterally concave area
of a hillside, especially at the head of a drainageway. The overland waterflow isconverging.
Hemic soil material (mucky peat). Organic soil material intermediate in degree ofdecomposition between the less decomposed fibric material and the moredecomposed sapric material.
High-residue crops. Such crops as small grain and corn used for grain. If properlymanaged, residue from these crops can be used to control erosion until the nextcrop in the rotation is established. These crops return large amounts of organicmatter to the soil.
Hill. A natural elevation of the land surface, rising as much as 1,000 feet abovesurrounding lowlands, commonly of limited summit area and having a well
Soil Survey of Salem County, New Jersey
172
defined outline; hillsides generally have slopes of more than 15 percent. Thedistinction between a hill and a mountain is arbitrary and is dependent on localusage.
Horizon, soil. A layer of soil, approximately parallel to the surface, having distinctcharacteristics produced by soil-forming processes. In the identification of soilhorizons, an uppercase letter represents the major horizons. Numbers orlowercase letters that follow represent subdivisions of the major horizons. Anexplanation of the subdivisions is given in the “Soil Survey Manual.” The majorhorizons of mineral soil are as follows:O horizon.—An organic layer of fresh and decaying plant residue.A horizon.—The mineral horizon at or near the surface in which an accumulationof humified organic matter is mixed with the mineral material. Also, a plowedsurface horizon, most of which was originally part of a B horizon.E horizon.—The mineral horizon in which the main feature is loss of silicate clay,iron, aluminum, or some combination of these.B horizon.—The mineral horizon below an A horizon. The B horizon is in part alayer of transition from the overlying A to the underlying C horizon. The B horizonalso has distinctive characteristics, such as (1) accumulation of clay,sesquioxides, humus, or a combination of these; (2) prismatic or blocky structure;(3) redder or browner colors than those in the A horizon; or (4) a combination ofthese.C horizon.—The mineral horizon or layer, excluding indurated bedrock, that islittle affected by soil-forming processes and does not have the properties typicalof the overlying soil material. The material of a C horizon may be either like orunlike that in which the solum formed. If the material is known to differ from that inthe solum, an Arabic numeral, commonly a 2, precedes the letter C.Cr horizon.—Soft, consolidated bedrock beneath the soil.R layer.—Consolidated bedrock beneath the soil. The bedrock commonlyunderlies a C horizon, but it can be directly below an A or a B horizon.
Humus. The well decomposed, more or less stable part of the organic matter inmineral soils.
Hydrologic soil groups. Refers to soils grouped according to their runoff potential.The soil properties that influence this potential are those that affect the minimumrate of water infiltration on a bare soil during periods after prolonged wettingwhen the soil is not frozen. These properties are depth to a seasonal high watertable, the infiltration rate and permeability after prolonged wetting, and depth to avery slowly permeable layer. The slope and the kind of plant cover are notconsidered but are separate factors in predicting runoff.
Igneous rock. Rock formed by solidification from a molten or partially molten state.Major varieties include plutonic and volcanic rock. Examples are andesite, basalt,and granite.
Illuviation. The movement of soil material from one horizon to another in the soilprofile. Generally, material is removed from an upper horizon and deposited in alower horizon.
Impervious soil. A soil through which water, air, or roots penetrate slowly or not atall. No soil is absolutely impervious to air and water all the time.
Increasers. Species in the climax vegetation that increase in amount as the moredesirable plants are reduced by close grazing. Increasers commonly are theshorter plants and the less palatable to livestock.
Infiltration. The downward entry of water into the immediate surface of soil or othermaterial, as contrasted with percolation, which is movement of water through soillayers or material.
Infiltration capacity. The maximum rate at which water can infiltrate into a soil undera given set of conditions.
Soil Survey of Salem County, New Jersey
173
Infiltration rate. The rate at which water penetrates the surface of the soil at anygiven instant, usually expressed in inches per hour. The rate can be limited bythe infiltration capacity of the soil or the rate at which water is applied at thesurface.
Intake rate. The average rate of water entering the soil under irrigation. Most soilshave a fast initial rate; the rate decreases with application time. Therefore, intakerate for design purposes is not a constant but is a variable depending on the netirrigation application. The rate of water intake, in inches per hour, is expressed asfollows:
Less than 0.2 ................................................. very low
0.2 to 0.4 ................................................................ low
0.4 to 0.75 ........................................... moderately low
0.75 to 1.25 .................................................. moderate
1.25 to 1.75 ........................................ moderately high
1.75 to 2.5 ............................................................. high
More than 2.5 ................................................ very high
Interfluve. An elevated area between two drainageways that sheds water to thosedrainageways.
Intermittent stream. A stream, or reach of a stream, that flows for prolongedperiods only when it receives ground-water discharge or long, continuedcontributions from melting snow or other surface and shallow subsurfacesources.
Invaders. On range, plants that encroach into an area and grow after the climaxvegetation has been reduced by grazing. Generally, plants invade followingdisturbance of the surface.
Iron depletions. Low-chroma zones having a low content of iron and manganeseoxide because of chemical reduction and removal, but having a clay contentsimilar to that of the adjacent matrix. A type of redoximorphic depletion.
Irrigation. Application of water to soils to assist in production of crops. Methods ofirrigation are:Basin.—Water is applied rapidly to nearly level plains surrounded by levees ordikes.Border.—Water is applied at the upper end of a strip in which the lateral flow ofwater is controlled by small earth ridges called border dikes, or borders.Controlled flooding.—Water is released at intervals from closely spaced fieldditches and distributed uniformly over the field.Corrugation.—Water is applied to small, closely spaced furrows or ditches infields of close-growing crops or in orchards so that it flows in only one direction.Drip (or trickle).—Water is applied slowly and under low pressure to the surfaceof the soil or into the soil through such applicators as emitters, porous tubing, orperforated pipe.Furrow.—Water is applied in small ditches made by cultivation implements.Furrows are used for tree and row crops.Sprinkler.—Water is sprayed over the soil surface through pipes or nozzles from apressure system.Subirrigation.—Water is applied in open ditches or tile lines until the water table israised enough to wet the soil.Wild flooding.—Water, released at high points, is allowed to flow onto an areawithout controlled distribution.
Knoll. A small, low, rounded hill rising above adjacent landforms.Ksat. Saturated hydraulic conductivity. (See Permeability.)Lacustrine deposit. Material deposited in lake water and exposed when the water
level is lowered or the elevation of the land is raised.
Soil Survey of Salem County, New Jersey
174
Landslide. The rapid downhill movement of a mass of soil and loose rock, generallywhen wet or saturated. The speed and distance of movement, as well as theamount of soil and rock material, vary greatly.
Large stones (in tables). Rock fragments 3 inches (7.6 centimeters) or more across.Large stones adversely affect the specified use of the soil.
Leaching. The removal of soluble material from soil or other material by percolatingwater.
Linear extensibility. Refers to the change in length of an unconfined clod asmoisture content is decreased from a moist to a dry state. Linear extensibility isused to determine the shrink-swell potential of soils. It is an expression of thevolume change between the water content of the clod at 1/3- or 1/10-bar tension(33kPa or 10kPa tension) and oven dryness. Volume change is influenced by theamount and type of clay minerals in the soil. The volume change is the percentchange for the whole soil. If it is expressed as a fraction, the resulting value isCOLE, coefficient of linear extensibility.
Liquid limit. The moisture content at which the soil passes from a plastic to a liquidstate.
Loam. Soil material that is 7 to 27 percent clay particles, 28 to 50 percent siltparticles, and less than 52 percent sand particles.
Loess. Fine grained material, dominantly of silt-sized particles, deposited by wind.Low-residue crops. Such crops as corn used for silage, peas, beans, and potatoes.
Residue from these crops is not adequate to control erosion until the next crop inthe rotation is established. These crops return little organic matter to the soil.
Low strength. The soil is not strong enough to support loads.Masses. Concentrations of substances in the soil matrix that do not have a clearly
defined boundary with the surrounding soil material and cannot be removed as adiscrete unit. Common compounds making up masses are calcium carbonate,gypsum or other soluble salts, iron oxide, and manganese oxide. Massesconsisting of iron oxide or manganese oxide generally are considered a type ofredoximorphic concentration.
Mechanical treatment. Use of mechanical equipment for seeding, brushmanagement, and other management practices.
Medium textured soil. Very fine sandy loam, loam, silt loam, or silt.Metamorphic rock. Rock of any origin altered in mineralogical composition, chemical
composition, or structure by heat, pressure, and movement. Nearly all such rocksare crystalline.
Mineral soil. Soil that is mainly mineral material and low in organic material. Its bulkdensity is more than that of organic soil.
Minimum tillage. Only the tillage essential to crop production and prevention of soildamage.
Miscellaneous area. An area that has little or no natural soil and supports little or novegetation.
Moderately coarse textured soil. Coarse sandy loam, sandy loam, or fine sandyloam.
Moderately fine textured soil. Clay loam, sandy clay loam, or silty clay loam.Mollic epipedon. A thick, dark, humus-rich surface horizon (or horizons) that has
high base saturation and pedogenic soil structure. It may include the upper partof the subsoil.
Morphology, soil. The physical makeup of the soil, including the texture, structure,porosity, consistence, color, and other physical, mineral, and biological propertiesof the various horizons, and the thickness and arrangement of those horizons inthe soil profile.
Mottling, soil. Irregular spots of different colors that vary in number and size.Descriptive terms are as follows: abundance—few, common, and many;
Soil Survey of Salem County, New Jersey
175
size—fine, medium, and coarse; and contrast—faint, distinct, and prominent.The size measurements are of the diameter along the greatest dimension.Fine indicates less than 5 millimeters (about 0.2 inch); medium, from 5 to15 millimeters (about 0.2 to 0.6 inch); and coarse, more than 15 millimeters(about 0.6 inch).
Muck. Dark, finely divided, well decomposed organic soil material. (See Sapric soilmaterial.)
Munsell notation. A designation of color by degrees of three simple variables—hue,value, and chroma. For example, a notation of 10YR 6/4 is a color with hue of10YR, value of 6, and chroma of 4.
Neutral soil. A soil having a pH value of 6.6 to 7.3. (See Reaction, soil.)Nodules. Cemented bodies lacking visible internal structure. Calcium carbonate, iron
oxide, and manganese oxide are common compounds making up nodules. Ifformed in place, nodules of iron oxide or manganese oxide are considered typesof redoximorphic concentrations.
Nose slope. A geomorphic component of hills consisting of the projecting end(laterally convex area) of a hillside. The overland waterflow is predominantlydivergent.
Nutrient, plant. Any element taken in by a plant essential to its growth. Plantnutrients are mainly nitrogen, phosphorus, potassium, calcium, magnesium,sulfur, iron, manganese, copper, boron, and zinc obtained from the soil andcarbon, hydrogen, and oxygen obtained from the air and water.
Organic matter. Plant and animal residue in the soil in various stages ofdecomposition. The content of organic matter in the surface layer is described asfollows:
Very low ..................................... less than 0.5 percent
Low .................................................. 0.5 to 1.0 percent
Moderately low ................................ 1.0 to 2.0 percent
Moderate ......................................... 2.0 to 4.0 percent
High ................................................. 4.0 to 8.0 percent
Very high .................................. more than 8.0 percent
Pan. A compact, dense layer in a soil that impedes the movement of water and thegrowth of roots. For example, hardpan, fragipan, claypan, plowpan, and trafficpan.
Parent material. The unconsolidated organic and mineral material in which soilforms.
Peat. Unconsolidated material, largely undecomposed organic matter, that hasaccumulated under excess moisture. (See Fibric soil material.)
Pebble. A rounded or angular fragment of rock as much as 3 inches (2 millimeters to7.6 centimeters) in diameter. A collection of pebbles is referred to as gravel.
Ped. An individual natural soil aggregate, such as a granule, a prism, or a block.Pedisediment. A thin layer of alluvial material that mantles an erosion surface and
has been transported to its present position from higher lying areas of the erosionsurface.
Pedon. The smallest volume that can be called “a soil.” A pedon is three dimensionaland large enough to permit study of all horizons. Its area ranges from about 10 to100 square feet (1 square meter to 10 square meters), depending on thevariability of the soil.
Percolation. The movement of water through the soil.Permeability. The quality of the soil that enables water or air to move downward
through the profile. The rate at which a saturated soil transmits water is acceptedas a measure of this quality. In soil physics, the rate is referred to as “saturatedhydraulic conductivity,” which is defined in the “Soil Survey Manual.” In line with
Soil Survey of Salem County, New Jersey
176
conventional usage in the engineering profession and with traditional usage inpublished soil surveys, this rate of flow continues to be expressed as“permeability.” Terms describing permeability, measured in inches per hour, are asfollows:
Impermeable ............................. less than 0.0015 inch
Very slow ...................................... 0.0015 to 0.06 inch
Slow .................................................... 0.06 to 0.2 inch
Moderately slow .................................... 0.2 to 0.6 inch
Moderate ................................... 0.6 inch to 2.0 inches
Moderately rapid ............................... 2.0 to 6.0 inches
Rapid .................................................. 6.0 to 20 inches
Very rapid ................................... more than 20 inches
Phase, soil. A subdivision of a soil series based on features that affect its use andmanagement, such as slope, stoniness, and flooding.
pH value. A numerical designation of acidity and alkalinity in soil. (See Reaction,soil.)
Piping (in tables). Formation of subsurface tunnels or pipelike cavities by watermoving through the soil.
Pitting (in tables). Pits caused by melting around ice. They form on the soil after plantcover is removed.
Plasticity index. The numerical difference between the liquid limit and the plasticlimit; the range of moisture content within which the soil remains plastic.
Plastic limit. The moisture content at which a soil changes from semisolid toplastic.
Plinthite. The sesquioxide-rich, humus-poor, highly weathered mixture of clay withquartz and other diluents. It commonly appears as red mottles, usually in platy,polygonal, or reticulate patterns. Plinthite changes irreversibly to an ironstonehardpan or to irregular aggregates on repeated wetting and drying, especially if itis exposed also to heat from the sun. In a moist soil, plinthite can be cut with aspade. It is a form of laterite.
Plowpan. A compacted layer formed in the soil directly below the plowed layer.Ponding. Standing water on soils in closed depressions. Unless the soils are
artificially drained, the water can be removed only by percolation orevapotranspiration.
Poorly graded. Refers to a coarse grained soil or soil material consisting mainly ofparticles of nearly the same size. Because there is little difference in size of theparticles, density can be increased only slightly by compaction.
Potential native plant community. See Climax plant community.Potential rooting depth (effective rooting depth). Depth to which roots could
penetrate if the content of moisture in the soil were adequate. The soil has noproperties restricting the penetration of roots to this depth.
Prescribed burning. Deliberately burning an area for specific managementpurposes, under the appropriate conditions of weather and soil moisture and atthe proper time of day.
Productivity, soil. The capability of a soil for producing a specified plant or sequenceof plants under specific management.
Profile, soil. A vertical section of the soil extending through all its horizons and intothe parent material.
Proper grazing use. Grazing at an intensity that maintains enough cover to protectthe soil and maintain or improve the quantity and quality of the desirablevegetation. This practice increases the vigor and reproduction capacity of the keyplants and promotes the accumulation of litter and mulch necessary to conservesoil and water.
Soil Survey of Salem County, New Jersey
177
Reaction, soil. A measure of acidity or alkalinity of a soil, expressed in pH values. Asoil that tests to pH 7.0 is described as precisely neutral in reaction because it isneither acid nor alkaline. The degrees of acidity or alkalinity, expressed as pHvalues, are:
Ultra acid ................................................. less than 3.5
Extremely acid .............................................. 3.5 to 4.4
Very strongly acid ......................................... 4.5 to 5.0
Strongly acid ................................................. 5.1 to 5.5
Moderately acid ............................................ 5.6 to 6.0
Slightly acid ................................................... 6.1 to 6.5
Neutral ........................................................... 6.6 to 7.3
Slightly alkaline ............................................. 7.4 to 7.8
Moderately alkaline ...................................... 7.9 to 8.4
Strongly alkaline ........................................... 8.5 to 9.0
Very strongly alkaline .......................... 9.1 and higher
Redoximorphic concentrations. Nodules, concretions, soft masses, porelinings, and other features resulting from the accumulation of iron ormanganese oxide. An indication of chemical reduction and oxidation resultingfrom saturation.
Redoximorphic depletions. Low-chroma zones from which iron and manganeseoxide or a combination of iron and manganese oxide and clay has been removed.These zones are indications of the chemical reduction of iron resulting fromsaturation.
Redoximorphic features. Redoximorphic concentrations, redoximorphic depletions,reduced matrices, a positive reaction to alpha,alpha-dipyridyl, and other featuresindicating the chemical reduction and oxidation of iron and manganesecompounds resulting from saturation.
Reduced matrix. A soil matrix that has low chroma in situ because of chemicallyreduced iron (Fe II). The chemical reduction results from nearly continuouswetness. The matrix undergoes a change in hue or chroma within 30 minutesafter exposure to air as the iron is oxidized (Fe III). A type of redoximorphicfeature.
Regolith. The unconsolidated mantle of weathered rock and soil material on theearth’s surface; the loose earth material above the solid rock.
Relief. The elevations or inequalities of a land surface, considered collectively.Residuum (residual soil material). Unconsolidated, weathered or partly weathered
mineral material that accumulated as consolidated rock disintegrated in place.Rill. A steep-sided channel resulting from accelerated erosion. A rill generally is a few
inches deep and not wide enough to be an obstacle to farm machinery.Road cut. A sloping surface produced by mechanical means during road
construction. It is commonly on the uphill side of the road.Rock fragments. Rock or mineral fragments having a diameter of 2 millimeters or
more; for example, pebbles, cobbles, stones, and boulders.Root zone. The part of the soil that can be penetrated by plant roots.Runoff. The precipitation discharged into stream channels from an area. The water
that flows off the surface of the land without sinking into the soil is called surfacerunoff. Water that enters the soil before reaching surface streams is calledground-water runoff or seepage flow from ground water.
Sand. As a soil separate, individual rock or mineral fragments from 0.05 millimeterto 2.0 millimeters in diameter. Most sand grains consist of quartz. As a soiltextural class, a soil that is 85 percent or more sand and not more than10 percent clay.
Sandstone. Sedimentary rock containing dominantly sand-sized particles.
Soil Survey of Salem County, New Jersey
178
Sapric soil material (muck). The most highly decomposed of all organic soilmaterial. Muck has the least amount of plant fiber, the highest bulk density, andthe lowest water content at saturation of all organic soil material.
Saturation. Wetness characterized by zero or positive pressure of the soil water.Under conditions of saturation, the water will flow from the soil matrix into anunlined auger hole.
Scarification. The act of abrading, scratching, loosening, crushing, or modifying thesurface to increase water absorption or to provide a more tillable soil.
Second bottom. The first terrace above the normal flood plain (or first bottom) of ariver.
Sedimentary rock. Rock made up of particles deposited from suspension in water.The chief kinds of sedimentary rock are conglomerate, formed from gravel;sandstone, formed from sand; shale, formed from clay; and limestone, formedfrom soft masses of calcium carbonate. There are many intermediate types.Some wind-deposited sand is consolidated into sandstone.
Sequum. A sequence consisting of an illuvial horizon and the overlying eluvialhorizon. (See Eluviation.)
Series, soil. A group of soils that have profiles that are almost alike, except fordifferences in texture of the surface layer. All the soils of a series have horizonsthat are similar in composition, thickness, and arrangement.
Shale. Sedimentary rock formed by the hardening of a clay deposit.Sheet erosion. The removal of a fairly uniform layer of soil material from the land
surface by the action of rainfall and surface runoff.Shoulder. The position that forms the uppermost inclined surface near the top of a
hillslope. It is a transition from backslope to summit. The surface is dominantlyconvex in profile and erosional in origin.
Shrink-swell (in tables). The shrinking of soil when dry and the swelling when wet.Shrinking and swelling can damage roads, dams, building foundations, and otherstructures. It can also damage plant roots.
Side slope. A geomorphic component of hills consisting of a laterally planar area of ahillside. The overland waterflow is predominantly parallel.
Silica. A combination of silicon and oxygen. The mineral form is called quartz.Silica-sesquioxide ratio. The ratio of the number of molecules of silica to the
number of molecules of alumina and iron oxide. The more highly weathered soilsor their clay fractions in warm-temperate, humid regions, and especially those inthe tropics, generally have a low ratio.
Silt. As a soil separate, individual mineral particles that range in diameter from theupper limit of clay (0.002 millimeter) to the lower limit of very fine sand(0.05 millimeter). As a soil textural class, soil that is 80 percent or more silt andless than 12 percent clay.
Siltstone. Sedimentary rock made up of dominantly silt-sized particles.Similar soils. Soils that share limits of diagnostic criteria, behave and perform in a
similar manner, and have similar conservation needs or managementrequirements for the major land uses in the survey area.
Site index. A designation of the quality of a forest site based on the height of thedominant stand at an arbitrarily chosen age. For example, if the average heightattained by dominant and codominant trees in a fully stocked stand at the age of50 years is 75 feet, the site index is 75.
Slope. The inclination of the land surface from the horizontal. Percentage of slope isthe vertical distance divided by horizontal distance, then multiplied by 100. Thus,a slope of 20 percent is a drop of 20 feet in 100 feet of horizontal distance. In thissurvey, classes for simple slopes are as follows:
Level ...................................................... 0 to 1 percent
Nearly level ........................................... 0 to 2 percent
Soil Survey of Salem County, New Jersey
179
Gently sloping ....................................... 2 to 5 percent
Strongly sloping .................................. 5 to 10 percent
Moderately steep .............................. 10 to 15 percent
Steep ................................................. 15 to 25 percent
Very steep ................................ 25 percent and higher
Slow refill (in tables). The slow filling of ponds, resulting from restricted permeabilityin the soil.
Sodicity. The degree to which a soil is affected by exchangeable sodium. Sodicity isexpressed as a sodium adsorption ratio (SAR) of a saturation extract, or the ratioof Na+ to Ca++ + Mg++. The degrees of sodicity and their respective ratios are:
Slight ..................................................... less than 13:1
Moderate ......................................................... 13-30:1
Strong .................................................. more than 30:1
Sodium adsorption ratio (SAR). A measure of the amount of sodium (Na) relative tocalcium (Ca) and magnesium (Mg) in the water extract from saturated soil paste.It is the ratio of the Na concentration divided by the square root of one-half of theCa + Mg concentration.
Soil. A natural, three-dimensional body at the earth’s surface. It is capable ofsupporting plants and has properties resulting from the integrated effect ofclimate and living matter acting on earthy parent material, as conditioned by reliefover periods of time.
Soil separates. Mineral particles less than 2 millimeters in equivalent diameter andranging between specified size limits. The names and sizes, in millimeters, ofseparates recognized in the United States are as follows:
Very coarse sand .......................................... 2.0 to 1.0
Coarse sand ................................................. 1.0 to 0.5
Medium sand ............................................. 0.5 to 0.25
Fine sand ................................................. 0.25 to 0.10
Very fine sand .......................................... 0.10 to 0.05
Silt .......................................................... 0.05 to 0.002
Clay ..................................................... less than 0.002
Solum. The upper part of a soil profile, above the C horizon, in which the processesof soil formation are active. The solum in soil consists of the A, E, and B horizons.Generally, the characteristics of the material in these horizons are unlike those ofthe material below the solum. The living roots and plant and animal activities arelargely confined to the solum.
Stone line. A concentration of coarse fragments in a soil. Generally, it is indicative ofan old weathered surface. In a cross section, the line may be one fragment ormore thick. It generally overlies material that weathered in place and is overlainby recent sediment of variable thickness.
Stones. Rock fragments 10 to 24 inches (25 to 60 centimeters) in diameter if roundedor 15 to 24 inches (38 to 60 centimeters) in length if flat.
Stony. Refers to a soil containing stones in numbers that interfere with or preventtillage.
Stripcropping. Growing crops in a systematic arrangement of strips or bands thatprovide vegetative barriers to wind erosion and water erosion.
Structure, soil. The arrangement of primary soil particles into compound particles oraggregates. The principal forms of soil structure are—platy (laminated), prismatic(vertical axis of aggregates longer than horizontal), columnar (prisms withrounded tops), blocky (angular or subangular), and granular. Structureless soilsare either single grained (each grain by itself, as in dune sand) or massive (theparticles adhering without any regular cleavage, as in many hardpans).
Soil Survey of Salem County, New Jersey
180
Stubble mulch. Stubble or other crop residue left on the soil or partly worked into thesoil. It protects the soil from wind erosion and water erosion after harvest, duringpreparation of a seedbed for the next crop, and during the early growing period ofthe new crop.
Subsoil. Technically, the B horizon; roughly, the part of the solum below plow depth.Subsoiling. Tilling a soil below normal plow depth, ordinarily to shatter a hardpan or
claypan.Substratum. The part of the soil below the solum.Subsurface layer. Any surface soil horizon (A, E, AB, or EB) below the surface layer.Summer fallow. The tillage of uncropped land during the summer to control weeds
and allow storage of moisture in the soil for the growth of a later crop. A practicecommon in semiarid regions, where annual precipitation is not enough to producea crop every year. Summer fallow is frequently practiced before planting wintergrain.
Summit. The topographically highest position of a hillslope. It has a nearly level(planar or only slightly convex) surface.
Surface layer. The soil ordinarily moved in tillage, or its equivalent in uncultivatedsoil, ranging in depth from 4 to 10 inches (10 to 25 centimeters). Frequentlydesignated as the “plow layer,” or the “Ap horizon.”
Surface soil. The A, E, AB, and EB horizons, considered collectively. It includes allsubdivisions of these horizons.
Taxadjuncts. Soils that cannot be classified in a series recognized in theclassification system. Such soils are named for a series they strongly resembleand are designated as taxadjuncts to that series because they differ in ways toosmall to be of consequence in interpreting their use and behavior. Soils arerecognized as taxadjuncts only when one or more of their characteristics areslightly outside the range defined for the family of the series for which the soilsare named.
Terrace. An embankment, or ridge, constructed across sloping soils on the contour orat a slight angle to the contour. The terrace intercepts surface runoff so that watersoaks into the soil or flows slowly to a prepared outlet. A terrace in a fieldgenerally is built so that the field can be farmed. A terrace intended mainly fordrainage has a deep channel that is maintained in permanent sod.
Terrace (geologic). An old alluvial plain, ordinarily flat or undulating, bordering a river,a lake, or the sea.
Texture, soil. The relative proportions of sand, silt, and clay particles in a mass ofsoil. The basic textural classes, in order of increasing proportion of fine particles,are sand, loamy sand, sandy loam, loam, silt loam, silt, sandy clay loam, clayloam, silty clay loam, sandy clay, silty clay, and clay. The sand, loamy sand, andsandy loam classes may be further divided by specifying “coarse,” “fine,” or “veryfine.”
Thin layer (in tables). Otherwise suitable soil material that is too thin for the specifieduse.
Tilth, soil. The physical condition of the soil as related to tillage, seedbedpreparation, seedling emergence, and root penetration.
Toeslope. The position that forms the gently inclined surface at the base of ahillslope. Toeslopes in profile are commonly gentle and linear and areconstructional surfaces forming the lower part of a hillslope continuum thatgrades to valley or closed-depression floors.
Topsoil. The upper part of the soil, which is the most favorable material for plantgrowth. It is ordinarily rich in organic matter and is used to topdress roadbanks,lawns, and land affected by mining.
Trace elements. Chemical elements, for example, zinc, cobalt, manganese, copper,and iron, in soils in extremely small amounts. They are essential to plant growth.
Soil Survey of Salem County, New Jersey
181
Upland. Land at a higher elevation, in general, than the alluvial plain or streamterrace; land above the lowlands along streams.
Variegation. Refers to patterns of contrasting colors assumed to be inherited fromthe parent material rather than to be the result of poor drainage.
Varve. A sedimentary layer or a lamina or sequence of laminae deposited in a bodyof still water within a year. Specifically, a thin pair of graded glaciolacustrine layersseasonally deposited, usually by meltwater streams, in a glacial lake or otherbody of still water in front of a glacier.
Water bars. Smooth, shallow ditches or depressional areas that are excavated at anangle across a sloping road. They are used to reduce the downward velocity ofwater and divert it off and away from the road surface. Water bars can easily bedriven over if constructed properly.
Weathering. All physical and chemical changes produced in rocks or other depositsat or near the earth’s surface by atmospheric agents. These changes result indisintegration and decomposition of the material.
Well graded. Refers to soil material consisting of coarse grained particles that arewell distributed over a wide range in size or diameter. Such soil normally can beeasily increased in density and bearing properties by compaction. Contrasts withpoorly graded soil.
Wilting point (or permanent wilting point). The moisture content of soil, on anovendry basis, at which a plant (specifically a sunflower) wilts so much that itdoes not recover when placed in a humid, dark chamber.
Windthrow. The uprooting and tipping over of trees by the wind.


183
Soil Survey of Salem County, New Jersey
Tables
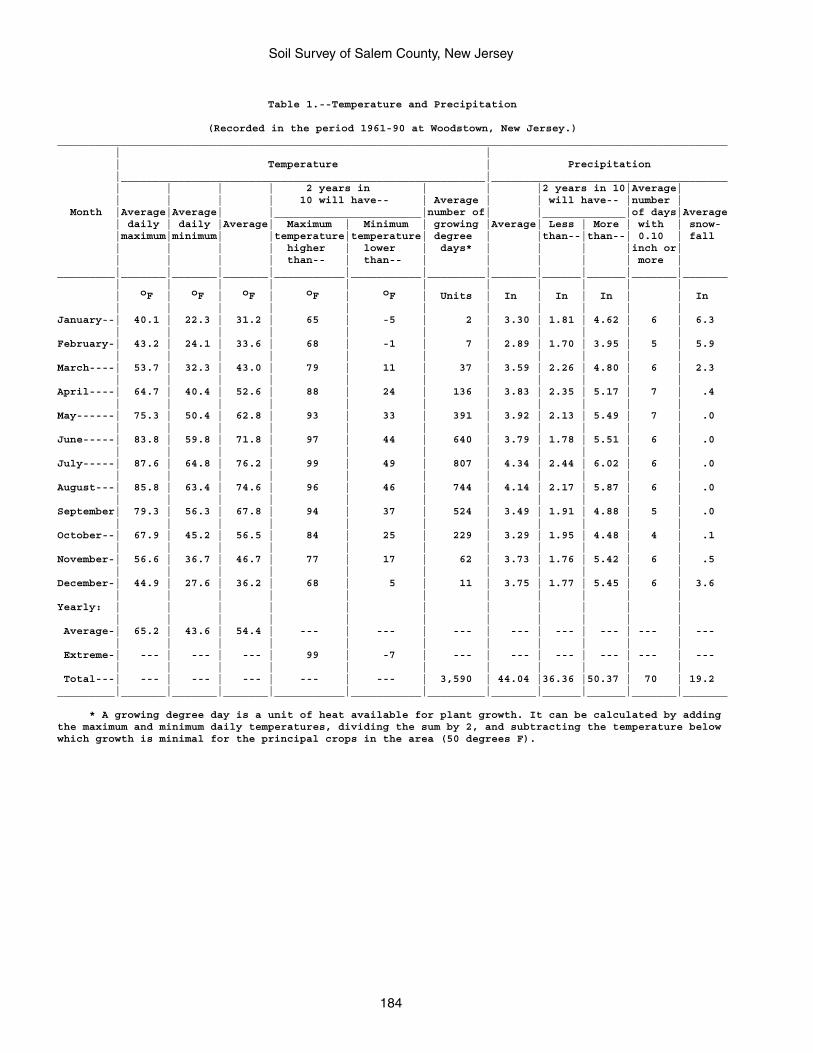
Soil Survey of Salem County, New Jersey
184
Table 1.--Temperature and Precipitation
(Recorded in the period 1961-90 at Woodstown, New Jersey.)_________________________________________________________________________________________________________ | | | Temperature | Precipitation |_________________________________________________________|_____________________________________ | | | | 2 years in | | |2 years in 10|Average| | | | | 10 will have-- | Average | | will have-- |number | Month |Average|Average| |_______________________|number of| |_____________|of days|Average | daily | daily |Average| Maximum | Minimum | growing |Average| Less | More | with | snow- |maximum|minimum| |temperature|temperature| degree | |than--|than--| 0.10 | fall | | | | higher | lower | days* | | | |inch or| | | | | than-- | than-- | | | | | more |_________|_______|_______|_______|___________|___________|_________|_______|______|______|_______|_______ | | | | | | | | | | | | oF | oF | oF | oF | oF | Units | In | In | In | | In | | | | | | | | | | |January--| 40.1 | 22.3 | 31.2 | 65 | -5 | 2 | 3.30 | 1.81 | 4.62 | 6 | 6.3 | | | | | | | | | | |February-| 43.2 | 24.1 | 33.6 | 68 | -1 | 7 | 2.89 | 1.70 | 3.95 | 5 | 5.9 | | | | | | | | | | |March----| 53.7 | 32.3 | 43.0 | 79 | 11 | 37 | 3.59 | 2.26 | 4.80 | 6 | 2.3 | | | | | | | | | | |April----| 64.7 | 40.4 | 52.6 | 88 | 24 | 136 | 3.83 | 2.35 | 5.17 | 7 | .4 | | | | | | | | | | |May------| 75.3 | 50.4 | 62.8 | 93 | 33 | 391 | 3.92 | 2.13 | 5.49 | 7 | .0 | | | | | | | | | | |June-----| 83.8 | 59.8 | 71.8 | 97 | 44 | 640 | 3.79 | 1.78 | 5.51 | 6 | .0 | | | | | | | | | | |July-----| 87.6 | 64.8 | 76.2 | 99 | 49 | 807 | 4.34 | 2.44 | 6.02 | 6 | .0 | | | | | | | | | | |August---| 85.8 | 63.4 | 74.6 | 96 | 46 | 744 | 4.14 | 2.17 | 5.87 | 6 | .0 | | | | | | | | | | |September| 79.3 | 56.3 | 67.8 | 94 | 37 | 524 | 3.49 | 1.91 | 4.88 | 5 | .0 | | | | | | | | | | |October--| 67.9 | 45.2 | 56.5 | 84 | 25 | 229 | 3.29 | 1.95 | 4.48 | 4 | .1 | | | | | | | | | | |November-| 56.6 | 36.7 | 46.7 | 77 | 17 | 62 | 3.73 | 1.76 | 5.42 | 6 | .5 | | | | | | | | | | |December-| 44.9 | 27.6 | 36.2 | 68 | 5 | 11 | 3.75 | 1.77 | 5.45 | 6 | 3.6 | | | | | | | | | | |Yearly: | | | | | | | | | | | | | | | | | | | | | | Average-| 65.2 | 43.6 | 54.4 | --- | --- | --- | --- | --- | --- | --- | --- | | | | | | | | | | | Extreme-| --- | --- | --- | 99 | -7 | --- | --- | --- | --- | --- | --- | | | | | | | | | | | Total---| --- | --- | --- | --- | --- | 3,590 | 44.04 |36.36 |50.37 | 70 | 19.2_________|_______|_______|_______|___________|___________|_________|_______|______|______|_______|_______
* A growing degree day is a unit of heat available for plant growth. It can be calculated by addingthe maximum and minimum daily temperatures, dividing the sum by 2, and subtracting the temperature belowwhich growth is minimal for the principal crops in the area (50 degrees F).
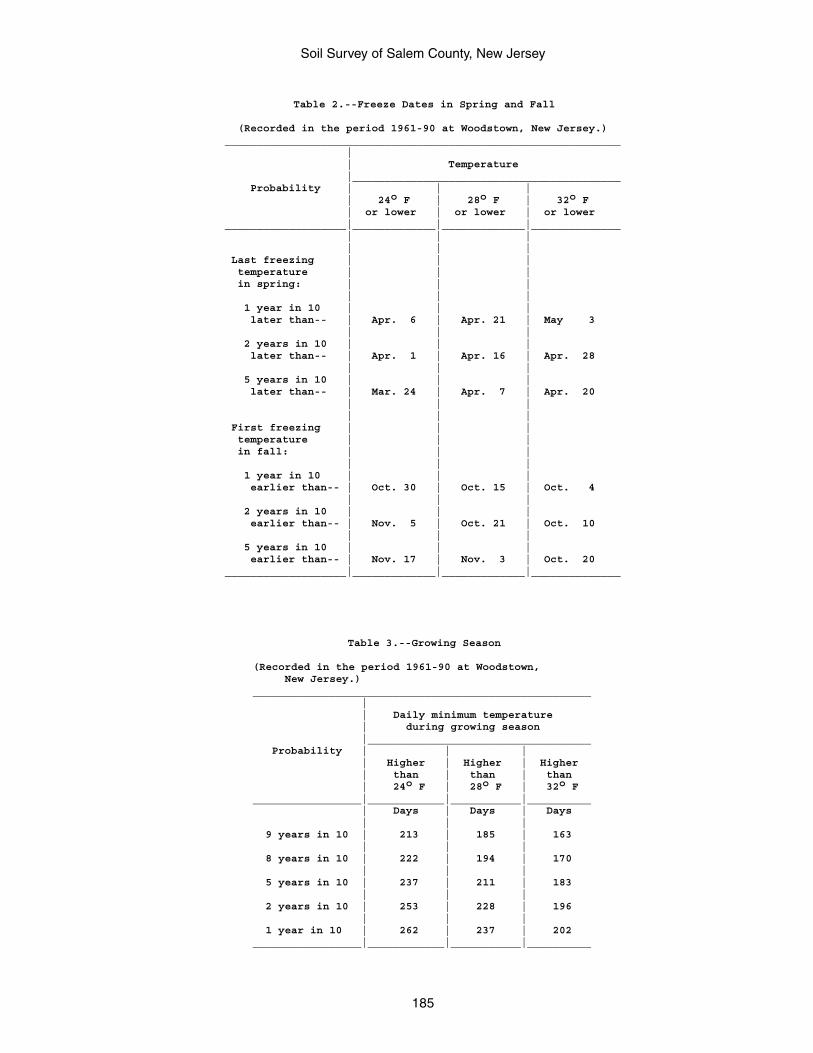
Soil Survey of Salem County, New Jersey
185
Table 2.--Freeze Dates in Spring and Fall
(Recorded in the period 1961-90 at Woodstown, New Jersey.)______________________________________________________________ | | Temperature |__________________________________________ Probability | | | | 24o F | 28o F | 32o F | or lower | or lower | or lower___________________|_____________|_____________|______________ | | | | | | Last freezing | | | temperature | | | in spring: | | | | | | 1 year in 10 | | | later than-- | Apr. 6 | Apr. 21 | May 3 | | | 2 years in 10 | | | later than-- | Apr. 1 | Apr. 16 | Apr. 28 | | | 5 years in 10 | | | later than-- | Mar. 24 | Apr. 7 | Apr. 20 | | | | | | First freezing | | | temperature | | | in fall: | | | | | | 1 year in 10 | | | earlier than-- | Oct. 30 | Oct. 15 | Oct. 4 | | | 2 years in 10 | | | earlier than-- | Nov. 5 | Oct. 21 | Oct. 10 | | | 5 years in 10 | | | earlier than-- | Nov. 17 | Nov. 3 | Oct. 20___________________|_____________|_____________|______________
Table 3.--Growing Season
(Recorded in the period 1961-90 at Woodstown, New Jersey.)_____________________________________________________ | | Daily minimum temperature | during growing season |___________________________________ Probability | | | | Higher | Higher | Higher | than | than | than | 24o F | 28o F | 32o F_________________|____________|___________|__________ | Days | Days | Days | | | 9 years in 10 | 213 | 185 | 163 | | | 8 years in 10 | 222 | 194 | 170 | | | 5 years in 10 | 237 | 211 | 183 | | | 2 years in 10 | 253 | 228 | 196 | | | 1 year in 10 | 262 | 237 | 202_________________|____________|___________|__________
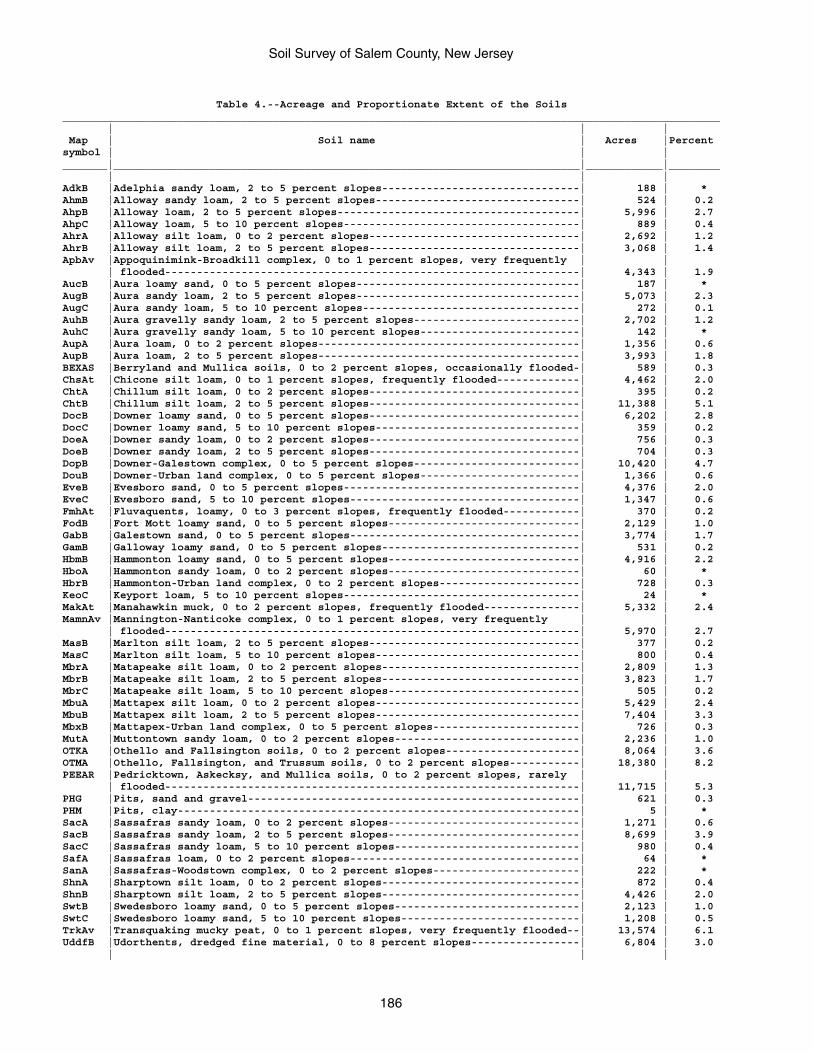
Soil Survey of Salem County, New Jersey
186
Table 4.--Acreage and Proportionate Extent of the Soils_______________________________________________________________________________________________________ | | | Map | Soil name | Acres |Percentsymbol | | |_______|_________________________________________________________________________|____________|________ | | |AdkB |Adelphia sandy loam, 2 to 5 percent slopes-------------------------------| 188 | *AhmB |Alloway sandy loam, 2 to 5 percent slopes--------------------------------| 524 | 0.2AhpB |Alloway loam, 2 to 5 percent slopes--------------------------------------| 5,996 | 2.7AhpC |Alloway loam, 5 to 10 percent slopes-------------------------------------| 889 | 0.4AhrA |Alloway silt loam, 0 to 2 percent slopes---------------------------------| 2,692 | 1.2AhrB |Alloway silt loam, 2 to 5 percent slopes---------------------------------| 3,068 | 1.4ApbAv |Appoquinimink-Broadkill complex, 0 to 1 percent slopes, very frequently | | | flooded-----------------------------------------------------------------| 4,343 | 1.9AucB |Aura loamy sand, 0 to 5 percent slopes-----------------------------------| 187 | *AugB |Aura sandy loam, 2 to 5 percent slopes-----------------------------------| 5,073 | 2.3AugC |Aura sandy loam, 5 to 10 percent slopes----------------------------------| 272 | 0.1AuhB |Aura gravelly sandy loam, 2 to 5 percent slopes--------------------------| 2,702 | 1.2AuhC |Aura gravelly sandy loam, 5 to 10 percent slopes-------------------------| 142 | *AupA |Aura loam, 0 to 2 percent slopes-----------------------------------------| 1,356 | 0.6AupB |Aura loam, 2 to 5 percent slopes-----------------------------------------| 3,993 | 1.8BEXAS |Berryland and Mullica soils, 0 to 2 percent slopes, occasionally flooded-| 589 | 0.3ChsAt |Chicone silt loam, 0 to 1 percent slopes, frequently flooded-------------| 4,462 | 2.0ChtA |Chillum silt loam, 0 to 2 percent slopes---------------------------------| 395 | 0.2ChtB |Chillum silt loam, 2 to 5 percent slopes---------------------------------| 11,388 | 5.1DocB |Downer loamy sand, 0 to 5 percent slopes---------------------------------| 6,202 | 2.8DocC |Downer loamy sand, 5 to 10 percent slopes--------------------------------| 359 | 0.2DoeA |Downer sandy loam, 0 to 2 percent slopes---------------------------------| 756 | 0.3DoeB |Downer sandy loam, 2 to 5 percent slopes---------------------------------| 704 | 0.3DopB |Downer-Galestown complex, 0 to 5 percent slopes--------------------------| 10,420 | 4.7DouB |Downer-Urban land complex, 0 to 5 percent slopes-------------------------| 1,366 | 0.6EveB |Evesboro sand, 0 to 5 percent slopes-------------------------------------| 4,376 | 2.0EveC |Evesboro sand, 5 to 10 percent slopes------------------------------------| 1,347 | 0.6FmhAt |Fluvaquents, loamy, 0 to 3 percent slopes, frequently flooded------------| 370 | 0.2FodB |Fort Mott loamy sand, 0 to 5 percent slopes------------------------------| 2,129 | 1.0GabB |Galestown sand, 0 to 5 percent slopes------------------------------------| 3,774 | 1.7GamB |Galloway loamy sand, 0 to 5 percent slopes-------------------------------| 531 | 0.2HbmB |Hammonton loamy sand, 0 to 5 percent slopes------------------------------| 4,916 | 2.2HboA |Hammonton sandy loam, 0 to 2 percent slopes------------------------------| 60 | *HbrB |Hammonton-Urban land complex, 0 to 2 percent slopes----------------------| 728 | 0.3KeoC |Keyport loam, 5 to 10 percent slopes-------------------------------------| 24 | *MakAt |Manahawkin muck, 0 to 2 percent slopes, frequently flooded---------------| 5,332 | 2.4MamnAv |Mannington-Nanticoke complex, 0 to 1 percent slopes, very frequently | | | flooded-----------------------------------------------------------------| 5,970 | 2.7MasB |Marlton silt loam, 2 to 5 percent slopes---------------------------------| 377 | 0.2MasC |Marlton silt loam, 5 to 10 percent slopes--------------------------------| 800 | 0.4MbrA |Matapeake silt loam, 0 to 2 percent slopes-------------------------------| 2,809 | 1.3MbrB |Matapeake silt loam, 2 to 5 percent slopes-------------------------------| 3,823 | 1.7MbrC |Matapeake silt loam, 5 to 10 percent slopes------------------------------| 505 | 0.2MbuA |Mattapex silt loam, 0 to 2 percent slopes--------------------------------| 5,429 | 2.4MbuB |Mattapex silt loam, 2 to 5 percent slopes--------------------------------| 7,404 | 3.3MbxB |Mattapex-Urban land complex, 0 to 5 percent slopes-----------------------| 726 | 0.3MutA |Muttontown sandy loam, 0 to 2 percent slopes-----------------------------| 2,236 | 1.0OTKA |Othello and Fallsington soils, 0 to 2 percent slopes---------------------| 8,064 | 3.6OTMA |Othello, Fallsington, and Trussum soils, 0 to 2 percent slopes-----------| 18,380 | 8.2PEEAR |Pedricktown, Askecksy, and Mullica soils, 0 to 2 percent slopes, rarely | | | flooded-----------------------------------------------------------------| 11,715 | 5.3PHG |Pits, sand and gravel----------------------------------------------------| 621 | 0.3PHM |Pits, clay---------------------------------------------------------------| 5 | *SacA |Sassafras sandy loam, 0 to 2 percent slopes------------------------------| 1,271 | 0.6SacB |Sassafras sandy loam, 2 to 5 percent slopes------------------------------| 8,699 | 3.9SacC |Sassafras sandy loam, 5 to 10 percent slopes-----------------------------| 980 | 0.4SafA |Sassafras loam, 0 to 2 percent slopes------------------------------------| 64 | *SanA |Sassafras-Woodstown complex, 0 to 2 percent slopes-----------------------| 222 | *ShnA |Sharptown silt loam, 0 to 2 percent slopes-------------------------------| 872 | 0.4ShnB |Sharptown silt loam, 2 to 5 percent slopes-------------------------------| 4,426 | 2.0SwtB |Swedesboro loamy sand, 0 to 5 percent slopes-----------------------------| 2,123 | 1.0SwtC |Swedesboro loamy sand, 5 to 10 percent slopes----------------------------| 1,208 | 0.5TrkAv |Transquaking mucky peat, 0 to 1 percent slopes, very frequently flooded--| 13,574 | 6.1UddfB |Udorthents, dredged fine material, 0 to 8 percent slopes-----------------| 6,804 | 3.0 | | |
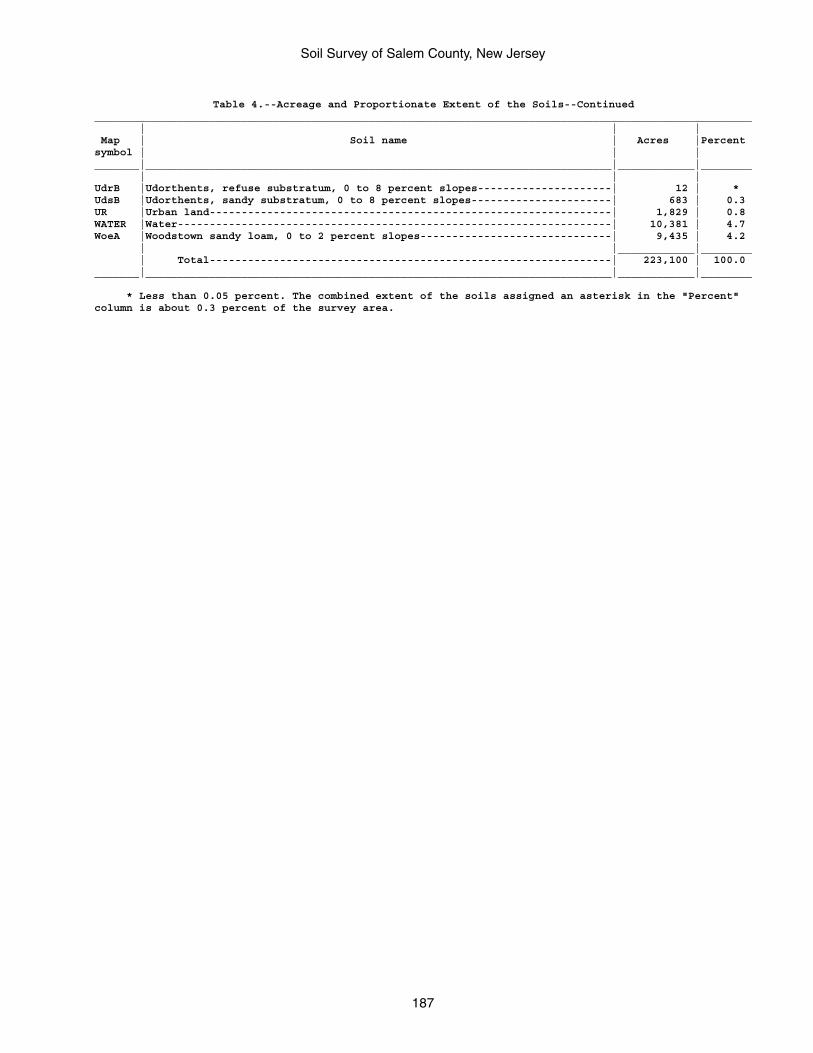
Soil Survey of Salem County, New Jersey
187
Table 4.--Acreage and Proportionate Extent of the Soils--Continued_______________________________________________________________________________________________________ | | | Map | Soil name | Acres |Percentsymbol | | |_______|_________________________________________________________________________|____________|________ | | |UdrB |Udorthents, refuse substratum, 0 to 8 percent slopes---------------------| 12 | *UdsB |Udorthents, sandy substratum, 0 to 8 percent slopes----------------------| 683 | 0.3UR |Urban land---------------------------------------------------------------| 1,829 | 0.8WATER |Water--------------------------------------------------------------------| 10,381 | 4.7WoeA |Woodstown sandy loam, 0 to 2 percent slopes------------------------------| 9,435 | 4.2 | |____________|________ | Total---------------------------------------------------------------| 223,100 | 100.0_______|_________________________________________________________________________|____________|________
* Less than 0.05 percent. The combined extent of the soils assigned an asterisk in the "Percent"column is about 0.3 percent of the survey area.
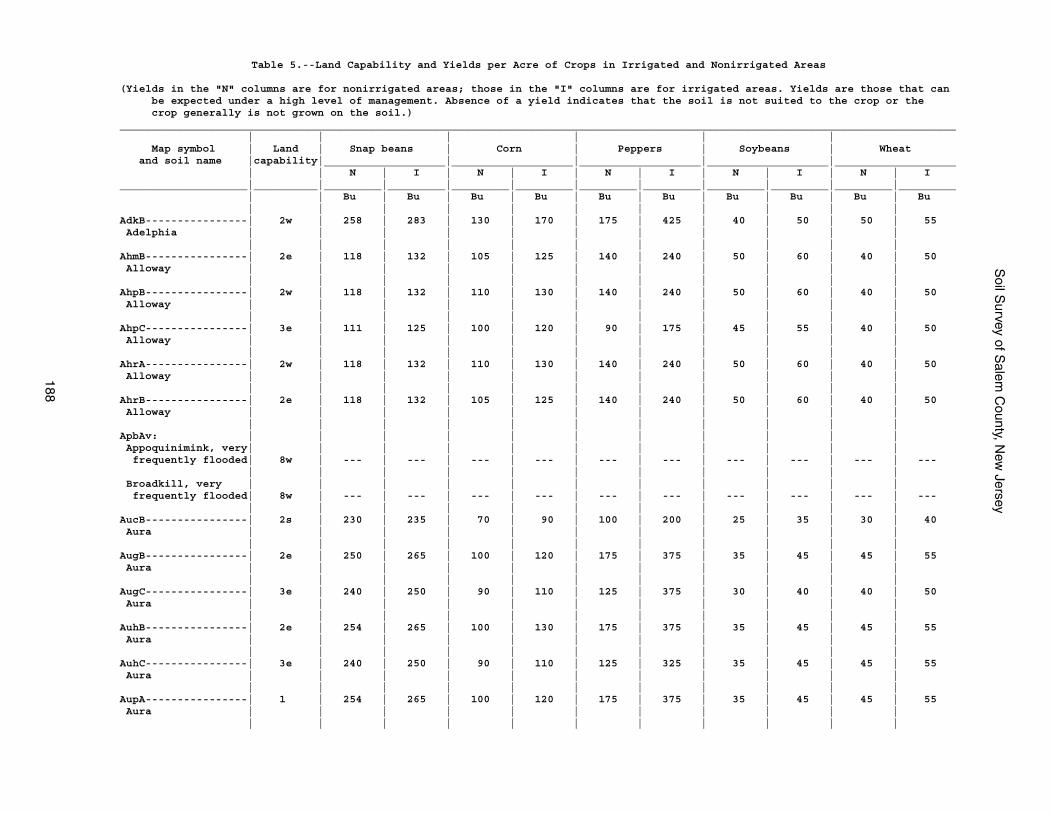
Soil S
urvey of Salem
County, N
ew Jersey
188
Table 5.--Land Capability and Yields per Acre of Crops in Irrigated and Nonirrigated Areas
(Yields in the "N" columns are for nonirrigated areas; those in the "I" columns are for irrigated areas. Yields are those that can be expected under a high level of management. Absence of a yield indicates that the soil is not suited to the crop or the crop generally is not grown on the soil.)___________________________________________________________________________________________________________________________________ | | | | | | Map symbol | Land | Snap beans | Corn | Peppers | Soybeans | Wheat and soil name |capability|___________________|___________________|___________________|___________________|___________________ | | N | I | N | I | N | I | N | I | N | I____________________|__________|_________|_________|_________|_________|_________|_________|_________|_________|_________|_________ | | Bu | Bu | Bu | Bu | Bu | Bu | Bu | Bu | Bu | Bu | | | | | | | | | | |AdkB----------------| 2w | 258 | 283 | 130 | 170 | 175 | 425 | 40 | 50 | 50 | 55 Adelphia | | | | | | | | | | | | | | | | | | | | | |AhmB----------------| 2e | 118 | 132 | 105 | 125 | 140 | 240 | 50 | 60 | 40 | 50 Alloway | | | | | | | | | | | | | | | | | | | | | |AhpB----------------| 2w | 118 | 132 | 110 | 130 | 140 | 240 | 50 | 60 | 40 | 50 Alloway | | | | | | | | | | | | | | | | | | | | | |AhpC----------------| 3e | 111 | 125 | 100 | 120 | 90 | 175 | 45 | 55 | 40 | 50 Alloway | | | | | | | | | | | | | | | | | | | | | |AhrA----------------| 2w | 118 | 132 | 110 | 130 | 140 | 240 | 50 | 60 | 40 | 50 Alloway | | | | | | | | | | | | | | | | | | | | | |AhrB----------------| 2e | 118 | 132 | 105 | 125 | 140 | 240 | 50 | 60 | 40 | 50 Alloway | | | | | | | | | | | | | | | | | | | | | |ApbAv: | | | | | | | | | | | Appoquinimink, very| | | | | | | | | | | frequently flooded| 8w | --- | --- | --- | --- | --- | --- | --- | --- | --- | --- | | | | | | | | | | | Broadkill, very | | | | | | | | | | | frequently flooded| 8w | --- | --- | --- | --- | --- | --- | --- | --- | --- | --- | | | | | | | | | | |AucB----------------| 2s | 230 | 235 | 70 | 90 | 100 | 200 | 25 | 35 | 30 | 40 Aura | | | | | | | | | | | | | | | | | | | | | |AugB----------------| 2e | 250 | 265 | 100 | 120 | 175 | 375 | 35 | 45 | 45 | 55 Aura | | | | | | | | | | | | | | | | | | | | | |AugC----------------| 3e | 240 | 250 | 90 | 110 | 125 | 375 | 30 | 40 | 40 | 50 Aura | | | | | | | | | | | | | | | | | | | | | |AuhB----------------| 2e | 254 | 265 | 100 | 130 | 175 | 375 | 35 | 45 | 45 | 55 Aura | | | | | | | | | | | | | | | | | | | | | |AuhC----------------| 3e | 240 | 250 | 90 | 110 | 125 | 325 | 35 | 45 | 45 | 55 Aura | | | | | | | | | | | | | | | | | | | | | |AupA----------------| 1 | 254 | 265 | 100 | 120 | 175 | 375 | 35 | 45 | 45 | 55 Aura | | | | | | | | | | | | | | | | | | | | | |
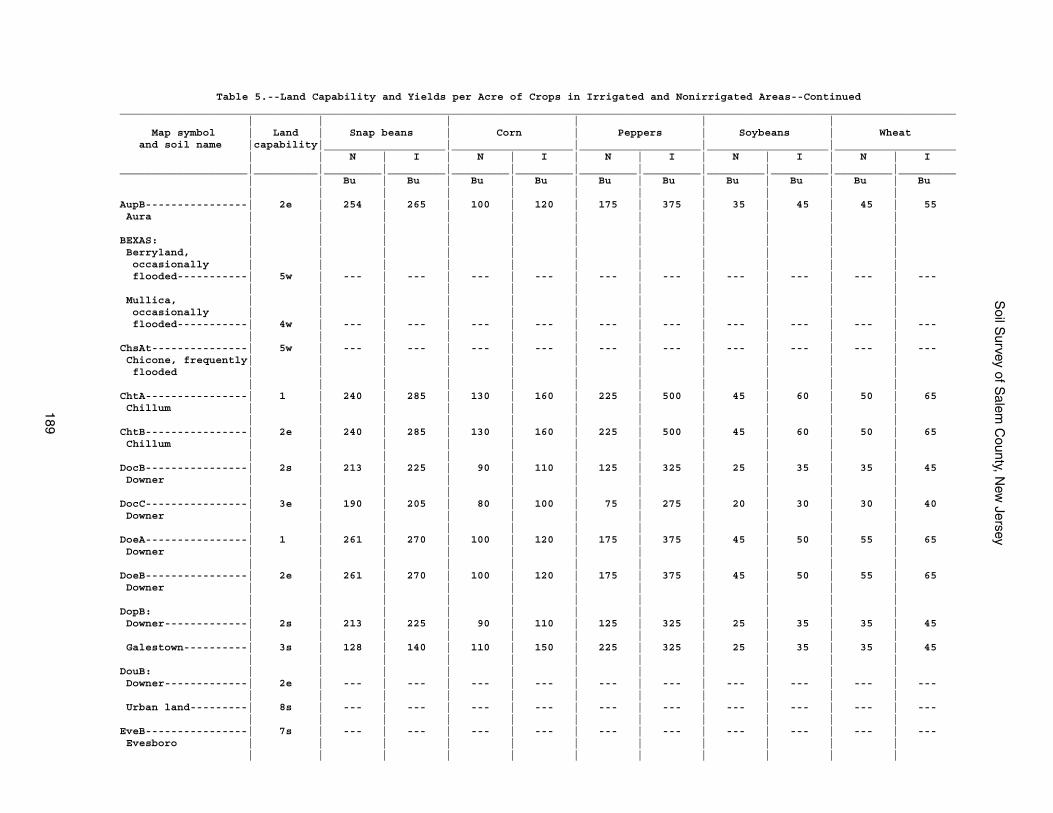
Soil S
urvey of Salem
County, N
ew Jersey
189
Table 5.--Land Capability and Yields per Acre of Crops in Irrigated and Nonirrigated Areas--Continued___________________________________________________________________________________________________________________________________ | | | | | | Map symbol | Land | Snap beans | Corn | Peppers | Soybeans | Wheat and soil name |capability|___________________|___________________|___________________|___________________|___________________ | | N | I | N | I | N | I | N | I | N | I____________________|__________|_________|_________|_________|_________|_________|_________|_________|_________|_________|_________ | | Bu | Bu | Bu | Bu | Bu | Bu | Bu | Bu | Bu | Bu | | | | | | | | | | |AupB----------------| 2e | 254 | 265 | 100 | 120 | 175 | 375 | 35 | 45 | 45 | 55 Aura | | | | | | | | | | | | | | | | | | | | | |BEXAS: | | | | | | | | | | | Berryland, | | | | | | | | | | | occasionally | | | | | | | | | | | flooded-----------| 5w | --- | --- | --- | --- | --- | --- | --- | --- | --- | --- | | | | | | | | | | | Mullica, | | | | | | | | | | | occasionally | | | | | | | | | | | flooded-----------| 4w | --- | --- | --- | --- | --- | --- | --- | --- | --- | --- | | | | | | | | | | |ChsAt---------------| 5w | --- | --- | --- | --- | --- | --- | --- | --- | --- | --- Chicone, frequently| | | | | | | | | | | flooded | | | | | | | | | | | | | | | | | | | | | |ChtA----------------| 1 | 240 | 285 | 130 | 160 | 225 | 500 | 45 | 60 | 50 | 65 Chillum | | | | | | | | | | | | | | | | | | | | | |ChtB----------------| 2e | 240 | 285 | 130 | 160 | 225 | 500 | 45 | 60 | 50 | 65 Chillum | | | | | | | | | | | | | | | | | | | | | |DocB----------------| 2s | 213 | 225 | 90 | 110 | 125 | 325 | 25 | 35 | 35 | 45 Downer | | | | | | | | | | | | | | | | | | | | | |DocC----------------| 3e | 190 | 205 | 80 | 100 | 75 | 275 | 20 | 30 | 30 | 40 Downer | | | | | | | | | | | | | | | | | | | | | |DoeA----------------| 1 | 261 | 270 | 100 | 120 | 175 | 375 | 45 | 50 | 55 | 65 Downer | | | | | | | | | | | | | | | | | | | | | |DoeB----------------| 2e | 261 | 270 | 100 | 120 | 175 | 375 | 45 | 50 | 55 | 65 Downer | | | | | | | | | | | | | | | | | | | | | |DopB: | | | | | | | | | | | Downer-------------| 2s | 213 | 225 | 90 | 110 | 125 | 325 | 25 | 35 | 35 | 45 | | | | | | | | | | | Galestown----------| 3s | 128 | 140 | 110 | 150 | 225 | 325 | 25 | 35 | 35 | 45 | | | | | | | | | | |DouB: | | | | | | | | | | | Downer-------------| 2e | --- | --- | --- | --- | --- | --- | --- | --- | --- | --- | | | | | | | | | | | Urban land---------| 8s | --- | --- | --- | --- | --- | --- | --- | --- | --- | --- | | | | | | | | | | |EveB----------------| 7s | --- | --- | --- | --- | --- | --- | --- | --- | --- | --- Evesboro | | | | | | | | | | | | | | | | | | | | | |
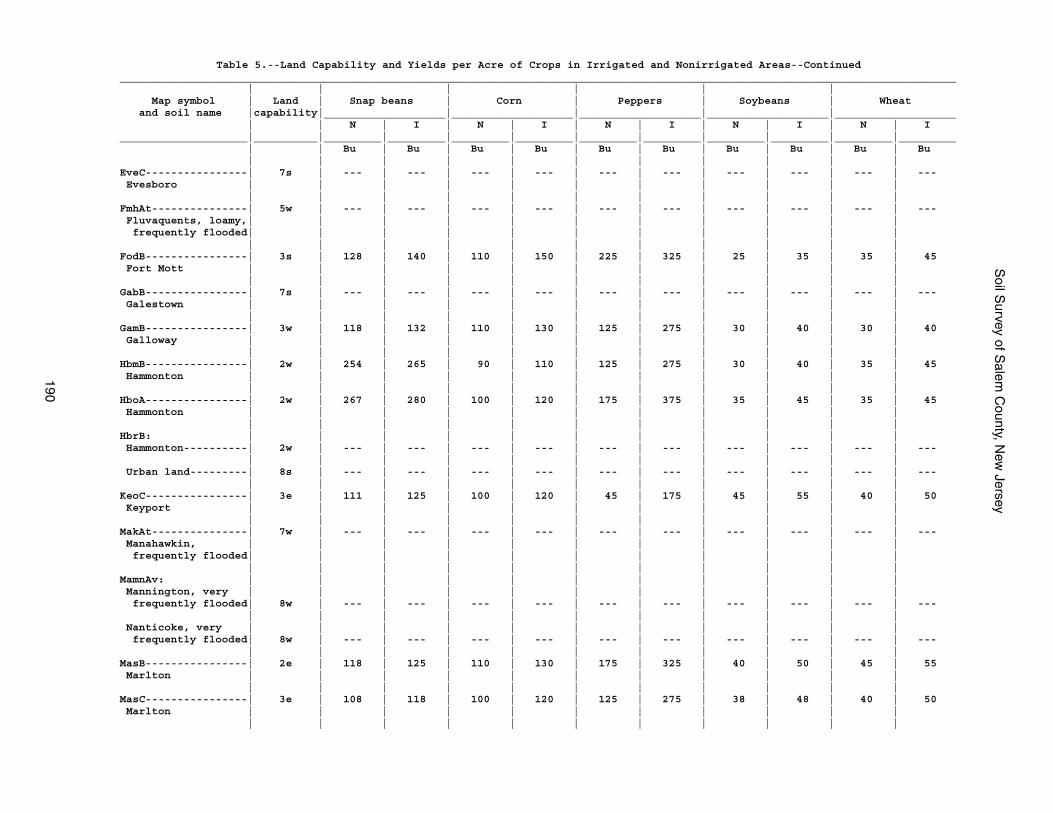
Soil S
urvey of Salem
County, N
ew Jersey
190
Table 5.--Land Capability and Yields per Acre of Crops in Irrigated and Nonirrigated Areas--Continued___________________________________________________________________________________________________________________________________ | | | | | | Map symbol | Land | Snap beans | Corn | Peppers | Soybeans | Wheat and soil name |capability|___________________|___________________|___________________|___________________|___________________ | | N | I | N | I | N | I | N | I | N | I____________________|__________|_________|_________|_________|_________|_________|_________|_________|_________|_________|_________ | | Bu | Bu | Bu | Bu | Bu | Bu | Bu | Bu | Bu | Bu | | | | | | | | | | |EveC----------------| 7s | --- | --- | --- | --- | --- | --- | --- | --- | --- | --- Evesboro | | | | | | | | | | | | | | | | | | | | | |FmhAt---------------| 5w | --- | --- | --- | --- | --- | --- | --- | --- | --- | --- Fluvaquents, loamy,| | | | | | | | | | | frequently flooded| | | | | | | | | | | | | | | | | | | | | |FodB----------------| 3s | 128 | 140 | 110 | 150 | 225 | 325 | 25 | 35 | 35 | 45 Fort Mott | | | | | | | | | | | | | | | | | | | | | |GabB----------------| 7s | --- | --- | --- | --- | --- | --- | --- | --- | --- | --- Galestown | | | | | | | | | | | | | | | | | | | | | |GamB----------------| 3w | 118 | 132 | 110 | 130 | 125 | 275 | 30 | 40 | 30 | 40 Galloway | | | | | | | | | | | | | | | | | | | | | |HbmB----------------| 2w | 254 | 265 | 90 | 110 | 125 | 275 | 30 | 40 | 35 | 45 Hammonton | | | | | | | | | | | | | | | | | | | | | |HboA----------------| 2w | 267 | 280 | 100 | 120 | 175 | 375 | 35 | 45 | 35 | 45 Hammonton | | | | | | | | | | | | | | | | | | | | | |HbrB: | | | | | | | | | | | Hammonton----------| 2w | --- | --- | --- | --- | --- | --- | --- | --- | --- | --- | | | | | | | | | | | Urban land---------| 8s | --- | --- | --- | --- | --- | --- | --- | --- | --- | --- | | | | | | | | | | |KeoC----------------| 3e | 111 | 125 | 100 | 120 | 45 | 175 | 45 | 55 | 40 | 50 Keyport | | | | | | | | | | | | | | | | | | | | | |MakAt---------------| 7w | --- | --- | --- | --- | --- | --- | --- | --- | --- | --- Manahawkin, | | | | | | | | | | | frequently flooded| | | | | | | | | | | | | | | | | | | | | |MamnAv: | | | | | | | | | | | Mannington, very | | | | | | | | | | | frequently flooded| 8w | --- | --- | --- | --- | --- | --- | --- | --- | --- | --- | | | | | | | | | | | Nanticoke, very | | | | | | | | | | | frequently flooded| 8w | --- | --- | --- | --- | --- | --- | --- | --- | --- | --- | | | | | | | | | | |MasB----------------| 2e | 118 | 125 | 110 | 130 | 175 | 325 | 40 | 50 | 45 | 55 Marlton | | | | | | | | | | | | | | | | | | | | | |MasC----------------| 3e | 108 | 118 | 100 | 120 | 125 | 275 | 38 | 48 | 40 | 50 Marlton | | | | | | | | | | | | | | | | | | | | | |
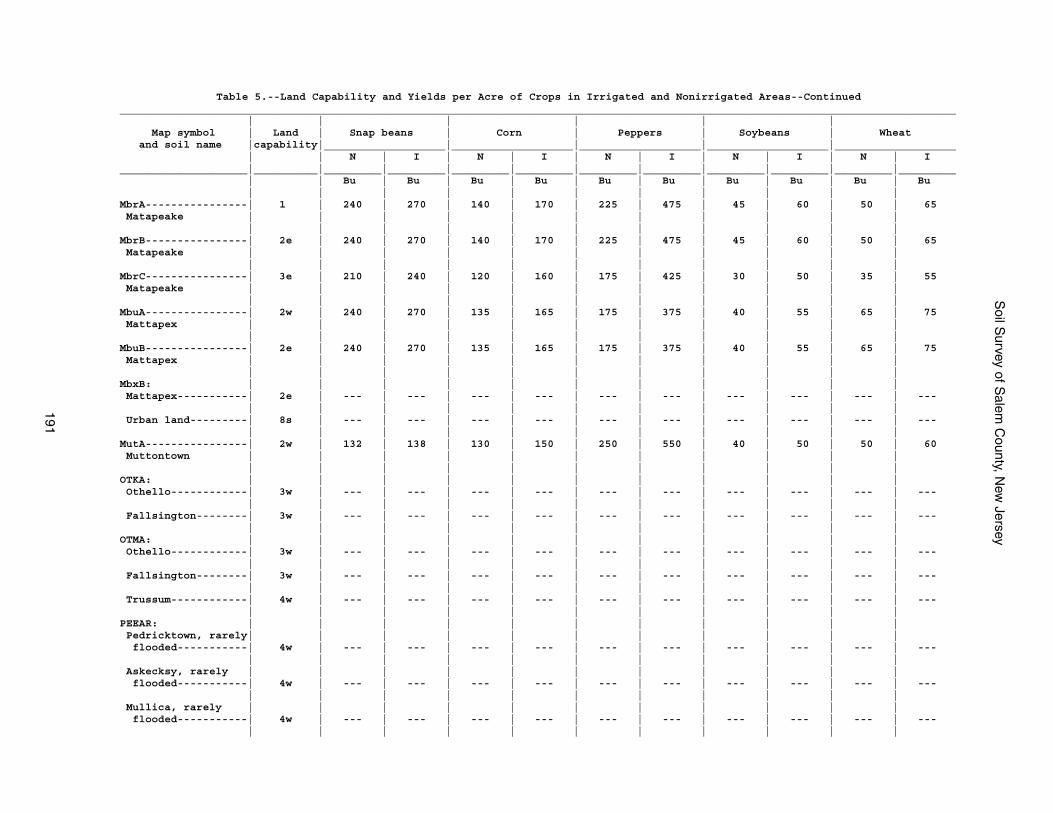
Soil S
urvey of Salem
County, N
ew Jersey
191
Table 5.--Land Capability and Yields per Acre of Crops in Irrigated and Nonirrigated Areas--Continued___________________________________________________________________________________________________________________________________ | | | | | | Map symbol | Land | Snap beans | Corn | Peppers | Soybeans | Wheat and soil name |capability|___________________|___________________|___________________|___________________|___________________ | | N | I | N | I | N | I | N | I | N | I____________________|__________|_________|_________|_________|_________|_________|_________|_________|_________|_________|_________ | | Bu | Bu | Bu | Bu | Bu | Bu | Bu | Bu | Bu | Bu | | | | | | | | | | |MbrA----------------| 1 | 240 | 270 | 140 | 170 | 225 | 475 | 45 | 60 | 50 | 65 Matapeake | | | | | | | | | | | | | | | | | | | | | |MbrB----------------| 2e | 240 | 270 | 140 | 170 | 225 | 475 | 45 | 60 | 50 | 65 Matapeake | | | | | | | | | | | | | | | | | | | | | |MbrC----------------| 3e | 210 | 240 | 120 | 160 | 175 | 425 | 30 | 50 | 35 | 55 Matapeake | | | | | | | | | | | | | | | | | | | | | |MbuA----------------| 2w | 240 | 270 | 135 | 165 | 175 | 375 | 40 | 55 | 65 | 75 Mattapex | | | | | | | | | | | | | | | | | | | | | |MbuB----------------| 2e | 240 | 270 | 135 | 165 | 175 | 375 | 40 | 55 | 65 | 75 Mattapex | | | | | | | | | | | | | | | | | | | | | |MbxB: | | | | | | | | | | | Mattapex-----------| 2e | --- | --- | --- | --- | --- | --- | --- | --- | --- | --- | | | | | | | | | | | Urban land---------| 8s | --- | --- | --- | --- | --- | --- | --- | --- | --- | --- | | | | | | | | | | |MutA----------------| 2w | 132 | 138 | 130 | 150 | 250 | 550 | 40 | 50 | 50 | 60 Muttontown | | | | | | | | | | | | | | | | | | | | | |OTKA: | | | | | | | | | | | Othello------------| 3w | --- | --- | --- | --- | --- | --- | --- | --- | --- | --- | | | | | | | | | | | Fallsington--------| 3w | --- | --- | --- | --- | --- | --- | --- | --- | --- | --- | | | | | | | | | | |OTMA: | | | | | | | | | | | Othello------------| 3w | --- | --- | --- | --- | --- | --- | --- | --- | --- | --- | | | | | | | | | | | Fallsington--------| 3w | --- | --- | --- | --- | --- | --- | --- | --- | --- | --- | | | | | | | | | | | Trussum------------| 4w | --- | --- | --- | --- | --- | --- | --- | --- | --- | --- | | | | | | | | | | |PEEAR: | | | | | | | | | | | Pedricktown, rarely| | | | | | | | | | | flooded-----------| 4w | --- | --- | --- | --- | --- | --- | --- | --- | --- | --- | | | | | | | | | | | Askecksy, rarely | | | | | | | | | | | flooded-----------| 4w | --- | --- | --- | --- | --- | --- | --- | --- | --- | --- | | | | | | | | | | | Mullica, rarely | | | | | | | | | | | flooded-----------| 4w | --- | --- | --- | --- | --- | --- | --- | --- | --- | --- | | | | | | | | | | |
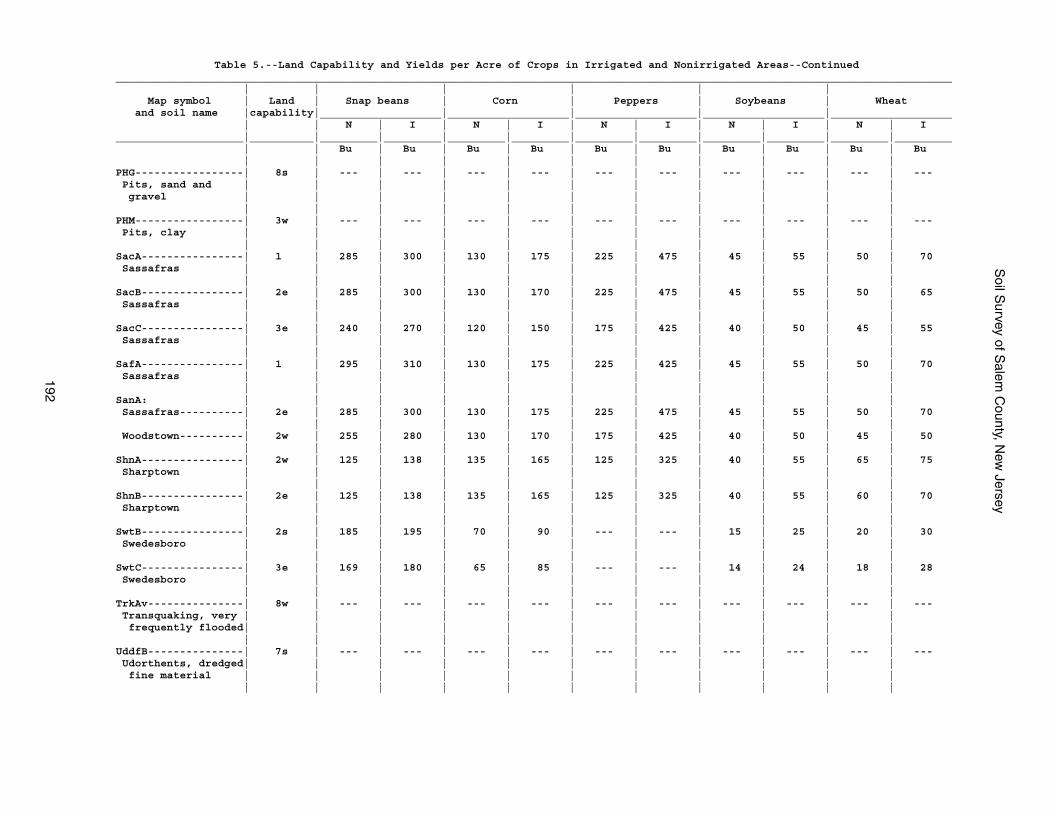
Soil S
urvey of Salem
County, N
ew Jersey
192
Table 5.--Land Capability and Yields per Acre of Crops in Irrigated and Nonirrigated Areas--Continued___________________________________________________________________________________________________________________________________ | | | | | | Map symbol | Land | Snap beans | Corn | Peppers | Soybeans | Wheat and soil name |capability|___________________|___________________|___________________|___________________|___________________ | | N | I | N | I | N | I | N | I | N | I____________________|__________|_________|_________|_________|_________|_________|_________|_________|_________|_________|_________ | | Bu | Bu | Bu | Bu | Bu | Bu | Bu | Bu | Bu | Bu | | | | | | | | | | |PHG-----------------| 8s | --- | --- | --- | --- | --- | --- | --- | --- | --- | --- Pits, sand and | | | | | | | | | | | gravel | | | | | | | | | | | | | | | | | | | | | |PHM-----------------| 3w | --- | --- | --- | --- | --- | --- | --- | --- | --- | --- Pits, clay | | | | | | | | | | | | | | | | | | | | | |SacA----------------| 1 | 285 | 300 | 130 | 175 | 225 | 475 | 45 | 55 | 50 | 70 Sassafras | | | | | | | | | | | | | | | | | | | | | |SacB----------------| 2e | 285 | 300 | 130 | 170 | 225 | 475 | 45 | 55 | 50 | 65 Sassafras | | | | | | | | | | | | | | | | | | | | | |SacC----------------| 3e | 240 | 270 | 120 | 150 | 175 | 425 | 40 | 50 | 45 | 55 Sassafras | | | | | | | | | | | | | | | | | | | | | |SafA----------------| 1 | 295 | 310 | 130 | 175 | 225 | 425 | 45 | 55 | 50 | 70 Sassafras | | | | | | | | | | | | | | | | | | | | | |SanA: | | | | | | | | | | | Sassafras----------| 2e | 285 | 300 | 130 | 175 | 225 | 475 | 45 | 55 | 50 | 70 | | | | | | | | | | | Woodstown----------| 2w | 255 | 280 | 130 | 170 | 175 | 425 | 40 | 50 | 45 | 50 | | | | | | | | | | |ShnA----------------| 2w | 125 | 138 | 135 | 165 | 125 | 325 | 40 | 55 | 65 | 75 Sharptown | | | | | | | | | | | | | | | | | | | | | |ShnB----------------| 2e | 125 | 138 | 135 | 165 | 125 | 325 | 40 | 55 | 60 | 70 Sharptown | | | | | | | | | | | | | | | | | | | | | |SwtB----------------| 2s | 185 | 195 | 70 | 90 | --- | --- | 15 | 25 | 20 | 30 Swedesboro | | | | | | | | | | | | | | | | | | | | | |SwtC----------------| 3e | 169 | 180 | 65 | 85 | --- | --- | 14 | 24 | 18 | 28 Swedesboro | | | | | | | | | | | | | | | | | | | | | |TrkAv---------------| 8w | --- | --- | --- | --- | --- | --- | --- | --- | --- | --- Transquaking, very | | | | | | | | | | | frequently flooded| | | | | | | | | | | | | | | | | | | | | |UddfB---------------| 7s | --- | --- | --- | --- | --- | --- | --- | --- | --- | --- Udorthents, dredged| | | | | | | | | | | fine material | | | | | | | | | | | | | | | | | | | | | |
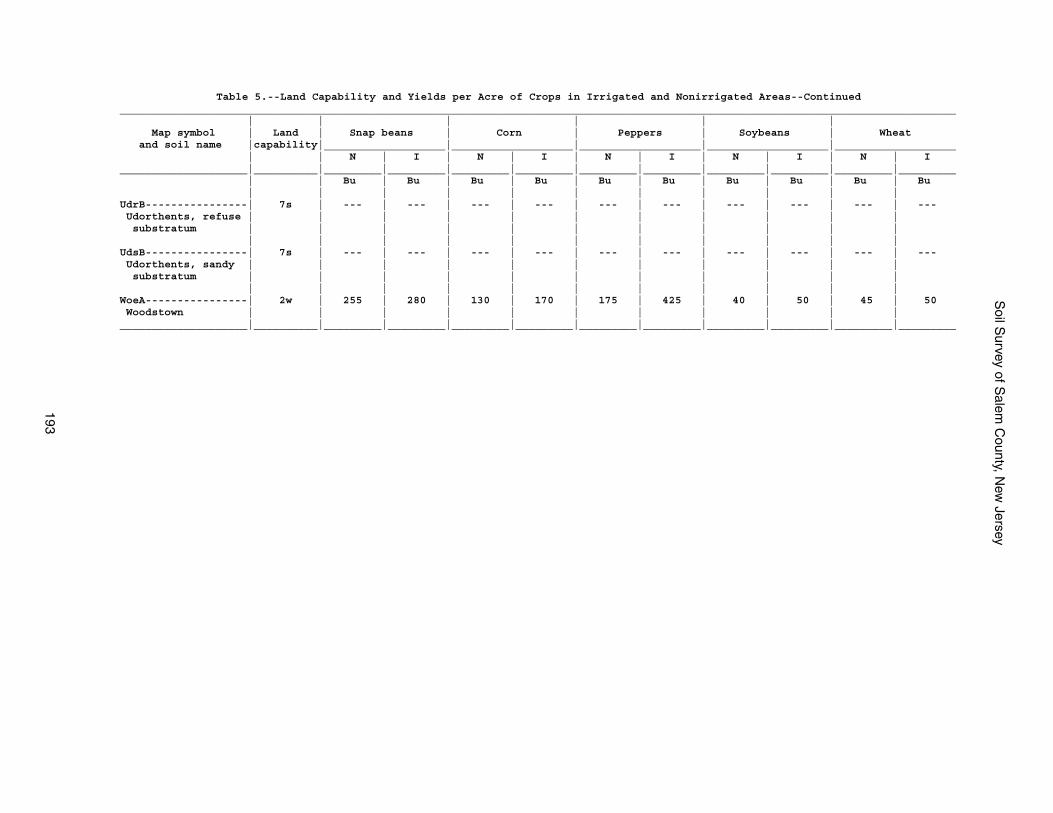
Soil S
urvey of Salem
County, N
ew Jersey
193
Table 5.--Land Capability and Yields per Acre of Crops in Irrigated and Nonirrigated Areas--Continued___________________________________________________________________________________________________________________________________ | | | | | | Map symbol | Land | Snap beans | Corn | Peppers | Soybeans | Wheat and soil name |capability|___________________|___________________|___________________|___________________|___________________ | | N | I | N | I | N | I | N | I | N | I____________________|__________|_________|_________|_________|_________|_________|_________|_________|_________|_________|_________ | | Bu | Bu | Bu | Bu | Bu | Bu | Bu | Bu | Bu | Bu | | | | | | | | | | |UdrB----------------| 7s | --- | --- | --- | --- | --- | --- | --- | --- | --- | --- Udorthents, refuse | | | | | | | | | | | substratum | | | | | | | | | | | | | | | | | | | | | |UdsB----------------| 7s | --- | --- | --- | --- | --- | --- | --- | --- | --- | --- Udorthents, sandy | | | | | | | | | | | substratum | | | | | | | | | | | | | | | | | | | | | |WoeA----------------| 2w | 255 | 280 | 130 | 170 | 175 | 425 | 40 | 50 | 45 | 50 Woodstown | | | | | | | | | | |____________________|__________|_________|_________|_________|_________|_________|_________|_________|_________|_________|_________
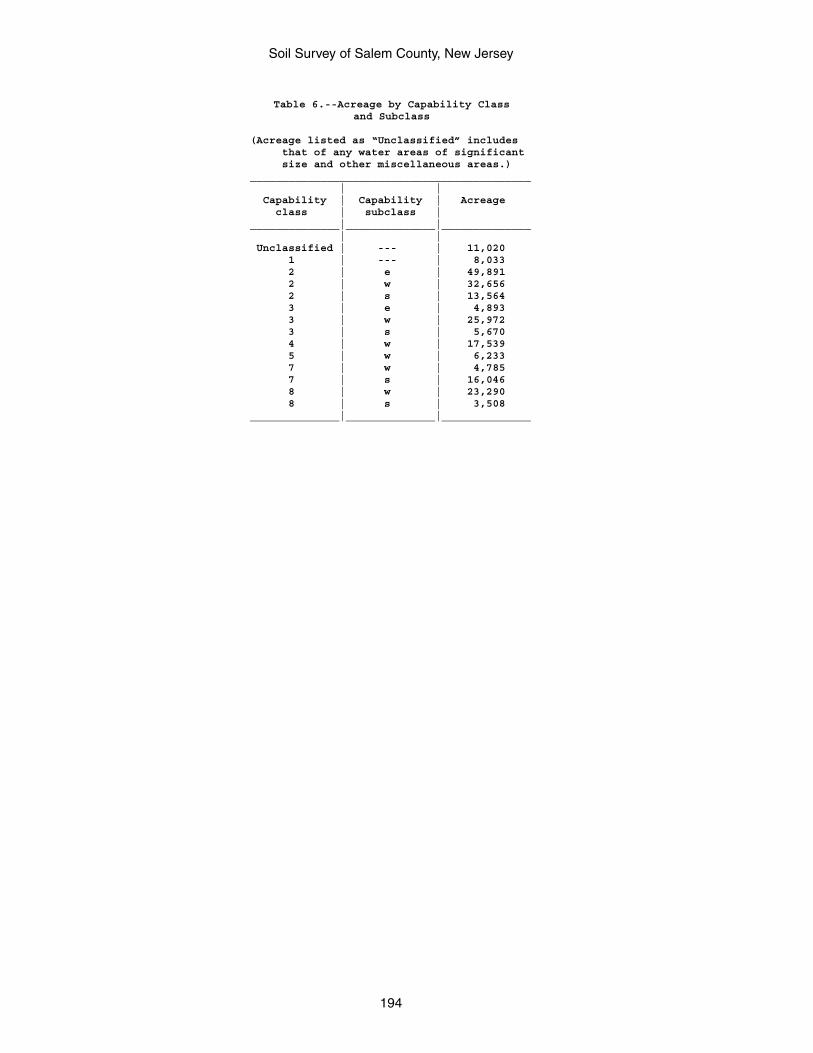
Soil Survey of Salem County, New Jersey
194
Table 6.--Acreage by Capability Classand Subclass
(Acreage listed as “Unclassified” includes that of any water areas of significant size and other miscellaneous areas.)____________________________________________ | | Capability | Capability | Acreage class | subclass |______________|______________|______________ | | Unclassified | --- | 11,020 1 | --- | 8,033 2 | e | 49,891 2 | w | 32,656 2 | s | 13,564 3 | e | 4,893 3 | w | 25,972 3 | s | 5,670 4 | w | 17,539 5 | w | 6,233 7 | w | 4,785 7 | s | 16,046 8 | w | 23,290 8 | s | 3,508______________|______________|______________
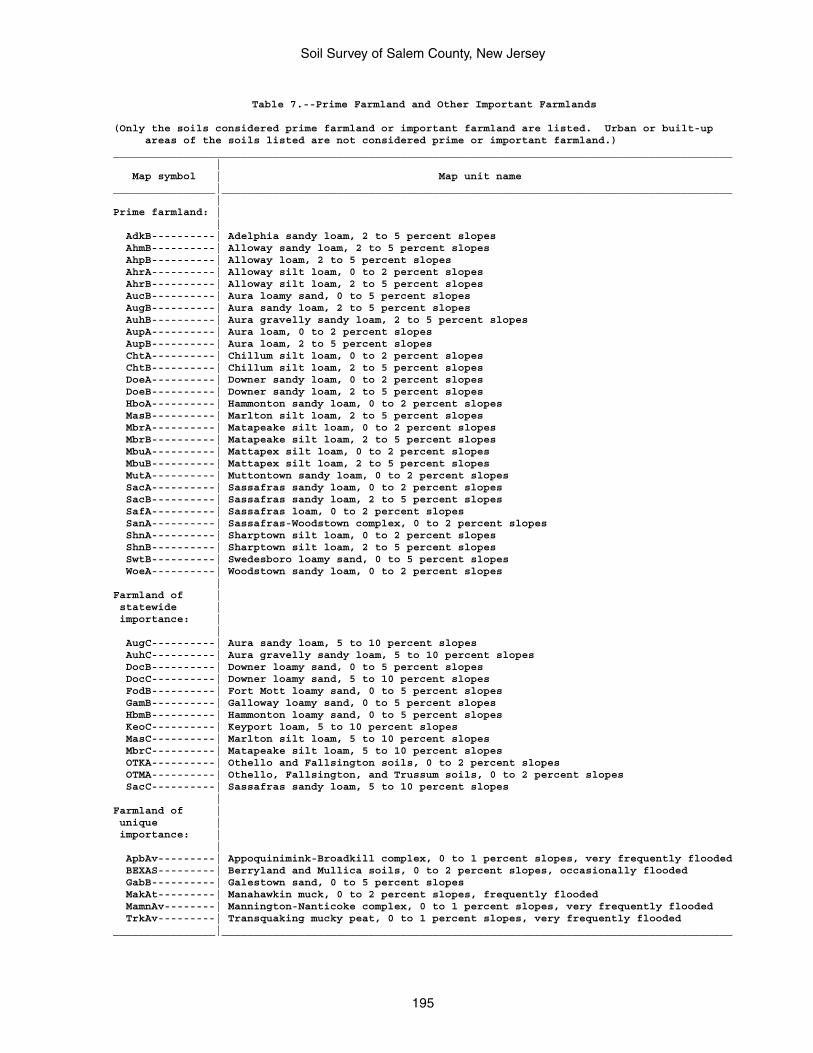
Soil Survey of Salem County, New Jersey
195
Table 7.--Prime Farmland and Other Important Farmlands
(Only the soils considered prime farmland or important farmland are listed. Urban or built-up areas of the soils listed are not considered prime or important farmland.)_________________________________________________________________________________________________ | Map symbol | Map unit name________________|________________________________________________________________________________ |Prime farmland: | | AdkB----------| Adelphia sandy loam, 2 to 5 percent slopes AhmB----------| Alloway sandy loam, 2 to 5 percent slopes AhpB----------| Alloway loam, 2 to 5 percent slopes AhrA----------| Alloway silt loam, 0 to 2 percent slopes AhrB----------| Alloway silt loam, 2 to 5 percent slopes AucB----------| Aura loamy sand, 0 to 5 percent slopes AugB----------| Aura sandy loam, 2 to 5 percent slopes AuhB----------| Aura gravelly sandy loam, 2 to 5 percent slopes AupA----------| Aura loam, 0 to 2 percent slopes AupB----------| Aura loam, 2 to 5 percent slopes ChtA----------| Chillum silt loam, 0 to 2 percent slopes ChtB----------| Chillum silt loam, 2 to 5 percent slopes DoeA----------| Downer sandy loam, 0 to 2 percent slopes DoeB----------| Downer sandy loam, 2 to 5 percent slopes HboA----------| Hammonton sandy loam, 0 to 2 percent slopes MasB----------| Marlton silt loam, 2 to 5 percent slopes MbrA----------| Matapeake silt loam, 0 to 2 percent slopes MbrB----------| Matapeake silt loam, 2 to 5 percent slopes MbuA----------| Mattapex silt loam, 0 to 2 percent slopes MbuB----------| Mattapex silt loam, 2 to 5 percent slopes MutA----------| Muttontown sandy loam, 0 to 2 percent slopes SacA----------| Sassafras sandy loam, 0 to 2 percent slopes SacB----------| Sassafras sandy loam, 2 to 5 percent slopes SafA----------| Sassafras loam, 0 to 2 percent slopes SanA----------| Sassafras-Woodstown complex, 0 to 2 percent slopes ShnA----------| Sharptown silt loam, 0 to 2 percent slopes ShnB----------| Sharptown silt loam, 2 to 5 percent slopes SwtB----------| Swedesboro loamy sand, 0 to 5 percent slopes WoeA----------| Woodstown sandy loam, 0 to 2 percent slopes |Farmland of | statewide | importance: | | AugC----------| Aura sandy loam, 5 to 10 percent slopes AuhC----------| Aura gravelly sandy loam, 5 to 10 percent slopes DocB----------| Downer loamy sand, 0 to 5 percent slopes DocC----------| Downer loamy sand, 5 to 10 percent slopes FodB----------| Fort Mott loamy sand, 0 to 5 percent slopes GamB----------| Galloway loamy sand, 0 to 5 percent slopes HbmB----------| Hammonton loamy sand, 0 to 5 percent slopes KeoC----------| Keyport loam, 5 to 10 percent slopes MasC----------| Marlton silt loam, 5 to 10 percent slopes MbrC----------| Matapeake silt loam, 5 to 10 percent slopes OTKA----------| Othello and Fallsington soils, 0 to 2 percent slopes OTMA----------| Othello, Fallsington, and Trussum soils, 0 to 2 percent slopes SacC----------| Sassafras sandy loam, 5 to 10 percent slopes |Farmland of | unique | importance: | | ApbAv---------| Appoquinimink-Broadkill complex, 0 to 1 percent slopes, very frequently flooded BEXAS---------| Berryland and Mullica soils, 0 to 2 percent slopes, occasionally flooded GabB----------| Galestown sand, 0 to 5 percent slopes MakAt---------| Manahawkin muck, 0 to 2 percent slopes, frequently flooded MamnAv--------| Mannington-Nanticoke complex, 0 to 1 percent slopes, very frequently flooded TrkAv---------| Transquaking mucky peat, 0 to 1 percent slopes, very frequently flooded________________|________________________________________________________________________________
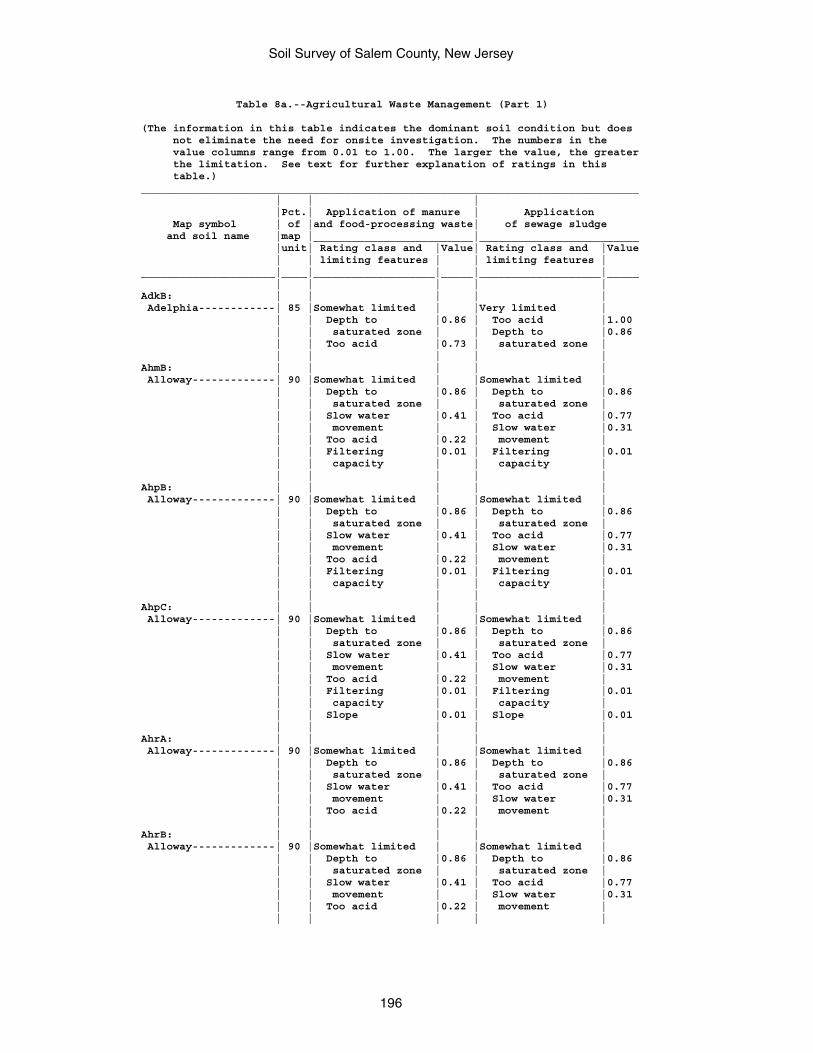
Soil Survey of Salem County, New Jersey
196
Table 8a.--Agricultural Waste Management (Part 1)
(The information in this table indicates the dominant soil condition but does not eliminate the need for onsite investigation. The numbers in the value columns range from 0.01 to 1.00. The larger the value, the greater the limitation. See text for further explanation of ratings in this table.)______________________________________________________________________________ | | | |Pct.| Application of manure | Application Map symbol | of |and food-processing waste| of sewage sludge and soil name |map |_________________________|_________________________ |unit| Rating class and |Value| Rating class and |Value | | limiting features | | limiting features |_____________________|____|___________________|_____|___________________|_____ | | | | |AdkB: | | | | | Adelphia------------| 85 |Somewhat limited | |Very limited | | | Depth to |0.86 | Too acid |1.00 | | saturated zone | | Depth to |0.86 | | Too acid |0.73 | saturated zone | | | | | |AhmB: | | | | | Alloway-------------| 90 |Somewhat limited | |Somewhat limited | | | Depth to |0.86 | Depth to |0.86 | | saturated zone | | saturated zone | | | Slow water |0.41 | Too acid |0.77 | | movement | | Slow water |0.31 | | Too acid |0.22 | movement | | | Filtering |0.01 | Filtering |0.01 | | capacity | | capacity | | | | | |AhpB: | | | | | Alloway-------------| 90 |Somewhat limited | |Somewhat limited | | | Depth to |0.86 | Depth to |0.86 | | saturated zone | | saturated zone | | | Slow water |0.41 | Too acid |0.77 | | movement | | Slow water |0.31 | | Too acid |0.22 | movement | | | Filtering |0.01 | Filtering |0.01 | | capacity | | capacity | | | | | |AhpC: | | | | | Alloway-------------| 90 |Somewhat limited | |Somewhat limited | | | Depth to |0.86 | Depth to |0.86 | | saturated zone | | saturated zone | | | Slow water |0.41 | Too acid |0.77 | | movement | | Slow water |0.31 | | Too acid |0.22 | movement | | | Filtering |0.01 | Filtering |0.01 | | capacity | | capacity | | | Slope |0.01 | Slope |0.01 | | | | |AhrA: | | | | | Alloway-------------| 90 |Somewhat limited | |Somewhat limited | | | Depth to |0.86 | Depth to |0.86 | | saturated zone | | saturated zone | | | Slow water |0.41 | Too acid |0.77 | | movement | | Slow water |0.31 | | Too acid |0.22 | movement | | | | | |AhrB: | | | | | Alloway-------------| 90 |Somewhat limited | |Somewhat limited | | | Depth to |0.86 | Depth to |0.86 | | saturated zone | | saturated zone | | | Slow water |0.41 | Too acid |0.77 | | movement | | Slow water |0.31 | | Too acid |0.22 | movement | | | | | |
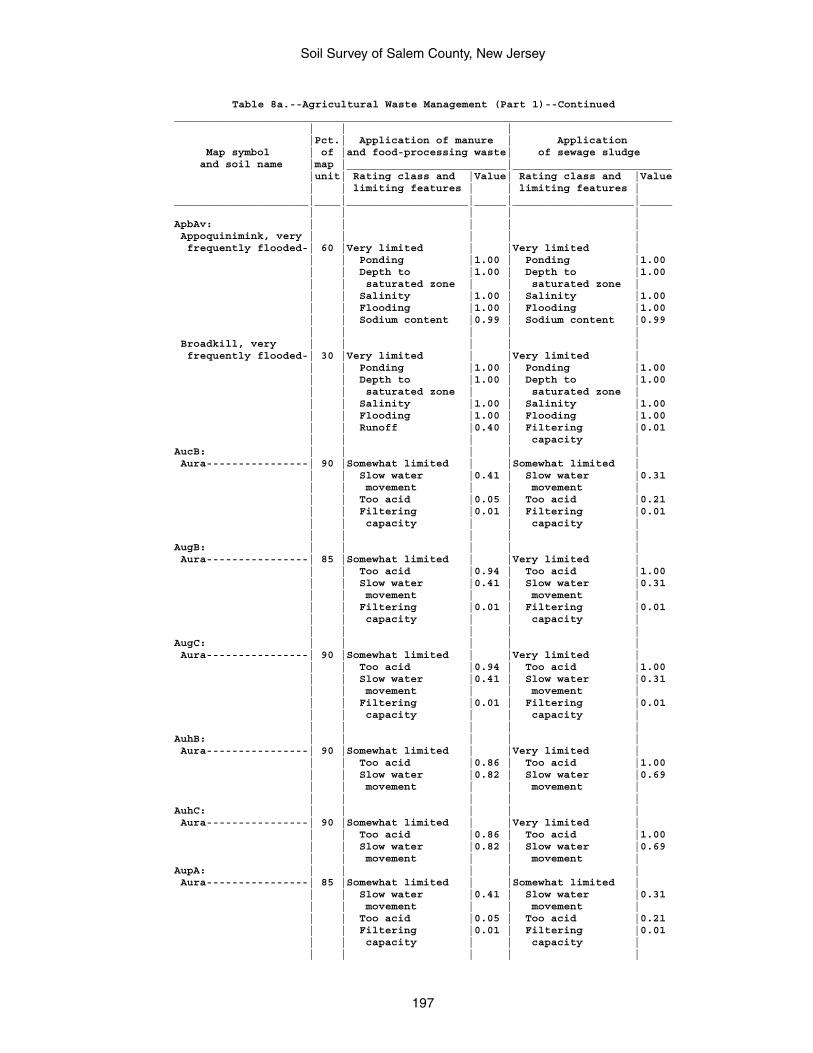
Soil Survey of Salem County, New Jersey
197
Table 8a.--Agricultural Waste Management (Part 1)--Continued______________________________________________________________________________ | | | |Pct.| Application of manure | Application Map symbol | of |and food-processing waste| of sewage sludge and soil name |map |_________________________|_________________________ |unit| Rating class and |Value| Rating class and |Value | | limiting features | | limiting features |_____________________|____|___________________|_____|___________________|_____ | | | | |ApbAv: | | | | | Appoquinimink, very | | | | | frequently flooded-| 60 |Very limited | |Very limited | | | Ponding |1.00 | Ponding |1.00 | | Depth to |1.00 | Depth to |1.00 | | saturated zone | | saturated zone | | | Salinity |1.00 | Salinity |1.00 | | Flooding |1.00 | Flooding |1.00 | | Sodium content |0.99 | Sodium content |0.99 | | | | | Broadkill, very | | | | | frequently flooded-| 30 |Very limited | |Very limited | | | Ponding |1.00 | Ponding |1.00 | | Depth to |1.00 | Depth to |1.00 | | saturated zone | | saturated zone | | | Salinity |1.00 | Salinity |1.00 | | Flooding |1.00 | Flooding |1.00 | | Runoff |0.40 | Filtering |0.01 | | | | capacity |AucB: | | | | | Aura----------------| 90 |Somewhat limited | |Somewhat limited | | | Slow water |0.41 | Slow water |0.31 | | movement | | movement | | | Too acid |0.05 | Too acid |0.21 | | Filtering |0.01 | Filtering |0.01 | | capacity | | capacity | | | | | |AugB: | | | | | Aura----------------| 85 |Somewhat limited | |Very limited | | | Too acid |0.94 | Too acid |1.00 | | Slow water |0.41 | Slow water |0.31 | | movement | | movement | | | Filtering |0.01 | Filtering |0.01 | | capacity | | capacity | | | | | |AugC: | | | | | Aura----------------| 90 |Somewhat limited | |Very limited | | | Too acid |0.94 | Too acid |1.00 | | Slow water |0.41 | Slow water |0.31 | | movement | | movement | | | Filtering |0.01 | Filtering |0.01 | | capacity | | capacity | | | | | |AuhB: | | | | | Aura----------------| 90 |Somewhat limited | |Very limited | | | Too acid |0.86 | Too acid |1.00 | | Slow water |0.82 | Slow water |0.69 | | movement | | movement | | | | | |AuhC: | | | | | Aura----------------| 90 |Somewhat limited | |Very limited | | | Too acid |0.86 | Too acid |1.00 | | Slow water |0.82 | Slow water |0.69 | | movement | | movement |AupA: | | | | | Aura----------------| 85 |Somewhat limited | |Somewhat limited | | | Slow water |0.41 | Slow water |0.31 | | movement | | movement | | | Too acid |0.05 | Too acid |0.21 | | Filtering |0.01 | Filtering |0.01 | | capacity | | capacity | | | | | |
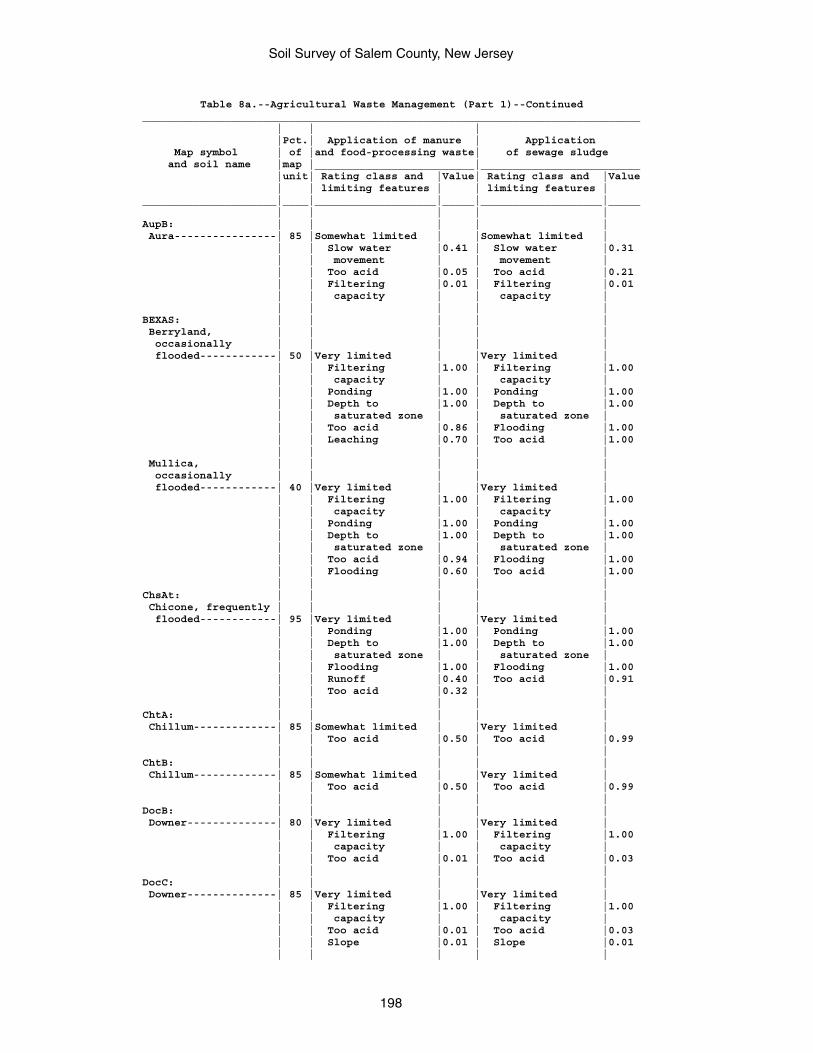
Soil Survey of Salem County, New Jersey
198
Table 8a.--Agricultural Waste Management (Part 1)--Continued______________________________________________________________________________ | | | |Pct.| Application of manure | Application Map symbol | of |and food-processing waste| of sewage sludge and soil name |map |_________________________|_________________________ |unit| Rating class and |Value| Rating class and |Value | | limiting features | | limiting features |_____________________|____|___________________|_____|___________________|_____ | | | | |AupB: | | | | | Aura----------------| 85 |Somewhat limited | |Somewhat limited | | | Slow water |0.41 | Slow water |0.31 | | movement | | movement | | | Too acid |0.05 | Too acid |0.21 | | Filtering |0.01 | Filtering |0.01 | | capacity | | capacity | | | | | |BEXAS: | | | | | Berryland, | | | | | occasionally | | | | | flooded------------| 50 |Very limited | |Very limited | | | Filtering |1.00 | Filtering |1.00 | | capacity | | capacity | | | Ponding |1.00 | Ponding |1.00 | | Depth to |1.00 | Depth to |1.00 | | saturated zone | | saturated zone | | | Too acid |0.86 | Flooding |1.00 | | Leaching |0.70 | Too acid |1.00 | | | | | Mullica, | | | | | occasionally | | | | | flooded------------| 40 |Very limited | |Very limited | | | Filtering |1.00 | Filtering |1.00 | | capacity | | capacity | | | Ponding |1.00 | Ponding |1.00 | | Depth to |1.00 | Depth to |1.00 | | saturated zone | | saturated zone | | | Too acid |0.94 | Flooding |1.00 | | Flooding |0.60 | Too acid |1.00 | | | | |ChsAt: | | | | | Chicone, frequently | | | | | flooded------------| 95 |Very limited | |Very limited | | | Ponding |1.00 | Ponding |1.00 | | Depth to |1.00 | Depth to |1.00 | | saturated zone | | saturated zone | | | Flooding |1.00 | Flooding |1.00 | | Runoff |0.40 | Too acid |0.91 | | Too acid |0.32 | | | | | | |ChtA: | | | | | Chillum-------------| 85 |Somewhat limited | |Very limited | | | Too acid |0.50 | Too acid |0.99 | | | | |ChtB: | | | | | Chillum-------------| 85 |Somewhat limited | |Very limited | | | Too acid |0.50 | Too acid |0.99 | | | | |DocB: | | | | | Downer--------------| 80 |Very limited | |Very limited | | | Filtering |1.00 | Filtering |1.00 | | capacity | | capacity | | | Too acid |0.01 | Too acid |0.03 | | | | |DocC: | | | | | Downer--------------| 85 |Very limited | |Very limited | | | Filtering |1.00 | Filtering |1.00 | | capacity | | capacity | | | Too acid |0.01 | Too acid |0.03 | | Slope |0.01 | Slope |0.01 | | | | |
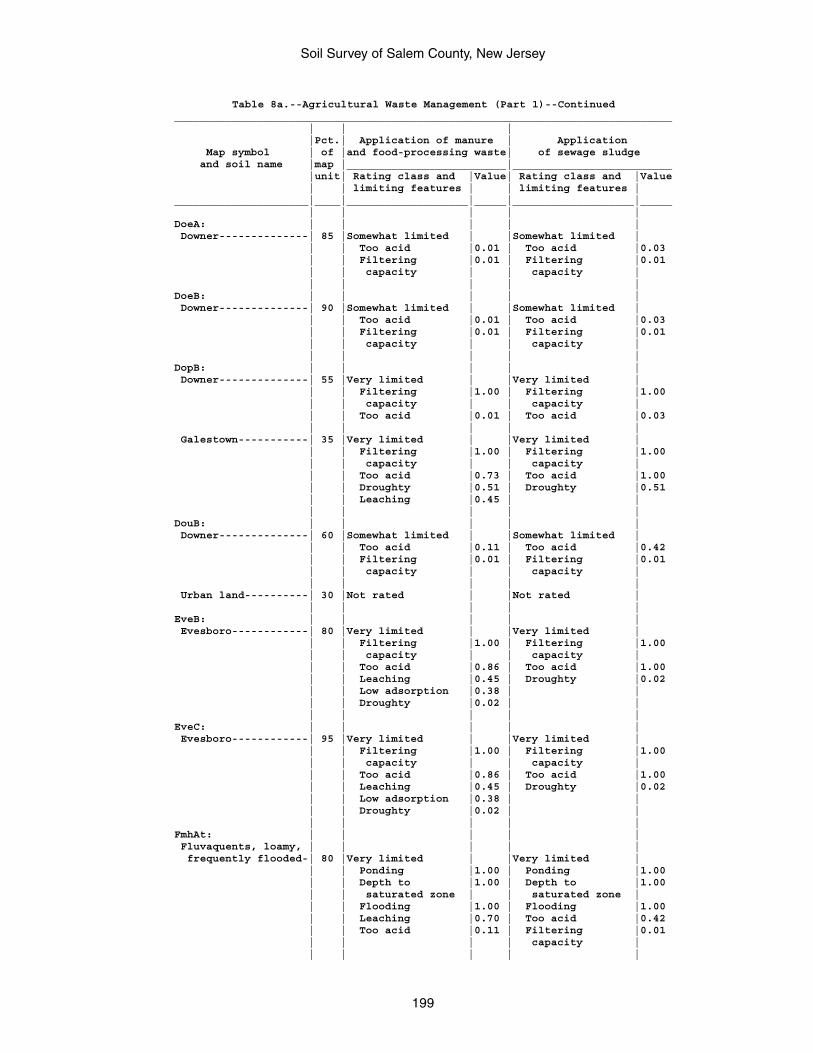
Soil Survey of Salem County, New Jersey
199
Table 8a.--Agricultural Waste Management (Part 1)--Continued______________________________________________________________________________ | | | |Pct.| Application of manure | Application Map symbol | of |and food-processing waste| of sewage sludge and soil name |map |_________________________|_________________________ |unit| Rating class and |Value| Rating class and |Value | | limiting features | | limiting features |_____________________|____|___________________|_____|___________________|_____ | | | | |DoeA: | | | | | Downer--------------| 85 |Somewhat limited | |Somewhat limited | | | Too acid |0.01 | Too acid |0.03 | | Filtering |0.01 | Filtering |0.01 | | capacity | | capacity | | | | | |DoeB: | | | | | Downer--------------| 90 |Somewhat limited | |Somewhat limited | | | Too acid |0.01 | Too acid |0.03 | | Filtering |0.01 | Filtering |0.01 | | capacity | | capacity | | | | | |DopB: | | | | | Downer--------------| 55 |Very limited | |Very limited | | | Filtering |1.00 | Filtering |1.00 | | capacity | | capacity | | | Too acid |0.01 | Too acid |0.03 | | | | | Galestown-----------| 35 |Very limited | |Very limited | | | Filtering |1.00 | Filtering |1.00 | | capacity | | capacity | | | Too acid |0.73 | Too acid |1.00 | | Droughty |0.51 | Droughty |0.51 | | Leaching |0.45 | | | | | | |DouB: | | | | | Downer--------------| 60 |Somewhat limited | |Somewhat limited | | | Too acid |0.11 | Too acid |0.42 | | Filtering |0.01 | Filtering |0.01 | | capacity | | capacity | | | | | | Urban land----------| 30 |Not rated | |Not rated | | | | | |EveB: | | | | | Evesboro------------| 80 |Very limited | |Very limited | | | Filtering |1.00 | Filtering |1.00 | | capacity | | capacity | | | Too acid |0.86 | Too acid |1.00 | | Leaching |0.45 | Droughty |0.02 | | Low adsorption |0.38 | | | | Droughty |0.02 | | | | | | |EveC: | | | | | Evesboro------------| 95 |Very limited | |Very limited | | | Filtering |1.00 | Filtering |1.00 | | capacity | | capacity | | | Too acid |0.86 | Too acid |1.00 | | Leaching |0.45 | Droughty |0.02 | | Low adsorption |0.38 | | | | Droughty |0.02 | | | | | | |FmhAt: | | | | | Fluvaquents, loamy, | | | | | frequently flooded-| 80 |Very limited | |Very limited | | | Ponding |1.00 | Ponding |1.00 | | Depth to |1.00 | Depth to |1.00 | | saturated zone | | saturated zone | | | Flooding |1.00 | Flooding |1.00 | | Leaching |0.70 | Too acid |0.42 | | Too acid |0.11 | Filtering |0.01 | | | | capacity | | | | | |
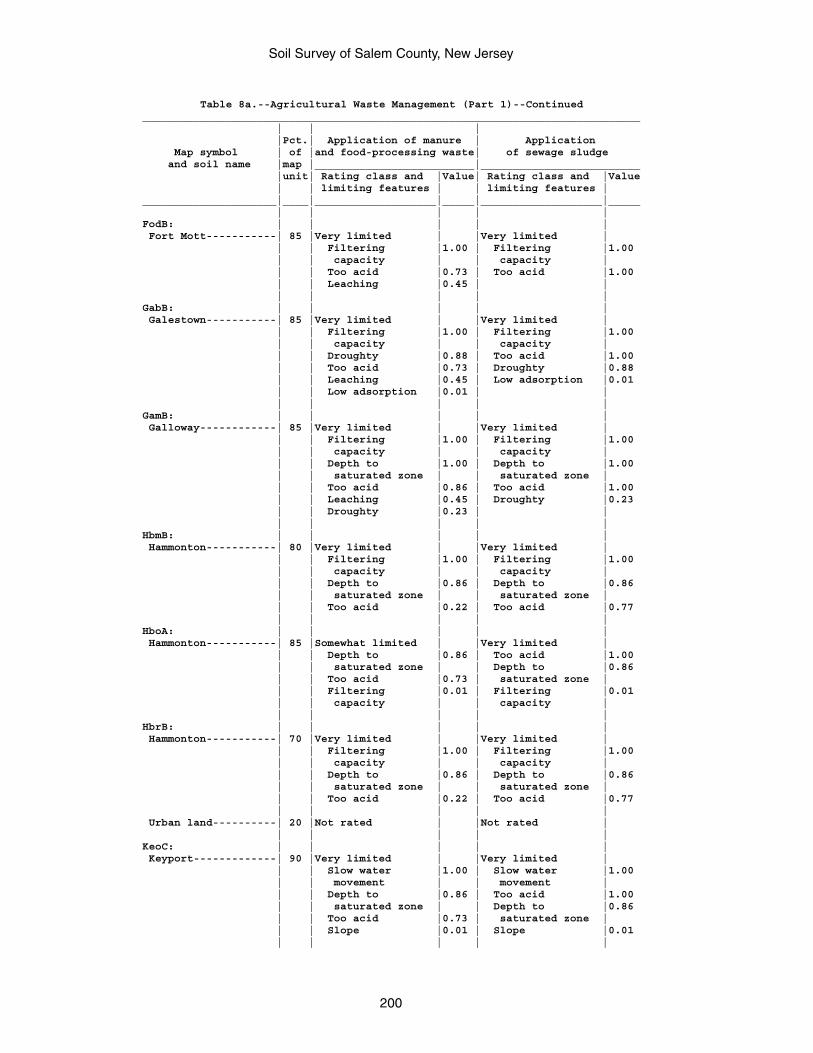
Soil Survey of Salem County, New Jersey
200
Table 8a.--Agricultural Waste Management (Part 1)--Continued______________________________________________________________________________ | | | |Pct.| Application of manure | Application Map symbol | of |and food-processing waste| of sewage sludge and soil name |map |_________________________|_________________________ |unit| Rating class and |Value| Rating class and |Value | | limiting features | | limiting features |_____________________|____|___________________|_____|___________________|_____ | | | | |FodB: | | | | | Fort Mott-----------| 85 |Very limited | |Very limited | | | Filtering |1.00 | Filtering |1.00 | | capacity | | capacity | | | Too acid |0.73 | Too acid |1.00 | | Leaching |0.45 | | | | | | |GabB: | | | | | Galestown-----------| 85 |Very limited | |Very limited | | | Filtering |1.00 | Filtering |1.00 | | capacity | | capacity | | | Droughty |0.88 | Too acid |1.00 | | Too acid |0.73 | Droughty |0.88 | | Leaching |0.45 | Low adsorption |0.01 | | Low adsorption |0.01 | | | | | | |GamB: | | | | | Galloway------------| 85 |Very limited | |Very limited | | | Filtering |1.00 | Filtering |1.00 | | capacity | | capacity | | | Depth to |1.00 | Depth to |1.00 | | saturated zone | | saturated zone | | | Too acid |0.86 | Too acid |1.00 | | Leaching |0.45 | Droughty |0.23 | | Droughty |0.23 | | | | | | |HbmB: | | | | | Hammonton-----------| 80 |Very limited | |Very limited | | | Filtering |1.00 | Filtering |1.00 | | capacity | | capacity | | | Depth to |0.86 | Depth to |0.86 | | saturated zone | | saturated zone | | | Too acid |0.22 | Too acid |0.77 | | | | |HboA: | | | | | Hammonton-----------| 85 |Somewhat limited | |Very limited | | | Depth to |0.86 | Too acid |1.00 | | saturated zone | | Depth to |0.86 | | Too acid |0.73 | saturated zone | | | Filtering |0.01 | Filtering |0.01 | | capacity | | capacity | | | | | |HbrB: | | | | | Hammonton-----------| 70 |Very limited | |Very limited | | | Filtering |1.00 | Filtering |1.00 | | capacity | | capacity | | | Depth to |0.86 | Depth to |0.86 | | saturated zone | | saturated zone | | | Too acid |0.22 | Too acid |0.77 | | | | | Urban land----------| 20 |Not rated | |Not rated | | | | | |KeoC: | | | | | Keyport-------------| 90 |Very limited | |Very limited | | | Slow water |1.00 | Slow water |1.00 | | movement | | movement | | | Depth to |0.86 | Too acid |1.00 | | saturated zone | | Depth to |0.86 | | Too acid |0.73 | saturated zone | | | Slope |0.01 | Slope |0.01 | | | | |
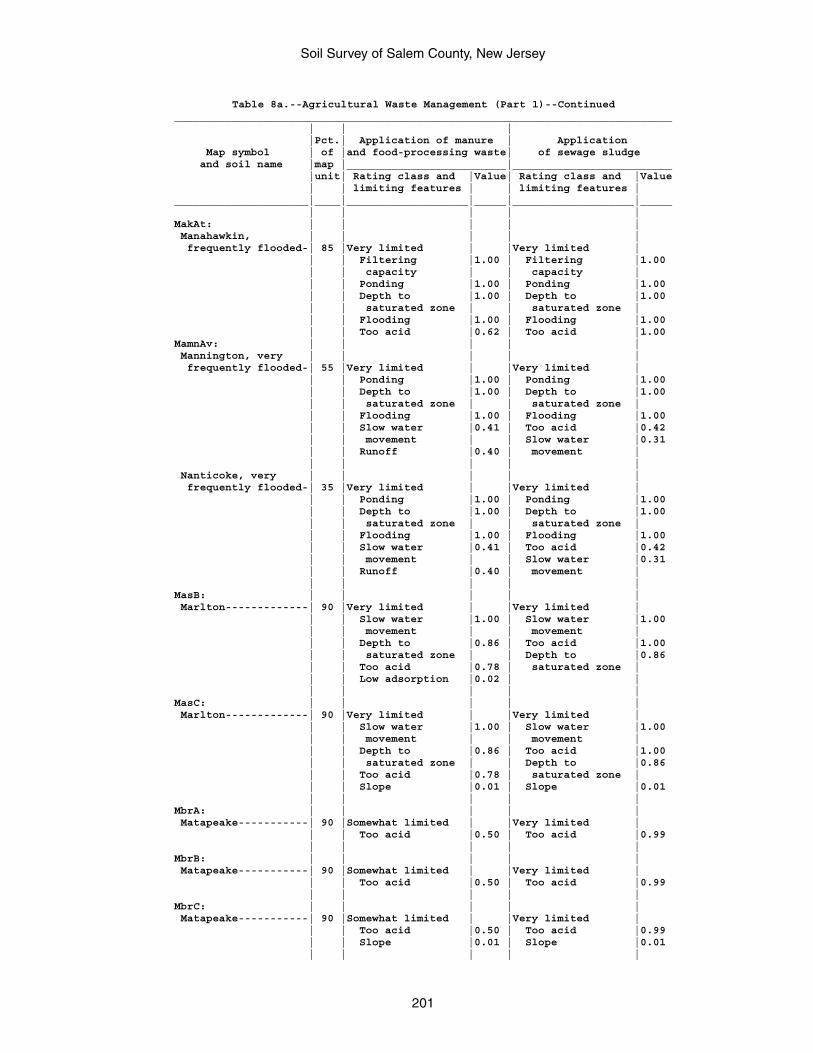
Soil Survey of Salem County, New Jersey
201
Table 8a.--Agricultural Waste Management (Part 1)--Continued______________________________________________________________________________ | | | |Pct.| Application of manure | Application Map symbol | of |and food-processing waste| of sewage sludge and soil name |map |_________________________|_________________________ |unit| Rating class and |Value| Rating class and |Value | | limiting features | | limiting features |_____________________|____|___________________|_____|___________________|_____ | | | | |MakAt: | | | | | Manahawkin, | | | | | frequently flooded-| 85 |Very limited | |Very limited | | | Filtering |1.00 | Filtering |1.00 | | capacity | | capacity | | | Ponding |1.00 | Ponding |1.00 | | Depth to |1.00 | Depth to |1.00 | | saturated zone | | saturated zone | | | Flooding |1.00 | Flooding |1.00 | | Too acid |0.62 | Too acid |1.00MamnAv: | | | | | Mannington, very | | | | | frequently flooded-| 55 |Very limited | |Very limited | | | Ponding |1.00 | Ponding |1.00 | | Depth to |1.00 | Depth to |1.00 | | saturated zone | | saturated zone | | | Flooding |1.00 | Flooding |1.00 | | Slow water |0.41 | Too acid |0.42 | | movement | | Slow water |0.31 | | Runoff |0.40 | movement | | | | | | Nanticoke, very | | | | | frequently flooded-| 35 |Very limited | |Very limited | | | Ponding |1.00 | Ponding |1.00 | | Depth to |1.00 | Depth to |1.00 | | saturated zone | | saturated zone | | | Flooding |1.00 | Flooding |1.00 | | Slow water |0.41 | Too acid |0.42 | | movement | | Slow water |0.31 | | Runoff |0.40 | movement | | | | | |MasB: | | | | | Marlton-------------| 90 |Very limited | |Very limited | | | Slow water |1.00 | Slow water |1.00 | | movement | | movement | | | Depth to |0.86 | Too acid |1.00 | | saturated zone | | Depth to |0.86 | | Too acid |0.78 | saturated zone | | | Low adsorption |0.02 | | | | | | |MasC: | | | | | Marlton-------------| 90 |Very limited | |Very limited | | | Slow water |1.00 | Slow water |1.00 | | movement | | movement | | | Depth to |0.86 | Too acid |1.00 | | saturated zone | | Depth to |0.86 | | Too acid |0.78 | saturated zone | | | Slope |0.01 | Slope |0.01 | | | | |MbrA: | | | | | Matapeake-----------| 90 |Somewhat limited | |Very limited | | | Too acid |0.50 | Too acid |0.99 | | | | |MbrB: | | | | | Matapeake-----------| 90 |Somewhat limited | |Very limited | | | Too acid |0.50 | Too acid |0.99 | | | | |MbrC: | | | | | Matapeake-----------| 90 |Somewhat limited | |Very limited | | | Too acid |0.50 | Too acid |0.99 | | Slope |0.01 | Slope |0.01 | | | | |
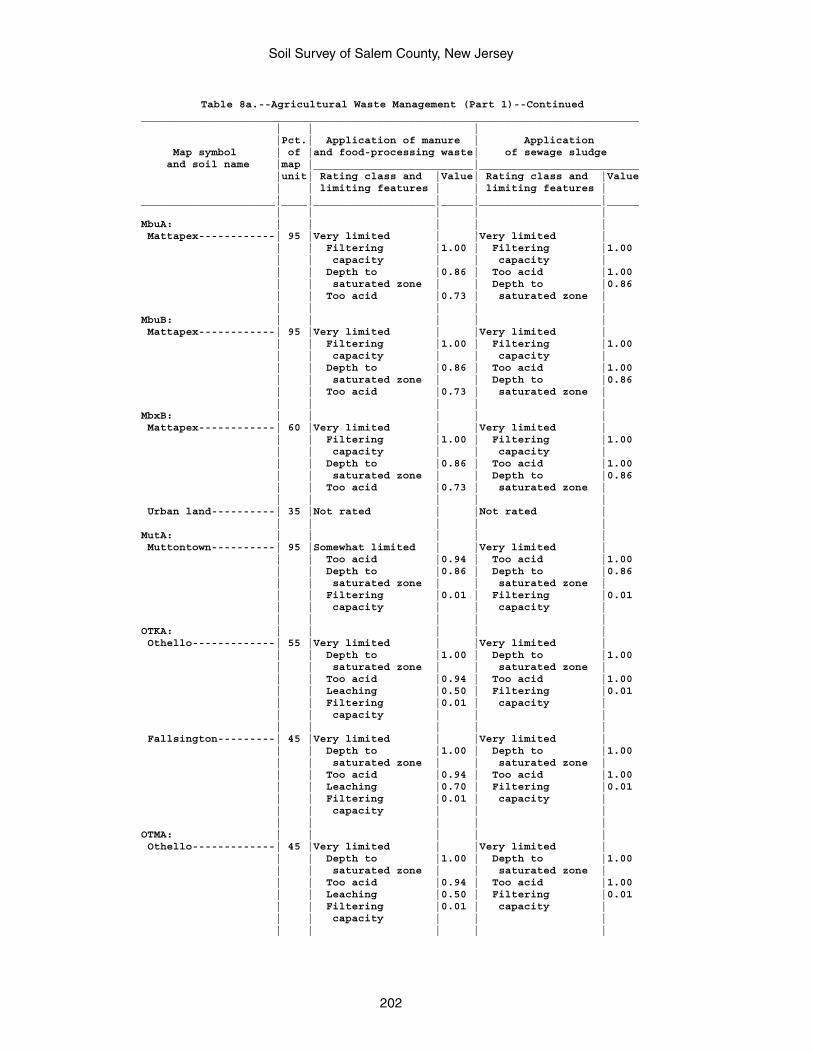
Soil Survey of Salem County, New Jersey
202
Table 8a.--Agricultural Waste Management (Part 1)--Continued______________________________________________________________________________ | | | |Pct.| Application of manure | Application Map symbol | of |and food-processing waste| of sewage sludge and soil name |map |_________________________|_________________________ |unit| Rating class and |Value| Rating class and |Value | | limiting features | | limiting features |_____________________|____|___________________|_____|___________________|_____ | | | | |MbuA: | | | | | Mattapex------------| 95 |Very limited | |Very limited | | | Filtering |1.00 | Filtering |1.00 | | capacity | | capacity | | | Depth to |0.86 | Too acid |1.00 | | saturated zone | | Depth to |0.86 | | Too acid |0.73 | saturated zone | | | | | |MbuB: | | | | | Mattapex------------| 95 |Very limited | |Very limited | | | Filtering |1.00 | Filtering |1.00 | | capacity | | capacity | | | Depth to |0.86 | Too acid |1.00 | | saturated zone | | Depth to |0.86 | | Too acid |0.73 | saturated zone | | | | | |MbxB: | | | | | Mattapex------------| 60 |Very limited | |Very limited | | | Filtering |1.00 | Filtering |1.00 | | capacity | | capacity | | | Depth to |0.86 | Too acid |1.00 | | saturated zone | | Depth to |0.86 | | Too acid |0.73 | saturated zone | | | | | | Urban land----------| 35 |Not rated | |Not rated | | | | | |MutA: | | | | | Muttontown----------| 95 |Somewhat limited | |Very limited | | | Too acid |0.94 | Too acid |1.00 | | Depth to |0.86 | Depth to |0.86 | | saturated zone | | saturated zone | | | Filtering |0.01 | Filtering |0.01 | | capacity | | capacity | | | | | |OTKA: | | | | | Othello-------------| 55 |Very limited | |Very limited | | | Depth to |1.00 | Depth to |1.00 | | saturated zone | | saturated zone | | | Too acid |0.94 | Too acid |1.00 | | Leaching |0.50 | Filtering |0.01 | | Filtering |0.01 | capacity | | | capacity | | | | | | | | Fallsington---------| 45 |Very limited | |Very limited | | | Depth to |1.00 | Depth to |1.00 | | saturated zone | | saturated zone | | | Too acid |0.94 | Too acid |1.00 | | Leaching |0.70 | Filtering |0.01 | | Filtering |0.01 | capacity | | | capacity | | | | | | | |OTMA: | | | | | Othello-------------| 45 |Very limited | |Very limited | | | Depth to |1.00 | Depth to |1.00 | | saturated zone | | saturated zone | | | Too acid |0.94 | Too acid |1.00 | | Leaching |0.50 | Filtering |0.01 | | Filtering |0.01 | capacity | | | capacity | | | | | | | |
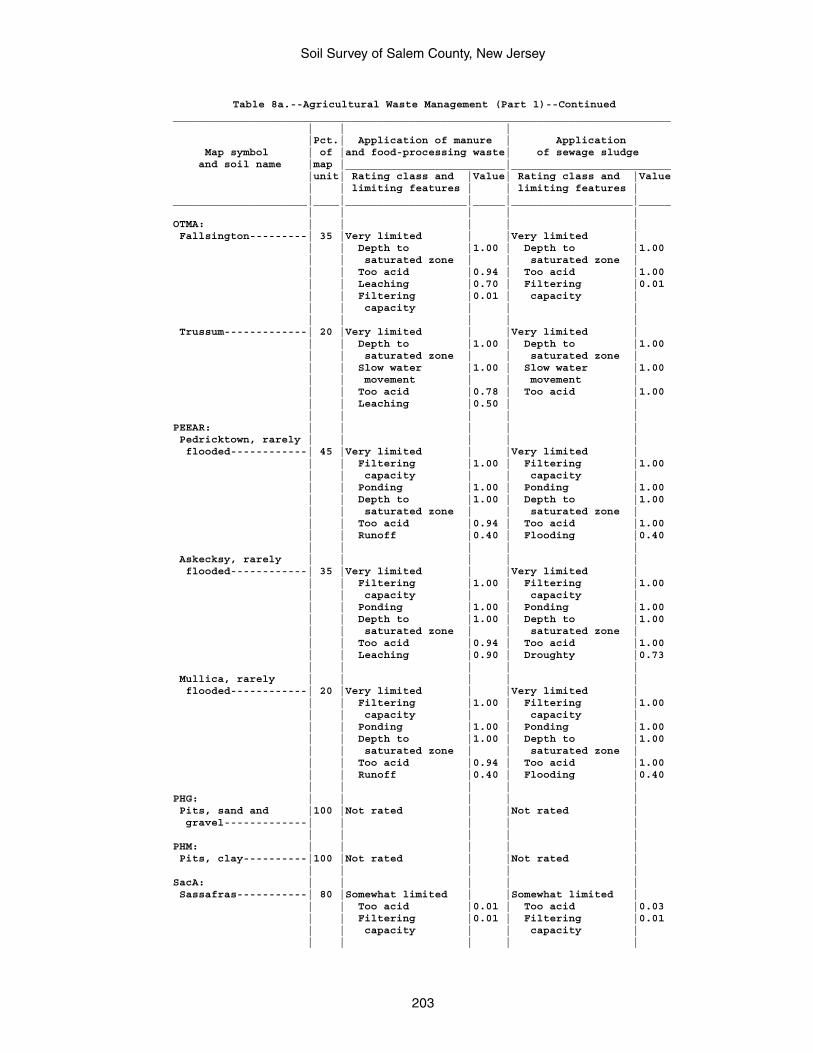
Soil Survey of Salem County, New Jersey
203
Table 8a.--Agricultural Waste Management (Part 1)--Continued______________________________________________________________________________ | | | |Pct.| Application of manure | Application Map symbol | of |and food-processing waste| of sewage sludge and soil name |map |_________________________|_________________________ |unit| Rating class and |Value| Rating class and |Value | | limiting features | | limiting features |_____________________|____|___________________|_____|___________________|_____ | | | | |OTMA: | | | | | Fallsington---------| 35 |Very limited | |Very limited | | | Depth to |1.00 | Depth to |1.00 | | saturated zone | | saturated zone | | | Too acid |0.94 | Too acid |1.00 | | Leaching |0.70 | Filtering |0.01 | | Filtering |0.01 | capacity | | | capacity | | | | | | | | Trussum-------------| 20 |Very limited | |Very limited | | | Depth to |1.00 | Depth to |1.00 | | saturated zone | | saturated zone | | | Slow water |1.00 | Slow water |1.00 | | movement | | movement | | | Too acid |0.78 | Too acid |1.00 | | Leaching |0.50 | | | | | | |PEEAR: | | | | | Pedricktown, rarely | | | | | flooded------------| 45 |Very limited | |Very limited | | | Filtering |1.00 | Filtering |1.00 | | capacity | | capacity | | | Ponding |1.00 | Ponding |1.00 | | Depth to |1.00 | Depth to |1.00 | | saturated zone | | saturated zone | | | Too acid |0.94 | Too acid |1.00 | | Runoff |0.40 | Flooding |0.40 | | | | | Askecksy, rarely | | | | | flooded------------| 35 |Very limited | |Very limited | | | Filtering |1.00 | Filtering |1.00 | | capacity | | capacity | | | Ponding |1.00 | Ponding |1.00 | | Depth to |1.00 | Depth to |1.00 | | saturated zone | | saturated zone | | | Too acid |0.94 | Too acid |1.00 | | Leaching |0.90 | Droughty |0.73 | | | | | Mullica, rarely | | | | | flooded------------| 20 |Very limited | |Very limited | | | Filtering |1.00 | Filtering |1.00 | | capacity | | capacity | | | Ponding |1.00 | Ponding |1.00 | | Depth to |1.00 | Depth to |1.00 | | saturated zone | | saturated zone | | | Too acid |0.94 | Too acid |1.00 | | Runoff |0.40 | Flooding |0.40 | | | | |PHG: | | | | | Pits, sand and |100 |Not rated | |Not rated | gravel-------------| | | | | | | | | |PHM: | | | | | Pits, clay----------|100 |Not rated | |Not rated | | | | | |SacA: | | | | | Sassafras-----------| 80 |Somewhat limited | |Somewhat limited | | | Too acid |0.01 | Too acid |0.03 | | Filtering |0.01 | Filtering |0.01 | | capacity | | capacity | | | | | |
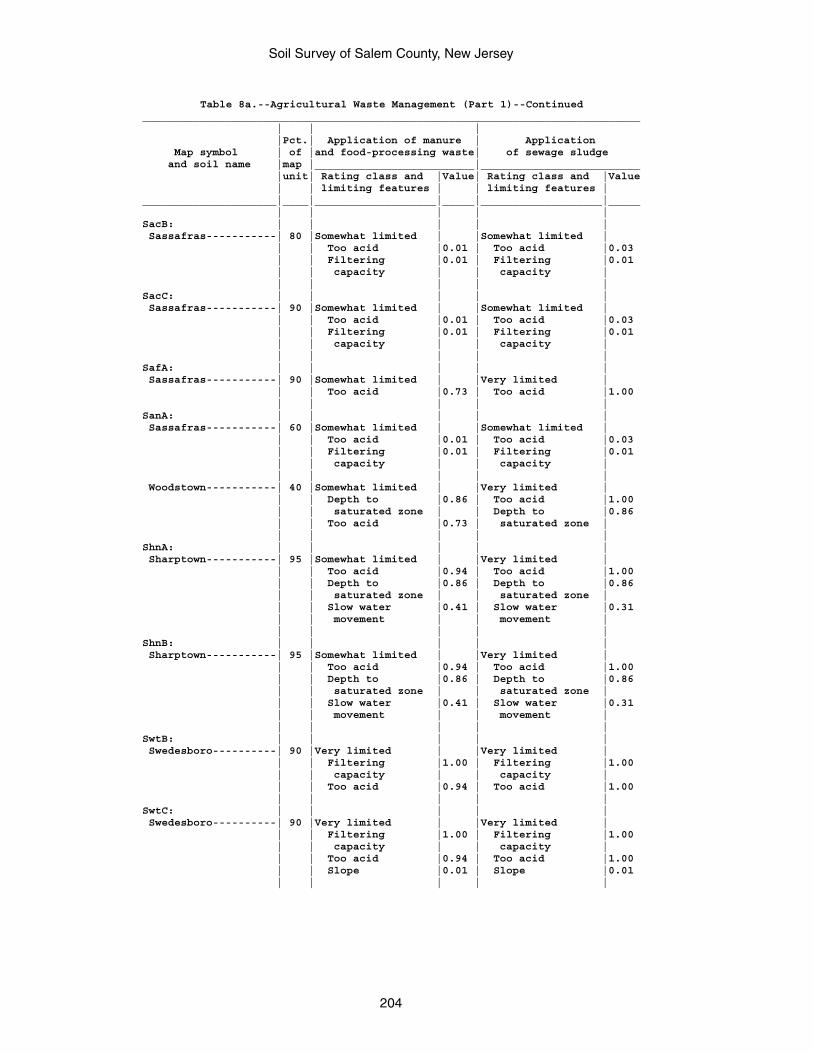
Soil Survey of Salem County, New Jersey
204
Table 8a.--Agricultural Waste Management (Part 1)--Continued______________________________________________________________________________ | | | |Pct.| Application of manure | Application Map symbol | of |and food-processing waste| of sewage sludge and soil name |map |_________________________|_________________________ |unit| Rating class and |Value| Rating class and |Value | | limiting features | | limiting features |_____________________|____|___________________|_____|___________________|_____ | | | | |SacB: | | | | | Sassafras-----------| 80 |Somewhat limited | |Somewhat limited | | | Too acid |0.01 | Too acid |0.03 | | Filtering |0.01 | Filtering |0.01 | | capacity | | capacity | | | | | |SacC: | | | | | Sassafras-----------| 90 |Somewhat limited | |Somewhat limited | | | Too acid |0.01 | Too acid |0.03 | | Filtering |0.01 | Filtering |0.01 | | capacity | | capacity | | | | | |SafA: | | | | | Sassafras-----------| 90 |Somewhat limited | |Very limited | | | Too acid |0.73 | Too acid |1.00 | | | | |SanA: | | | | | Sassafras-----------| 60 |Somewhat limited | |Somewhat limited | | | Too acid |0.01 | Too acid |0.03 | | Filtering |0.01 | Filtering |0.01 | | capacity | | capacity | | | | | | Woodstown-----------| 40 |Somewhat limited | |Very limited | | | Depth to |0.86 | Too acid |1.00 | | saturated zone | | Depth to |0.86 | | Too acid |0.73 | saturated zone | | | | | |ShnA: | | | | | Sharptown-----------| 95 |Somewhat limited | |Very limited | | | Too acid |0.94 | Too acid |1.00 | | Depth to |0.86 | Depth to |0.86 | | saturated zone | | saturated zone | | | Slow water |0.41 | Slow water |0.31 | | movement | | movement | | | | | |ShnB: | | | | | Sharptown-----------| 95 |Somewhat limited | |Very limited | | | Too acid |0.94 | Too acid |1.00 | | Depth to |0.86 | Depth to |0.86 | | saturated zone | | saturated zone | | | Slow water |0.41 | Slow water |0.31 | | movement | | movement | | | | | |SwtB: | | | | | Swedesboro----------| 90 |Very limited | |Very limited | | | Filtering |1.00 | Filtering |1.00 | | capacity | | capacity | | | Too acid |0.94 | Too acid |1.00 | | | | |SwtC: | | | | | Swedesboro----------| 90 |Very limited | |Very limited | | | Filtering |1.00 | Filtering |1.00 | | capacity | | capacity | | | Too acid |0.94 | Too acid |1.00 | | Slope |0.01 | Slope |0.01 | | | | |
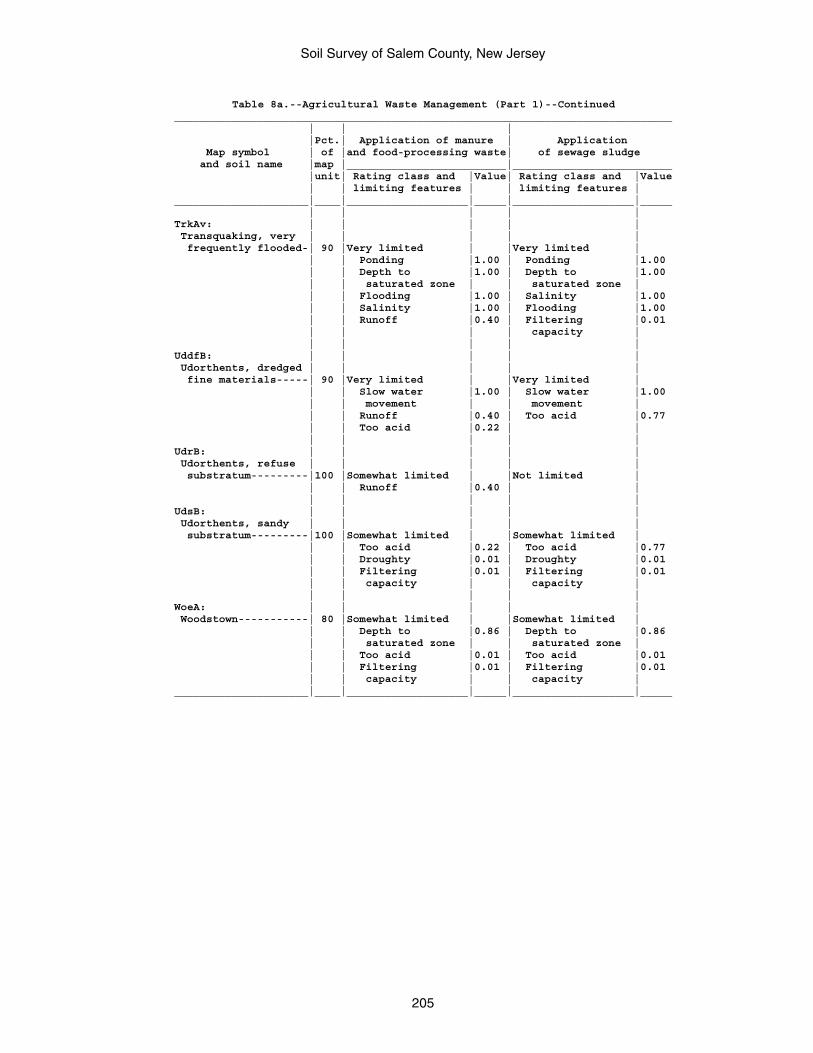
Soil Survey of Salem County, New Jersey
205
Table 8a.--Agricultural Waste Management (Part 1)--Continued______________________________________________________________________________ | | | |Pct.| Application of manure | Application Map symbol | of |and food-processing waste| of sewage sludge and soil name |map |_________________________|_________________________ |unit| Rating class and |Value| Rating class and |Value | | limiting features | | limiting features |_____________________|____|___________________|_____|___________________|_____ | | | | |TrkAv: | | | | | Transquaking, very | | | | | frequently flooded-| 90 |Very limited | |Very limited | | | Ponding |1.00 | Ponding |1.00 | | Depth to |1.00 | Depth to |1.00 | | saturated zone | | saturated zone | | | Flooding |1.00 | Salinity |1.00 | | Salinity |1.00 | Flooding |1.00 | | Runoff |0.40 | Filtering |0.01 | | | | capacity | | | | | |UddfB: | | | | | Udorthents, dredged | | | | | fine materials-----| 90 |Very limited | |Very limited | | | Slow water |1.00 | Slow water |1.00 | | movement | | movement | | | Runoff |0.40 | Too acid |0.77 | | Too acid |0.22 | | | | | | |UdrB: | | | | | Udorthents, refuse | | | | | substratum---------|100 |Somewhat limited | |Not limited | | | Runoff |0.40 | | | | | | |UdsB: | | | | | Udorthents, sandy | | | | | substratum---------|100 |Somewhat limited | |Somewhat limited | | | Too acid |0.22 | Too acid |0.77 | | Droughty |0.01 | Droughty |0.01 | | Filtering |0.01 | Filtering |0.01 | | capacity | | capacity | | | | | |WoeA: | | | | | Woodstown-----------| 80 |Somewhat limited | |Somewhat limited | | | Depth to |0.86 | Depth to |0.86 | | saturated zone | | saturated zone | | | Too acid |0.01 | Too acid |0.01 | | Filtering |0.01 | Filtering |0.01 | | capacity | | capacity |_____________________|____|___________________|_____|___________________|_____
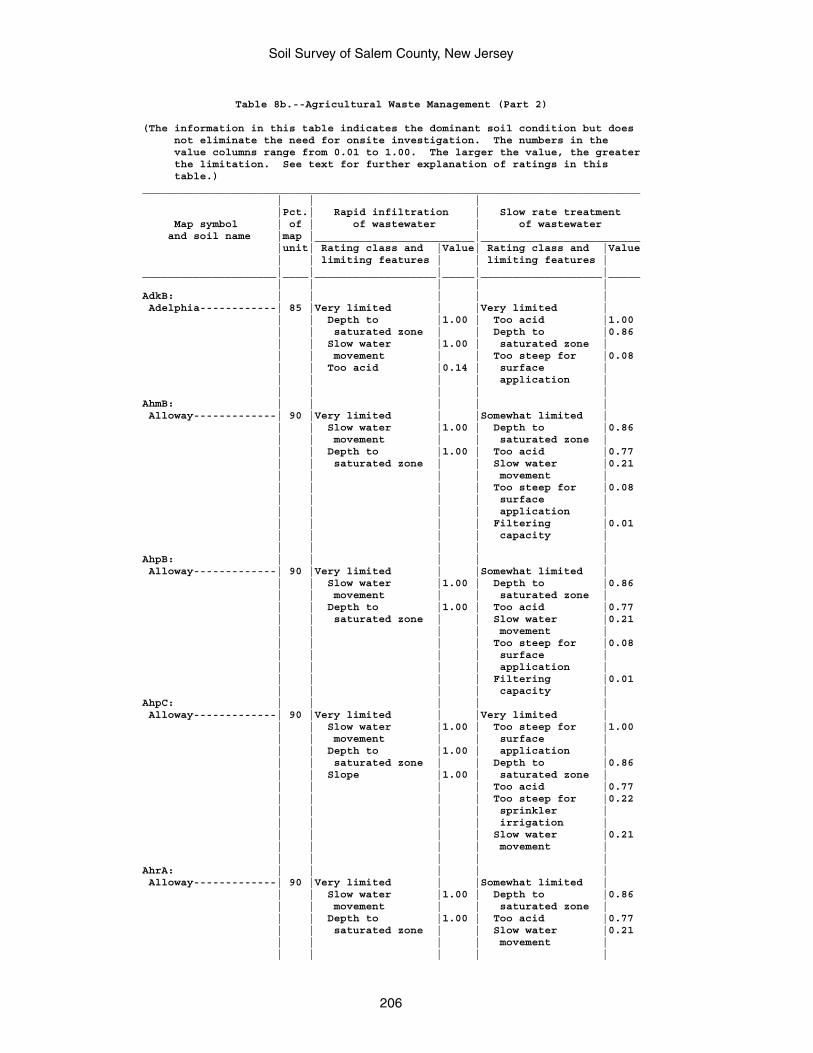
Soil Survey of Salem County, New Jersey
206
Table 8b.--Agricultural Waste Management (Part 2)
(The information in this table indicates the dominant soil condition but does not eliminate the need for onsite investigation. The numbers in the value columns range from 0.01 to 1.00. The larger the value, the greater the limitation. See text for further explanation of ratings in this table.)______________________________________________________________________________ | | | |Pct.| Rapid infiltration | Slow rate treatment Map symbol | of | of wastewater | of wastewater and soil name |map |_________________________|_________________________ |unit| Rating class and |Value| Rating class and |Value | | limiting features | | limiting features |_____________________|____|___________________|_____|___________________|_____ | | | | |AdkB: | | | | | Adelphia------------| 85 |Very limited | |Very limited | | | Depth to |1.00 | Too acid |1.00 | | saturated zone | | Depth to |0.86 | | Slow water |1.00 | saturated zone | | | movement | | Too steep for |0.08 | | Too acid |0.14 | surface | | | | | application | | | | | |AhmB: | | | | | Alloway-------------| 90 |Very limited | |Somewhat limited | | | Slow water |1.00 | Depth to |0.86 | | movement | | saturated zone | | | Depth to |1.00 | Too acid |0.77 | | saturated zone | | Slow water |0.21 | | | | movement | | | | | Too steep for |0.08 | | | | surface | | | | | application | | | | | Filtering |0.01 | | | | capacity | | | | | |AhpB: | | | | | Alloway-------------| 90 |Very limited | |Somewhat limited | | | Slow water |1.00 | Depth to |0.86 | | movement | | saturated zone | | | Depth to |1.00 | Too acid |0.77 | | saturated zone | | Slow water |0.21 | | | | movement | | | | | Too steep for |0.08 | | | | surface | | | | | application | | | | | Filtering |0.01 | | | | capacity |AhpC: | | | | | Alloway-------------| 90 |Very limited | |Very limited | | | Slow water |1.00 | Too steep for |1.00 | | movement | | surface | | | Depth to |1.00 | application | | | saturated zone | | Depth to |0.86 | | Slope |1.00 | saturated zone | | | | | Too acid |0.77 | | | | Too steep for |0.22 | | | | sprinkler | | | | | irrigation | | | | | Slow water |0.21 | | | | movement | | | | | |AhrA: | | | | | Alloway-------------| 90 |Very limited | |Somewhat limited | | | Slow water |1.00 | Depth to |0.86 | | movement | | saturated zone | | | Depth to |1.00 | Too acid |0.77 | | saturated zone | | Slow water |0.21 | | | | movement | | | | | |
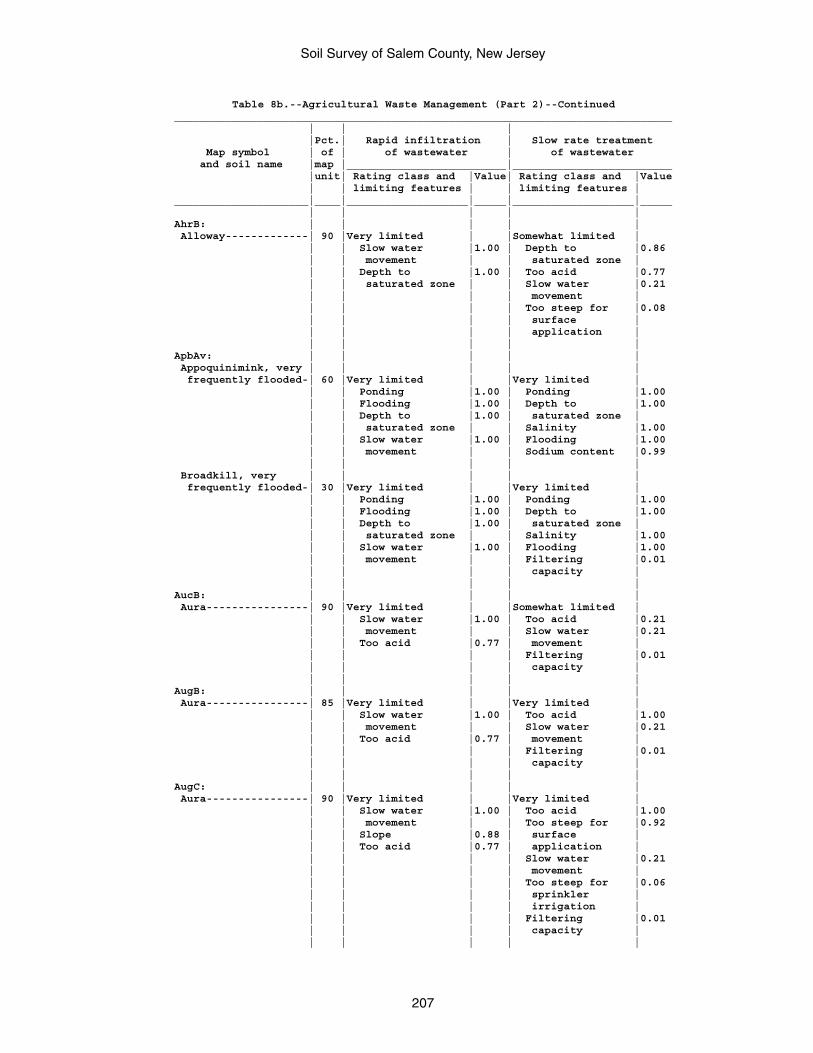
Soil Survey of Salem County, New Jersey
207
Table 8b.--Agricultural Waste Management (Part 2)--Continued______________________________________________________________________________ | | | |Pct.| Rapid infiltration | Slow rate treatment Map symbol | of | of wastewater | of wastewater and soil name |map |_________________________|_________________________ |unit| Rating class and |Value| Rating class and |Value | | limiting features | | limiting features |_____________________|____|___________________|_____|___________________|_____ | | | | |AhrB: | | | | | Alloway-------------| 90 |Very limited | |Somewhat limited | | | Slow water |1.00 | Depth to |0.86 | | movement | | saturated zone | | | Depth to |1.00 | Too acid |0.77 | | saturated zone | | Slow water |0.21 | | | | movement | | | | | Too steep for |0.08 | | | | surface | | | | | application | | | | | |ApbAv: | | | | | Appoquinimink, very | | | | | frequently flooded-| 60 |Very limited | |Very limited | | | Ponding |1.00 | Ponding |1.00 | | Flooding |1.00 | Depth to |1.00 | | Depth to |1.00 | saturated zone | | | saturated zone | | Salinity |1.00 | | Slow water |1.00 | Flooding |1.00 | | movement | | Sodium content |0.99 | | | | | Broadkill, very | | | | | frequently flooded-| 30 |Very limited | |Very limited | | | Ponding |1.00 | Ponding |1.00 | | Flooding |1.00 | Depth to |1.00 | | Depth to |1.00 | saturated zone | | | saturated zone | | Salinity |1.00 | | Slow water |1.00 | Flooding |1.00 | | movement | | Filtering |0.01 | | | | capacity | | | | | |AucB: | | | | | Aura----------------| 90 |Very limited | |Somewhat limited | | | Slow water |1.00 | Too acid |0.21 | | movement | | Slow water |0.21 | | Too acid |0.77 | movement | | | | | Filtering |0.01 | | | | capacity | | | | | |AugB: | | | | | Aura----------------| 85 |Very limited | |Very limited | | | Slow water |1.00 | Too acid |1.00 | | movement | | Slow water |0.21 | | Too acid |0.77 | movement | | | | | Filtering |0.01 | | | | capacity | | | | | |AugC: | | | | | Aura----------------| 90 |Very limited | |Very limited | | | Slow water |1.00 | Too acid |1.00 | | movement | | Too steep for |0.92 | | Slope |0.88 | surface | | | Too acid |0.77 | application | | | | | Slow water |0.21 | | | | movement | | | | | Too steep for |0.06 | | | | sprinkler | | | | | irrigation | | | | | Filtering |0.01 | | | | capacity | | | | | |
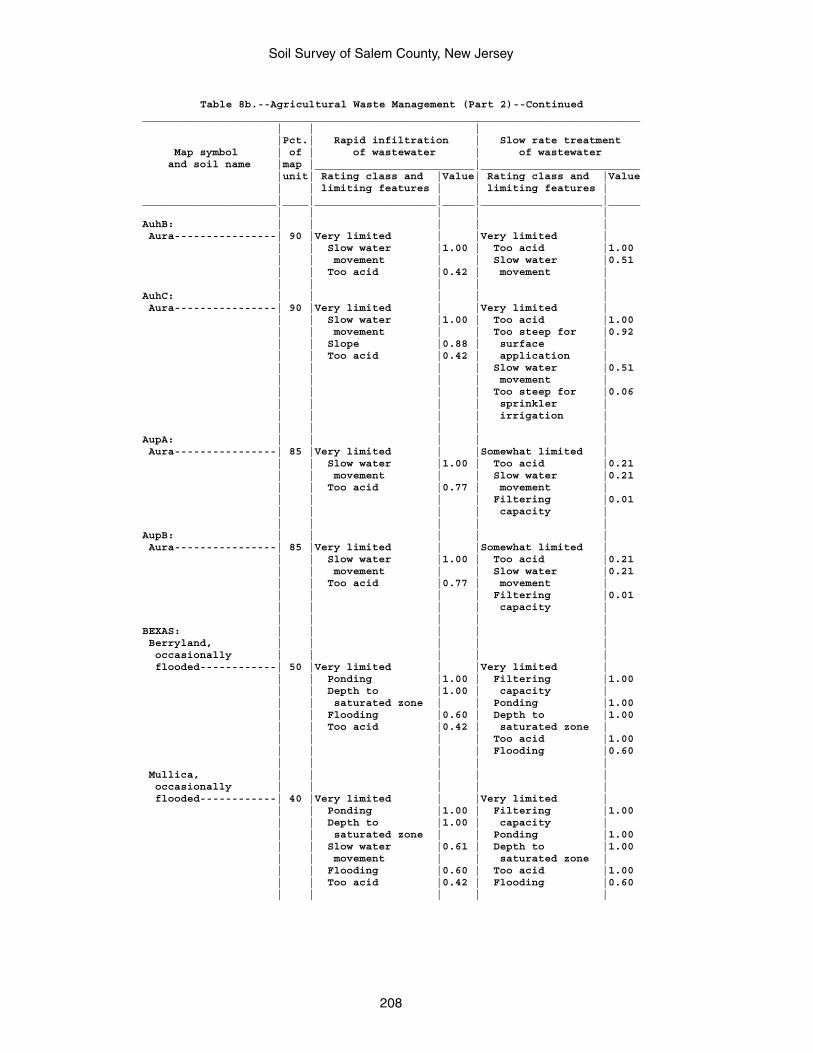
Soil Survey of Salem County, New Jersey
208
Table 8b.--Agricultural Waste Management (Part 2)--Continued______________________________________________________________________________ | | | |Pct.| Rapid infiltration | Slow rate treatment Map symbol | of | of wastewater | of wastewater and soil name |map |_________________________|_________________________ |unit| Rating class and |Value| Rating class and |Value | | limiting features | | limiting features |_____________________|____|___________________|_____|___________________|_____ | | | | |AuhB: | | | | | Aura----------------| 90 |Very limited | |Very limited | | | Slow water |1.00 | Too acid |1.00 | | movement | | Slow water |0.51 | | Too acid |0.42 | movement | | | | | |AuhC: | | | | | Aura----------------| 90 |Very limited | |Very limited | | | Slow water |1.00 | Too acid |1.00 | | movement | | Too steep for |0.92 | | Slope |0.88 | surface | | | Too acid |0.42 | application | | | | | Slow water |0.51 | | | | movement | | | | | Too steep for |0.06 | | | | sprinkler | | | | | irrigation | | | | | |AupA: | | | | | Aura----------------| 85 |Very limited | |Somewhat limited | | | Slow water |1.00 | Too acid |0.21 | | movement | | Slow water |0.21 | | Too acid |0.77 | movement | | | | | Filtering |0.01 | | | | capacity | | | | | |AupB: | | | | | Aura----------------| 85 |Very limited | |Somewhat limited | | | Slow water |1.00 | Too acid |0.21 | | movement | | Slow water |0.21 | | Too acid |0.77 | movement | | | | | Filtering |0.01 | | | | capacity | | | | | |BEXAS: | | | | | Berryland, | | | | | occasionally | | | | | flooded------------| 50 |Very limited | |Very limited | | | Ponding |1.00 | Filtering |1.00 | | Depth to |1.00 | capacity | | | saturated zone | | Ponding |1.00 | | Flooding |0.60 | Depth to |1.00 | | Too acid |0.42 | saturated zone | | | | | Too acid |1.00 | | | | Flooding |0.60 | | | | | Mullica, | | | | | occasionally | | | | | flooded------------| 40 |Very limited | |Very limited | | | Ponding |1.00 | Filtering |1.00 | | Depth to |1.00 | capacity | | | saturated zone | | Ponding |1.00 | | Slow water |0.61 | Depth to |1.00 | | movement | | saturated zone | | | Flooding |0.60 | Too acid |1.00 | | Too acid |0.42 | Flooding |0.60 | | | | |
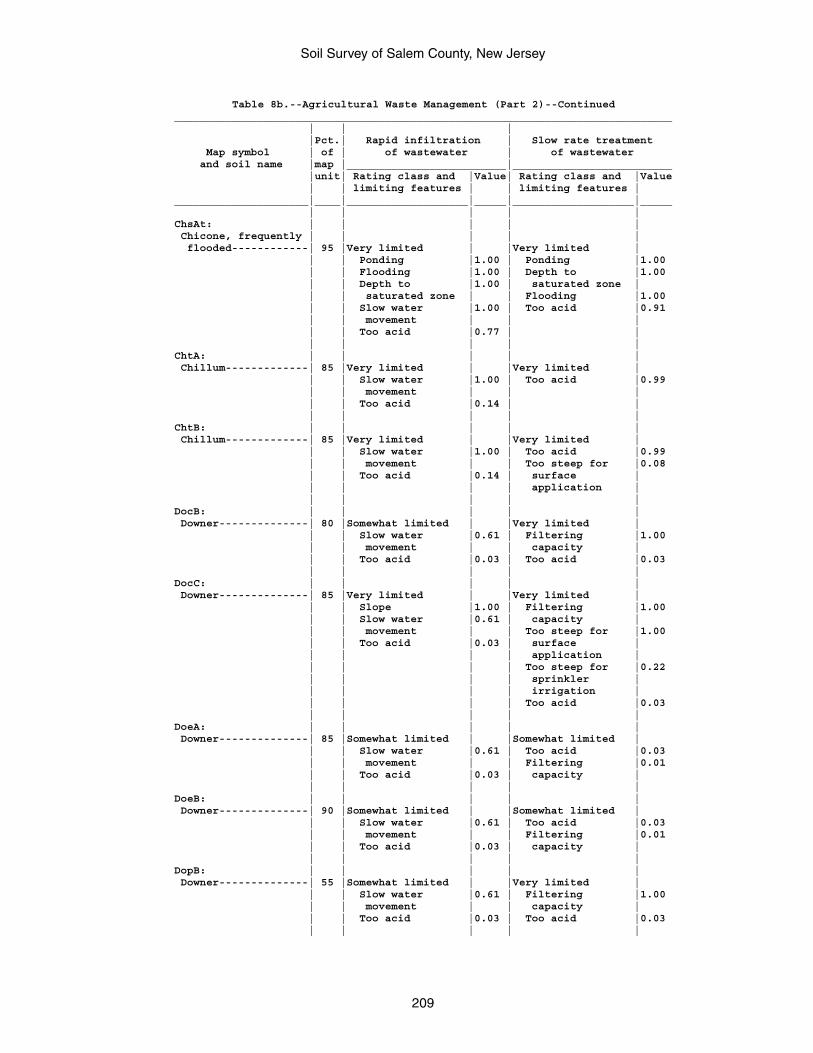
Soil Survey of Salem County, New Jersey
209
Table 8b.--Agricultural Waste Management (Part 2)--Continued______________________________________________________________________________ | | | |Pct.| Rapid infiltration | Slow rate treatment Map symbol | of | of wastewater | of wastewater and soil name |map |_________________________|_________________________ |unit| Rating class and |Value| Rating class and |Value | | limiting features | | limiting features |_____________________|____|___________________|_____|___________________|_____ | | | | |ChsAt: | | | | | Chicone, frequently | | | | | flooded------------| 95 |Very limited | |Very limited | | | Ponding |1.00 | Ponding |1.00 | | Flooding |1.00 | Depth to |1.00 | | Depth to |1.00 | saturated zone | | | saturated zone | | Flooding |1.00 | | Slow water |1.00 | Too acid |0.91 | | movement | | | | | Too acid |0.77 | | | | | | |ChtA: | | | | | Chillum-------------| 85 |Very limited | |Very limited | | | Slow water |1.00 | Too acid |0.99 | | movement | | | | | Too acid |0.14 | | | | | | |ChtB: | | | | | Chillum-------------| 85 |Very limited | |Very limited | | | Slow water |1.00 | Too acid |0.99 | | movement | | Too steep for |0.08 | | Too acid |0.14 | surface | | | | | application | | | | | |DocB: | | | | | Downer--------------| 80 |Somewhat limited | |Very limited | | | Slow water |0.61 | Filtering |1.00 | | movement | | capacity | | | Too acid |0.03 | Too acid |0.03 | | | | |DocC: | | | | | Downer--------------| 85 |Very limited | |Very limited | | | Slope |1.00 | Filtering |1.00 | | Slow water |0.61 | capacity | | | movement | | Too steep for |1.00 | | Too acid |0.03 | surface | | | | | application | | | | | Too steep for |0.22 | | | | sprinkler | | | | | irrigation | | | | | Too acid |0.03 | | | | |DoeA: | | | | | Downer--------------| 85 |Somewhat limited | |Somewhat limited | | | Slow water |0.61 | Too acid |0.03 | | movement | | Filtering |0.01 | | Too acid |0.03 | capacity | | | | | |DoeB: | | | | | Downer--------------| 90 |Somewhat limited | |Somewhat limited | | | Slow water |0.61 | Too acid |0.03 | | movement | | Filtering |0.01 | | Too acid |0.03 | capacity | | | | | |DopB: | | | | | Downer--------------| 55 |Somewhat limited | |Very limited | | | Slow water |0.61 | Filtering |1.00 | | movement | | capacity | | | Too acid |0.03 | Too acid |0.03 | | | | |
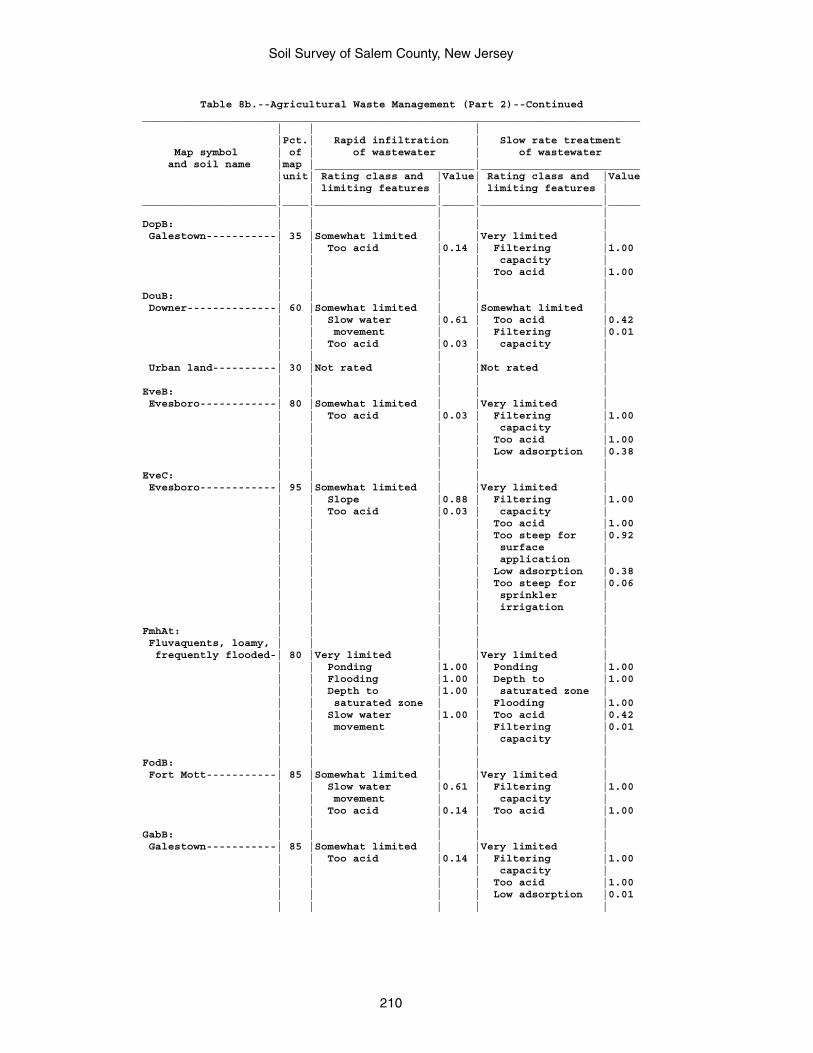
Soil Survey of Salem County, New Jersey
210
Table 8b.--Agricultural Waste Management (Part 2)--Continued______________________________________________________________________________ | | | |Pct.| Rapid infiltration | Slow rate treatment Map symbol | of | of wastewater | of wastewater and soil name |map |_________________________|_________________________ |unit| Rating class and |Value| Rating class and |Value | | limiting features | | limiting features |_____________________|____|___________________|_____|___________________|_____ | | | | |DopB: | | | | | Galestown-----------| 35 |Somewhat limited | |Very limited | | | Too acid |0.14 | Filtering |1.00 | | | | capacity | | | | | Too acid |1.00 | | | | |DouB: | | | | | Downer--------------| 60 |Somewhat limited | |Somewhat limited | | | Slow water |0.61 | Too acid |0.42 | | movement | | Filtering |0.01 | | Too acid |0.03 | capacity | | | | | | Urban land----------| 30 |Not rated | |Not rated | | | | | |EveB: | | | | | Evesboro------------| 80 |Somewhat limited | |Very limited | | | Too acid |0.03 | Filtering |1.00 | | | | capacity | | | | | Too acid |1.00 | | | | Low adsorption |0.38 | | | | |EveC: | | | | | Evesboro------------| 95 |Somewhat limited | |Very limited | | | Slope |0.88 | Filtering |1.00 | | Too acid |0.03 | capacity | | | | | Too acid |1.00 | | | | Too steep for |0.92 | | | | surface | | | | | application | | | | | Low adsorption |0.38 | | | | Too steep for |0.06 | | | | sprinkler | | | | | irrigation | | | | | |FmhAt: | | | | | Fluvaquents, loamy, | | | | | frequently flooded-| 80 |Very limited | |Very limited | | | Ponding |1.00 | Ponding |1.00 | | Flooding |1.00 | Depth to |1.00 | | Depth to |1.00 | saturated zone | | | saturated zone | | Flooding |1.00 | | Slow water |1.00 | Too acid |0.42 | | movement | | Filtering |0.01 | | | | capacity | | | | | |FodB: | | | | | Fort Mott-----------| 85 |Somewhat limited | |Very limited | | | Slow water |0.61 | Filtering |1.00 | | movement | | capacity | | | Too acid |0.14 | Too acid |1.00 | | | | |GabB: | | | | | Galestown-----------| 85 |Somewhat limited | |Very limited | | | Too acid |0.14 | Filtering |1.00 | | | | capacity | | | | | Too acid |1.00 | | | | Low adsorption |0.01 | | | | |
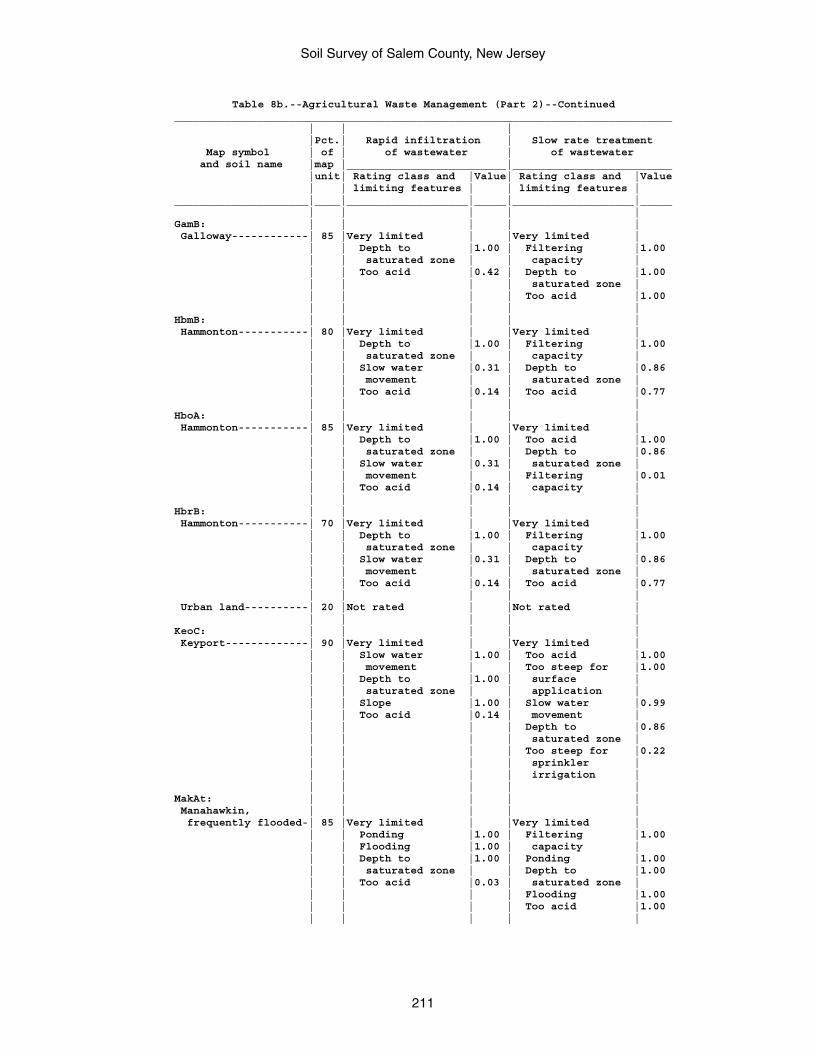
Soil Survey of Salem County, New Jersey
211
Table 8b.--Agricultural Waste Management (Part 2)--Continued______________________________________________________________________________ | | | |Pct.| Rapid infiltration | Slow rate treatment Map symbol | of | of wastewater | of wastewater and soil name |map |_________________________|_________________________ |unit| Rating class and |Value| Rating class and |Value | | limiting features | | limiting features |_____________________|____|___________________|_____|___________________|_____ | | | | |GamB: | | | | | Galloway------------| 85 |Very limited | |Very limited | | | Depth to |1.00 | Filtering |1.00 | | saturated zone | | capacity | | | Too acid |0.42 | Depth to |1.00 | | | | saturated zone | | | | | Too acid |1.00 | | | | |HbmB: | | | | | Hammonton-----------| 80 |Very limited | |Very limited | | | Depth to |1.00 | Filtering |1.00 | | saturated zone | | capacity | | | Slow water |0.31 | Depth to |0.86 | | movement | | saturated zone | | | Too acid |0.14 | Too acid |0.77 | | | | |HboA: | | | | | Hammonton-----------| 85 |Very limited | |Very limited | | | Depth to |1.00 | Too acid |1.00 | | saturated zone | | Depth to |0.86 | | Slow water |0.31 | saturated zone | | | movement | | Filtering |0.01 | | Too acid |0.14 | capacity | | | | | |HbrB: | | | | | Hammonton-----------| 70 |Very limited | |Very limited | | | Depth to |1.00 | Filtering |1.00 | | saturated zone | | capacity | | | Slow water |0.31 | Depth to |0.86 | | movement | | saturated zone | | | Too acid |0.14 | Too acid |0.77 | | | | | Urban land----------| 20 |Not rated | |Not rated | | | | | |KeoC: | | | | | Keyport-------------| 90 |Very limited | |Very limited | | | Slow water |1.00 | Too acid |1.00 | | movement | | Too steep for |1.00 | | Depth to |1.00 | surface | | | saturated zone | | application | | | Slope |1.00 | Slow water |0.99 | | Too acid |0.14 | movement | | | | | Depth to |0.86 | | | | saturated zone | | | | | Too steep for |0.22 | | | | sprinkler | | | | | irrigation | | | | | |MakAt: | | | | | Manahawkin, | | | | | frequently flooded-| 85 |Very limited | |Very limited | | | Ponding |1.00 | Filtering |1.00 | | Flooding |1.00 | capacity | | | Depth to |1.00 | Ponding |1.00 | | saturated zone | | Depth to |1.00 | | Too acid |0.03 | saturated zone | | | | | Flooding |1.00 | | | | Too acid |1.00 | | | | |
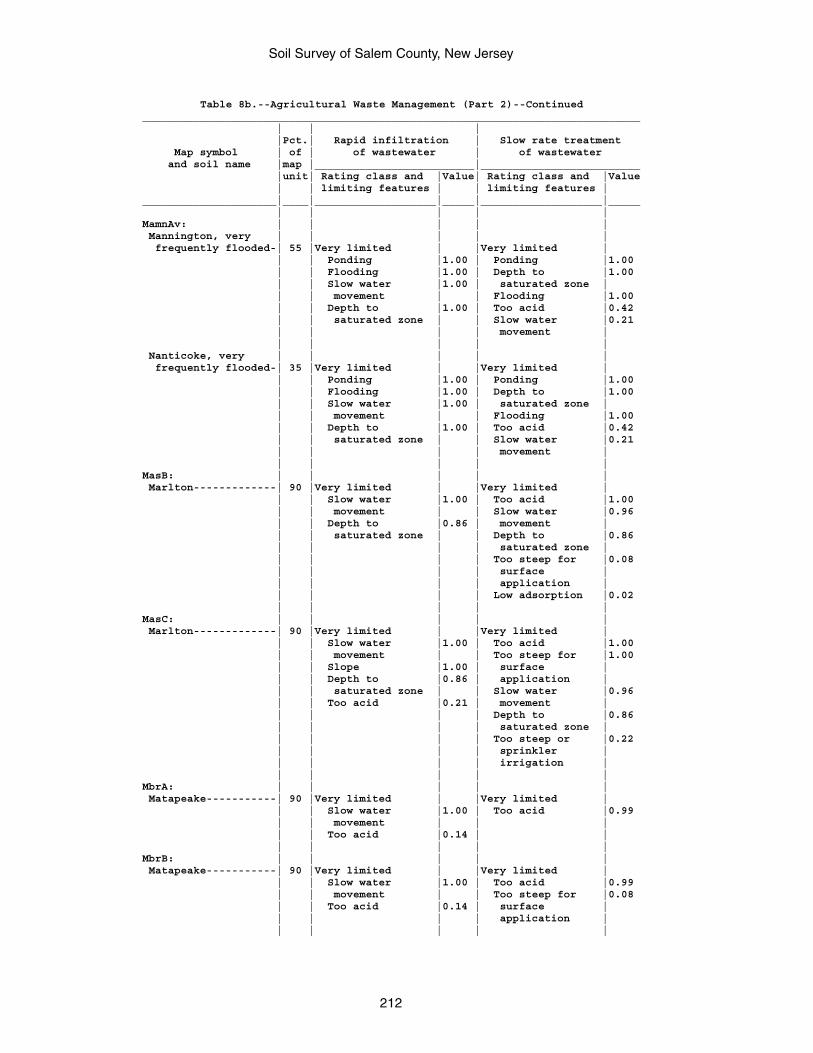
Soil Survey of Salem County, New Jersey
212
Table 8b.--Agricultural Waste Management (Part 2)--Continued______________________________________________________________________________ | | | |Pct.| Rapid infiltration | Slow rate treatment Map symbol | of | of wastewater | of wastewater and soil name |map |_________________________|_________________________ |unit| Rating class and |Value| Rating class and |Value | | limiting features | | limiting features |_____________________|____|___________________|_____|___________________|_____ | | | | |MamnAv: | | | | | Mannington, very | | | | | frequently flooded-| 55 |Very limited | |Very limited | | | Ponding |1.00 | Ponding |1.00 | | Flooding |1.00 | Depth to |1.00 | | Slow water |1.00 | saturated zone | | | movement | | Flooding |1.00 | | Depth to |1.00 | Too acid |0.42 | | saturated zone | | Slow water |0.21 | | | | movement | | | | | | Nanticoke, very | | | | | frequently flooded-| 35 |Very limited | |Very limited | | | Ponding |1.00 | Ponding |1.00 | | Flooding |1.00 | Depth to |1.00 | | Slow water |1.00 | saturated zone | | | movement | | Flooding |1.00 | | Depth to |1.00 | Too acid |0.42 | | saturated zone | | Slow water |0.21 | | | | movement | | | | | |MasB: | | | | | Marlton-------------| 90 |Very limited | |Very limited | | | Slow water |1.00 | Too acid |1.00 | | movement | | Slow water |0.96 | | Depth to |0.86 | movement | | | saturated zone | | Depth to |0.86 | | | | saturated zone | | | | | Too steep for |0.08 | | | | surface | | | | | application | | | | | Low adsorption |0.02 | | | | |MasC: | | | | | Marlton-------------| 90 |Very limited | |Very limited | | | Slow water |1.00 | Too acid |1.00 | | movement | | Too steep for |1.00 | | Slope |1.00 | surface | | | Depth to |0.86 | application | | | saturated zone | | Slow water |0.96 | | Too acid |0.21 | movement | | | | | Depth to |0.86 | | | | saturated zone | | | | | Too steep or |0.22 | | | | sprinkler | | | | | irrigation | | | | | |MbrA: | | | | | Matapeake-----------| 90 |Very limited | |Very limited | | | Slow water |1.00 | Too acid |0.99 | | movement | | | | | Too acid |0.14 | | | | | | |MbrB: | | | | | Matapeake-----------| 90 |Very limited | |Very limited | | | Slow water |1.00 | Too acid |0.99 | | movement | | Too steep for |0.08 | | Too acid |0.14 | surface | | | | | application | | | | | |
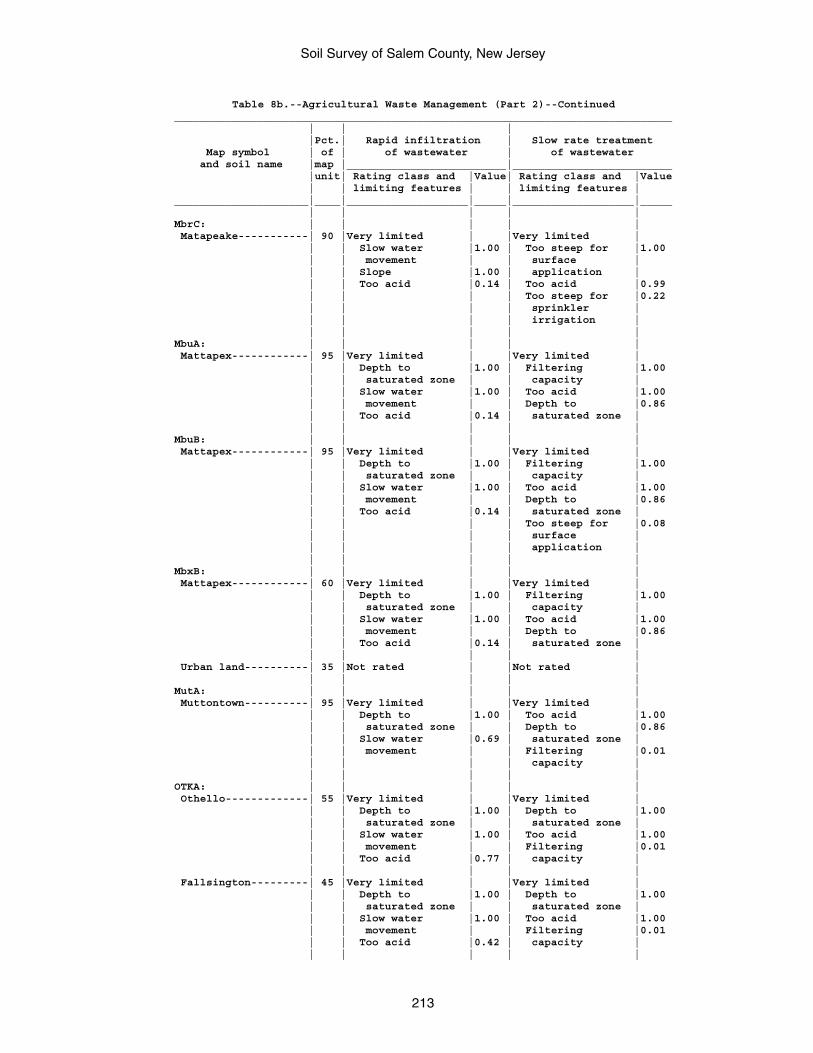
Soil Survey of Salem County, New Jersey
213
Table 8b.--Agricultural Waste Management (Part 2)--Continued______________________________________________________________________________ | | | |Pct.| Rapid infiltration | Slow rate treatment Map symbol | of | of wastewater | of wastewater and soil name |map |_________________________|_________________________ |unit| Rating class and |Value| Rating class and |Value | | limiting features | | limiting features |_____________________|____|___________________|_____|___________________|_____ | | | | |MbrC: | | | | | Matapeake-----------| 90 |Very limited | |Very limited | | | Slow water |1.00 | Too steep for |1.00 | | movement | | surface | | | Slope |1.00 | application | | | Too acid |0.14 | Too acid |0.99 | | | | Too steep for |0.22 | | | | sprinkler | | | | | irrigation | | | | | |MbuA: | | | | | Mattapex------------| 95 |Very limited | |Very limited | | | Depth to |1.00 | Filtering |1.00 | | saturated zone | | capacity | | | Slow water |1.00 | Too acid |1.00 | | movement | | Depth to |0.86 | | Too acid |0.14 | saturated zone | | | | | |MbuB: | | | | | Mattapex------------| 95 |Very limited | |Very limited | | | Depth to |1.00 | Filtering |1.00 | | saturated zone | | capacity | | | Slow water |1.00 | Too acid |1.00 | | movement | | Depth to |0.86 | | Too acid |0.14 | saturated zone | | | | | Too steep for |0.08 | | | | surface | | | | | application | | | | | |MbxB: | | | | | Mattapex------------| 60 |Very limited | |Very limited | | | Depth to |1.00 | Filtering |1.00 | | saturated zone | | capacity | | | Slow water |1.00 | Too acid |1.00 | | movement | | Depth to |0.86 | | Too acid |0.14 | saturated zone | | | | | | Urban land----------| 35 |Not rated | |Not rated | | | | | |MutA: | | | | | Muttontown----------| 95 |Very limited | |Very limited | | | Depth to |1.00 | Too acid |1.00 | | saturated zone | | Depth to |0.86 | | Slow water |0.69 | saturated zone | | | movement | | Filtering |0.01 | | | | capacity | | | | | |OTKA: | | | | | Othello-------------| 55 |Very limited | |Very limited | | | Depth to |1.00 | Depth to |1.00 | | saturated zone | | saturated zone | | | Slow water |1.00 | Too acid |1.00 | | movement | | Filtering |0.01 | | Too acid |0.77 | capacity | | | | | | Fallsington---------| 45 |Very limited | |Very limited | | | Depth to |1.00 | Depth to |1.00 | | saturated zone | | saturated zone | | | Slow water |1.00 | Too acid |1.00 | | movement | | Filtering |0.01 | | Too acid |0.42 | capacity | | | | | |
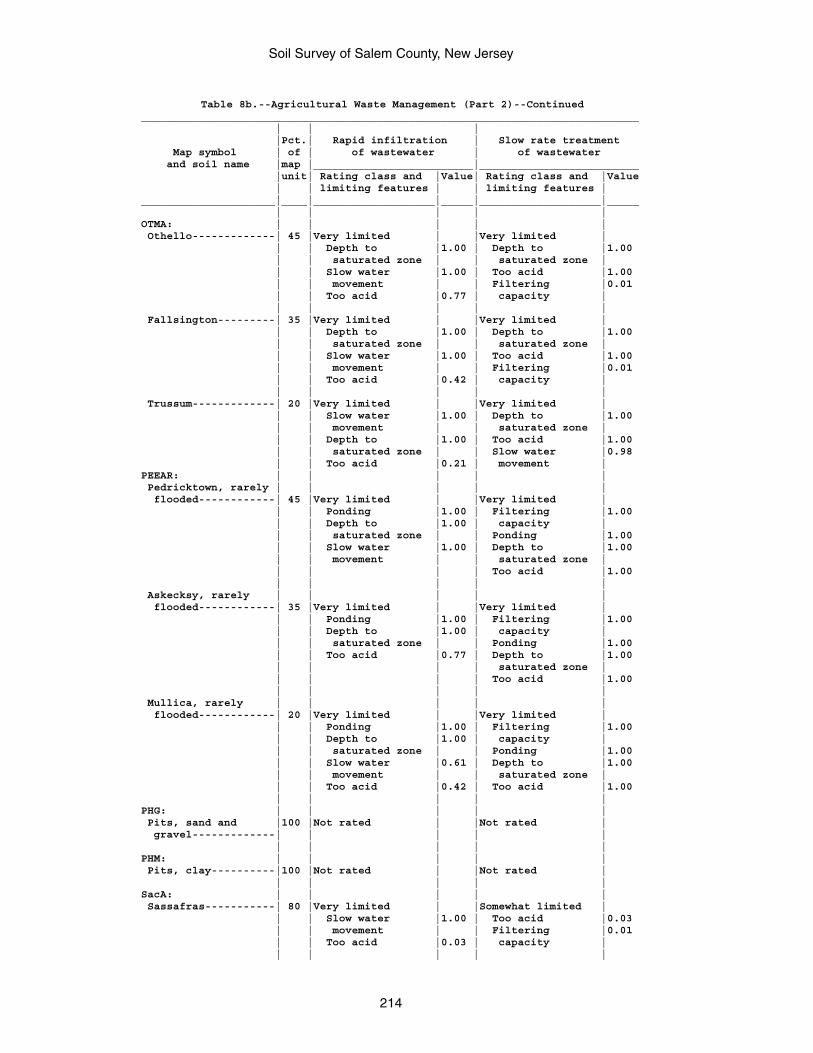
Soil Survey of Salem County, New Jersey
214
Table 8b.--Agricultural Waste Management (Part 2)--Continued______________________________________________________________________________ | | | |Pct.| Rapid infiltration | Slow rate treatment Map symbol | of | of wastewater | of wastewater and soil name |map |_________________________|_________________________ |unit| Rating class and |Value| Rating class and |Value | | limiting features | | limiting features |_____________________|____|___________________|_____|___________________|_____ | | | | |OTMA: | | | | | Othello-------------| 45 |Very limited | |Very limited | | | Depth to |1.00 | Depth to |1.00 | | saturated zone | | saturated zone | | | Slow water |1.00 | Too acid |1.00 | | movement | | Filtering |0.01 | | Too acid |0.77 | capacity | | | | | | Fallsington---------| 35 |Very limited | |Very limited | | | Depth to |1.00 | Depth to |1.00 | | saturated zone | | saturated zone | | | Slow water |1.00 | Too acid |1.00 | | movement | | Filtering |0.01 | | Too acid |0.42 | capacity | | | | | | Trussum-------------| 20 |Very limited | |Very limited | | | Slow water |1.00 | Depth to |1.00 | | movement | | saturated zone | | | Depth to |1.00 | Too acid |1.00 | | saturated zone | | Slow water |0.98 | | Too acid |0.21 | movement |PEEAR: | | | | | Pedricktown, rarely | | | | | flooded------------| 45 |Very limited | |Very limited | | | Ponding |1.00 | Filtering |1.00 | | Depth to |1.00 | capacity | | | saturated zone | | Ponding |1.00 | | Slow water |1.00 | Depth to |1.00 | | movement | | saturated zone | | | | | Too acid |1.00 | | | | | Askecksy, rarely | | | | | flooded------------| 35 |Very limited | |Very limited | | | Ponding |1.00 | Filtering |1.00 | | Depth to |1.00 | capacity | | | saturated zone | | Ponding |1.00 | | Too acid |0.77 | Depth to |1.00 | | | | saturated zone | | | | | Too acid |1.00 | | | | | Mullica, rarely | | | | | flooded------------| 20 |Very limited | |Very limited | | | Ponding |1.00 | Filtering |1.00 | | Depth to |1.00 | capacity | | | saturated zone | | Ponding |1.00 | | Slow water |0.61 | Depth to |1.00 | | movement | | saturated zone | | | Too acid |0.42 | Too acid |1.00 | | | | |PHG: | | | | | Pits, sand and |100 |Not rated | |Not rated | gravel-------------| | | | | | | | | |PHM: | | | | | Pits, clay----------|100 |Not rated | |Not rated | | | | | |SacA: | | | | | Sassafras-----------| 80 |Very limited | |Somewhat limited | | | Slow water |1.00 | Too acid |0.03 | | movement | | Filtering |0.01 | | Too acid |0.03 | capacity | | | | | |
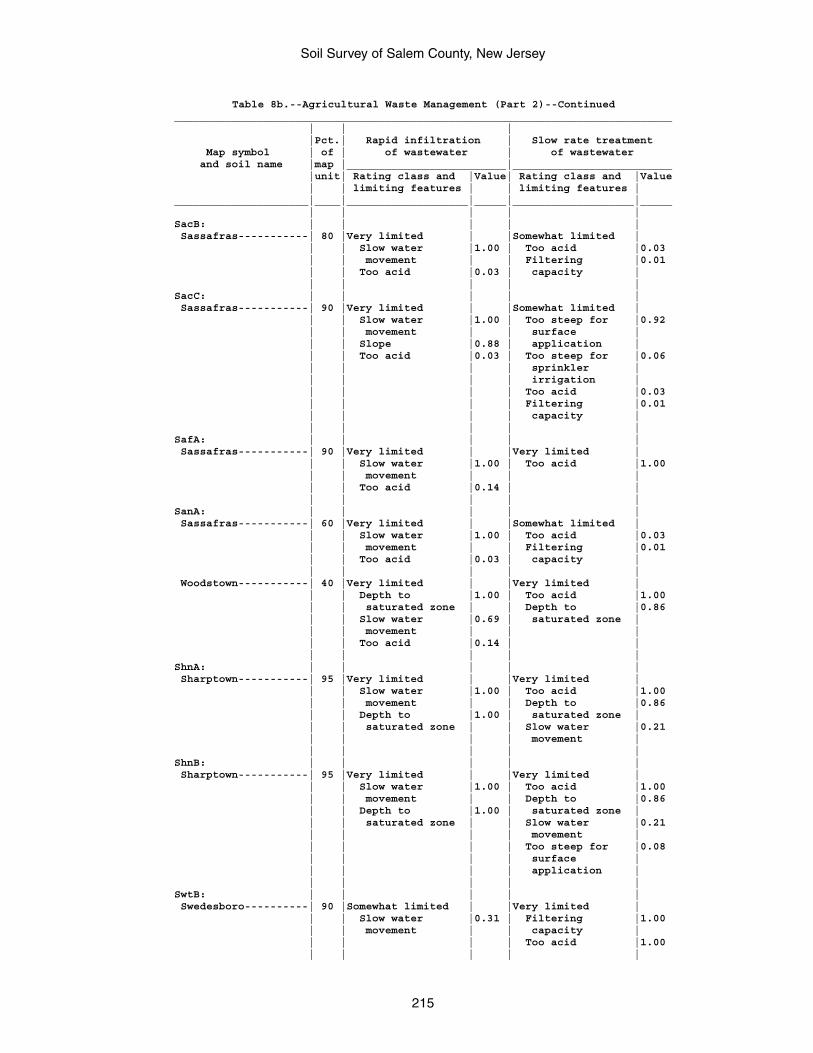
Soil Survey of Salem County, New Jersey
215
Table 8b.--Agricultural Waste Management (Part 2)--Continued______________________________________________________________________________ | | | |Pct.| Rapid infiltration | Slow rate treatment Map symbol | of | of wastewater | of wastewater and soil name |map |_________________________|_________________________ |unit| Rating class and |Value| Rating class and |Value | | limiting features | | limiting features |_____________________|____|___________________|_____|___________________|_____ | | | | |SacB: | | | | | Sassafras-----------| 80 |Very limited | |Somewhat limited | | | Slow water |1.00 | Too acid |0.03 | | movement | | Filtering |0.01 | | Too acid |0.03 | capacity | | | | | |SacC: | | | | | Sassafras-----------| 90 |Very limited | |Somewhat limited | | | Slow water |1.00 | Too steep for |0.92 | | movement | | surface | | | Slope |0.88 | application | | | Too acid |0.03 | Too steep for |0.06 | | | | sprinkler | | | | | irrigation | | | | | Too acid |0.03 | | | | Filtering |0.01 | | | | capacity | | | | | |SafA: | | | | | Sassafras-----------| 90 |Very limited | |Very limited | | | Slow water |1.00 | Too acid |1.00 | | movement | | | | | Too acid |0.14 | | | | | | |SanA: | | | | | Sassafras-----------| 60 |Very limited | |Somewhat limited | | | Slow water |1.00 | Too acid |0.03 | | movement | | Filtering |0.01 | | Too acid |0.03 | capacity | | | | | | Woodstown-----------| 40 |Very limited | |Very limited | | | Depth to |1.00 | Too acid |1.00 | | saturated zone | | Depth to |0.86 | | Slow water |0.69 | saturated zone | | | movement | | | | | Too acid |0.14 | | | | | | |ShnA: | | | | | Sharptown-----------| 95 |Very limited | |Very limited | | | Slow water |1.00 | Too acid |1.00 | | movement | | Depth to |0.86 | | Depth to |1.00 | saturated zone | | | saturated zone | | Slow water |0.21 | | | | movement | | | | | |ShnB: | | | | | Sharptown-----------| 95 |Very limited | |Very limited | | | Slow water |1.00 | Too acid |1.00 | | movement | | Depth to |0.86 | | Depth to |1.00 | saturated zone | | | saturated zone | | Slow water |0.21 | | | | movement | | | | | Too steep for |0.08 | | | | surface | | | | | application | | | | | |SwtB: | | | | | Swedesboro----------| 90 |Somewhat limited | |Very limited | | | Slow water |0.31 | Filtering |1.00 | | movement | | capacity | | | | | Too acid |1.00 | | | | |
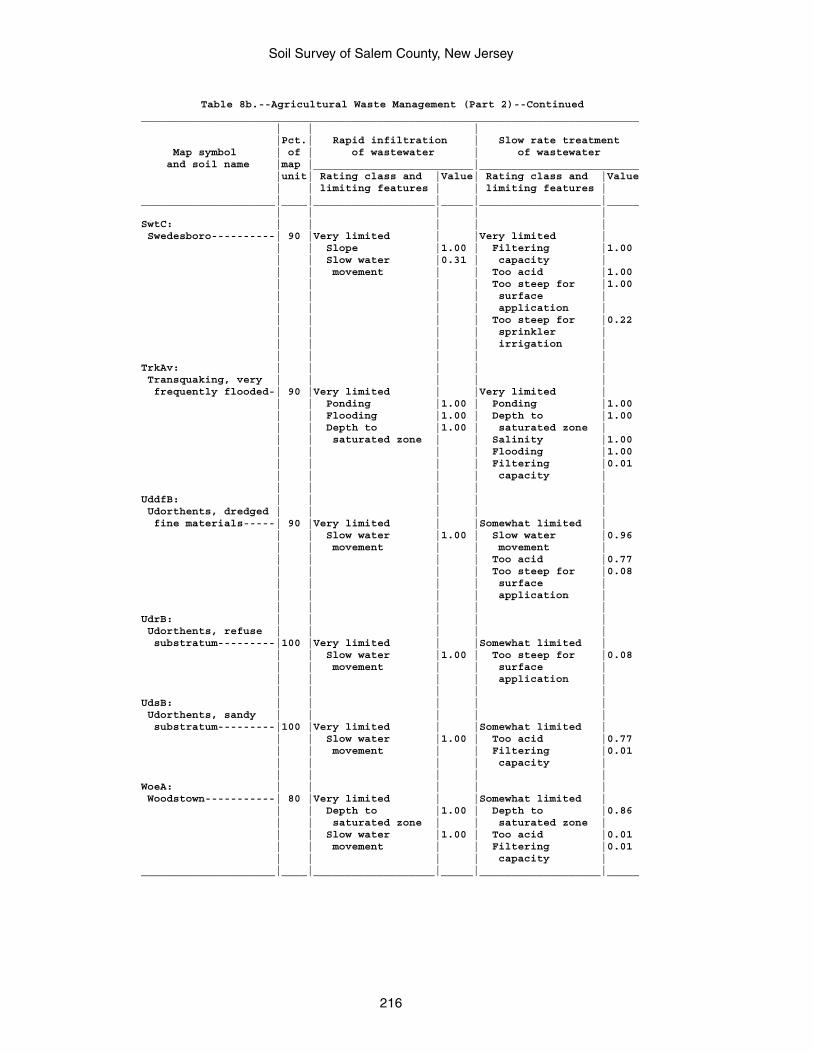
Soil Survey of Salem County, New Jersey
216
Table 8b.--Agricultural Waste Management (Part 2)--Continued______________________________________________________________________________ | | | |Pct.| Rapid infiltration | Slow rate treatment Map symbol | of | of wastewater | of wastewater and soil name |map |_________________________|_________________________ |unit| Rating class and |Value| Rating class and |Value | | limiting features | | limiting features |_____________________|____|___________________|_____|___________________|_____ | | | | |SwtC: | | | | | Swedesboro----------| 90 |Very limited | |Very limited | | | Slope |1.00 | Filtering |1.00 | | Slow water |0.31 | capacity | | | movement | | Too acid |1.00 | | | | Too steep for |1.00 | | | | surface | | | | | application | | | | | Too steep for |0.22 | | | | sprinkler | | | | | irrigation | | | | | |TrkAv: | | | | | Transquaking, very | | | | | frequently flooded-| 90 |Very limited | |Very limited | | | Ponding |1.00 | Ponding |1.00 | | Flooding |1.00 | Depth to |1.00 | | Depth to |1.00 | saturated zone | | | saturated zone | | Salinity |1.00 | | | | Flooding |1.00 | | | | Filtering |0.01 | | | | capacity | | | | | |UddfB: | | | | | Udorthents, dredged | | | | | fine materials-----| 90 |Very limited | |Somewhat limited | | | Slow water |1.00 | Slow water |0.96 | | movement | | movement | | | | | Too acid |0.77 | | | | Too steep for |0.08 | | | | surface | | | | | application | | | | | |UdrB: | | | | | Udorthents, refuse | | | | | substratum---------|100 |Very limited | |Somewhat limited | | | Slow water |1.00 | Too steep for |0.08 | | movement | | surface | | | | | application | | | | | |UdsB: | | | | | Udorthents, sandy | | | | | substratum---------|100 |Very limited | |Somewhat limited | | | Slow water |1.00 | Too acid |0.77 | | movement | | Filtering |0.01 | | | | capacity | | | | | |WoeA: | | | | | Woodstown-----------| 80 |Very limited | |Somewhat limited | | | Depth to |1.00 | Depth to |0.86 | | saturated zone | | saturated zone | | | Slow water |1.00 | Too acid |0.01 | | movement | | Filtering |0.01 | | | | capacity |_____________________|____|___________________|_____|___________________|_____
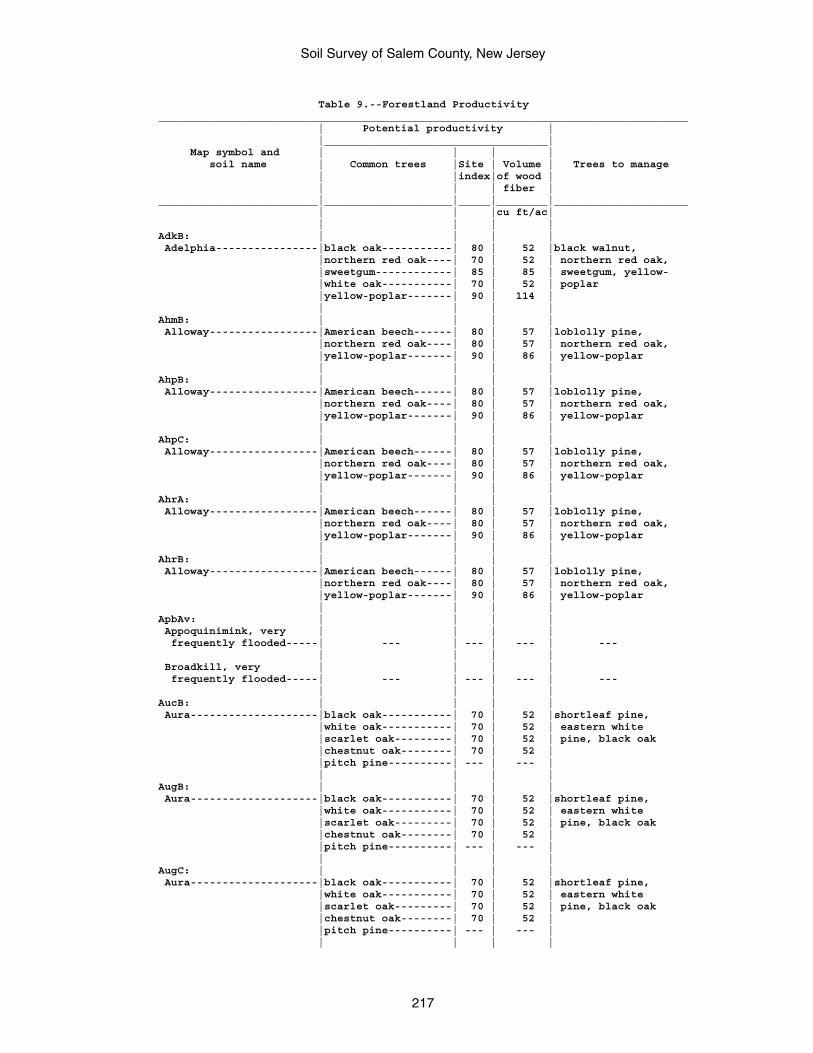
Soil Survey of Salem County, New Jersey
217
Table 9.--Forestland Productivity___________________________________________________________________________________ | Potential productivity | |___________________________________| Map symbol and | | | | soil name | Common trees |Site | Volume | Trees to manage | |index|of wood | | | | fiber |_________________________|____________________|_____|________|_____________________ | | |cu ft/ac| | | | |AdkB: | | | | Adelphia----------------|black oak-----------| 80 | 52 |black walnut, |northern red oak----| 70 | 52 | northern red oak, |sweetgum------------| 85 | 85 | sweetgum, yellow- |white oak-----------| 70 | 52 | poplar |yellow-poplar-------| 90 | 114 | | | | |AhmB: | | | | Alloway-----------------|American beech------| 80 | 57 |loblolly pine, |northern red oak----| 80 | 57 | northern red oak, |yellow-poplar-------| 90 | 86 | yellow-poplar | | | |AhpB: | | | | Alloway-----------------|American beech------| 80 | 57 |loblolly pine, |northern red oak----| 80 | 57 | northern red oak, |yellow-poplar-------| 90 | 86 | yellow-poplar | | | |AhpC: | | | | Alloway-----------------|American beech------| 80 | 57 |loblolly pine, |northern red oak----| 80 | 57 | northern red oak, |yellow-poplar-------| 90 | 86 | yellow-poplar | | | |AhrA: | | | | Alloway-----------------|American beech------| 80 | 57 |loblolly pine, |northern red oak----| 80 | 57 | northern red oak, |yellow-poplar-------| 90 | 86 | yellow-poplar | | | |AhrB: | | | | Alloway-----------------|American beech------| 80 | 57 |loblolly pine, |northern red oak----| 80 | 57 | northern red oak, |yellow-poplar-------| 90 | 86 | yellow-poplar | | | |ApbAv: | | | | Appoquinimink, very | | | | frequently flooded-----| --- | --- | --- | --- | | | | Broadkill, very | | | | frequently flooded-----| --- | --- | --- | --- | | | |AucB: | | | | Aura--------------------|black oak-----------| 70 | 52 |shortleaf pine, |white oak-----------| 70 | 52 | eastern white |scarlet oak---------| 70 | 52 | pine, black oak |chestnut oak--------| 70 | 52 | |pitch pine----------| --- | --- | | | | |AugB: | | | | Aura--------------------|black oak-----------| 70 | 52 |shortleaf pine, |white oak-----------| 70 | 52 | eastern white |scarlet oak---------| 70 | 52 | pine, black oak |chestnut oak--------| 70 | 52 | |pitch pine----------| --- | --- | | | | |AugC: | | | | Aura--------------------|black oak-----------| 70 | 52 |shortleaf pine, |white oak-----------| 70 | 52 | eastern white |scarlet oak---------| 70 | 52 | pine, black oak |chestnut oak--------| 70 | 52 | |pitch pine----------| --- | --- | | | | |
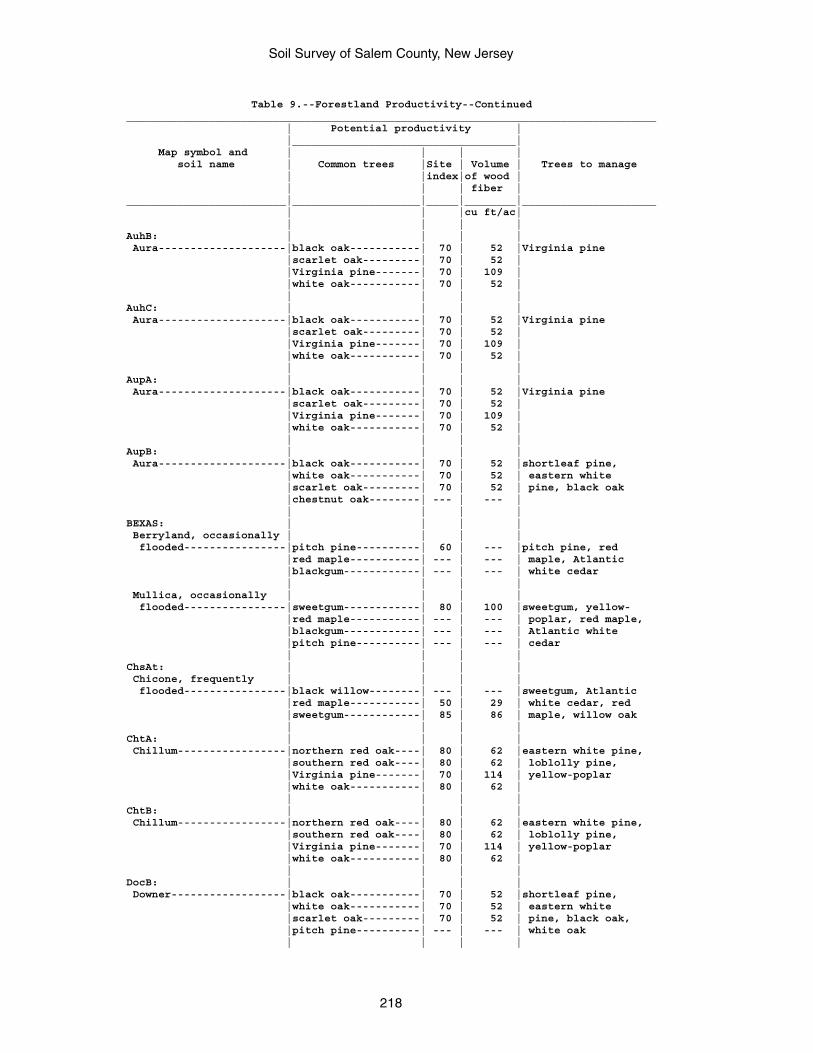
Soil Survey of Salem County, New Jersey
218
Table 9.--Forestland Productivity--Continued___________________________________________________________________________________ | Potential productivity | |___________________________________| Map symbol and | | | | soil name | Common trees |Site | Volume | Trees to manage | |index|of wood | | | | fiber |_________________________|____________________|_____|________|_____________________ | | |cu ft/ac| | | | |AuhB: | | | | Aura--------------------|black oak-----------| 70 | 52 |Virginia pine |scarlet oak---------| 70 | 52 | |Virginia pine-------| 70 | 109 | |white oak-----------| 70 | 52 | | | | |AuhC: | | | | Aura--------------------|black oak-----------| 70 | 52 |Virginia pine |scarlet oak---------| 70 | 52 | |Virginia pine-------| 70 | 109 | |white oak-----------| 70 | 52 | | | | |AupA: | | | | Aura--------------------|black oak-----------| 70 | 52 |Virginia pine |scarlet oak---------| 70 | 52 | |Virginia pine-------| 70 | 109 | |white oak-----------| 70 | 52 | | | | |AupB: | | | | Aura--------------------|black oak-----------| 70 | 52 |shortleaf pine, |white oak-----------| 70 | 52 | eastern white |scarlet oak---------| 70 | 52 | pine, black oak |chestnut oak--------| --- | --- | | | | |BEXAS: | | | | Berryland, occasionally | | | | flooded----------------|pitch pine----------| 60 | --- |pitch pine, red |red maple-----------| --- | --- | maple, Atlantic |blackgum------------| --- | --- | white cedar | | | | Mullica, occasionally | | | | flooded----------------|sweetgum------------| 80 | 100 |sweetgum, yellow- |red maple-----------| --- | --- | poplar, red maple, |blackgum------------| --- | --- | Atlantic white |pitch pine----------| --- | --- | cedar | | | |ChsAt: | | | | Chicone, frequently | | | | flooded----------------|black willow--------| --- | --- |sweetgum, Atlantic |red maple-----------| 50 | 29 | white cedar, red |sweetgum------------| 85 | 86 | maple, willow oak | | | |ChtA: | | | | Chillum-----------------|northern red oak----| 80 | 62 |eastern white pine, |southern red oak----| 80 | 62 | loblolly pine, |Virginia pine-------| 70 | 114 | yellow-poplar |white oak-----------| 80 | 62 | | | | |ChtB: | | | | Chillum-----------------|northern red oak----| 80 | 62 |eastern white pine, |southern red oak----| 80 | 62 | loblolly pine, |Virginia pine-------| 70 | 114 | yellow-poplar |white oak-----------| 80 | 62 | | | | |DocB: | | | | Downer------------------|black oak-----------| 70 | 52 |shortleaf pine, |white oak-----------| 70 | 52 | eastern white |scarlet oak---------| 70 | 52 | pine, black oak, |pitch pine----------| --- | --- | white oak | | | |
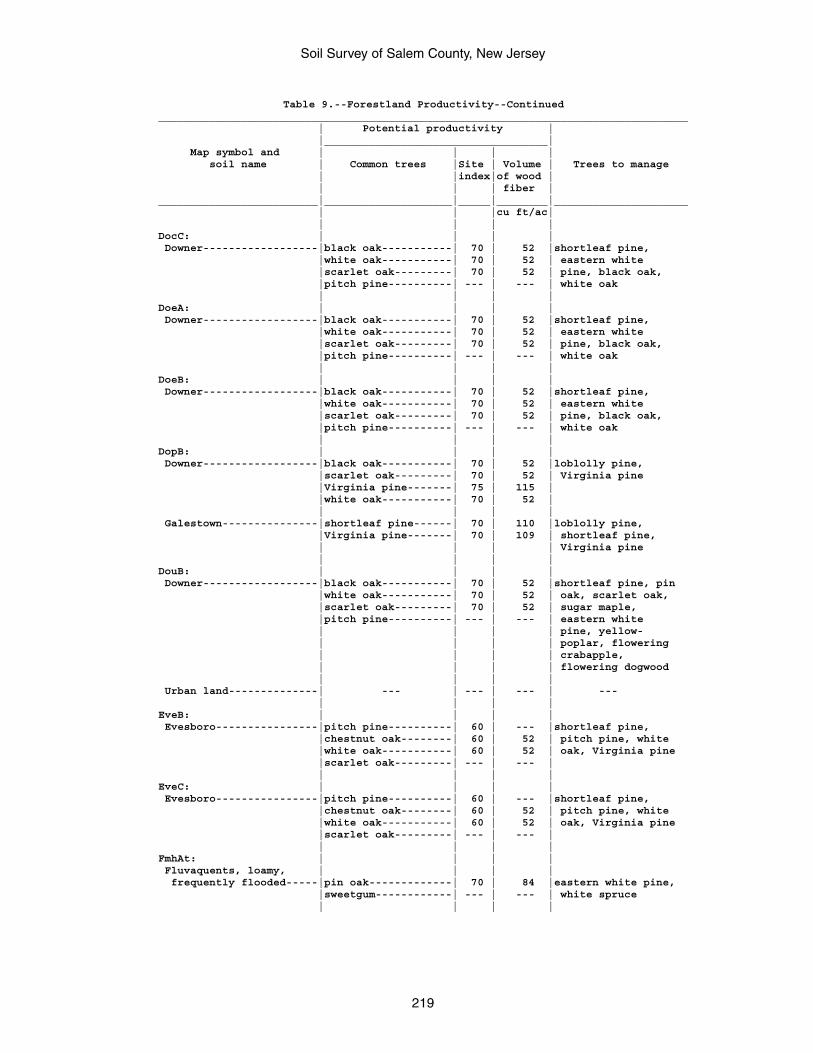
Soil Survey of Salem County, New Jersey
219
Table 9.--Forestland Productivity--Continued___________________________________________________________________________________ | Potential productivity | |___________________________________| Map symbol and | | | | soil name | Common trees |Site | Volume | Trees to manage | |index|of wood | | | | fiber |_________________________|____________________|_____|________|_____________________ | | |cu ft/ac| | | | |DocC: | | | | Downer------------------|black oak-----------| 70 | 52 |shortleaf pine, |white oak-----------| 70 | 52 | eastern white |scarlet oak---------| 70 | 52 | pine, black oak, |pitch pine----------| --- | --- | white oak | | | |DoeA: | | | | Downer------------------|black oak-----------| 70 | 52 |shortleaf pine, |white oak-----------| 70 | 52 | eastern white |scarlet oak---------| 70 | 52 | pine, black oak, |pitch pine----------| --- | --- | white oak | | | |DoeB: | | | | Downer------------------|black oak-----------| 70 | 52 |shortleaf pine, |white oak-----------| 70 | 52 | eastern white |scarlet oak---------| 70 | 52 | pine, black oak, |pitch pine----------| --- | --- | white oak | | | |DopB: | | | | Downer------------------|black oak-----------| 70 | 52 |loblolly pine, |scarlet oak---------| 70 | 52 | Virginia pine |Virginia pine-------| 75 | 115 | |white oak-----------| 70 | 52 | | | | | Galestown---------------|shortleaf pine------| 70 | 110 |loblolly pine, |Virginia pine-------| 70 | 109 | shortleaf pine, | | | | Virginia pine | | | |DouB: | | | | Downer------------------|black oak-----------| 70 | 52 |shortleaf pine, pin |white oak-----------| 70 | 52 | oak, scarlet oak, |scarlet oak---------| 70 | 52 | sugar maple, |pitch pine----------| --- | --- | eastern white | | | | pine, yellow- | | | | poplar, flowering | | | | crabapple, | | | | flowering dogwood | | | | Urban land--------------| --- | --- | --- | --- | | | |EveB: | | | | Evesboro----------------|pitch pine----------| 60 | --- |shortleaf pine, |chestnut oak--------| 60 | 52 | pitch pine, white |white oak-----------| 60 | 52 | oak, Virginia pine |scarlet oak---------| --- | --- | | | | |EveC: | | | | Evesboro----------------|pitch pine----------| 60 | --- |shortleaf pine, |chestnut oak--------| 60 | 52 | pitch pine, white |white oak-----------| 60 | 52 | oak, Virginia pine |scarlet oak---------| --- | --- | | | | |FmhAt: | | | | Fluvaquents, loamy, | | | | frequently flooded-----|pin oak-------------| 70 | 84 |eastern white pine, |sweetgum------------| --- | --- | white spruce | | | |
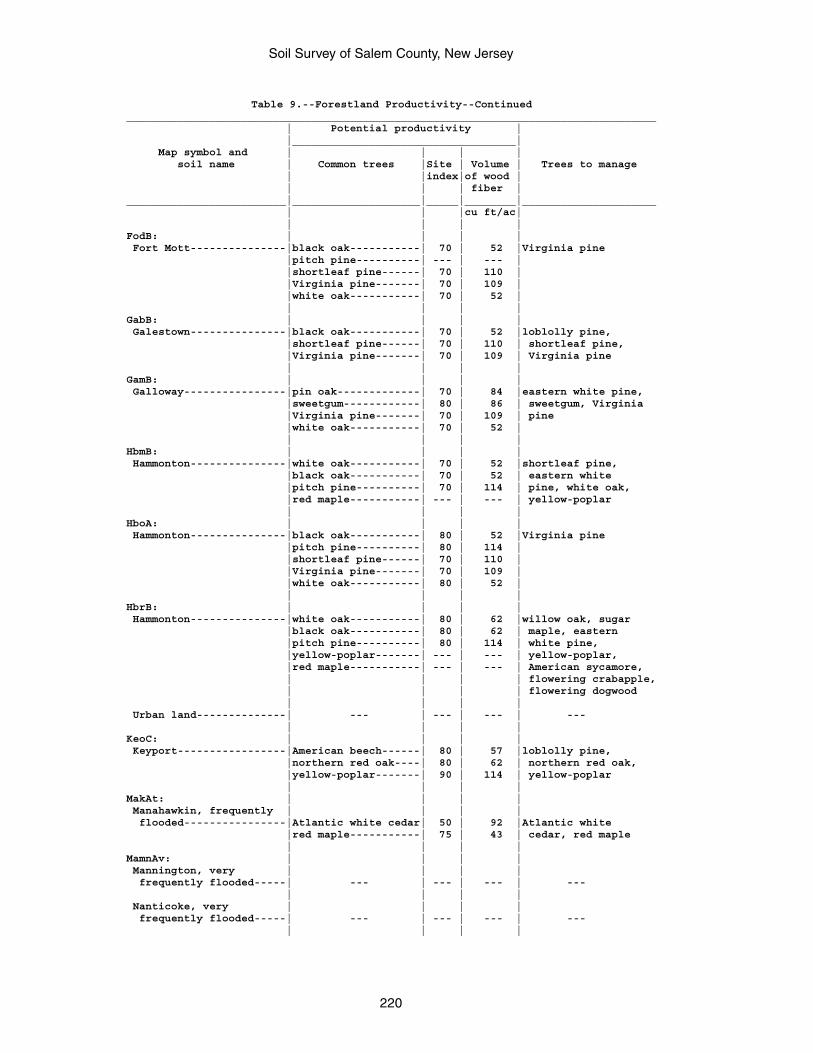
Soil Survey of Salem County, New Jersey
220
Table 9.--Forestland Productivity--Continued___________________________________________________________________________________ | Potential productivity | |___________________________________| Map symbol and | | | | soil name | Common trees |Site | Volume | Trees to manage | |index|of wood | | | | fiber |_________________________|____________________|_____|________|_____________________ | | |cu ft/ac| | | | |FodB: | | | | Fort Mott---------------|black oak-----------| 70 | 52 |Virginia pine |pitch pine----------| --- | --- | |shortleaf pine------| 70 | 110 | |Virginia pine-------| 70 | 109 | |white oak-----------| 70 | 52 | | | | |GabB: | | | | Galestown---------------|black oak-----------| 70 | 52 |loblolly pine, |shortleaf pine------| 70 | 110 | shortleaf pine, |Virginia pine-------| 70 | 109 | Virginia pine | | | |GamB: | | | | Galloway----------------|pin oak-------------| 70 | 84 |eastern white pine, |sweetgum------------| 80 | 86 | sweetgum, Virginia |Virginia pine-------| 70 | 109 | pine |white oak-----------| 70 | 52 | | | | |HbmB: | | | | Hammonton---------------|white oak-----------| 70 | 52 |shortleaf pine, |black oak-----------| 70 | 52 | eastern white |pitch pine----------| 70 | 114 | pine, white oak, |red maple-----------| --- | --- | yellow-poplar | | | |HboA: | | | | Hammonton---------------|black oak-----------| 80 | 52 |Virginia pine |pitch pine----------| 80 | 114 | |shortleaf pine------| 70 | 110 | |Virginia pine-------| 70 | 109 | |white oak-----------| 80 | 52 | | | | |HbrB: | | | | Hammonton---------------|white oak-----------| 80 | 62 |willow oak, sugar |black oak-----------| 80 | 62 | maple, eastern |pitch pine----------| 80 | 114 | white pine, |yellow-poplar-------| --- | --- | yellow-poplar, |red maple-----------| --- | --- | American sycamore, | | | | flowering crabapple, | | | | flowering dogwood | | | | Urban land--------------| --- | --- | --- | --- | | | |KeoC: | | | | Keyport-----------------|American beech------| 80 | 57 |loblolly pine, |northern red oak----| 80 | 62 | northern red oak, |yellow-poplar-------| 90 | 114 | yellow-poplar | | | |MakAt: | | | | Manahawkin, frequently | | | | flooded----------------|Atlantic white cedar| 50 | 92 |Atlantic white |red maple-----------| 75 | 43 | cedar, red maple | | | |MamnAv: | | | | Mannington, very | | | | frequently flooded-----| --- | --- | --- | --- | | | | Nanticoke, very | | | | frequently flooded-----| --- | --- | --- | --- | | | |
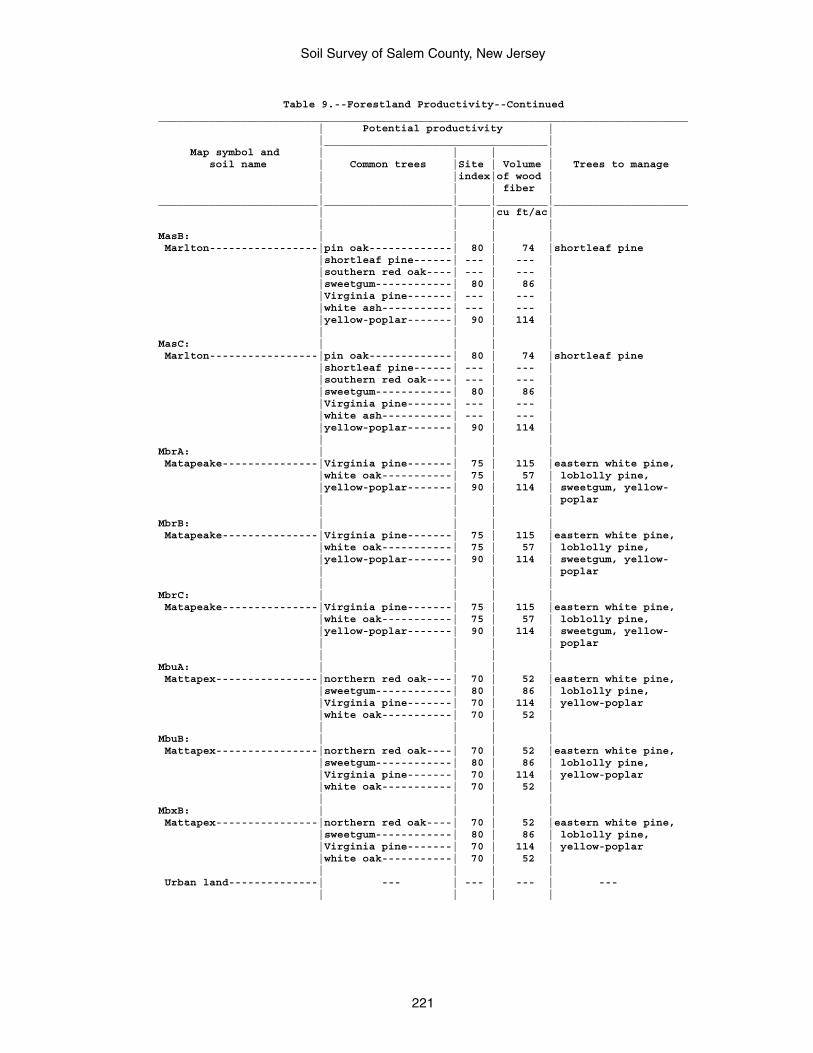
Soil Survey of Salem County, New Jersey
221
Table 9.--Forestland Productivity--Continued___________________________________________________________________________________ | Potential productivity | |___________________________________| Map symbol and | | | | soil name | Common trees |Site | Volume | Trees to manage | |index|of wood | | | | fiber |_________________________|____________________|_____|________|_____________________ | | |cu ft/ac| | | | |MasB: | | | | Marlton-----------------|pin oak-------------| 80 | 74 |shortleaf pine |shortleaf pine------| --- | --- | |southern red oak----| --- | --- | |sweetgum------------| 80 | 86 | |Virginia pine-------| --- | --- | |white ash-----------| --- | --- | |yellow-poplar-------| 90 | 114 | | | | |MasC: | | | | Marlton-----------------|pin oak-------------| 80 | 74 |shortleaf pine |shortleaf pine------| --- | --- | |southern red oak----| --- | --- | |sweetgum------------| 80 | 86 | |Virginia pine-------| --- | --- | |white ash-----------| --- | --- | |yellow-poplar-------| 90 | 114 | | | | |MbrA: | | | | Matapeake---------------|Virginia pine-------| 75 | 115 |eastern white pine, |white oak-----------| 75 | 57 | loblolly pine, |yellow-poplar-------| 90 | 114 | sweetgum, yellow- | | | | poplar | | | |MbrB: | | | | Matapeake---------------|Virginia pine-------| 75 | 115 |eastern white pine, |white oak-----------| 75 | 57 | loblolly pine, |yellow-poplar-------| 90 | 114 | sweetgum, yellow- | | | | poplar | | | |MbrC: | | | | Matapeake---------------|Virginia pine-------| 75 | 115 |eastern white pine, |white oak-----------| 75 | 57 | loblolly pine, |yellow-poplar-------| 90 | 114 | sweetgum, yellow- | | | | poplar | | | |MbuA: | | | | Mattapex----------------|northern red oak----| 70 | 52 |eastern white pine, |sweetgum------------| 80 | 86 | loblolly pine, |Virginia pine-------| 70 | 114 | yellow-poplar |white oak-----------| 70 | 52 | | | | |MbuB: | | | | Mattapex----------------|northern red oak----| 70 | 52 |eastern white pine, |sweetgum------------| 80 | 86 | loblolly pine, |Virginia pine-------| 70 | 114 | yellow-poplar |white oak-----------| 70 | 52 | | | | |MbxB: | | | | Mattapex----------------|northern red oak----| 70 | 52 |eastern white pine, |sweetgum------------| 80 | 86 | loblolly pine, |Virginia pine-------| 70 | 114 | yellow-poplar |white oak-----------| 70 | 52 | | | | | Urban land--------------| --- | --- | --- | --- | | | |
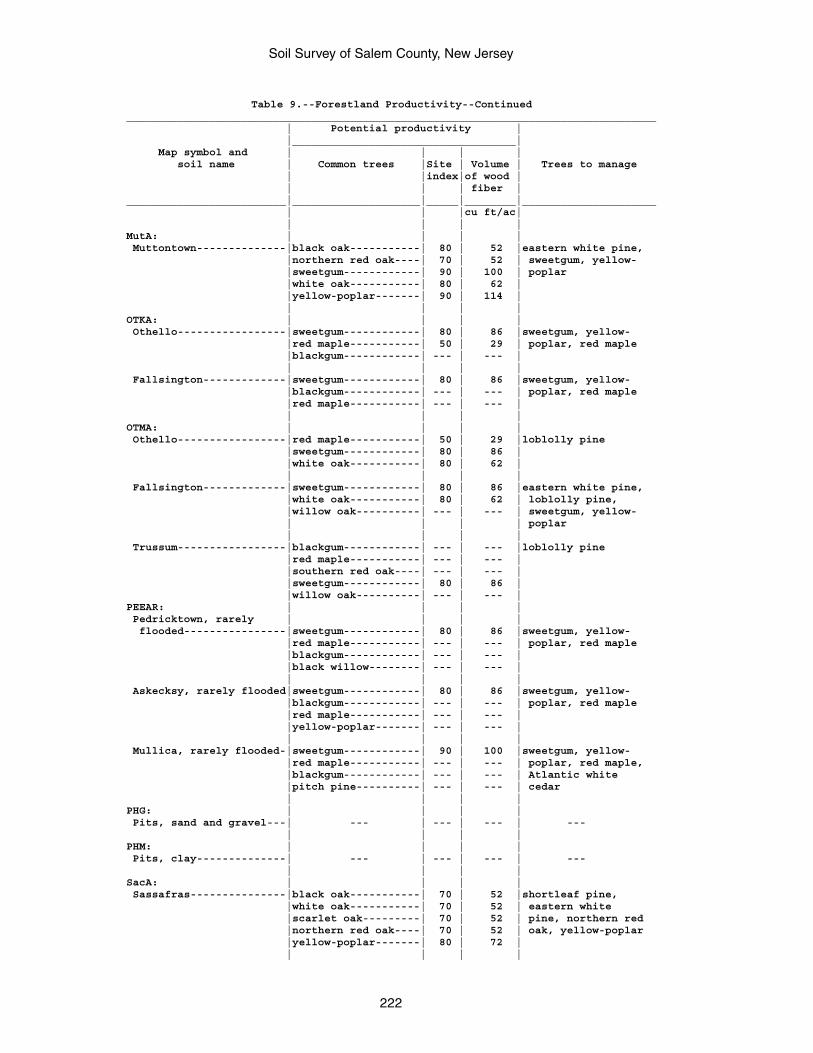
Soil Survey of Salem County, New Jersey
222
Table 9.--Forestland Productivity--Continued___________________________________________________________________________________ | Potential productivity | |___________________________________| Map symbol and | | | | soil name | Common trees |Site | Volume | Trees to manage | |index|of wood | | | | fiber |_________________________|____________________|_____|________|_____________________ | | |cu ft/ac| | | | |MutA: | | | | Muttontown--------------|black oak-----------| 80 | 52 |eastern white pine, |northern red oak----| 70 | 52 | sweetgum, yellow- |sweetgum------------| 90 | 100 | poplar |white oak-----------| 80 | 62 | |yellow-poplar-------| 90 | 114 | | | | |OTKA: | | | | Othello-----------------|sweetgum------------| 80 | 86 |sweetgum, yellow- |red maple-----------| 50 | 29 | poplar, red maple |blackgum------------| --- | --- | | | | | Fallsington-------------|sweetgum------------| 80 | 86 |sweetgum, yellow- |blackgum------------| --- | --- | poplar, red maple |red maple-----------| --- | --- | | | | |OTMA: | | | | Othello-----------------|red maple-----------| 50 | 29 |loblolly pine |sweetgum------------| 80 | 86 | |white oak-----------| 80 | 62 | | | | | Fallsington-------------|sweetgum------------| 80 | 86 |eastern white pine, |white oak-----------| 80 | 62 | loblolly pine, |willow oak----------| --- | --- | sweetgum, yellow- | | | | poplar | | | | Trussum-----------------|blackgum------------| --- | --- |loblolly pine |red maple-----------| --- | --- | |southern red oak----| --- | --- | |sweetgum------------| 80 | 86 | |willow oak----------| --- | --- |PEEAR: | | | | Pedricktown, rarely | | | | flooded----------------|sweetgum------------| 80 | 86 |sweetgum, yellow- |red maple-----------| --- | --- | poplar, red maple |blackgum------------| --- | --- | |black willow--------| --- | --- | | | | | Askecksy, rarely flooded|sweetgum------------| 80 | 86 |sweetgum, yellow- |blackgum------------| --- | --- | poplar, red maple |red maple-----------| --- | --- | |yellow-poplar-------| --- | --- | | | | | Mullica, rarely flooded-|sweetgum------------| 90 | 100 |sweetgum, yellow- |red maple-----------| --- | --- | poplar, red maple, |blackgum------------| --- | --- | Atlantic white |pitch pine----------| --- | --- | cedar | | | |PHG: | | | | Pits, sand and gravel---| --- | --- | --- | --- | | | |PHM: | | | | Pits, clay--------------| --- | --- | --- | --- | | | |SacA: | | | | Sassafras---------------|black oak-----------| 70 | 52 |shortleaf pine, |white oak-----------| 70 | 52 | eastern white |scarlet oak---------| 70 | 52 | pine, northern red |northern red oak----| 70 | 52 | oak, yellow-poplar |yellow-poplar-------| 80 | 72 | | | | |
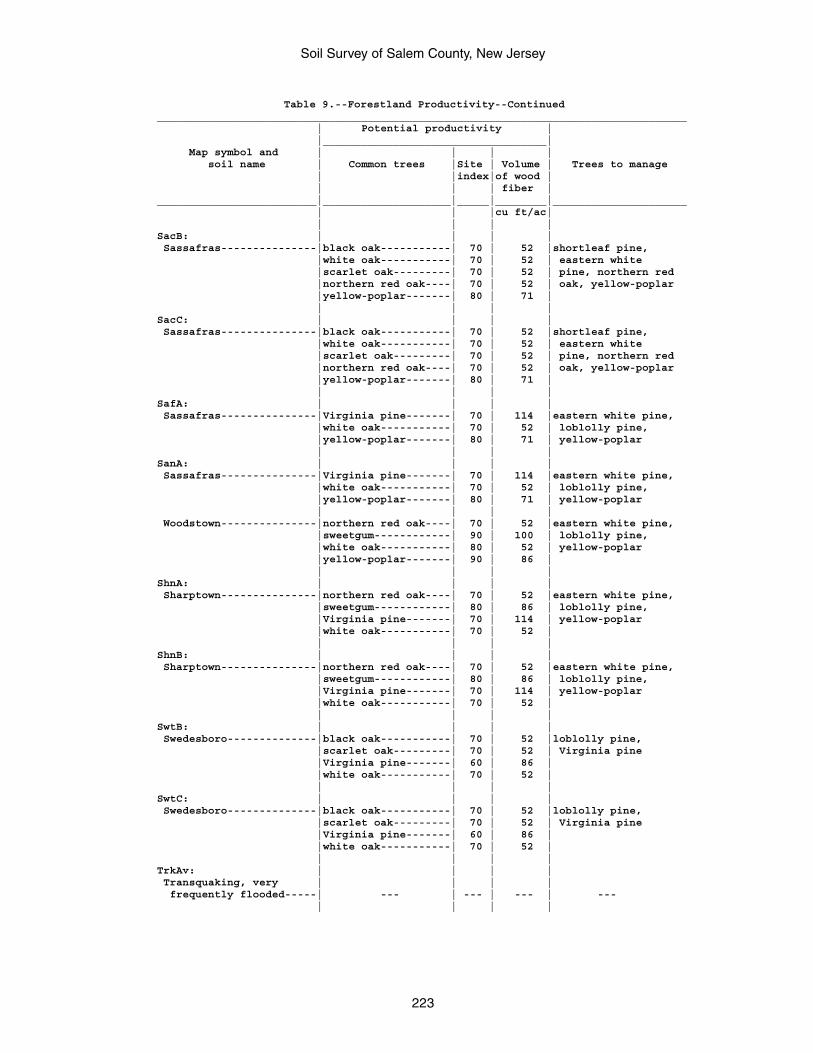
Soil Survey of Salem County, New Jersey
223
Table 9.--Forestland Productivity--Continued___________________________________________________________________________________ | Potential productivity | |___________________________________| Map symbol and | | | | soil name | Common trees |Site | Volume | Trees to manage | |index|of wood | | | | fiber |_________________________|____________________|_____|________|_____________________ | | |cu ft/ac| | | | |SacB: | | | | Sassafras---------------|black oak-----------| 70 | 52 |shortleaf pine, |white oak-----------| 70 | 52 | eastern white |scarlet oak---------| 70 | 52 | pine, northern red |northern red oak----| 70 | 52 | oak, yellow-poplar |yellow-poplar-------| 80 | 71 | | | | |SacC: | | | | Sassafras---------------|black oak-----------| 70 | 52 |shortleaf pine, |white oak-----------| 70 | 52 | eastern white |scarlet oak---------| 70 | 52 | pine, northern red |northern red oak----| 70 | 52 | oak, yellow-poplar |yellow-poplar-------| 80 | 71 | | | | |SafA: | | | | Sassafras---------------|Virginia pine-------| 70 | 114 |eastern white pine, |white oak-----------| 70 | 52 | loblolly pine, |yellow-poplar-------| 80 | 71 | yellow-poplar | | | |SanA: | | | | Sassafras---------------|Virginia pine-------| 70 | 114 |eastern white pine, |white oak-----------| 70 | 52 | loblolly pine, |yellow-poplar-------| 80 | 71 | yellow-poplar | | | | Woodstown---------------|northern red oak----| 70 | 52 |eastern white pine, |sweetgum------------| 90 | 100 | loblolly pine, |white oak-----------| 80 | 52 | yellow-poplar |yellow-poplar-------| 90 | 86 | | | | |ShnA: | | | | Sharptown---------------|northern red oak----| 70 | 52 |eastern white pine, |sweetgum------------| 80 | 86 | loblolly pine, |Virginia pine-------| 70 | 114 | yellow-poplar |white oak-----------| 70 | 52 | | | | |ShnB: | | | | Sharptown---------------|northern red oak----| 70 | 52 |eastern white pine, |sweetgum------------| 80 | 86 | loblolly pine, |Virginia pine-------| 70 | 114 | yellow-poplar |white oak-----------| 70 | 52 | | | | |SwtB: | | | | Swedesboro--------------|black oak-----------| 70 | 52 |loblolly pine, |scarlet oak---------| 70 | 52 | Virginia pine |Virginia pine-------| 60 | 86 | |white oak-----------| 70 | 52 | | | | |SwtC: | | | | Swedesboro--------------|black oak-----------| 70 | 52 |loblolly pine, |scarlet oak---------| 70 | 52 | Virginia pine |Virginia pine-------| 60 | 86 | |white oak-----------| 70 | 52 | | | | |TrkAv: | | | | Transquaking, very | | | | frequently flooded-----| --- | --- | --- | --- | | | |
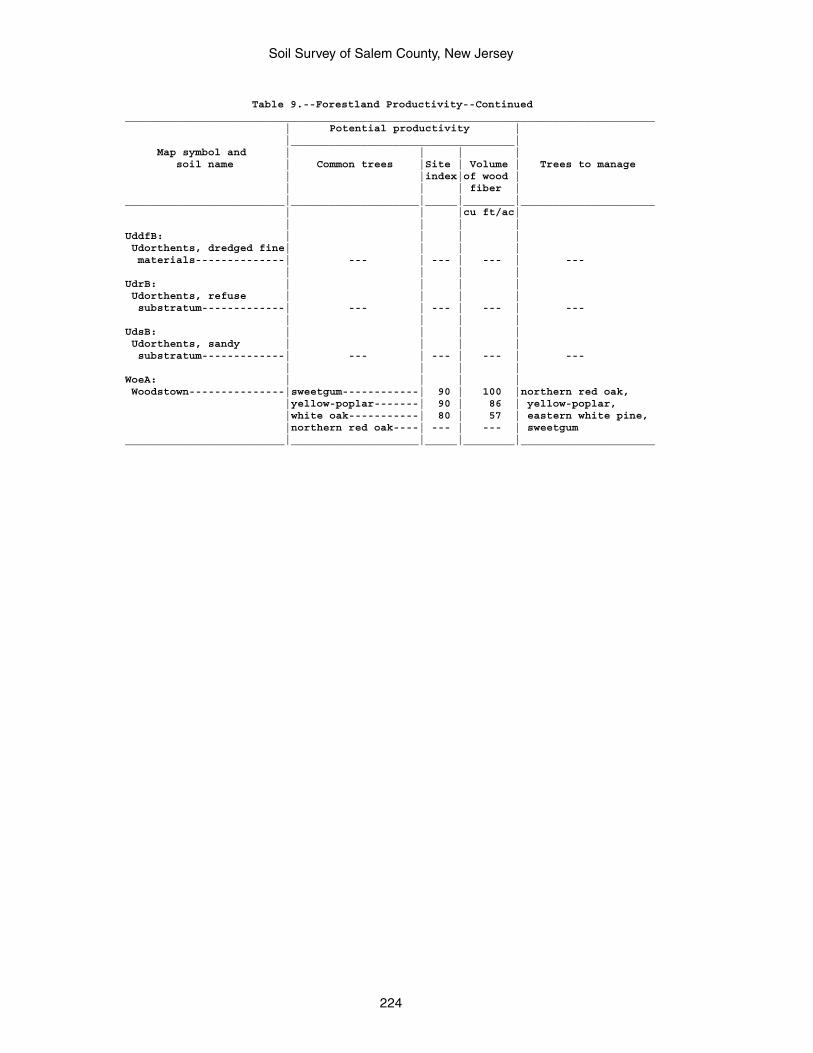
Soil Survey of Salem County, New Jersey
224
Table 9.--Forestland Productivity--Continued___________________________________________________________________________________ | Potential productivity | |___________________________________| Map symbol and | | | | soil name | Common trees |Site | Volume | Trees to manage | |index|of wood | | | | fiber |_________________________|____________________|_____|________|_____________________ | | |cu ft/ac| | | | |UddfB: | | | | Udorthents, dredged fine| | | | materials--------------| --- | --- | --- | --- | | | |UdrB: | | | | Udorthents, refuse | | | | substratum-------------| --- | --- | --- | --- | | | |UdsB: | | | | Udorthents, sandy | | | | substratum-------------| --- | --- | --- | --- | | | |WoeA: | | | | Woodstown---------------|sweetgum------------| 90 | 100 |northern red oak, |yellow-poplar-------| 90 | 86 | yellow-poplar, |white oak-----------| 80 | 57 | eastern white pine, |northern red oak----| --- | --- | sweetgum_________________________|____________________|_____|________|_____________________
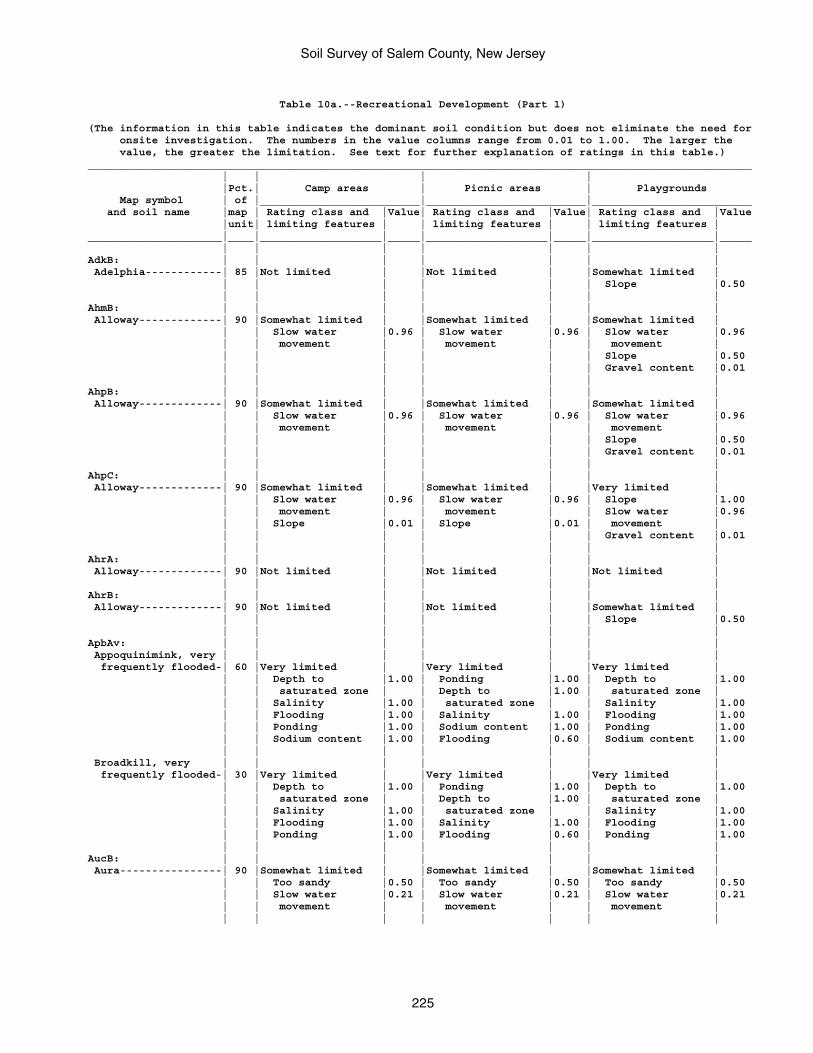
Soil Survey of Salem County, New Jersey
225
Table 10a.--Recreational Development (Part 1)
(The information in this table indicates the dominant soil condition but does not eliminate the need for onsite investigation. The numbers in the value columns range from 0.01 to 1.00. The larger the value, the greater the limitation. See text for further explanation of ratings in this table.)________________________________________________________________________________________________________ | | | | |Pct.| Camp areas | Picnic areas | Playgrounds Map symbol | of |_________________________|_________________________|_________________________ and soil name |map | Rating class and |Value| Rating class and |Value| Rating class and |Value |unit| limiting features | | limiting features | | limiting features |_____________________|____|___________________|_____|___________________|_____|___________________|_____ | | | | | | |AdkB: | | | | | | | Adelphia------------| 85 |Not limited | |Not limited | |Somewhat limited | | | | | | | Slope |0.50 | | | | | | |AhmB: | | | | | | | Alloway-------------| 90 |Somewhat limited | |Somewhat limited | |Somewhat limited | | | Slow water |0.96 | Slow water |0.96 | Slow water |0.96 | | movement | | movement | | movement | | | | | | | Slope |0.50 | | | | | | Gravel content |0.01 | | | | | | |AhpB: | | | | | | | Alloway-------------| 90 |Somewhat limited | |Somewhat limited | |Somewhat limited | | | Slow water |0.96 | Slow water |0.96 | Slow water |0.96 | | movement | | movement | | movement | | | | | | | Slope |0.50 | | | | | | Gravel content |0.01 | | | | | | |AhpC: | | | | | | | Alloway-------------| 90 |Somewhat limited | |Somewhat limited | |Very limited | | | Slow water |0.96 | Slow water |0.96 | Slope |1.00 | | movement | | movement | | Slow water |0.96 | | Slope |0.01 | Slope |0.01 | movement | | | | | | | Gravel content |0.01 | | | | | | |AhrA: | | | | | | | Alloway-------------| 90 |Not limited | |Not limited | |Not limited | | | | | | | |AhrB: | | | | | | | Alloway-------------| 90 |Not limited | |Not limited | |Somewhat limited | | | | | | | Slope |0.50 | | | | | | |ApbAv: | | | | | | | Appoquinimink, very | | | | | | | frequently flooded-| 60 |Very limited | |Very limited | |Very limited | | | Depth to |1.00 | Ponding |1.00 | Depth to |1.00 | | saturated zone | | Depth to |1.00 | saturated zone | | | Salinity |1.00 | saturated zone | | Salinity |1.00 | | Flooding |1.00 | Salinity |1.00 | Flooding |1.00 | | Ponding |1.00 | Sodium content |1.00 | Ponding |1.00 | | Sodium content |1.00 | Flooding |0.60 | Sodium content |1.00 | | | | | | | Broadkill, very | | | | | | | frequently flooded-| 30 |Very limited | |Very limited | |Very limited | | | Depth to |1.00 | Ponding |1.00 | Depth to |1.00 | | saturated zone | | Depth to |1.00 | saturated zone | | | Salinity |1.00 | saturated zone | | Salinity |1.00 | | Flooding |1.00 | Salinity |1.00 | Flooding |1.00 | | Ponding |1.00 | Flooding |0.60 | Ponding |1.00 | | | | | | |AucB: | | | | | | | Aura----------------| 90 |Somewhat limited | |Somewhat limited | |Somewhat limited | | | Too sandy |0.50 | Too sandy |0.50 | Too sandy |0.50 | | Slow water |0.21 | Slow water |0.21 | Slow water |0.21 | | movement | | movement | | movement | | | | | | | |
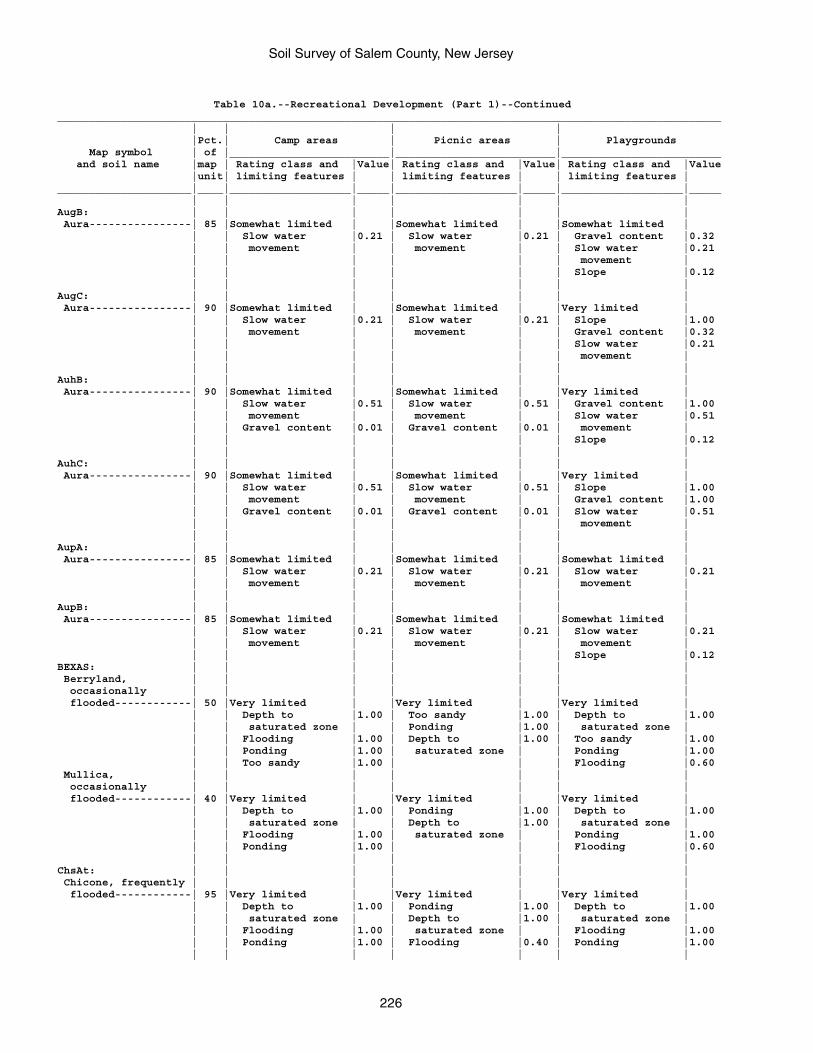
Soil Survey of Salem County, New Jersey
226
Table 10a.--Recreational Development (Part 1)--Continued________________________________________________________________________________________________________ | | | | |Pct.| Camp areas | Picnic areas | Playgrounds Map symbol | of |_________________________|_________________________|_________________________ and soil name |map | Rating class and |Value| Rating class and |Value| Rating class and |Value |unit| limiting features | | limiting features | | limiting features |_____________________|____|___________________|_____|___________________|_____|___________________|_____ | | | | | | |AugB: | | | | | | | Aura----------------| 85 |Somewhat limited | |Somewhat limited | |Somewhat limited | | | Slow water |0.21 | Slow water |0.21 | Gravel content |0.32 | | movement | | movement | | Slow water |0.21 | | | | | | movement | | | | | | | Slope |0.12 | | | | | | |AugC: | | | | | | | Aura----------------| 90 |Somewhat limited | |Somewhat limited | |Very limited | | | Slow water |0.21 | Slow water |0.21 | Slope |1.00 | | movement | | movement | | Gravel content |0.32 | | | | | | Slow water |0.21 | | | | | | movement | | | | | | | |AuhB: | | | | | | | Aura----------------| 90 |Somewhat limited | |Somewhat limited | |Very limited | | | Slow water |0.51 | Slow water |0.51 | Gravel content |1.00 | | movement | | movement | | Slow water |0.51 | | Gravel content |0.01 | Gravel content |0.01 | movement | | | | | | | Slope |0.12 | | | | | | |AuhC: | | | | | | | Aura----------------| 90 |Somewhat limited | |Somewhat limited | |Very limited | | | Slow water |0.51 | Slow water |0.51 | Slope |1.00 | | movement | | movement | | Gravel content |1.00 | | Gravel content |0.01 | Gravel content |0.01 | Slow water |0.51 | | | | | | movement | | | | | | | |AupA: | | | | | | | Aura----------------| 85 |Somewhat limited | |Somewhat limited | |Somewhat limited | | | Slow water |0.21 | Slow water |0.21 | Slow water |0.21 | | movement | | movement | | movement | | | | | | | |AupB: | | | | | | | Aura----------------| 85 |Somewhat limited | |Somewhat limited | |Somewhat limited | | | Slow water |0.21 | Slow water |0.21 | Slow water |0.21 | | movement | | movement | | movement | | | | | | | Slope |0.12BEXAS: | | | | | | | Berryland, | | | | | | | occasionally | | | | | | | flooded------------| 50 |Very limited | |Very limited | |Very limited | | | Depth to |1.00 | Too sandy |1.00 | Depth to |1.00 | | saturated zone | | Ponding |1.00 | saturated zone | | | Flooding |1.00 | Depth to |1.00 | Too sandy |1.00 | | Ponding |1.00 | saturated zone | | Ponding |1.00 | | Too sandy |1.00 | | | Flooding |0.60 Mullica, | | | | | | | occasionally | | | | | | | flooded------------| 40 |Very limited | |Very limited | |Very limited | | | Depth to |1.00 | Ponding |1.00 | Depth to |1.00 | | saturated zone | | Depth to |1.00 | saturated zone | | | Flooding |1.00 | saturated zone | | Ponding |1.00 | | Ponding |1.00 | | | Flooding |0.60 | | | | | | |ChsAt: | | | | | | | Chicone, frequently | | | | | | | flooded------------| 95 |Very limited | |Very limited | |Very limited | | | Depth to |1.00 | Ponding |1.00 | Depth to |1.00 | | saturated zone | | Depth to |1.00 | saturated zone | | | Flooding |1.00 | saturated zone | | Flooding |1.00 | | Ponding |1.00 | Flooding |0.40 | Ponding |1.00 | | | | | | |
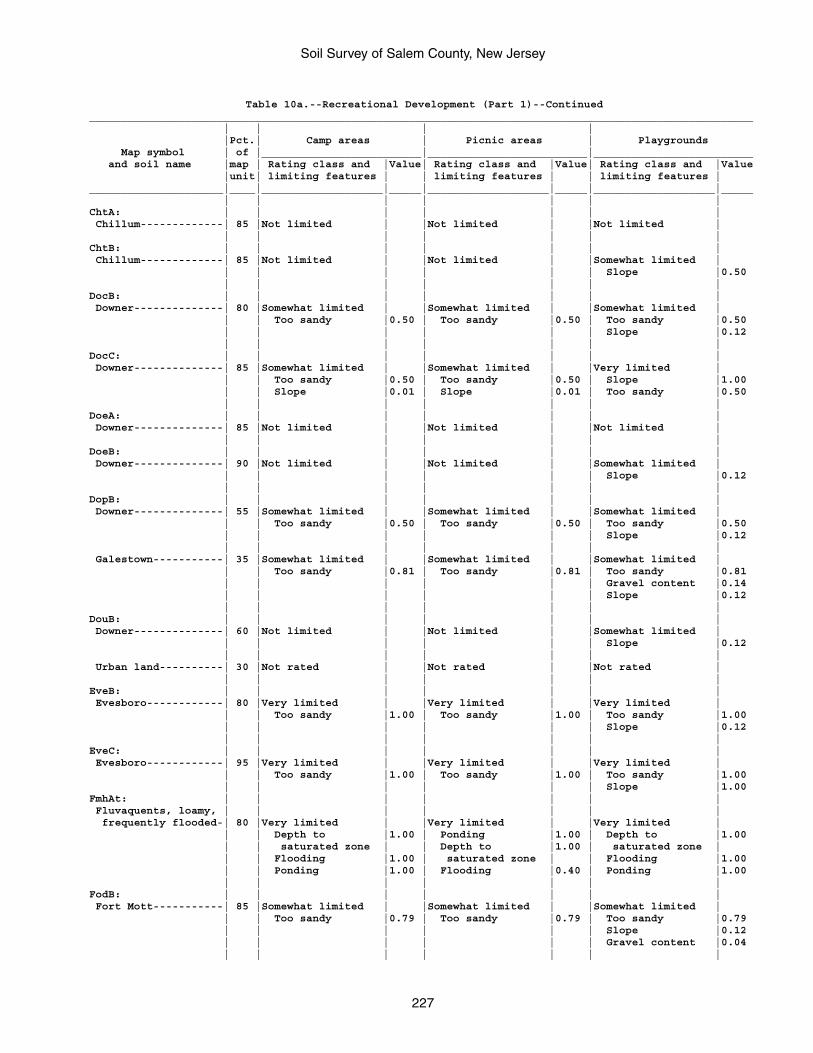
Soil Survey of Salem County, New Jersey
227
Table 10a.--Recreational Development (Part 1)--Continued________________________________________________________________________________________________________ | | | | |Pct.| Camp areas | Picnic areas | Playgrounds Map symbol | of |_________________________|_________________________|_________________________ and soil name |map | Rating class and |Value| Rating class and |Value| Rating class and |Value |unit| limiting features | | limiting features | | limiting features |_____________________|____|___________________|_____|___________________|_____|___________________|_____ | | | | | | |ChtA: | | | | | | | Chillum-------------| 85 |Not limited | |Not limited | |Not limited | | | | | | | |ChtB: | | | | | | | Chillum-------------| 85 |Not limited | |Not limited | |Somewhat limited | | | | | | | Slope |0.50 | | | | | | |DocB: | | | | | | | Downer--------------| 80 |Somewhat limited | |Somewhat limited | |Somewhat limited | | | Too sandy |0.50 | Too sandy |0.50 | Too sandy |0.50 | | | | | | Slope |0.12 | | | | | | |DocC: | | | | | | | Downer--------------| 85 |Somewhat limited | |Somewhat limited | |Very limited | | | Too sandy |0.50 | Too sandy |0.50 | Slope |1.00 | | Slope |0.01 | Slope |0.01 | Too sandy |0.50 | | | | | | |DoeA: | | | | | | | Downer--------------| 85 |Not limited | |Not limited | |Not limited | | | | | | | |DoeB: | | | | | | | Downer--------------| 90 |Not limited | |Not limited | |Somewhat limited | | | | | | | Slope |0.12 | | | | | | |DopB: | | | | | | | Downer--------------| 55 |Somewhat limited | |Somewhat limited | |Somewhat limited | | | Too sandy |0.50 | Too sandy |0.50 | Too sandy |0.50 | | | | | | Slope |0.12 | | | | | | | Galestown-----------| 35 |Somewhat limited | |Somewhat limited | |Somewhat limited | | | Too sandy |0.81 | Too sandy |0.81 | Too sandy |0.81 | | | | | | Gravel content |0.14 | | | | | | Slope |0.12 | | | | | | |DouB: | | | | | | | Downer--------------| 60 |Not limited | |Not limited | |Somewhat limited | | | | | | | Slope |0.12 | | | | | | | Urban land----------| 30 |Not rated | |Not rated | |Not rated | | | | | | | |EveB: | | | | | | | Evesboro------------| 80 |Very limited | |Very limited | |Very limited | | | Too sandy |1.00 | Too sandy |1.00 | Too sandy |1.00 | | | | | | Slope |0.12 | | | | | | |EveC: | | | | | | | Evesboro------------| 95 |Very limited | |Very limited | |Very limited | | | Too sandy |1.00 | Too sandy |1.00 | Too sandy |1.00 | | | | | | Slope |1.00FmhAt: | | | | | | | Fluvaquents, loamy, | | | | | | | frequently flooded-| 80 |Very limited | |Very limited | |Very limited | | | Depth to |1.00 | Ponding |1.00 | Depth to |1.00 | | saturated zone | | Depth to |1.00 | saturated zone | | | Flooding |1.00 | saturated zone | | Flooding |1.00 | | Ponding |1.00 | Flooding |0.40 | Ponding |1.00 | | | | | | |FodB: | | | | | | | Fort Mott-----------| 85 |Somewhat limited | |Somewhat limited | |Somewhat limited | | | Too sandy |0.79 | Too sandy |0.79 | Too sandy |0.79 | | | | | | Slope |0.12 | | | | | | Gravel content |0.04 | | | | | | |
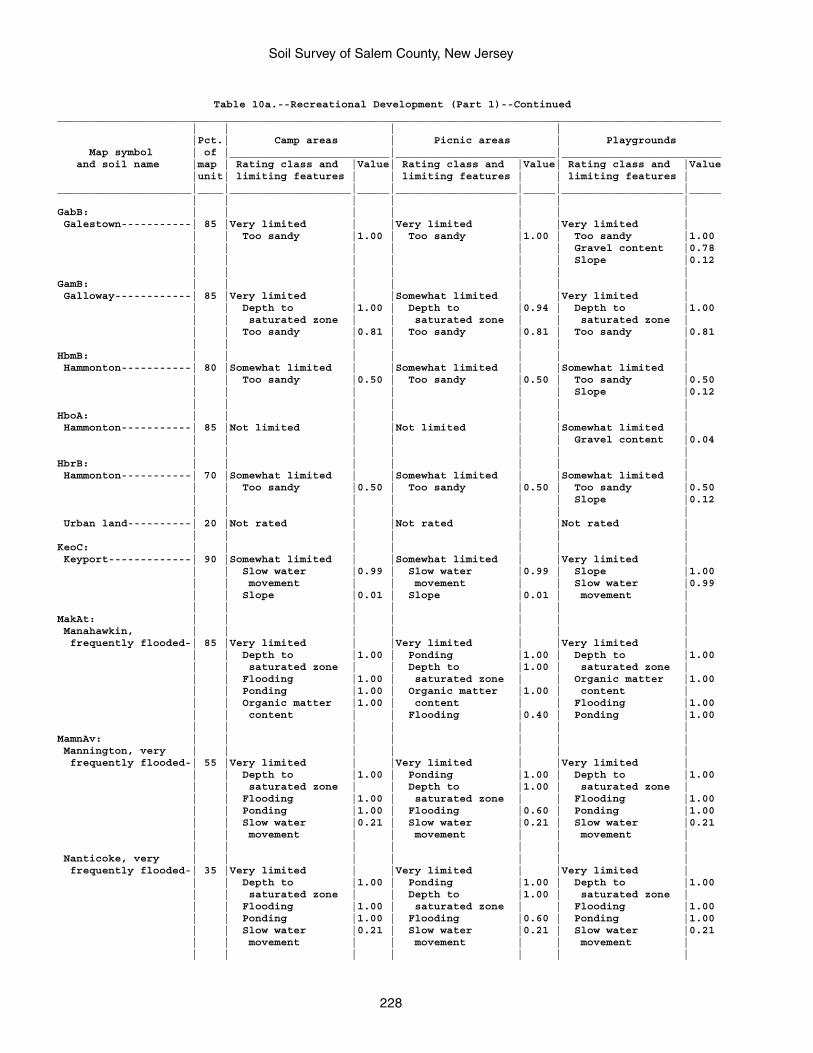
Soil Survey of Salem County, New Jersey
228
Table 10a.--Recreational Development (Part 1)--Continued________________________________________________________________________________________________________ | | | | |Pct.| Camp areas | Picnic areas | Playgrounds Map symbol | of |_________________________|_________________________|_________________________ and soil name |map | Rating class and |Value| Rating class and |Value| Rating class and |Value |unit| limiting features | | limiting features | | limiting features |_____________________|____|___________________|_____|___________________|_____|___________________|_____ | | | | | | |GabB: | | | | | | | Galestown-----------| 85 |Very limited | |Very limited | |Very limited | | | Too sandy |1.00 | Too sandy |1.00 | Too sandy |1.00 | | | | | | Gravel content |0.78 | | | | | | Slope |0.12 | | | | | | |GamB: | | | | | | | Galloway------------| 85 |Very limited | |Somewhat limited | |Very limited | | | Depth to |1.00 | Depth to |0.94 | Depth to |1.00 | | saturated zone | | saturated zone | | saturated zone | | | Too sandy |0.81 | Too sandy |0.81 | Too sandy |0.81 | | | | | | |HbmB: | | | | | | | Hammonton-----------| 80 |Somewhat limited | |Somewhat limited | |Somewhat limited | | | Too sandy |0.50 | Too sandy |0.50 | Too sandy |0.50 | | | | | | Slope |0.12 | | | | | | |HboA: | | | | | | | Hammonton-----------| 85 |Not limited | |Not limited | |Somewhat limited | | | | | | | Gravel content |0.04 | | | | | | |HbrB: | | | | | | | Hammonton-----------| 70 |Somewhat limited | |Somewhat limited | |Somewhat limited | | | Too sandy |0.50 | Too sandy |0.50 | Too sandy |0.50 | | | | | | Slope |0.12 | | | | | | | Urban land----------| 20 |Not rated | |Not rated | |Not rated | | | | | | | |KeoC: | | | | | | | Keyport-------------| 90 |Somewhat limited | |Somewhat limited | |Very limited | | | Slow water |0.99 | Slow water |0.99 | Slope |1.00 | | movement | | movement | | Slow water |0.99 | | Slope |0.01 | Slope |0.01 | movement | | | | | | | |MakAt: | | | | | | | Manahawkin, | | | | | | | frequently flooded-| 85 |Very limited | |Very limited | |Very limited | | | Depth to |1.00 | Ponding |1.00 | Depth to |1.00 | | saturated zone | | Depth to |1.00 | saturated zone | | | Flooding |1.00 | saturated zone | | Organic matter |1.00 | | Ponding |1.00 | Organic matter |1.00 | content | | | Organic matter |1.00 | content | | Flooding |1.00 | | content | | Flooding |0.40 | Ponding |1.00 | | | | | | |MamnAv: | | | | | | | Mannington, very | | | | | | | frequently flooded-| 55 |Very limited | |Very limited | |Very limited | | | Depth to |1.00 | Ponding |1.00 | Depth to |1.00 | | saturated zone | | Depth to |1.00 | saturated zone | | | Flooding |1.00 | saturated zone | | Flooding |1.00 | | Ponding |1.00 | Flooding |0.60 | Ponding |1.00 | | Slow water |0.21 | Slow water |0.21 | Slow water |0.21 | | movement | | movement | | movement | | | | | | | | Nanticoke, very | | | | | | | frequently flooded-| 35 |Very limited | |Very limited | |Very limited | | | Depth to |1.00 | Ponding |1.00 | Depth to |1.00 | | saturated zone | | Depth to |1.00 | saturated zone | | | Flooding |1.00 | saturated zone | | Flooding |1.00 | | Ponding |1.00 | Flooding |0.60 | Ponding |1.00 | | Slow water |0.21 | Slow water |0.21 | Slow water |0.21 | | movement | | movement | | movement | | | | | | | |
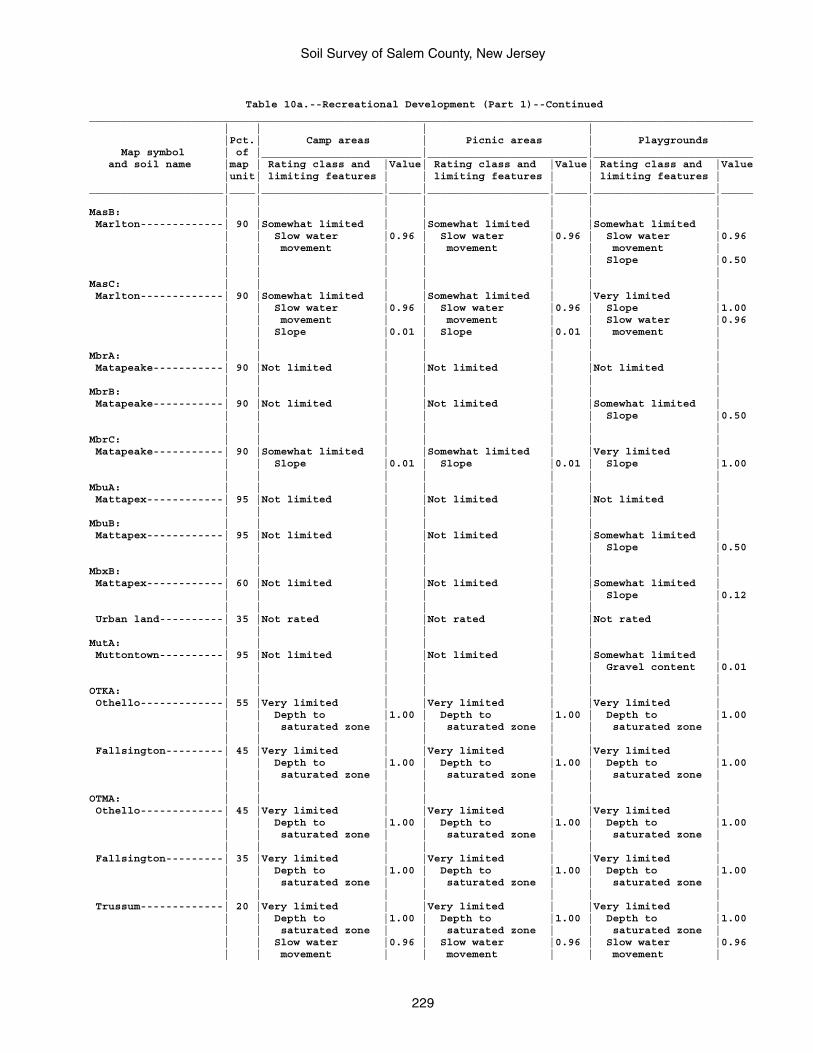
Soil Survey of Salem County, New Jersey
229
Table 10a.--Recreational Development (Part 1)--Continued________________________________________________________________________________________________________ | | | | |Pct.| Camp areas | Picnic areas | Playgrounds Map symbol | of |_________________________|_________________________|_________________________ and soil name |map | Rating class and |Value| Rating class and |Value| Rating class and |Value |unit| limiting features | | limiting features | | limiting features |_____________________|____|___________________|_____|___________________|_____|___________________|_____ | | | | | | |MasB: | | | | | | | Marlton-------------| 90 |Somewhat limited | |Somewhat limited | |Somewhat limited | | | Slow water |0.96 | Slow water |0.96 | Slow water |0.96 | | movement | | movement | | movement | | | | | | | Slope |0.50 | | | | | | |MasC: | | | | | | | Marlton-------------| 90 |Somewhat limited | |Somewhat limited | |Very limited | | | Slow water |0.96 | Slow water |0.96 | Slope |1.00 | | movement | | movement | | Slow water |0.96 | | Slope |0.01 | Slope |0.01 | movement | | | | | | | |MbrA: | | | | | | | Matapeake-----------| 90 |Not limited | |Not limited | |Not limited | | | | | | | |MbrB: | | | | | | | Matapeake-----------| 90 |Not limited | |Not limited | |Somewhat limited | | | | | | | Slope |0.50 | | | | | | |MbrC: | | | | | | | Matapeake-----------| 90 |Somewhat limited | |Somewhat limited | |Very limited | | | Slope |0.01 | Slope |0.01 | Slope |1.00 | | | | | | |MbuA: | | | | | | | Mattapex------------| 95 |Not limited | |Not limited | |Not limited | | | | | | | |MbuB: | | | | | | | Mattapex------------| 95 |Not limited | |Not limited | |Somewhat limited | | | | | | | Slope |0.50 | | | | | | |MbxB: | | | | | | | Mattapex------------| 60 |Not limited | |Not limited | |Somewhat limited | | | | | | | Slope |0.12 | | | | | | | Urban land----------| 35 |Not rated | |Not rated | |Not rated | | | | | | | |MutA: | | | | | | | Muttontown----------| 95 |Not limited | |Not limited | |Somewhat limited | | | | | | | Gravel content |0.01 | | | | | | |OTKA: | | | | | | | Othello-------------| 55 |Very limited | |Very limited | |Very limited | | | Depth to |1.00 | Depth to |1.00 | Depth to |1.00 | | saturated zone | | saturated zone | | saturated zone | | | | | | | | Fallsington---------| 45 |Very limited | |Very limited | |Very limited | | | Depth to |1.00 | Depth to |1.00 | Depth to |1.00 | | saturated zone | | saturated zone | | saturated zone | | | | | | | |OTMA: | | | | | | | Othello-------------| 45 |Very limited | |Very limited | |Very limited | | | Depth to |1.00 | Depth to |1.00 | Depth to |1.00 | | saturated zone | | saturated zone | | saturated zone | | | | | | | | Fallsington---------| 35 |Very limited | |Very limited | |Very limited | | | Depth to |1.00 | Depth to |1.00 | Depth to |1.00 | | saturated zone | | saturated zone | | saturated zone | | | | | | | | Trussum-------------| 20 |Very limited | |Very limited | |Very limited | | | Depth to |1.00 | Depth to |1.00 | Depth to |1.00 | | saturated zone | | saturated zone | | saturated zone | | | Slow water |0.96 | Slow water |0.96 | Slow water |0.96 | | movement | | movement | | movement |
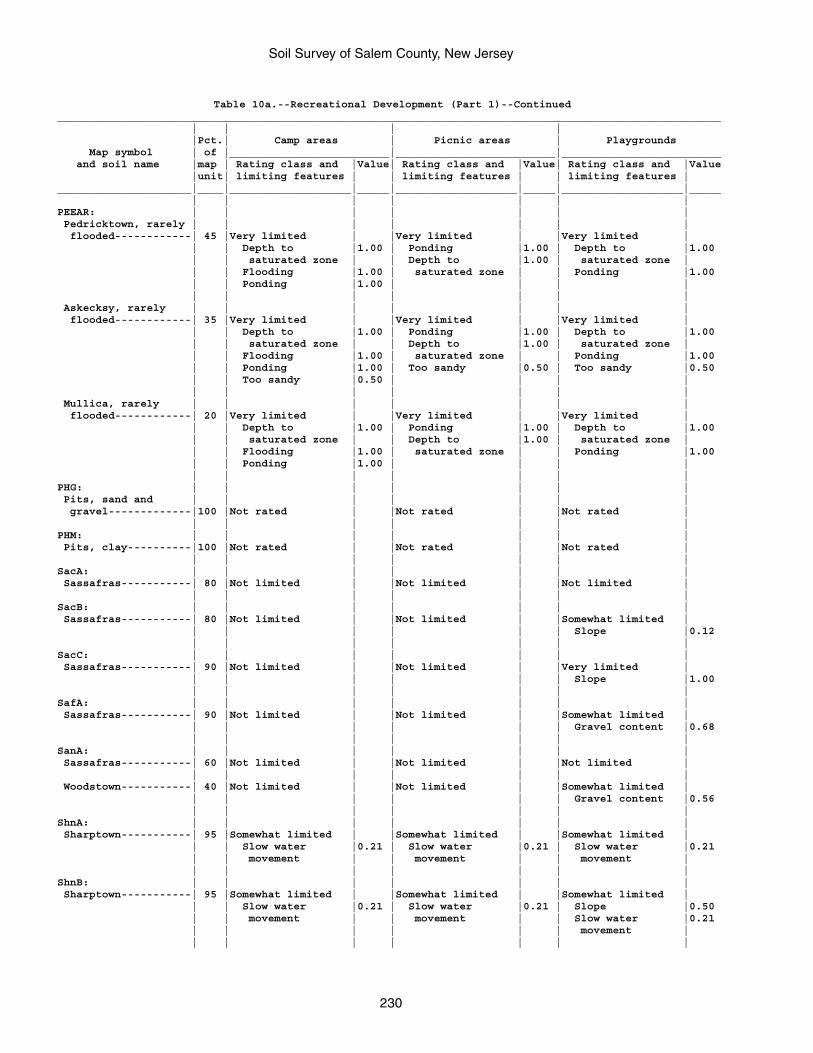
Soil Survey of Salem County, New Jersey
230
Table 10a.--Recreational Development (Part 1)--Continued________________________________________________________________________________________________________ | | | | |Pct.| Camp areas | Picnic areas | Playgrounds Map symbol | of |_________________________|_________________________|_________________________ and soil name |map | Rating class and |Value| Rating class and |Value| Rating class and |Value |unit| limiting features | | limiting features | | limiting features |_____________________|____|___________________|_____|___________________|_____|___________________|_____ | | | | | | |PEEAR: | | | | | | | Pedricktown, rarely | | | | | | | flooded------------| 45 |Very limited | |Very limited | |Very limited | | | Depth to |1.00 | Ponding |1.00 | Depth to |1.00 | | saturated zone | | Depth to |1.00 | saturated zone | | | Flooding |1.00 | saturated zone | | Ponding |1.00 | | Ponding |1.00 | | | | | | | | | | | Askecksy, rarely | | | | | | | flooded------------| 35 |Very limited | |Very limited | |Very limited | | | Depth to |1.00 | Ponding |1.00 | Depth to |1.00 | | saturated zone | | Depth to |1.00 | saturated zone | | | Flooding |1.00 | saturated zone | | Ponding |1.00 | | Ponding |1.00 | Too sandy |0.50 | Too sandy |0.50 | | Too sandy |0.50 | | | | | | | | | | | Mullica, rarely | | | | | | | flooded------------| 20 |Very limited | |Very limited | |Very limited | | | Depth to |1.00 | Ponding |1.00 | Depth to |1.00 | | saturated zone | | Depth to |1.00 | saturated zone | | | Flooding |1.00 | saturated zone | | Ponding |1.00 | | Ponding |1.00 | | | | | | | | | | |PHG: | | | | | | | Pits, sand and | | | | | | | gravel-------------|100 |Not rated | |Not rated | |Not rated | | | | | | | |PHM: | | | | | | | Pits, clay----------|100 |Not rated | |Not rated | |Not rated | | | | | | | |SacA: | | | | | | | Sassafras-----------| 80 |Not limited | |Not limited | |Not limited | | | | | | | |SacB: | | | | | | | Sassafras-----------| 80 |Not limited | |Not limited | |Somewhat limited | | | | | | | Slope |0.12 | | | | | | |SacC: | | | | | | | Sassafras-----------| 90 |Not limited | |Not limited | |Very limited | | | | | | | Slope |1.00 | | | | | | |SafA: | | | | | | | Sassafras-----------| 90 |Not limited | |Not limited | |Somewhat limited | | | | | | | Gravel content |0.68 | | | | | | |SanA: | | | | | | | Sassafras-----------| 60 |Not limited | |Not limited | |Not limited | | | | | | | | Woodstown-----------| 40 |Not limited | |Not limited | |Somewhat limited | | | | | | | Gravel content |0.56 | | | | | | |ShnA: | | | | | | | Sharptown-----------| 95 |Somewhat limited | |Somewhat limited | |Somewhat limited | | | Slow water |0.21 | Slow water |0.21 | Slow water |0.21 | | movement | | movement | | movement | | | | | | | |ShnB: | | | | | | | Sharptown-----------| 95 |Somewhat limited | |Somewhat limited | |Somewhat limited | | | Slow water |0.21 | Slow water |0.21 | Slope |0.50 | | movement | | movement | | Slow water |0.21 | | | | | | movement | | | | | | | |
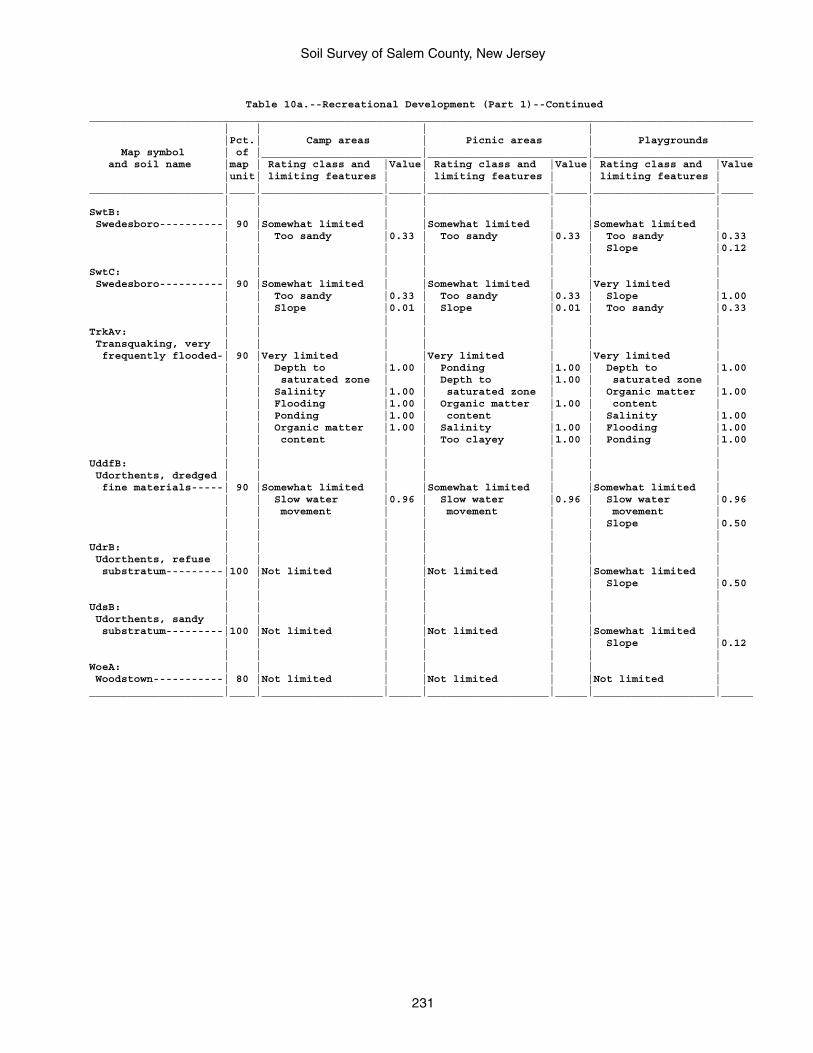
Soil Survey of Salem County, New Jersey
231
Table 10a.--Recreational Development (Part 1)--Continued________________________________________________________________________________________________________ | | | | |Pct.| Camp areas | Picnic areas | Playgrounds Map symbol | of |_________________________|_________________________|_________________________ and soil name |map | Rating class and |Value| Rating class and |Value| Rating class and |Value |unit| limiting features | | limiting features | | limiting features |_____________________|____|___________________|_____|___________________|_____|___________________|_____ | | | | | | |SwtB: | | | | | | | Swedesboro----------| 90 |Somewhat limited | |Somewhat limited | |Somewhat limited | | | Too sandy |0.33 | Too sandy |0.33 | Too sandy |0.33 | | | | | | Slope |0.12 | | | | | | |SwtC: | | | | | | | Swedesboro----------| 90 |Somewhat limited | |Somewhat limited | |Very limited | | | Too sandy |0.33 | Too sandy |0.33 | Slope |1.00 | | Slope |0.01 | Slope |0.01 | Too sandy |0.33 | | | | | | |TrkAv: | | | | | | | Transquaking, very | | | | | | | frequently flooded-| 90 |Very limited | |Very limited | |Very limited | | | Depth to |1.00 | Ponding |1.00 | Depth to |1.00 | | saturated zone | | Depth to |1.00 | saturated zone | | | Salinity |1.00 | saturated zone | | Organic matter |1.00 | | Flooding |1.00 | Organic matter |1.00 | content | | | Ponding |1.00 | content | | Salinity |1.00 | | Organic matter |1.00 | Salinity |1.00 | Flooding |1.00 | | content | | Too clayey |1.00 | Ponding |1.00 | | | | | | |UddfB: | | | | | | | Udorthents, dredged | | | | | | | fine materials-----| 90 |Somewhat limited | |Somewhat limited | |Somewhat limited | | | Slow water |0.96 | Slow water |0.96 | Slow water |0.96 | | movement | | movement | | movement | | | | | | | Slope |0.50 | | | | | | |UdrB: | | | | | | | Udorthents, refuse | | | | | | | substratum---------|100 |Not limited | |Not limited | |Somewhat limited | | | | | | | Slope |0.50 | | | | | | |UdsB: | | | | | | | Udorthents, sandy | | | | | | | substratum---------|100 |Not limited | |Not limited | |Somewhat limited | | | | | | | Slope |0.12 | | | | | | |WoeA: | | | | | | | Woodstown-----------| 80 |Not limited | |Not limited | |Not limited |_____________________|____|___________________|_____|___________________|_____|___________________|_____
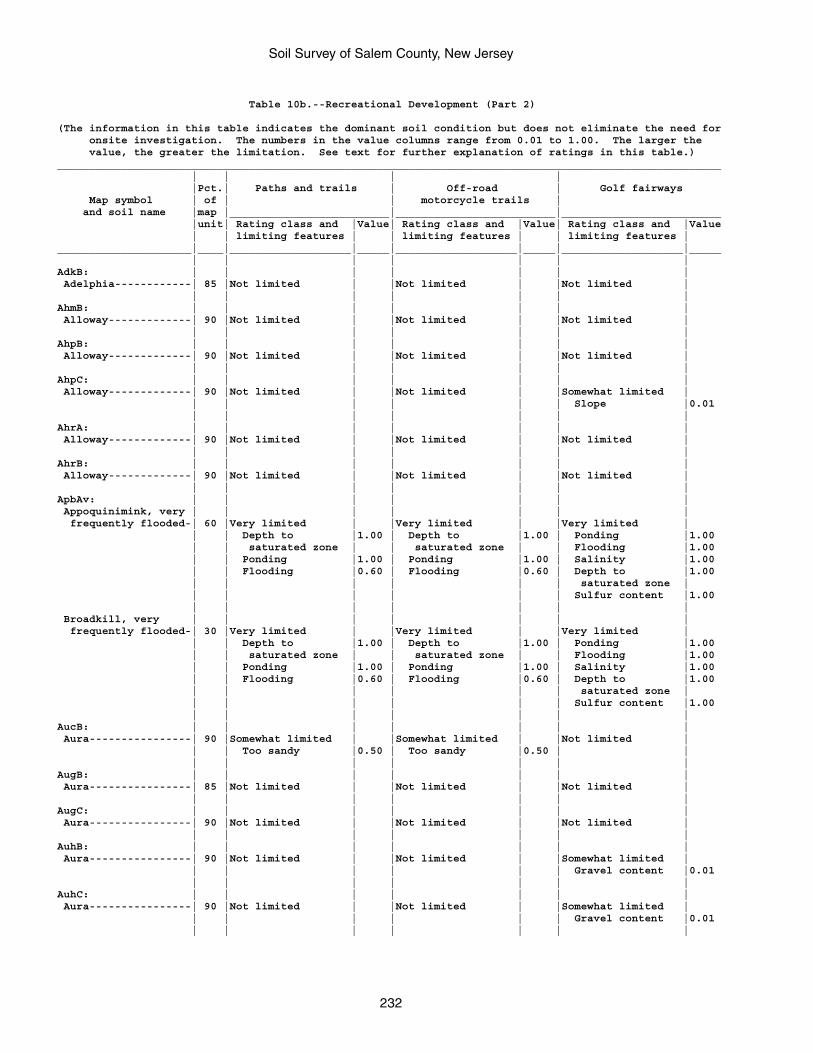
Soil Survey of Salem County, New Jersey
232
Table 10b.--Recreational Development (Part 2)
(The information in this table indicates the dominant soil condition but does not eliminate the need for onsite investigation. The numbers in the value columns range from 0.01 to 1.00. The larger the value, the greater the limitation. See text for further explanation of ratings in this table.)________________________________________________________________________________________________________ | | | | |Pct.| Paths and trails | Off-road | Golf fairways Map symbol | of | | motorcycle trails | and soil name |map |_________________________|_________________________|_________________________ |unit| Rating class and |Value| Rating class and |Value| Rating class and |Value | | limiting features | | limiting features | | limiting features |_____________________|____|___________________|_____|___________________|_____|___________________|_____ | | | | | | |AdkB: | | | | | | | Adelphia------------| 85 |Not limited | |Not limited | |Not limited | | | | | | | |AhmB: | | | | | | | Alloway-------------| 90 |Not limited | |Not limited | |Not limited | | | | | | | |AhpB: | | | | | | | Alloway-------------| 90 |Not limited | |Not limited | |Not limited | | | | | | | |AhpC: | | | | | | | Alloway-------------| 90 |Not limited | |Not limited | |Somewhat limited | | | | | | | Slope |0.01 | | | | | | |AhrA: | | | | | | | Alloway-------------| 90 |Not limited | |Not limited | |Not limited | | | | | | | |AhrB: | | | | | | | Alloway-------------| 90 |Not limited | |Not limited | |Not limited | | | | | | | |ApbAv: | | | | | | | Appoquinimink, very | | | | | | | frequently flooded-| 60 |Very limited | |Very limited | |Very limited | | | Depth to |1.00 | Depth to |1.00 | Ponding |1.00 | | saturated zone | | saturated zone | | Flooding |1.00 | | Ponding |1.00 | Ponding |1.00 | Salinity |1.00 | | Flooding |0.60 | Flooding |0.60 | Depth to |1.00 | | | | | | saturated zone | | | | | | | Sulfur content |1.00 | | | | | | | Broadkill, very | | | | | | | frequently flooded-| 30 |Very limited | |Very limited | |Very limited | | | Depth to |1.00 | Depth to |1.00 | Ponding |1.00 | | saturated zone | | saturated zone | | Flooding |1.00 | | Ponding |1.00 | Ponding |1.00 | Salinity |1.00 | | Flooding |0.60 | Flooding |0.60 | Depth to |1.00 | | | | | | saturated zone | | | | | | | Sulfur content |1.00 | | | | | | |AucB: | | | | | | | Aura----------------| 90 |Somewhat limited | |Somewhat limited | |Not limited | | | Too sandy |0.50 | Too sandy |0.50 | | | | | | | | |AugB: | | | | | | | Aura----------------| 85 |Not limited | |Not limited | |Not limited | | | | | | | |AugC: | | | | | | | Aura----------------| 90 |Not limited | |Not limited | |Not limited | | | | | | | |AuhB: | | | | | | | Aura----------------| 90 |Not limited | |Not limited | |Somewhat limited | | | | | | | Gravel content |0.01 | | | | | | |AuhC: | | | | | | | Aura----------------| 90 |Not limited | |Not limited | |Somewhat limited | | | | | | | Gravel content |0.01 | | | | | | |
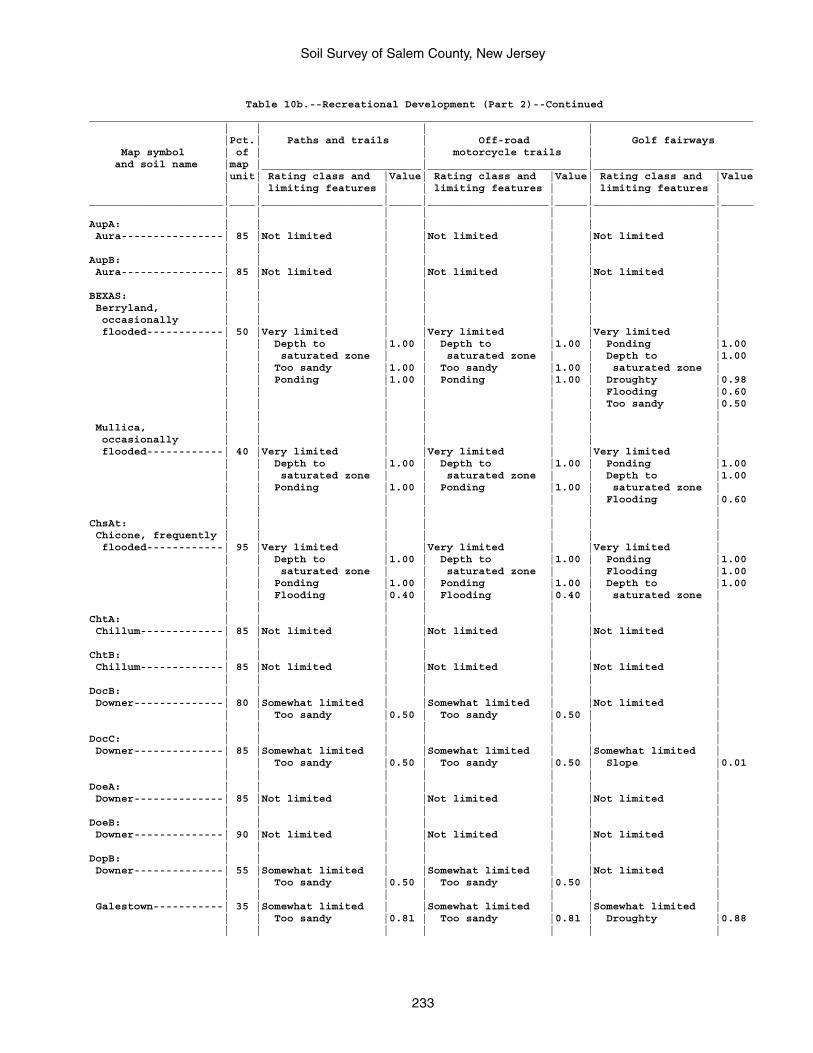
Soil Survey of Salem County, New Jersey
233
Table 10b.--Recreational Development (Part 2)--Continued________________________________________________________________________________________________________ | | | | |Pct.| Paths and trails | Off-road | Golf fairways Map symbol | of | | motorcycle trails | and soil name |map |_________________________|_________________________|_________________________ |unit| Rating class and |Value| Rating class and |Value| Rating class and |Value | | limiting features | | limiting features | | limiting features |_____________________|____|___________________|_____|___________________|_____|___________________|_____ | | | | | | |AupA: | | | | | | | Aura----------------| 85 |Not limited | |Not limited | |Not limited | | | | | | | |AupB: | | | | | | | Aura----------------| 85 |Not limited | |Not limited | |Not limited | | | | | | | |BEXAS: | | | | | | | Berryland, | | | | | | | occasionally | | | | | | | flooded------------| 50 |Very limited | |Very limited | |Very limited | | | Depth to |1.00 | Depth to |1.00 | Ponding |1.00 | | saturated zone | | saturated zone | | Depth to |1.00 | | Too sandy |1.00 | Too sandy |1.00 | saturated zone | | | Ponding |1.00 | Ponding |1.00 | Droughty |0.98 | | | | | | Flooding |0.60 | | | | | | Too sandy |0.50 | | | | | | | Mullica, | | | | | | | occasionally | | | | | | | flooded------------| 40 |Very limited | |Very limited | |Very limited | | | Depth to |1.00 | Depth to |1.00 | Ponding |1.00 | | saturated zone | | saturated zone | | Depth to |1.00 | | Ponding |1.00 | Ponding |1.00 | saturated zone | | | | | | | Flooding |0.60 | | | | | | |ChsAt: | | | | | | | Chicone, frequently | | | | | | | flooded------------| 95 |Very limited | |Very limited | |Very limited | | | Depth to |1.00 | Depth to |1.00 | Ponding |1.00 | | saturated zone | | saturated zone | | Flooding |1.00 | | Ponding |1.00 | Ponding |1.00 | Depth to |1.00 | | Flooding |0.40 | Flooding |0.40 | saturated zone | | | | | | | |ChtA: | | | | | | | Chillum-------------| 85 |Not limited | |Not limited | |Not limited | | | | | | | |ChtB: | | | | | | | Chillum-------------| 85 |Not limited | |Not limited | |Not limited | | | | | | | |DocB: | | | | | | | Downer--------------| 80 |Somewhat limited | |Somewhat limited | |Not limited | | | Too sandy |0.50 | Too sandy |0.50 | | | | | | | | |DocC: | | | | | | | Downer--------------| 85 |Somewhat limited | |Somewhat limited | |Somewhat limited | | | Too sandy |0.50 | Too sandy |0.50 | Slope |0.01 | | | | | | |DoeA: | | | | | | | Downer--------------| 85 |Not limited | |Not limited | |Not limited | | | | | | | |DoeB: | | | | | | | Downer--------------| 90 |Not limited | |Not limited | |Not limited | | | | | | | |DopB: | | | | | | | Downer--------------| 55 |Somewhat limited | |Somewhat limited | |Not limited | | | Too sandy |0.50 | Too sandy |0.50 | | | | | | | | | Galestown-----------| 35 |Somewhat limited | |Somewhat limited | |Somewhat limited | | | Too sandy |0.81 | Too sandy |0.81 | Droughty |0.88 | | | | | | |
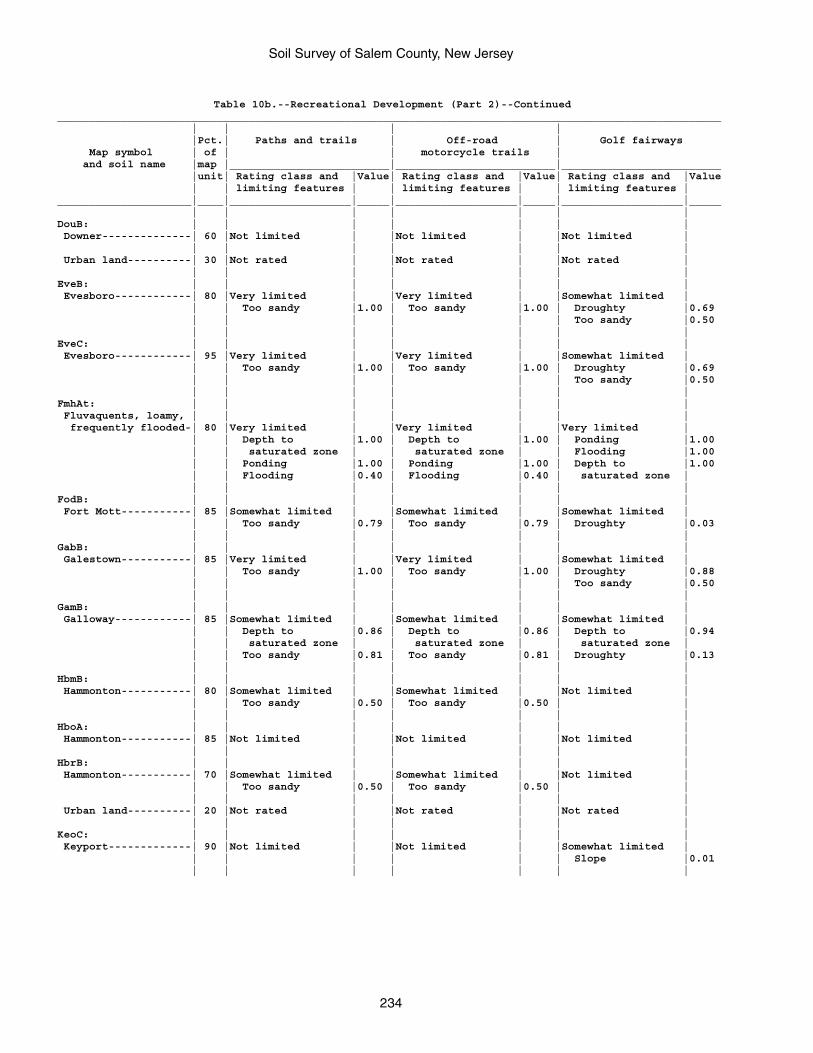
Soil Survey of Salem County, New Jersey
234
Table 10b.--Recreational Development (Part 2)--Continued________________________________________________________________________________________________________ | | | | |Pct.| Paths and trails | Off-road | Golf fairways Map symbol | of | | motorcycle trails | and soil name |map |_________________________|_________________________|_________________________ |unit| Rating class and |Value| Rating class and |Value| Rating class and |Value | | limiting features | | limiting features | | limiting features |_____________________|____|___________________|_____|___________________|_____|___________________|_____ | | | | | | |DouB: | | | | | | | Downer--------------| 60 |Not limited | |Not limited | |Not limited | | | | | | | | Urban land----------| 30 |Not rated | |Not rated | |Not rated | | | | | | | |EveB: | | | | | | | Evesboro------------| 80 |Very limited | |Very limited | |Somewhat limited | | | Too sandy |1.00 | Too sandy |1.00 | Droughty |0.69 | | | | | | Too sandy |0.50 | | | | | | |EveC: | | | | | | | Evesboro------------| 95 |Very limited | |Very limited | |Somewhat limited | | | Too sandy |1.00 | Too sandy |1.00 | Droughty |0.69 | | | | | | Too sandy |0.50 | | | | | | |FmhAt: | | | | | | | Fluvaquents, loamy, | | | | | | | frequently flooded-| 80 |Very limited | |Very limited | |Very limited | | | Depth to |1.00 | Depth to |1.00 | Ponding |1.00 | | saturated zone | | saturated zone | | Flooding |1.00 | | Ponding |1.00 | Ponding |1.00 | Depth to |1.00 | | Flooding |0.40 | Flooding |0.40 | saturated zone | | | | | | | |FodB: | | | | | | | Fort Mott-----------| 85 |Somewhat limited | |Somewhat limited | |Somewhat limited | | | Too sandy |0.79 | Too sandy |0.79 | Droughty |0.03 | | | | | | |GabB: | | | | | | | Galestown-----------| 85 |Very limited | |Very limited | |Somewhat limited | | | Too sandy |1.00 | Too sandy |1.00 | Droughty |0.88 | | | | | | Too sandy |0.50 | | | | | | |GamB: | | | | | | | Galloway------------| 85 |Somewhat limited | |Somewhat limited | |Somewhat limited | | | Depth to |0.86 | Depth to |0.86 | Depth to |0.94 | | saturated zone | | saturated zone | | saturated zone | | | Too sandy |0.81 | Too sandy |0.81 | Droughty |0.13 | | | | | | |HbmB: | | | | | | | Hammonton-----------| 80 |Somewhat limited | |Somewhat limited | |Not limited | | | Too sandy |0.50 | Too sandy |0.50 | | | | | | | | |HboA: | | | | | | | Hammonton-----------| 85 |Not limited | |Not limited | |Not limited | | | | | | | |HbrB: | | | | | | | Hammonton-----------| 70 |Somewhat limited | |Somewhat limited | |Not limited | | | Too sandy |0.50 | Too sandy |0.50 | | | | | | | | | Urban land----------| 20 |Not rated | |Not rated | |Not rated | | | | | | | |KeoC: | | | | | | | Keyport-------------| 90 |Not limited | |Not limited | |Somewhat limited | | | | | | | Slope |0.01 | | | | | | |
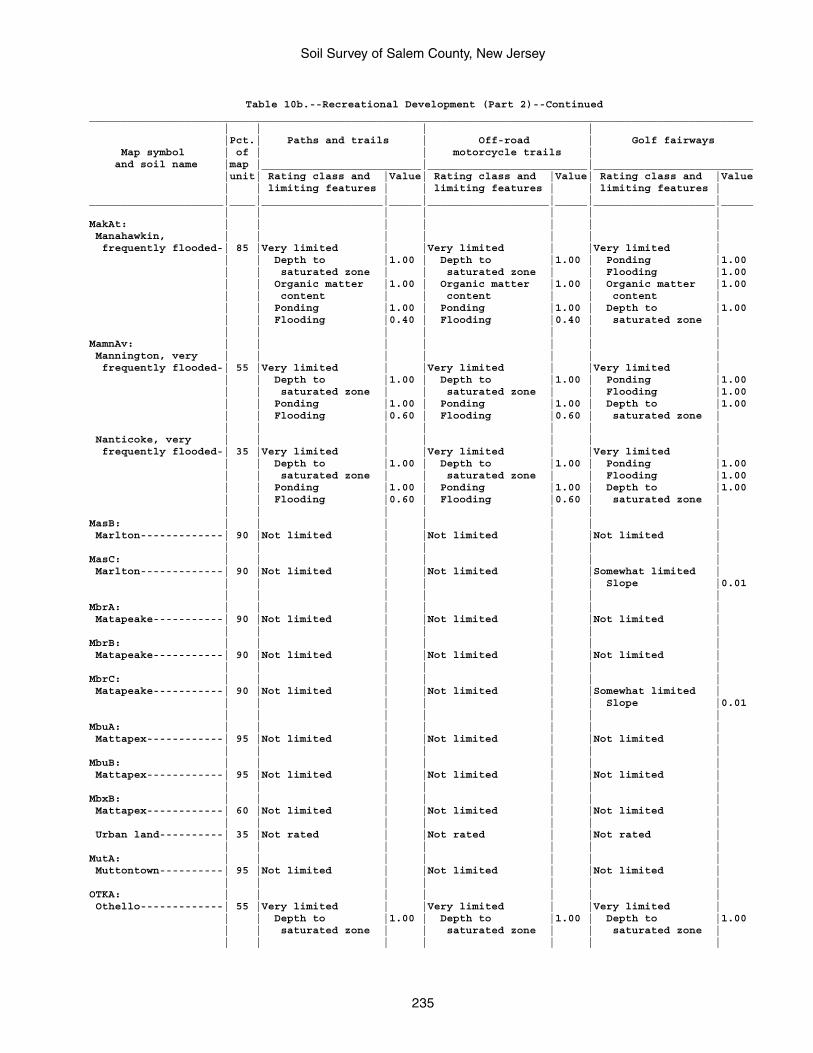
Soil Survey of Salem County, New Jersey
235
Table 10b.--Recreational Development (Part 2)--Continued________________________________________________________________________________________________________ | | | | |Pct.| Paths and trails | Off-road | Golf fairways Map symbol | of | | motorcycle trails | and soil name |map |_________________________|_________________________|_________________________ |unit| Rating class and |Value| Rating class and |Value| Rating class and |Value | | limiting features | | limiting features | | limiting features |_____________________|____|___________________|_____|___________________|_____|___________________|_____ | | | | | | |MakAt: | | | | | | | Manahawkin, | | | | | | | frequently flooded-| 85 |Very limited | |Very limited | |Very limited | | | Depth to |1.00 | Depth to |1.00 | Ponding |1.00 | | saturated zone | | saturated zone | | Flooding |1.00 | | Organic matter |1.00 | Organic matter |1.00 | Organic matter |1.00 | | content | | content | | content | | | Ponding |1.00 | Ponding |1.00 | Depth to |1.00 | | Flooding |0.40 | Flooding |0.40 | saturated zone | | | | | | | |MamnAv: | | | | | | | Mannington, very | | | | | | | frequently flooded-| 55 |Very limited | |Very limited | |Very limited | | | Depth to |1.00 | Depth to |1.00 | Ponding |1.00 | | saturated zone | | saturated zone | | Flooding |1.00 | | Ponding |1.00 | Ponding |1.00 | Depth to |1.00 | | Flooding |0.60 | Flooding |0.60 | saturated zone | | | | | | | | Nanticoke, very | | | | | | | frequently flooded-| 35 |Very limited | |Very limited | |Very limited | | | Depth to |1.00 | Depth to |1.00 | Ponding |1.00 | | saturated zone | | saturated zone | | Flooding |1.00 | | Ponding |1.00 | Ponding |1.00 | Depth to |1.00 | | Flooding |0.60 | Flooding |0.60 | saturated zone | | | | | | | |MasB: | | | | | | | Marlton-------------| 90 |Not limited | |Not limited | |Not limited | | | | | | | |MasC: | | | | | | | Marlton-------------| 90 |Not limited | |Not limited | |Somewhat limited | | | | | | | Slope |0.01 | | | | | | |MbrA: | | | | | | | Matapeake-----------| 90 |Not limited | |Not limited | |Not limited | | | | | | | |MbrB: | | | | | | | Matapeake-----------| 90 |Not limited | |Not limited | |Not limited | | | | | | | |MbrC: | | | | | | | Matapeake-----------| 90 |Not limited | |Not limited | |Somewhat limited | | | | | | | Slope |0.01 | | | | | | |MbuA: | | | | | | | Mattapex------------| 95 |Not limited | |Not limited | |Not limited | | | | | | | |MbuB: | | | | | | | Mattapex------------| 95 |Not limited | |Not limited | |Not limited | | | | | | | |MbxB: | | | | | | | Mattapex------------| 60 |Not limited | |Not limited | |Not limited | | | | | | | | Urban land----------| 35 |Not rated | |Not rated | |Not rated | | | | | | | |MutA: | | | | | | | Muttontown----------| 95 |Not limited | |Not limited | |Not limited | | | | | | | |OTKA: | | | | | | | Othello-------------| 55 |Very limited | |Very limited | |Very limited | | | Depth to |1.00 | Depth to |1.00 | Depth to |1.00 | | saturated zone | | saturated zone | | saturated zone | | | | | | | |
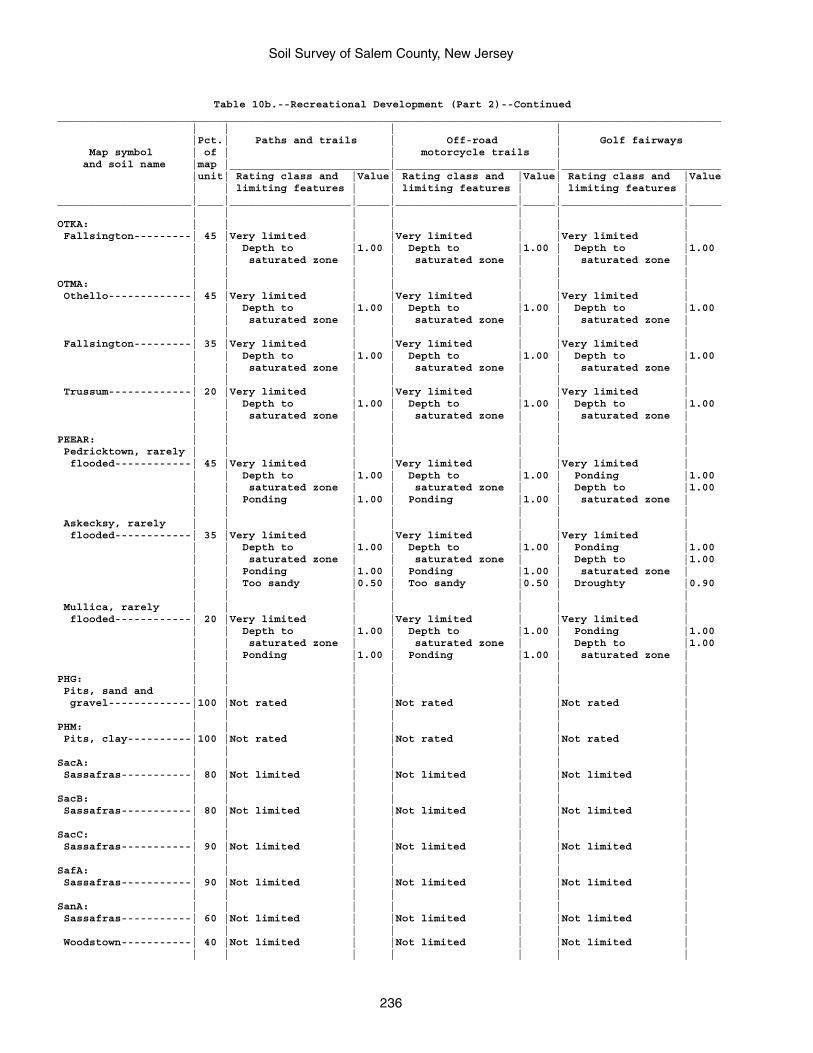
Soil Survey of Salem County, New Jersey
236
Table 10b.--Recreational Development (Part 2)--Continued________________________________________________________________________________________________________ | | | | |Pct.| Paths and trails | Off-road | Golf fairways Map symbol | of | | motorcycle trails | and soil name |map |_________________________|_________________________|_________________________ |unit| Rating class and |Value| Rating class and |Value| Rating class and |Value | | limiting features | | limiting features | | limiting features |_____________________|____|___________________|_____|___________________|_____|___________________|_____ | | | | | | |OTKA: | | | | | | | Fallsington---------| 45 |Very limited | |Very limited | |Very limited | | | Depth to |1.00 | Depth to |1.00 | Depth to |1.00 | | saturated zone | | saturated zone | | saturated zone | | | | | | | |OTMA: | | | | | | | Othello-------------| 45 |Very limited | |Very limited | |Very limited | | | Depth to |1.00 | Depth to |1.00 | Depth to |1.00 | | saturated zone | | saturated zone | | saturated zone | | | | | | | | Fallsington---------| 35 |Very limited | |Very limited | |Very limited | | | Depth to |1.00 | Depth to |1.00 | Depth to |1.00 | | saturated zone | | saturated zone | | saturated zone | | | | | | | | Trussum-------------| 20 |Very limited | |Very limited | |Very limited | | | Depth to |1.00 | Depth to |1.00 | Depth to |1.00 | | saturated zone | | saturated zone | | saturated zone | | | | | | | |PEEAR: | | | | | | | Pedricktown, rarely | | | | | | | flooded------------| 45 |Very limited | |Very limited | |Very limited | | | Depth to |1.00 | Depth to |1.00 | Ponding |1.00 | | saturated zone | | saturated zone | | Depth to |1.00 | | Ponding |1.00 | Ponding |1.00 | saturated zone | | | | | | | | Askecksy, rarely | | | | | | | flooded------------| 35 |Very limited | |Very limited | |Very limited | | | Depth to |1.00 | Depth to |1.00 | Ponding |1.00 | | saturated zone | | saturated zone | | Depth to |1.00 | | Ponding |1.00 | Ponding |1.00 | saturated zone | | | Too sandy |0.50 | Too sandy |0.50 | Droughty |0.90 | | | | | | | Mullica, rarely | | | | | | | flooded------------| 20 |Very limited | |Very limited | |Very limited | | | Depth to |1.00 | Depth to |1.00 | Ponding |1.00 | | saturated zone | | saturated zone | | Depth to |1.00 | | Ponding |1.00 | Ponding |1.00 | saturated zone | | | | | | | |PHG: | | | | | | | Pits, sand and | | | | | | | gravel-------------|100 |Not rated | |Not rated | |Not rated | | | | | | | |PHM: | | | | | | | Pits, clay----------|100 |Not rated | |Not rated | |Not rated | | | | | | | |SacA: | | | | | | | Sassafras-----------| 80 |Not limited | |Not limited | |Not limited | | | | | | | |SacB: | | | | | | | Sassafras-----------| 80 |Not limited | |Not limited | |Not limited | | | | | | | |SacC: | | | | | | | Sassafras-----------| 90 |Not limited | |Not limited | |Not limited | | | | | | | |SafA: | | | | | | | Sassafras-----------| 90 |Not limited | |Not limited | |Not limited | | | | | | | |SanA: | | | | | | | Sassafras-----------| 60 |Not limited | |Not limited | |Not limited | | | | | | | | Woodstown-----------| 40 |Not limited | |Not limited | |Not limited | | | | | | | |
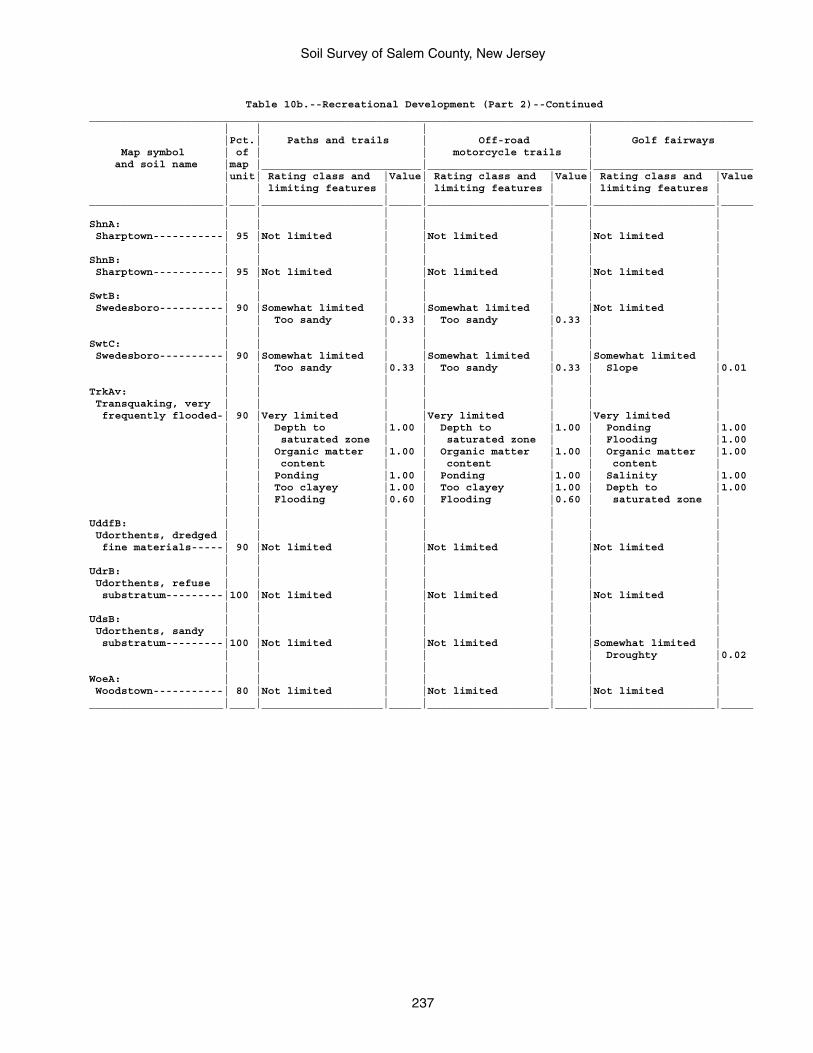
Soil Survey of Salem County, New Jersey
237
Table 10b.--Recreational Development (Part 2)--Continued________________________________________________________________________________________________________ | | | | |Pct.| Paths and trails | Off-road | Golf fairways Map symbol | of | | motorcycle trails | and soil name |map |_________________________|_________________________|_________________________ |unit| Rating class and |Value| Rating class and |Value| Rating class and |Value | | limiting features | | limiting features | | limiting features |_____________________|____|___________________|_____|___________________|_____|___________________|_____ | | | | | | |ShnA: | | | | | | | Sharptown-----------| 95 |Not limited | |Not limited | |Not limited | | | | | | | |ShnB: | | | | | | | Sharptown-----------| 95 |Not limited | |Not limited | |Not limited | | | | | | | |SwtB: | | | | | | | Swedesboro----------| 90 |Somewhat limited | |Somewhat limited | |Not limited | | | Too sandy |0.33 | Too sandy |0.33 | | | | | | | | |SwtC: | | | | | | | Swedesboro----------| 90 |Somewhat limited | |Somewhat limited | |Somewhat limited | | | Too sandy |0.33 | Too sandy |0.33 | Slope |0.01 | | | | | | |TrkAv: | | | | | | | Transquaking, very | | | | | | | frequently flooded-| 90 |Very limited | |Very limited | |Very limited | | | Depth to |1.00 | Depth to |1.00 | Ponding |1.00 | | saturated zone | | saturated zone | | Flooding |1.00 | | Organic matter |1.00 | Organic matter |1.00 | Organic matter |1.00 | | content | | content | | content | | | Ponding |1.00 | Ponding |1.00 | Salinity |1.00 | | Too clayey |1.00 | Too clayey |1.00 | Depth to |1.00 | | Flooding |0.60 | Flooding |0.60 | saturated zone | | | | | | | |UddfB: | | | | | | | Udorthents, dredged | | | | | | | fine materials-----| 90 |Not limited | |Not limited | |Not limited | | | | | | | |UdrB: | | | | | | | Udorthents, refuse | | | | | | | substratum---------|100 |Not limited | |Not limited | |Not limited | | | | | | | |UdsB: | | | | | | | Udorthents, sandy | | | | | | | substratum---------|100 |Not limited | |Not limited | |Somewhat limited | | | | | | | Droughty |0.02 | | | | | | |WoeA: | | | | | | | Woodstown-----------| 80 |Not limited | |Not limited | |Not limited |_____________________|____|___________________|_____|___________________|_____|___________________|_____
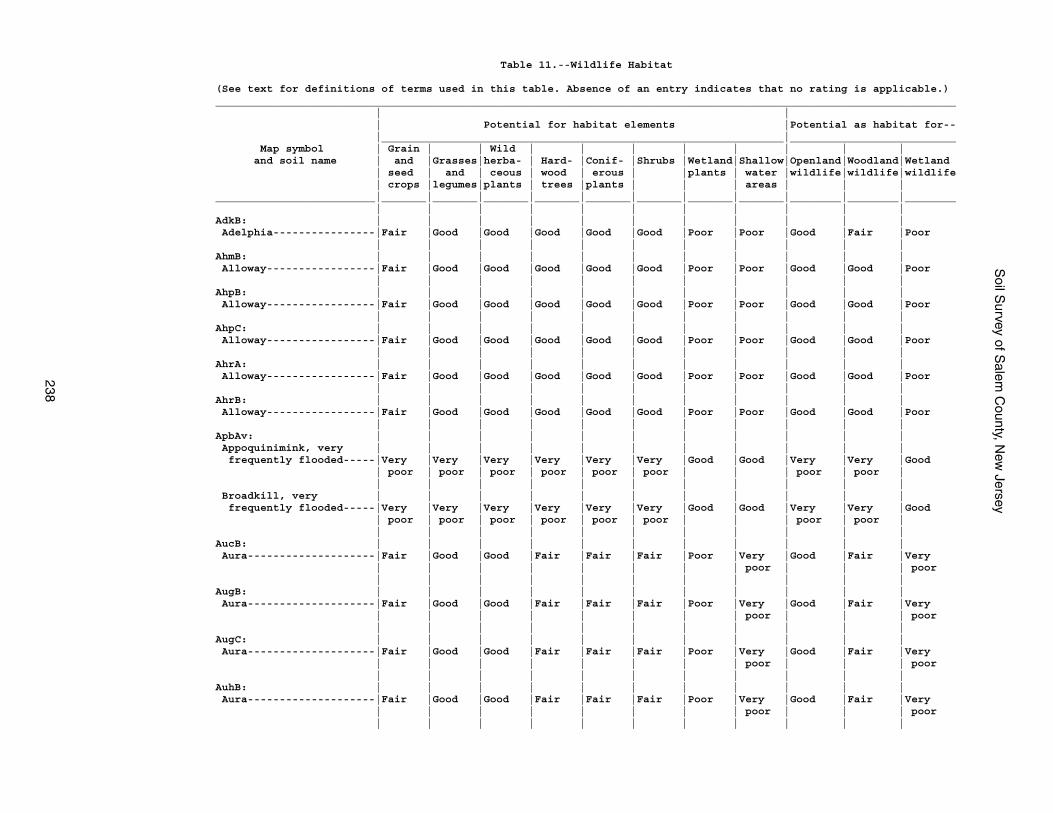
Soil S
urvey of Salem
County, N
ew Jersey
238
Table 11.--Wildlife Habitat
(See text for definitions of terms used in this table. Absence of an entry indicates that no rating is applicable.)____________________________________________________________________________________________________________________ | | | Potential for habitat elements |Potential as habitat for-- |_______________________________________________________________|__________________________ Map symbol | Grain | | Wild | | | | | | | | and soil name | and |Grasses|herba- | Hard- |Conif- |Shrubs |Wetland|Shallow|Openland|Woodland|Wetland | seed | and | ceous | wood | erous | |plants | water |wildlife|wildlife|wildlife | crops |legumes|plants | trees |plants | | | areas | | |_________________________|_______|_______|_______|_______|_______|_______|_______|_______|________|________|________ | | | | | | | | | | |AdkB: | | | | | | | | | | | Adelphia----------------|Fair |Good |Good |Good |Good |Good |Poor |Poor |Good |Fair |Poor | | | | | | | | | | |AhmB: | | | | | | | | | | | Alloway-----------------|Fair |Good |Good |Good |Good |Good |Poor |Poor |Good |Good |Poor | | | | | | | | | | |AhpB: | | | | | | | | | | | Alloway-----------------|Fair |Good |Good |Good |Good |Good |Poor |Poor |Good |Good |Poor | | | | | | | | | | |AhpC: | | | | | | | | | | | Alloway-----------------|Fair |Good |Good |Good |Good |Good |Poor |Poor |Good |Good |Poor | | | | | | | | | | |AhrA: | | | | | | | | | | | Alloway-----------------|Fair |Good |Good |Good |Good |Good |Poor |Poor |Good |Good |Poor | | | | | | | | | | |AhrB: | | | | | | | | | | | Alloway-----------------|Fair |Good |Good |Good |Good |Good |Poor |Poor |Good |Good |Poor | | | | | | | | | | |ApbAv: | | | | | | | | | | | Appoquinimink, very | | | | | | | | | | | frequently flooded-----|Very |Very |Very |Very |Very |Very |Good |Good |Very |Very |Good | poor | poor | poor | poor | poor | poor | | | poor | poor | | | | | | | | | | | | Broadkill, very | | | | | | | | | | | frequently flooded-----|Very |Very |Very |Very |Very |Very |Good |Good |Very |Very |Good | poor | poor | poor | poor | poor | poor | | | poor | poor | | | | | | | | | | | |AucB: | | | | | | | | | | | Aura--------------------|Fair |Good |Good |Fair |Fair |Fair |Poor |Very |Good |Fair |Very | | | | | | | | poor | | | poor | | | | | | | | | | |AugB: | | | | | | | | | | | Aura--------------------|Fair |Good |Good |Fair |Fair |Fair |Poor |Very |Good |Fair |Very | | | | | | | | poor | | | poor | | | | | | | | | | |AugC: | | | | | | | | | | | Aura--------------------|Fair |Good |Good |Fair |Fair |Fair |Poor |Very |Good |Fair |Very | | | | | | | | poor | | | poor | | | | | | | | | | |AuhB: | | | | | | | | | | | Aura--------------------|Fair |Good |Good |Fair |Fair |Fair |Poor |Very |Good |Fair |Very | | | | | | | | poor | | | poor | | | | | | | | | | |
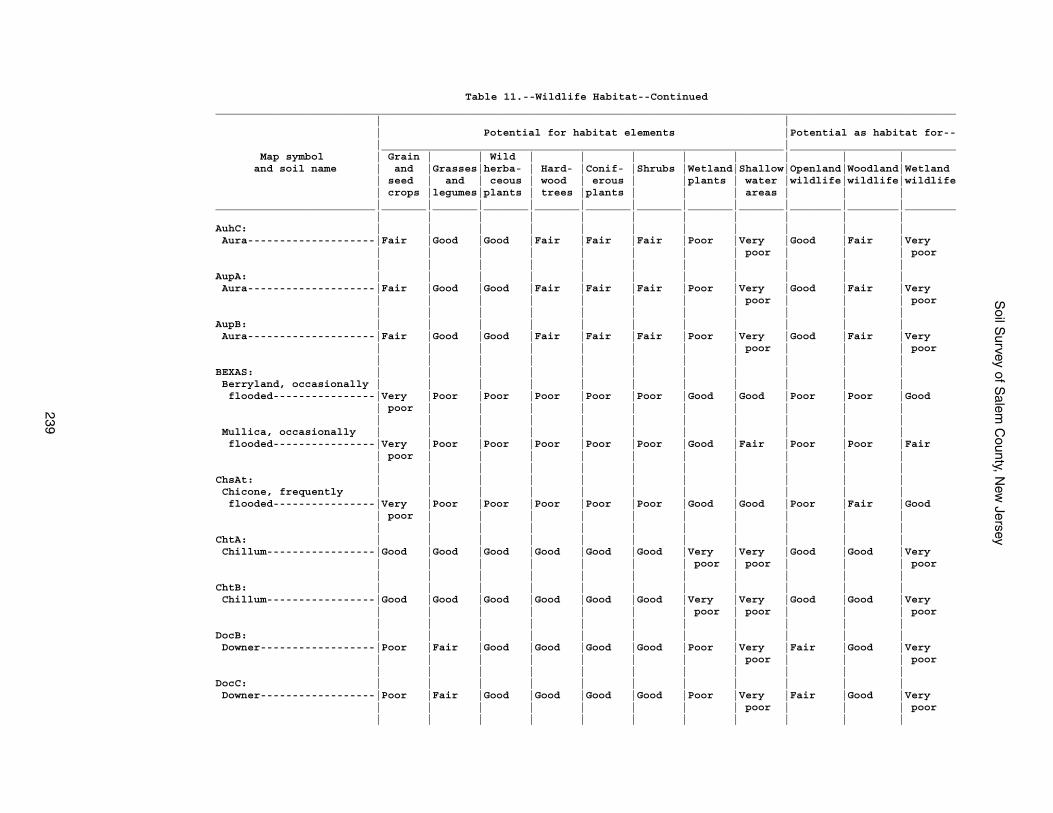
Soil S
urvey of Salem
County, N
ew Jersey
239
Table 11.--Wildlife Habitat--Continued____________________________________________________________________________________________________________________ | | | Potential for habitat elements |Potential as habitat for-- |_______________________________________________________________|__________________________ Map symbol | Grain | | Wild | | | | | | | | and soil name | and |Grasses|herba- | Hard- |Conif- |Shrubs |Wetland|Shallow|Openland|Woodland|Wetland | seed | and | ceous | wood | erous | |plants | water |wildlife|wildlife|wildlife | crops |legumes|plants | trees |plants | | | areas | | |_________________________|_______|_______|_______|_______|_______|_______|_______|_______|________|________|________ | | | | | | | | | | |AuhC: | | | | | | | | | | | Aura--------------------|Fair |Good |Good |Fair |Fair |Fair |Poor |Very |Good |Fair |Very | | | | | | | | poor | | | poor | | | | | | | | | | |AupA: | | | | | | | | | | | Aura--------------------|Fair |Good |Good |Fair |Fair |Fair |Poor |Very |Good |Fair |Very | | | | | | | | poor | | | poor | | | | | | | | | | |AupB: | | | | | | | | | | | Aura--------------------|Fair |Good |Good |Fair |Fair |Fair |Poor |Very |Good |Fair |Very | | | | | | | | poor | | | poor | | | | | | | | | | |BEXAS: | | | | | | | | | | | Berryland, occasionally | | | | | | | | | | | flooded----------------|Very |Poor |Poor |Poor |Poor |Poor |Good |Good |Poor |Poor |Good | poor | | | | | | | | | | | | | | | | | | | | | Mullica, occasionally | | | | | | | | | | | flooded----------------|Very |Poor |Poor |Poor |Poor |Poor |Good |Fair |Poor |Poor |Fair | poor | | | | | | | | | | | | | | | | | | | | |ChsAt: | | | | | | | | | | | Chicone, frequently | | | | | | | | | | | flooded----------------|Very |Poor |Poor |Poor |Poor |Poor |Good |Good |Poor |Fair |Good | poor | | | | | | | | | | | | | | | | | | | | |ChtA: | | | | | | | | | | | Chillum-----------------|Good |Good |Good |Good |Good |Good |Very |Very |Good |Good |Very | | | | | | | poor | poor | | | poor | | | | | | | | | | |ChtB: | | | | | | | | | | | Chillum-----------------|Good |Good |Good |Good |Good |Good |Very |Very |Good |Good |Very | | | | | | | poor | poor | | | poor | | | | | | | | | | |DocB: | | | | | | | | | | | Downer------------------|Poor |Fair |Good |Good |Good |Good |Poor |Very |Fair |Good |Very | | | | | | | | poor | | | poor | | | | | | | | | | |DocC: | | | | | | | | | | | Downer------------------|Poor |Fair |Good |Good |Good |Good |Poor |Very |Fair |Good |Very | | | | | | | | poor | | | poor | | | | | | | | | | |
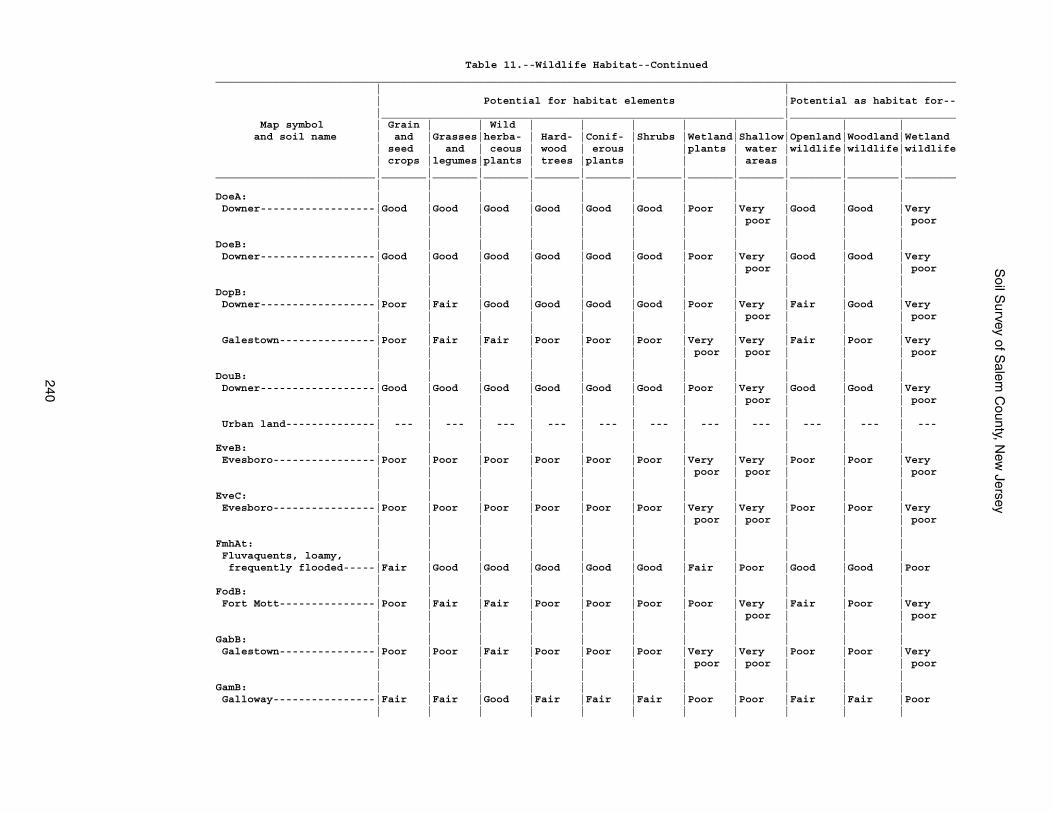
Soil S
urvey of Salem
County, N
ew Jersey
240
Table 11.--Wildlife Habitat--Continued____________________________________________________________________________________________________________________ | | | Potential for habitat elements |Potential as habitat for-- |_______________________________________________________________|__________________________ Map symbol | Grain | | Wild | | | | | | | | and soil name | and |Grasses|herba- | Hard- |Conif- |Shrubs |Wetland|Shallow|Openland|Woodland|Wetland | seed | and | ceous | wood | erous | |plants | water |wildlife|wildlife|wildlife | crops |legumes|plants | trees |plants | | | areas | | |_________________________|_______|_______|_______|_______|_______|_______|_______|_______|________|________|________ | | | | | | | | | | |DoeA: | | | | | | | | | | | Downer------------------|Good |Good |Good |Good |Good |Good |Poor |Very |Good |Good |Very | | | | | | | | poor | | | poor | | | | | | | | | | |DoeB: | | | | | | | | | | | Downer------------------|Good |Good |Good |Good |Good |Good |Poor |Very |Good |Good |Very | | | | | | | | poor | | | poor | | | | | | | | | | |DopB: | | | | | | | | | | | Downer------------------|Poor |Fair |Good |Good |Good |Good |Poor |Very |Fair |Good |Very | | | | | | | | poor | | | poor | | | | | | | | | | | Galestown---------------|Poor |Fair |Fair |Poor |Poor |Poor |Very |Very |Fair |Poor |Very | | | | | | | poor | poor | | | poor | | | | | | | | | | |DouB: | | | | | | | | | | | Downer------------------|Good |Good |Good |Good |Good |Good |Poor |Very |Good |Good |Very | | | | | | | | poor | | | poor | | | | | | | | | | | Urban land--------------| --- | --- | --- | --- | --- | --- | --- | --- | --- | --- | --- | | | | | | | | | | |EveB: | | | | | | | | | | | Evesboro----------------|Poor |Poor |Poor |Poor |Poor |Poor |Very |Very |Poor |Poor |Very | | | | | | | poor | poor | | | poor | | | | | | | | | | |EveC: | | | | | | | | | | | Evesboro----------------|Poor |Poor |Poor |Poor |Poor |Poor |Very |Very |Poor |Poor |Very | | | | | | | poor | poor | | | poor | | | | | | | | | | |FmhAt: | | | | | | | | | | | Fluvaquents, loamy, | | | | | | | | | | | frequently flooded-----|Fair |Good |Good |Good |Good |Good |Fair |Poor |Good |Good |Poor | | | | | | | | | | |FodB: | | | | | | | | | | | Fort Mott---------------|Poor |Fair |Fair |Poor |Poor |Poor |Poor |Very |Fair |Poor |Very | | | | | | | | poor | | | poor | | | | | | | | | | |GabB: | | | | | | | | | | | Galestown---------------|Poor |Poor |Fair |Poor |Poor |Poor |Very |Very |Poor |Poor |Very | | | | | | | poor | poor | | | poor | | | | | | | | | | |GamB: | | | | | | | | | | | Galloway----------------|Fair |Fair |Good |Fair |Fair |Fair |Poor |Poor |Fair |Fair |Poor | | | | | | | | | | |
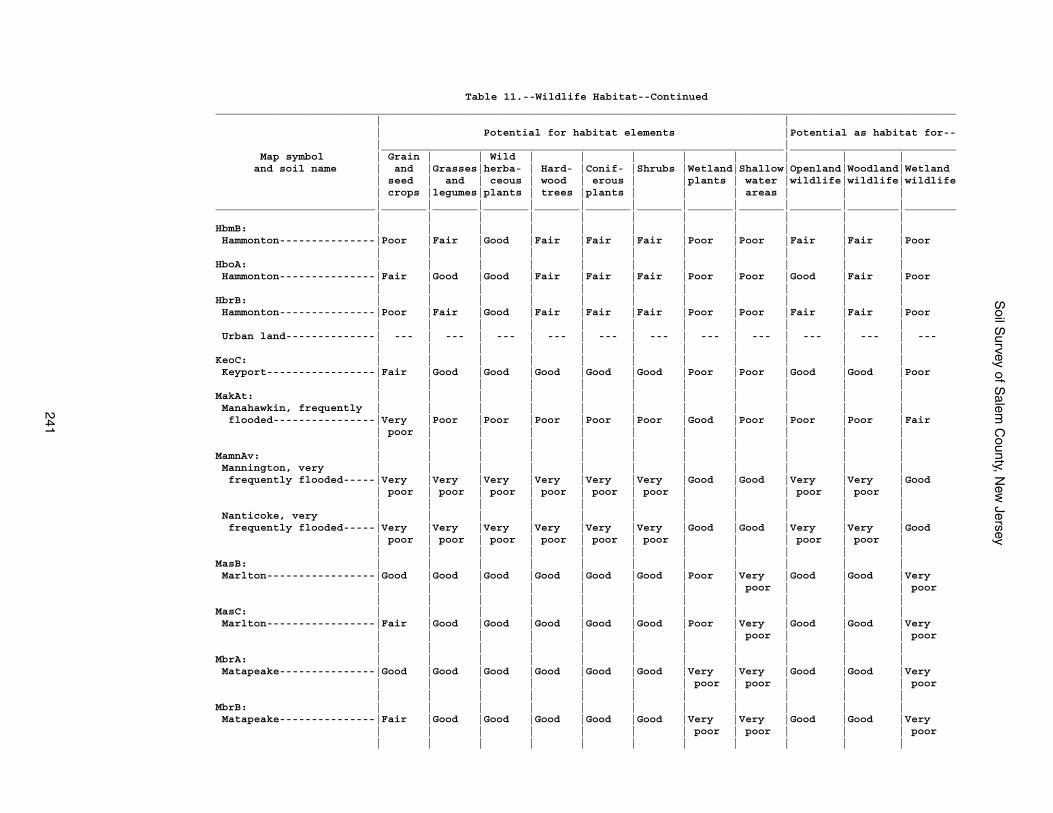
Soil S
urvey of Salem
County, N
ew Jersey
241
Table 11.--Wildlife Habitat--Continued____________________________________________________________________________________________________________________ | | | Potential for habitat elements |Potential as habitat for-- |_______________________________________________________________|__________________________ Map symbol | Grain | | Wild | | | | | | | | and soil name | and |Grasses|herba- | Hard- |Conif- |Shrubs |Wetland|Shallow|Openland|Woodland|Wetland | seed | and | ceous | wood | erous | |plants | water |wildlife|wildlife|wildlife | crops |legumes|plants | trees |plants | | | areas | | |_________________________|_______|_______|_______|_______|_______|_______|_______|_______|________|________|________ | | | | | | | | | | |HbmB: | | | | | | | | | | | Hammonton---------------|Poor |Fair |Good |Fair |Fair |Fair |Poor |Poor |Fair |Fair |Poor | | | | | | | | | | |HboA: | | | | | | | | | | | Hammonton---------------|Fair |Good |Good |Fair |Fair |Fair |Poor |Poor |Good |Fair |Poor | | | | | | | | | | |HbrB: | | | | | | | | | | | Hammonton---------------|Poor |Fair |Good |Fair |Fair |Fair |Poor |Poor |Fair |Fair |Poor | | | | | | | | | | | Urban land--------------| --- | --- | --- | --- | --- | --- | --- | --- | --- | --- | --- | | | | | | | | | | |KeoC: | | | | | | | | | | | Keyport-----------------|Fair |Good |Good |Good |Good |Good |Poor |Poor |Good |Good |Poor | | | | | | | | | | |MakAt: | | | | | | | | | | | Manahawkin, frequently | | | | | | | | | | | flooded----------------|Very |Poor |Poor |Poor |Poor |Poor |Good |Poor |Poor |Poor |Fair | poor | | | | | | | | | | | | | | | | | | | | |MamnAv: | | | | | | | | | | | Mannington, very | | | | | | | | | | | frequently flooded-----|Very |Very |Very |Very |Very |Very |Good |Good |Very |Very |Good | poor | poor | poor | poor | poor | poor | | | poor | poor | | | | | | | | | | | | Nanticoke, very | | | | | | | | | | | frequently flooded-----|Very |Very |Very |Very |Very |Very |Good |Good |Very |Very |Good | poor | poor | poor | poor | poor | poor | | | poor | poor | | | | | | | | | | | |MasB: | | | | | | | | | | | Marlton-----------------|Good |Good |Good |Good |Good |Good |Poor |Very |Good |Good |Very | | | | | | | | poor | | | poor | | | | | | | | | | |MasC: | | | | | | | | | | | Marlton-----------------|Fair |Good |Good |Good |Good |Good |Poor |Very |Good |Good |Very | | | | | | | | poor | | | poor | | | | | | | | | | |MbrA: | | | | | | | | | | | Matapeake---------------|Good |Good |Good |Good |Good |Good |Very |Very |Good |Good |Very | | | | | | | poor | poor | | | poor | | | | | | | | | | |MbrB: | | | | | | | | | | | Matapeake---------------|Fair |Good |Good |Good |Good |Good |Very |Very |Good |Good |Very | | | | | | | poor | poor | | | poor | | | | | | | | | | |
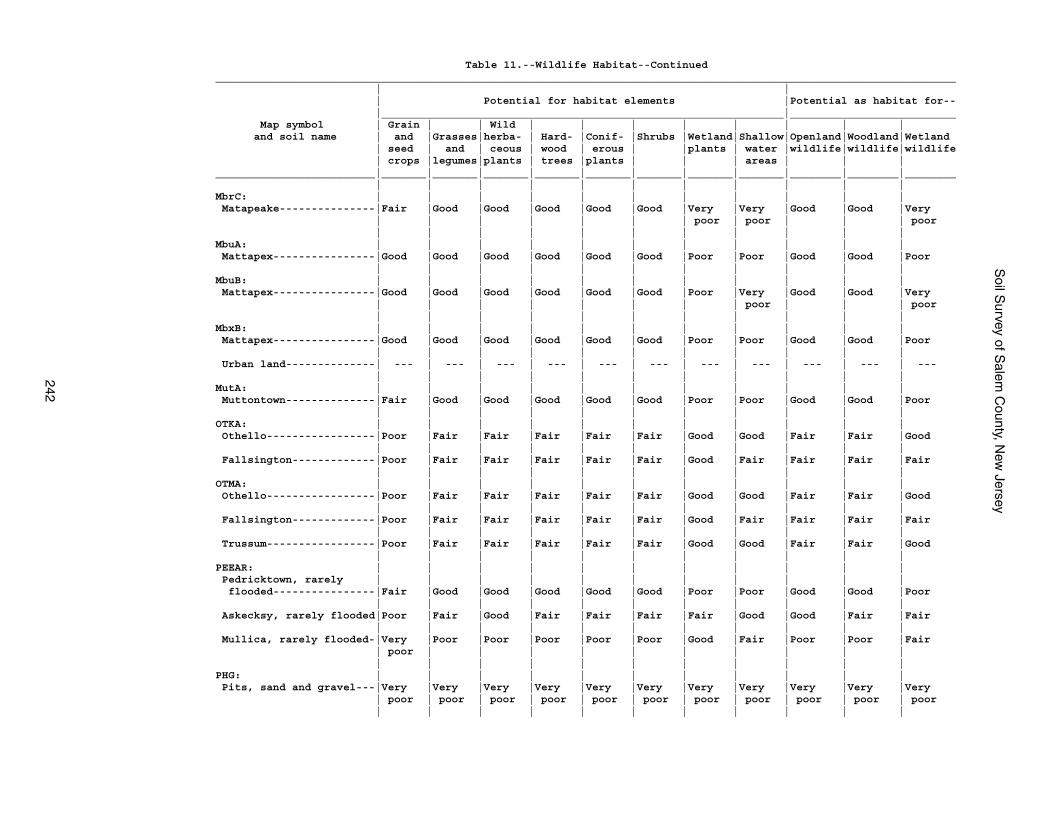
Soil S
urvey of Salem
County, N
ew Jersey
242
Table 11.--Wildlife Habitat--Continued____________________________________________________________________________________________________________________ | | | Potential for habitat elements |Potential as habitat for-- |_______________________________________________________________|__________________________ Map symbol | Grain | | Wild | | | | | | | | and soil name | and |Grasses|herba- | Hard- |Conif- |Shrubs |Wetland|Shallow|Openland|Woodland|Wetland | seed | and | ceous | wood | erous | |plants | water |wildlife|wildlife|wildlife | crops |legumes|plants | trees |plants | | | areas | | |_________________________|_______|_______|_______|_______|_______|_______|_______|_______|________|________|________ | | | | | | | | | | |MbrC: | | | | | | | | | | | Matapeake---------------|Fair |Good |Good |Good |Good |Good |Very |Very |Good |Good |Very | | | | | | | poor | poor | | | poor | | | | | | | | | | |MbuA: | | | | | | | | | | | Mattapex----------------|Good |Good |Good |Good |Good |Good |Poor |Poor |Good |Good |Poor | | | | | | | | | | |MbuB: | | | | | | | | | | | Mattapex----------------|Good |Good |Good |Good |Good |Good |Poor |Very |Good |Good |Very | | | | | | | | poor | | | poor | | | | | | | | | | |MbxB: | | | | | | | | | | | Mattapex----------------|Good |Good |Good |Good |Good |Good |Poor |Poor |Good |Good |Poor | | | | | | | | | | | Urban land--------------| --- | --- | --- | --- | --- | --- | --- | --- | --- | --- | --- | | | | | | | | | | |MutA: | | | | | | | | | | | Muttontown--------------|Fair |Good |Good |Good |Good |Good |Poor |Poor |Good |Good |Poor | | | | | | | | | | |OTKA: | | | | | | | | | | | Othello-----------------|Poor |Fair |Fair |Fair |Fair |Fair |Good |Good |Fair |Fair |Good | | | | | | | | | | | Fallsington-------------|Poor |Fair |Fair |Fair |Fair |Fair |Good |Fair |Fair |Fair |Fair | | | | | | | | | | |OTMA: | | | | | | | | | | | Othello-----------------|Poor |Fair |Fair |Fair |Fair |Fair |Good |Good |Fair |Fair |Good | | | | | | | | | | | Fallsington-------------|Poor |Fair |Fair |Fair |Fair |Fair |Good |Fair |Fair |Fair |Fair | | | | | | | | | | | Trussum-----------------|Poor |Fair |Fair |Fair |Fair |Fair |Good |Good |Fair |Fair |Good | | | | | | | | | | |PEEAR: | | | | | | | | | | | Pedricktown, rarely | | | | | | | | | | | flooded----------------|Fair |Good |Good |Good |Good |Good |Poor |Poor |Good |Good |Poor | | | | | | | | | | | Askecksy, rarely flooded|Poor |Fair |Good |Fair |Fair |Fair |Fair |Good |Good |Fair |Fair | | | | | | | | | | | Mullica, rarely flooded-|Very |Poor |Poor |Poor |Poor |Poor |Good |Fair |Poor |Poor |Fair | poor | | | | | | | | | | | | | | | | | | | | |PHG: | | | | | | | | | | | Pits, sand and gravel---|Very |Very |Very |Very |Very |Very |Very |Very |Very |Very |Very | poor | poor | poor | poor | poor | poor | poor | poor | poor | poor | poor | | | | | | | | | | |
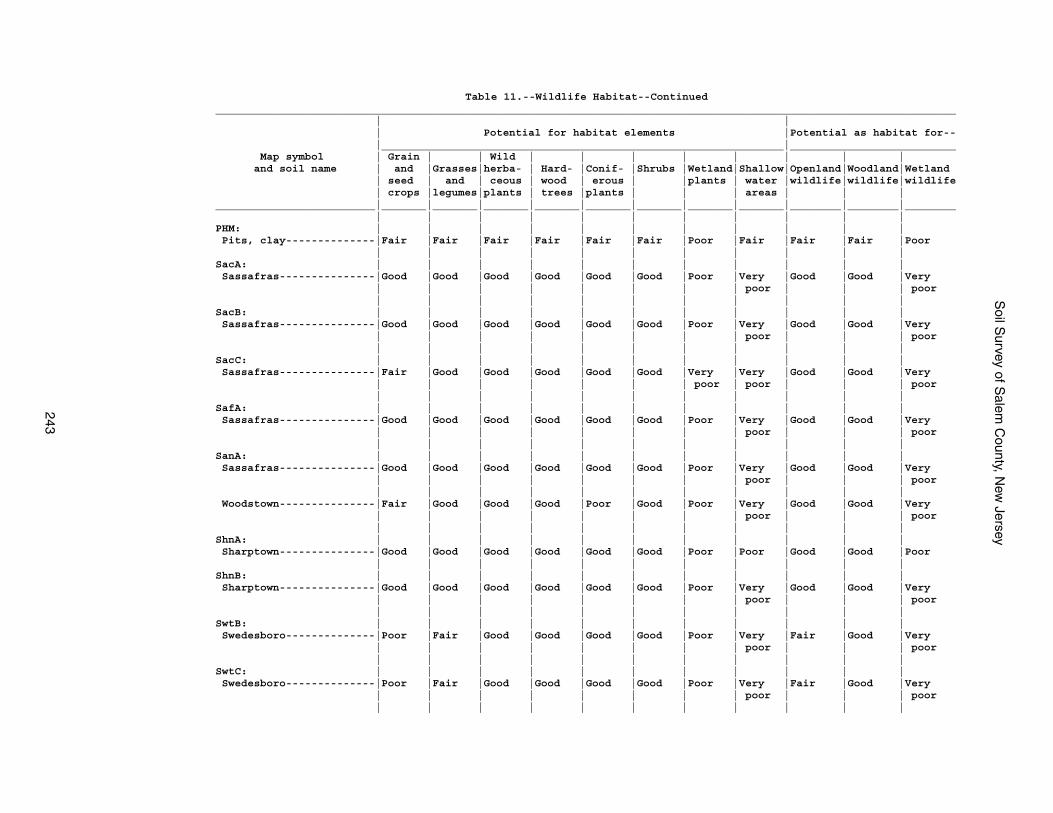
Soil S
urvey of Salem
County, N
ew Jersey
243
Table 11.--Wildlife Habitat--Continued____________________________________________________________________________________________________________________ | | | Potential for habitat elements |Potential as habitat for-- |_______________________________________________________________|__________________________ Map symbol | Grain | | Wild | | | | | | | | and soil name | and |Grasses|herba- | Hard- |Conif- |Shrubs |Wetland|Shallow|Openland|Woodland|Wetland | seed | and | ceous | wood | erous | |plants | water |wildlife|wildlife|wildlife | crops |legumes|plants | trees |plants | | | areas | | |_________________________|_______|_______|_______|_______|_______|_______|_______|_______|________|________|________ | | | | | | | | | | |PHM: | | | | | | | | | | | Pits, clay--------------|Fair |Fair |Fair |Fair |Fair |Fair |Poor |Fair |Fair |Fair |Poor | | | | | | | | | | |SacA: | | | | | | | | | | | Sassafras---------------|Good |Good |Good |Good |Good |Good |Poor |Very |Good |Good |Very | | | | | | | | poor | | | poor | | | | | | | | | | |SacB: | | | | | | | | | | | Sassafras---------------|Good |Good |Good |Good |Good |Good |Poor |Very |Good |Good |Very | | | | | | | | poor | | | poor | | | | | | | | | | |SacC: | | | | | | | | | | | Sassafras---------------|Fair |Good |Good |Good |Good |Good |Very |Very |Good |Good |Very | | | | | | | poor | poor | | | poor | | | | | | | | | | |SafA: | | | | | | | | | | | Sassafras---------------|Good |Good |Good |Good |Good |Good |Poor |Very |Good |Good |Very | | | | | | | | poor | | | poor | | | | | | | | | | |SanA: | | | | | | | | | | | Sassafras---------------|Good |Good |Good |Good |Good |Good |Poor |Very |Good |Good |Very | | | | | | | | poor | | | poor | | | | | | | | | | | Woodstown---------------|Fair |Good |Good |Good |Poor |Good |Poor |Very |Good |Good |Very | | | | | | | | poor | | | poor | | | | | | | | | | |ShnA: | | | | | | | | | | | Sharptown---------------|Good |Good |Good |Good |Good |Good |Poor |Poor |Good |Good |Poor | | | | | | | | | | |ShnB: | | | | | | | | | | | Sharptown---------------|Good |Good |Good |Good |Good |Good |Poor |Very |Good |Good |Very | | | | | | | | poor | | | poor | | | | | | | | | | |SwtB: | | | | | | | | | | | Swedesboro--------------|Poor |Fair |Good |Good |Good |Good |Poor |Very |Fair |Good |Very | | | | | | | | poor | | | poor | | | | | | | | | | |SwtC: | | | | | | | | | | | Swedesboro--------------|Poor |Fair |Good |Good |Good |Good |Poor |Very |Fair |Good |Very | | | | | | | | poor | | | poor | | | | | | | | | | |
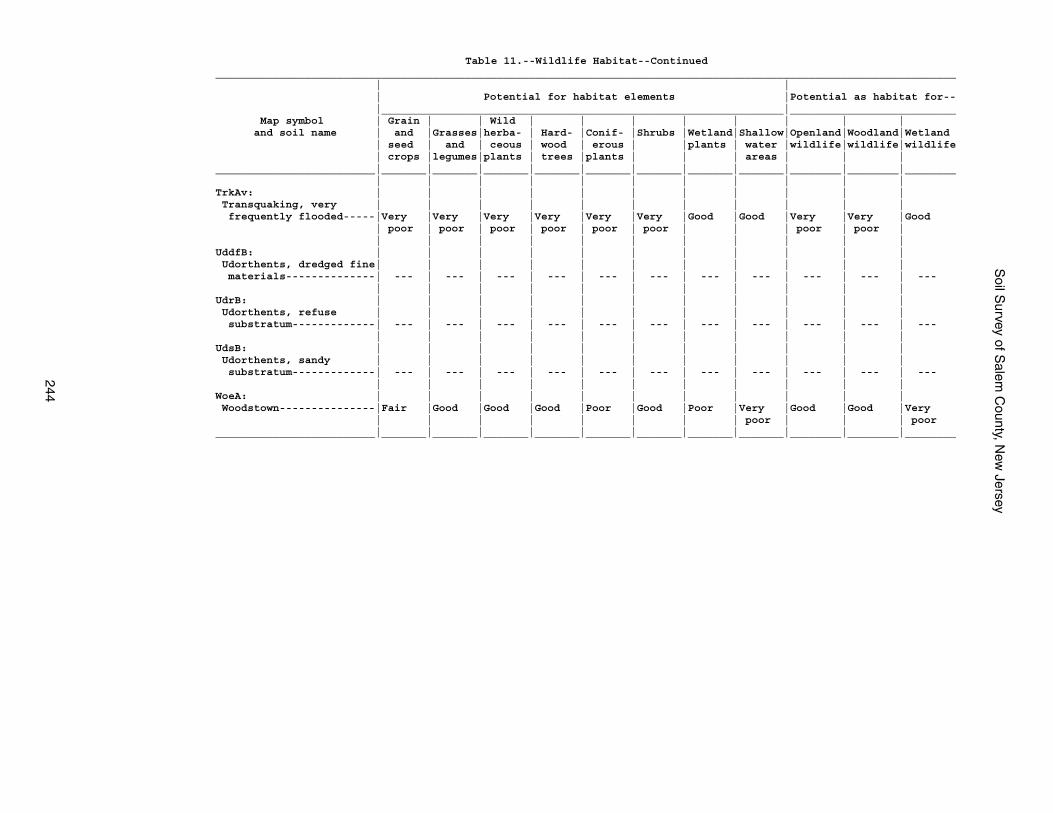
Soil S
urvey of Salem
County, N
ew Jersey
244
Table 11.--Wildlife Habitat--Continued____________________________________________________________________________________________________________________ | | | Potential for habitat elements |Potential as habitat for-- |_______________________________________________________________|__________________________ Map symbol | Grain | | Wild | | | | | | | | and soil name | and |Grasses|herba- | Hard- |Conif- |Shrubs |Wetland|Shallow|Openland|Woodland|Wetland | seed | and | ceous | wood | erous | |plants | water |wildlife|wildlife|wildlife | crops |legumes|plants | trees |plants | | | areas | | |_________________________|_______|_______|_______|_______|_______|_______|_______|_______|________|________|________ | | | | | | | | | | |TrkAv: | | | | | | | | | | | Transquaking, very | | | | | | | | | | | frequently flooded-----|Very |Very |Very |Very |Very |Very |Good |Good |Very |Very |Good | poor | poor | poor | poor | poor | poor | | | poor | poor | | | | | | | | | | | |UddfB: | | | | | | | | | | | Udorthents, dredged fine| | | | | | | | | | | materials--------------| --- | --- | --- | --- | --- | --- | --- | --- | --- | --- | --- | | | | | | | | | | |UdrB: | | | | | | | | | | | Udorthents, refuse | | | | | | | | | | | substratum-------------| --- | --- | --- | --- | --- | --- | --- | --- | --- | --- | --- | | | | | | | | | | |UdsB: | | | | | | | | | | | Udorthents, sandy | | | | | | | | | | | substratum-------------| --- | --- | --- | --- | --- | --- | --- | --- | --- | --- | --- | | | | | | | | | | |WoeA: | | | | | | | | | | | Woodstown---------------|Fair |Good |Good |Good |Poor |Good |Poor |Very |Good |Good |Very | | | | | | | | poor | | | poor_________________________|_______|_______|_______|_______|_______|_______|_______|_______|________|________|________
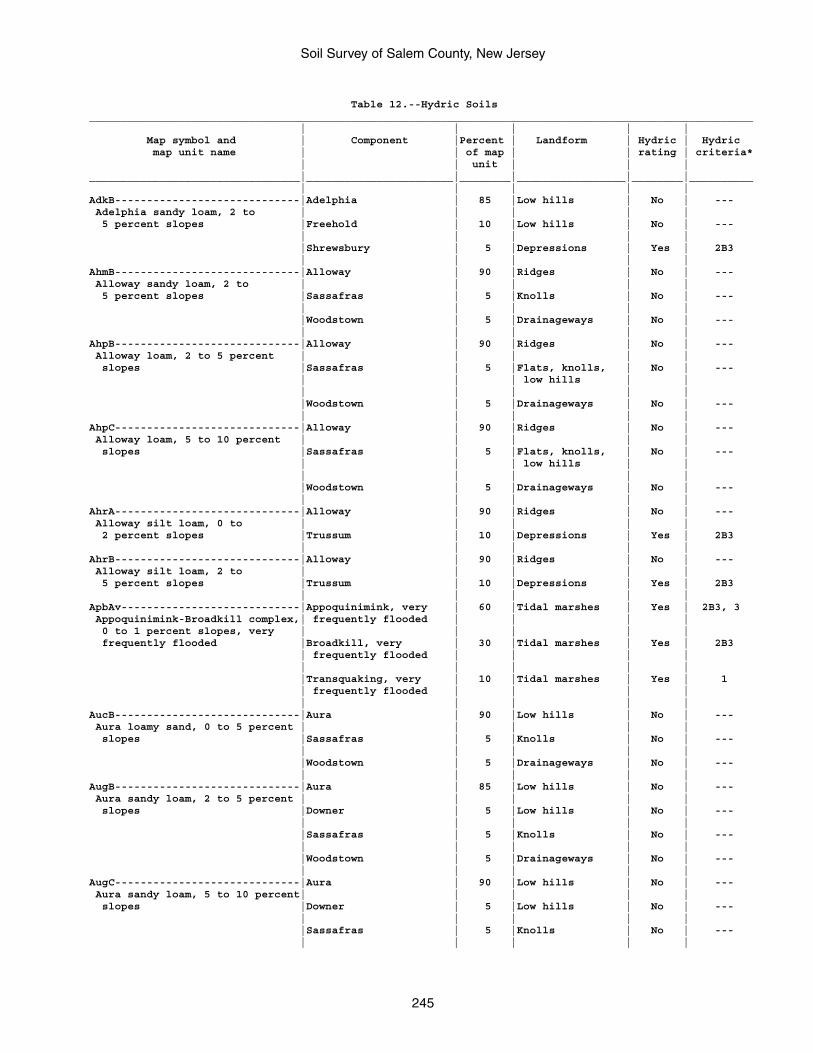
Soil Survey of Salem County, New Jersey
245
Table 12.--Hydric Soils________________________________________________________________________________________________________ | | | | | Map symbol and | Component |Percent | Landform | Hydric | Hydric map unit name | | of map | | rating | criteria* | | unit | | |_________________________________|_______________________|________|_________________|________|__________ | | | | |AdkB-----------------------------|Adelphia | 85 |Low hills | No | --- Adelphia sandy loam, 2 to | | | | | 5 percent slopes |Freehold | 10 |Low hills | No | --- | | | | | |Shrewsbury | 5 |Depressions | Yes | 2B3 | | | | |AhmB-----------------------------|Alloway | 90 |Ridges | No | --- Alloway sandy loam, 2 to | | | | | 5 percent slopes |Sassafras | 5 |Knolls | No | --- | | | | | |Woodstown | 5 |Drainageways | No | --- | | | | |AhpB-----------------------------|Alloway | 90 |Ridges | No | --- Alloway loam, 2 to 5 percent | | | | | slopes |Sassafras | 5 |Flats, knolls, | No | --- | | | low hills | | | | | | | |Woodstown | 5 |Drainageways | No | --- | | | | |AhpC-----------------------------|Alloway | 90 |Ridges | No | --- Alloway loam, 5 to 10 percent | | | | | slopes |Sassafras | 5 |Flats, knolls, | No | --- | | | low hills | | | | | | | |Woodstown | 5 |Drainageways | No | --- | | | | |AhrA-----------------------------|Alloway | 90 |Ridges | No | --- Alloway silt loam, 0 to | | | | | 2 percent slopes |Trussum | 10 |Depressions | Yes | 2B3 | | | | |AhrB-----------------------------|Alloway | 90 |Ridges | No | --- Alloway silt loam, 2 to | | | | | 5 percent slopes |Trussum | 10 |Depressions | Yes | 2B3 | | | | |ApbAv----------------------------|Appoquinimink, very | 60 |Tidal marshes | Yes | 2B3, 3 Appoquinimink-Broadkill complex,| frequently flooded | | | | 0 to 1 percent slopes, very | | | | | frequently flooded |Broadkill, very | 30 |Tidal marshes | Yes | 2B3 | frequently flooded | | | | | | | | | |Transquaking, very | 10 |Tidal marshes | Yes | 1 | frequently flooded | | | | | | | | |AucB-----------------------------|Aura | 90 |Low hills | No | --- Aura loamy sand, 0 to 5 percent | | | | | slopes |Sassafras | 5 |Knolls | No | --- | | | | | |Woodstown | 5 |Drainageways | No | --- | | | | |AugB-----------------------------|Aura | 85 |Low hills | No | --- Aura sandy loam, 2 to 5 percent | | | | | slopes |Downer | 5 |Low hills | No | --- | | | | | |Sassafras | 5 |Knolls | No | --- | | | | | |Woodstown | 5 |Drainageways | No | --- | | | | |AugC-----------------------------|Aura | 90 |Low hills | No | --- Aura sandy loam, 5 to 10 percent| | | | | slopes |Downer | 5 |Low hills | No | --- | | | | | |Sassafras | 5 |Knolls | No | --- | | | | |
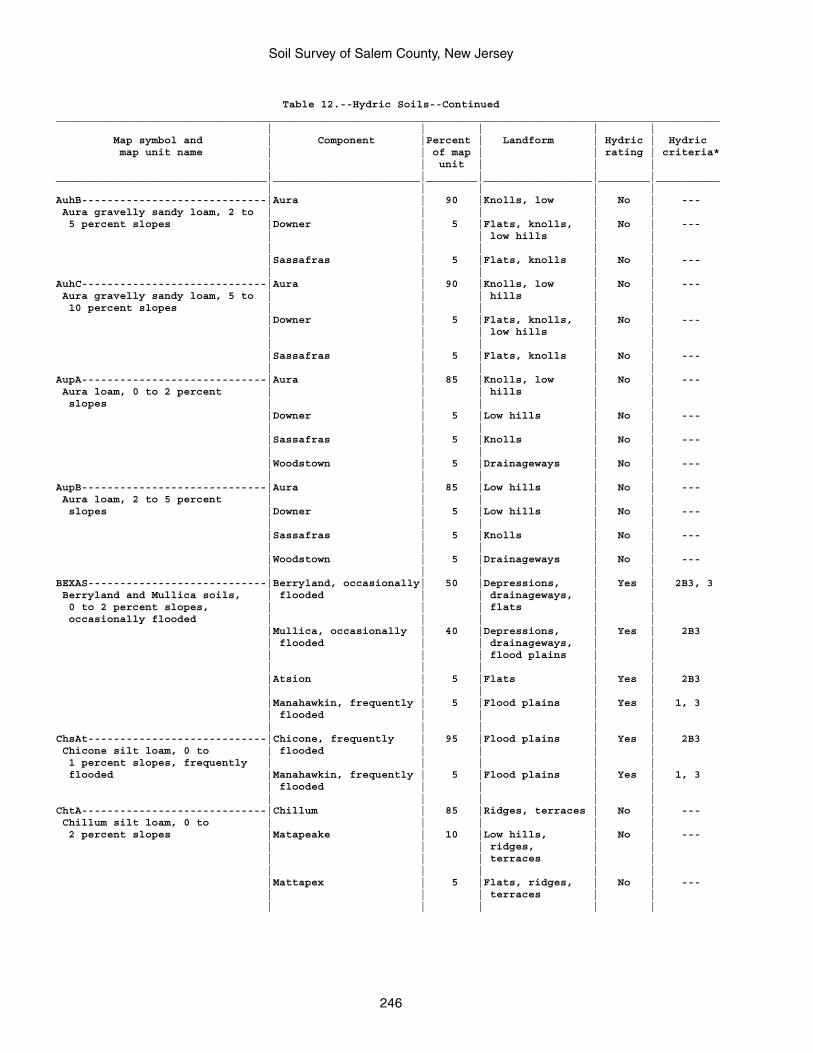
Soil Survey of Salem County, New Jersey
246
Table 12.--Hydric Soils--Continued________________________________________________________________________________________________________ | | | | | Map symbol and | Component |Percent | Landform | Hydric | Hydric map unit name | | of map | | rating | criteria* | | unit | | |_________________________________|_______________________|________|_________________|________|__________ | | | | |AuhB-----------------------------|Aura | 90 |Knolls, low | No | --- Aura gravelly sandy loam, 2 to | | | | | 5 percent slopes |Downer | 5 |Flats, knolls, | No | --- | | | low hills | | | | | | | |Sassafras | 5 |Flats, knolls | No | --- | | | | |AuhC-----------------------------|Aura | 90 |Knolls, low | No | --- Aura gravelly sandy loam, 5 to | | | hills | | 10 percent slopes | | | | | |Downer | 5 |Flats, knolls, | No | --- | | | low hills | | | | | | | |Sassafras | 5 |Flats, knolls | No | --- | | | | |AupA-----------------------------|Aura | 85 |Knolls, low | No | --- Aura loam, 0 to 2 percent | | | hills | | slopes | | | | | |Downer | 5 |Low hills | No | --- | | | | | |Sassafras | 5 |Knolls | No | --- | | | | | |Woodstown | 5 |Drainageways | No | --- | | | | |AupB-----------------------------|Aura | 85 |Low hills | No | --- Aura loam, 2 to 5 percent | | | | | slopes |Downer | 5 |Low hills | No | --- | | | | | |Sassafras | 5 |Knolls | No | --- | | | | | |Woodstown | 5 |Drainageways | No | --- | | | | |BEXAS----------------------------|Berryland, occasionally| 50 |Depressions, | Yes | 2B3, 3 Berryland and Mullica soils, | flooded | | drainageways, | | 0 to 2 percent slopes, | | | flats | | occasionally flooded | | | | | |Mullica, occasionally | 40 |Depressions, | Yes | 2B3 | flooded | | drainageways, | | | | | flood plains | | | | | | | |Atsion | 5 |Flats | Yes | 2B3 | | | | | |Manahawkin, frequently | 5 |Flood plains | Yes | 1, 3 | flooded | | | | | | | | |ChsAt----------------------------|Chicone, frequently | 95 |Flood plains | Yes | 2B3 Chicone silt loam, 0 to | flooded | | | | 1 percent slopes, frequently | | | | | flooded |Manahawkin, frequently | 5 |Flood plains | Yes | 1, 3 | flooded | | | | | | | | |ChtA-----------------------------|Chillum | 85 |Ridges, terraces | No | --- Chillum silt loam, 0 to | | | | | 2 percent slopes |Matapeake | 10 |Low hills, | No | --- | | | ridges, | | | | | terraces | | | | | | | |Mattapex | 5 |Flats, ridges, | No | --- | | | terraces | | | | | | |
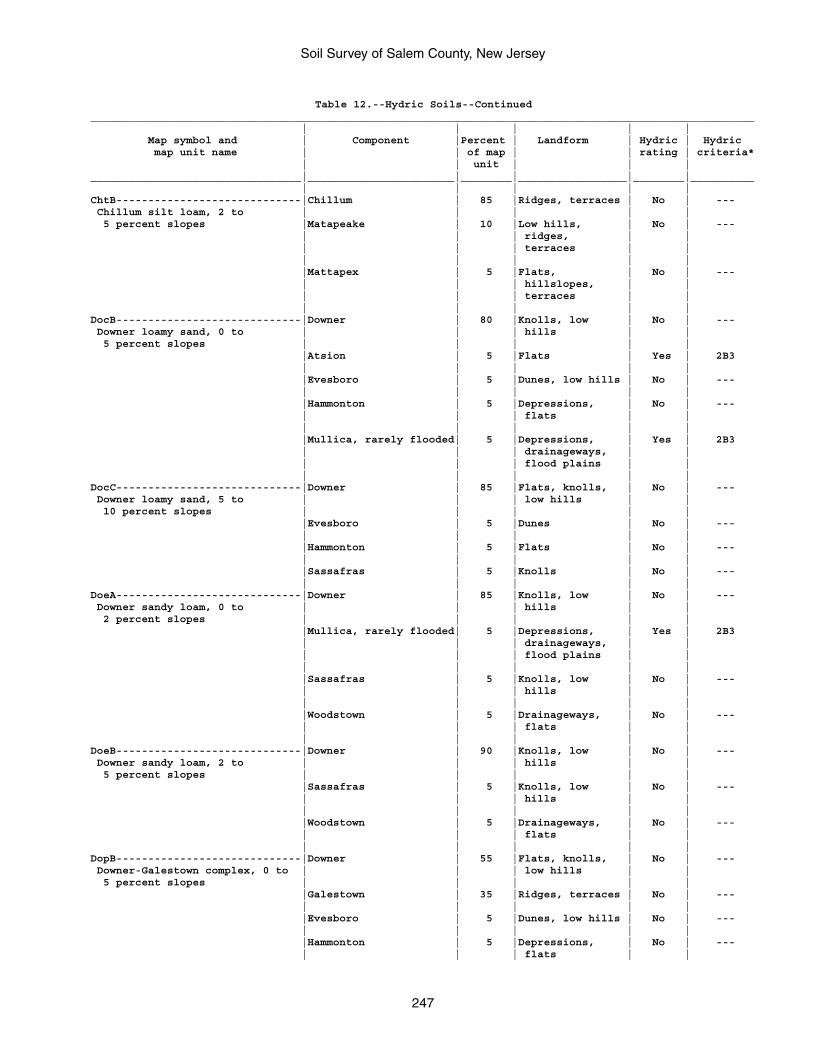
Soil Survey of Salem County, New Jersey
247
Table 12.--Hydric Soils--Continued________________________________________________________________________________________________________ | | | | | Map symbol and | Component |Percent | Landform | Hydric | Hydric map unit name | | of map | | rating | criteria* | | unit | | |_________________________________|_______________________|________|_________________|________|__________ | | | | |ChtB-----------------------------|Chillum | 85 |Ridges, terraces | No | --- Chillum silt loam, 2 to | | | | | 5 percent slopes |Matapeake | 10 |Low hills, | No | --- | | | ridges, | | | | | terraces | | | | | | | |Mattapex | 5 |Flats, | No | --- | | | hillslopes, | | | | | terraces | | | | | | |DocB-----------------------------|Downer | 80 |Knolls, low | No | --- Downer loamy sand, 0 to | | | hills | | 5 percent slopes | | | | | |Atsion | 5 |Flats | Yes | 2B3 | | | | | |Evesboro | 5 |Dunes, low hills | No | --- | | | | | |Hammonton | 5 |Depressions, | No | --- | | | flats | | | | | | | |Mullica, rarely flooded| 5 |Depressions, | Yes | 2B3 | | | drainageways, | | | | | flood plains | | | | | | |DocC-----------------------------|Downer | 85 |Flats, knolls, | No | --- Downer loamy sand, 5 to | | | low hills | | 10 percent slopes | | | | | |Evesboro | 5 |Dunes | No | --- | | | | | |Hammonton | 5 |Flats | No | --- | | | | | |Sassafras | 5 |Knolls | No | --- | | | | |DoeA-----------------------------|Downer | 85 |Knolls, low | No | --- Downer sandy loam, 0 to | | | hills | | 2 percent slopes | | | | | |Mullica, rarely flooded| 5 |Depressions, | Yes | 2B3 | | | drainageways, | | | | | flood plains | | | | | | | |Sassafras | 5 |Knolls, low | No | --- | | | hills | | | | | | | |Woodstown | 5 |Drainageways, | No | --- | | | flats | | | | | | |DoeB-----------------------------|Downer | 90 |Knolls, low | No | --- Downer sandy loam, 2 to | | | hills | | 5 percent slopes | | | | | |Sassafras | 5 |Knolls, low | No | --- | | | hills | | | | | | | |Woodstown | 5 |Drainageways, | No | --- | | | flats | | | | | | |DopB-----------------------------|Downer | 55 |Flats, knolls, | No | --- Downer-Galestown complex, 0 to | | | low hills | | 5 percent slopes | | | | | |Galestown | 35 |Ridges, terraces | No | --- | | | | | |Evesboro | 5 |Dunes, low hills | No | --- | | | | | |Hammonton | 5 |Depressions, | No | --- | | | flats | |
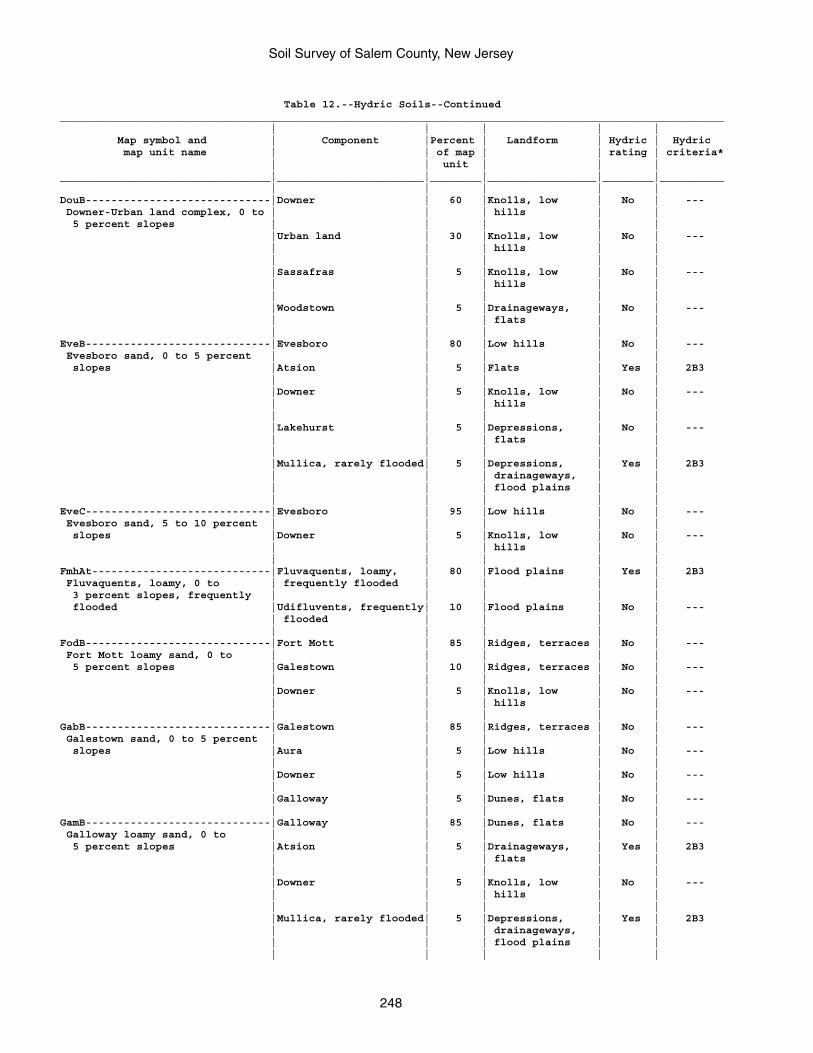
Soil Survey of Salem County, New Jersey
248
Table 12.--Hydric Soils--Continued________________________________________________________________________________________________________ | | | | | Map symbol and | Component |Percent | Landform | Hydric | Hydric map unit name | | of map | | rating | criteria* | | unit | | |_________________________________|_______________________|________|_________________|________|__________ | | | | |DouB-----------------------------|Downer | 60 |Knolls, low | No | --- Downer-Urban land complex, 0 to | | | hills | | 5 percent slopes | | | | | |Urban land | 30 |Knolls, low | No | --- | | | hills | | | | | | | |Sassafras | 5 |Knolls, low | No | --- | | | hills | | | | | | | |Woodstown | 5 |Drainageways, | No | --- | | | flats | | | | | | |EveB-----------------------------|Evesboro | 80 |Low hills | No | --- Evesboro sand, 0 to 5 percent | | | | | slopes |Atsion | 5 |Flats | Yes | 2B3 | | | | | |Downer | 5 |Knolls, low | No | --- | | | hills | | | | | | | |Lakehurst | 5 |Depressions, | No | --- | | | flats | | | | | | | |Mullica, rarely flooded| 5 |Depressions, | Yes | 2B3 | | | drainageways, | | | | | flood plains | | | | | | |EveC-----------------------------|Evesboro | 95 |Low hills | No | --- Evesboro sand, 5 to 10 percent | | | | | slopes |Downer | 5 |Knolls, low | No | --- | | | hills | | | | | | |FmhAt----------------------------|Fluvaquents, loamy, | 80 |Flood plains | Yes | 2B3 Fluvaquents, loamy, 0 to | frequently flooded | | | | 3 percent slopes, frequently | | | | | flooded |Udifluvents, frequently| 10 |Flood plains | No | --- | flooded | | | | | | | | |FodB-----------------------------|Fort Mott | 85 |Ridges, terraces | No | --- Fort Mott loamy sand, 0 to | | | | | 5 percent slopes |Galestown | 10 |Ridges, terraces | No | --- | | | | | |Downer | 5 |Knolls, low | No | --- | | | hills | | | | | | |GabB-----------------------------|Galestown | 85 |Ridges, terraces | No | --- Galestown sand, 0 to 5 percent | | | | | slopes |Aura | 5 |Low hills | No | --- | | | | | |Downer | 5 |Low hills | No | --- | | | | | |Galloway | 5 |Dunes, flats | No | --- | | | | |GamB-----------------------------|Galloway | 85 |Dunes, flats | No | --- Galloway loamy sand, 0 to | | | | | 5 percent slopes |Atsion | 5 |Drainageways, | Yes | 2B3 | | | flats | | | | | | | |Downer | 5 |Knolls, low | No | --- | | | hills | | | | | | | |Mullica, rarely flooded| 5 |Depressions, | Yes | 2B3 | | | drainageways, | | | | | flood plains | | | | | | |
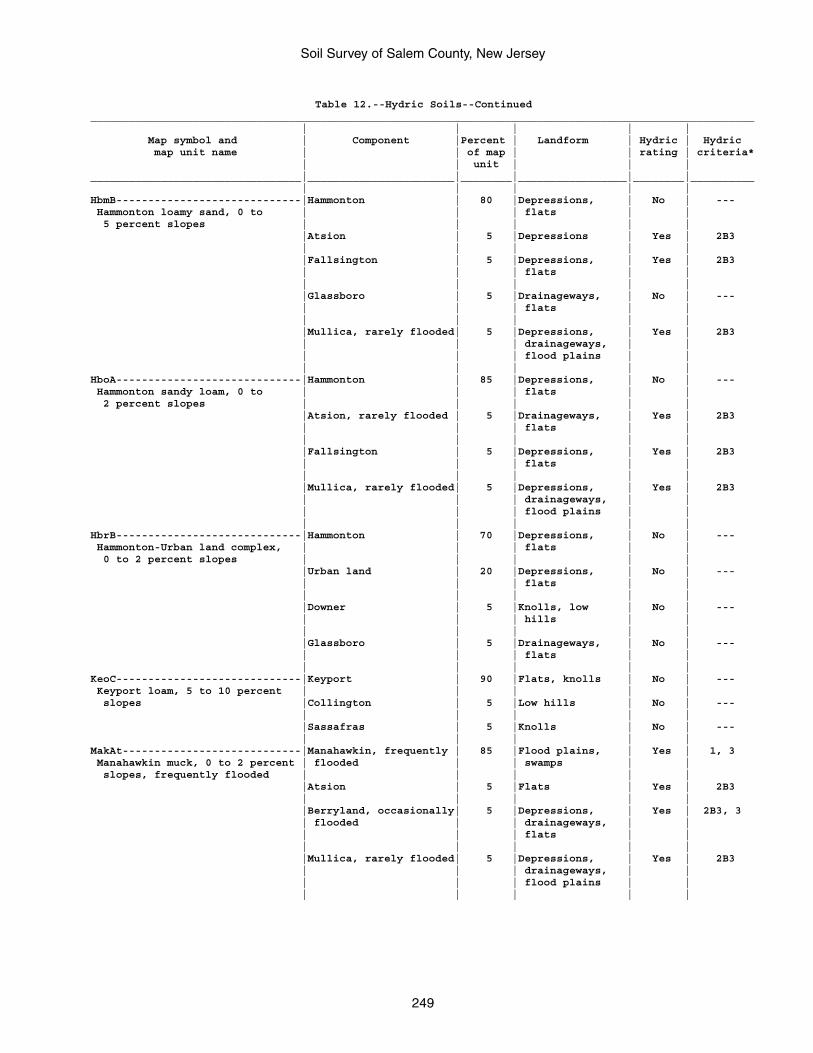
Soil Survey of Salem County, New Jersey
249
Table 12.--Hydric Soils--Continued________________________________________________________________________________________________________ | | | | | Map symbol and | Component |Percent | Landform | Hydric | Hydric map unit name | | of map | | rating | criteria* | | unit | | |_________________________________|_______________________|________|_________________|________|__________ | | | | |HbmB-----------------------------|Hammonton | 80 |Depressions, | No | --- Hammonton loamy sand, 0 to | | | flats | | 5 percent slopes | | | | | |Atsion | 5 |Depressions | Yes | 2B3 | | | | | |Fallsington | 5 |Depressions, | Yes | 2B3 | | | flats | | | | | | | |Glassboro | 5 |Drainageways, | No | --- | | | flats | | | | | | | |Mullica, rarely flooded| 5 |Depressions, | Yes | 2B3 | | | drainageways, | | | | | flood plains | | | | | | |HboA-----------------------------|Hammonton | 85 |Depressions, | No | --- Hammonton sandy loam, 0 to | | | flats | | 2 percent slopes | | | | | |Atsion, rarely flooded | 5 |Drainageways, | Yes | 2B3 | | | flats | | | | | | | |Fallsington | 5 |Depressions, | Yes | 2B3 | | | flats | | | | | | | |Mullica, rarely flooded| 5 |Depressions, | Yes | 2B3 | | | drainageways, | | | | | flood plains | | | | | | |HbrB-----------------------------|Hammonton | 70 |Depressions, | No | --- Hammonton-Urban land complex, | | | flats | | 0 to 2 percent slopes | | | | | |Urban land | 20 |Depressions, | No | --- | | | flats | | | | | | | |Downer | 5 |Knolls, low | No | --- | | | hills | | | | | | | |Glassboro | 5 |Drainageways, | No | --- | | | flats | | | | | | |KeoC-----------------------------|Keyport | 90 |Flats, knolls | No | --- Keyport loam, 5 to 10 percent | | | | | slopes |Collington | 5 |Low hills | No | --- | | | | | |Sassafras | 5 |Knolls | No | --- | | | | |MakAt----------------------------|Manahawkin, frequently | 85 |Flood plains, | Yes | 1, 3 Manahawkin muck, 0 to 2 percent | flooded | | swamps | | slopes, frequently flooded | | | | | |Atsion | 5 |Flats | Yes | 2B3 | | | | | |Berryland, occasionally| 5 |Depressions, | Yes | 2B3, 3 | flooded | | drainageways, | | | | | flats | | | | | | | |Mullica, rarely flooded| 5 |Depressions, | Yes | 2B3 | | | drainageways, | | | | | flood plains | | | | | | |
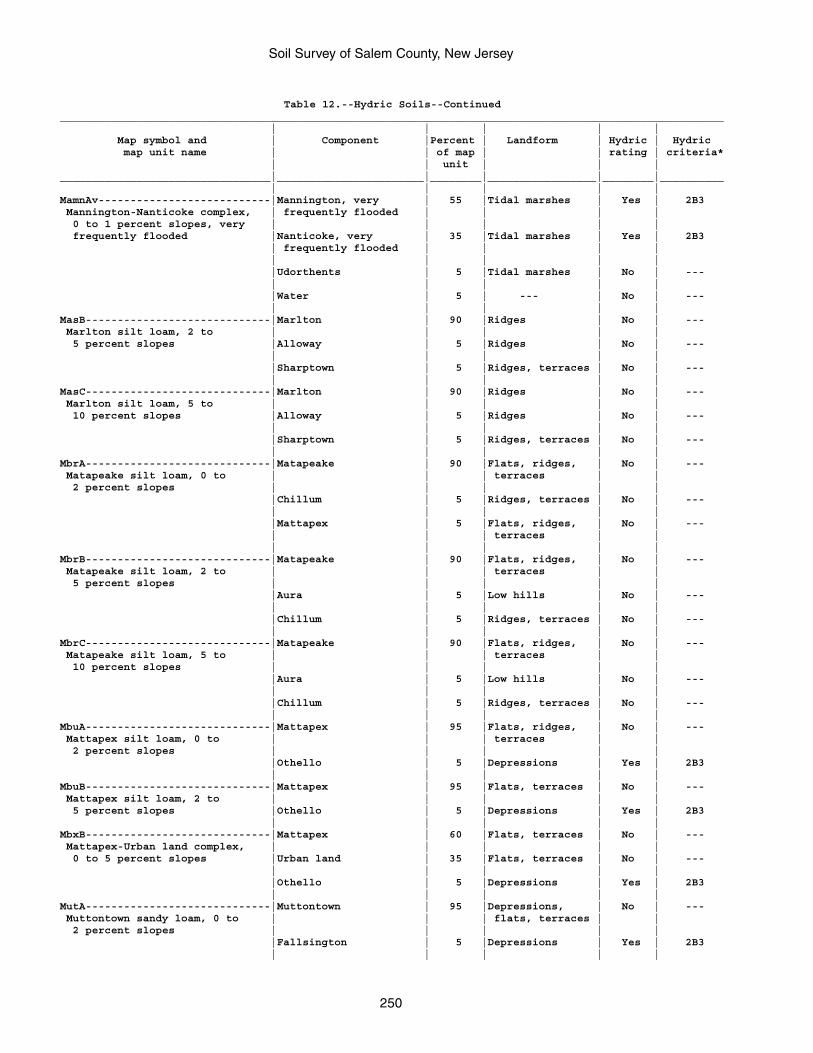
Soil Survey of Salem County, New Jersey
250
Table 12.--Hydric Soils--Continued________________________________________________________________________________________________________ | | | | | Map symbol and | Component |Percent | Landform | Hydric | Hydric map unit name | | of map | | rating | criteria* | | unit | | |_________________________________|_______________________|________|_________________|________|__________ | | | | |MamnAv---------------------------|Mannington, very | 55 |Tidal marshes | Yes | 2B3 Mannington-Nanticoke complex, | frequently flooded | | | | 0 to 1 percent slopes, very | | | | | frequently flooded |Nanticoke, very | 35 |Tidal marshes | Yes | 2B3 | frequently flooded | | | | | | | | | |Udorthents | 5 |Tidal marshes | No | --- | | | | | |Water | 5 | --- | No | --- | | | | |MasB-----------------------------|Marlton | 90 |Ridges | No | --- Marlton silt loam, 2 to | | | | | 5 percent slopes |Alloway | 5 |Ridges | No | --- | | | | | |Sharptown | 5 |Ridges, terraces | No | --- | | | | |MasC-----------------------------|Marlton | 90 |Ridges | No | --- Marlton silt loam, 5 to | | | | | 10 percent slopes |Alloway | 5 |Ridges | No | --- | | | | | |Sharptown | 5 |Ridges, terraces | No | --- | | | | |MbrA-----------------------------|Matapeake | 90 |Flats, ridges, | No | --- Matapeake silt loam, 0 to | | | terraces | | 2 percent slopes | | | | | |Chillum | 5 |Ridges, terraces | No | --- | | | | | |Mattapex | 5 |Flats, ridges, | No | --- | | | terraces | | | | | | |MbrB-----------------------------|Matapeake | 90 |Flats, ridges, | No | --- Matapeake silt loam, 2 to | | | terraces | | 5 percent slopes | | | | | |Aura | 5 |Low hills | No | --- | | | | | |Chillum | 5 |Ridges, terraces | No | --- | | | | |MbrC-----------------------------|Matapeake | 90 |Flats, ridges, | No | --- Matapeake silt loam, 5 to | | | terraces | | 10 percent slopes | | | | | |Aura | 5 |Low hills | No | --- | | | | | |Chillum | 5 |Ridges, terraces | No | --- | | | | |MbuA-----------------------------|Mattapex | 95 |Flats, ridges, | No | --- Mattapex silt loam, 0 to | | | terraces | | 2 percent slopes | | | | | |Othello | 5 |Depressions | Yes | 2B3 | | | | |MbuB-----------------------------|Mattapex | 95 |Flats, terraces | No | --- Mattapex silt loam, 2 to | | | | | 5 percent slopes |Othello | 5 |Depressions | Yes | 2B3 | | | | |MbxB-----------------------------|Mattapex | 60 |Flats, terraces | No | --- Mattapex-Urban land complex, | | | | | 0 to 5 percent slopes |Urban land | 35 |Flats, terraces | No | --- | | | | | |Othello | 5 |Depressions | Yes | 2B3 | | | | |MutA-----------------------------|Muttontown | 95 |Depressions, | No | --- Muttontown sandy loam, 0 to | | | flats, terraces | | 2 percent slopes | | | | | |Fallsington | 5 |Depressions | Yes | 2B3 | | | | |
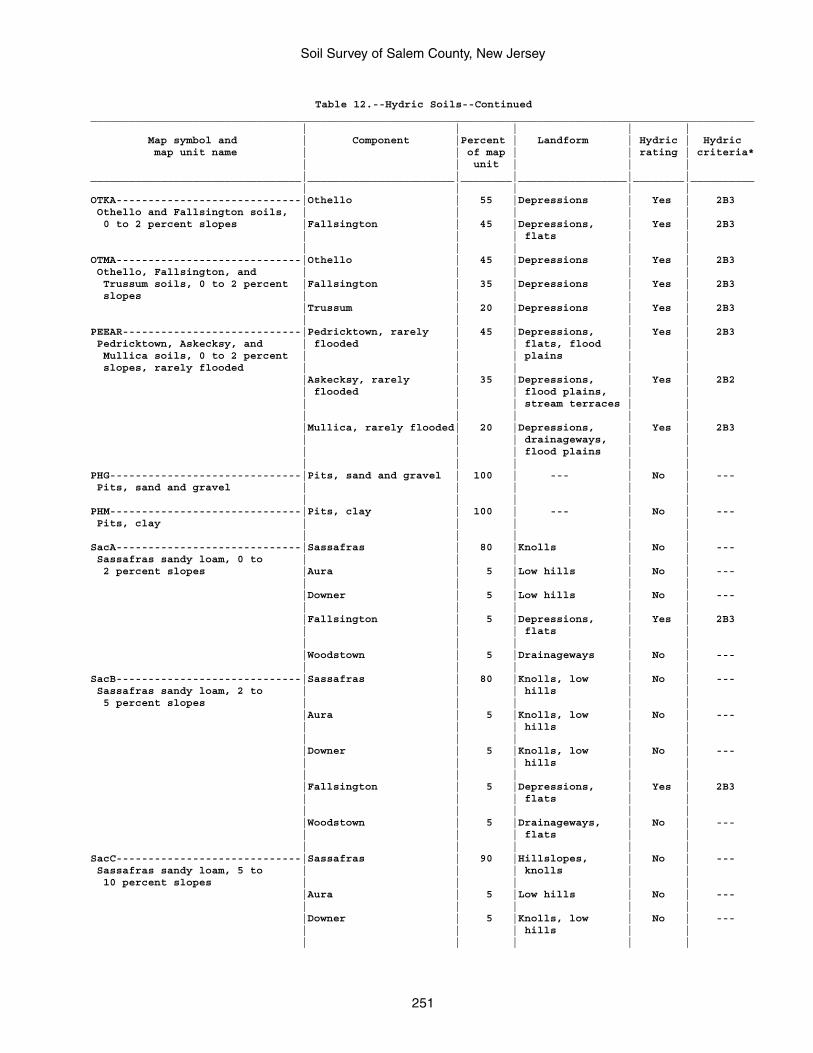
Soil Survey of Salem County, New Jersey
251
Table 12.--Hydric Soils--Continued________________________________________________________________________________________________________ | | | | | Map symbol and | Component |Percent | Landform | Hydric | Hydric map unit name | | of map | | rating | criteria* | | unit | | |_________________________________|_______________________|________|_________________|________|__________ | | | | |OTKA-----------------------------|Othello | 55 |Depressions | Yes | 2B3 Othello and Fallsington soils, | | | | | 0 to 2 percent slopes |Fallsington | 45 |Depressions, | Yes | 2B3 | | | flats | | | | | | |OTMA-----------------------------|Othello | 45 |Depressions | Yes | 2B3 Othello, Fallsington, and | | | | | Trussum soils, 0 to 2 percent |Fallsington | 35 |Depressions | Yes | 2B3 slopes | | | | | |Trussum | 20 |Depressions | Yes | 2B3 | | | | |PEEAR----------------------------|Pedricktown, rarely | 45 |Depressions, | Yes | 2B3 Pedricktown, Askecksy, and | flooded | | flats, flood | | Mullica soils, 0 to 2 percent | | | plains | | slopes, rarely flooded | | | | | |Askecksy, rarely | 35 |Depressions, | Yes | 2B2 | flooded | | flood plains, | | | | | stream terraces | | | | | | | |Mullica, rarely flooded| 20 |Depressions, | Yes | 2B3 | | | drainageways, | | | | | flood plains | | | | | | |PHG------------------------------|Pits, sand and gravel | 100 | --- | No | --- Pits, sand and gravel | | | | | | | | | |PHM------------------------------|Pits, clay | 100 | --- | No | --- Pits, clay | | | | | | | | | |SacA-----------------------------|Sassafras | 80 |Knolls | No | --- Sassafras sandy loam, 0 to | | | | | 2 percent slopes |Aura | 5 |Low hills | No | --- | | | | | |Downer | 5 |Low hills | No | --- | | | | | |Fallsington | 5 |Depressions, | Yes | 2B3 | | | flats | | | | | | | |Woodstown | 5 |Drainageways | No | --- | | | | |SacB-----------------------------|Sassafras | 80 |Knolls, low | No | --- Sassafras sandy loam, 2 to | | | hills | | 5 percent slopes | | | | | |Aura | 5 |Knolls, low | No | --- | | | hills | | | | | | | |Downer | 5 |Knolls, low | No | --- | | | hills | | | | | | | |Fallsington | 5 |Depressions, | Yes | 2B3 | | | flats | | | | | | | |Woodstown | 5 |Drainageways, | No | --- | | | flats | | | | | | |SacC-----------------------------|Sassafras | 90 |Hillslopes, | No | --- Sassafras sandy loam, 5 to | | | knolls | | 10 percent slopes | | | | | |Aura | 5 |Low hills | No | --- | | | | | |Downer | 5 |Knolls, low | No | --- | | | hills | | | | | | |
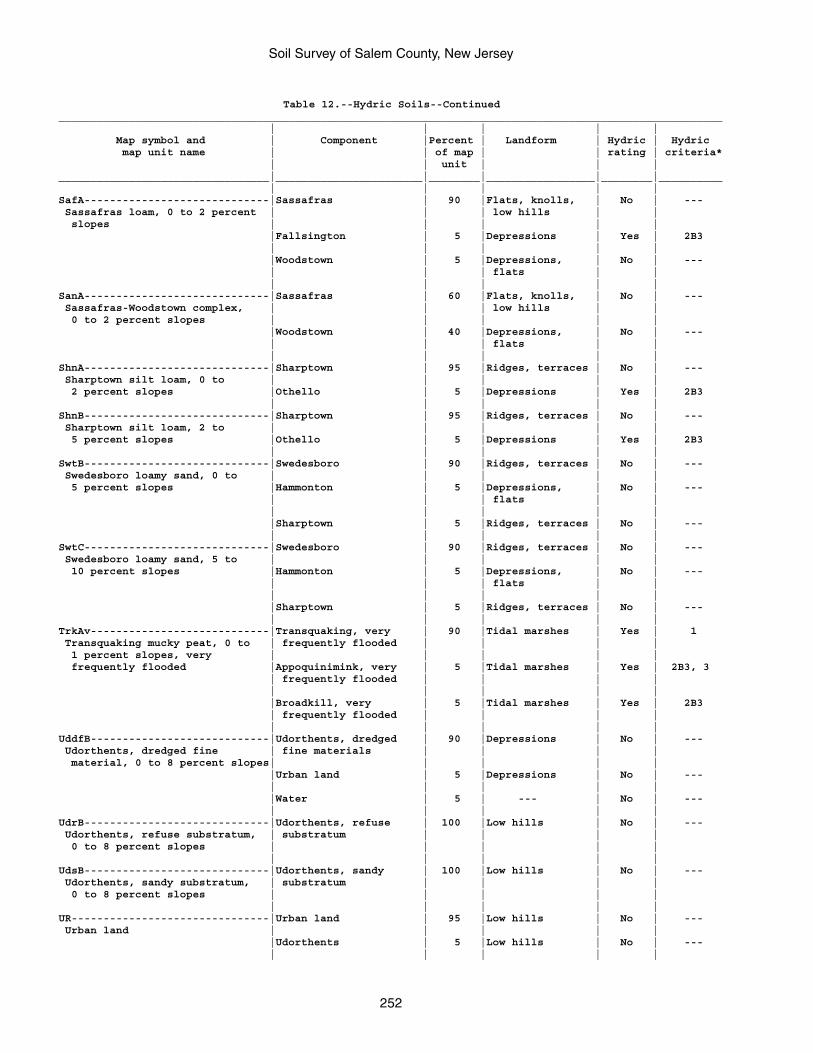
Soil Survey of Salem County, New Jersey
252
Table 12.--Hydric Soils--Continued________________________________________________________________________________________________________ | | | | | Map symbol and | Component |Percent | Landform | Hydric | Hydric map unit name | | of map | | rating | criteria* | | unit | | |_________________________________|_______________________|________|_________________|________|__________ | | | | |SafA-----------------------------|Sassafras | 90 |Flats, knolls, | No | --- Sassafras loam, 0 to 2 percent | | | low hills | | slopes | | | | | |Fallsington | 5 |Depressions | Yes | 2B3 | | | | | |Woodstown | 5 |Depressions, | No | --- | | | flats | | | | | | |SanA-----------------------------|Sassafras | 60 |Flats, knolls, | No | --- Sassafras-Woodstown complex, | | | low hills | | 0 to 2 percent slopes | | | | | |Woodstown | 40 |Depressions, | No | --- | | | flats | | | | | | |ShnA-----------------------------|Sharptown | 95 |Ridges, terraces | No | --- Sharptown silt loam, 0 to | | | | | 2 percent slopes |Othello | 5 |Depressions | Yes | 2B3 | | | | |ShnB-----------------------------|Sharptown | 95 |Ridges, terraces | No | --- Sharptown silt loam, 2 to | | | | | 5 percent slopes |Othello | 5 |Depressions | Yes | 2B3 | | | | |SwtB-----------------------------|Swedesboro | 90 |Ridges, terraces | No | --- Swedesboro loamy sand, 0 to | | | | | 5 percent slopes |Hammonton | 5 |Depressions, | No | --- | | | flats | | | | | | | |Sharptown | 5 |Ridges, terraces | No | --- | | | | |SwtC-----------------------------|Swedesboro | 90 |Ridges, terraces | No | --- Swedesboro loamy sand, 5 to | | | | | 10 percent slopes |Hammonton | 5 |Depressions, | No | --- | | | flats | | | | | | | |Sharptown | 5 |Ridges, terraces | No | --- | | | | |TrkAv----------------------------|Transquaking, very | 90 |Tidal marshes | Yes | 1 Transquaking mucky peat, 0 to | frequently flooded | | | | 1 percent slopes, very | | | | | frequently flooded |Appoquinimink, very | 5 |Tidal marshes | Yes | 2B3, 3 | frequently flooded | | | | | | | | | |Broadkill, very | 5 |Tidal marshes | Yes | 2B3 | frequently flooded | | | | | | | | |UddfB----------------------------|Udorthents, dredged | 90 |Depressions | No | --- Udorthents, dredged fine | fine materials | | | | material, 0 to 8 percent slopes| | | | | |Urban land | 5 |Depressions | No | --- | | | | | |Water | 5 | --- | No | --- | | | | |UdrB-----------------------------|Udorthents, refuse | 100 |Low hills | No | --- Udorthents, refuse substratum, | substratum | | | | 0 to 8 percent slopes | | | | | | | | | |UdsB-----------------------------|Udorthents, sandy | 100 |Low hills | No | --- Udorthents, sandy substratum, | substratum | | | | 0 to 8 percent slopes | | | | | | | | | |UR-------------------------------|Urban land | 95 |Low hills | No | --- Urban land | | | | | |Udorthents | 5 |Low hills | No | --- | | | | |
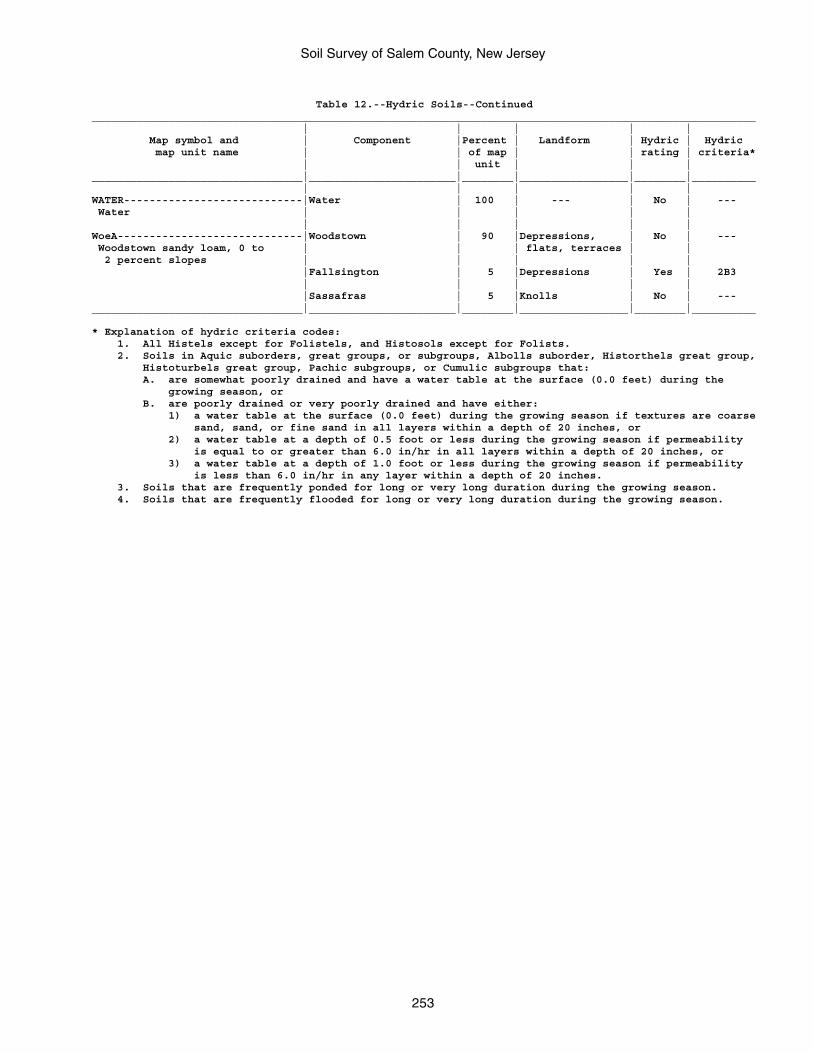
Soil Survey of Salem County, New Jersey
253
Table 12.--Hydric Soils--Continued________________________________________________________________________________________________________ | | | | | Map symbol and | Component |Percent | Landform | Hydric | Hydric map unit name | | of map | | rating | criteria* | | unit | | |_________________________________|_______________________|________|_________________|________|__________ | | | | |WATER----------------------------|Water | 100 | --- | No | --- Water | | | | | | | | | |WoeA-----------------------------|Woodstown | 90 |Depressions, | No | --- Woodstown sandy loam, 0 to | | | flats, terraces | | 2 percent slopes | | | | | |Fallsington | 5 |Depressions | Yes | 2B3 | | | | | |Sassafras | 5 |Knolls | No | ---_________________________________|_______________________|________|_________________|________|__________
* Explanation of hydric criteria codes: 1. All Histels except for Folistels, and Histosols except for Folists. 2. Soils in Aquic suborders, great groups, or subgroups, Albolls suborder, Historthels great group, Histoturbels great group, Pachic subgroups, or Cumulic subgroups that: A. are somewhat poorly drained and have a water table at the surface (0.0 feet) during the growing season, or B. are poorly drained or very poorly drained and have either: 1) a water table at the surface (0.0 feet) during the growing season if textures are coarse sand, sand, or fine sand in all layers within a depth of 20 inches, or 2) a water table at a depth of 0.5 foot or less during the growing season if permeability is equal to or greater than 6.0 in/hr in all layers within a depth of 20 inches, or 3) a water table at a depth of 1.0 foot or less during the growing season if permeability is less than 6.0 in/hr in any layer within a depth of 20 inches. 3. Soils that are frequently ponded for long or very long duration during the growing season. 4. Soils that are frequently flooded for long or very long duration during the growing season.
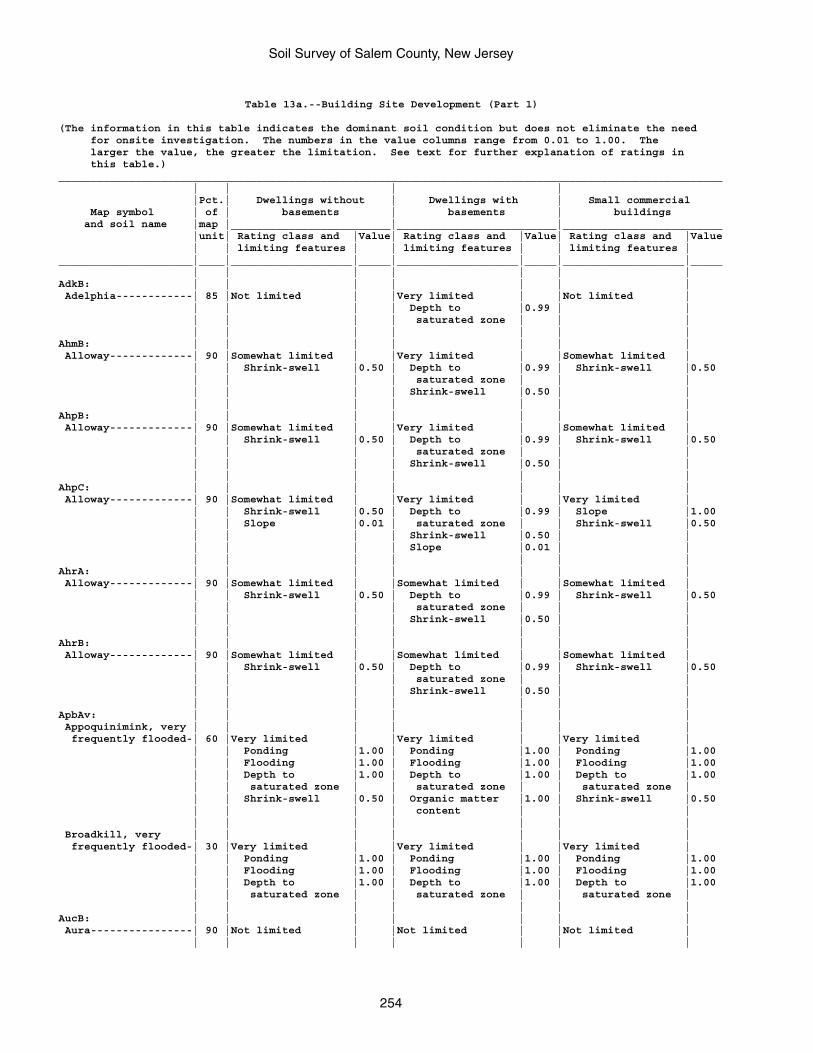
Soil Survey of Salem County, New Jersey
254
Table 13a.--Building Site Development (Part 1)
(The information in this table indicates the dominant soil condition but does not eliminate the need for onsite investigation. The numbers in the value columns range from 0.01 to 1.00. The larger the value, the greater the limitation. See text for further explanation of ratings in this table.)________________________________________________________________________________________________________ | | | | |Pct.| Dwellings without | Dwellings with | Small commercial Map symbol | of | basements | basements | buildings and soil name |map |_________________________|_________________________|_________________________ |unit| Rating class and |Value| Rating class and |Value| Rating class and |Value | | limiting features | | limiting features | | limiting features |_____________________|____|___________________|_____|___________________|_____|___________________|_____ | | | | | | |AdkB: | | | | | | | Adelphia------------| 85 |Not limited | |Very limited | |Not limited | | | | | Depth to |0.99 | | | | | | saturated zone | | | | | | | | | |AhmB: | | | | | | | Alloway-------------| 90 |Somewhat limited | |Very limited | |Somewhat limited | | | Shrink-swell |0.50 | Depth to |0.99 | Shrink-swell |0.50 | | | | saturated zone | | | | | | | Shrink-swell |0.50 | | | | | | | | |AhpB: | | | | | | | Alloway-------------| 90 |Somewhat limited | |Very limited | |Somewhat limited | | | Shrink-swell |0.50 | Depth to |0.99 | Shrink-swell |0.50 | | | | saturated zone | | | | | | | Shrink-swell |0.50 | | | | | | | | |AhpC: | | | | | | | Alloway-------------| 90 |Somewhat limited | |Very limited | |Very limited | | | Shrink-swell |0.50 | Depth to |0.99 | Slope |1.00 | | Slope |0.01 | saturated zone | | Shrink-swell |0.50 | | | | Shrink-swell |0.50 | | | | | | Slope |0.01 | | | | | | | | |AhrA: | | | | | | | Alloway-------------| 90 |Somewhat limited | |Somewhat limited | |Somewhat limited | | | Shrink-swell |0.50 | Depth to |0.99 | Shrink-swell |0.50 | | | | saturated zone | | | | | | | Shrink-swell |0.50 | | | | | | | | |AhrB: | | | | | | | Alloway-------------| 90 |Somewhat limited | |Somewhat limited | |Somewhat limited | | | Shrink-swell |0.50 | Depth to |0.99 | Shrink-swell |0.50 | | | | saturated zone | | | | | | | Shrink-swell |0.50 | | | | | | | | |ApbAv: | | | | | | | Appoquinimink, very | | | | | | | frequently flooded-| 60 |Very limited | |Very limited | |Very limited | | | Ponding |1.00 | Ponding |1.00 | Ponding |1.00 | | Flooding |1.00 | Flooding |1.00 | Flooding |1.00 | | Depth to |1.00 | Depth to |1.00 | Depth to |1.00 | | saturated zone | | saturated zone | | saturated zone | | | Shrink-swell |0.50 | Organic matter |1.00 | Shrink-swell |0.50 | | | | content | | | | | | | | | | Broadkill, very | | | | | | | frequently flooded-| 30 |Very limited | |Very limited | |Very limited | | | Ponding |1.00 | Ponding |1.00 | Ponding |1.00 | | Flooding |1.00 | Flooding |1.00 | Flooding |1.00 | | Depth to |1.00 | Depth to |1.00 | Depth to |1.00 | | saturated zone | | saturated zone | | saturated zone | | | | | | | |AucB: | | | | | | | Aura----------------| 90 |Not limited | |Not limited | |Not limited | | | | | | | |
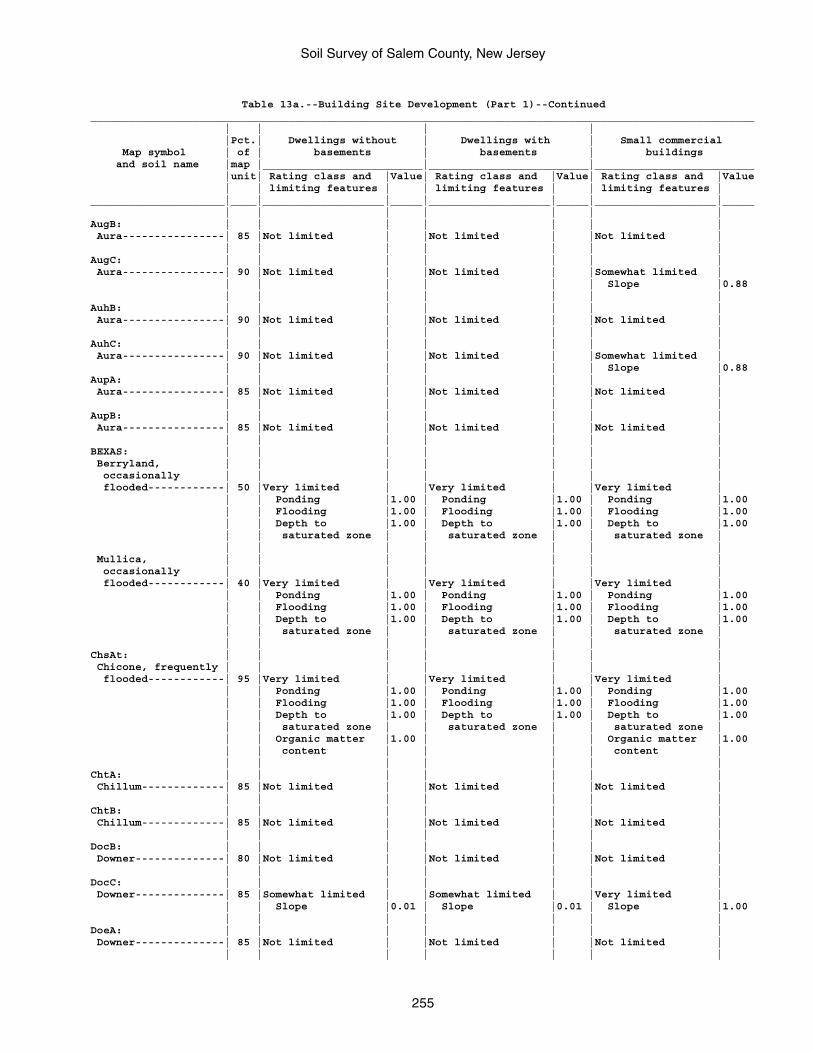
Soil Survey of Salem County, New Jersey
255
Table 13a.--Building Site Development (Part 1)--Continued________________________________________________________________________________________________________ | | | | |Pct.| Dwellings without | Dwellings with | Small commercial Map symbol | of | basements | basements | buildings and soil name |map |_________________________|_________________________|_________________________ |unit| Rating class and |Value| Rating class and |Value| Rating class and |Value | | limiting features | | limiting features | | limiting features |_____________________|____|___________________|_____|___________________|_____|___________________|_____ | | | | | | |AugB: | | | | | | | Aura----------------| 85 |Not limited | |Not limited | |Not limited | | | | | | | |AugC: | | | | | | | Aura----------------| 90 |Not limited | |Not limited | |Somewhat limited | | | | | | | Slope |0.88 | | | | | | |AuhB: | | | | | | | Aura----------------| 90 |Not limited | |Not limited | |Not limited | | | | | | | |AuhC: | | | | | | | Aura----------------| 90 |Not limited | |Not limited | |Somewhat limited | | | | | | | Slope |0.88AupA: | | | | | | | Aura----------------| 85 |Not limited | |Not limited | |Not limited | | | | | | | |AupB: | | | | | | | Aura----------------| 85 |Not limited | |Not limited | |Not limited | | | | | | | |BEXAS: | | | | | | | Berryland, | | | | | | | occasionally | | | | | | | flooded------------| 50 |Very limited | |Very limited | |Very limited | | | Ponding |1.00 | Ponding |1.00 | Ponding |1.00 | | Flooding |1.00 | Flooding |1.00 | Flooding |1.00 | | Depth to |1.00 | Depth to |1.00 | Depth to |1.00 | | saturated zone | | saturated zone | | saturated zone | | | | | | | | Mullica, | | | | | | | occasionally | | | | | | | flooded------------| 40 |Very limited | |Very limited | |Very limited | | | Ponding |1.00 | Ponding |1.00 | Ponding |1.00 | | Flooding |1.00 | Flooding |1.00 | Flooding |1.00 | | Depth to |1.00 | Depth to |1.00 | Depth to |1.00 | | saturated zone | | saturated zone | | saturated zone | | | | | | | |ChsAt: | | | | | | | Chicone, frequently | | | | | | | flooded------------| 95 |Very limited | |Very limited | |Very limited | | | Ponding |1.00 | Ponding |1.00 | Ponding |1.00 | | Flooding |1.00 | Flooding |1.00 | Flooding |1.00 | | Depth to |1.00 | Depth to |1.00 | Depth to |1.00 | | saturated zone | | saturated zone | | saturated zone | | | Organic matter |1.00 | | | Organic matter |1.00 | | content | | | | content | | | | | | | |ChtA: | | | | | | | Chillum-------------| 85 |Not limited | |Not limited | |Not limited | | | | | | | |ChtB: | | | | | | | Chillum-------------| 85 |Not limited | |Not limited | |Not limited | | | | | | | |DocB: | | | | | | | Downer--------------| 80 |Not limited | |Not limited | |Not limited | | | | | | | |DocC: | | | | | | | Downer--------------| 85 |Somewhat limited | |Somewhat limited | |Very limited | | | Slope |0.01 | Slope |0.01 | Slope |1.00 | | | | | | |DoeA: | | | | | | | Downer--------------| 85 |Not limited | |Not limited | |Not limited | | | | | | | |
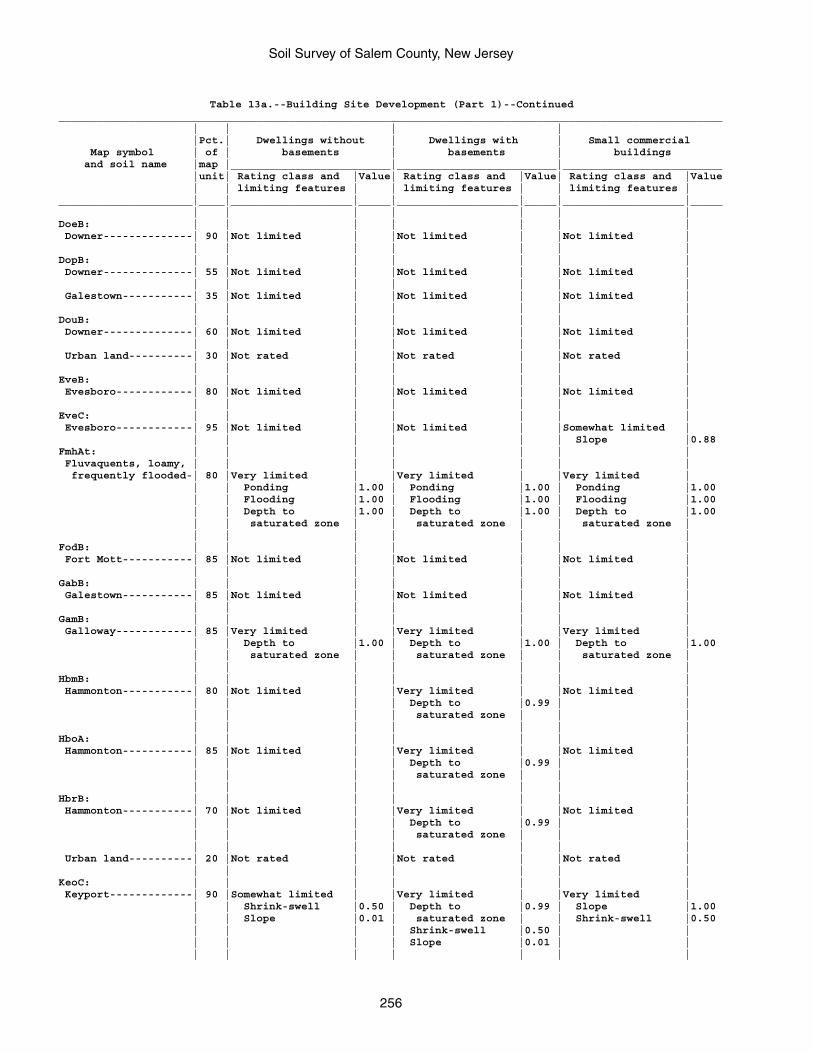
Soil Survey of Salem County, New Jersey
256
Table 13a.--Building Site Development (Part 1)--Continued________________________________________________________________________________________________________ | | | | |Pct.| Dwellings without | Dwellings with | Small commercial Map symbol | of | basements | basements | buildings and soil name |map |_________________________|_________________________|_________________________ |unit| Rating class and |Value| Rating class and |Value| Rating class and |Value | | limiting features | | limiting features | | limiting features |_____________________|____|___________________|_____|___________________|_____|___________________|_____ | | | | | | |DoeB: | | | | | | | Downer--------------| 90 |Not limited | |Not limited | |Not limited | | | | | | | |DopB: | | | | | | | Downer--------------| 55 |Not limited | |Not limited | |Not limited | | | | | | | | Galestown-----------| 35 |Not limited | |Not limited | |Not limited | | | | | | | |DouB: | | | | | | | Downer--------------| 60 |Not limited | |Not limited | |Not limited | | | | | | | | Urban land----------| 30 |Not rated | |Not rated | |Not rated | | | | | | | |EveB: | | | | | | | Evesboro------------| 80 |Not limited | |Not limited | |Not limited | | | | | | | |EveC: | | | | | | | Evesboro------------| 95 |Not limited | |Not limited | |Somewhat limited | | | | | | | Slope |0.88FmhAt: | | | | | | | Fluvaquents, loamy, | | | | | | | frequently flooded-| 80 |Very limited | |Very limited | |Very limited | | | Ponding |1.00 | Ponding |1.00 | Ponding |1.00 | | Flooding |1.00 | Flooding |1.00 | Flooding |1.00 | | Depth to |1.00 | Depth to |1.00 | Depth to |1.00 | | saturated zone | | saturated zone | | saturated zone | | | | | | | |FodB: | | | | | | | Fort Mott-----------| 85 |Not limited | |Not limited | |Not limited | | | | | | | |GabB: | | | | | | | Galestown-----------| 85 |Not limited | |Not limited | |Not limited | | | | | | | |GamB: | | | | | | | Galloway------------| 85 |Very limited | |Very limited | |Very limited | | | Depth to |1.00 | Depth to |1.00 | Depth to |1.00 | | saturated zone | | saturated zone | | saturated zone | | | | | | | |HbmB: | | | | | | | Hammonton-----------| 80 |Not limited | |Very limited | |Not limited | | | | | Depth to |0.99 | | | | | | saturated zone | | | | | | | | | |HboA: | | | | | | | Hammonton-----------| 85 |Not limited | |Very limited | |Not limited | | | | | Depth to |0.99 | | | | | | saturated zone | | | | | | | | | |HbrB: | | | | | | | Hammonton-----------| 70 |Not limited | |Very limited | |Not limited | | | | | Depth to |0.99 | | | | | | saturated zone | | | | | | | | | | Urban land----------| 20 |Not rated | |Not rated | |Not rated | | | | | | | |KeoC: | | | | | | | Keyport-------------| 90 |Somewhat limited | |Very limited | |Very limited | | | Shrink-swell |0.50 | Depth to |0.99 | Slope |1.00 | | Slope |0.01 | saturated zone | | Shrink-swell |0.50 | | | | Shrink-swell |0.50 | | | | | | Slope |0.01 | | | | | | | | |
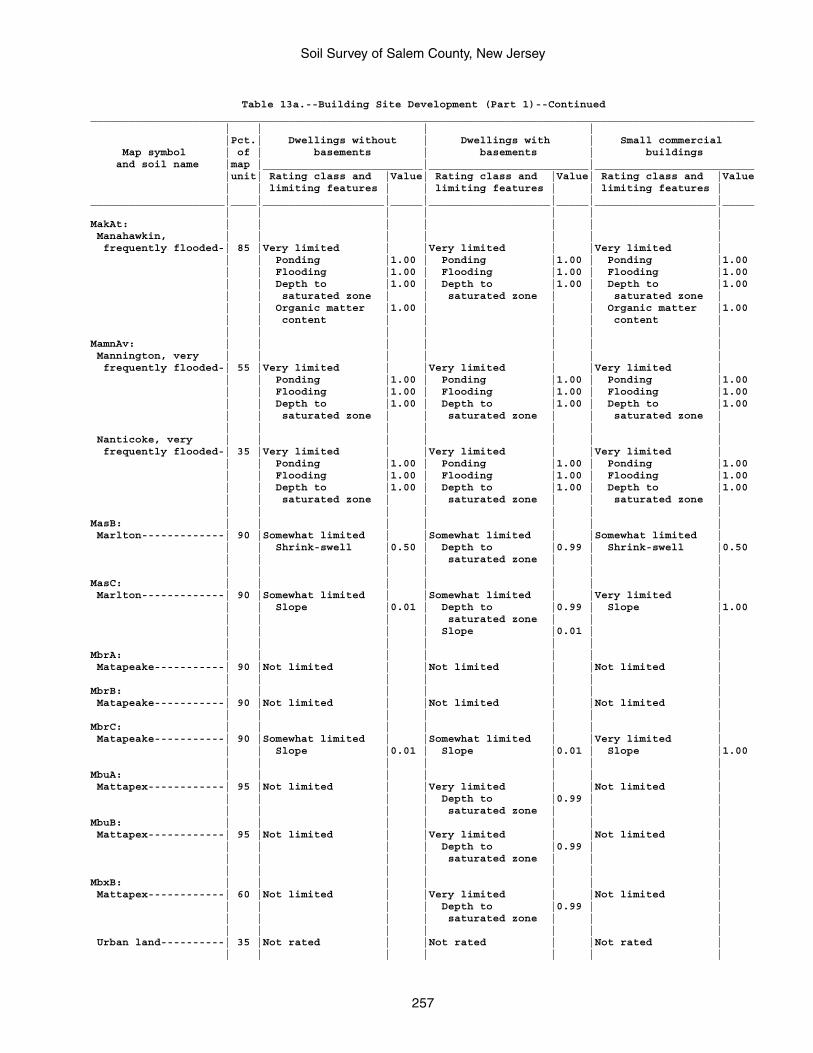
Soil Survey of Salem County, New Jersey
257
Table 13a.--Building Site Development (Part 1)--Continued________________________________________________________________________________________________________ | | | | |Pct.| Dwellings without | Dwellings with | Small commercial Map symbol | of | basements | basements | buildings and soil name |map |_________________________|_________________________|_________________________ |unit| Rating class and |Value| Rating class and |Value| Rating class and |Value | | limiting features | | limiting features | | limiting features |_____________________|____|___________________|_____|___________________|_____|___________________|_____ | | | | | | |MakAt: | | | | | | | Manahawkin, | | | | | | | frequently flooded-| 85 |Very limited | |Very limited | |Very limited | | | Ponding |1.00 | Ponding |1.00 | Ponding |1.00 | | Flooding |1.00 | Flooding |1.00 | Flooding |1.00 | | Depth to |1.00 | Depth to |1.00 | Depth to |1.00 | | saturated zone | | saturated zone | | saturated zone | | | Organic matter |1.00 | | | Organic matter |1.00 | | content | | | | content | | | | | | | |MamnAv: | | | | | | | Mannington, very | | | | | | | frequently flooded-| 55 |Very limited | |Very limited | |Very limited | | | Ponding |1.00 | Ponding |1.00 | Ponding |1.00 | | Flooding |1.00 | Flooding |1.00 | Flooding |1.00 | | Depth to |1.00 | Depth to |1.00 | Depth to |1.00 | | saturated zone | | saturated zone | | saturated zone | | | | | | | | Nanticoke, very | | | | | | | frequently flooded-| 35 |Very limited | |Very limited | |Very limited | | | Ponding |1.00 | Ponding |1.00 | Ponding |1.00 | | Flooding |1.00 | Flooding |1.00 | Flooding |1.00 | | Depth to |1.00 | Depth to |1.00 | Depth to |1.00 | | saturated zone | | saturated zone | | saturated zone | | | | | | | |MasB: | | | | | | | Marlton-------------| 90 |Somewhat limited | |Somewhat limited | |Somewhat limited | | | Shrink-swell |0.50 | Depth to |0.99 | Shrink-swell |0.50 | | | | saturated zone | | | | | | | | | |MasC: | | | | | | | Marlton-------------| 90 |Somewhat limited | |Somewhat limited | |Very limited | | | Slope |0.01 | Depth to |0.99 | Slope |1.00 | | | | saturated zone | | | | | | | Slope |0.01 | | | | | | | | |MbrA: | | | | | | | Matapeake-----------| 90 |Not limited | |Not limited | |Not limited | | | | | | | |MbrB: | | | | | | | Matapeake-----------| 90 |Not limited | |Not limited | |Not limited | | | | | | | |MbrC: | | | | | | | Matapeake-----------| 90 |Somewhat limited | |Somewhat limited | |Very limited | | | Slope |0.01 | Slope |0.01 | Slope |1.00 | | | | | | |MbuA: | | | | | | | Mattapex------------| 95 |Not limited | |Very limited | |Not limited | | | | | Depth to |0.99 | | | | | | saturated zone | | |MbuB: | | | | | | | Mattapex------------| 95 |Not limited | |Very limited | |Not limited | | | | | Depth to |0.99 | | | | | | saturated zone | | | | | | | | | |MbxB: | | | | | | | Mattapex------------| 60 |Not limited | |Very limited | |Not limited | | | | | Depth to |0.99 | | | | | | saturated zone | | | | | | | | | | Urban land----------| 35 |Not rated | |Not rated | |Not rated | | | | | | | |
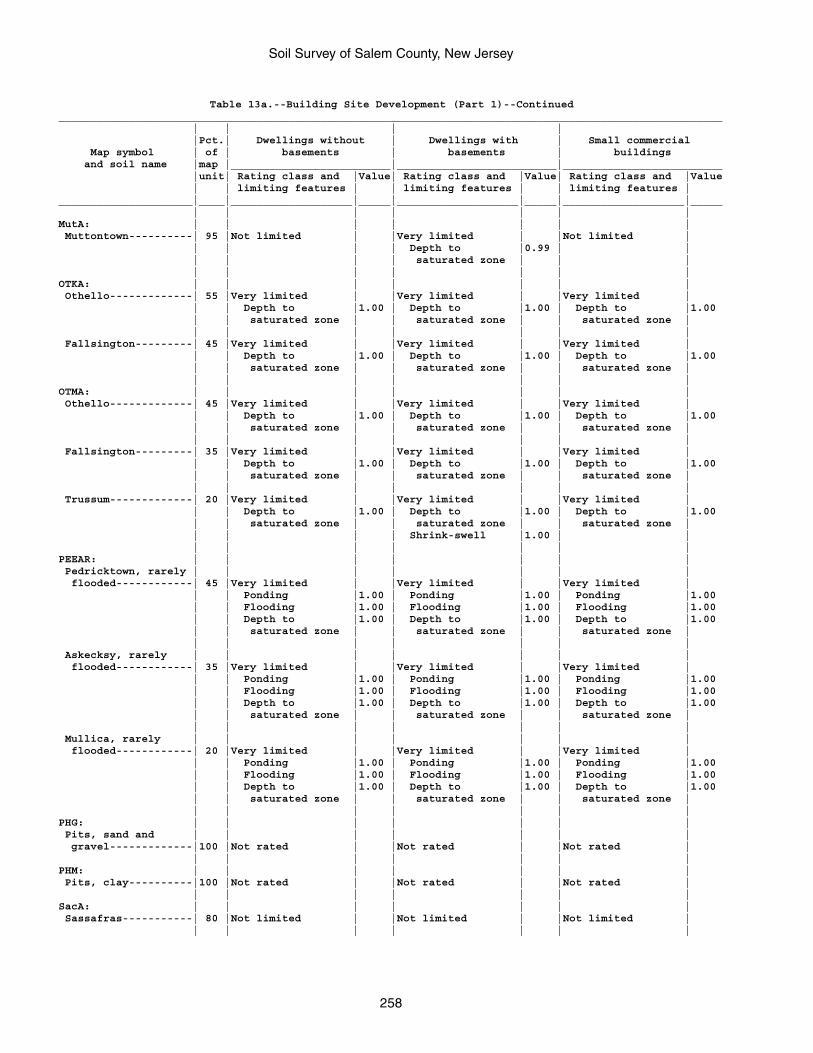
Soil Survey of Salem County, New Jersey
258
Table 13a.--Building Site Development (Part 1)--Continued________________________________________________________________________________________________________ | | | | |Pct.| Dwellings without | Dwellings with | Small commercial Map symbol | of | basements | basements | buildings and soil name |map |_________________________|_________________________|_________________________ |unit| Rating class and |Value| Rating class and |Value| Rating class and |Value | | limiting features | | limiting features | | limiting features |_____________________|____|___________________|_____|___________________|_____|___________________|_____ | | | | | | |MutA: | | | | | | | Muttontown----------| 95 |Not limited | |Very limited | |Not limited | | | | | Depth to |0.99 | | | | | | saturated zone | | | | | | | | | |OTKA: | | | | | | | Othello-------------| 55 |Very limited | |Very limited | |Very limited | | | Depth to |1.00 | Depth to |1.00 | Depth to |1.00 | | saturated zone | | saturated zone | | saturated zone | | | | | | | | Fallsington---------| 45 |Very limited | |Very limited | |Very limited | | | Depth to |1.00 | Depth to |1.00 | Depth to |1.00 | | saturated zone | | saturated zone | | saturated zone | | | | | | | |OTMA: | | | | | | | Othello-------------| 45 |Very limited | |Very limited | |Very limited | | | Depth to |1.00 | Depth to |1.00 | Depth to |1.00 | | saturated zone | | saturated zone | | saturated zone | | | | | | | | Fallsington---------| 35 |Very limited | |Very limited | |Very limited | | | Depth to |1.00 | Depth to |1.00 | Depth to |1.00 | | saturated zone | | saturated zone | | saturated zone | | | | | | | | Trussum-------------| 20 |Very limited | |Very limited | |Very limited | | | Depth to |1.00 | Depth to |1.00 | Depth to |1.00 | | saturated zone | | saturated zone | | saturated zone | | | | | Shrink-swell |1.00 | | | | | | | | |PEEAR: | | | | | | | Pedricktown, rarely | | | | | | | flooded------------| 45 |Very limited | |Very limited | |Very limited | | | Ponding |1.00 | Ponding |1.00 | Ponding |1.00 | | Flooding |1.00 | Flooding |1.00 | Flooding |1.00 | | Depth to |1.00 | Depth to |1.00 | Depth to |1.00 | | saturated zone | | saturated zone | | saturated zone | | | | | | | | Askecksy, rarely | | | | | | | flooded------------| 35 |Very limited | |Very limited | |Very limited | | | Ponding |1.00 | Ponding |1.00 | Ponding |1.00 | | Flooding |1.00 | Flooding |1.00 | Flooding |1.00 | | Depth to |1.00 | Depth to |1.00 | Depth to |1.00 | | saturated zone | | saturated zone | | saturated zone | | | | | | | | Mullica, rarely | | | | | | | flooded------------| 20 |Very limited | |Very limited | |Very limited | | | Ponding |1.00 | Ponding |1.00 | Ponding |1.00 | | Flooding |1.00 | Flooding |1.00 | Flooding |1.00 | | Depth to |1.00 | Depth to |1.00 | Depth to |1.00 | | saturated zone | | saturated zone | | saturated zone | | | | | | | |PHG: | | | | | | | Pits, sand and | | | | | | | gravel-------------|100 |Not rated | |Not rated | |Not rated | | | | | | | |PHM: | | | | | | | Pits, clay----------|100 |Not rated | |Not rated | |Not rated | | | | | | | |SacA: | | | | | | | Sassafras-----------| 80 |Not limited | |Not limited | |Not limited | | | | | | | |
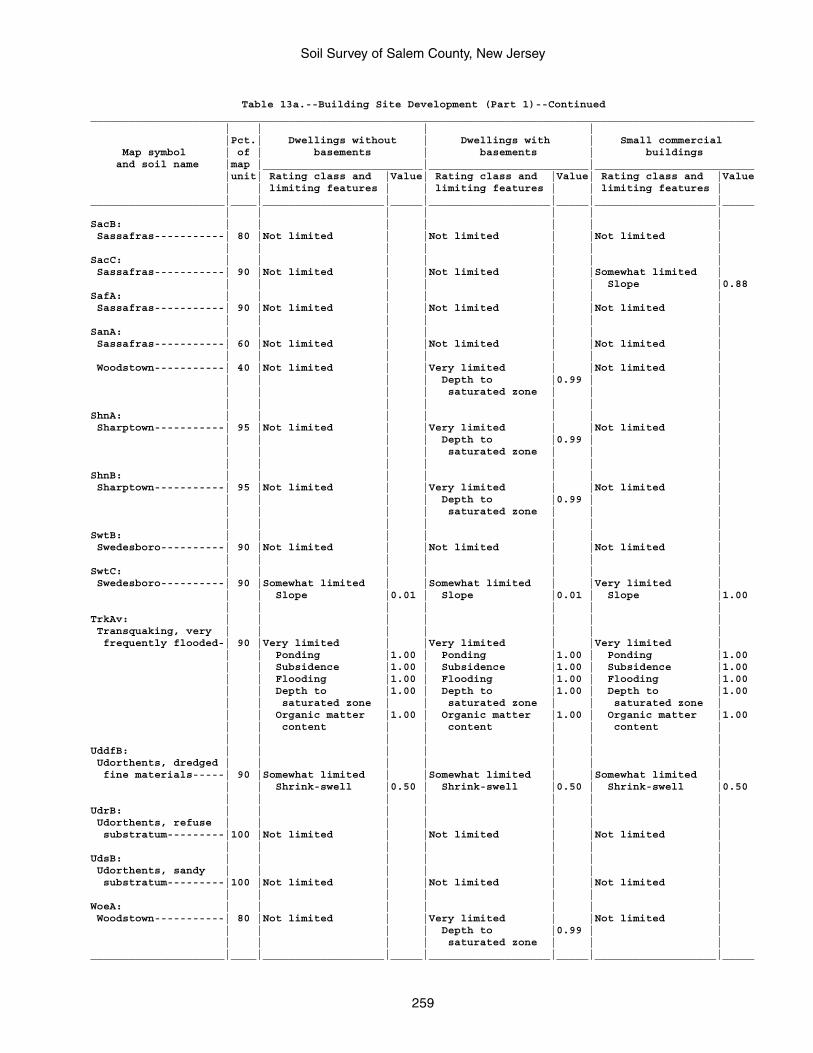
Soil Survey of Salem County, New Jersey
259
Table 13a.--Building Site Development (Part 1)--Continued________________________________________________________________________________________________________ | | | | |Pct.| Dwellings without | Dwellings with | Small commercial Map symbol | of | basements | basements | buildings and soil name |map |_________________________|_________________________|_________________________ |unit| Rating class and |Value| Rating class and |Value| Rating class and |Value | | limiting features | | limiting features | | limiting features |_____________________|____|___________________|_____|___________________|_____|___________________|_____ | | | | | | |SacB: | | | | | | | Sassafras-----------| 80 |Not limited | |Not limited | |Not limited | | | | | | | |SacC: | | | | | | | Sassafras-----------| 90 |Not limited | |Not limited | |Somewhat limited | | | | | | | Slope |0.88SafA: | | | | | | | Sassafras-----------| 90 |Not limited | |Not limited | |Not limited | | | | | | | |SanA: | | | | | | | Sassafras-----------| 60 |Not limited | |Not limited | |Not limited | | | | | | | | Woodstown-----------| 40 |Not limited | |Very limited | |Not limited | | | | | Depth to |0.99 | | | | | | saturated zone | | | | | | | | | |ShnA: | | | | | | | Sharptown-----------| 95 |Not limited | |Very limited | |Not limited | | | | | Depth to |0.99 | | | | | | saturated zone | | | | | | | | | |ShnB: | | | | | | | Sharptown-----------| 95 |Not limited | |Very limited | |Not limited | | | | | Depth to |0.99 | | | | | | saturated zone | | | | | | | | | |SwtB: | | | | | | | Swedesboro----------| 90 |Not limited | |Not limited | |Not limited | | | | | | | |SwtC: | | | | | | | Swedesboro----------| 90 |Somewhat limited | |Somewhat limited | |Very limited | | | Slope |0.01 | Slope |0.01 | Slope |1.00 | | | | | | |TrkAv: | | | | | | | Transquaking, very | | | | | | | frequently flooded-| 90 |Very limited | |Very limited | |Very limited | | | Ponding |1.00 | Ponding |1.00 | Ponding |1.00 | | Subsidence |1.00 | Subsidence |1.00 | Subsidence |1.00 | | Flooding |1.00 | Flooding |1.00 | Flooding |1.00 | | Depth to |1.00 | Depth to |1.00 | Depth to |1.00 | | saturated zone | | saturated zone | | saturated zone | | | Organic matter |1.00 | Organic matter |1.00 | Organic matter |1.00 | | content | | content | | content | | | | | | | |UddfB: | | | | | | | Udorthents, dredged | | | | | | | fine materials-----| 90 |Somewhat limited | |Somewhat limited | |Somewhat limited | | | Shrink-swell |0.50 | Shrink-swell |0.50 | Shrink-swell |0.50 | | | | | | |UdrB: | | | | | | | Udorthents, refuse | | | | | | | substratum---------|100 |Not limited | |Not limited | |Not limited | | | | | | | |UdsB: | | | | | | | Udorthents, sandy | | | | | | | substratum---------|100 |Not limited | |Not limited | |Not limited | | | | | | | |WoeA: | | | | | | | Woodstown-----------| 80 |Not limited | |Very limited | |Not limited | | | | | Depth to |0.99 | | | | | | saturated zone | | |_____________________|____|___________________|_____|___________________|_____|___________________|_____
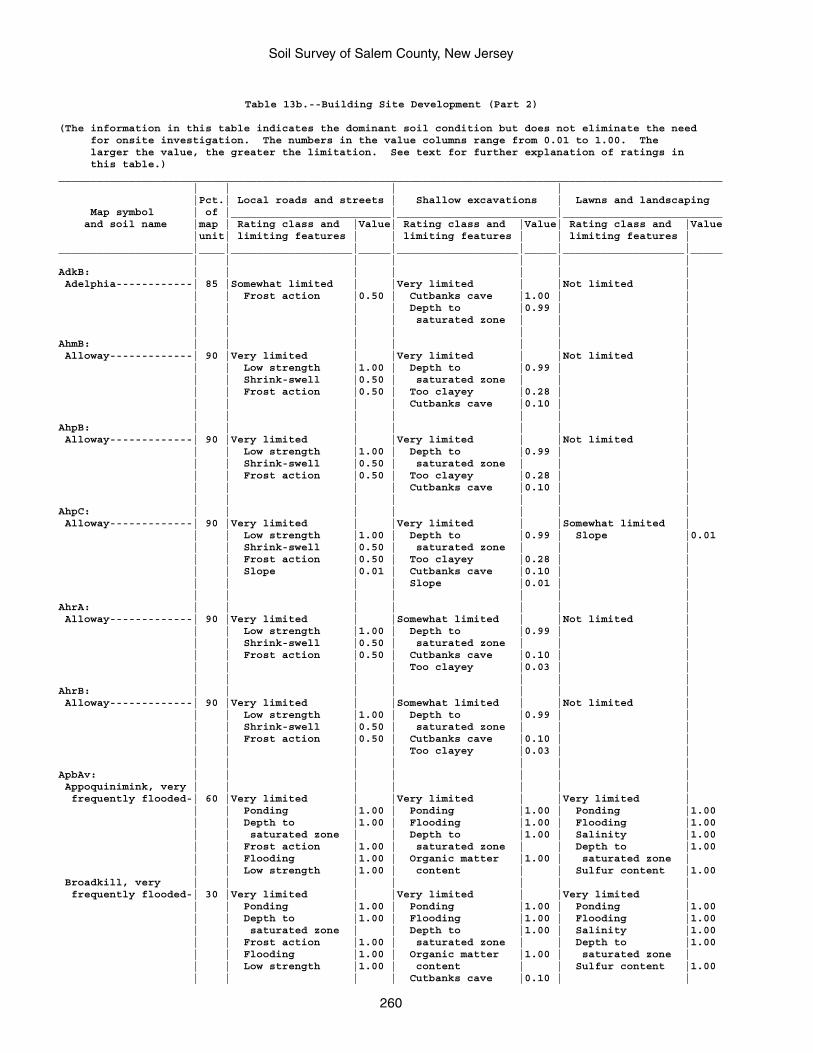
Soil Survey of Salem County, New Jersey
260
Table 13b.--Building Site Development (Part 2)
(The information in this table indicates the dominant soil condition but does not eliminate the need for onsite investigation. The numbers in the value columns range from 0.01 to 1.00. The larger the value, the greater the limitation. See text for further explanation of ratings in this table.)________________________________________________________________________________________________________ | | | | |Pct.| Local roads and streets | Shallow excavations | Lawns and landscaping Map symbol | of |_________________________|_________________________|_________________________ and soil name |map | Rating class and |Value| Rating class and |Value| Rating class and |Value |unit| limiting features | | limiting features | | limiting features |_____________________|____|___________________|_____|___________________|_____|___________________|_____ | | | | | | |AdkB: | | | | | | | Adelphia------------| 85 |Somewhat limited | |Very limited | |Not limited | | | Frost action |0.50 | Cutbanks cave |1.00 | | | | | | Depth to |0.99 | | | | | | saturated zone | | | | | | | | | |AhmB: | | | | | | | Alloway-------------| 90 |Very limited | |Very limited | |Not limited | | | Low strength |1.00 | Depth to |0.99 | | | | Shrink-swell |0.50 | saturated zone | | | | | Frost action |0.50 | Too clayey |0.28 | | | | | | Cutbanks cave |0.10 | | | | | | | | |AhpB: | | | | | | | Alloway-------------| 90 |Very limited | |Very limited | |Not limited | | | Low strength |1.00 | Depth to |0.99 | | | | Shrink-swell |0.50 | saturated zone | | | | | Frost action |0.50 | Too clayey |0.28 | | | | | | Cutbanks cave |0.10 | | | | | | | | |AhpC: | | | | | | | Alloway-------------| 90 |Very limited | |Very limited | |Somewhat limited | | | Low strength |1.00 | Depth to |0.99 | Slope |0.01 | | Shrink-swell |0.50 | saturated zone | | | | | Frost action |0.50 | Too clayey |0.28 | | | | Slope |0.01 | Cutbanks cave |0.10 | | | | | | Slope |0.01 | | | | | | | | |AhrA: | | | | | | | Alloway-------------| 90 |Very limited | |Somewhat limited | |Not limited | | | Low strength |1.00 | Depth to |0.99 | | | | Shrink-swell |0.50 | saturated zone | | | | | Frost action |0.50 | Cutbanks cave |0.10 | | | | | | Too clayey |0.03 | | | | | | | | |AhrB: | | | | | | | Alloway-------------| 90 |Very limited | |Somewhat limited | |Not limited | | | Low strength |1.00 | Depth to |0.99 | | | | Shrink-swell |0.50 | saturated zone | | | | | Frost action |0.50 | Cutbanks cave |0.10 | | | | | | Too clayey |0.03 | | | | | | | | |ApbAv: | | | | | | | Appoquinimink, very | | | | | | | frequently flooded-| 60 |Very limited | |Very limited | |Very limited | | | Ponding |1.00 | Ponding |1.00 | Ponding |1.00 | | Depth to |1.00 | Flooding |1.00 | Flooding |1.00 | | saturated zone | | Depth to |1.00 | Salinity |1.00 | | Frost action |1.00 | saturated zone | | Depth to |1.00 | | Flooding |1.00 | Organic matter |1.00 | saturated zone | | | Low strength |1.00 | content | | Sulfur content |1.00 Broadkill, very | | | | | | | frequently flooded-| 30 |Very limited | |Very limited | |Very limited | | | Ponding |1.00 | Ponding |1.00 | Ponding |1.00 | | Depth to |1.00 | Flooding |1.00 | Flooding |1.00 | | saturated zone | | Depth to |1.00 | Salinity |1.00 | | Frost action |1.00 | saturated zone | | Depth to |1.00 | | Flooding |1.00 | Organic matter |1.00 | saturated zone | | | Low strength |1.00 | content | | Sulfur content |1.00 | | | | Cutbanks cave |0.10 | |
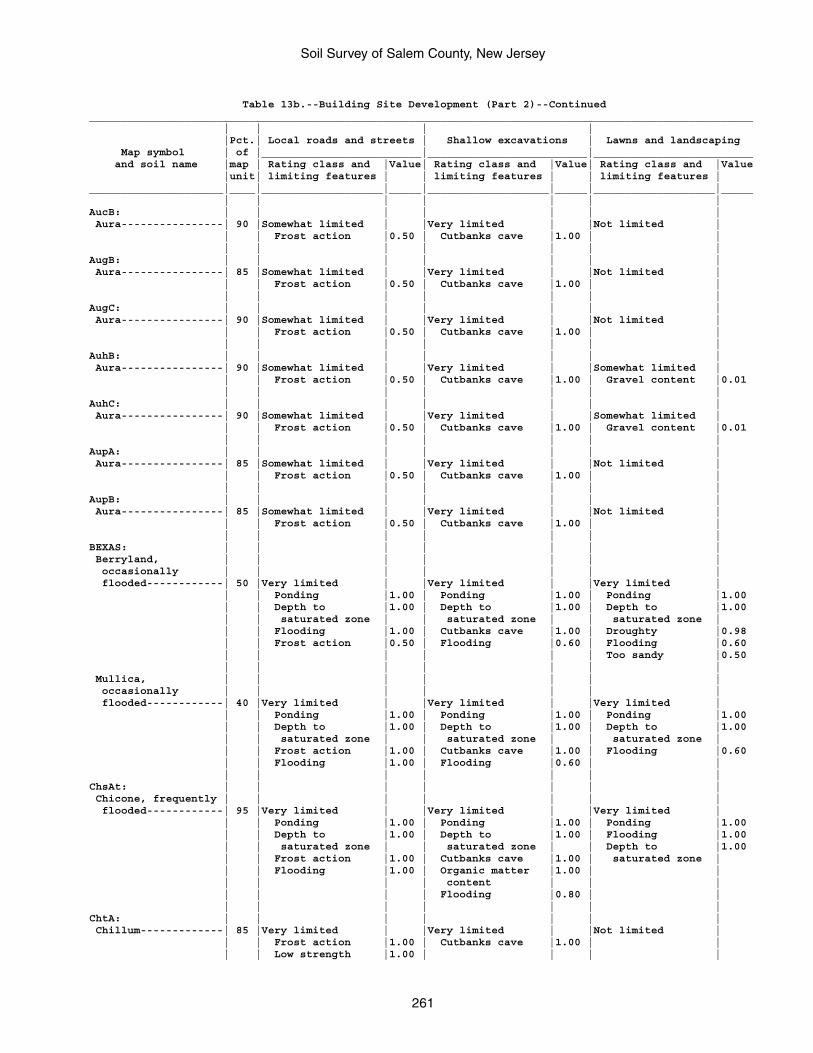
Soil Survey of Salem County, New Jersey
261
Table 13b.--Building Site Development (Part 2)--Continued________________________________________________________________________________________________________ | | | | |Pct.| Local roads and streets | Shallow excavations | Lawns and landscaping Map symbol | of |_________________________|_________________________|_________________________ and soil name |map | Rating class and |Value| Rating class and |Value| Rating class and |Value |unit| limiting features | | limiting features | | limiting features |_____________________|____|___________________|_____|___________________|_____|___________________|_____ | | | | | | |AucB: | | | | | | | Aura----------------| 90 |Somewhat limited | |Very limited | |Not limited | | | Frost action |0.50 | Cutbanks cave |1.00 | | | | | | | | |AugB: | | | | | | | Aura----------------| 85 |Somewhat limited | |Very limited | |Not limited | | | Frost action |0.50 | Cutbanks cave |1.00 | | | | | | | | |AugC: | | | | | | | Aura----------------| 90 |Somewhat limited | |Very limited | |Not limited | | | Frost action |0.50 | Cutbanks cave |1.00 | | | | | | | | |AuhB: | | | | | | | Aura----------------| 90 |Somewhat limited | |Very limited | |Somewhat limited | | | Frost action |0.50 | Cutbanks cave |1.00 | Gravel content |0.01 | | | | | | |AuhC: | | | | | | | Aura----------------| 90 |Somewhat limited | |Very limited | |Somewhat limited | | | Frost action |0.50 | Cutbanks cave |1.00 | Gravel content |0.01 | | | | | | |AupA: | | | | | | | Aura----------------| 85 |Somewhat limited | |Very limited | |Not limited | | | Frost action |0.50 | Cutbanks cave |1.00 | | | | | | | | |AupB: | | | | | | | Aura----------------| 85 |Somewhat limited | |Very limited | |Not limited | | | Frost action |0.50 | Cutbanks cave |1.00 | | | | | | | | |BEXAS: | | | | | | | Berryland, | | | | | | | occasionally | | | | | | | flooded------------| 50 |Very limited | |Very limited | |Very limited | | | Ponding |1.00 | Ponding |1.00 | Ponding |1.00 | | Depth to |1.00 | Depth to |1.00 | Depth to |1.00 | | saturated zone | | saturated zone | | saturated zone | | | Flooding |1.00 | Cutbanks cave |1.00 | Droughty |0.98 | | Frost action |0.50 | Flooding |0.60 | Flooding |0.60 | | | | | | Too sandy |0.50 | | | | | | | Mullica, | | | | | | | occasionally | | | | | | | flooded------------| 40 |Very limited | |Very limited | |Very limited | | | Ponding |1.00 | Ponding |1.00 | Ponding |1.00 | | Depth to |1.00 | Depth to |1.00 | Depth to |1.00 | | saturated zone | | saturated zone | | saturated zone | | | Frost action |1.00 | Cutbanks cave |1.00 | Flooding |0.60 | | Flooding |1.00 | Flooding |0.60 | | | | | | | | |ChsAt: | | | | | | | Chicone, frequently | | | | | | | flooded------------| 95 |Very limited | |Very limited | |Very limited | | | Ponding |1.00 | Ponding |1.00 | Ponding |1.00 | | Depth to |1.00 | Depth to |1.00 | Flooding |1.00 | | saturated zone | | saturated zone | | Depth to |1.00 | | Frost action |1.00 | Cutbanks cave |1.00 | saturated zone | | | Flooding |1.00 | Organic matter |1.00 | | | | | | content | | | | | | | Flooding |0.80 | | | | | | | | |ChtA: | | | | | | | Chillum-------------| 85 |Very limited | |Very limited | |Not limited | | | Frost action |1.00 | Cutbanks cave |1.00 | | | | Low strength |1.00 | | | |
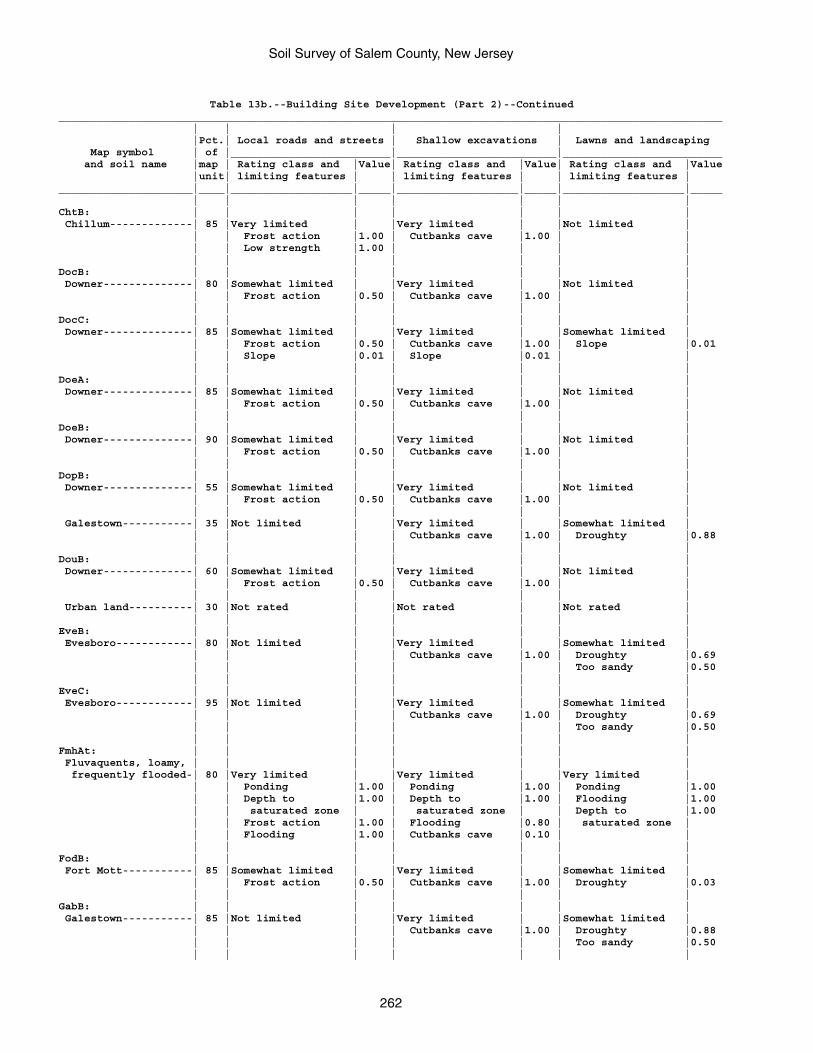
Soil Survey of Salem County, New Jersey
262
Table 13b.--Building Site Development (Part 2)--Continued________________________________________________________________________________________________________ | | | | |Pct.| Local roads and streets | Shallow excavations | Lawns and landscaping Map symbol | of |_________________________|_________________________|_________________________ and soil name |map | Rating class and |Value| Rating class and |Value| Rating class and |Value |unit| limiting features | | limiting features | | limiting features |_____________________|____|___________________|_____|___________________|_____|___________________|_____ | | | | | | |ChtB: | | | | | | | Chillum-------------| 85 |Very limited | |Very limited | |Not limited | | | Frost action |1.00 | Cutbanks cave |1.00 | | | | Low strength |1.00 | | | | | | | | | | |DocB: | | | | | | | Downer--------------| 80 |Somewhat limited | |Very limited | |Not limited | | | Frost action |0.50 | Cutbanks cave |1.00 | | | | | | | | |DocC: | | | | | | | Downer--------------| 85 |Somewhat limited | |Very limited | |Somewhat limited | | | Frost action |0.50 | Cutbanks cave |1.00 | Slope |0.01 | | Slope |0.01 | Slope |0.01 | | | | | | | | |DoeA: | | | | | | | Downer--------------| 85 |Somewhat limited | |Very limited | |Not limited | | | Frost action |0.50 | Cutbanks cave |1.00 | | | | | | | | |DoeB: | | | | | | | Downer--------------| 90 |Somewhat limited | |Very limited | |Not limited | | | Frost action |0.50 | Cutbanks cave |1.00 | | | | | | | | |DopB: | | | | | | | Downer--------------| 55 |Somewhat limited | |Very limited | |Not limited | | | Frost action |0.50 | Cutbanks cave |1.00 | | | | | | | | | Galestown-----------| 35 |Not limited | |Very limited | |Somewhat limited | | | | | Cutbanks cave |1.00 | Droughty |0.88 | | | | | | |DouB: | | | | | | | Downer--------------| 60 |Somewhat limited | |Very limited | |Not limited | | | Frost action |0.50 | Cutbanks cave |1.00 | | | | | | | | | Urban land----------| 30 |Not rated | |Not rated | |Not rated | | | | | | | |EveB: | | | | | | | Evesboro------------| 80 |Not limited | |Very limited | |Somewhat limited | | | | | Cutbanks cave |1.00 | Droughty |0.69 | | | | | | Too sandy |0.50 | | | | | | |EveC: | | | | | | | Evesboro------------| 95 |Not limited | |Very limited | |Somewhat limited | | | | | Cutbanks cave |1.00 | Droughty |0.69 | | | | | | Too sandy |0.50 | | | | | | |FmhAt: | | | | | | | Fluvaquents, loamy, | | | | | | | frequently flooded-| 80 |Very limited | |Very limited | |Very limited | | | Ponding |1.00 | Ponding |1.00 | Ponding |1.00 | | Depth to |1.00 | Depth to |1.00 | Flooding |1.00 | | saturated zone | | saturated zone | | Depth to |1.00 | | Frost action |1.00 | Flooding |0.80 | saturated zone | | | Flooding |1.00 | Cutbanks cave |0.10 | | | | | | | | |FodB: | | | | | | | Fort Mott-----------| 85 |Somewhat limited | |Very limited | |Somewhat limited | | | Frost action |0.50 | Cutbanks cave |1.00 | Droughty |0.03 | | | | | | |GabB: | | | | | | | Galestown-----------| 85 |Not limited | |Very limited | |Somewhat limited | | | | | Cutbanks cave |1.00 | Droughty |0.88 | | | | | | Too sandy |0.50 | | | | | | |
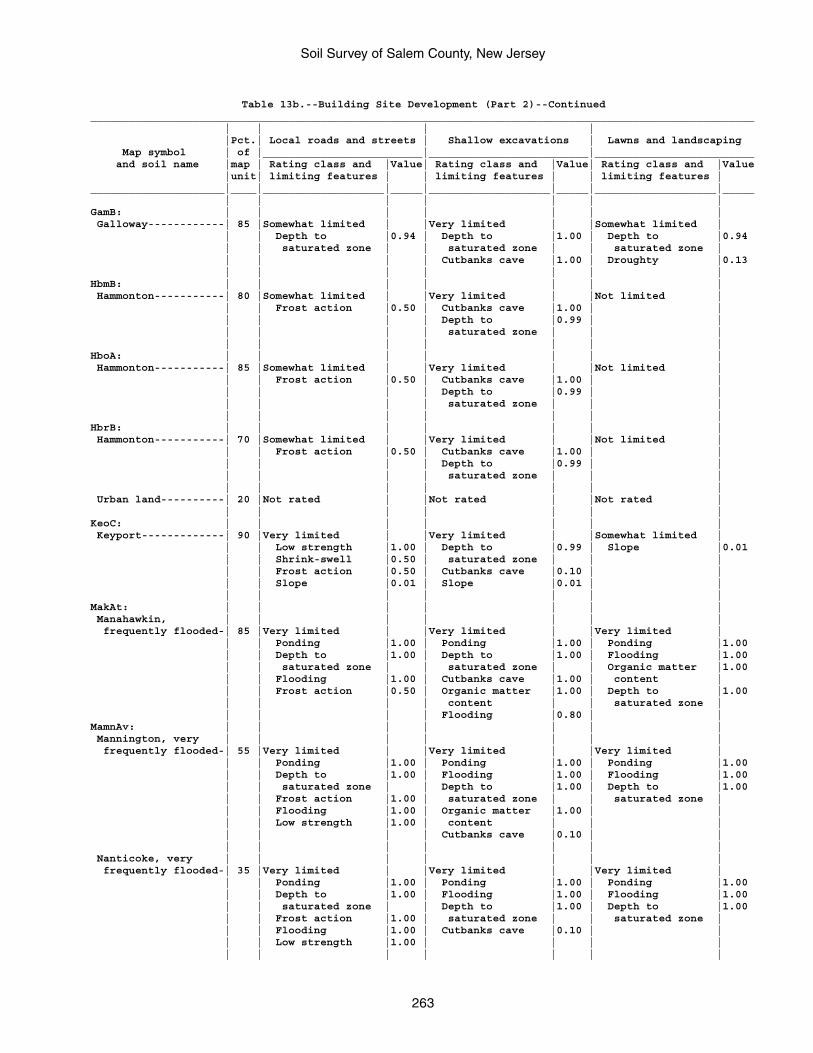
Soil Survey of Salem County, New Jersey
263
Table 13b.--Building Site Development (Part 2)--Continued________________________________________________________________________________________________________ | | | | |Pct.| Local roads and streets | Shallow excavations | Lawns and landscaping Map symbol | of |_________________________|_________________________|_________________________ and soil name |map | Rating class and |Value| Rating class and |Value| Rating class and |Value |unit| limiting features | | limiting features | | limiting features |_____________________|____|___________________|_____|___________________|_____|___________________|_____ | | | | | | |GamB: | | | | | | | Galloway------------| 85 |Somewhat limited | |Very limited | |Somewhat limited | | | Depth to |0.94 | Depth to |1.00 | Depth to |0.94 | | saturated zone | | saturated zone | | saturated zone | | | | | Cutbanks cave |1.00 | Droughty |0.13 | | | | | | |HbmB: | | | | | | | Hammonton-----------| 80 |Somewhat limited | |Very limited | |Not limited | | | Frost action |0.50 | Cutbanks cave |1.00 | | | | | | Depth to |0.99 | | | | | | saturated zone | | | | | | | | | |HboA: | | | | | | | Hammonton-----------| 85 |Somewhat limited | |Very limited | |Not limited | | | Frost action |0.50 | Cutbanks cave |1.00 | | | | | | Depth to |0.99 | | | | | | saturated zone | | | | | | | | | |HbrB: | | | | | | | Hammonton-----------| 70 |Somewhat limited | |Very limited | |Not limited | | | Frost action |0.50 | Cutbanks cave |1.00 | | | | | | Depth to |0.99 | | | | | | saturated zone | | | | | | | | | | Urban land----------| 20 |Not rated | |Not rated | |Not rated | | | | | | | |KeoC: | | | | | | | Keyport-------------| 90 |Very limited | |Very limited | |Somewhat limited | | | Low strength |1.00 | Depth to |0.99 | Slope |0.01 | | Shrink-swell |0.50 | saturated zone | | | | | Frost action |0.50 | Cutbanks cave |0.10 | | | | Slope |0.01 | Slope |0.01 | | | | | | | | |MakAt: | | | | | | | Manahawkin, | | | | | | | frequently flooded-| 85 |Very limited | |Very limited | |Very limited | | | Ponding |1.00 | Ponding |1.00 | Ponding |1.00 | | Depth to |1.00 | Depth to |1.00 | Flooding |1.00 | | saturated zone | | saturated zone | | Organic matter |1.00 | | Flooding |1.00 | Cutbanks cave |1.00 | content | | | Frost action |0.50 | Organic matter |1.00 | Depth to |1.00 | | | | content | | saturated zone | | | | | Flooding |0.80 | |MamnAv: | | | | | | | Mannington, very | | | | | | | frequently flooded-| 55 |Very limited | |Very limited | |Very limited | | | Ponding |1.00 | Ponding |1.00 | Ponding |1.00 | | Depth to |1.00 | Flooding |1.00 | Flooding |1.00 | | saturated zone | | Depth to |1.00 | Depth to |1.00 | | Frost action |1.00 | saturated zone | | saturated zone | | | Flooding |1.00 | Organic matter |1.00 | | | | Low strength |1.00 | content | | | | | | | Cutbanks cave |0.10 | | | | | | | | | Nanticoke, very | | | | | | | frequently flooded-| 35 |Very limited | |Very limited | |Very limited | | | Ponding |1.00 | Ponding |1.00 | Ponding |1.00 | | Depth to |1.00 | Flooding |1.00 | Flooding |1.00 | | saturated zone | | Depth to |1.00 | Depth to |1.00 | | Frost action |1.00 | saturated zone | | saturated zone | | | Flooding |1.00 | Cutbanks cave |0.10 | | | | Low strength |1.00 | | | | | | | | | | |
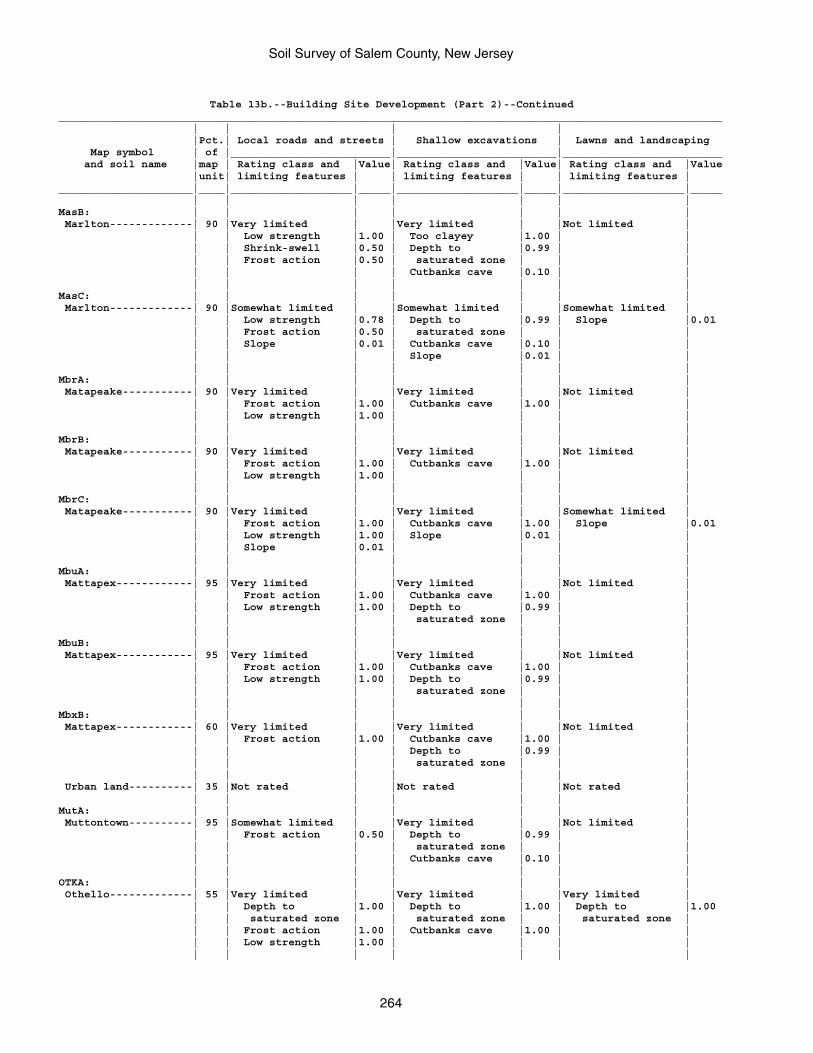
Soil Survey of Salem County, New Jersey
264
Table 13b.--Building Site Development (Part 2)--Continued________________________________________________________________________________________________________ | | | | |Pct.| Local roads and streets | Shallow excavations | Lawns and landscaping Map symbol | of |_________________________|_________________________|_________________________ and soil name |map | Rating class and |Value| Rating class and |Value| Rating class and |Value |unit| limiting features | | limiting features | | limiting features |_____________________|____|___________________|_____|___________________|_____|___________________|_____ | | | | | | |MasB: | | | | | | | Marlton-------------| 90 |Very limited | |Very limited | |Not limited | | | Low strength |1.00 | Too clayey |1.00 | | | | Shrink-swell |0.50 | Depth to |0.99 | | | | Frost action |0.50 | saturated zone | | | | | | | Cutbanks cave |0.10 | | | | | | | | |MasC: | | | | | | | Marlton-------------| 90 |Somewhat limited | |Somewhat limited | |Somewhat limited | | | Low strength |0.78 | Depth to |0.99 | Slope |0.01 | | Frost action |0.50 | saturated zone | | | | | Slope |0.01 | Cutbanks cave |0.10 | | | | | | Slope |0.01 | | | | | | | | |MbrA: | | | | | | | Matapeake-----------| 90 |Very limited | |Very limited | |Not limited | | | Frost action |1.00 | Cutbanks cave |1.00 | | | | Low strength |1.00 | | | | | | | | | | |MbrB: | | | | | | | Matapeake-----------| 90 |Very limited | |Very limited | |Not limited | | | Frost action |1.00 | Cutbanks cave |1.00 | | | | Low strength |1.00 | | | | | | | | | | |MbrC: | | | | | | | Matapeake-----------| 90 |Very limited | |Very limited | |Somewhat limited | | | Frost action |1.00 | Cutbanks cave |1.00 | Slope |0.01 | | Low strength |1.00 | Slope |0.01 | | | | Slope |0.01 | | | | | | | | | | |MbuA: | | | | | | | Mattapex------------| 95 |Very limited | |Very limited | |Not limited | | | Frost action |1.00 | Cutbanks cave |1.00 | | | | Low strength |1.00 | Depth to |0.99 | | | | | | saturated zone | | | | | | | | | |MbuB: | | | | | | | Mattapex------------| 95 |Very limited | |Very limited | |Not limited | | | Frost action |1.00 | Cutbanks cave |1.00 | | | | Low strength |1.00 | Depth to |0.99 | | | | | | saturated zone | | | | | | | | | |MbxB: | | | | | | | Mattapex------------| 60 |Very limited | |Very limited | |Not limited | | | Frost action |1.00 | Cutbanks cave |1.00 | | | | | | Depth to |0.99 | | | | | | saturated zone | | | | | | | | | | Urban land----------| 35 |Not rated | |Not rated | |Not rated | | | | | | | |MutA: | | | | | | | Muttontown----------| 95 |Somewhat limited | |Very limited | |Not limited | | | Frost action |0.50 | Depth to |0.99 | | | | | | saturated zone | | | | | | | Cutbanks cave |0.10 | | | | | | | | |OTKA: | | | | | | | Othello-------------| 55 |Very limited | |Very limited | |Very limited | | | Depth to |1.00 | Depth to |1.00 | Depth to |1.00 | | saturated zone | | saturated zone | | saturated zone | | | Frost action |1.00 | Cutbanks cave |1.00 | | | | Low strength |1.00 | | | | | | | | | | |
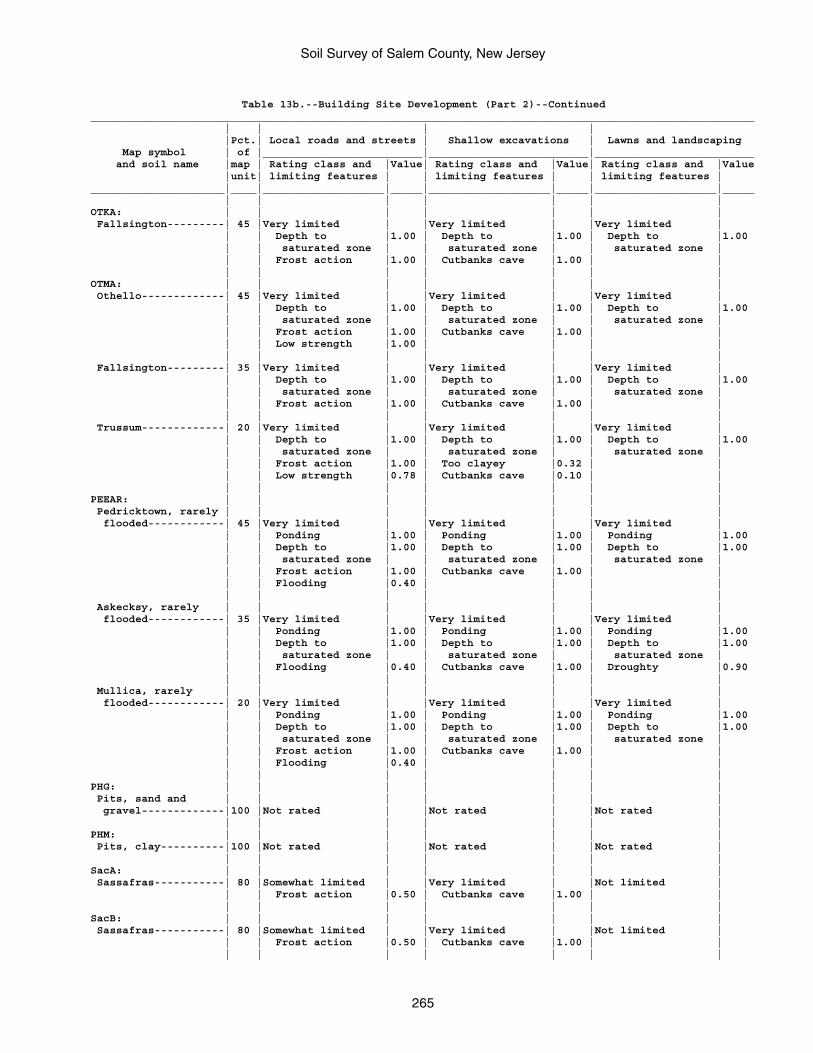
Soil Survey of Salem County, New Jersey
265
Table 13b.--Building Site Development (Part 2)--Continued________________________________________________________________________________________________________ | | | | |Pct.| Local roads and streets | Shallow excavations | Lawns and landscaping Map symbol | of |_________________________|_________________________|_________________________ and soil name |map | Rating class and |Value| Rating class and |Value| Rating class and |Value |unit| limiting features | | limiting features | | limiting features |_____________________|____|___________________|_____|___________________|_____|___________________|_____ | | | | | | |OTKA: | | | | | | | Fallsington---------| 45 |Very limited | |Very limited | |Very limited | | | Depth to |1.00 | Depth to |1.00 | Depth to |1.00 | | saturated zone | | saturated zone | | saturated zone | | | Frost action |1.00 | Cutbanks cave |1.00 | | | | | | | | |OTMA: | | | | | | | Othello-------------| 45 |Very limited | |Very limited | |Very limited | | | Depth to |1.00 | Depth to |1.00 | Depth to |1.00 | | saturated zone | | saturated zone | | saturated zone | | | Frost action |1.00 | Cutbanks cave |1.00 | | | | Low strength |1.00 | | | | | | | | | | | Fallsington---------| 35 |Very limited | |Very limited | |Very limited | | | Depth to |1.00 | Depth to |1.00 | Depth to |1.00 | | saturated zone | | saturated zone | | saturated zone | | | Frost action |1.00 | Cutbanks cave |1.00 | | | | | | | | | Trussum-------------| 20 |Very limited | |Very limited | |Very limited | | | Depth to |1.00 | Depth to |1.00 | Depth to |1.00 | | saturated zone | | saturated zone | | saturated zone | | | Frost action |1.00 | Too clayey |0.32 | | | | Low strength |0.78 | Cutbanks cave |0.10 | | | | | | | | |PEEAR: | | | | | | | Pedricktown, rarely | | | | | | | flooded------------| 45 |Very limited | |Very limited | |Very limited | | | Ponding |1.00 | Ponding |1.00 | Ponding |1.00 | | Depth to |1.00 | Depth to |1.00 | Depth to |1.00 | | saturated zone | | saturated zone | | saturated zone | | | Frost action |1.00 | Cutbanks cave |1.00 | | | | Flooding |0.40 | | | | | | | | | | | Askecksy, rarely | | | | | | | flooded------------| 35 |Very limited | |Very limited | |Very limited | | | Ponding |1.00 | Ponding |1.00 | Ponding |1.00 | | Depth to |1.00 | Depth to |1.00 | Depth to |1.00 | | saturated zone | | saturated zone | | saturated zone | | | Flooding |0.40 | Cutbanks cave |1.00 | Droughty |0.90 | | | | | | | Mullica, rarely | | | | | | | flooded------------| 20 |Very limited | |Very limited | |Very limited | | | Ponding |1.00 | Ponding |1.00 | Ponding |1.00 | | Depth to |1.00 | Depth to |1.00 | Depth to |1.00 | | saturated zone | | saturated zone | | saturated zone | | | Frost action |1.00 | Cutbanks cave |1.00 | | | | Flooding |0.40 | | | | | | | | | | |PHG: | | | | | | | Pits, sand and | | | | | | | gravel-------------|100 |Not rated | |Not rated | |Not rated | | | | | | | |PHM: | | | | | | | Pits, clay----------|100 |Not rated | |Not rated | |Not rated | | | | | | | |SacA: | | | | | | | Sassafras-----------| 80 |Somewhat limited | |Very limited | |Not limited | | | Frost action |0.50 | Cutbanks cave |1.00 | | | | | | | | |SacB: | | | | | | | Sassafras-----------| 80 |Somewhat limited | |Very limited | |Not limited | | | Frost action |0.50 | Cutbanks cave |1.00 | | | | | | | | |
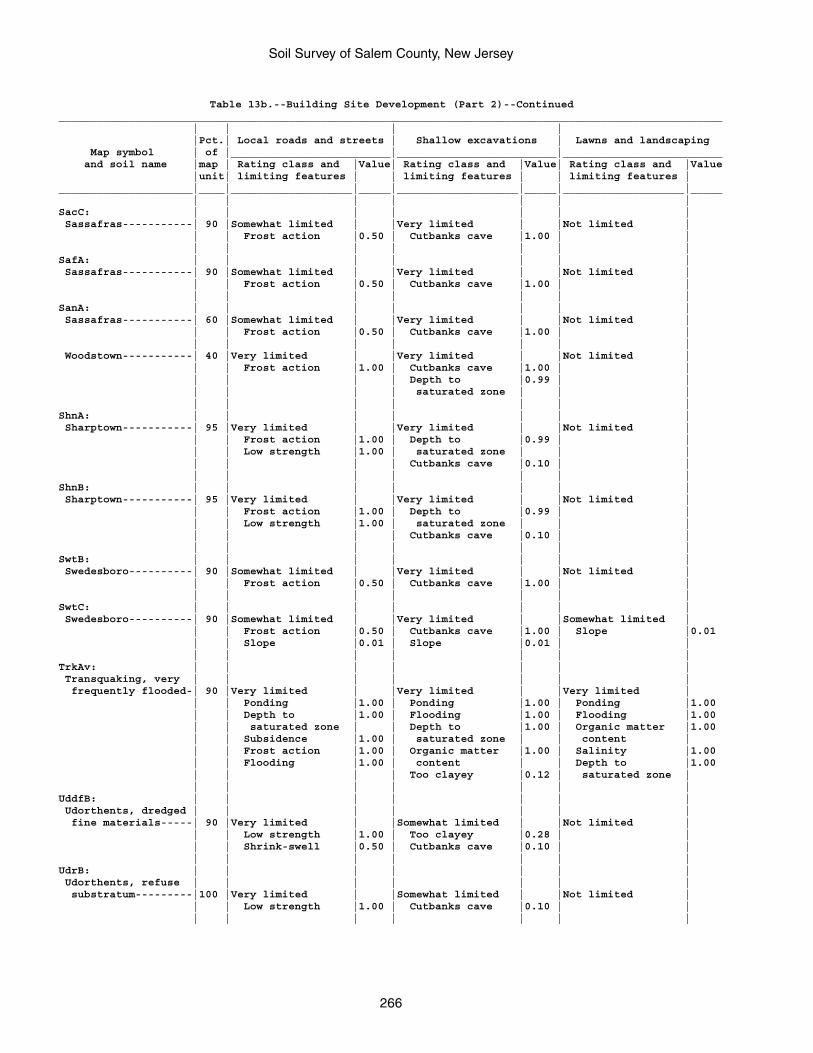
Soil Survey of Salem County, New Jersey
266
Table 13b.--Building Site Development (Part 2)--Continued________________________________________________________________________________________________________ | | | | |Pct.| Local roads and streets | Shallow excavations | Lawns and landscaping Map symbol | of |_________________________|_________________________|_________________________ and soil name |map | Rating class and |Value| Rating class and |Value| Rating class and |Value |unit| limiting features | | limiting features | | limiting features |_____________________|____|___________________|_____|___________________|_____|___________________|_____ | | | | | | |SacC: | | | | | | | Sassafras-----------| 90 |Somewhat limited | |Very limited | |Not limited | | | Frost action |0.50 | Cutbanks cave |1.00 | | | | | | | | |SafA: | | | | | | | Sassafras-----------| 90 |Somewhat limited | |Very limited | |Not limited | | | Frost action |0.50 | Cutbanks cave |1.00 | | | | | | | | |SanA: | | | | | | | Sassafras-----------| 60 |Somewhat limited | |Very limited | |Not limited | | | Frost action |0.50 | Cutbanks cave |1.00 | | | | | | | | | Woodstown-----------| 40 |Very limited | |Very limited | |Not limited | | | Frost action |1.00 | Cutbanks cave |1.00 | | | | | | Depth to |0.99 | | | | | | saturated zone | | | | | | | | | |ShnA: | | | | | | | Sharptown-----------| 95 |Very limited | |Very limited | |Not limited | | | Frost action |1.00 | Depth to |0.99 | | | | Low strength |1.00 | saturated zone | | | | | | | Cutbanks cave |0.10 | | | | | | | | |ShnB: | | | | | | | Sharptown-----------| 95 |Very limited | |Very limited | |Not limited | | | Frost action |1.00 | Depth to |0.99 | | | | Low strength |1.00 | saturated zone | | | | | | | Cutbanks cave |0.10 | | | | | | | | |SwtB: | | | | | | | Swedesboro----------| 90 |Somewhat limited | |Very limited | |Not limited | | | Frost action |0.50 | Cutbanks cave |1.00 | | | | | | | | |SwtC: | | | | | | | Swedesboro----------| 90 |Somewhat limited | |Very limited | |Somewhat limited | | | Frost action |0.50 | Cutbanks cave |1.00 | Slope |0.01 | | Slope |0.01 | Slope |0.01 | | | | | | | | |TrkAv: | | | | | | | Transquaking, very | | | | | | | frequently flooded-| 90 |Very limited | |Very limited | |Very limited | | | Ponding |1.00 | Ponding |1.00 | Ponding |1.00 | | Depth to |1.00 | Flooding |1.00 | Flooding |1.00 | | saturated zone | | Depth to |1.00 | Organic matter |1.00 | | Subsidence |1.00 | saturated zone | | content | | | Frost action |1.00 | Organic matter |1.00 | Salinity |1.00 | | Flooding |1.00 | content | | Depth to |1.00 | | | | Too clayey |0.12 | saturated zone | | | | | | | |UddfB: | | | | | | | Udorthents, dredged | | | | | | | fine materials-----| 90 |Very limited | |Somewhat limited | |Not limited | | | Low strength |1.00 | Too clayey |0.28 | | | | Shrink-swell |0.50 | Cutbanks cave |0.10 | | | | | | | | |UdrB: | | | | | | | Udorthents, refuse | | | | | | | substratum---------|100 |Very limited | |Somewhat limited | |Not limited | | | Low strength |1.00 | Cutbanks cave |0.10 | | | | | | | | |
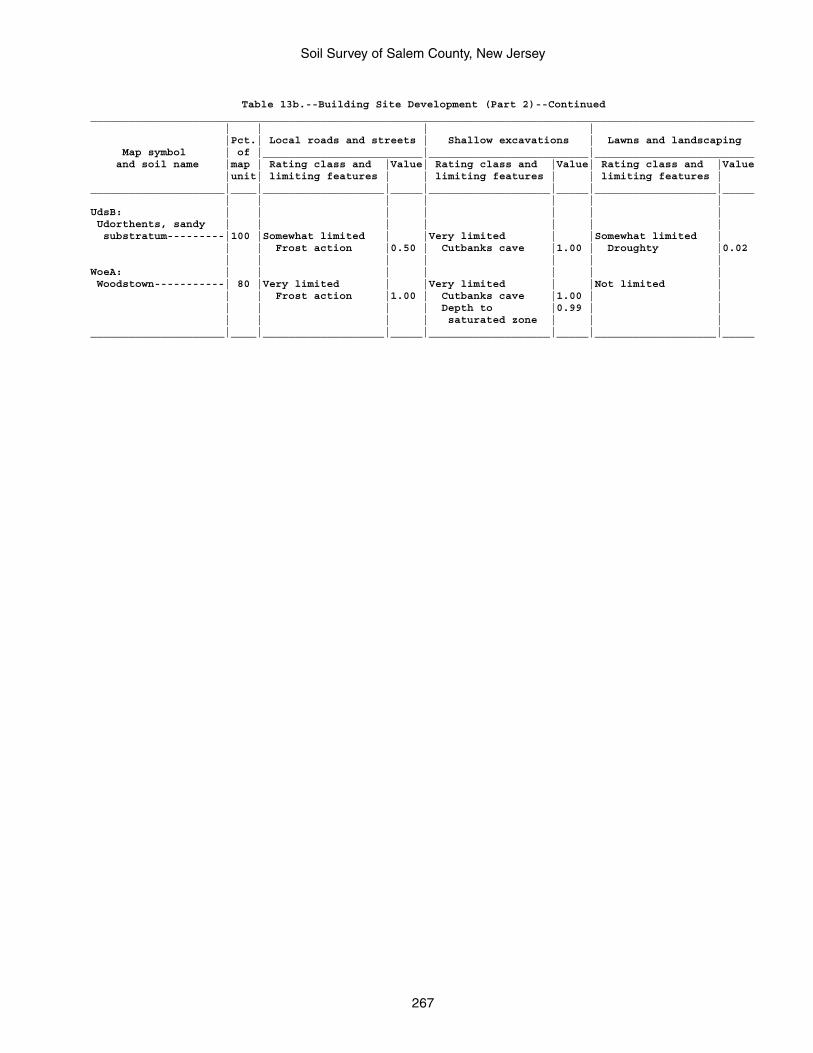
Soil Survey of Salem County, New Jersey
267
Table 13b.--Building Site Development (Part 2)--Continued________________________________________________________________________________________________________ | | | | |Pct.| Local roads and streets | Shallow excavations | Lawns and landscaping Map symbol | of |_________________________|_________________________|_________________________ and soil name |map | Rating class and |Value| Rating class and |Value| Rating class and |Value |unit| limiting features | | limiting features | | limiting features |_____________________|____|___________________|_____|___________________|_____|___________________|_____ | | | | | | |UdsB: | | | | | | | Udorthents, sandy | | | | | | | substratum---------|100 |Somewhat limited | |Very limited | |Somewhat limited | | | Frost action |0.50 | Cutbanks cave |1.00 | Droughty |0.02 | | | | | | |WoeA: | | | | | | | Woodstown-----------| 80 |Very limited | |Very limited | |Not limited | | | Frost action |1.00 | Cutbanks cave |1.00 | | | | | | Depth to |0.99 | | | | | | saturated zone | | |_____________________|____|___________________|_____|___________________|_____|___________________|_____
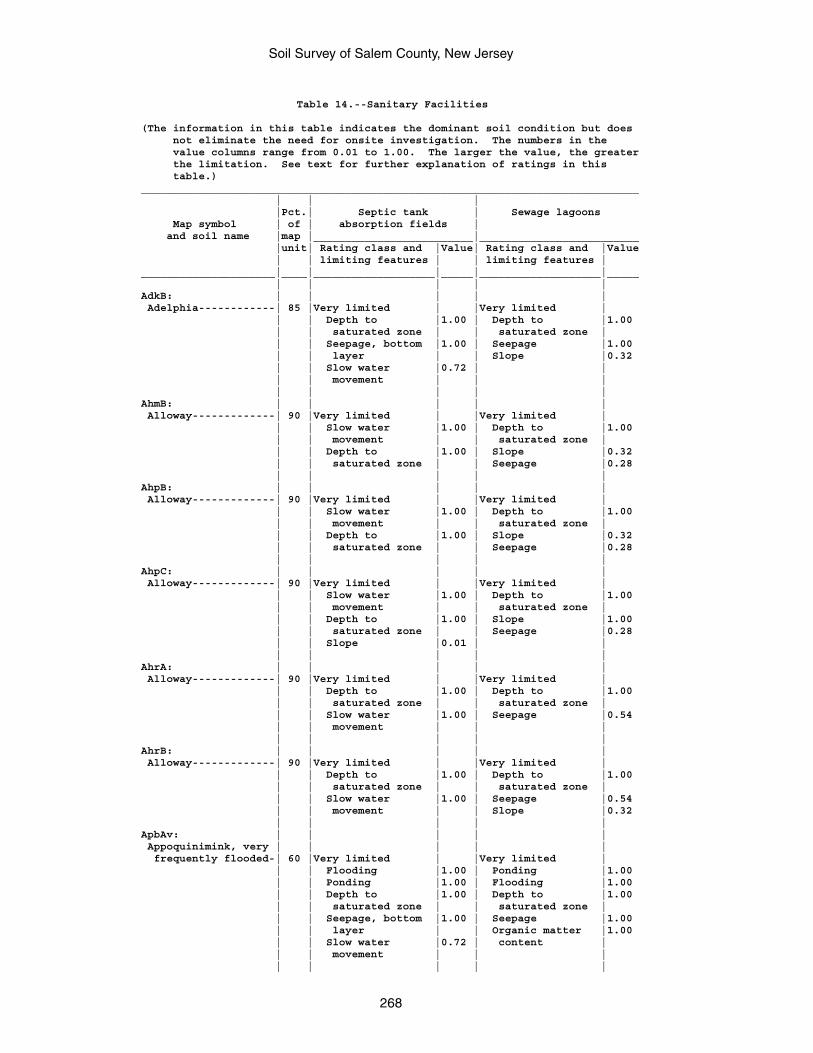
Soil Survey of Salem County, New Jersey
268
Table 14.--Sanitary Facilities
(The information in this table indicates the dominant soil condition but does not eliminate the need for onsite investigation. The numbers in the value columns range from 0.01 to 1.00. The larger the value, the greater the limitation. See text for further explanation of ratings in this table.)______________________________________________________________________________ | | | |Pct.| Septic tank | Sewage lagoons Map symbol | of | absorption fields | and soil name |map |_________________________|_________________________ |unit| Rating class and |Value| Rating class and |Value | | limiting features | | limiting features |_____________________|____|___________________|_____|___________________|_____ | | | | |AdkB: | | | | | Adelphia------------| 85 |Very limited | |Very limited | | | Depth to |1.00 | Depth to |1.00 | | saturated zone | | saturated zone | | | Seepage, bottom |1.00 | Seepage |1.00 | | layer | | Slope |0.32 | | Slow water |0.72 | | | | movement | | | | | | | |AhmB: | | | | | Alloway-------------| 90 |Very limited | |Very limited | | | Slow water |1.00 | Depth to |1.00 | | movement | | saturated zone | | | Depth to |1.00 | Slope |0.32 | | saturated zone | | Seepage |0.28 | | | | |AhpB: | | | | | Alloway-------------| 90 |Very limited | |Very limited | | | Slow water |1.00 | Depth to |1.00 | | movement | | saturated zone | | | Depth to |1.00 | Slope |0.32 | | saturated zone | | Seepage |0.28 | | | | |AhpC: | | | | | Alloway-------------| 90 |Very limited | |Very limited | | | Slow water |1.00 | Depth to |1.00 | | movement | | saturated zone | | | Depth to |1.00 | Slope |1.00 | | saturated zone | | Seepage |0.28 | | Slope |0.01 | | | | | | |AhrA: | | | | | Alloway-------------| 90 |Very limited | |Very limited | | | Depth to |1.00 | Depth to |1.00 | | saturated zone | | saturated zone | | | Slow water |1.00 | Seepage |0.54 | | movement | | | | | | | |AhrB: | | | | | Alloway-------------| 90 |Very limited | |Very limited | | | Depth to |1.00 | Depth to |1.00 | | saturated zone | | saturated zone | | | Slow water |1.00 | Seepage |0.54 | | movement | | Slope |0.32 | | | | |ApbAv: | | | | | Appoquinimink, very | | | | | frequently flooded-| 60 |Very limited | |Very limited | | | Flooding |1.00 | Ponding |1.00 | | Ponding |1.00 | Flooding |1.00 | | Depth to |1.00 | Depth to |1.00 | | saturated zone | | saturated zone | | | Seepage, bottom |1.00 | Seepage |1.00 | | layer | | Organic matter |1.00 | | Slow water |0.72 | content | | | movement | | | | | | | |
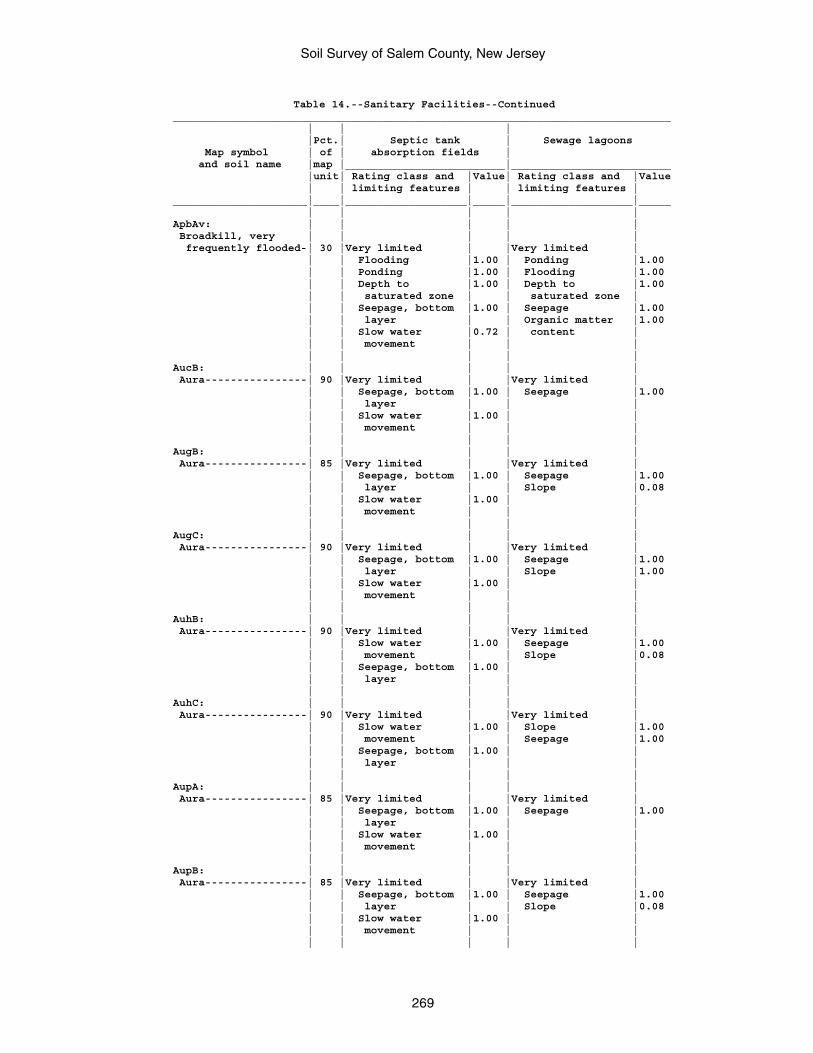
Soil Survey of Salem County, New Jersey
269
Table 14.--Sanitary Facilities--Continued______________________________________________________________________________ | | | |Pct.| Septic tank | Sewage lagoons Map symbol | of | absorption fields | and soil name |map |_________________________|_________________________ |unit| Rating class and |Value| Rating class and |Value | | limiting features | | limiting features |_____________________|____|___________________|_____|___________________|_____ | | | | |ApbAv: | | | | | Broadkill, very | | | | | frequently flooded-| 30 |Very limited | |Very limited | | | Flooding |1.00 | Ponding |1.00 | | Ponding |1.00 | Flooding |1.00 | | Depth to |1.00 | Depth to |1.00 | | saturated zone | | saturated zone | | | Seepage, bottom |1.00 | Seepage |1.00 | | layer | | Organic matter |1.00 | | Slow water |0.72 | content | | | movement | | | | | | | |AucB: | | | | | Aura----------------| 90 |Very limited | |Very limited | | | Seepage, bottom |1.00 | Seepage |1.00 | | layer | | | | | Slow water |1.00 | | | | movement | | | | | | | |AugB: | | | | | Aura----------------| 85 |Very limited | |Very limited | | | Seepage, bottom |1.00 | Seepage |1.00 | | layer | | Slope |0.08 | | Slow water |1.00 | | | | movement | | | | | | | |AugC: | | | | | Aura----------------| 90 |Very limited | |Very limited | | | Seepage, bottom |1.00 | Seepage |1.00 | | layer | | Slope |1.00 | | Slow water |1.00 | | | | movement | | | | | | | |AuhB: | | | | | Aura----------------| 90 |Very limited | |Very limited | | | Slow water |1.00 | Seepage |1.00 | | movement | | Slope |0.08 | | Seepage, bottom |1.00 | | | | layer | | | | | | | |AuhC: | | | | | Aura----------------| 90 |Very limited | |Very limited | | | Slow water |1.00 | Slope |1.00 | | movement | | Seepage |1.00 | | Seepage, bottom |1.00 | | | | layer | | | | | | | |AupA: | | | | | Aura----------------| 85 |Very limited | |Very limited | | | Seepage, bottom |1.00 | Seepage |1.00 | | layer | | | | | Slow water |1.00 | | | | movement | | | | | | | |AupB: | | | | | Aura----------------| 85 |Very limited | |Very limited | | | Seepage, bottom |1.00 | Seepage |1.00 | | layer | | Slope |0.08 | | Slow water |1.00 | | | | movement | | | | | | | |
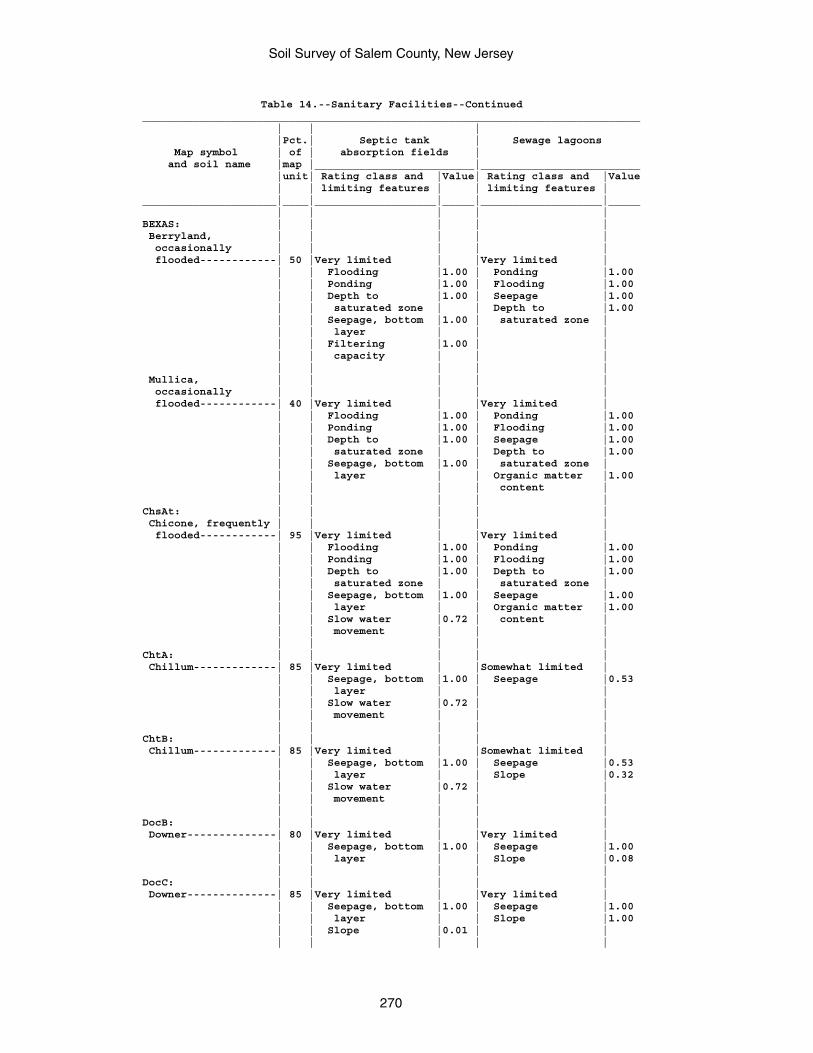
Soil Survey of Salem County, New Jersey
270
Table 14.--Sanitary Facilities--Continued______________________________________________________________________________ | | | |Pct.| Septic tank | Sewage lagoons Map symbol | of | absorption fields | and soil name |map |_________________________|_________________________ |unit| Rating class and |Value| Rating class and |Value | | limiting features | | limiting features |_____________________|____|___________________|_____|___________________|_____ | | | | |BEXAS: | | | | | Berryland, | | | | | occasionally | | | | | flooded------------| 50 |Very limited | |Very limited | | | Flooding |1.00 | Ponding |1.00 | | Ponding |1.00 | Flooding |1.00 | | Depth to |1.00 | Seepage |1.00 | | saturated zone | | Depth to |1.00 | | Seepage, bottom |1.00 | saturated zone | | | layer | | | | | Filtering |1.00 | | | | capacity | | | | | | | | Mullica, | | | | | occasionally | | | | | flooded------------| 40 |Very limited | |Very limited | | | Flooding |1.00 | Ponding |1.00 | | Ponding |1.00 | Flooding |1.00 | | Depth to |1.00 | Seepage |1.00 | | saturated zone | | Depth to |1.00 | | Seepage, bottom |1.00 | saturated zone | | | layer | | Organic matter |1.00 | | | | content | | | | | |ChsAt: | | | | | Chicone, frequently | | | | | flooded------------| 95 |Very limited | |Very limited | | | Flooding |1.00 | Ponding |1.00 | | Ponding |1.00 | Flooding |1.00 | | Depth to |1.00 | Depth to |1.00 | | saturated zone | | saturated zone | | | Seepage, bottom |1.00 | Seepage |1.00 | | layer | | Organic matter |1.00 | | Slow water |0.72 | content | | | movement | | | | | | | |ChtA: | | | | | Chillum-------------| 85 |Very limited | |Somewhat limited | | | Seepage, bottom |1.00 | Seepage |0.53 | | layer | | | | | Slow water |0.72 | | | | movement | | | | | | | |ChtB: | | | | | Chillum-------------| 85 |Very limited | |Somewhat limited | | | Seepage, bottom |1.00 | Seepage |0.53 | | layer | | Slope |0.32 | | Slow water |0.72 | | | | movement | | | | | | | |DocB: | | | | | Downer--------------| 80 |Very limited | |Very limited | | | Seepage, bottom |1.00 | Seepage |1.00 | | layer | | Slope |0.08 | | | | |DocC: | | | | | Downer--------------| 85 |Very limited | |Very limited | | | Seepage, bottom |1.00 | Seepage |1.00 | | layer | | Slope |1.00 | | Slope |0.01 | | | | | | |
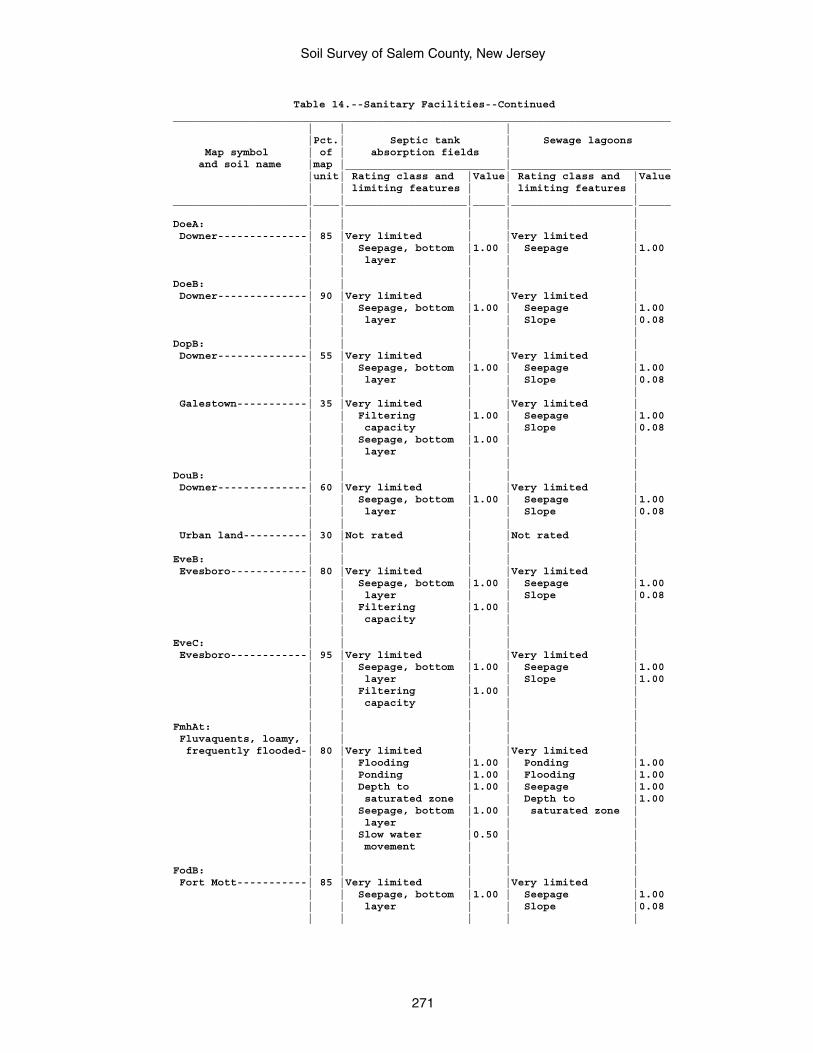
Soil Survey of Salem County, New Jersey
271
Table 14.--Sanitary Facilities--Continued______________________________________________________________________________ | | | |Pct.| Septic tank | Sewage lagoons Map symbol | of | absorption fields | and soil name |map |_________________________|_________________________ |unit| Rating class and |Value| Rating class and |Value | | limiting features | | limiting features |_____________________|____|___________________|_____|___________________|_____ | | | | |DoeA: | | | | | Downer--------------| 85 |Very limited | |Very limited | | | Seepage, bottom |1.00 | Seepage |1.00 | | layer | | | | | | | |DoeB: | | | | | Downer--------------| 90 |Very limited | |Very limited | | | Seepage, bottom |1.00 | Seepage |1.00 | | layer | | Slope |0.08 | | | | |DopB: | | | | | Downer--------------| 55 |Very limited | |Very limited | | | Seepage, bottom |1.00 | Seepage |1.00 | | layer | | Slope |0.08 | | | | | Galestown-----------| 35 |Very limited | |Very limited | | | Filtering |1.00 | Seepage |1.00 | | capacity | | Slope |0.08 | | Seepage, bottom |1.00 | | | | layer | | | | | | | |DouB: | | | | | Downer--------------| 60 |Very limited | |Very limited | | | Seepage, bottom |1.00 | Seepage |1.00 | | layer | | Slope |0.08 | | | | | Urban land----------| 30 |Not rated | |Not rated | | | | | |EveB: | | | | | Evesboro------------| 80 |Very limited | |Very limited | | | Seepage, bottom |1.00 | Seepage |1.00 | | layer | | Slope |0.08 | | Filtering |1.00 | | | | capacity | | | | | | | |EveC: | | | | | Evesboro------------| 95 |Very limited | |Very limited | | | Seepage, bottom |1.00 | Seepage |1.00 | | layer | | Slope |1.00 | | Filtering |1.00 | | | | capacity | | | | | | | |FmhAt: | | | | | Fluvaquents, loamy, | | | | | frequently flooded-| 80 |Very limited | |Very limited | | | Flooding |1.00 | Ponding |1.00 | | Ponding |1.00 | Flooding |1.00 | | Depth to |1.00 | Seepage |1.00 | | saturated zone | | Depth to |1.00 | | Seepage, bottom |1.00 | saturated zone | | | layer | | | | | Slow water |0.50 | | | | movement | | | | | | | |FodB: | | | | | Fort Mott-----------| 85 |Very limited | |Very limited | | | Seepage, bottom |1.00 | Seepage |1.00 | | layer | | Slope |0.08 | | | | |
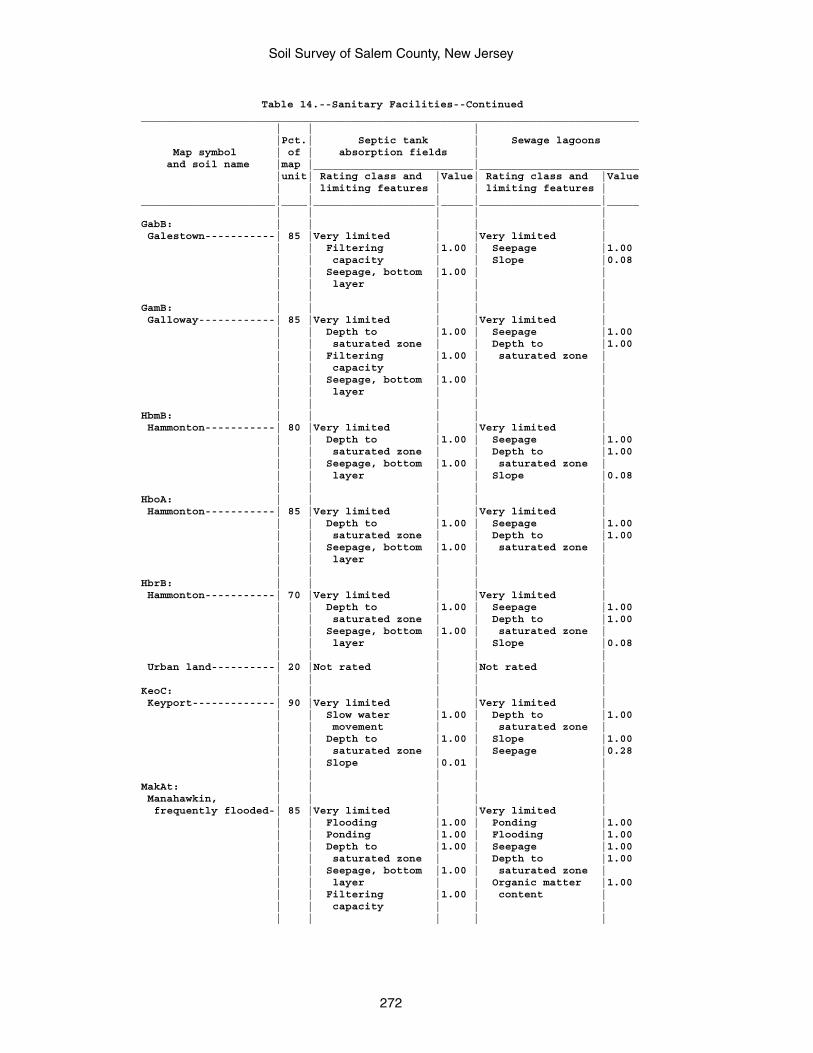
Soil Survey of Salem County, New Jersey
272
Table 14.--Sanitary Facilities--Continued______________________________________________________________________________ | | | |Pct.| Septic tank | Sewage lagoons Map symbol | of | absorption fields | and soil name |map |_________________________|_________________________ |unit| Rating class and |Value| Rating class and |Value | | limiting features | | limiting features |_____________________|____|___________________|_____|___________________|_____ | | | | |GabB: | | | | | Galestown-----------| 85 |Very limited | |Very limited | | | Filtering |1.00 | Seepage |1.00 | | capacity | | Slope |0.08 | | Seepage, bottom |1.00 | | | | layer | | | | | | | |GamB: | | | | | Galloway------------| 85 |Very limited | |Very limited | | | Depth to |1.00 | Seepage |1.00 | | saturated zone | | Depth to |1.00 | | Filtering |1.00 | saturated zone | | | capacity | | | | | Seepage, bottom |1.00 | | | | layer | | | | | | | |HbmB: | | | | | Hammonton-----------| 80 |Very limited | |Very limited | | | Depth to |1.00 | Seepage |1.00 | | saturated zone | | Depth to |1.00 | | Seepage, bottom |1.00 | saturated zone | | | layer | | Slope |0.08 | | | | |HboA: | | | | | Hammonton-----------| 85 |Very limited | |Very limited | | | Depth to |1.00 | Seepage |1.00 | | saturated zone | | Depth to |1.00 | | Seepage, bottom |1.00 | saturated zone | | | layer | | | | | | | |HbrB: | | | | | Hammonton-----------| 70 |Very limited | |Very limited | | | Depth to |1.00 | Seepage |1.00 | | saturated zone | | Depth to |1.00 | | Seepage, bottom |1.00 | saturated zone | | | layer | | Slope |0.08 | | | | | Urban land----------| 20 |Not rated | |Not rated | | | | | |KeoC: | | | | | Keyport-------------| 90 |Very limited | |Very limited | | | Slow water |1.00 | Depth to |1.00 | | movement | | saturated zone | | | Depth to |1.00 | Slope |1.00 | | saturated zone | | Seepage |0.28 | | Slope |0.01 | | | | | | |MakAt: | | | | | Manahawkin, | | | | | frequently flooded-| 85 |Very limited | |Very limited | | | Flooding |1.00 | Ponding |1.00 | | Ponding |1.00 | Flooding |1.00 | | Depth to |1.00 | Seepage |1.00 | | saturated zone | | Depth to |1.00 | | Seepage, bottom |1.00 | saturated zone | | | layer | | Organic matter |1.00 | | Filtering |1.00 | content | | | capacity | | | | | | | |
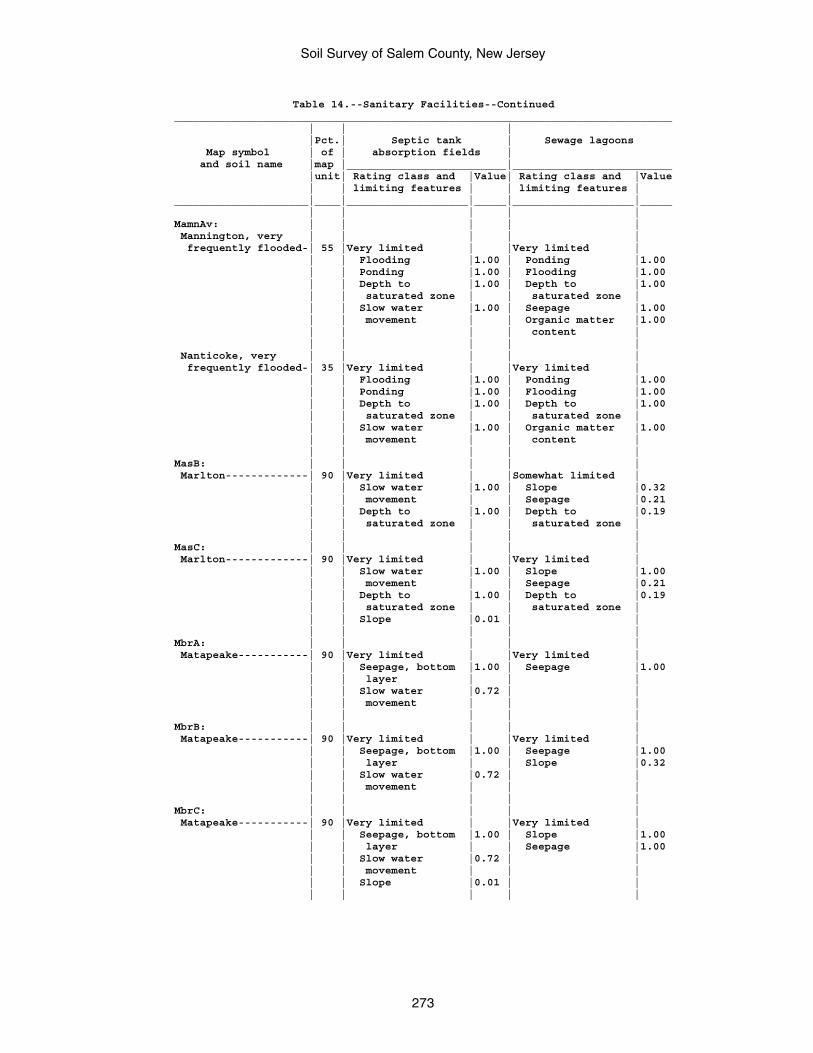
Soil Survey of Salem County, New Jersey
273
Table 14.--Sanitary Facilities--Continued______________________________________________________________________________ | | | |Pct.| Septic tank | Sewage lagoons Map symbol | of | absorption fields | and soil name |map |_________________________|_________________________ |unit| Rating class and |Value| Rating class and |Value | | limiting features | | limiting features |_____________________|____|___________________|_____|___________________|_____ | | | | |MamnAv: | | | | | Mannington, very | | | | | frequently flooded-| 55 |Very limited | |Very limited | | | Flooding |1.00 | Ponding |1.00 | | Ponding |1.00 | Flooding |1.00 | | Depth to |1.00 | Depth to |1.00 | | saturated zone | | saturated zone | | | Slow water |1.00 | Seepage |1.00 | | movement | | Organic matter |1.00 | | | | content | | | | | | Nanticoke, very | | | | | frequently flooded-| 35 |Very limited | |Very limited | | | Flooding |1.00 | Ponding |1.00 | | Ponding |1.00 | Flooding |1.00 | | Depth to |1.00 | Depth to |1.00 | | saturated zone | | saturated zone | | | Slow water |1.00 | Organic matter |1.00 | | movement | | content | | | | | |MasB: | | | | | Marlton-------------| 90 |Very limited | |Somewhat limited | | | Slow water |1.00 | Slope |0.32 | | movement | | Seepage |0.21 | | Depth to |1.00 | Depth to |0.19 | | saturated zone | | saturated zone | | | | | |MasC: | | | | | Marlton-------------| 90 |Very limited | |Very limited | | | Slow water |1.00 | Slope |1.00 | | movement | | Seepage |0.21 | | Depth to |1.00 | Depth to |0.19 | | saturated zone | | saturated zone | | | Slope |0.01 | | | | | | |MbrA: | | | | | Matapeake-----------| 90 |Very limited | |Very limited | | | Seepage, bottom |1.00 | Seepage |1.00 | | layer | | | | | Slow water |0.72 | | | | movement | | | | | | | |MbrB: | | | | | Matapeake-----------| 90 |Very limited | |Very limited | | | Seepage, bottom |1.00 | Seepage |1.00 | | layer | | Slope |0.32 | | Slow water |0.72 | | | | movement | | | | | | | |MbrC: | | | | | Matapeake-----------| 90 |Very limited | |Very limited | | | Seepage, bottom |1.00 | Slope |1.00 | | layer | | Seepage |1.00 | | Slow water |0.72 | | | | movement | | | | | Slope |0.01 | | | | | | |
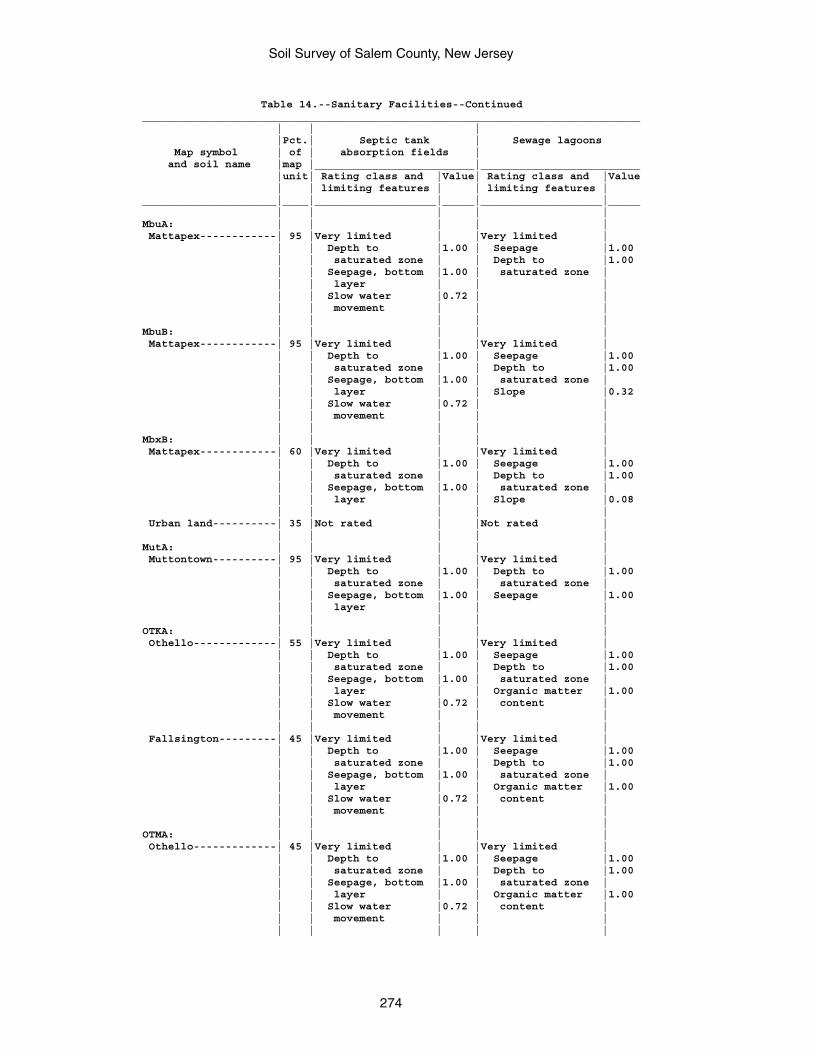
Soil Survey of Salem County, New Jersey
274
Table 14.--Sanitary Facilities--Continued______________________________________________________________________________ | | | |Pct.| Septic tank | Sewage lagoons Map symbol | of | absorption fields | and soil name |map |_________________________|_________________________ |unit| Rating class and |Value| Rating class and |Value | | limiting features | | limiting features |_____________________|____|___________________|_____|___________________|_____ | | | | |MbuA: | | | | | Mattapex------------| 95 |Very limited | |Very limited | | | Depth to |1.00 | Seepage |1.00 | | saturated zone | | Depth to |1.00 | | Seepage, bottom |1.00 | saturated zone | | | layer | | | | | Slow water |0.72 | | | | movement | | | | | | | |MbuB: | | | | | Mattapex------------| 95 |Very limited | |Very limited | | | Depth to |1.00 | Seepage |1.00 | | saturated zone | | Depth to |1.00 | | Seepage, bottom |1.00 | saturated zone | | | layer | | Slope |0.32 | | Slow water |0.72 | | | | movement | | | | | | | |MbxB: | | | | | Mattapex------------| 60 |Very limited | |Very limited | | | Depth to |1.00 | Seepage |1.00 | | saturated zone | | Depth to |1.00 | | Seepage, bottom |1.00 | saturated zone | | | layer | | Slope |0.08 | | | | | Urban land----------| 35 |Not rated | |Not rated | | | | | |MutA: | | | | | Muttontown----------| 95 |Very limited | |Very limited | | | Depth to |1.00 | Depth to |1.00 | | saturated zone | | saturated zone | | | Seepage, bottom |1.00 | Seepage |1.00 | | layer | | | | | | | |OTKA: | | | | | Othello-------------| 55 |Very limited | |Very limited | | | Depth to |1.00 | Seepage |1.00 | | saturated zone | | Depth to |1.00 | | Seepage, bottom |1.00 | saturated zone | | | layer | | Organic matter |1.00 | | Slow water |0.72 | content | | | movement | | | | | | | | Fallsington---------| 45 |Very limited | |Very limited | | | Depth to |1.00 | Seepage |1.00 | | saturated zone | | Depth to |1.00 | | Seepage, bottom |1.00 | saturated zone | | | layer | | Organic matter |1.00 | | Slow water |0.72 | content | | | movement | | | | | | | |OTMA: | | | | | Othello-------------| 45 |Very limited | |Very limited | | | Depth to |1.00 | Seepage |1.00 | | saturated zone | | Depth to |1.00 | | Seepage, bottom |1.00 | saturated zone | | | layer | | Organic matter |1.00 | | Slow water |0.72 | content | | | movement | | | | | | | |
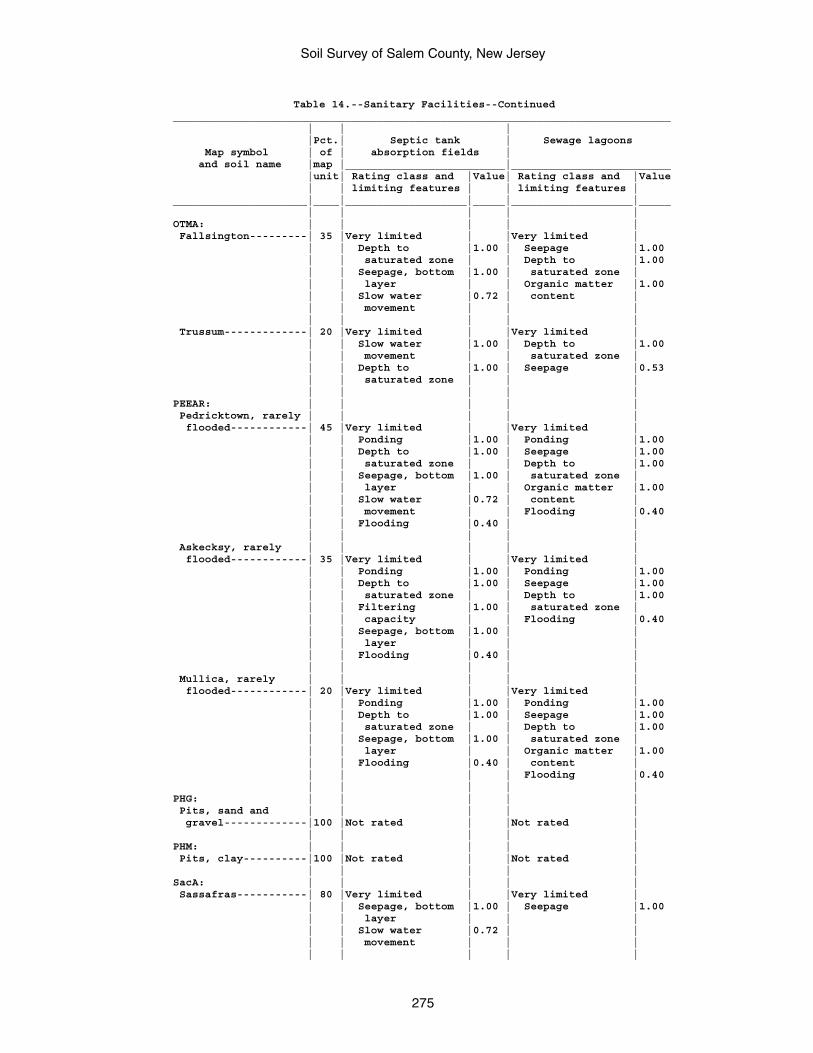
Soil Survey of Salem County, New Jersey
275
Table 14.--Sanitary Facilities--Continued______________________________________________________________________________ | | | |Pct.| Septic tank | Sewage lagoons Map symbol | of | absorption fields | and soil name |map |_________________________|_________________________ |unit| Rating class and |Value| Rating class and |Value | | limiting features | | limiting features |_____________________|____|___________________|_____|___________________|_____ | | | | |OTMA: | | | | | Fallsington---------| 35 |Very limited | |Very limited | | | Depth to |1.00 | Seepage |1.00 | | saturated zone | | Depth to |1.00 | | Seepage, bottom |1.00 | saturated zone | | | layer | | Organic matter |1.00 | | Slow water |0.72 | content | | | movement | | | | | | | | Trussum-------------| 20 |Very limited | |Very limited | | | Slow water |1.00 | Depth to |1.00 | | movement | | saturated zone | | | Depth to |1.00 | Seepage |0.53 | | saturated zone | | | | | | | |PEEAR: | | | | | Pedricktown, rarely | | | | | flooded------------| 45 |Very limited | |Very limited | | | Ponding |1.00 | Ponding |1.00 | | Depth to |1.00 | Seepage |1.00 | | saturated zone | | Depth to |1.00 | | Seepage, bottom |1.00 | saturated zone | | | layer | | Organic matter |1.00 | | Slow water |0.72 | content | | | movement | | Flooding |0.40 | | Flooding |0.40 | | | | | | | Askecksy, rarely | | | | | flooded------------| 35 |Very limited | |Very limited | | | Ponding |1.00 | Ponding |1.00 | | Depth to |1.00 | Seepage |1.00 | | saturated zone | | Depth to |1.00 | | Filtering |1.00 | saturated zone | | | capacity | | Flooding |0.40 | | Seepage, bottom |1.00 | | | | layer | | | | | Flooding |0.40 | | | | | | | Mullica, rarely | | | | | flooded------------| 20 |Very limited | |Very limited | | | Ponding |1.00 | Ponding |1.00 | | Depth to |1.00 | Seepage |1.00 | | saturated zone | | Depth to |1.00 | | Seepage, bottom |1.00 | saturated zone | | | layer | | Organic matter |1.00 | | Flooding |0.40 | content | | | | | Flooding |0.40 | | | | |PHG: | | | | | Pits, sand and | | | | | gravel-------------|100 |Not rated | |Not rated | | | | | |PHM: | | | | | Pits, clay----------|100 |Not rated | |Not rated | | | | | |SacA: | | | | | Sassafras-----------| 80 |Very limited | |Very limited | | | Seepage, bottom |1.00 | Seepage |1.00 | | layer | | | | | Slow water |0.72 | | | | movement | | | | | | | |
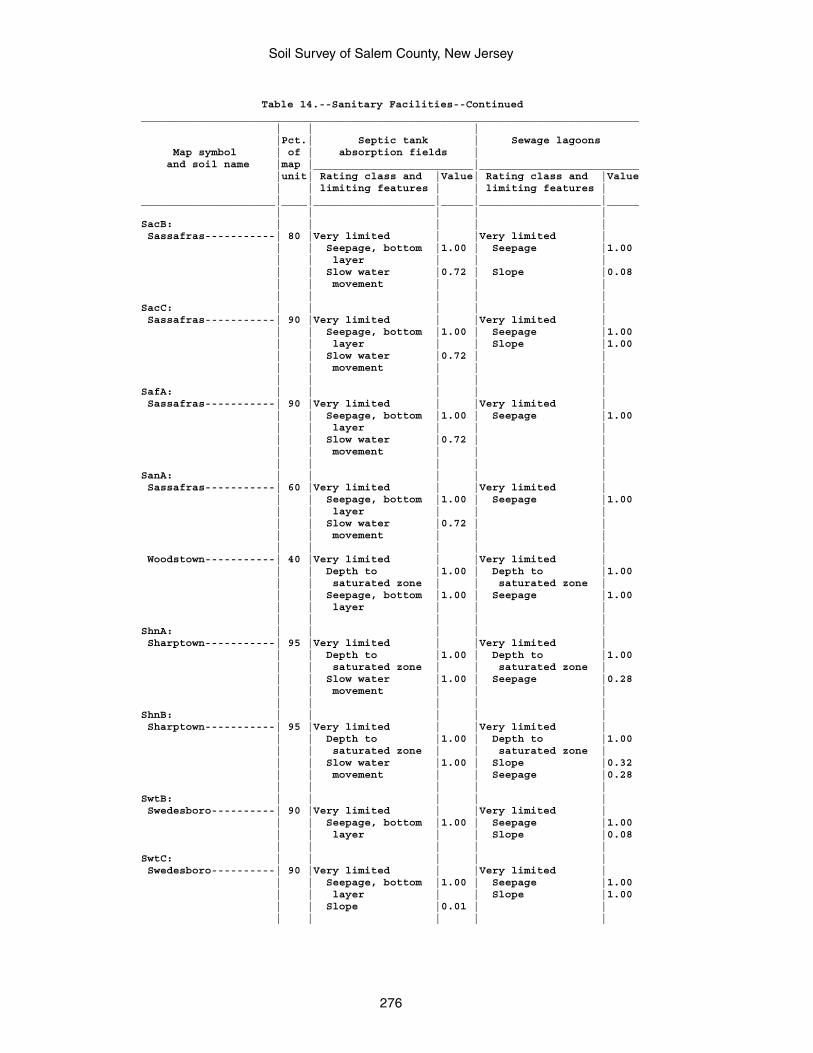
Soil Survey of Salem County, New Jersey
276
Table 14.--Sanitary Facilities--Continued______________________________________________________________________________ | | | |Pct.| Septic tank | Sewage lagoons Map symbol | of | absorption fields | and soil name |map |_________________________|_________________________ |unit| Rating class and |Value| Rating class and |Value | | limiting features | | limiting features |_____________________|____|___________________|_____|___________________|_____ | | | | |SacB: | | | | | Sassafras-----------| 80 |Very limited | |Very limited | | | Seepage, bottom |1.00 | Seepage |1.00 | | layer | | | | | Slow water |0.72 | Slope |0.08 | | movement | | | | | | | |SacC: | | | | | Sassafras-----------| 90 |Very limited | |Very limited | | | Seepage, bottom |1.00 | Seepage |1.00 | | layer | | Slope |1.00 | | Slow water |0.72 | | | | movement | | | | | | | |SafA: | | | | | Sassafras-----------| 90 |Very limited | |Very limited | | | Seepage, bottom |1.00 | Seepage |1.00 | | layer | | | | | Slow water |0.72 | | | | movement | | | | | | | |SanA: | | | | | Sassafras-----------| 60 |Very limited | |Very limited | | | Seepage, bottom |1.00 | Seepage |1.00 | | layer | | | | | Slow water |0.72 | | | | movement | | | | | | | | Woodstown-----------| 40 |Very limited | |Very limited | | | Depth to |1.00 | Depth to |1.00 | | saturated zone | | saturated zone | | | Seepage, bottom |1.00 | Seepage |1.00 | | layer | | | | | | | |ShnA: | | | | | Sharptown-----------| 95 |Very limited | |Very limited | | | Depth to |1.00 | Depth to |1.00 | | saturated zone | | saturated zone | | | Slow water |1.00 | Seepage |0.28 | | movement | | | | | | | |ShnB: | | | | | Sharptown-----------| 95 |Very limited | |Very limited | | | Depth to |1.00 | Depth to |1.00 | | saturated zone | | saturated zone | | | Slow water |1.00 | Slope |0.32 | | movement | | Seepage |0.28 | | | | |SwtB: | | | | | Swedesboro----------| 90 |Very limited | |Very limited | | | Seepage, bottom |1.00 | Seepage |1.00 | | layer | | Slope |0.08 | | | | |SwtC: | | | | | Swedesboro----------| 90 |Very limited | |Very limited | | | Seepage, bottom |1.00 | Seepage |1.00 | | layer | | Slope |1.00 | | Slope |0.01 | | | | | | |
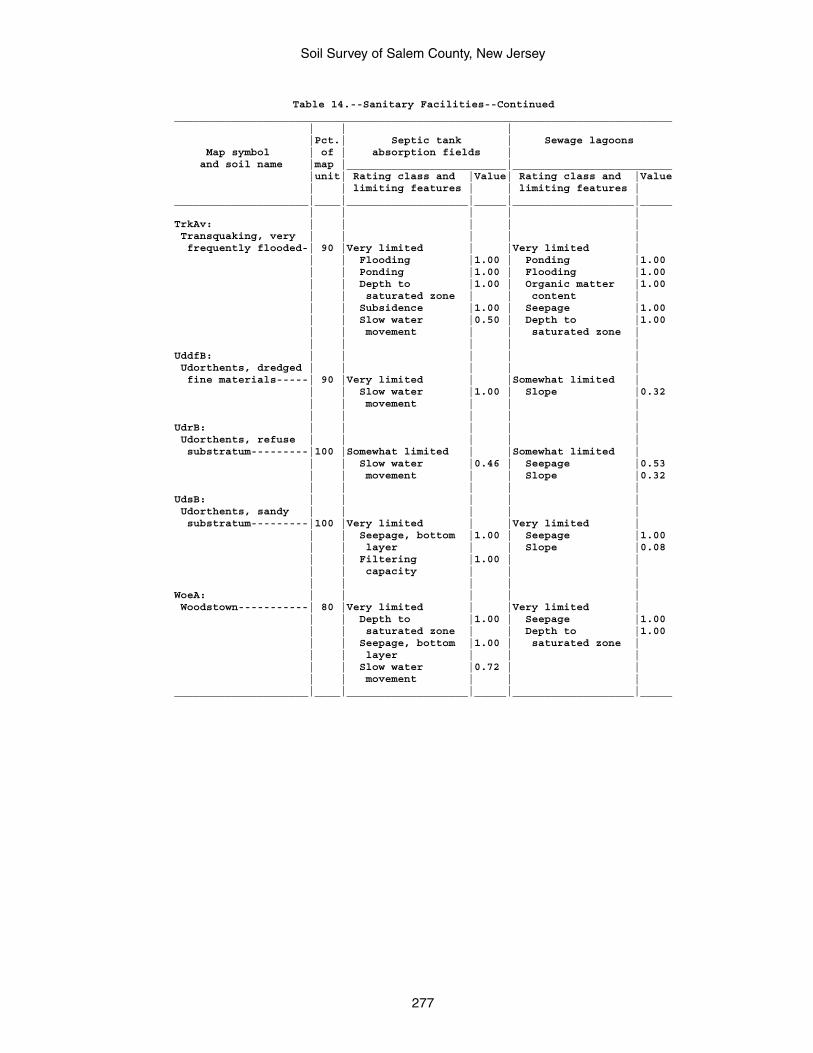
Soil Survey of Salem County, New Jersey
277
Table 14.--Sanitary Facilities--Continued______________________________________________________________________________ | | | |Pct.| Septic tank | Sewage lagoons Map symbol | of | absorption fields | and soil name |map |_________________________|_________________________ |unit| Rating class and |Value| Rating class and |Value | | limiting features | | limiting features |_____________________|____|___________________|_____|___________________|_____ | | | | |TrkAv: | | | | | Transquaking, very | | | | | frequently flooded-| 90 |Very limited | |Very limited | | | Flooding |1.00 | Ponding |1.00 | | Ponding |1.00 | Flooding |1.00 | | Depth to |1.00 | Organic matter |1.00 | | saturated zone | | content | | | Subsidence |1.00 | Seepage |1.00 | | Slow water |0.50 | Depth to |1.00 | | movement | | saturated zone | | | | | |UddfB: | | | | | Udorthents, dredged | | | | | fine materials-----| 90 |Very limited | |Somewhat limited | | | Slow water |1.00 | Slope |0.32 | | movement | | | | | | | |UdrB: | | | | | Udorthents, refuse | | | | | substratum---------|100 |Somewhat limited | |Somewhat limited | | | Slow water |0.46 | Seepage |0.53 | | movement | | Slope |0.32 | | | | |UdsB: | | | | | Udorthents, sandy | | | | | substratum---------|100 |Very limited | |Very limited | | | Seepage, bottom |1.00 | Seepage |1.00 | | layer | | Slope |0.08 | | Filtering |1.00 | | | | capacity | | | | | | | |WoeA: | | | | | Woodstown-----------| 80 |Very limited | |Very limited | | | Depth to |1.00 | Seepage |1.00 | | saturated zone | | Depth to |1.00 | | Seepage, bottom |1.00 | saturated zone | | | layer | | | | | Slow water |0.72 | | | | movement | | |_____________________|____|___________________|_____|___________________|_____
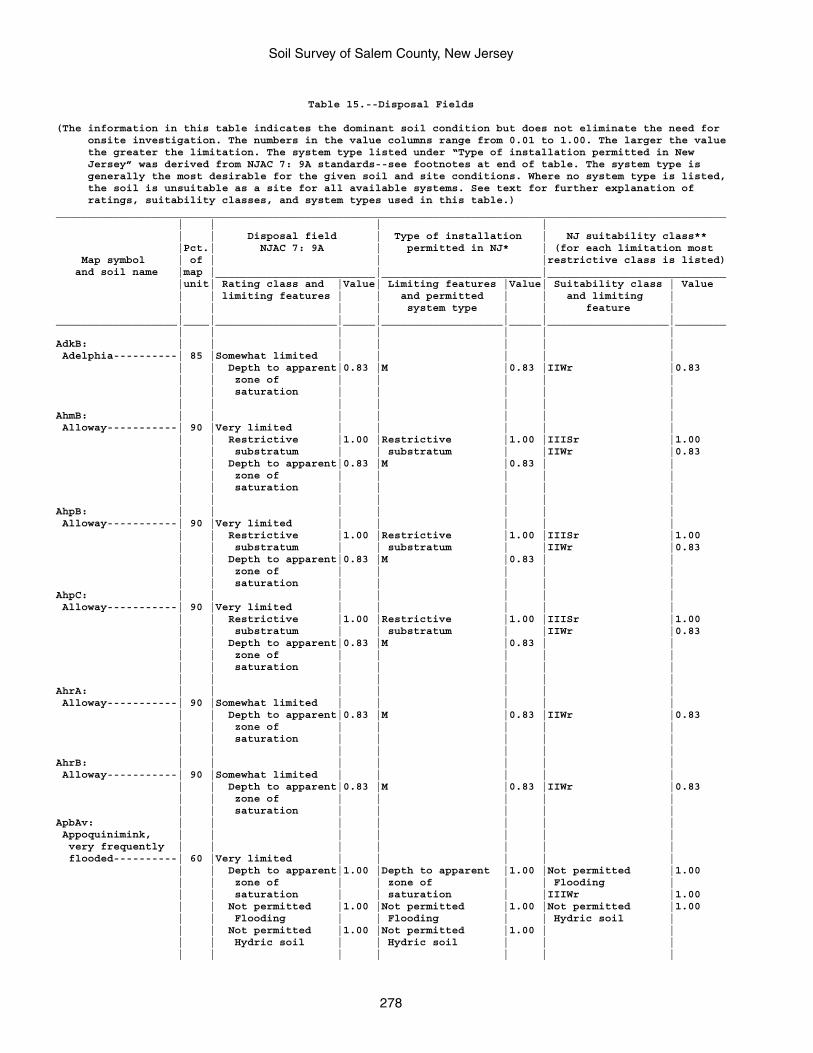
Soil Survey of Salem County, New Jersey
278
Table 15.--Disposal Fields
(The information in this table indicates the dominant soil condition but does not eliminate the need for onsite investigation. The numbers in the value columns range from 0.01 to 1.00. The larger the value the greater the limitation. The system type listed under “Type of installation permitted in New Jersey” was derived from NJAC 7: 9A standards--see footnotes at end of table. The system type is generally the most desirable for the given soil and site conditions. Where no system type is listed, the soil is unsuitable as a site for all available systems. See text for further explanation of ratings, suitability classes, and system types used in this table.)_________________________________________________________________________________________________________ | | | | | | Disposal field | Type of installation | NJ suitability class** |Pct.| NJAC 7: 9A | permitted in NJ* | (for each limitation most Map symbol | of | | |restrictive class is listed) and soil name |map |_________________________|_________________________|____________________________ |unit| Rating class and |Value| Limiting features |Value| Suitability class | Value | | limiting features | | and permitted | | and limiting | | | | | system type | | feature |___________________|____|___________________|_____|___________________|_____|___________________|________ | | | | | | |AdkB: | | | | | | | Adelphia----------| 85 |Somewhat limited | | | | | | | Depth to apparent|0.83 |M |0.83 |IIWr |0.83 | | zone of | | | | | | | saturation | | | | | | | | | | | |AhmB: | | | | | | | Alloway-----------| 90 |Very limited | | | | | | | Restrictive |1.00 |Restrictive |1.00 |IIISr |1.00 | | substratum | | substratum | |IIWr |0.83 | | Depth to apparent|0.83 |M |0.83 | | | | zone of | | | | | | | saturation | | | | | | | | | | | |AhpB: | | | | | | | Alloway-----------| 90 |Very limited | | | | | | | Restrictive |1.00 |Restrictive |1.00 |IIISr |1.00 | | substratum | | substratum | |IIWr |0.83 | | Depth to apparent|0.83 |M |0.83 | | | | zone of | | | | | | | saturation | | | | |AhpC: | | | | | | | Alloway-----------| 90 |Very limited | | | | | | | Restrictive |1.00 |Restrictive |1.00 |IIISr |1.00 | | substratum | | substratum | |IIWr |0.83 | | Depth to apparent|0.83 |M |0.83 | | | | zone of | | | | | | | saturation | | | | | | | | | | | |AhrA: | | | | | | | Alloway-----------| 90 |Somewhat limited | | | | | | | Depth to apparent|0.83 |M |0.83 |IIWr |0.83 | | zone of | | | | | | | saturation | | | | | | | | | | | |AhrB: | | | | | | | Alloway-----------| 90 |Somewhat limited | | | | | | | Depth to apparent|0.83 |M |0.83 |IIWr |0.83 | | zone of | | | | | | | saturation | | | | |ApbAv: | | | | | | | Appoquinimink, | | | | | | | very frequently | | | | | | | flooded----------| 60 |Very limited | | | | | | | Depth to apparent|1.00 |Depth to apparent |1.00 |Not permitted |1.00 | | zone of | | zone of | | Flooding | | | saturation | | saturation | |IIIWr |1.00 | | Not permitted |1.00 |Not permitted |1.00 |Not permitted |1.00 | | Flooding | | Flooding | | Hydric soil | | | Not permitted |1.00 |Not permitted |1.00 | | | | Hydric soil | | Hydric soil | | | | | | | | | |
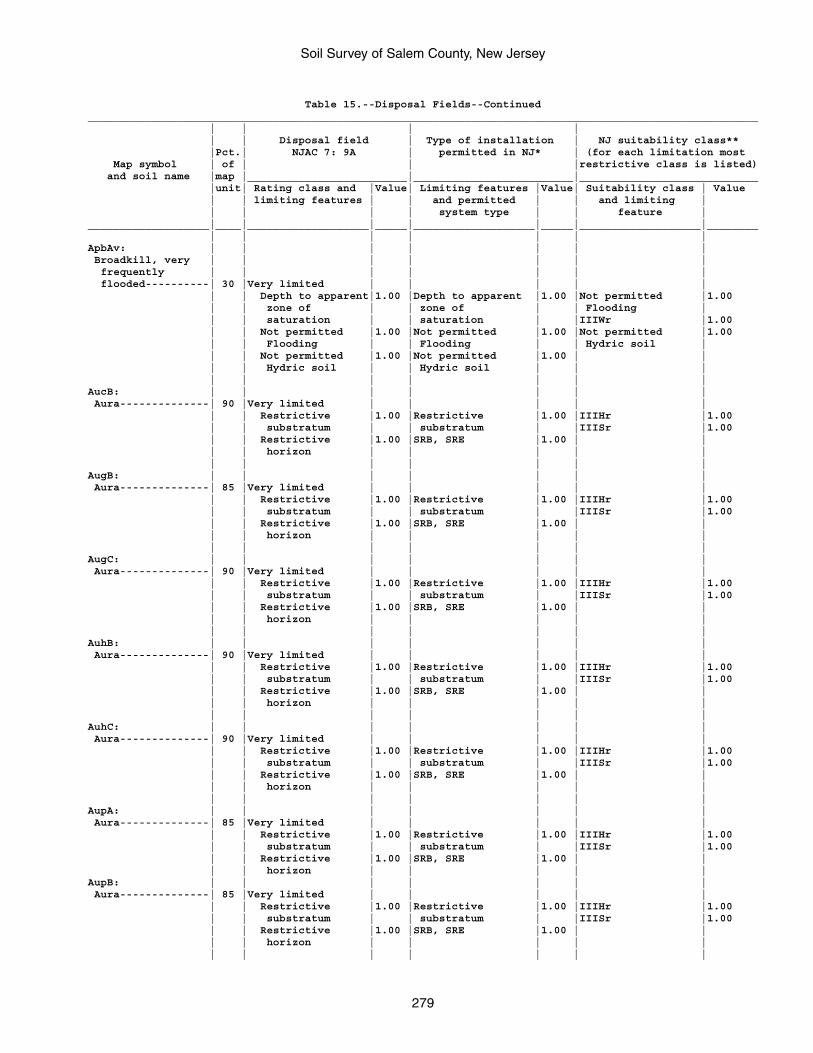
Soil Survey of Salem County, New Jersey
279
Table 15.--Disposal Fields--Continued_________________________________________________________________________________________________________ | | | | | | Disposal field | Type of installation | NJ suitability class** |Pct.| NJAC 7: 9A | permitted in NJ* | (for each limitation most Map symbol | of | | |restrictive class is listed) and soil name |map |_________________________|_________________________|____________________________ |unit| Rating class and |Value| Limiting features |Value| Suitability class | Value | | limiting features | | and permitted | | and limiting | | | | | system type | | feature |___________________|____|___________________|_____|___________________|_____|___________________|________ | | | | | | |ApbAv: | | | | | | | Broadkill, very | | | | | | | frequently | | | | | | | flooded----------| 30 |Very limited | | | | | | | Depth to apparent|1.00 |Depth to apparent |1.00 |Not permitted |1.00 | | zone of | | zone of | | Flooding | | | saturation | | saturation | |IIIWr |1.00 | | Not permitted |1.00 |Not permitted |1.00 |Not permitted |1.00 | | Flooding | | Flooding | | Hydric soil | | | Not permitted |1.00 |Not permitted |1.00 | | | | Hydric soil | | Hydric soil | | | | | | | | | |AucB: | | | | | | | Aura--------------| 90 |Very limited | | | | | | | Restrictive |1.00 |Restrictive |1.00 |IIIHr |1.00 | | substratum | | substratum | |IIISr |1.00 | | Restrictive |1.00 |SRB, SRE |1.00 | | | | horizon | | | | | | | | | | | |AugB: | | | | | | | Aura--------------| 85 |Very limited | | | | | | | Restrictive |1.00 |Restrictive |1.00 |IIIHr |1.00 | | substratum | | substratum | |IIISr |1.00 | | Restrictive |1.00 |SRB, SRE |1.00 | | | | horizon | | | | | | | | | | | |AugC: | | | | | | | Aura--------------| 90 |Very limited | | | | | | | Restrictive |1.00 |Restrictive |1.00 |IIIHr |1.00 | | substratum | | substratum | |IIISr |1.00 | | Restrictive |1.00 |SRB, SRE |1.00 | | | | horizon | | | | | | | | | | | |AuhB: | | | | | | | Aura--------------| 90 |Very limited | | | | | | | Restrictive |1.00 |Restrictive |1.00 |IIIHr |1.00 | | substratum | | substratum | |IIISr |1.00 | | Restrictive |1.00 |SRB, SRE |1.00 | | | | horizon | | | | | | | | | | | |AuhC: | | | | | | | Aura--------------| 90 |Very limited | | | | | | | Restrictive |1.00 |Restrictive |1.00 |IIIHr |1.00 | | substratum | | substratum | |IIISr |1.00 | | Restrictive |1.00 |SRB, SRE |1.00 | | | | horizon | | | | | | | | | | | |AupA: | | | | | | | Aura--------------| 85 |Very limited | | | | | | | Restrictive |1.00 |Restrictive |1.00 |IIIHr |1.00 | | substratum | | substratum | |IIISr |1.00 | | Restrictive |1.00 |SRB, SRE |1.00 | | | | horizon | | | | |AupB: | | | | | | | Aura--------------| 85 |Very limited | | | | | | | Restrictive |1.00 |Restrictive |1.00 |IIIHr |1.00 | | substratum | | substratum | |IIISr |1.00 | | Restrictive |1.00 |SRB, SRE |1.00 | | | | horizon | | | | | | | | | | | |
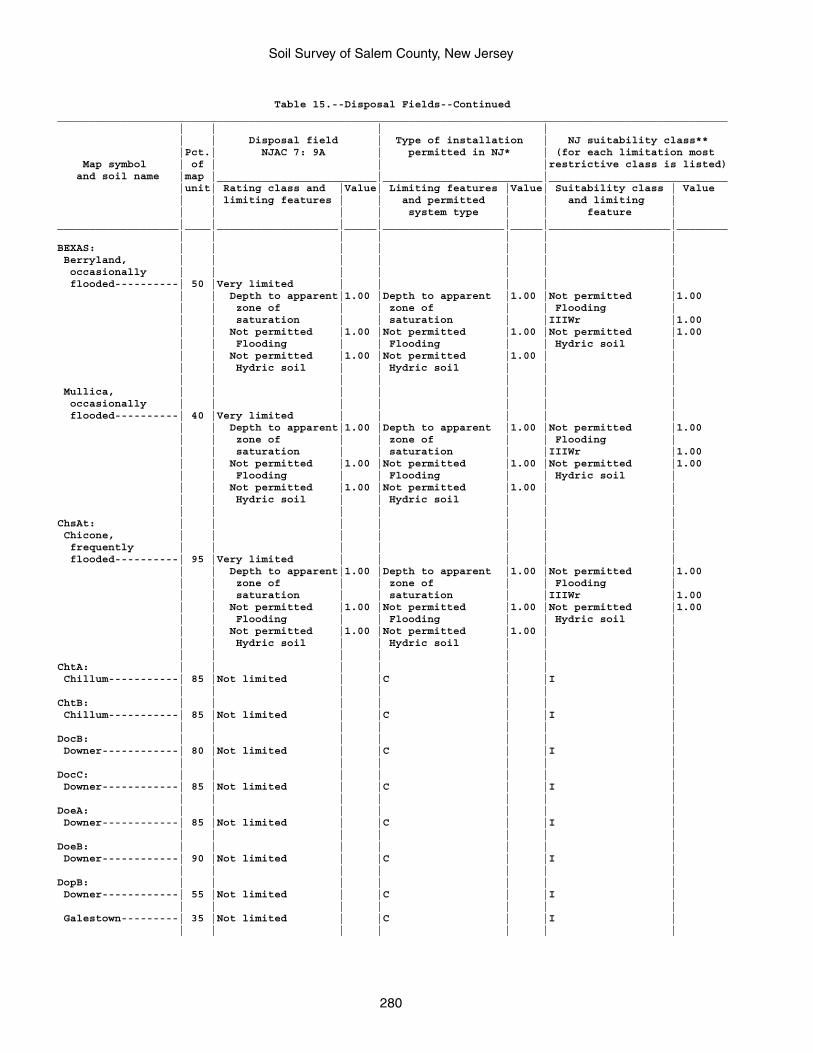
Soil Survey of Salem County, New Jersey
280
Table 15.--Disposal Fields--Continued_________________________________________________________________________________________________________ | | | | | | Disposal field | Type of installation | NJ suitability class** |Pct.| NJAC 7: 9A | permitted in NJ* | (for each limitation most Map symbol | of | | |restrictive class is listed) and soil name |map |_________________________|_________________________|____________________________ |unit| Rating class and |Value| Limiting features |Value| Suitability class | Value | | limiting features | | and permitted | | and limiting | | | | | system type | | feature |___________________|____|___________________|_____|___________________|_____|___________________|________ | | | | | | |BEXAS: | | | | | | | Berryland, | | | | | | | occasionally | | | | | | | flooded----------| 50 |Very limited | | | | | | | Depth to apparent|1.00 |Depth to apparent |1.00 |Not permitted |1.00 | | zone of | | zone of | | Flooding | | | saturation | | saturation | |IIIWr |1.00 | | Not permitted |1.00 |Not permitted |1.00 |Not permitted |1.00 | | Flooding | | Flooding | | Hydric soil | | | Not permitted |1.00 |Not permitted |1.00 | | | | Hydric soil | | Hydric soil | | | | | | | | | | Mullica, | | | | | | | occasionally | | | | | | | flooded----------| 40 |Very limited | | | | | | | Depth to apparent|1.00 |Depth to apparent |1.00 |Not permitted |1.00 | | zone of | | zone of | | Flooding | | | saturation | | saturation | |IIIWr |1.00 | | Not permitted |1.00 |Not permitted |1.00 |Not permitted |1.00 | | Flooding | | Flooding | | Hydric soil | | | Not permitted |1.00 |Not permitted |1.00 | | | | Hydric soil | | Hydric soil | | | | | | | | | |ChsAt: | | | | | | | Chicone, | | | | | | | frequently | | | | | | | flooded----------| 95 |Very limited | | | | | | | Depth to apparent|1.00 |Depth to apparent |1.00 |Not permitted |1.00 | | zone of | | zone of | | Flooding | | | saturation | | saturation | |IIIWr |1.00 | | Not permitted |1.00 |Not permitted |1.00 |Not permitted |1.00 | | Flooding | | Flooding | | Hydric soil | | | Not permitted |1.00 |Not permitted |1.00 | | | | Hydric soil | | Hydric soil | | | | | | | | | |ChtA: | | | | | | | Chillum-----------| 85 |Not limited | |C | |I | | | | | | | |ChtB: | | | | | | | Chillum-----------| 85 |Not limited | |C | |I | | | | | | | |DocB: | | | | | | | Downer------------| 80 |Not limited | |C | |I | | | | | | | |DocC: | | | | | | | Downer------------| 85 |Not limited | |C | |I | | | | | | | |DoeA: | | | | | | | Downer------------| 85 |Not limited | |C | |I | | | | | | | |DoeB: | | | | | | | Downer------------| 90 |Not limited | |C | |I | | | | | | | |DopB: | | | | | | | Downer------------| 55 |Not limited | |C | |I | | | | | | | | Galestown---------| 35 |Not limited | |C | |I | | | | | | | |
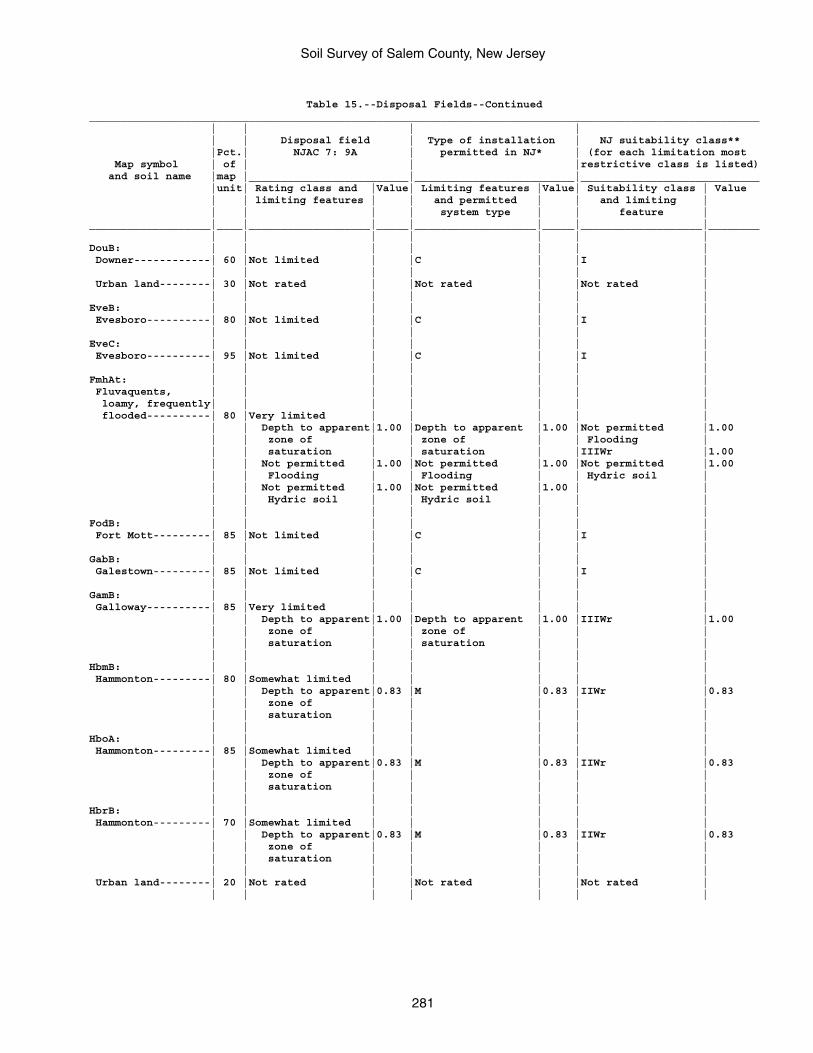
Soil Survey of Salem County, New Jersey
281
Table 15.--Disposal Fields--Continued_________________________________________________________________________________________________________ | | | | | | Disposal field | Type of installation | NJ suitability class** |Pct.| NJAC 7: 9A | permitted in NJ* | (for each limitation most Map symbol | of | | |restrictive class is listed) and soil name |map |_________________________|_________________________|____________________________ |unit| Rating class and |Value| Limiting features |Value| Suitability class | Value | | limiting features | | and permitted | | and limiting | | | | | system type | | feature |___________________|____|___________________|_____|___________________|_____|___________________|________ | | | | | | |DouB: | | | | | | | Downer------------| 60 |Not limited | |C | |I | | | | | | | | Urban land--------| 30 |Not rated | |Not rated | |Not rated | | | | | | | |EveB: | | | | | | | Evesboro----------| 80 |Not limited | |C | |I | | | | | | | |EveC: | | | | | | | Evesboro----------| 95 |Not limited | |C | |I | | | | | | | |FmhAt: | | | | | | | Fluvaquents, | | | | | | | loamy, frequently| | | | | | | flooded----------| 80 |Very limited | | | | | | | Depth to apparent|1.00 |Depth to apparent |1.00 |Not permitted |1.00 | | zone of | | zone of | | Flooding | | | saturation | | saturation | |IIIWr |1.00 | | Not permitted |1.00 |Not permitted |1.00 |Not permitted |1.00 | | Flooding | | Flooding | | Hydric soil | | | Not permitted |1.00 |Not permitted |1.00 | | | | Hydric soil | | Hydric soil | | | | | | | | | |FodB: | | | | | | | Fort Mott---------| 85 |Not limited | |C | |I | | | | | | | |GabB: | | | | | | | Galestown---------| 85 |Not limited | |C | |I | | | | | | | |GamB: | | | | | | | Galloway----------| 85 |Very limited | | | | | | | Depth to apparent|1.00 |Depth to apparent |1.00 |IIIWr |1.00 | | zone of | | zone of | | | | | saturation | | saturation | | | | | | | | | |HbmB: | | | | | | | Hammonton---------| 80 |Somewhat limited | | | | | | | Depth to apparent|0.83 |M |0.83 |IIWr |0.83 | | zone of | | | | | | | saturation | | | | | | | | | | | |HboA: | | | | | | | Hammonton---------| 85 |Somewhat limited | | | | | | | Depth to apparent|0.83 |M |0.83 |IIWr |0.83 | | zone of | | | | | | | saturation | | | | | | | | | | | |HbrB: | | | | | | | Hammonton---------| 70 |Somewhat limited | | | | | | | Depth to apparent|0.83 |M |0.83 |IIWr |0.83 | | zone of | | | | | | | saturation | | | | | | | | | | | | Urban land--------| 20 |Not rated | |Not rated | |Not rated | | | | | | | |
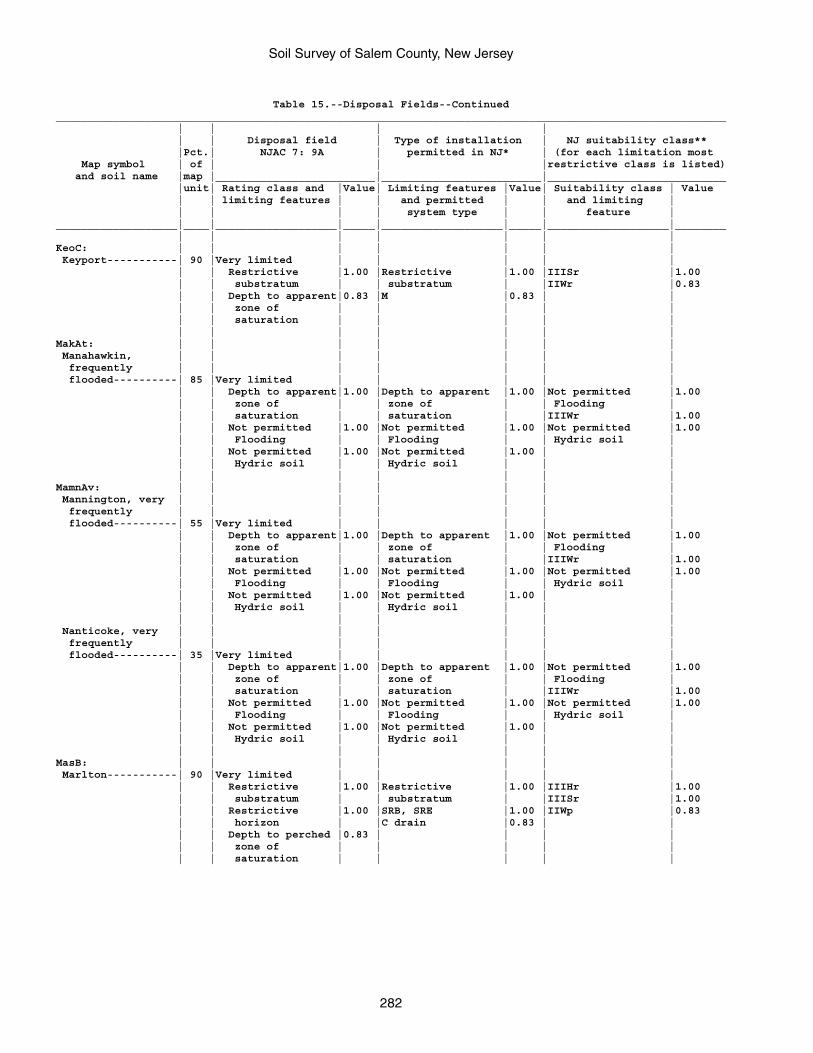
Soil Survey of Salem County, New Jersey
282
Table 15.--Disposal Fields--Continued_________________________________________________________________________________________________________ | | | | | | Disposal field | Type of installation | NJ suitability class** |Pct.| NJAC 7: 9A | permitted in NJ* | (for each limitation most Map symbol | of | | |restrictive class is listed) and soil name |map |_________________________|_________________________|____________________________ |unit| Rating class and |Value| Limiting features |Value| Suitability class | Value | | limiting features | | and permitted | | and limiting | | | | | system type | | feature |___________________|____|___________________|_____|___________________|_____|___________________|________ | | | | | | |KeoC: | | | | | | | Keyport-----------| 90 |Very limited | | | | | | | Restrictive |1.00 |Restrictive |1.00 |IIISr |1.00 | | substratum | | substratum | |IIWr |0.83 | | Depth to apparent|0.83 |M |0.83 | | | | zone of | | | | | | | saturation | | | | | | | | | | | |MakAt: | | | | | | | Manahawkin, | | | | | | | frequently | | | | | | | flooded----------| 85 |Very limited | | | | | | | Depth to apparent|1.00 |Depth to apparent |1.00 |Not permitted |1.00 | | zone of | | zone of | | Flooding | | | saturation | | saturation | |IIIWr |1.00 | | Not permitted |1.00 |Not permitted |1.00 |Not permitted |1.00 | | Flooding | | Flooding | | Hydric soil | | | Not permitted |1.00 |Not permitted |1.00 | | | | Hydric soil | | Hydric soil | | | | | | | | | |MamnAv: | | | | | | | Mannington, very | | | | | | | frequently | | | | | | | flooded----------| 55 |Very limited | | | | | | | Depth to apparent|1.00 |Depth to apparent |1.00 |Not permitted |1.00 | | zone of | | zone of | | Flooding | | | saturation | | saturation | |IIIWr |1.00 | | Not permitted |1.00 |Not permitted |1.00 |Not permitted |1.00 | | Flooding | | Flooding | | Hydric soil | | | Not permitted |1.00 |Not permitted |1.00 | | | | Hydric soil | | Hydric soil | | | | | | | | | | Nanticoke, very | | | | | | | frequently | | | | | | | flooded----------| 35 |Very limited | | | | | | | Depth to apparent|1.00 |Depth to apparent |1.00 |Not permitted |1.00 | | zone of | | zone of | | Flooding | | | saturation | | saturation | |IIIWr |1.00 | | Not permitted |1.00 |Not permitted |1.00 |Not permitted |1.00 | | Flooding | | Flooding | | Hydric soil | | | Not permitted |1.00 |Not permitted |1.00 | | | | Hydric soil | | Hydric soil | | | | | | | | | |MasB: | | | | | | | Marlton-----------| 90 |Very limited | | | | | | | Restrictive |1.00 |Restrictive |1.00 |IIIHr |1.00 | | substratum | | substratum | |IIISr |1.00 | | Restrictive |1.00 |SRB, SRE |1.00 |IIWp |0.83 | | horizon | |C drain |0.83 | | | | Depth to perched |0.83 | | | | | | zone of | | | | | | | saturation | | | | |
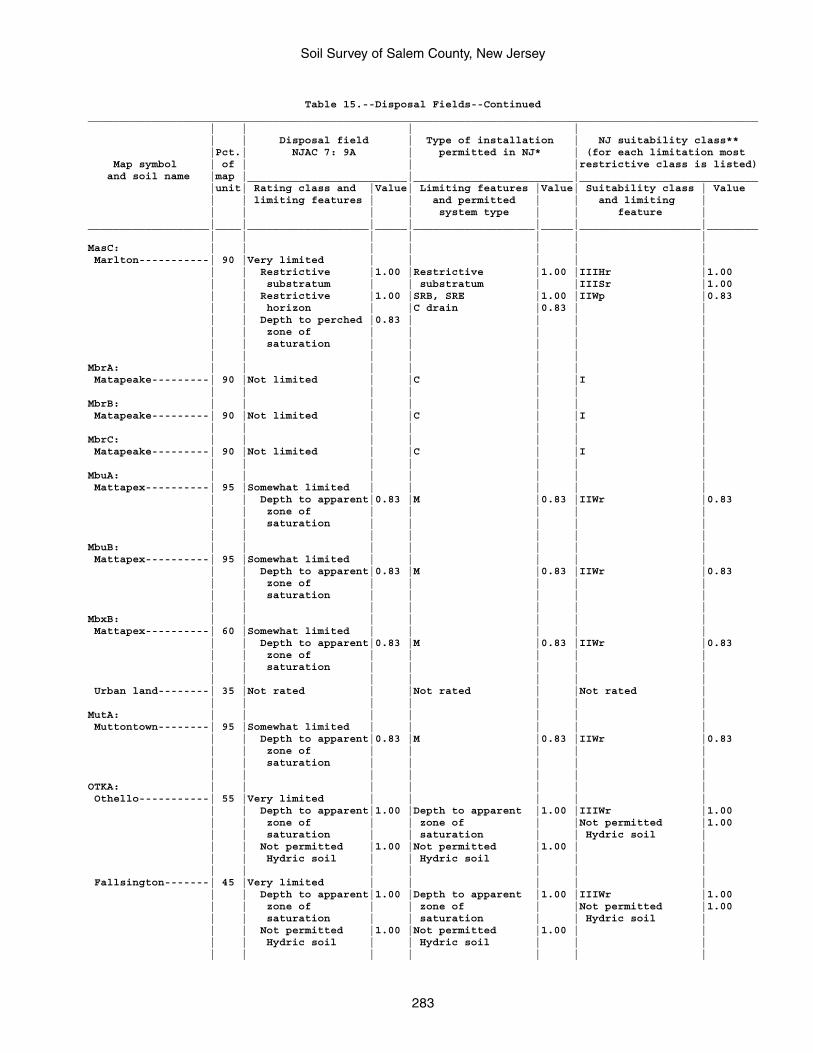
Soil Survey of Salem County, New Jersey
283
Table 15.--Disposal Fields--Continued_________________________________________________________________________________________________________ | | | | | | Disposal field | Type of installation | NJ suitability class** |Pct.| NJAC 7: 9A | permitted in NJ* | (for each limitation most Map symbol | of | | |restrictive class is listed) and soil name |map |_________________________|_________________________|____________________________ |unit| Rating class and |Value| Limiting features |Value| Suitability class | Value | | limiting features | | and permitted | | and limiting | | | | | system type | | feature |___________________|____|___________________|_____|___________________|_____|___________________|________ | | | | | | |MasC: | | | | | | | Marlton-----------| 90 |Very limited | | | | | | | Restrictive |1.00 |Restrictive |1.00 |IIIHr |1.00 | | substratum | | substratum | |IIISr |1.00 | | Restrictive |1.00 |SRB, SRE |1.00 |IIWp |0.83 | | horizon | |C drain |0.83 | | | | Depth to perched |0.83 | | | | | | zone of | | | | | | | saturation | | | | | | | | | | | |MbrA: | | | | | | | Matapeake---------| 90 |Not limited | |C | |I | | | | | | | |MbrB: | | | | | | | Matapeake---------| 90 |Not limited | |C | |I | | | | | | | |MbrC: | | | | | | | Matapeake---------| 90 |Not limited | |C | |I | | | | | | | |MbuA: | | | | | | | Mattapex----------| 95 |Somewhat limited | | | | | | | Depth to apparent|0.83 |M |0.83 |IIWr |0.83 | | zone of | | | | | | | saturation | | | | | | | | | | | |MbuB: | | | | | | | Mattapex----------| 95 |Somewhat limited | | | | | | | Depth to apparent|0.83 |M |0.83 |IIWr |0.83 | | zone of | | | | | | | saturation | | | | | | | | | | | |MbxB: | | | | | | | Mattapex----------| 60 |Somewhat limited | | | | | | | Depth to apparent|0.83 |M |0.83 |IIWr |0.83 | | zone of | | | | | | | saturation | | | | | | | | | | | | Urban land--------| 35 |Not rated | |Not rated | |Not rated | | | | | | | |MutA: | | | | | | | Muttontown--------| 95 |Somewhat limited | | | | | | | Depth to apparent|0.83 |M |0.83 |IIWr |0.83 | | zone of | | | | | | | saturation | | | | | | | | | | | |OTKA: | | | | | | | Othello-----------| 55 |Very limited | | | | | | | Depth to apparent|1.00 |Depth to apparent |1.00 |IIIWr |1.00 | | zone of | | zone of | |Not permitted |1.00 | | saturation | | saturation | | Hydric soil | | | Not permitted |1.00 |Not permitted |1.00 | | | | Hydric soil | | Hydric soil | | | | | | | | | | Fallsington-------| 45 |Very limited | | | | | | | Depth to apparent|1.00 |Depth to apparent |1.00 |IIIWr |1.00 | | zone of | | zone of | |Not permitted |1.00 | | saturation | | saturation | | Hydric soil | | | Not permitted |1.00 |Not permitted |1.00 | | | | Hydric soil | | Hydric soil | | | | | | | | | |
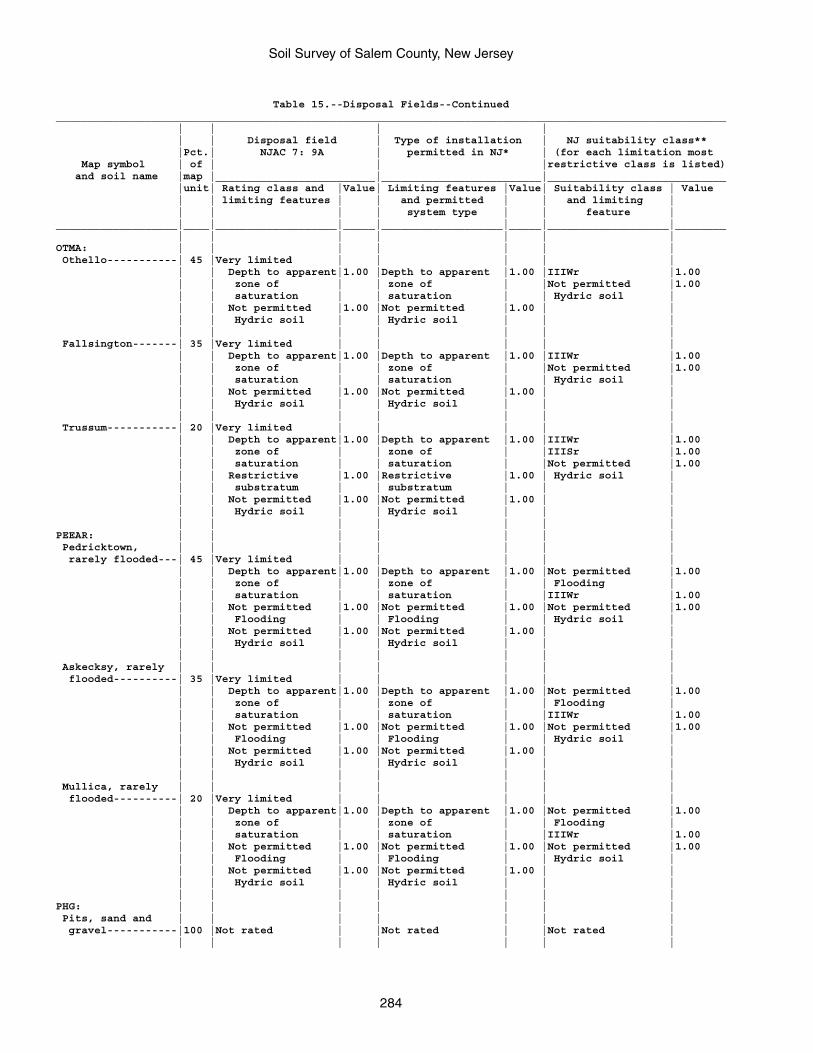
Soil Survey of Salem County, New Jersey
284
Table 15.--Disposal Fields--Continued_________________________________________________________________________________________________________ | | | | | | Disposal field | Type of installation | NJ suitability class** |Pct.| NJAC 7: 9A | permitted in NJ* | (for each limitation most Map symbol | of | | |restrictive class is listed) and soil name |map |_________________________|_________________________|____________________________ |unit| Rating class and |Value| Limiting features |Value| Suitability class | Value | | limiting features | | and permitted | | and limiting | | | | | system type | | feature |___________________|____|___________________|_____|___________________|_____|___________________|________ | | | | | | |OTMA: | | | | | | | Othello-----------| 45 |Very limited | | | | | | | Depth to apparent|1.00 |Depth to apparent |1.00 |IIIWr |1.00 | | zone of | | zone of | |Not permitted |1.00 | | saturation | | saturation | | Hydric soil | | | Not permitted |1.00 |Not permitted |1.00 | | | | Hydric soil | | Hydric soil | | | | | | | | | | Fallsington-------| 35 |Very limited | | | | | | | Depth to apparent|1.00 |Depth to apparent |1.00 |IIIWr |1.00 | | zone of | | zone of | |Not permitted |1.00 | | saturation | | saturation | | Hydric soil | | | Not permitted |1.00 |Not permitted |1.00 | | | | Hydric soil | | Hydric soil | | | | | | | | | | Trussum-----------| 20 |Very limited | | | | | | | Depth to apparent|1.00 |Depth to apparent |1.00 |IIIWr |1.00 | | zone of | | zone of | |IIISr |1.00 | | saturation | | saturation | |Not permitted |1.00 | | Restrictive |1.00 |Restrictive |1.00 | Hydric soil | | | substratum | | substratum | | | | | Not permitted |1.00 |Not permitted |1.00 | | | | Hydric soil | | Hydric soil | | | | | | | | | |PEEAR: | | | | | | | Pedricktown, | | | | | | | rarely flooded---| 45 |Very limited | | | | | | | Depth to apparent|1.00 |Depth to apparent |1.00 |Not permitted |1.00 | | zone of | | zone of | | Flooding | | | saturation | | saturation | |IIIWr |1.00 | | Not permitted |1.00 |Not permitted |1.00 |Not permitted |1.00 | | Flooding | | Flooding | | Hydric soil | | | Not permitted |1.00 |Not permitted |1.00 | | | | Hydric soil | | Hydric soil | | | | | | | | | | Askecksy, rarely | | | | | | | flooded----------| 35 |Very limited | | | | | | | Depth to apparent|1.00 |Depth to apparent |1.00 |Not permitted |1.00 | | zone of | | zone of | | Flooding | | | saturation | | saturation | |IIIWr |1.00 | | Not permitted |1.00 |Not permitted |1.00 |Not permitted |1.00 | | Flooding | | Flooding | | Hydric soil | | | Not permitted |1.00 |Not permitted |1.00 | | | | Hydric soil | | Hydric soil | | | | | | | | | | Mullica, rarely | | | | | | | flooded----------| 20 |Very limited | | | | | | | Depth to apparent|1.00 |Depth to apparent |1.00 |Not permitted |1.00 | | zone of | | zone of | | Flooding | | | saturation | | saturation | |IIIWr |1.00 | | Not permitted |1.00 |Not permitted |1.00 |Not permitted |1.00 | | Flooding | | Flooding | | Hydric soil | | | Not permitted |1.00 |Not permitted |1.00 | | | | Hydric soil | | Hydric soil | | | | | | | | | |PHG: | | | | | | | Pits, sand and | | | | | | | gravel-----------|100 |Not rated | |Not rated | |Not rated | | | | | | | |
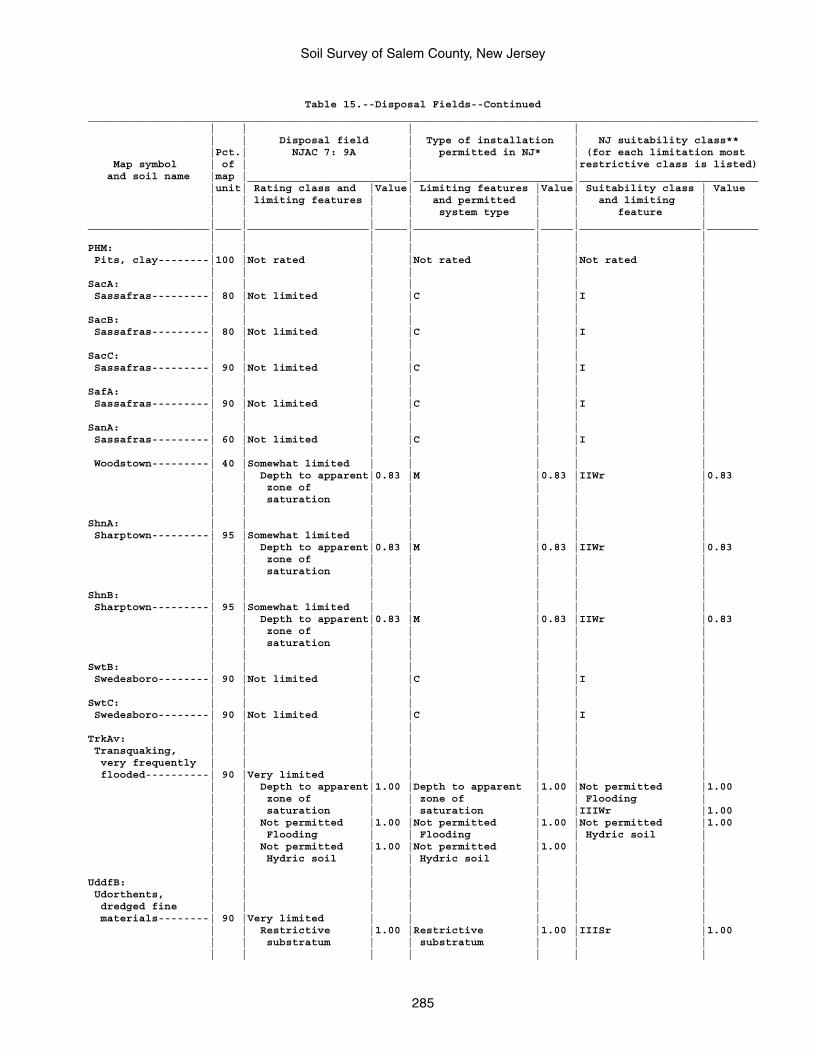
Soil Survey of Salem County, New Jersey
285
Table 15.--Disposal Fields--Continued_________________________________________________________________________________________________________ | | | | | | Disposal field | Type of installation | NJ suitability class** |Pct.| NJAC 7: 9A | permitted in NJ* | (for each limitation most Map symbol | of | | |restrictive class is listed) and soil name |map |_________________________|_________________________|____________________________ |unit| Rating class and |Value| Limiting features |Value| Suitability class | Value | | limiting features | | and permitted | | and limiting | | | | | system type | | feature |___________________|____|___________________|_____|___________________|_____|___________________|________ | | | | | | |PHM: | | | | | | | Pits, clay--------|100 |Not rated | |Not rated | |Not rated | | | | | | | |SacA: | | | | | | | Sassafras---------| 80 |Not limited | |C | |I | | | | | | | |SacB: | | | | | | | Sassafras---------| 80 |Not limited | |C | |I | | | | | | | |SacC: | | | | | | | Sassafras---------| 90 |Not limited | |C | |I | | | | | | | |SafA: | | | | | | | Sassafras---------| 90 |Not limited | |C | |I | | | | | | | |SanA: | | | | | | | Sassafras---------| 60 |Not limited | |C | |I | | | | | | | | Woodstown---------| 40 |Somewhat limited | | | | | | | Depth to apparent|0.83 |M |0.83 |IIWr |0.83 | | zone of | | | | | | | saturation | | | | | | | | | | | |ShnA: | | | | | | | Sharptown---------| 95 |Somewhat limited | | | | | | | Depth to apparent|0.83 |M |0.83 |IIWr |0.83 | | zone of | | | | | | | saturation | | | | | | | | | | | |ShnB: | | | | | | | Sharptown---------| 95 |Somewhat limited | | | | | | | Depth to apparent|0.83 |M |0.83 |IIWr |0.83 | | zone of | | | | | | | saturation | | | | | | | | | | | |SwtB: | | | | | | | Swedesboro--------| 90 |Not limited | |C | |I | | | | | | | |SwtC: | | | | | | | Swedesboro--------| 90 |Not limited | |C | |I | | | | | | | |TrkAv: | | | | | | | Transquaking, | | | | | | | very frequently | | | | | | | flooded----------| 90 |Very limited | | | | | | | Depth to apparent|1.00 |Depth to apparent |1.00 |Not permitted |1.00 | | zone of | | zone of | | Flooding | | | saturation | | saturation | |IIIWr |1.00 | | Not permitted |1.00 |Not permitted |1.00 |Not permitted |1.00 | | Flooding | | Flooding | | Hydric soil | | | Not permitted |1.00 |Not permitted |1.00 | | | | Hydric soil | | Hydric soil | | | | | | | | | |UddfB: | | | | | | | Udorthents, | | | | | | | dredged fine | | | | | | | materials--------| 90 |Very limited | | | | | | | Restrictive |1.00 |Restrictive |1.00 |IIISr |1.00 | | substratum | | substratum | | | | | | | | | |
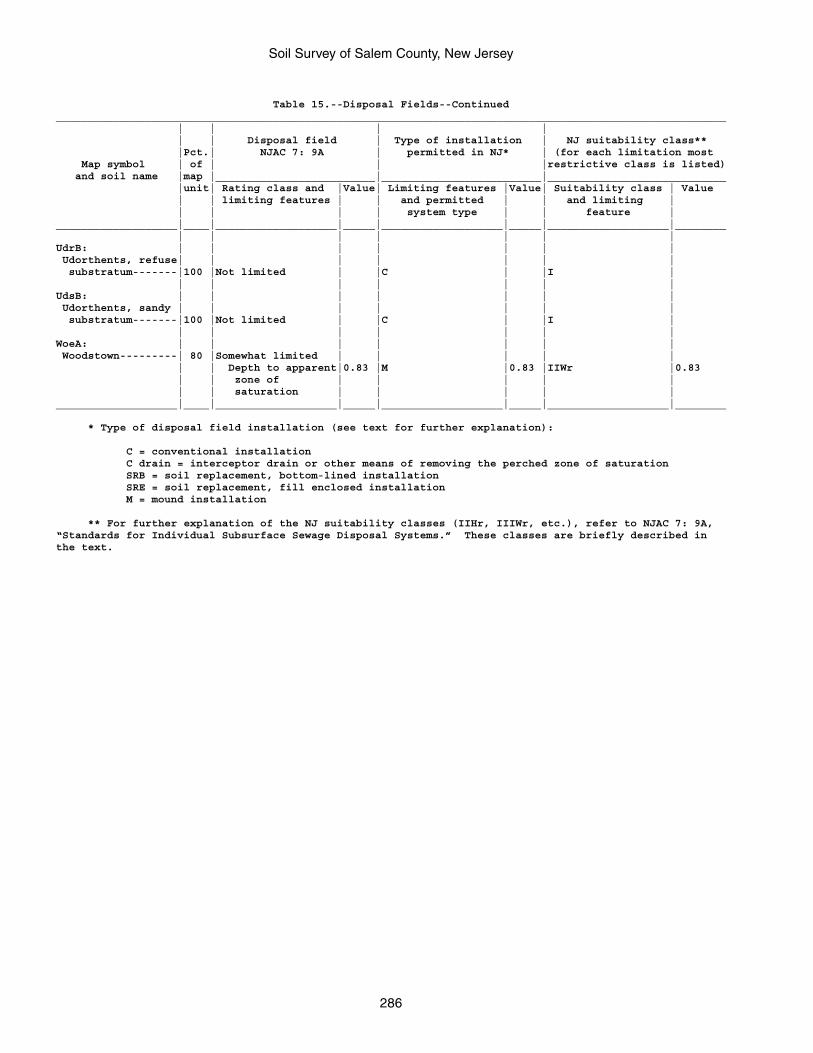
Soil Survey of Salem County, New Jersey
286
Table 15.--Disposal Fields--Continued_________________________________________________________________________________________________________ | | | | | | Disposal field | Type of installation | NJ suitability class** |Pct.| NJAC 7: 9A | permitted in NJ* | (for each limitation most Map symbol | of | | |restrictive class is listed) and soil name |map |_________________________|_________________________|____________________________ |unit| Rating class and |Value| Limiting features |Value| Suitability class | Value | | limiting features | | and permitted | | and limiting | | | | | system type | | feature |___________________|____|___________________|_____|___________________|_____|___________________|________ | | | | | | |UdrB: | | | | | | | Udorthents, refuse| | | | | | | substratum-------|100 |Not limited | |C | |I | | | | | | | |UdsB: | | | | | | | Udorthents, sandy | | | | | | | substratum-------|100 |Not limited | |C | |I | | | | | | | |WoeA: | | | | | | | Woodstown---------| 80 |Somewhat limited | | | | | | | Depth to apparent|0.83 |M |0.83 |IIWr |0.83 | | zone of | | | | | | | saturation | | | | |___________________|____|___________________|_____|___________________|_____|___________________|________
* Type of disposal field installation (see text for further explanation):
C = conventional installation C drain = interceptor drain or other means of removing the perched zone of saturation SRB = soil replacement, bottom-lined installation SRE = soil replacement, fill enclosed installation M = mound installation
** For further explanation of the NJ suitability classes (IIHr, IIIWr, etc.), refer to NJAC 7: 9A,“Standards for Individual Subsurface Sewage Disposal Systems.” These classes are briefly described inthe text.
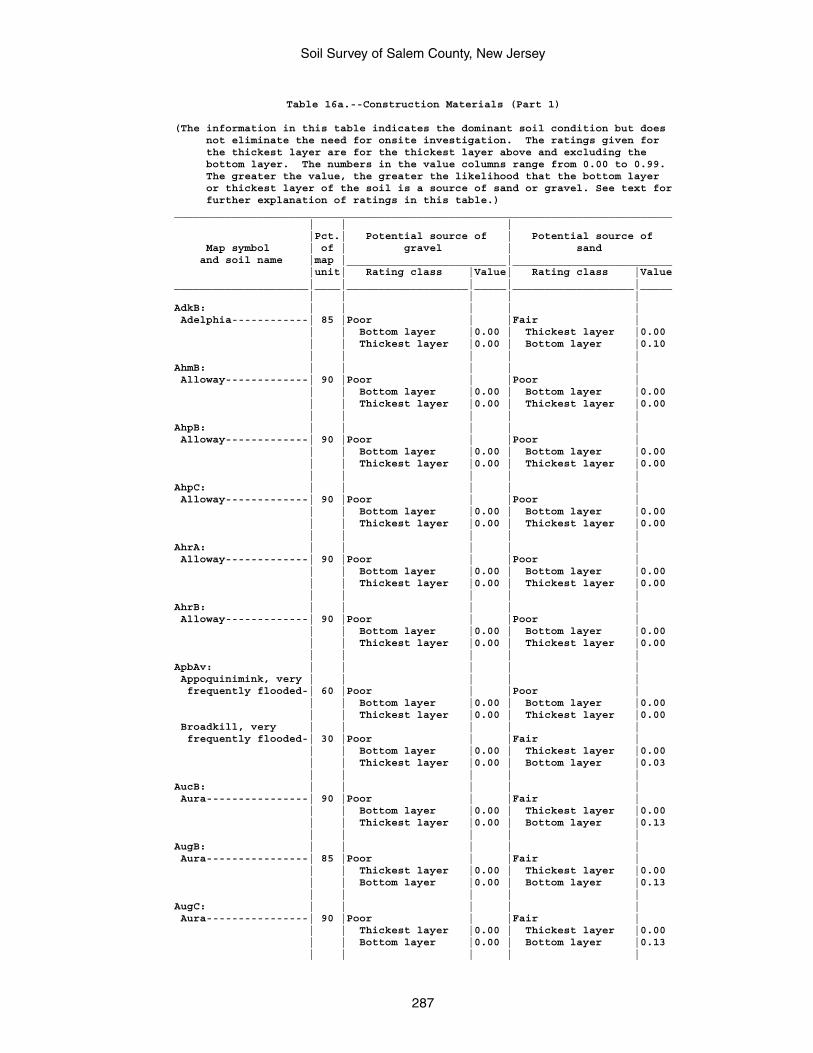
Soil Survey of Salem County, New Jersey
287
Table 16a.--Construction Materials (Part 1)
(The information in this table indicates the dominant soil condition but does not eliminate the need for onsite investigation. The ratings given for the thickest layer are for the thickest layer above and excluding the bottom layer. The numbers in the value columns range from 0.00 to 0.99. The greater the value, the greater the likelihood that the bottom layer or thickest layer of the soil is a source of sand or gravel. See text for further explanation of ratings in this table.)______________________________________________________________________________ | | | |Pct.| Potential source of | Potential source of Map symbol | of | gravel | sand and soil name |map |_________________________|_________________________ |unit| Rating class |Value| Rating class |Value_____________________|____|___________________|_____|___________________|_____ | | | | |AdkB: | | | | | Adelphia------------| 85 |Poor | |Fair | | | Bottom layer |0.00 | Thickest layer |0.00 | | Thickest layer |0.00 | Bottom layer |0.10 | | | | |AhmB: | | | | | Alloway-------------| 90 |Poor | |Poor | | | Bottom layer |0.00 | Bottom layer |0.00 | | Thickest layer |0.00 | Thickest layer |0.00 | | | | |AhpB: | | | | | Alloway-------------| 90 |Poor | |Poor | | | Bottom layer |0.00 | Bottom layer |0.00 | | Thickest layer |0.00 | Thickest layer |0.00 | | | | |AhpC: | | | | | Alloway-------------| 90 |Poor | |Poor | | | Bottom layer |0.00 | Bottom layer |0.00 | | Thickest layer |0.00 | Thickest layer |0.00 | | | | |AhrA: | | | | | Alloway-------------| 90 |Poor | |Poor | | | Bottom layer |0.00 | Bottom layer |0.00 | | Thickest layer |0.00 | Thickest layer |0.00 | | | | |AhrB: | | | | | Alloway-------------| 90 |Poor | |Poor | | | Bottom layer |0.00 | Bottom layer |0.00 | | Thickest layer |0.00 | Thickest layer |0.00 | | | | |ApbAv: | | | | | Appoquinimink, very | | | | | frequently flooded-| 60 |Poor | |Poor | | | Bottom layer |0.00 | Bottom layer |0.00 | | Thickest layer |0.00 | Thickest layer |0.00 Broadkill, very | | | | | frequently flooded-| 30 |Poor | |Fair | | | Bottom layer |0.00 | Thickest layer |0.00 | | Thickest layer |0.00 | Bottom layer |0.03 | | | | |AucB: | | | | | Aura----------------| 90 |Poor | |Fair | | | Bottom layer |0.00 | Thickest layer |0.00 | | Thickest layer |0.00 | Bottom layer |0.13 | | | | |AugB: | | | | | Aura----------------| 85 |Poor | |Fair | | | Thickest layer |0.00 | Thickest layer |0.00 | | Bottom layer |0.00 | Bottom layer |0.13 | | | | |AugC: | | | | | Aura----------------| 90 |Poor | |Fair | | | Thickest layer |0.00 | Thickest layer |0.00 | | Bottom layer |0.00 | Bottom layer |0.13 | | | | |
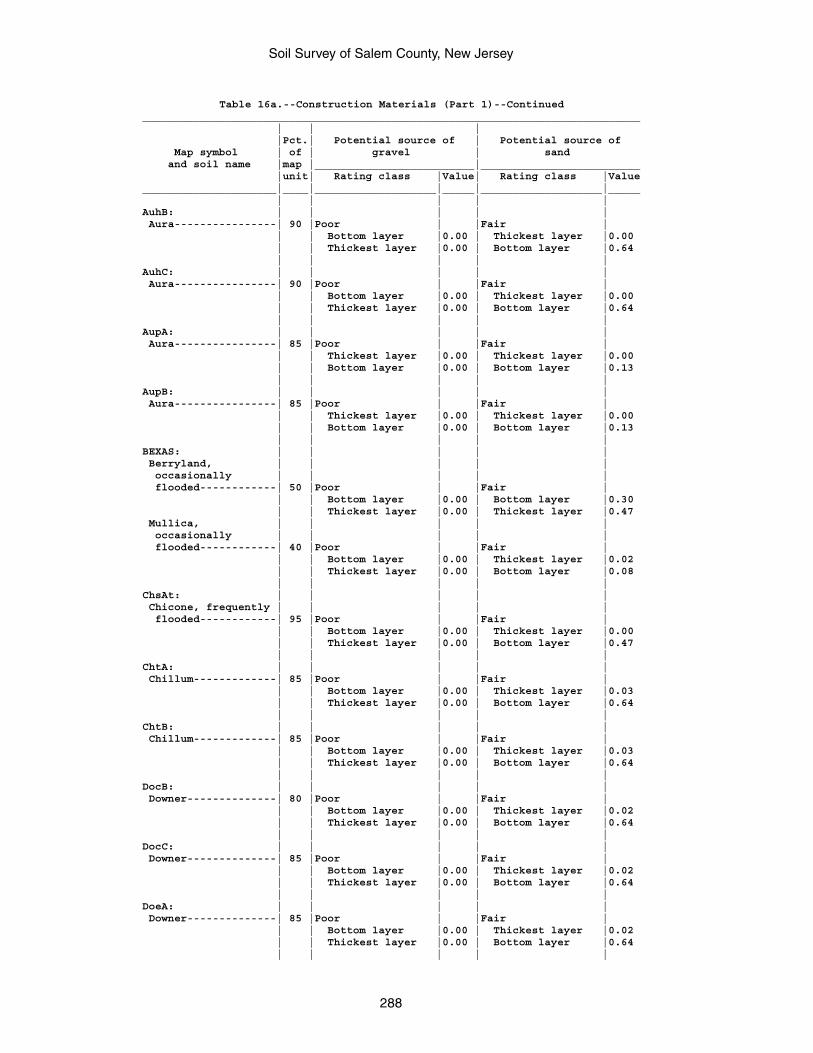
Soil Survey of Salem County, New Jersey
288
Table 16a.--Construction Materials (Part 1)--Continued______________________________________________________________________________ | | | |Pct.| Potential source of | Potential source of Map symbol | of | gravel | sand and soil name |map |_________________________|_________________________ |unit| Rating class |Value| Rating class |Value_____________________|____|___________________|_____|___________________|_____ | | | | |AuhB: | | | | | Aura----------------| 90 |Poor | |Fair | | | Bottom layer |0.00 | Thickest layer |0.00 | | Thickest layer |0.00 | Bottom layer |0.64 | | | | |AuhC: | | | | | Aura----------------| 90 |Poor | |Fair | | | Bottom layer |0.00 | Thickest layer |0.00 | | Thickest layer |0.00 | Bottom layer |0.64 | | | | |AupA: | | | | | Aura----------------| 85 |Poor | |Fair | | | Thickest layer |0.00 | Thickest layer |0.00 | | Bottom layer |0.00 | Bottom layer |0.13 | | | | |AupB: | | | | | Aura----------------| 85 |Poor | |Fair | | | Thickest layer |0.00 | Thickest layer |0.00 | | Bottom layer |0.00 | Bottom layer |0.13 | | | | |BEXAS: | | | | | Berryland, | | | | | occasionally | | | | | flooded------------| 50 |Poor | |Fair | | | Bottom layer |0.00 | Bottom layer |0.30 | | Thickest layer |0.00 | Thickest layer |0.47 Mullica, | | | | | occasionally | | | | | flooded------------| 40 |Poor | |Fair | | | Bottom layer |0.00 | Thickest layer |0.02 | | Thickest layer |0.00 | Bottom layer |0.08 | | | | |ChsAt: | | | | | Chicone, frequently | | | | | flooded------------| 95 |Poor | |Fair | | | Bottom layer |0.00 | Thickest layer |0.00 | | Thickest layer |0.00 | Bottom layer |0.47 | | | | |ChtA: | | | | | Chillum-------------| 85 |Poor | |Fair | | | Bottom layer |0.00 | Thickest layer |0.03 | | Thickest layer |0.00 | Bottom layer |0.64 | | | | |ChtB: | | | | | Chillum-------------| 85 |Poor | |Fair | | | Bottom layer |0.00 | Thickest layer |0.03 | | Thickest layer |0.00 | Bottom layer |0.64 | | | | |DocB: | | | | | Downer--------------| 80 |Poor | |Fair | | | Bottom layer |0.00 | Thickest layer |0.02 | | Thickest layer |0.00 | Bottom layer |0.64 | | | | |DocC: | | | | | Downer--------------| 85 |Poor | |Fair | | | Bottom layer |0.00 | Thickest layer |0.02 | | Thickest layer |0.00 | Bottom layer |0.64 | | | | |DoeA: | | | | | Downer--------------| 85 |Poor | |Fair | | | Bottom layer |0.00 | Thickest layer |0.02 | | Thickest layer |0.00 | Bottom layer |0.64 | | | | |
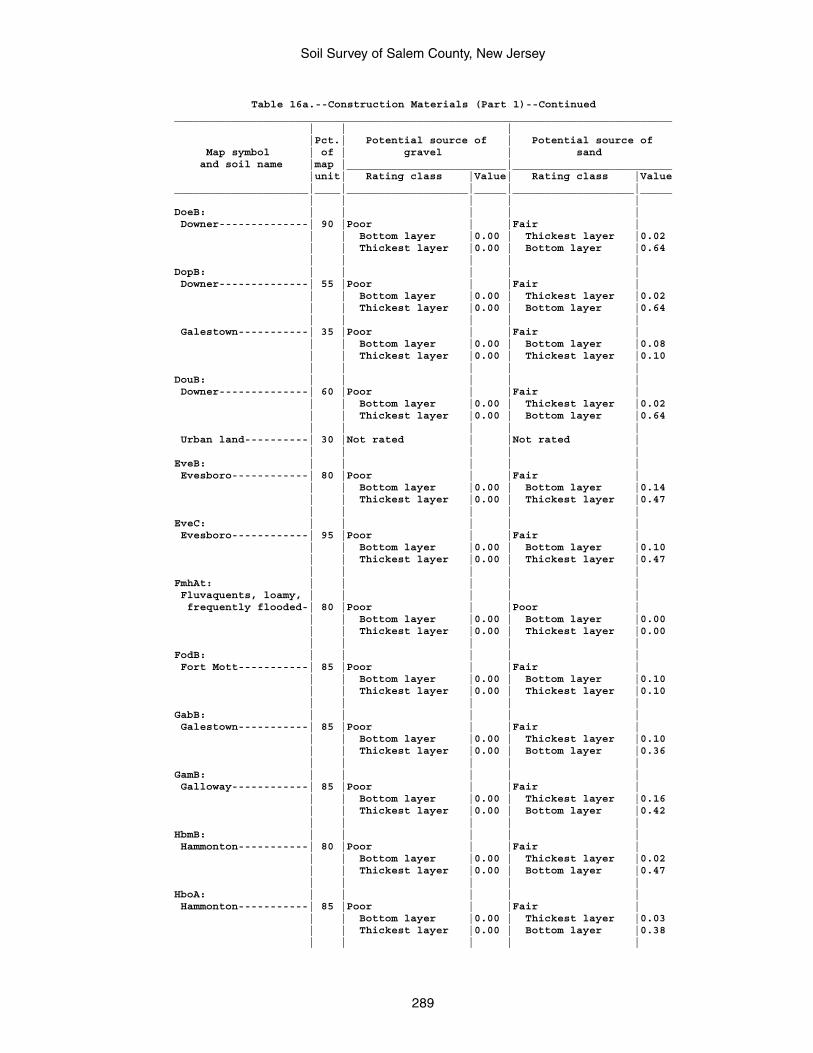
Soil Survey of Salem County, New Jersey
289
Table 16a.--Construction Materials (Part 1)--Continued______________________________________________________________________________ | | | |Pct.| Potential source of | Potential source of Map symbol | of | gravel | sand and soil name |map |_________________________|_________________________ |unit| Rating class |Value| Rating class |Value_____________________|____|___________________|_____|___________________|_____ | | | | |DoeB: | | | | | Downer--------------| 90 |Poor | |Fair | | | Bottom layer |0.00 | Thickest layer |0.02 | | Thickest layer |0.00 | Bottom layer |0.64 | | | | |DopB: | | | | | Downer--------------| 55 |Poor | |Fair | | | Bottom layer |0.00 | Thickest layer |0.02 | | Thickest layer |0.00 | Bottom layer |0.64 | | | | | Galestown-----------| 35 |Poor | |Fair | | | Bottom layer |0.00 | Bottom layer |0.08 | | Thickest layer |0.00 | Thickest layer |0.10 | | | | |DouB: | | | | | Downer--------------| 60 |Poor | |Fair | | | Bottom layer |0.00 | Thickest layer |0.02 | | Thickest layer |0.00 | Bottom layer |0.64 | | | | | Urban land----------| 30 |Not rated | |Not rated | | | | | |EveB: | | | | | Evesboro------------| 80 |Poor | |Fair | | | Bottom layer |0.00 | Bottom layer |0.14 | | Thickest layer |0.00 | Thickest layer |0.47 | | | | |EveC: | | | | | Evesboro------------| 95 |Poor | |Fair | | | Bottom layer |0.00 | Bottom layer |0.10 | | Thickest layer |0.00 | Thickest layer |0.47 | | | | |FmhAt: | | | | | Fluvaquents, loamy, | | | | | frequently flooded-| 80 |Poor | |Poor | | | Bottom layer |0.00 | Bottom layer |0.00 | | Thickest layer |0.00 | Thickest layer |0.00 | | | | |FodB: | | | | | Fort Mott-----------| 85 |Poor | |Fair | | | Bottom layer |0.00 | Bottom layer |0.10 | | Thickest layer |0.00 | Thickest layer |0.10 | | | | |GabB: | | | | | Galestown-----------| 85 |Poor | |Fair | | | Bottom layer |0.00 | Thickest layer |0.10 | | Thickest layer |0.00 | Bottom layer |0.36 | | | | |GamB: | | | | | Galloway------------| 85 |Poor | |Fair | | | Bottom layer |0.00 | Thickest layer |0.16 | | Thickest layer |0.00 | Bottom layer |0.42 | | | | |HbmB: | | | | | Hammonton-----------| 80 |Poor | |Fair | | | Bottom layer |0.00 | Thickest layer |0.02 | | Thickest layer |0.00 | Bottom layer |0.47 | | | | |HboA: | | | | | Hammonton-----------| 85 |Poor | |Fair | | | Bottom layer |0.00 | Thickest layer |0.03 | | Thickest layer |0.00 | Bottom layer |0.38 | | | | |
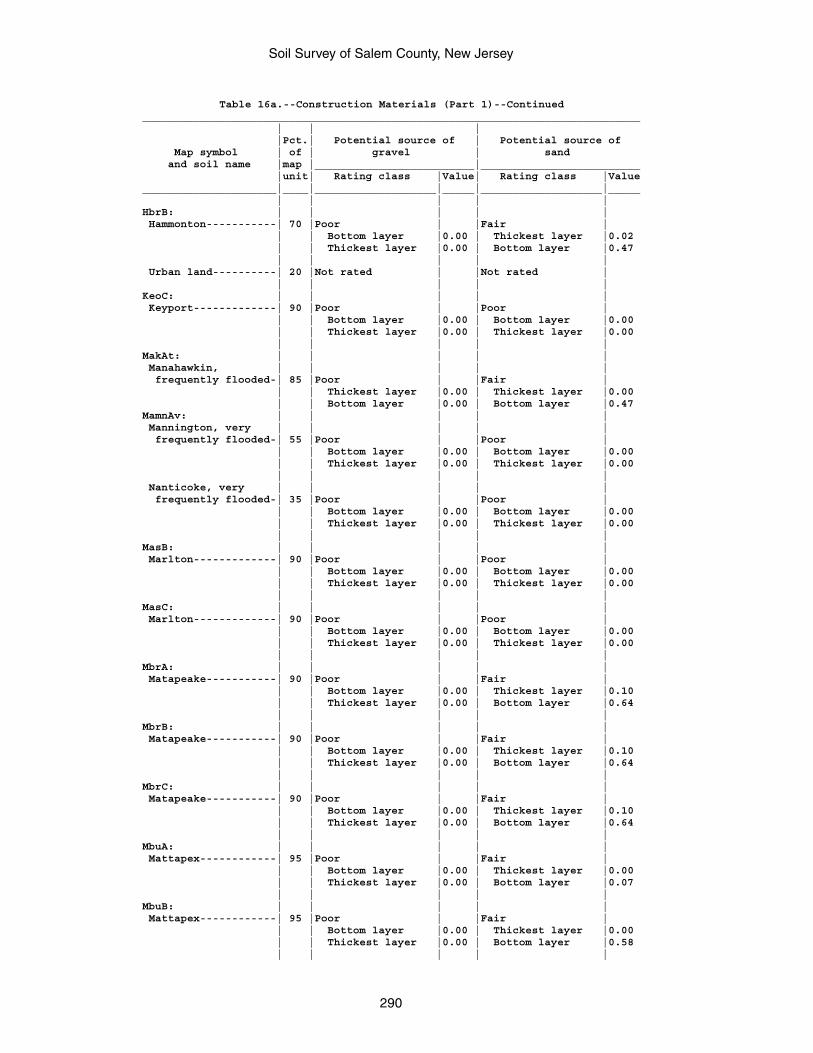
Soil Survey of Salem County, New Jersey
290
Table 16a.--Construction Materials (Part 1)--Continued______________________________________________________________________________ | | | |Pct.| Potential source of | Potential source of Map symbol | of | gravel | sand and soil name |map |_________________________|_________________________ |unit| Rating class |Value| Rating class |Value_____________________|____|___________________|_____|___________________|_____ | | | | |HbrB: | | | | | Hammonton-----------| 70 |Poor | |Fair | | | Bottom layer |0.00 | Thickest layer |0.02 | | Thickest layer |0.00 | Bottom layer |0.47 | | | | | Urban land----------| 20 |Not rated | |Not rated | | | | | |KeoC: | | | | | Keyport-------------| 90 |Poor | |Poor | | | Bottom layer |0.00 | Bottom layer |0.00 | | Thickest layer |0.00 | Thickest layer |0.00 | | | | |MakAt: | | | | | Manahawkin, | | | | | frequently flooded-| 85 |Poor | |Fair | | | Thickest layer |0.00 | Thickest layer |0.00 | | Bottom layer |0.00 | Bottom layer |0.47MamnAv: | | | | | Mannington, very | | | | | frequently flooded-| 55 |Poor | |Poor | | | Bottom layer |0.00 | Bottom layer |0.00 | | Thickest layer |0.00 | Thickest layer |0.00 | | | | | Nanticoke, very | | | | | frequently flooded-| 35 |Poor | |Poor | | | Bottom layer |0.00 | Bottom layer |0.00 | | Thickest layer |0.00 | Thickest layer |0.00 | | | | |MasB: | | | | | Marlton-------------| 90 |Poor | |Poor | | | Bottom layer |0.00 | Bottom layer |0.00 | | Thickest layer |0.00 | Thickest layer |0.00 | | | | |MasC: | | | | | Marlton-------------| 90 |Poor | |Poor | | | Bottom layer |0.00 | Bottom layer |0.00 | | Thickest layer |0.00 | Thickest layer |0.00 | | | | |MbrA: | | | | | Matapeake-----------| 90 |Poor | |Fair | | | Bottom layer |0.00 | Thickest layer |0.10 | | Thickest layer |0.00 | Bottom layer |0.64 | | | | |MbrB: | | | | | Matapeake-----------| 90 |Poor | |Fair | | | Bottom layer |0.00 | Thickest layer |0.10 | | Thickest layer |0.00 | Bottom layer |0.64 | | | | |MbrC: | | | | | Matapeake-----------| 90 |Poor | |Fair | | | Bottom layer |0.00 | Thickest layer |0.10 | | Thickest layer |0.00 | Bottom layer |0.64 | | | | |MbuA: | | | | | Mattapex------------| 95 |Poor | |Fair | | | Bottom layer |0.00 | Thickest layer |0.00 | | Thickest layer |0.00 | Bottom layer |0.07 | | | | |MbuB: | | | | | Mattapex------------| 95 |Poor | |Fair | | | Bottom layer |0.00 | Thickest layer |0.00 | | Thickest layer |0.00 | Bottom layer |0.58 | | | | |
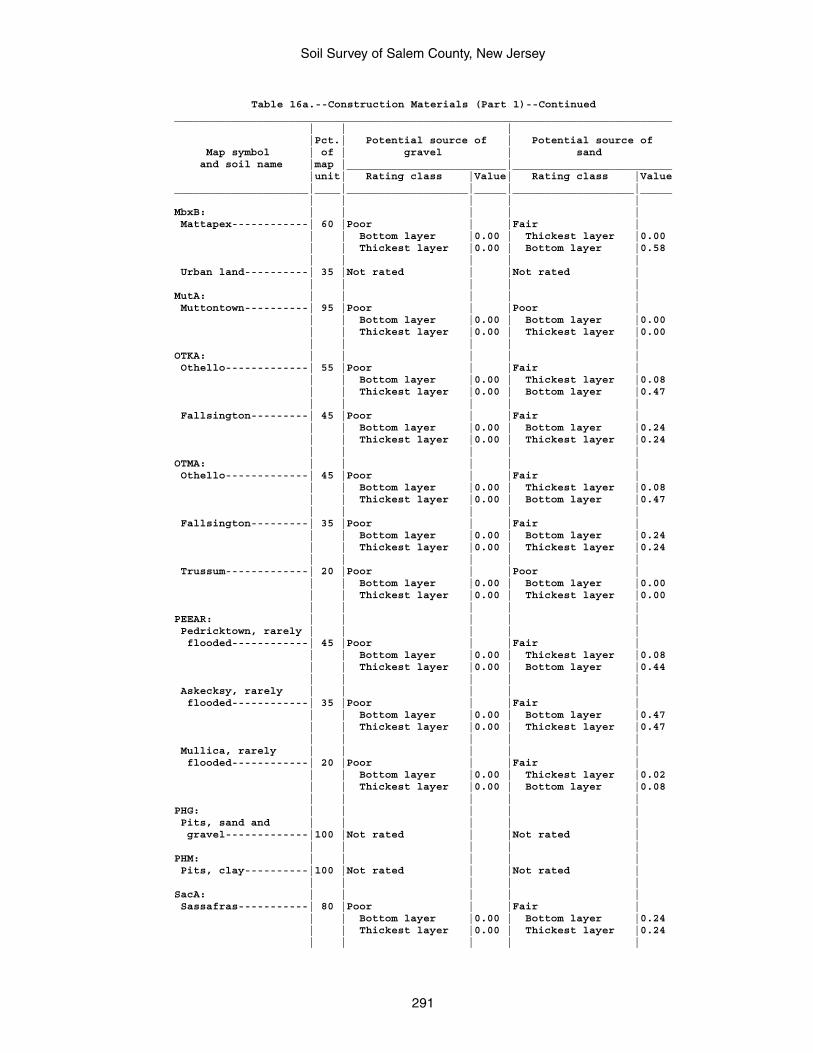
Soil Survey of Salem County, New Jersey
291
Table 16a.--Construction Materials (Part 1)--Continued______________________________________________________________________________ | | | |Pct.| Potential source of | Potential source of Map symbol | of | gravel | sand and soil name |map |_________________________|_________________________ |unit| Rating class |Value| Rating class |Value_____________________|____|___________________|_____|___________________|_____ | | | | |MbxB: | | | | | Mattapex------------| 60 |Poor | |Fair | | | Bottom layer |0.00 | Thickest layer |0.00 | | Thickest layer |0.00 | Bottom layer |0.58 | | | | | Urban land----------| 35 |Not rated | |Not rated | | | | | |MutA: | | | | | Muttontown----------| 95 |Poor | |Poor | | | Bottom layer |0.00 | Bottom layer |0.00 | | Thickest layer |0.00 | Thickest layer |0.00 | | | | |OTKA: | | | | | Othello-------------| 55 |Poor | |Fair | | | Bottom layer |0.00 | Thickest layer |0.08 | | Thickest layer |0.00 | Bottom layer |0.47 | | | | | Fallsington---------| 45 |Poor | |Fair | | | Bottom layer |0.00 | Bottom layer |0.24 | | Thickest layer |0.00 | Thickest layer |0.24 | | | | |OTMA: | | | | | Othello-------------| 45 |Poor | |Fair | | | Bottom layer |0.00 | Thickest layer |0.08 | | Thickest layer |0.00 | Bottom layer |0.47 | | | | | Fallsington---------| 35 |Poor | |Fair | | | Bottom layer |0.00 | Bottom layer |0.24 | | Thickest layer |0.00 | Thickest layer |0.24 | | | | | Trussum-------------| 20 |Poor | |Poor | | | Bottom layer |0.00 | Bottom layer |0.00 | | Thickest layer |0.00 | Thickest layer |0.00 | | | | |PEEAR: | | | | | Pedricktown, rarely | | | | | flooded------------| 45 |Poor | |Fair | | | Bottom layer |0.00 | Thickest layer |0.08 | | Thickest layer |0.00 | Bottom layer |0.44 | | | | | Askecksy, rarely | | | | | flooded------------| 35 |Poor | |Fair | | | Bottom layer |0.00 | Bottom layer |0.47 | | Thickest layer |0.00 | Thickest layer |0.47 | | | | | Mullica, rarely | | | | | flooded------------| 20 |Poor | |Fair | | | Bottom layer |0.00 | Thickest layer |0.02 | | Thickest layer |0.00 | Bottom layer |0.08 | | | | |PHG: | | | | | Pits, sand and | | | | | gravel-------------|100 |Not rated | |Not rated | | | | | |PHM: | | | | | Pits, clay----------|100 |Not rated | |Not rated | | | | | |SacA: | | | | | Sassafras-----------| 80 |Poor | |Fair | | | Bottom layer |0.00 | Bottom layer |0.24 | | Thickest layer |0.00 | Thickest layer |0.24 | | | | |
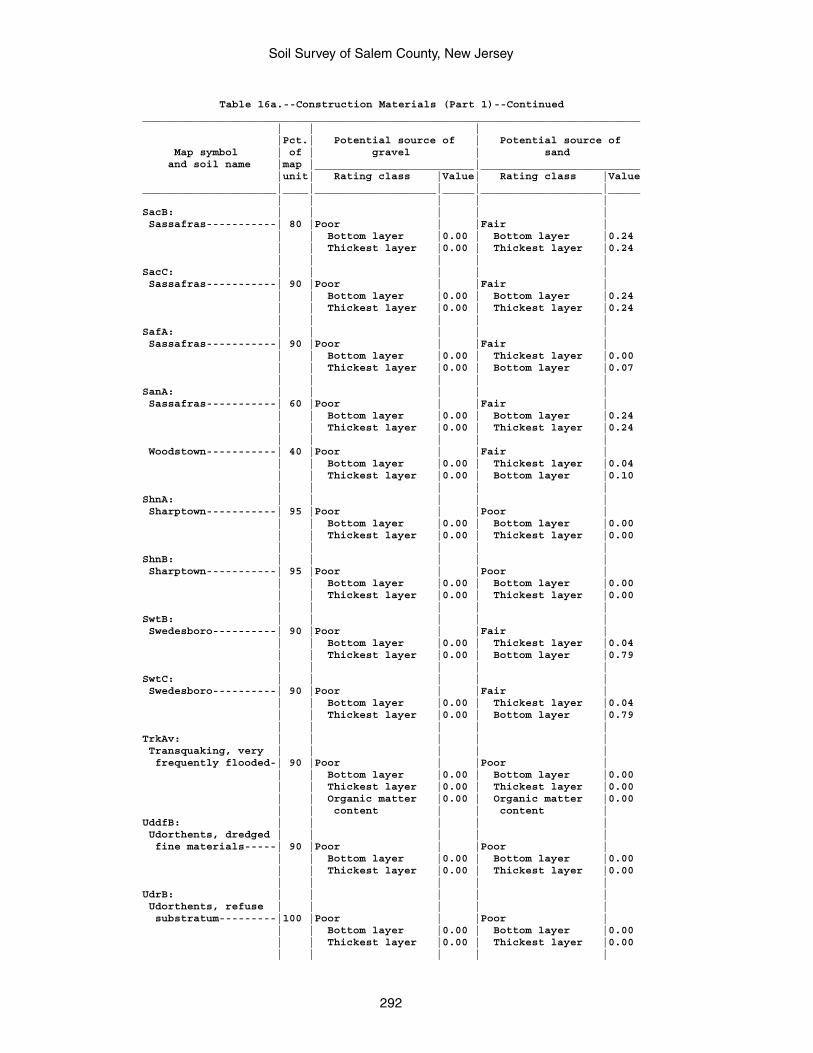
Soil Survey of Salem County, New Jersey
292
Table 16a.--Construction Materials (Part 1)--Continued______________________________________________________________________________ | | | |Pct.| Potential source of | Potential source of Map symbol | of | gravel | sand and soil name |map |_________________________|_________________________ |unit| Rating class |Value| Rating class |Value_____________________|____|___________________|_____|___________________|_____ | | | | |SacB: | | | | | Sassafras-----------| 80 |Poor | |Fair | | | Bottom layer |0.00 | Bottom layer |0.24 | | Thickest layer |0.00 | Thickest layer |0.24 | | | | |SacC: | | | | | Sassafras-----------| 90 |Poor | |Fair | | | Bottom layer |0.00 | Bottom layer |0.24 | | Thickest layer |0.00 | Thickest layer |0.24 | | | | |SafA: | | | | | Sassafras-----------| 90 |Poor | |Fair | | | Bottom layer |0.00 | Thickest layer |0.00 | | Thickest layer |0.00 | Bottom layer |0.07 | | | | |SanA: | | | | | Sassafras-----------| 60 |Poor | |Fair | | | Bottom layer |0.00 | Bottom layer |0.24 | | Thickest layer |0.00 | Thickest layer |0.24 | | | | | Woodstown-----------| 40 |Poor | |Fair | | | Bottom layer |0.00 | Thickest layer |0.04 | | Thickest layer |0.00 | Bottom layer |0.10 | | | | |ShnA: | | | | | Sharptown-----------| 95 |Poor | |Poor | | | Bottom layer |0.00 | Bottom layer |0.00 | | Thickest layer |0.00 | Thickest layer |0.00 | | | | |ShnB: | | | | | Sharptown-----------| 95 |Poor | |Poor | | | Bottom layer |0.00 | Bottom layer |0.00 | | Thickest layer |0.00 | Thickest layer |0.00 | | | | |SwtB: | | | | | Swedesboro----------| 90 |Poor | |Fair | | | Bottom layer |0.00 | Thickest layer |0.04 | | Thickest layer |0.00 | Bottom layer |0.79 | | | | |SwtC: | | | | | Swedesboro----------| 90 |Poor | |Fair | | | Bottom layer |0.00 | Thickest layer |0.04 | | Thickest layer |0.00 | Bottom layer |0.79 | | | | |TrkAv: | | | | | Transquaking, very | | | | | frequently flooded-| 90 |Poor | |Poor | | | Bottom layer |0.00 | Bottom layer |0.00 | | Thickest layer |0.00 | Thickest layer |0.00 | | Organic matter |0.00 | Organic matter |0.00 | | content | | content |UddfB: | | | | | Udorthents, dredged | | | | | fine materials-----| 90 |Poor | |Poor | | | Bottom layer |0.00 | Bottom layer |0.00 | | Thickest layer |0.00 | Thickest layer |0.00 | | | | |UdrB: | | | | | Udorthents, refuse | | | | | substratum---------|100 |Poor | |Poor | | | Bottom layer |0.00 | Bottom layer |0.00 | | Thickest layer |0.00 | Thickest layer |0.00 | | | | |
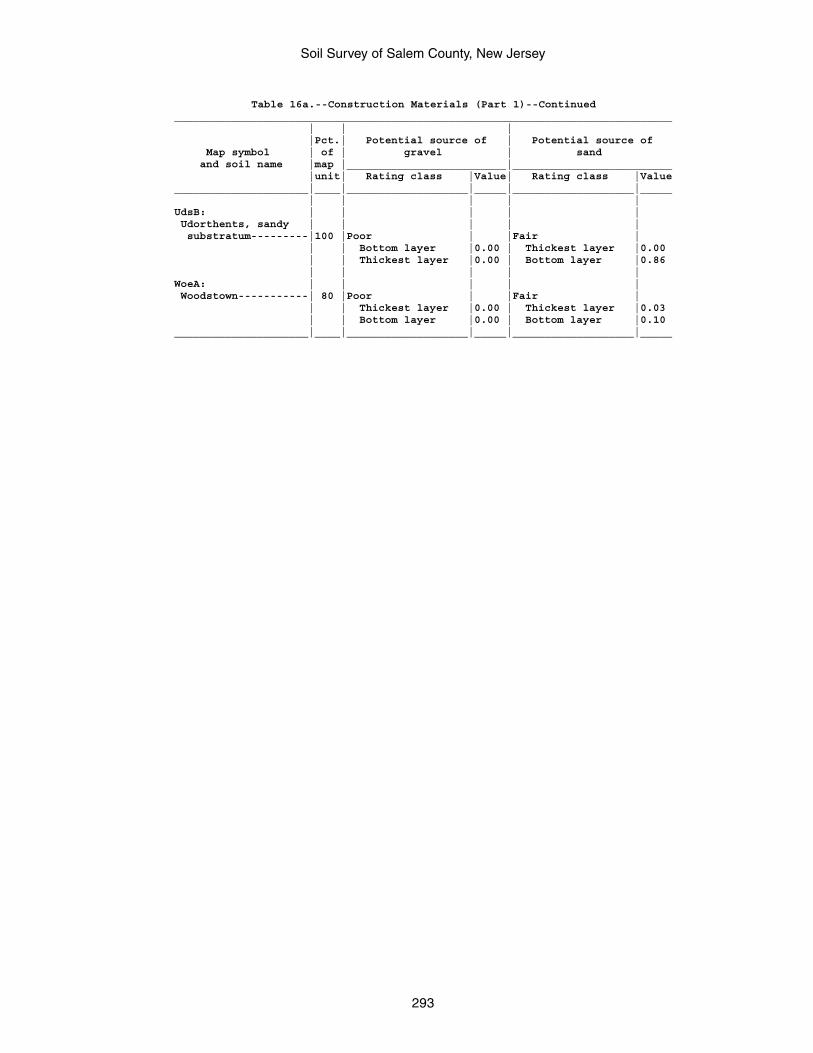
Soil Survey of Salem County, New Jersey
293
Table 16a.--Construction Materials (Part 1)--Continued______________________________________________________________________________ | | | |Pct.| Potential source of | Potential source of Map symbol | of | gravel | sand and soil name |map |_________________________|_________________________ |unit| Rating class |Value| Rating class |Value_____________________|____|___________________|_____|___________________|_____ | | | | |UdsB: | | | | | Udorthents, sandy | | | | | substratum---------|100 |Poor | |Fair | | | Bottom layer |0.00 | Thickest layer |0.00 | | Thickest layer |0.00 | Bottom layer |0.86 | | | | |WoeA: | | | | | Woodstown-----------| 80 |Poor | |Fair | | | Thickest layer |0.00 | Thickest layer |0.03 | | Bottom layer |0.00 | Bottom layer |0.10_____________________|____|___________________|_____|___________________|_____
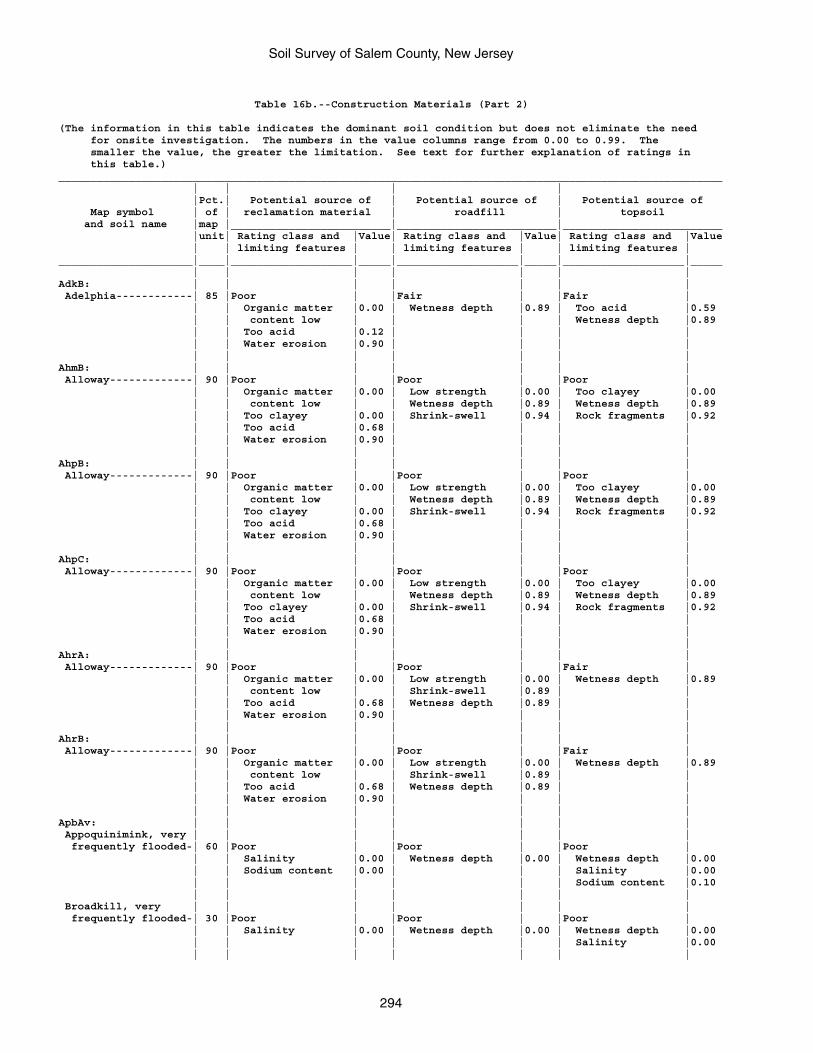
Soil Survey of Salem County, New Jersey
294
Table 16b.--Construction Materials (Part 2)
(The information in this table indicates the dominant soil condition but does not eliminate the need for onsite investigation. The numbers in the value columns range from 0.00 to 0.99. The smaller the value, the greater the limitation. See text for further explanation of ratings in this table.)________________________________________________________________________________________________________ | | | | |Pct.| Potential source of | Potential source of | Potential source of Map symbol | of | reclamation material | roadfill | topsoil and soil name |map |_________________________|_________________________|_________________________ |unit| Rating class and |Value| Rating class and |Value| Rating class and |Value | | limiting features | | limiting features | | limiting features |_____________________|____|___________________|_____|___________________|_____|___________________|_____ | | | | | | |AdkB: | | | | | | | Adelphia------------| 85 |Poor | |Fair | |Fair | | | Organic matter |0.00 | Wetness depth |0.89 | Too acid |0.59 | | content low | | | | Wetness depth |0.89 | | Too acid |0.12 | | | | | | Water erosion |0.90 | | | | | | | | | | |AhmB: | | | | | | | Alloway-------------| 90 |Poor | |Poor | |Poor | | | Organic matter |0.00 | Low strength |0.00 | Too clayey |0.00 | | content low | | Wetness depth |0.89 | Wetness depth |0.89 | | Too clayey |0.00 | Shrink-swell |0.94 | Rock fragments |0.92 | | Too acid |0.68 | | | | | | Water erosion |0.90 | | | | | | | | | | |AhpB: | | | | | | | Alloway-------------| 90 |Poor | |Poor | |Poor | | | Organic matter |0.00 | Low strength |0.00 | Too clayey |0.00 | | content low | | Wetness depth |0.89 | Wetness depth |0.89 | | Too clayey |0.00 | Shrink-swell |0.94 | Rock fragments |0.92 | | Too acid |0.68 | | | | | | Water erosion |0.90 | | | | | | | | | | |AhpC: | | | | | | | Alloway-------------| 90 |Poor | |Poor | |Poor | | | Organic matter |0.00 | Low strength |0.00 | Too clayey |0.00 | | content low | | Wetness depth |0.89 | Wetness depth |0.89 | | Too clayey |0.00 | Shrink-swell |0.94 | Rock fragments |0.92 | | Too acid |0.68 | | | | | | Water erosion |0.90 | | | | | | | | | | |AhrA: | | | | | | | Alloway-------------| 90 |Poor | |Poor | |Fair | | | Organic matter |0.00 | Low strength |0.00 | Wetness depth |0.89 | | content low | | Shrink-swell |0.89 | | | | Too acid |0.68 | Wetness depth |0.89 | | | | Water erosion |0.90 | | | | | | | | | | |AhrB: | | | | | | | Alloway-------------| 90 |Poor | |Poor | |Fair | | | Organic matter |0.00 | Low strength |0.00 | Wetness depth |0.89 | | content low | | Shrink-swell |0.89 | | | | Too acid |0.68 | Wetness depth |0.89 | | | | Water erosion |0.90 | | | | | | | | | | |ApbAv: | | | | | | | Appoquinimink, very | | | | | | | frequently flooded-| 60 |Poor | |Poor | |Poor | | | Salinity |0.00 | Wetness depth |0.00 | Wetness depth |0.00 | | Sodium content |0.00 | | | Salinity |0.00 | | | | | | Sodium content |0.10 | | | | | | | Broadkill, very | | | | | | | frequently flooded-| 30 |Poor | |Poor | |Poor | | | Salinity |0.00 | Wetness depth |0.00 | Wetness depth |0.00 | | | | | | Salinity |0.00 | | | | | | |
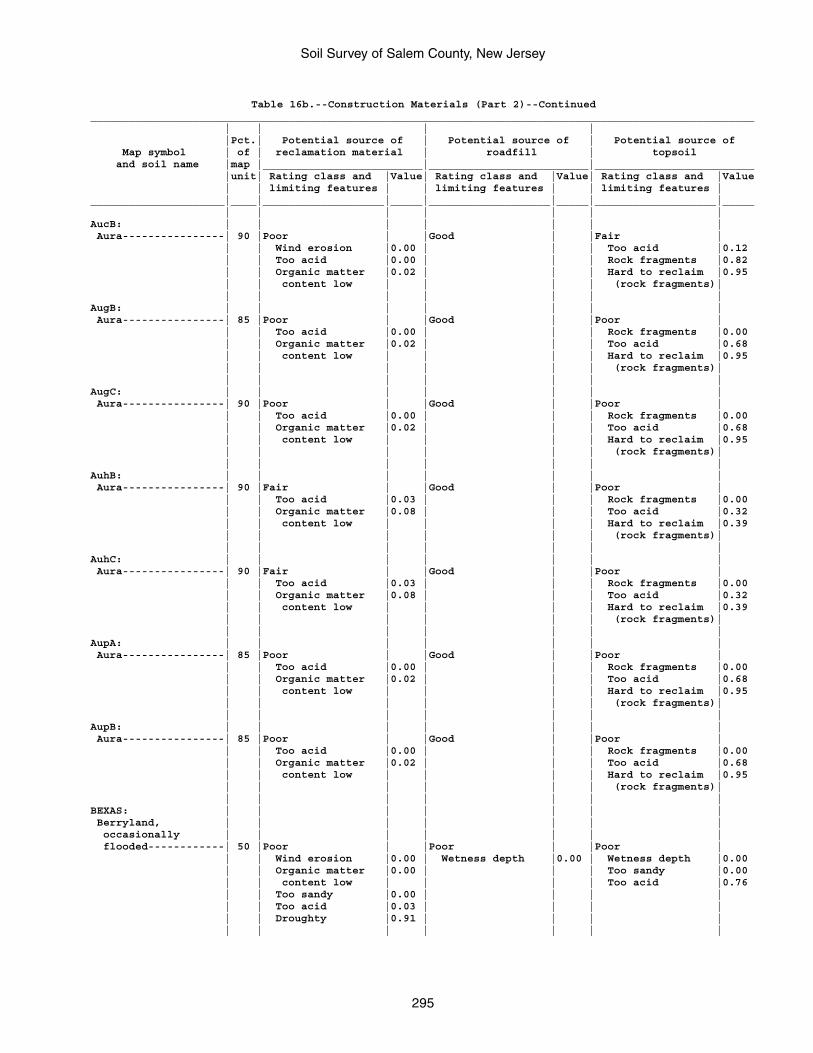
Soil Survey of Salem County, New Jersey
295
Table 16b.--Construction Materials (Part 2)--Continued________________________________________________________________________________________________________ | | | | |Pct.| Potential source of | Potential source of | Potential source of Map symbol | of | reclamation material | roadfill | topsoil and soil name |map |_________________________|_________________________|_________________________ |unit| Rating class and |Value| Rating class and |Value| Rating class and |Value | | limiting features | | limiting features | | limiting features |_____________________|____|___________________|_____|___________________|_____|___________________|_____ | | | | | | |AucB: | | | | | | | Aura----------------| 90 |Poor | |Good | |Fair | | | Wind erosion |0.00 | | | Too acid |0.12 | | Too acid |0.00 | | | Rock fragments |0.82 | | Organic matter |0.02 | | | Hard to reclaim |0.95 | | content low | | | | (rock fragments)| | | | | | | |AugB: | | | | | | | Aura----------------| 85 |Poor | |Good | |Poor | | | Too acid |0.00 | | | Rock fragments |0.00 | | Organic matter |0.02 | | | Too acid |0.68 | | content low | | | | Hard to reclaim |0.95 | | | | | | (rock fragments)| | | | | | | |AugC: | | | | | | | Aura----------------| 90 |Poor | |Good | |Poor | | | Too acid |0.00 | | | Rock fragments |0.00 | | Organic matter |0.02 | | | Too acid |0.68 | | content low | | | | Hard to reclaim |0.95 | | | | | | (rock fragments)| | | | | | | |AuhB: | | | | | | | Aura----------------| 90 |Fair | |Good | |Poor | | | Too acid |0.03 | | | Rock fragments |0.00 | | Organic matter |0.08 | | | Too acid |0.32 | | content low | | | | Hard to reclaim |0.39 | | | | | | (rock fragments)| | | | | | | |AuhC: | | | | | | | Aura----------------| 90 |Fair | |Good | |Poor | | | Too acid |0.03 | | | Rock fragments |0.00 | | Organic matter |0.08 | | | Too acid |0.32 | | content low | | | | Hard to reclaim |0.39 | | | | | | (rock fragments)| | | | | | | |AupA: | | | | | | | Aura----------------| 85 |Poor | |Good | |Poor | | | Too acid |0.00 | | | Rock fragments |0.00 | | Organic matter |0.02 | | | Too acid |0.68 | | content low | | | | Hard to reclaim |0.95 | | | | | | (rock fragments)| | | | | | | |AupB: | | | | | | | Aura----------------| 85 |Poor | |Good | |Poor | | | Too acid |0.00 | | | Rock fragments |0.00 | | Organic matter |0.02 | | | Too acid |0.68 | | content low | | | | Hard to reclaim |0.95 | | | | | | (rock fragments)| | | | | | | |BEXAS: | | | | | | | Berryland, | | | | | | | occasionally | | | | | | | flooded------------| 50 |Poor | |Poor | |Poor | | | Wind erosion |0.00 | Wetness depth |0.00 | Wetness depth |0.00 | | Organic matter |0.00 | | | Too sandy |0.00 | | content low | | | | Too acid |0.76 | | Too sandy |0.00 | | | | | | Too acid |0.03 | | | | | | Droughty |0.91 | | | | | | | | | | |
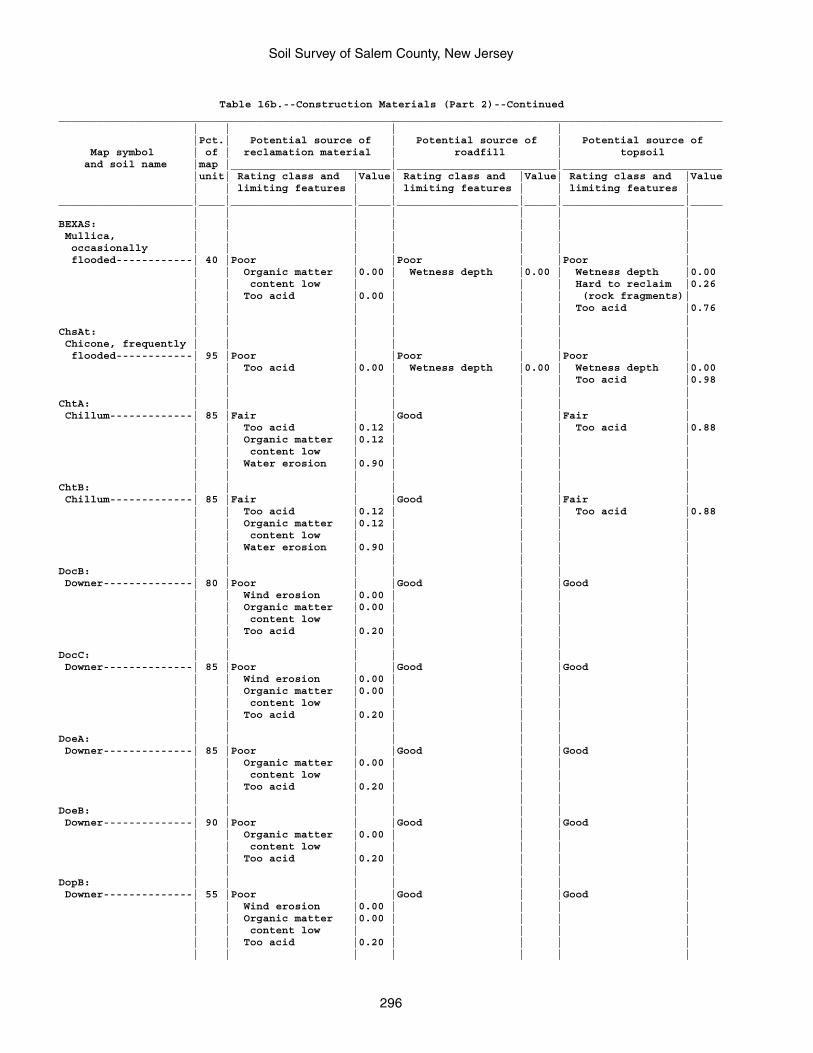
Soil Survey of Salem County, New Jersey
296
Table 16b.--Construction Materials (Part 2)--Continued________________________________________________________________________________________________________ | | | | |Pct.| Potential source of | Potential source of | Potential source of Map symbol | of | reclamation material | roadfill | topsoil and soil name |map |_________________________|_________________________|_________________________ |unit| Rating class and |Value| Rating class and |Value| Rating class and |Value | | limiting features | | limiting features | | limiting features |_____________________|____|___________________|_____|___________________|_____|___________________|_____ | | | | | | |BEXAS: | | | | | | | Mullica, | | | | | | | occasionally | | | | | | | flooded------------| 40 |Poor | |Poor | |Poor | | | Organic matter |0.00 | Wetness depth |0.00 | Wetness depth |0.00 | | content low | | | | Hard to reclaim |0.26 | | Too acid |0.00 | | | (rock fragments)| | | | | | | Too acid |0.76 | | | | | | |ChsAt: | | | | | | | Chicone, frequently | | | | | | | flooded------------| 95 |Poor | |Poor | |Poor | | | Too acid |0.00 | Wetness depth |0.00 | Wetness depth |0.00 | | | | | | Too acid |0.98 | | | | | | |ChtA: | | | | | | | Chillum-------------| 85 |Fair | |Good | |Fair | | | Too acid |0.12 | | | Too acid |0.88 | | Organic matter |0.12 | | | | | | content low | | | | | | | Water erosion |0.90 | | | | | | | | | | |ChtB: | | | | | | | Chillum-------------| 85 |Fair | |Good | |Fair | | | Too acid |0.12 | | | Too acid |0.88 | | Organic matter |0.12 | | | | | | content low | | | | | | | Water erosion |0.90 | | | | | | | | | | |DocB: | | | | | | | Downer--------------| 80 |Poor | |Good | |Good | | | Wind erosion |0.00 | | | | | | Organic matter |0.00 | | | | | | content low | | | | | | | Too acid |0.20 | | | | | | | | | | |DocC: | | | | | | | Downer--------------| 85 |Poor | |Good | |Good | | | Wind erosion |0.00 | | | | | | Organic matter |0.00 | | | | | | content low | | | | | | | Too acid |0.20 | | | | | | | | | | |DoeA: | | | | | | | Downer--------------| 85 |Poor | |Good | |Good | | | Organic matter |0.00 | | | | | | content low | | | | | | | Too acid |0.20 | | | | | | | | | | |DoeB: | | | | | | | Downer--------------| 90 |Poor | |Good | |Good | | | Organic matter |0.00 | | | | | | content low | | | | | | | Too acid |0.20 | | | | | | | | | | |DopB: | | | | | | | Downer--------------| 55 |Poor | |Good | |Good | | | Wind erosion |0.00 | | | | | | Organic matter |0.00 | | | | | | content low | | | | | | | Too acid |0.20 | | | | | | | | | | |
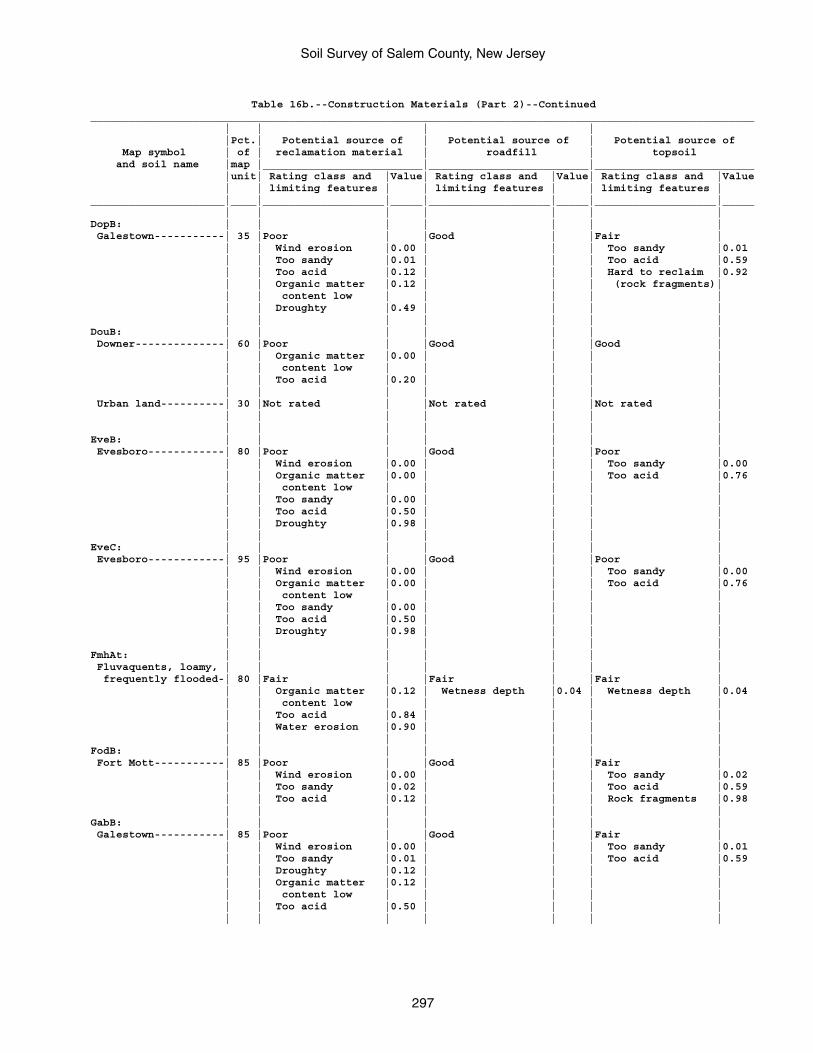
Soil Survey of Salem County, New Jersey
297
Table 16b.--Construction Materials (Part 2)--Continued________________________________________________________________________________________________________ | | | | |Pct.| Potential source of | Potential source of | Potential source of Map symbol | of | reclamation material | roadfill | topsoil and soil name |map |_________________________|_________________________|_________________________ |unit| Rating class and |Value| Rating class and |Value| Rating class and |Value | | limiting features | | limiting features | | limiting features |_____________________|____|___________________|_____|___________________|_____|___________________|_____ | | | | | | |DopB: | | | | | | | Galestown-----------| 35 |Poor | |Good | |Fair | | | Wind erosion |0.00 | | | Too sandy |0.01 | | Too sandy |0.01 | | | Too acid |0.59 | | Too acid |0.12 | | | Hard to reclaim |0.92 | | Organic matter |0.12 | | | (rock fragments)| | | content low | | | | | | | Droughty |0.49 | | | | | | | | | | |DouB: | | | | | | | Downer--------------| 60 |Poor | |Good | |Good | | | Organic matter |0.00 | | | | | | content low | | | | | | | Too acid |0.20 | | | | | | | | | | | Urban land----------| 30 |Not rated | |Not rated | |Not rated | | | | | | | | | | | | | | |EveB: | | | | | | | Evesboro------------| 80 |Poor | |Good | |Poor | | | Wind erosion |0.00 | | | Too sandy |0.00 | | Organic matter |0.00 | | | Too acid |0.76 | | content low | | | | | | | Too sandy |0.00 | | | | | | Too acid |0.50 | | | | | | Droughty |0.98 | | | | | | | | | | |EveC: | | | | | | | Evesboro------------| 95 |Poor | |Good | |Poor | | | Wind erosion |0.00 | | | Too sandy |0.00 | | Organic matter |0.00 | | | Too acid |0.76 | | content low | | | | | | | Too sandy |0.00 | | | | | | Too acid |0.50 | | | | | | Droughty |0.98 | | | | | | | | | | |FmhAt: | | | | | | | Fluvaquents, loamy, | | | | | | | frequently flooded-| 80 |Fair | |Fair | |Fair | | | Organic matter |0.12 | Wetness depth |0.04 | Wetness depth |0.04 | | content low | | | | | | | Too acid |0.84 | | | | | | Water erosion |0.90 | | | | | | | | | | |FodB: | | | | | | | Fort Mott-----------| 85 |Poor | |Good | |Fair | | | Wind erosion |0.00 | | | Too sandy |0.02 | | Too sandy |0.02 | | | Too acid |0.59 | | Too acid |0.12 | | | Rock fragments |0.98 | | | | | | |GabB: | | | | | | | Galestown-----------| 85 |Poor | |Good | |Fair | | | Wind erosion |0.00 | | | Too sandy |0.01 | | Too sandy |0.01 | | | Too acid |0.59 | | Droughty |0.12 | | | | | | Organic matter |0.12 | | | | | | content low | | | | | | | Too acid |0.50 | | | | | | | | | | |
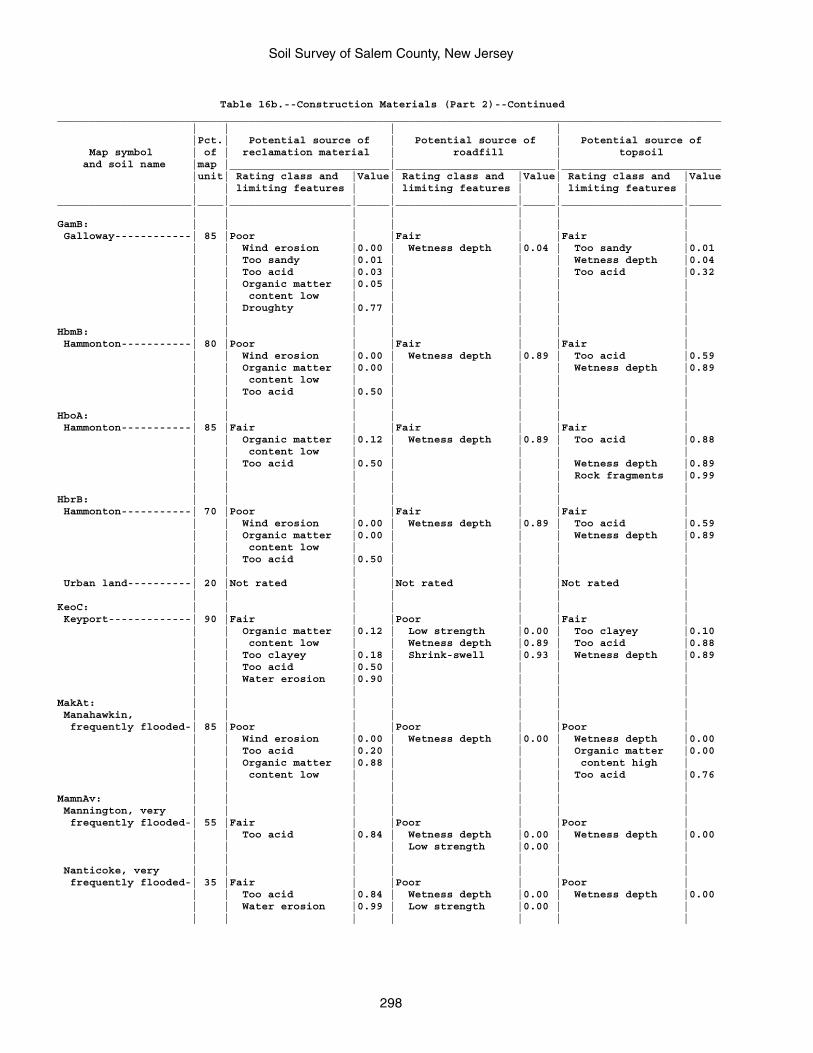
Soil Survey of Salem County, New Jersey
298
Table 16b.--Construction Materials (Part 2)--Continued________________________________________________________________________________________________________ | | | | |Pct.| Potential source of | Potential source of | Potential source of Map symbol | of | reclamation material | roadfill | topsoil and soil name |map |_________________________|_________________________|_________________________ |unit| Rating class and |Value| Rating class and |Value| Rating class and |Value | | limiting features | | limiting features | | limiting features |_____________________|____|___________________|_____|___________________|_____|___________________|_____ | | | | | | |GamB: | | | | | | | Galloway------------| 85 |Poor | |Fair | |Fair | | | Wind erosion |0.00 | Wetness depth |0.04 | Too sandy |0.01 | | Too sandy |0.01 | | | Wetness depth |0.04 | | Too acid |0.03 | | | Too acid |0.32 | | Organic matter |0.05 | | | | | | content low | | | | | | | Droughty |0.77 | | | | | | | | | | |HbmB: | | | | | | | Hammonton-----------| 80 |Poor | |Fair | |Fair | | | Wind erosion |0.00 | Wetness depth |0.89 | Too acid |0.59 | | Organic matter |0.00 | | | Wetness depth |0.89 | | content low | | | | | | | Too acid |0.50 | | | | | | | | | | |HboA: | | | | | | | Hammonton-----------| 85 |Fair | |Fair | |Fair | | | Organic matter |0.12 | Wetness depth |0.89 | Too acid |0.88 | | content low | | | | | | | Too acid |0.50 | | | Wetness depth |0.89 | | | | | | Rock fragments |0.99 | | | | | | |HbrB: | | | | | | | Hammonton-----------| 70 |Poor | |Fair | |Fair | | | Wind erosion |0.00 | Wetness depth |0.89 | Too acid |0.59 | | Organic matter |0.00 | | | Wetness depth |0.89 | | content low | | | | | | | Too acid |0.50 | | | | | | | | | | | Urban land----------| 20 |Not rated | |Not rated | |Not rated | | | | | | | |KeoC: | | | | | | | Keyport-------------| 90 |Fair | |Poor | |Fair | | | Organic matter |0.12 | Low strength |0.00 | Too clayey |0.10 | | content low | | Wetness depth |0.89 | Too acid |0.88 | | Too clayey |0.18 | Shrink-swell |0.93 | Wetness depth |0.89 | | Too acid |0.50 | | | | | | Water erosion |0.90 | | | | | | | | | | |MakAt: | | | | | | | Manahawkin, | | | | | | | frequently flooded-| 85 |Poor | |Poor | |Poor | | | Wind erosion |0.00 | Wetness depth |0.00 | Wetness depth |0.00 | | Too acid |0.20 | | | Organic matter |0.00 | | Organic matter |0.88 | | | content high | | | content low | | | | Too acid |0.76 | | | | | | |MamnAv: | | | | | | | Mannington, very | | | | | | | frequently flooded-| 55 |Fair | |Poor | |Poor | | | Too acid |0.84 | Wetness depth |0.00 | Wetness depth |0.00 | | | | Low strength |0.00 | | | | | | | | | Nanticoke, very | | | | | | | frequently flooded-| 35 |Fair | |Poor | |Poor | | | Too acid |0.84 | Wetness depth |0.00 | Wetness depth |0.00 | | Water erosion |0.99 | Low strength |0.00 | | | | | | | | |
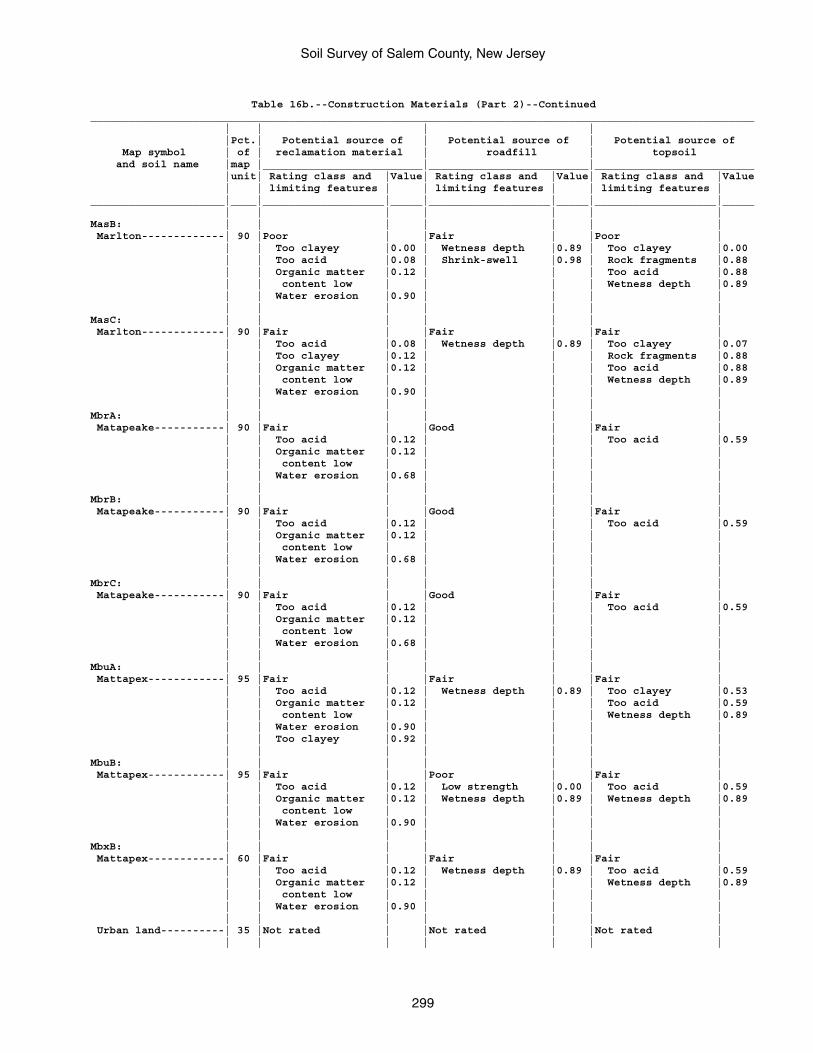
Soil Survey of Salem County, New Jersey
299
Table 16b.--Construction Materials (Part 2)--Continued________________________________________________________________________________________________________ | | | | |Pct.| Potential source of | Potential source of | Potential source of Map symbol | of | reclamation material | roadfill | topsoil and soil name |map |_________________________|_________________________|_________________________ |unit| Rating class and |Value| Rating class and |Value| Rating class and |Value | | limiting features | | limiting features | | limiting features |_____________________|____|___________________|_____|___________________|_____|___________________|_____ | | | | | | |MasB: | | | | | | | Marlton-------------| 90 |Poor | |Fair | |Poor | | | Too clayey |0.00 | Wetness depth |0.89 | Too clayey |0.00 | | Too acid |0.08 | Shrink-swell |0.98 | Rock fragments |0.88 | | Organic matter |0.12 | | | Too acid |0.88 | | content low | | | | Wetness depth |0.89 | | Water erosion |0.90 | | | | | | | | | | |MasC: | | | | | | | Marlton-------------| 90 |Fair | |Fair | |Fair | | | Too acid |0.08 | Wetness depth |0.89 | Too clayey |0.07 | | Too clayey |0.12 | | | Rock fragments |0.88 | | Organic matter |0.12 | | | Too acid |0.88 | | content low | | | | Wetness depth |0.89 | | Water erosion |0.90 | | | | | | | | | | |MbrA: | | | | | | | Matapeake-----------| 90 |Fair | |Good | |Fair | | | Too acid |0.12 | | | Too acid |0.59 | | Organic matter |0.12 | | | | | | content low | | | | | | | Water erosion |0.68 | | | | | | | | | | |MbrB: | | | | | | | Matapeake-----------| 90 |Fair | |Good | |Fair | | | Too acid |0.12 | | | Too acid |0.59 | | Organic matter |0.12 | | | | | | content low | | | | | | | Water erosion |0.68 | | | | | | | | | | |MbrC: | | | | | | | Matapeake-----------| 90 |Fair | |Good | |Fair | | | Too acid |0.12 | | | Too acid |0.59 | | Organic matter |0.12 | | | | | | content low | | | | | | | Water erosion |0.68 | | | | | | | | | | |MbuA: | | | | | | | Mattapex------------| 95 |Fair | |Fair | |Fair | | | Too acid |0.12 | Wetness depth |0.89 | Too clayey |0.53 | | Organic matter |0.12 | | | Too acid |0.59 | | content low | | | | Wetness depth |0.89 | | Water erosion |0.90 | | | | | | Too clayey |0.92 | | | | | | | | | | |MbuB: | | | | | | | Mattapex------------| 95 |Fair | |Poor | |Fair | | | Too acid |0.12 | Low strength |0.00 | Too acid |0.59 | | Organic matter |0.12 | Wetness depth |0.89 | Wetness depth |0.89 | | content low | | | | | | | Water erosion |0.90 | | | | | | | | | | |MbxB: | | | | | | | Mattapex------------| 60 |Fair | |Fair | |Fair | | | Too acid |0.12 | Wetness depth |0.89 | Too acid |0.59 | | Organic matter |0.12 | | | Wetness depth |0.89 | | content low | | | | | | | Water erosion |0.90 | | | | | | | | | | | Urban land----------| 35 |Not rated | |Not rated | |Not rated | | | | | | | |
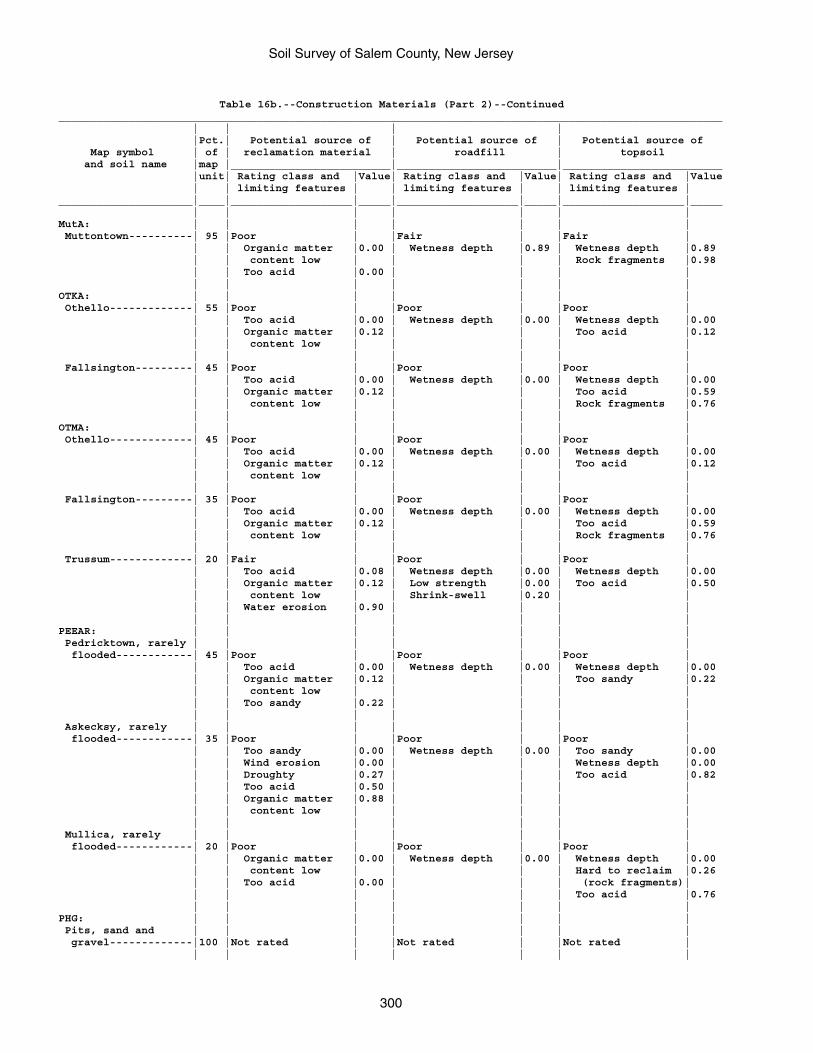
Soil Survey of Salem County, New Jersey
300
Table 16b.--Construction Materials (Part 2)--Continued________________________________________________________________________________________________________ | | | | |Pct.| Potential source of | Potential source of | Potential source of Map symbol | of | reclamation material | roadfill | topsoil and soil name |map |_________________________|_________________________|_________________________ |unit| Rating class and |Value| Rating class and |Value| Rating class and |Value | | limiting features | | limiting features | | limiting features |_____________________|____|___________________|_____|___________________|_____|___________________|_____ | | | | | | |MutA: | | | | | | | Muttontown----------| 95 |Poor | |Fair | |Fair | | | Organic matter |0.00 | Wetness depth |0.89 | Wetness depth |0.89 | | content low | | | | Rock fragments |0.98 | | Too acid |0.00 | | | | | | | | | | |OTKA: | | | | | | | Othello-------------| 55 |Poor | |Poor | |Poor | | | Too acid |0.00 | Wetness depth |0.00 | Wetness depth |0.00 | | Organic matter |0.12 | | | Too acid |0.12 | | content low | | | | | | | | | | | | Fallsington---------| 45 |Poor | |Poor | |Poor | | | Too acid |0.00 | Wetness depth |0.00 | Wetness depth |0.00 | | Organic matter |0.12 | | | Too acid |0.59 | | content low | | | | Rock fragments |0.76 | | | | | | |OTMA: | | | | | | | Othello-------------| 45 |Poor | |Poor | |Poor | | | Too acid |0.00 | Wetness depth |0.00 | Wetness depth |0.00 | | Organic matter |0.12 | | | Too acid |0.12 | | content low | | | | | | | | | | | | Fallsington---------| 35 |Poor | |Poor | |Poor | | | Too acid |0.00 | Wetness depth |0.00 | Wetness depth |0.00 | | Organic matter |0.12 | | | Too acid |0.59 | | content low | | | | Rock fragments |0.76 | | | | | | | Trussum-------------| 20 |Fair | |Poor | |Poor | | | Too acid |0.08 | Wetness depth |0.00 | Wetness depth |0.00 | | Organic matter |0.12 | Low strength |0.00 | Too acid |0.50 | | content low | | Shrink-swell |0.20 | | | | Water erosion |0.90 | | | | | | | | | | |PEEAR: | | | | | | | Pedricktown, rarely | | | | | | | flooded------------| 45 |Poor | |Poor | |Poor | | | Too acid |0.00 | Wetness depth |0.00 | Wetness depth |0.00 | | Organic matter |0.12 | | | Too sandy |0.22 | | content low | | | | | | | Too sandy |0.22 | | | | | | | | | | | Askecksy, rarely | | | | | | | flooded------------| 35 |Poor | |Poor | |Poor | | | Too sandy |0.00 | Wetness depth |0.00 | Too sandy |0.00 | | Wind erosion |0.00 | | | Wetness depth |0.00 | | Droughty |0.27 | | | Too acid |0.82 | | Too acid |0.50 | | | | | | Organic matter |0.88 | | | | | | content low | | | | | | | | | | | | Mullica, rarely | | | | | | | flooded------------| 20 |Poor | |Poor | |Poor | | | Organic matter |0.00 | Wetness depth |0.00 | Wetness depth |0.00 | | content low | | | | Hard to reclaim |0.26 | | Too acid |0.00 | | | (rock fragments)| | | | | | | Too acid |0.76 | | | | | | |PHG: | | | | | | | Pits, sand and | | | | | | | gravel-------------|100 |Not rated | |Not rated | |Not rated | | | | | | | |
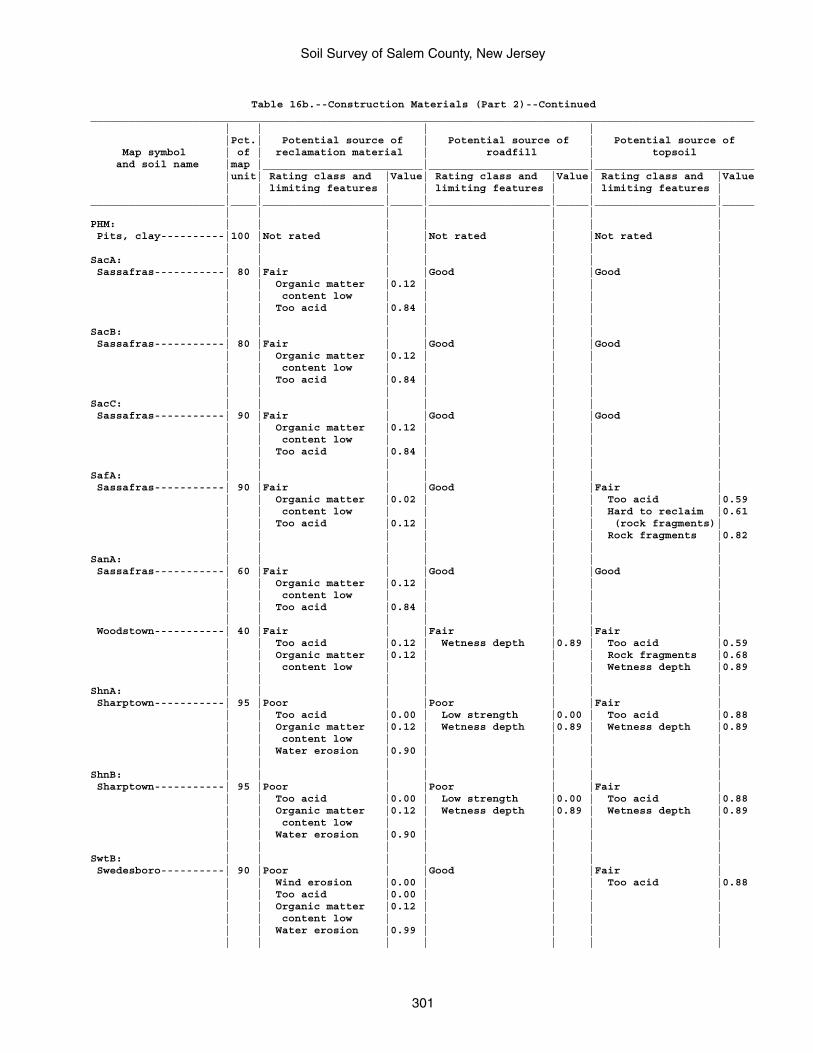
Soil Survey of Salem County, New Jersey
301
Table 16b.--Construction Materials (Part 2)--Continued________________________________________________________________________________________________________ | | | | |Pct.| Potential source of | Potential source of | Potential source of Map symbol | of | reclamation material | roadfill | topsoil and soil name |map |_________________________|_________________________|_________________________ |unit| Rating class and |Value| Rating class and |Value| Rating class and |Value | | limiting features | | limiting features | | limiting features |_____________________|____|___________________|_____|___________________|_____|___________________|_____ | | | | | | |PHM: | | | | | | | Pits, clay----------|100 |Not rated | |Not rated | |Not rated | | | | | | | |SacA: | | | | | | | Sassafras-----------| 80 |Fair | |Good | |Good | | | Organic matter |0.12 | | | | | | content low | | | | | | | Too acid |0.84 | | | | | | | | | | |SacB: | | | | | | | Sassafras-----------| 80 |Fair | |Good | |Good | | | Organic matter |0.12 | | | | | | content low | | | | | | | Too acid |0.84 | | | | | | | | | | |SacC: | | | | | | | Sassafras-----------| 90 |Fair | |Good | |Good | | | Organic matter |0.12 | | | | | | content low | | | | | | | Too acid |0.84 | | | | | | | | | | |SafA: | | | | | | | Sassafras-----------| 90 |Fair | |Good | |Fair | | | Organic matter |0.02 | | | Too acid |0.59 | | content low | | | | Hard to reclaim |0.61 | | Too acid |0.12 | | | (rock fragments)| | | | | | | Rock fragments |0.82 | | | | | | |SanA: | | | | | | | Sassafras-----------| 60 |Fair | |Good | |Good | | | Organic matter |0.12 | | | | | | content low | | | | | | | Too acid |0.84 | | | | | | | | | | | Woodstown-----------| 40 |Fair | |Fair | |Fair | | | Too acid |0.12 | Wetness depth |0.89 | Too acid |0.59 | | Organic matter |0.12 | | | Rock fragments |0.68 | | content low | | | | Wetness depth |0.89 | | | | | | |ShnA: | | | | | | | Sharptown-----------| 95 |Poor | |Poor | |Fair | | | Too acid |0.00 | Low strength |0.00 | Too acid |0.88 | | Organic matter |0.12 | Wetness depth |0.89 | Wetness depth |0.89 | | content low | | | | | | | Water erosion |0.90 | | | | | | | | | | |ShnB: | | | | | | | Sharptown-----------| 95 |Poor | |Poor | |Fair | | | Too acid |0.00 | Low strength |0.00 | Too acid |0.88 | | Organic matter |0.12 | Wetness depth |0.89 | Wetness depth |0.89 | | content low | | | | | | | Water erosion |0.90 | | | | | | | | | | |SwtB: | | | | | | | Swedesboro----------| 90 |Poor | |Good | |Fair | | | Wind erosion |0.00 | | | Too acid |0.88 | | Too acid |0.00 | | | | | | Organic matter |0.12 | | | | | | content low | | | | | | | Water erosion |0.99 | | | | | | | | | | |
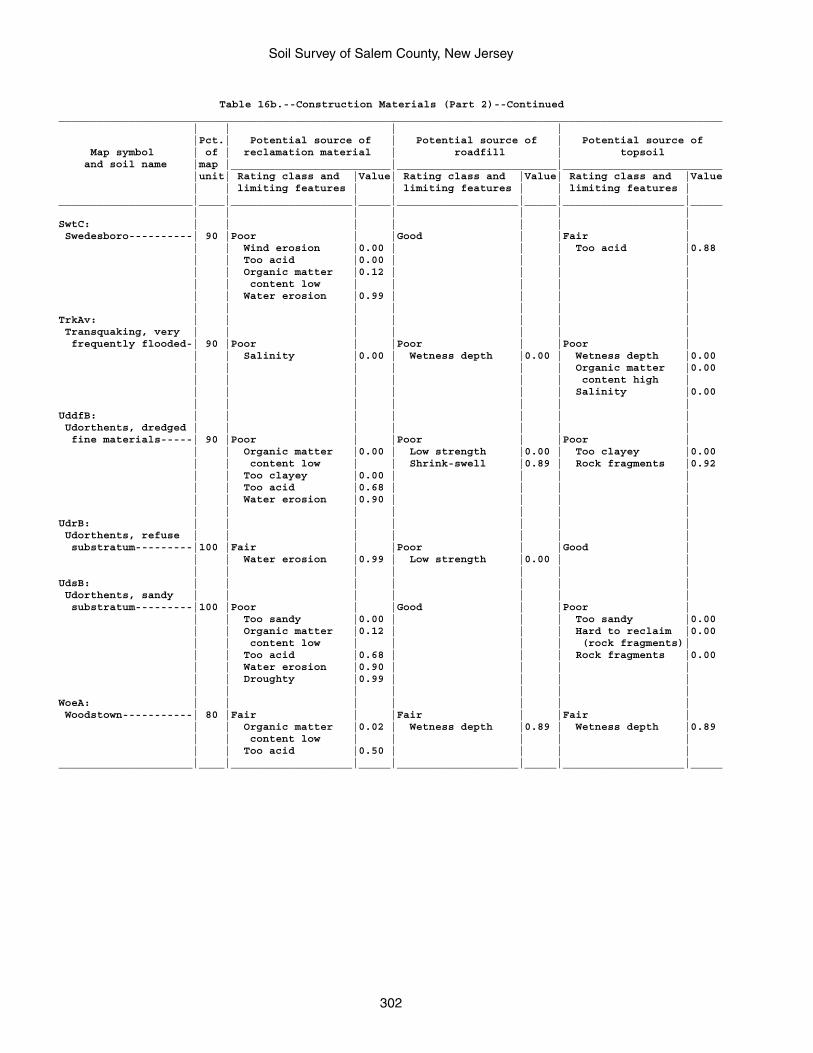
Soil Survey of Salem County, New Jersey
302
Table 16b.--Construction Materials (Part 2)--Continued________________________________________________________________________________________________________ | | | | |Pct.| Potential source of | Potential source of | Potential source of Map symbol | of | reclamation material | roadfill | topsoil and soil name |map |_________________________|_________________________|_________________________ |unit| Rating class and |Value| Rating class and |Value| Rating class and |Value | | limiting features | | limiting features | | limiting features |_____________________|____|___________________|_____|___________________|_____|___________________|_____ | | | | | | |SwtC: | | | | | | | Swedesboro----------| 90 |Poor | |Good | |Fair | | | Wind erosion |0.00 | | | Too acid |0.88 | | Too acid |0.00 | | | | | | Organic matter |0.12 | | | | | | content low | | | | | | | Water erosion |0.99 | | | | | | | | | | |TrkAv: | | | | | | | Transquaking, very | | | | | | | frequently flooded-| 90 |Poor | |Poor | |Poor | | | Salinity |0.00 | Wetness depth |0.00 | Wetness depth |0.00 | | | | | | Organic matter |0.00 | | | | | | content high | | | | | | | Salinity |0.00 | | | | | | |UddfB: | | | | | | | Udorthents, dredged | | | | | | | fine materials-----| 90 |Poor | |Poor | |Poor | | | Organic matter |0.00 | Low strength |0.00 | Too clayey |0.00 | | content low | | Shrink-swell |0.89 | Rock fragments |0.92 | | Too clayey |0.00 | | | | | | Too acid |0.68 | | | | | | Water erosion |0.90 | | | | | | | | | | |UdrB: | | | | | | | Udorthents, refuse | | | | | | | substratum---------|100 |Fair | |Poor | |Good | | | Water erosion |0.99 | Low strength |0.00 | | | | | | | | |UdsB: | | | | | | | Udorthents, sandy | | | | | | | substratum---------|100 |Poor | |Good | |Poor | | | Too sandy |0.00 | | | Too sandy |0.00 | | Organic matter |0.12 | | | Hard to reclaim |0.00 | | content low | | | | (rock fragments)| | | Too acid |0.68 | | | Rock fragments |0.00 | | Water erosion |0.90 | | | | | | Droughty |0.99 | | | | | | | | | | |WoeA: | | | | | | | Woodstown-----------| 80 |Fair | |Fair | |Fair | | | Organic matter |0.02 | Wetness depth |0.89 | Wetness depth |0.89 | | content low | | | | | | | Too acid |0.50 | | | |_____________________|____|___________________|_____|___________________|_____|___________________|_____
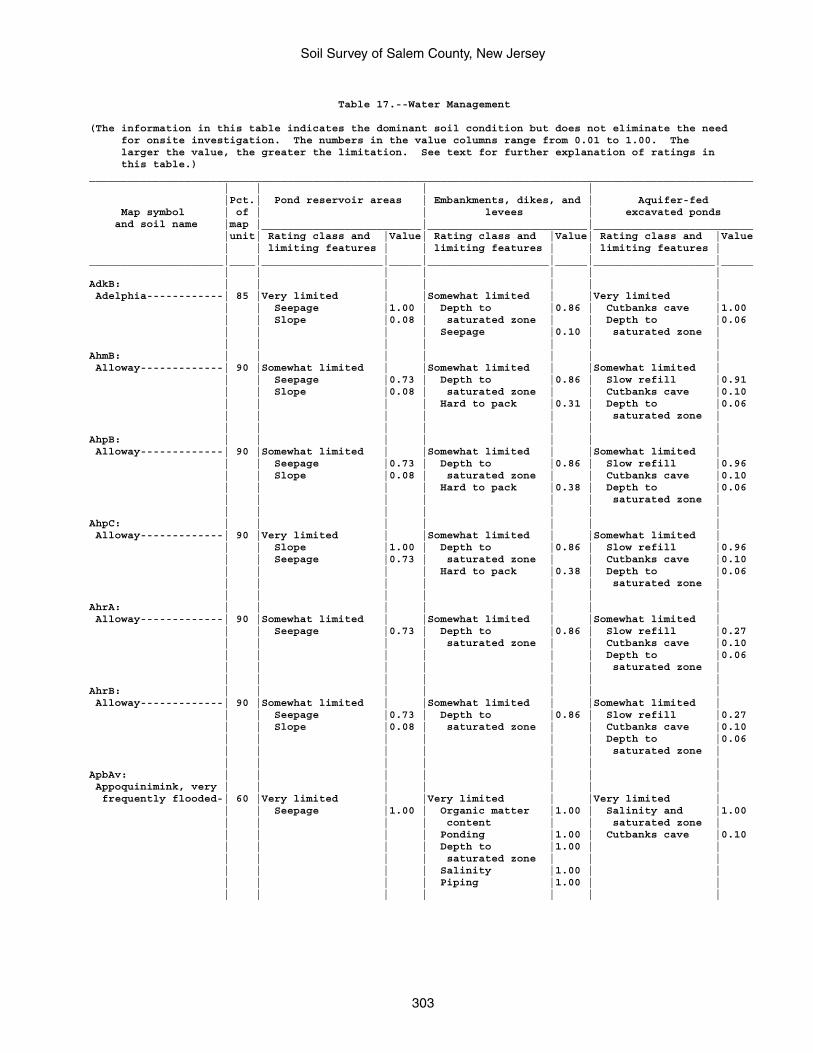
Soil Survey of Salem County, New Jersey
303
Table 17.--Water Management
(The information in this table indicates the dominant soil condition but does not eliminate the need for onsite investigation. The numbers in the value columns range from 0.01 to 1.00. The larger the value, the greater the limitation. See text for further explanation of ratings in this table.)________________________________________________________________________________________________________ | | | | |Pct.| Pond reservoir areas | Embankments, dikes, and | Aquifer-fed Map symbol | of | | levees | excavated ponds and soil name |map |_________________________|_________________________|_________________________ |unit| Rating class and |Value| Rating class and |Value| Rating class and |Value | | limiting features | | limiting features | | limiting features |_____________________|____|___________________|_____|___________________|_____|___________________|_____ | | | | | | |AdkB: | | | | | | | Adelphia------------| 85 |Very limited | |Somewhat limited | |Very limited | | | Seepage |1.00 | Depth to |0.86 | Cutbanks cave |1.00 | | Slope |0.08 | saturated zone | | Depth to |0.06 | | | | Seepage |0.10 | saturated zone | | | | | | | |AhmB: | | | | | | | Alloway-------------| 90 |Somewhat limited | |Somewhat limited | |Somewhat limited | | | Seepage |0.73 | Depth to |0.86 | Slow refill |0.91 | | Slope |0.08 | saturated zone | | Cutbanks cave |0.10 | | | | Hard to pack |0.31 | Depth to |0.06 | | | | | | saturated zone | | | | | | | |AhpB: | | | | | | | Alloway-------------| 90 |Somewhat limited | |Somewhat limited | |Somewhat limited | | | Seepage |0.73 | Depth to |0.86 | Slow refill |0.96 | | Slope |0.08 | saturated zone | | Cutbanks cave |0.10 | | | | Hard to pack |0.38 | Depth to |0.06 | | | | | | saturated zone | | | | | | | |AhpC: | | | | | | | Alloway-------------| 90 |Very limited | |Somewhat limited | |Somewhat limited | | | Slope |1.00 | Depth to |0.86 | Slow refill |0.96 | | Seepage |0.73 | saturated zone | | Cutbanks cave |0.10 | | | | Hard to pack |0.38 | Depth to |0.06 | | | | | | saturated zone | | | | | | | |AhrA: | | | | | | | Alloway-------------| 90 |Somewhat limited | |Somewhat limited | |Somewhat limited | | | Seepage |0.73 | Depth to |0.86 | Slow refill |0.27 | | | | saturated zone | | Cutbanks cave |0.10 | | | | | | Depth to |0.06 | | | | | | saturated zone | | | | | | | |AhrB: | | | | | | | Alloway-------------| 90 |Somewhat limited | |Somewhat limited | |Somewhat limited | | | Seepage |0.73 | Depth to |0.86 | Slow refill |0.27 | | Slope |0.08 | saturated zone | | Cutbanks cave |0.10 | | | | | | Depth to |0.06 | | | | | | saturated zone | | | | | | | |ApbAv: | | | | | | | Appoquinimink, very | | | | | | | frequently flooded-| 60 |Very limited | |Very limited | |Very limited | | | Seepage |1.00 | Organic matter |1.00 | Salinity and |1.00 | | | | content | | saturated zone | | | | | Ponding |1.00 | Cutbanks cave |0.10 | | | | Depth to |1.00 | | | | | | saturated zone | | | | | | | Salinity |1.00 | | | | | | Piping |1.00 | | | | | | | | |
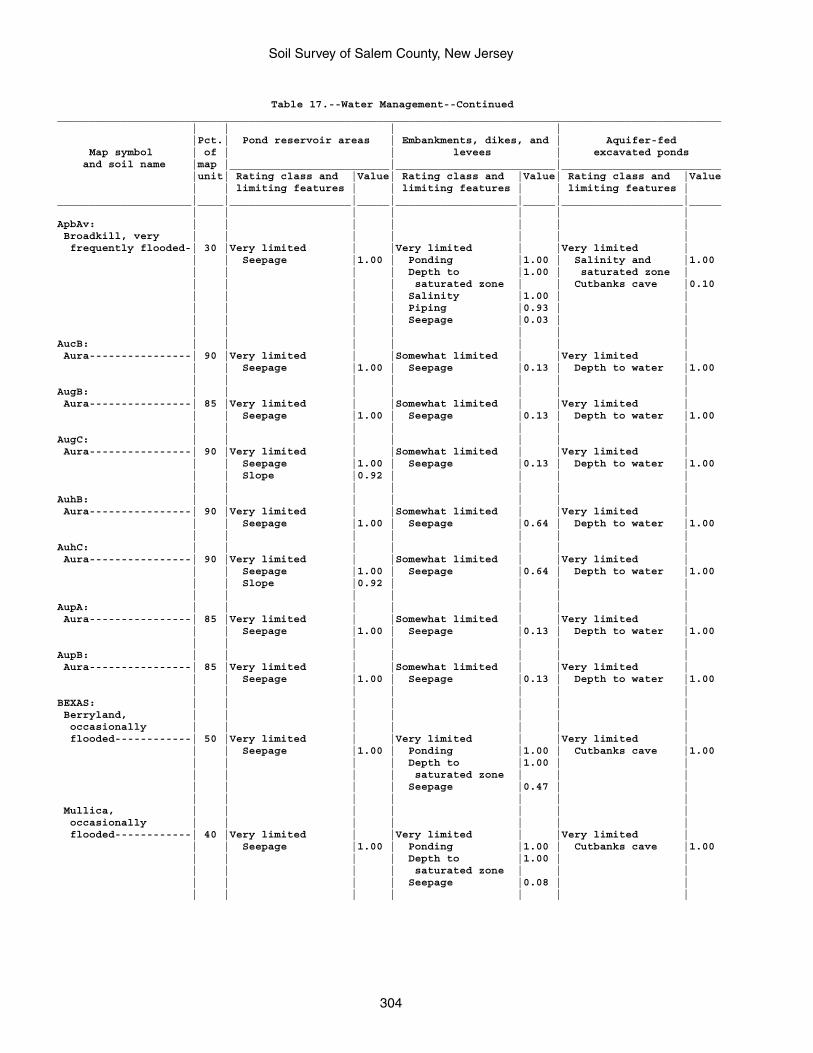
Soil Survey of Salem County, New Jersey
304
Table 17.--Water Management--Continued________________________________________________________________________________________________________ | | | | |Pct.| Pond reservoir areas | Embankments, dikes, and | Aquifer-fed Map symbol | of | | levees | excavated ponds and soil name |map |_________________________|_________________________|_________________________ |unit| Rating class and |Value| Rating class and |Value| Rating class and |Value | | limiting features | | limiting features | | limiting features |_____________________|____|___________________|_____|___________________|_____|___________________|_____ | | | | | | |ApbAv: | | | | | | | Broadkill, very | | | | | | | frequently flooded-| 30 |Very limited | |Very limited | |Very limited | | | Seepage |1.00 | Ponding |1.00 | Salinity and |1.00 | | | | Depth to |1.00 | saturated zone | | | | | saturated zone | | Cutbanks cave |0.10 | | | | Salinity |1.00 | | | | | | Piping |0.93 | | | | | | Seepage |0.03 | | | | | | | | |AucB: | | | | | | | Aura----------------| 90 |Very limited | |Somewhat limited | |Very limited | | | Seepage |1.00 | Seepage |0.13 | Depth to water |1.00 | | | | | | |AugB: | | | | | | | Aura----------------| 85 |Very limited | |Somewhat limited | |Very limited | | | Seepage |1.00 | Seepage |0.13 | Depth to water |1.00 | | | | | | |AugC: | | | | | | | Aura----------------| 90 |Very limited | |Somewhat limited | |Very limited | | | Seepage |1.00 | Seepage |0.13 | Depth to water |1.00 | | Slope |0.92 | | | | | | | | | | |AuhB: | | | | | | | Aura----------------| 90 |Very limited | |Somewhat limited | |Very limited | | | Seepage |1.00 | Seepage |0.64 | Depth to water |1.00 | | | | | | |AuhC: | | | | | | | Aura----------------| 90 |Very limited | |Somewhat limited | |Very limited | | | Seepage |1.00 | Seepage |0.64 | Depth to water |1.00 | | Slope |0.92 | | | | | | | | | | |AupA: | | | | | | | Aura----------------| 85 |Very limited | |Somewhat limited | |Very limited | | | Seepage |1.00 | Seepage |0.13 | Depth to water |1.00 | | | | | | |AupB: | | | | | | | Aura----------------| 85 |Very limited | |Somewhat limited | |Very limited | | | Seepage |1.00 | Seepage |0.13 | Depth to water |1.00 | | | | | | |BEXAS: | | | | | | | Berryland, | | | | | | | occasionally | | | | | | | flooded------------| 50 |Very limited | |Very limited | |Very limited | | | Seepage |1.00 | Ponding |1.00 | Cutbanks cave |1.00 | | | | Depth to |1.00 | | | | | | saturated zone | | | | | | | Seepage |0.47 | | | | | | | | | Mullica, | | | | | | | occasionally | | | | | | | flooded------------| 40 |Very limited | |Very limited | |Very limited | | | Seepage |1.00 | Ponding |1.00 | Cutbanks cave |1.00 | | | | Depth to |1.00 | | | | | | saturated zone | | | | | | | Seepage |0.08 | | | | | | | | |
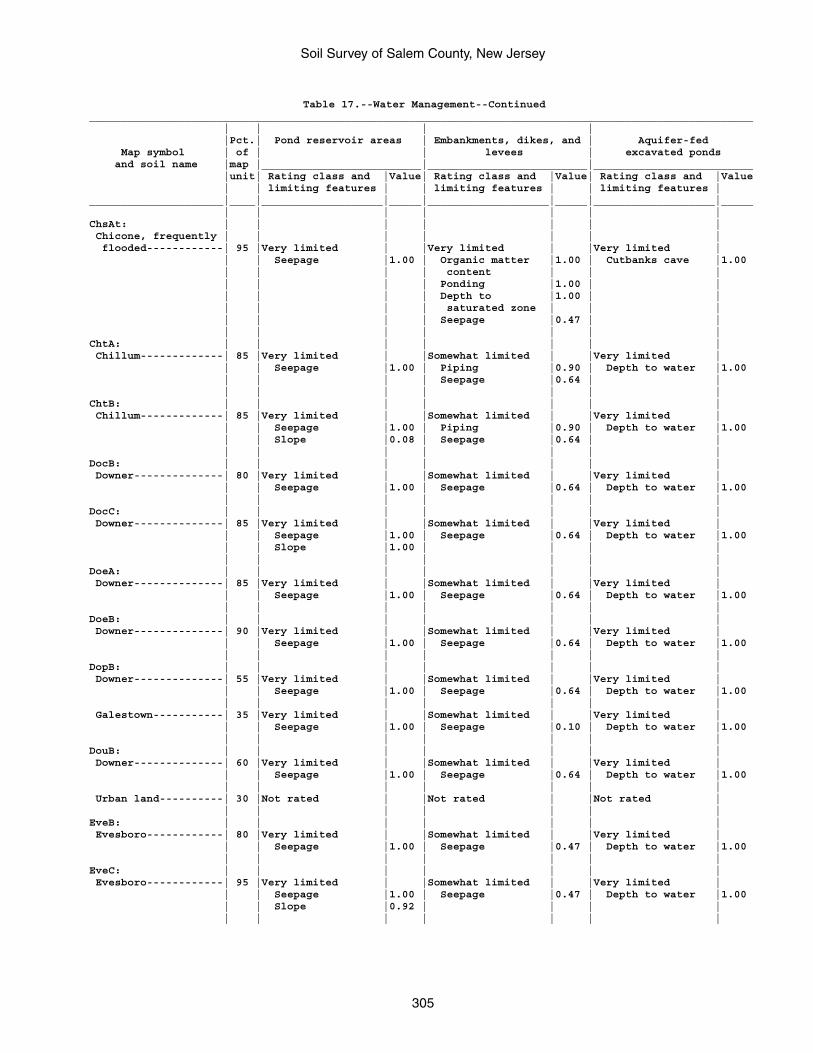
Soil Survey of Salem County, New Jersey
305
Table 17.--Water Management--Continued________________________________________________________________________________________________________ | | | | |Pct.| Pond reservoir areas | Embankments, dikes, and | Aquifer-fed Map symbol | of | | levees | excavated ponds and soil name |map |_________________________|_________________________|_________________________ |unit| Rating class and |Value| Rating class and |Value| Rating class and |Value | | limiting features | | limiting features | | limiting features |_____________________|____|___________________|_____|___________________|_____|___________________|_____ | | | | | | |ChsAt: | | | | | | | Chicone, frequently | | | | | | | flooded------------| 95 |Very limited | |Very limited | |Very limited | | | Seepage |1.00 | Organic matter |1.00 | Cutbanks cave |1.00 | | | | content | | | | | | | Ponding |1.00 | | | | | | Depth to |1.00 | | | | | | saturated zone | | | | | | | Seepage |0.47 | | | | | | | | |ChtA: | | | | | | | Chillum-------------| 85 |Very limited | |Somewhat limited | |Very limited | | | Seepage |1.00 | Piping |0.90 | Depth to water |1.00 | | | | Seepage |0.64 | | | | | | | | |ChtB: | | | | | | | Chillum-------------| 85 |Very limited | |Somewhat limited | |Very limited | | | Seepage |1.00 | Piping |0.90 | Depth to water |1.00 | | Slope |0.08 | Seepage |0.64 | | | | | | | | |DocB: | | | | | | | Downer--------------| 80 |Very limited | |Somewhat limited | |Very limited | | | Seepage |1.00 | Seepage |0.64 | Depth to water |1.00 | | | | | | |DocC: | | | | | | | Downer--------------| 85 |Very limited | |Somewhat limited | |Very limited | | | Seepage |1.00 | Seepage |0.64 | Depth to water |1.00 | | Slope |1.00 | | | | | | | | | | |DoeA: | | | | | | | Downer--------------| 85 |Very limited | |Somewhat limited | |Very limited | | | Seepage |1.00 | Seepage |0.64 | Depth to water |1.00 | | | | | | |DoeB: | | | | | | | Downer--------------| 90 |Very limited | |Somewhat limited | |Very limited | | | Seepage |1.00 | Seepage |0.64 | Depth to water |1.00 | | | | | | |DopB: | | | | | | | Downer--------------| 55 |Very limited | |Somewhat limited | |Very limited | | | Seepage |1.00 | Seepage |0.64 | Depth to water |1.00 | | | | | | | Galestown-----------| 35 |Very limited | |Somewhat limited | |Very limited | | | Seepage |1.00 | Seepage |0.10 | Depth to water |1.00 | | | | | | |DouB: | | | | | | | Downer--------------| 60 |Very limited | |Somewhat limited | |Very limited | | | Seepage |1.00 | Seepage |0.64 | Depth to water |1.00 | | | | | | | Urban land----------| 30 |Not rated | |Not rated | |Not rated | | | | | | | |EveB: | | | | | | | Evesboro------------| 80 |Very limited | |Somewhat limited | |Very limited | | | Seepage |1.00 | Seepage |0.47 | Depth to water |1.00 | | | | | | |EveC: | | | | | | | Evesboro------------| 95 |Very limited | |Somewhat limited | |Very limited | | | Seepage |1.00 | Seepage |0.47 | Depth to water |1.00 | | Slope |0.92 | | | | | | | | | | |
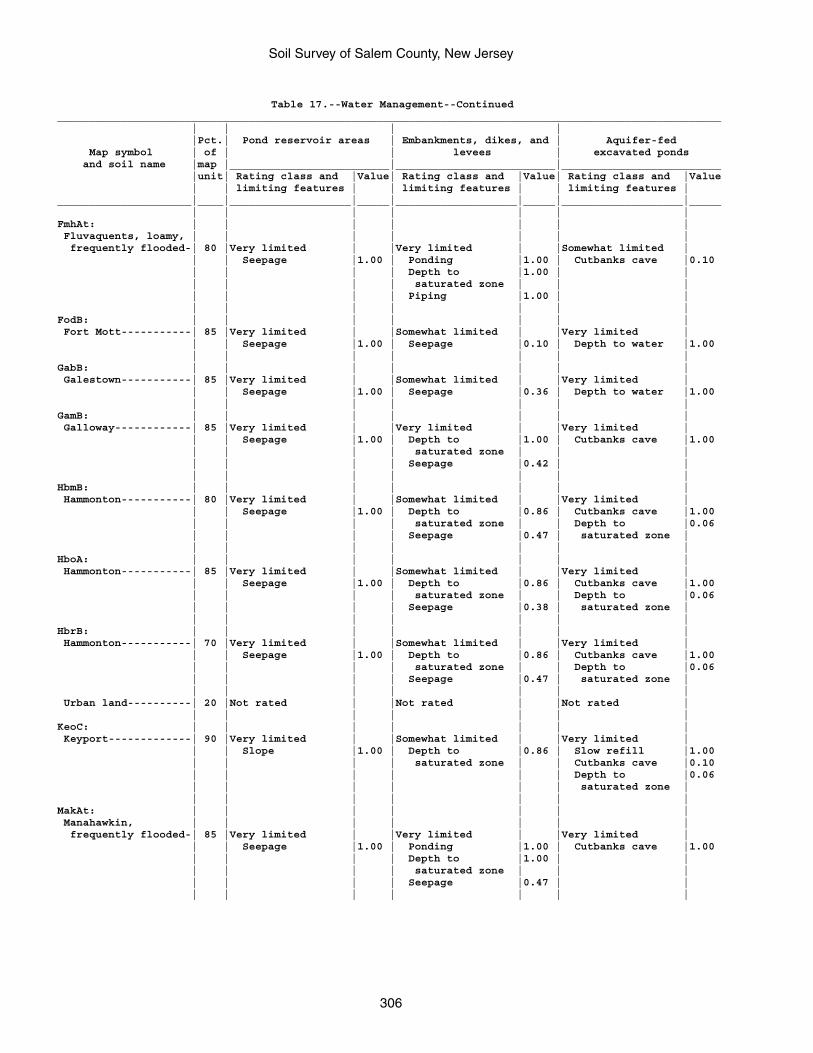
Soil Survey of Salem County, New Jersey
306
Table 17.--Water Management--Continued________________________________________________________________________________________________________ | | | | |Pct.| Pond reservoir areas | Embankments, dikes, and | Aquifer-fed Map symbol | of | | levees | excavated ponds and soil name |map |_________________________|_________________________|_________________________ |unit| Rating class and |Value| Rating class and |Value| Rating class and |Value | | limiting features | | limiting features | | limiting features |_____________________|____|___________________|_____|___________________|_____|___________________|_____ | | | | | | |FmhAt: | | | | | | | Fluvaquents, loamy, | | | | | | | frequently flooded-| 80 |Very limited | |Very limited | |Somewhat limited | | | Seepage |1.00 | Ponding |1.00 | Cutbanks cave |0.10 | | | | Depth to |1.00 | | | | | | saturated zone | | | | | | | Piping |1.00 | | | | | | | | |FodB: | | | | | | | Fort Mott-----------| 85 |Very limited | |Somewhat limited | |Very limited | | | Seepage |1.00 | Seepage |0.10 | Depth to water |1.00 | | | | | | |GabB: | | | | | | | Galestown-----------| 85 |Very limited | |Somewhat limited | |Very limited | | | Seepage |1.00 | Seepage |0.36 | Depth to water |1.00 | | | | | | |GamB: | | | | | | | Galloway------------| 85 |Very limited | |Very limited | |Very limited | | | Seepage |1.00 | Depth to |1.00 | Cutbanks cave |1.00 | | | | saturated zone | | | | | | | Seepage |0.42 | | | | | | | | |HbmB: | | | | | | | Hammonton-----------| 80 |Very limited | |Somewhat limited | |Very limited | | | Seepage |1.00 | Depth to |0.86 | Cutbanks cave |1.00 | | | | saturated zone | | Depth to |0.06 | | | | Seepage |0.47 | saturated zone | | | | | | | |HboA: | | | | | | | Hammonton-----------| 85 |Very limited | |Somewhat limited | |Very limited | | | Seepage |1.00 | Depth to |0.86 | Cutbanks cave |1.00 | | | | saturated zone | | Depth to |0.06 | | | | Seepage |0.38 | saturated zone | | | | | | | |HbrB: | | | | | | | Hammonton-----------| 70 |Very limited | |Somewhat limited | |Very limited | | | Seepage |1.00 | Depth to |0.86 | Cutbanks cave |1.00 | | | | saturated zone | | Depth to |0.06 | | | | Seepage |0.47 | saturated zone | | | | | | | | Urban land----------| 20 |Not rated | |Not rated | |Not rated | | | | | | | |KeoC: | | | | | | | Keyport-------------| 90 |Very limited | |Somewhat limited | |Very limited | | | Slope |1.00 | Depth to |0.86 | Slow refill |1.00 | | | | saturated zone | | Cutbanks cave |0.10 | | | | | | Depth to |0.06 | | | | | | saturated zone | | | | | | | |MakAt: | | | | | | | Manahawkin, | | | | | | | frequently flooded-| 85 |Very limited | |Very limited | |Very limited | | | Seepage |1.00 | Ponding |1.00 | Cutbanks cave |1.00 | | | | Depth to |1.00 | | | | | | saturated zone | | | | | | | Seepage |0.47 | | | | | | | | |
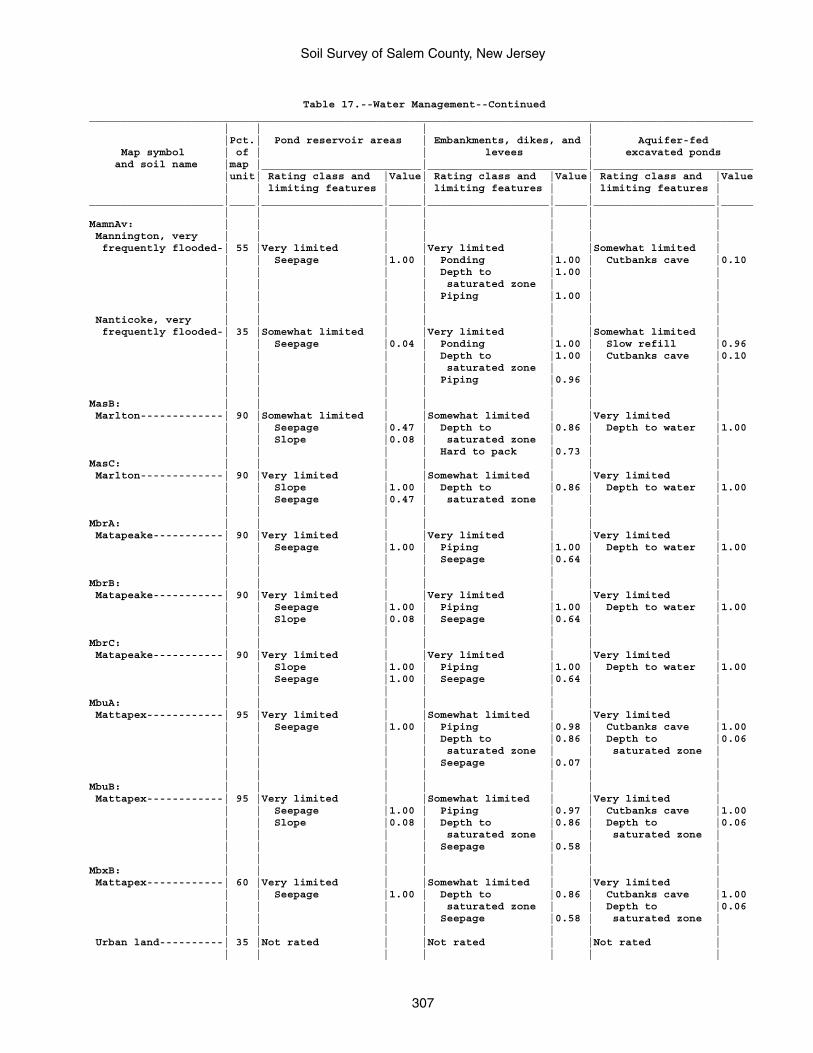
Soil Survey of Salem County, New Jersey
307
Table 17.--Water Management--Continued________________________________________________________________________________________________________ | | | | |Pct.| Pond reservoir areas | Embankments, dikes, and | Aquifer-fed Map symbol | of | | levees | excavated ponds and soil name |map |_________________________|_________________________|_________________________ |unit| Rating class and |Value| Rating class and |Value| Rating class and |Value | | limiting features | | limiting features | | limiting features |_____________________|____|___________________|_____|___________________|_____|___________________|_____ | | | | | | |MamnAv: | | | | | | | Mannington, very | | | | | | | frequently flooded-| 55 |Very limited | |Very limited | |Somewhat limited | | | Seepage |1.00 | Ponding |1.00 | Cutbanks cave |0.10 | | | | Depth to |1.00 | | | | | | saturated zone | | | | | | | Piping |1.00 | | | | | | | | | Nanticoke, very | | | | | | | frequently flooded-| 35 |Somewhat limited | |Very limited | |Somewhat limited | | | Seepage |0.04 | Ponding |1.00 | Slow refill |0.96 | | | | Depth to |1.00 | Cutbanks cave |0.10 | | | | saturated zone | | | | | | | Piping |0.96 | | | | | | | | |MasB: | | | | | | | Marlton-------------| 90 |Somewhat limited | |Somewhat limited | |Very limited | | | Seepage |0.47 | Depth to |0.86 | Depth to water |1.00 | | Slope |0.08 | saturated zone | | | | | | | Hard to pack |0.73 | |MasC: | | | | | | | Marlton-------------| 90 |Very limited | |Somewhat limited | |Very limited | | | Slope |1.00 | Depth to |0.86 | Depth to water |1.00 | | Seepage |0.47 | saturated zone | | | | | | | | | |MbrA: | | | | | | | Matapeake-----------| 90 |Very limited | |Very limited | |Very limited | | | Seepage |1.00 | Piping |1.00 | Depth to water |1.00 | | | | Seepage |0.64 | | | | | | | | |MbrB: | | | | | | | Matapeake-----------| 90 |Very limited | |Very limited | |Very limited | | | Seepage |1.00 | Piping |1.00 | Depth to water |1.00 | | Slope |0.08 | Seepage |0.64 | | | | | | | | |MbrC: | | | | | | | Matapeake-----------| 90 |Very limited | |Very limited | |Very limited | | | Slope |1.00 | Piping |1.00 | Depth to water |1.00 | | Seepage |1.00 | Seepage |0.64 | | | | | | | | |MbuA: | | | | | | | Mattapex------------| 95 |Very limited | |Somewhat limited | |Very limited | | | Seepage |1.00 | Piping |0.98 | Cutbanks cave |1.00 | | | | Depth to |0.86 | Depth to |0.06 | | | | saturated zone | | saturated zone | | | | | Seepage |0.07 | | | | | | | | |MbuB: | | | | | | | Mattapex------------| 95 |Very limited | |Somewhat limited | |Very limited | | | Seepage |1.00 | Piping |0.97 | Cutbanks cave |1.00 | | Slope |0.08 | Depth to |0.86 | Depth to |0.06 | | | | saturated zone | | saturated zone | | | | | Seepage |0.58 | | | | | | | | |MbxB: | | | | | | | Mattapex------------| 60 |Very limited | |Somewhat limited | |Very limited | | | Seepage |1.00 | Depth to |0.86 | Cutbanks cave |1.00 | | | | saturated zone | | Depth to |0.06 | | | | Seepage |0.58 | saturated zone | | | | | | | | Urban land----------| 35 |Not rated | |Not rated | |Not rated | | | | | | | |
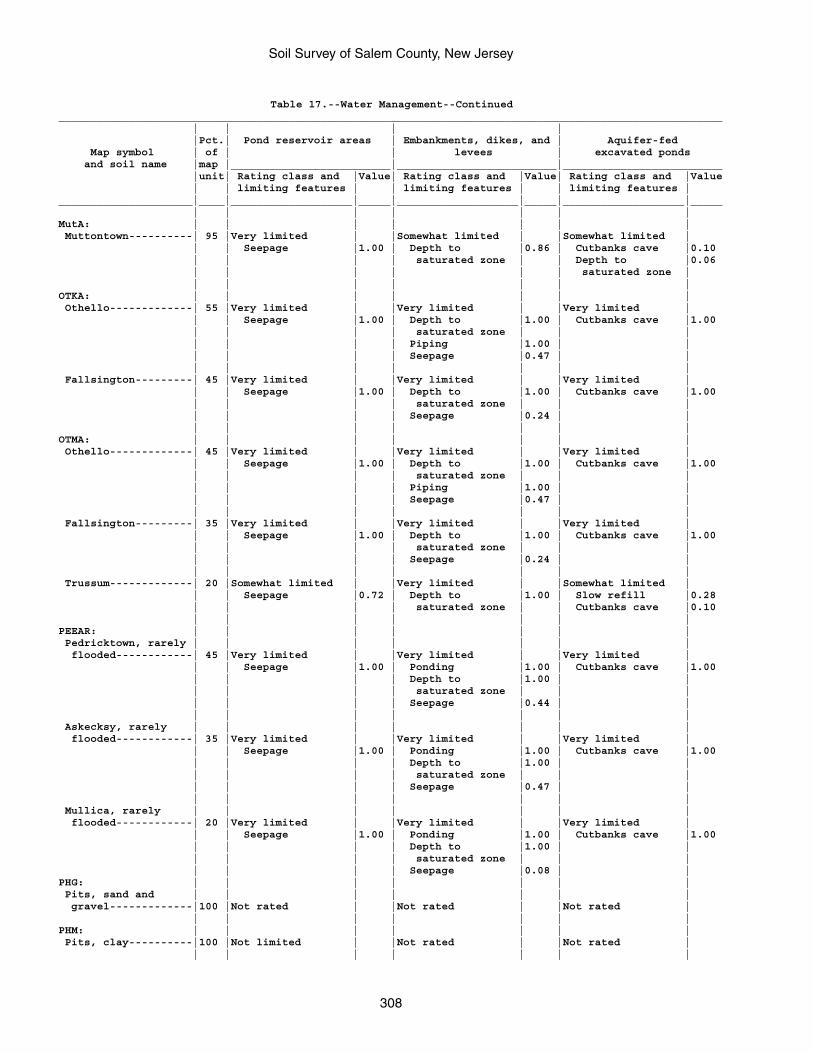
Soil Survey of Salem County, New Jersey
308
Table 17.--Water Management--Continued________________________________________________________________________________________________________ | | | | |Pct.| Pond reservoir areas | Embankments, dikes, and | Aquifer-fed Map symbol | of | | levees | excavated ponds and soil name |map |_________________________|_________________________|_________________________ |unit| Rating class and |Value| Rating class and |Value| Rating class and |Value | | limiting features | | limiting features | | limiting features |_____________________|____|___________________|_____|___________________|_____|___________________|_____ | | | | | | |MutA: | | | | | | | Muttontown----------| 95 |Very limited | |Somewhat limited | |Somewhat limited | | | Seepage |1.00 | Depth to |0.86 | Cutbanks cave |0.10 | | | | saturated zone | | Depth to |0.06 | | | | | | saturated zone | | | | | | | |OTKA: | | | | | | | Othello-------------| 55 |Very limited | |Very limited | |Very limited | | | Seepage |1.00 | Depth to |1.00 | Cutbanks cave |1.00 | | | | saturated zone | | | | | | | Piping |1.00 | | | | | | Seepage |0.47 | | | | | | | | | Fallsington---------| 45 |Very limited | |Very limited | |Very limited | | | Seepage |1.00 | Depth to |1.00 | Cutbanks cave |1.00 | | | | saturated zone | | | | | | | Seepage |0.24 | | | | | | | | |OTMA: | | | | | | | Othello-------------| 45 |Very limited | |Very limited | |Very limited | | | Seepage |1.00 | Depth to |1.00 | Cutbanks cave |1.00 | | | | saturated zone | | | | | | | Piping |1.00 | | | | | | Seepage |0.47 | | | | | | | | | Fallsington---------| 35 |Very limited | |Very limited | |Very limited | | | Seepage |1.00 | Depth to |1.00 | Cutbanks cave |1.00 | | | | saturated zone | | | | | | | Seepage |0.24 | | | | | | | | | Trussum-------------| 20 |Somewhat limited | |Very limited | |Somewhat limited | | | Seepage |0.72 | Depth to |1.00 | Slow refill |0.28 | | | | saturated zone | | Cutbanks cave |0.10 | | | | | | |PEEAR: | | | | | | | Pedricktown, rarely | | | | | | | flooded------------| 45 |Very limited | |Very limited | |Very limited | | | Seepage |1.00 | Ponding |1.00 | Cutbanks cave |1.00 | | | | Depth to |1.00 | | | | | | saturated zone | | | | | | | Seepage |0.44 | | | | | | | | | Askecksy, rarely | | | | | | | flooded------------| 35 |Very limited | |Very limited | |Very limited | | | Seepage |1.00 | Ponding |1.00 | Cutbanks cave |1.00 | | | | Depth to |1.00 | | | | | | saturated zone | | | | | | | Seepage |0.47 | | | | | | | | | Mullica, rarely | | | | | | | flooded------------| 20 |Very limited | |Very limited | |Very limited | | | Seepage |1.00 | Ponding |1.00 | Cutbanks cave |1.00 | | | | Depth to |1.00 | | | | | | saturated zone | | | | | | | Seepage |0.08 | |PHG: | | | | | | | Pits, sand and | | | | | | | gravel-------------|100 |Not rated | |Not rated | |Not rated | | | | | | | |PHM: | | | | | | | Pits, clay----------|100 |Not limited | |Not rated | |Not rated | | | | | | | |
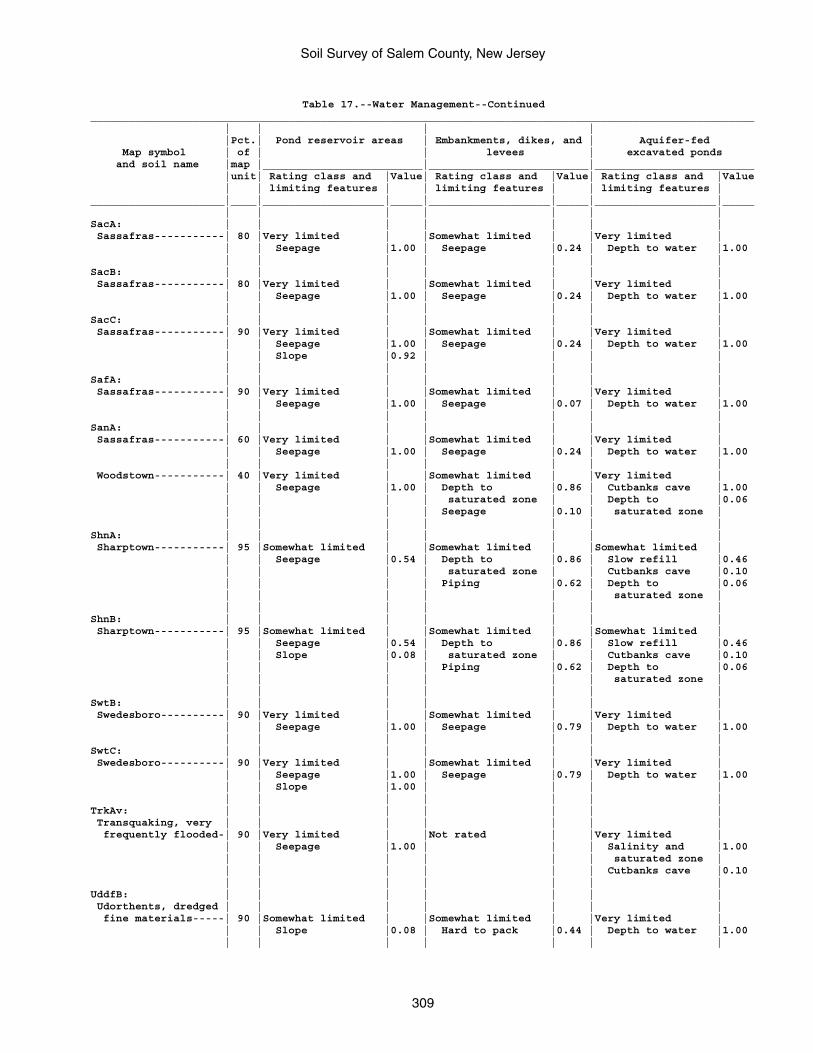
Soil Survey of Salem County, New Jersey
309
Table 17.--Water Management--Continued________________________________________________________________________________________________________ | | | | |Pct.| Pond reservoir areas | Embankments, dikes, and | Aquifer-fed Map symbol | of | | levees | excavated ponds and soil name |map |_________________________|_________________________|_________________________ |unit| Rating class and |Value| Rating class and |Value| Rating class and |Value | | limiting features | | limiting features | | limiting features |_____________________|____|___________________|_____|___________________|_____|___________________|_____ | | | | | | |SacA: | | | | | | | Sassafras-----------| 80 |Very limited | |Somewhat limited | |Very limited | | | Seepage |1.00 | Seepage |0.24 | Depth to water |1.00 | | | | | | |SacB: | | | | | | | Sassafras-----------| 80 |Very limited | |Somewhat limited | |Very limited | | | Seepage |1.00 | Seepage |0.24 | Depth to water |1.00 | | | | | | |SacC: | | | | | | | Sassafras-----------| 90 |Very limited | |Somewhat limited | |Very limited | | | Seepage |1.00 | Seepage |0.24 | Depth to water |1.00 | | Slope |0.92 | | | | | | | | | | |SafA: | | | | | | | Sassafras-----------| 90 |Very limited | |Somewhat limited | |Very limited | | | Seepage |1.00 | Seepage |0.07 | Depth to water |1.00 | | | | | | |SanA: | | | | | | | Sassafras-----------| 60 |Very limited | |Somewhat limited | |Very limited | | | Seepage |1.00 | Seepage |0.24 | Depth to water |1.00 | | | | | | | Woodstown-----------| 40 |Very limited | |Somewhat limited | |Very limited | | | Seepage |1.00 | Depth to |0.86 | Cutbanks cave |1.00 | | | | saturated zone | | Depth to |0.06 | | | | Seepage |0.10 | saturated zone | | | | | | | |ShnA: | | | | | | | Sharptown-----------| 95 |Somewhat limited | |Somewhat limited | |Somewhat limited | | | Seepage |0.54 | Depth to |0.86 | Slow refill |0.46 | | | | saturated zone | | Cutbanks cave |0.10 | | | | Piping |0.62 | Depth to |0.06 | | | | | | saturated zone | | | | | | | |ShnB: | | | | | | | Sharptown-----------| 95 |Somewhat limited | |Somewhat limited | |Somewhat limited | | | Seepage |0.54 | Depth to |0.86 | Slow refill |0.46 | | Slope |0.08 | saturated zone | | Cutbanks cave |0.10 | | | | Piping |0.62 | Depth to |0.06 | | | | | | saturated zone | | | | | | | |SwtB: | | | | | | | Swedesboro----------| 90 |Very limited | |Somewhat limited | |Very limited | | | Seepage |1.00 | Seepage |0.79 | Depth to water |1.00 | | | | | | |SwtC: | | | | | | | Swedesboro----------| 90 |Very limited | |Somewhat limited | |Very limited | | | Seepage |1.00 | Seepage |0.79 | Depth to water |1.00 | | Slope |1.00 | | | | | | | | | | |TrkAv: | | | | | | | Transquaking, very | | | | | | | frequently flooded-| 90 |Very limited | |Not rated | |Very limited | | | Seepage |1.00 | | | Salinity and |1.00 | | | | | | saturated zone | | | | | | | Cutbanks cave |0.10 | | | | | | |UddfB: | | | | | | | Udorthents, dredged | | | | | | | fine materials-----| 90 |Somewhat limited | |Somewhat limited | |Very limited | | | Slope |0.08 | Hard to pack |0.44 | Depth to water |1.00 | | | | | | |
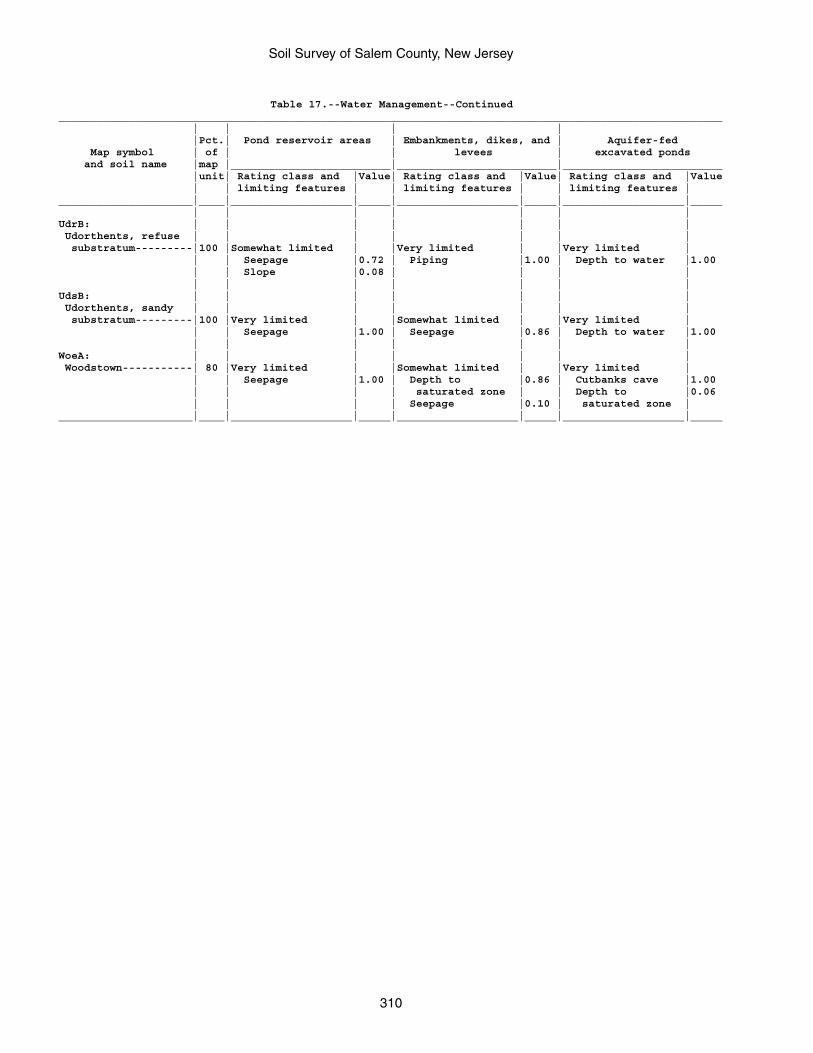
Soil Survey of Salem County, New Jersey
310
Table 17.--Water Management--Continued________________________________________________________________________________________________________ | | | | |Pct.| Pond reservoir areas | Embankments, dikes, and | Aquifer-fed Map symbol | of | | levees | excavated ponds and soil name |map |_________________________|_________________________|_________________________ |unit| Rating class and |Value| Rating class and |Value| Rating class and |Value | | limiting features | | limiting features | | limiting features |_____________________|____|___________________|_____|___________________|_____|___________________|_____ | | | | | | |UdrB: | | | | | | | Udorthents, refuse | | | | | | | substratum---------|100 |Somewhat limited | |Very limited | |Very limited | | | Seepage |0.72 | Piping |1.00 | Depth to water |1.00 | | Slope |0.08 | | | | | | | | | | |UdsB: | | | | | | | Udorthents, sandy | | | | | | | substratum---------|100 |Very limited | |Somewhat limited | |Very limited | | | Seepage |1.00 | Seepage |0.86 | Depth to water |1.00 | | | | | | |WoeA: | | | | | | | Woodstown-----------| 80 |Very limited | |Somewhat limited | |Very limited | | | Seepage |1.00 | Depth to |0.86 | Cutbanks cave |1.00 | | | | saturated zone | | Depth to |0.06 | | | | Seepage |0.10 | saturated zone |_____________________|____|___________________|_____|___________________|_____|___________________|_____
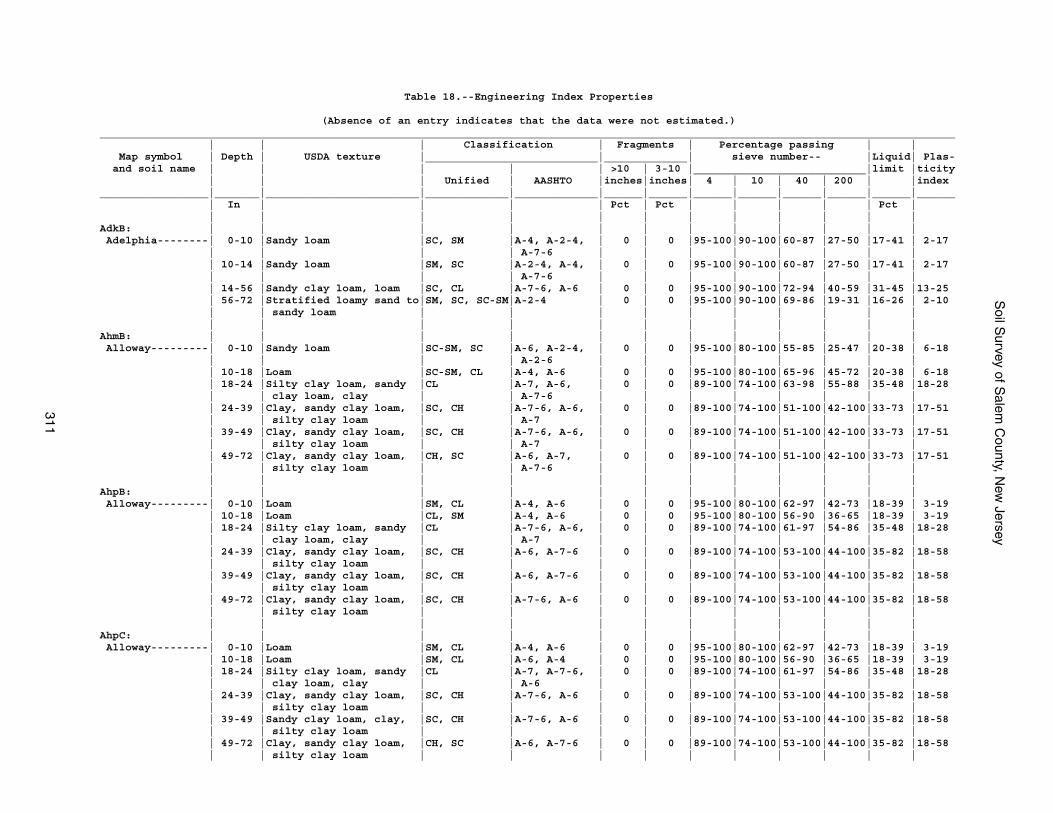
Soil S
urvey of Salem
County, N
ew Jersey
311
Table 18.--Engineering Index Properties
(Absence of an entry indicates that the data were not estimated.)______________________________________________________________________________________________________________________________________ | | | Classification | Fragments | Percentage passing | | Map symbol | Depth | USDA texture |___________________________|_____________| sieve number-- |Liquid| Plas- and soil name | | | | | >10 | 3-10 |___________________________|limit |ticity | | | Unified | AASHTO |inches|inches| 4 | 10 | 40 | 200 | |index_________________|_______|________________________|_____________|_____________|______|______|______|______|______|______|______|______ | In | | | | Pct | Pct | | | | | Pct | | | | | | | | | | | | |AdkB: | | | | | | | | | | | | Adelphia--------| 0-10 |Sandy loam |SC, SM |A-4, A-2-4, | 0 | 0 |95-100|90-100|60-87 |27-50 |17-41 | 2-17 | | | | A-7-6 | | | | | | | | | 10-14 |Sandy loam |SM, SC |A-2-4, A-4, | 0 | 0 |95-100|90-100|60-87 |27-50 |17-41 | 2-17 | | | | A-7-6 | | | | | | | | | 14-56 |Sandy clay loam, loam |SC, CL |A-7-6, A-6 | 0 | 0 |95-100|90-100|72-94 |40-59 |31-45 |13-25 | 56-72 |Stratified loamy sand to|SM, SC, SC-SM|A-2-4 | 0 | 0 |95-100|90-100|69-86 |19-31 |16-26 | 2-10 | | sandy loam | | | | | | | | | | | | | | | | | | | | | |AhmB: | | | | | | | | | | | | Alloway---------| 0-10 |Sandy loam |SC-SM, SC |A-6, A-2-4, | 0 | 0 |95-100|80-100|55-85 |25-47 |20-38 | 6-18 | | | | A-2-6 | | | | | | | | | 10-18 |Loam |SC-SM, CL |A-4, A-6 | 0 | 0 |95-100|80-100|65-96 |45-72 |20-38 | 6-18 | 18-24 |Silty clay loam, sandy |CL |A-7, A-6, | 0 | 0 |89-100|74-100|63-98 |55-88 |35-48 |18-28 | | clay loam, clay | | A-7-6 | | | | | | | | | 24-39 |Clay, sandy clay loam, |SC, CH |A-7-6, A-6, | 0 | 0 |89-100|74-100|51-100|42-100|33-73 |17-51 | | silty clay loam | | A-7 | | | | | | | | | 39-49 |Clay, sandy clay loam, |SC, CH |A-7-6, A-6, | 0 | 0 |89-100|74-100|51-100|42-100|33-73 |17-51 | | silty clay loam | | A-7 | | | | | | | | | 49-72 |Clay, sandy clay loam, |CH, SC |A-6, A-7, | 0 | 0 |89-100|74-100|51-100|42-100|33-73 |17-51 | | silty clay loam | | A-7-6 | | | | | | | | | | | | | | | | | | | |AhpB: | | | | | | | | | | | | Alloway---------| 0-10 |Loam |SM, CL |A-4, A-6 | 0 | 0 |95-100|80-100|62-97 |42-73 |18-39 | 3-19 | 10-18 |Loam |CL, SM |A-4, A-6 | 0 | 0 |95-100|80-100|56-90 |36-65 |18-39 | 3-19 | 18-24 |Silty clay loam, sandy |CL |A-7-6, A-6, | 0 | 0 |89-100|74-100|61-97 |54-86 |35-48 |18-28 | | clay loam, clay | | A-7 | | | | | | | | | 24-39 |Clay, sandy clay loam, |SC, CH |A-6, A-7-6 | 0 | 0 |89-100|74-100|53-100|44-100|35-82 |18-58 | | silty clay loam | | | | | | | | | | | 39-49 |Clay, sandy clay loam, |SC, CH |A-6, A-7-6 | 0 | 0 |89-100|74-100|53-100|44-100|35-82 |18-58 | | silty clay loam | | | | | | | | | | | 49-72 |Clay, sandy clay loam, |SC, CH |A-7-6, A-6 | 0 | 0 |89-100|74-100|53-100|44-100|35-82 |18-58 | | silty clay loam | | | | | | | | | | | | | | | | | | | | | |AhpC: | | | | | | | | | | | | Alloway---------| 0-10 |Loam |SM, CL |A-4, A-6 | 0 | 0 |95-100|80-100|62-97 |42-73 |18-39 | 3-19 | 10-18 |Loam |SM, CL |A-6, A-4 | 0 | 0 |95-100|80-100|56-90 |36-65 |18-39 | 3-19 | 18-24 |Silty clay loam, sandy |CL |A-7, A-7-6, | 0 | 0 |89-100|74-100|61-97 |54-86 |35-48 |18-28 | | clay loam, clay | | A-6 | | | | | | | | | 24-39 |Clay, sandy clay loam, |SC, CH |A-7-6, A-6 | 0 | 0 |89-100|74-100|53-100|44-100|35-82 |18-58 | | silty clay loam | | | | | | | | | | | 39-49 |Sandy clay loam, clay, |SC, CH |A-7-6, A-6 | 0 | 0 |89-100|74-100|53-100|44-100|35-82 |18-58 | | silty clay loam | | | | | | | | | | | 49-72 |Clay, sandy clay loam, |CH, SC |A-6, A-7-6 | 0 | 0 |89-100|74-100|53-100|44-100|35-82 |18-58 | | silty clay loam | | | | | | | | | |
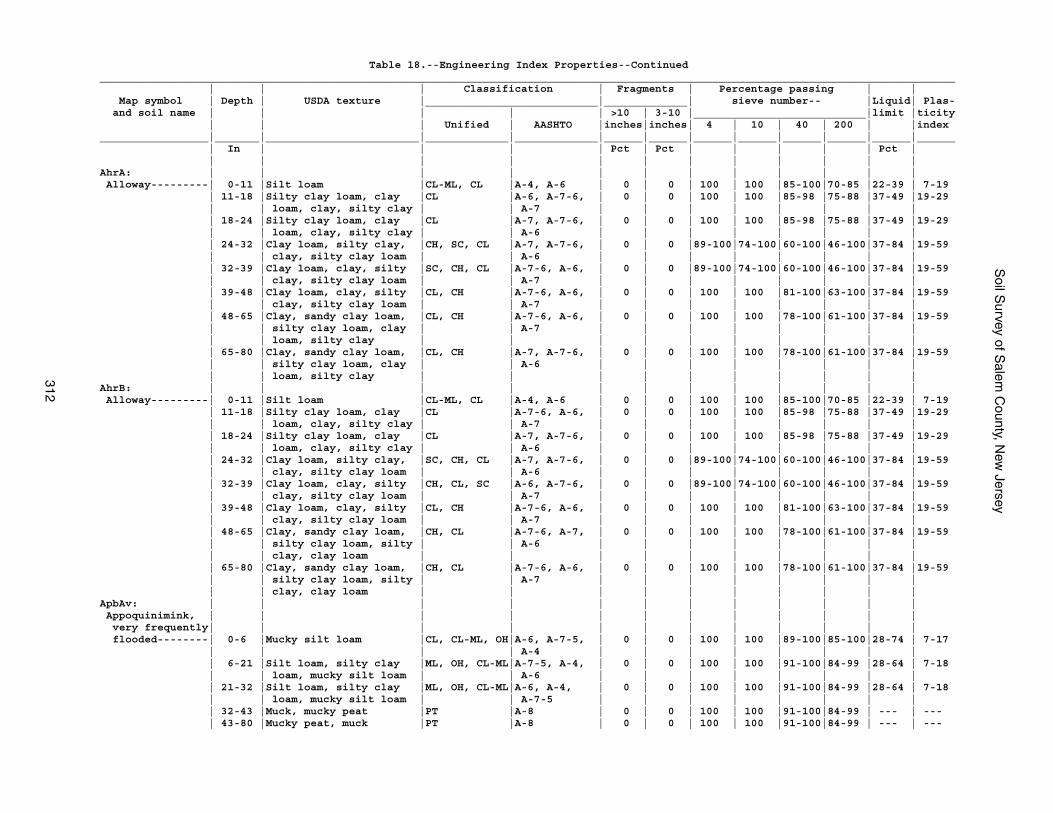
Soil S
urvey of Salem
County, N
ew Jersey
312
Table 18.--Engineering Index Properties--Continued______________________________________________________________________________________________________________________________________ | | | Classification | Fragments | Percentage passing | | Map symbol | Depth | USDA texture |___________________________|_____________| sieve number-- |Liquid| Plas- and soil name | | | | | >10 | 3-10 |___________________________|limit |ticity | | | Unified | AASHTO |inches|inches| 4 | 10 | 40 | 200 | |index_________________|_______|________________________|_____________|_____________|______|______|______|______|______|______|______|______ | In | | | | Pct | Pct | | | | | Pct | | | | | | | | | | | | |AhrA: | | | | | | | | | | | | Alloway---------| 0-11 |Silt loam |CL-ML, CL |A-4, A-6 | 0 | 0 | 100 | 100 |85-100|70-85 |22-39 | 7-19 | 11-18 |Silty clay loam, clay |CL |A-6, A-7-6, | 0 | 0 | 100 | 100 |85-98 |75-88 |37-49 |19-29 | | loam, clay, silty clay | | A-7 | | | | | | | | | 18-24 |Silty clay loam, clay |CL |A-7, A-7-6, | 0 | 0 | 100 | 100 |85-98 |75-88 |37-49 |19-29 | | loam, clay, silty clay | | A-6 | | | | | | | | | 24-32 |Clay loam, silty clay, |CH, SC, CL |A-7, A-7-6, | 0 | 0 |89-100|74-100|60-100|46-100|37-84 |19-59 | | clay, silty clay loam | | A-6 | | | | | | | | | 32-39 |Clay loam, clay, silty |SC, CH, CL |A-7-6, A-6, | 0 | 0 |89-100|74-100|60-100|46-100|37-84 |19-59 | | clay, silty clay loam | | A-7 | | | | | | | | | 39-48 |Clay loam, clay, silty |CL, CH |A-7-6, A-6, | 0 | 0 | 100 | 100 |81-100|63-100|37-84 |19-59 | | clay, silty clay loam | | A-7 | | | | | | | | | 48-65 |Clay, sandy clay loam, |CL, CH |A-7-6, A-6, | 0 | 0 | 100 | 100 |78-100|61-100|37-84 |19-59 | | silty clay loam, clay | | A-7 | | | | | | | | | | loam, silty clay | | | | | | | | | | | 65-80 |Clay, sandy clay loam, |CL, CH |A-7, A-7-6, | 0 | 0 | 100 | 100 |78-100|61-100|37-84 |19-59 | | silty clay loam, clay | | A-6 | | | | | | | | | | loam, silty clay | | | | | | | | | |AhrB: | | | | | | | | | | | | Alloway---------| 0-11 |Silt loam |CL-ML, CL |A-4, A-6 | 0 | 0 | 100 | 100 |85-100|70-85 |22-39 | 7-19 | 11-18 |Silty clay loam, clay |CL |A-7-6, A-6, | 0 | 0 | 100 | 100 |85-98 |75-88 |37-49 |19-29 | | loam, clay, silty clay | | A-7 | | | | | | | | | 18-24 |Silty clay loam, clay |CL |A-7, A-7-6, | 0 | 0 | 100 | 100 |85-98 |75-88 |37-49 |19-29 | | loam, clay, silty clay | | A-6 | | | | | | | | | 24-32 |Clay loam, silty clay, |SC, CH, CL |A-7, A-7-6, | 0 | 0 |89-100|74-100|60-100|46-100|37-84 |19-59 | | clay, silty clay loam | | A-6 | | | | | | | | | 32-39 |Clay loam, clay, silty |CH, CL, SC |A-6, A-7-6, | 0 | 0 |89-100|74-100|60-100|46-100|37-84 |19-59 | | clay, silty clay loam | | A-7 | | | | | | | | | 39-48 |Clay loam, clay, silty |CL, CH |A-7-6, A-6, | 0 | 0 | 100 | 100 |81-100|63-100|37-84 |19-59 | | clay, silty clay loam | | A-7 | | | | | | | | | 48-65 |Clay, sandy clay loam, |CH, CL |A-7-6, A-7, | 0 | 0 | 100 | 100 |78-100|61-100|37-84 |19-59 | | silty clay loam, silty | | A-6 | | | | | | | | | | clay, clay loam | | | | | | | | | | | 65-80 |Clay, sandy clay loam, |CH, CL |A-7-6, A-6, | 0 | 0 | 100 | 100 |78-100|61-100|37-84 |19-59 | | silty clay loam, silty | | A-7 | | | | | | | | | | clay, clay loam | | | | | | | | | |ApbAv: | | | | | | | | | | | | Appoquinimink, | | | | | | | | | | | | very frequently| | | | | | | | | | | | flooded--------| 0-6 |Mucky silt loam |CL, CL-ML, OH|A-6, A-7-5, | 0 | 0 | 100 | 100 |89-100|85-100|28-74 | 7-17 | | | | A-4 | | | | | | | | | 6-21 |Silt loam, silty clay |ML, OH, CL-ML|A-7-5, A-4, | 0 | 0 | 100 | 100 |91-100|84-99 |28-64 | 7-18 | | loam, mucky silt loam | | A-6 | | | | | | | | | 21-32 |Silt loam, silty clay |ML, OH, CL-ML|A-6, A-4, | 0 | 0 | 100 | 100 |91-100|84-99 |28-64 | 7-18 | | loam, mucky silt loam | | A-7-5 | | | | | | | | | 32-43 |Muck, mucky peat |PT |A-8 | 0 | 0 | 100 | 100 |91-100|84-99 | --- | --- | 43-80 |Mucky peat, muck |PT |A-8 | 0 | 0 | 100 | 100 |91-100|84-99 | --- | ---
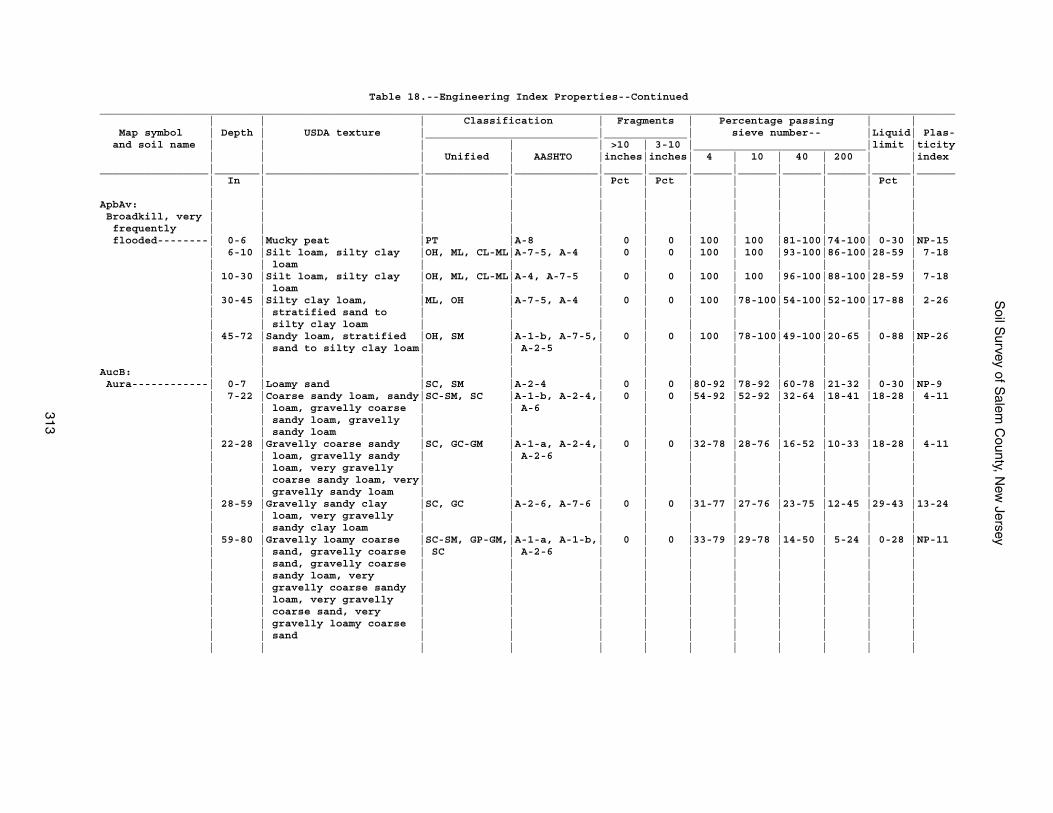
Soil S
urvey of Salem
County, N
ew Jersey
313
Table 18.--Engineering Index Properties--Continued______________________________________________________________________________________________________________________________________ | | | Classification | Fragments | Percentage passing | | Map symbol | Depth | USDA texture |___________________________|_____________| sieve number-- |Liquid| Plas- and soil name | | | | | >10 | 3-10 |___________________________|limit |ticity | | | Unified | AASHTO |inches|inches| 4 | 10 | 40 | 200 | |index_________________|_______|________________________|_____________|_____________|______|______|______|______|______|______|______|______ | In | | | | Pct | Pct | | | | | Pct | | | | | | | | | | | | |ApbAv: | | | | | | | | | | | | Broadkill, very | | | | | | | | | | | | frequently | | | | | | | | | | | | flooded--------| 0-6 |Mucky peat |PT |A-8 | 0 | 0 | 100 | 100 |81-100|74-100| 0-30 |NP-15 | 6-10 |Silt loam, silty clay |OH, ML, CL-ML|A-7-5, A-4 | 0 | 0 | 100 | 100 |93-100|86-100|28-59 | 7-18 | | loam | | | | | | | | | | | 10-30 |Silt loam, silty clay |OH, ML, CL-ML|A-4, A-7-5 | 0 | 0 | 100 | 100 |96-100|88-100|28-59 | 7-18 | | loam | | | | | | | | | | | 30-45 |Silty clay loam, |ML, OH |A-7-5, A-4 | 0 | 0 | 100 |78-100|54-100|52-100|17-88 | 2-26 | | stratified sand to | | | | | | | | | | | | silty clay loam | | | | | | | | | | | 45-72 |Sandy loam, stratified |OH, SM |A-1-b, A-7-5,| 0 | 0 | 100 |78-100|49-100|20-65 | 0-88 |NP-26 | | sand to silty clay loam| | A-2-5 | | | | | | | | | | | | | | | | | | | |AucB: | | | | | | | | | | | | Aura------------| 0-7 |Loamy sand |SC, SM |A-2-4 | 0 | 0 |80-92 |78-92 |60-78 |21-32 | 0-30 |NP-9 | 7-22 |Coarse sandy loam, sandy|SC-SM, SC |A-1-b, A-2-4,| 0 | 0 |54-92 |52-92 |32-64 |18-41 |18-28 | 4-11 | | loam, gravelly coarse | | A-6 | | | | | | | | | | sandy loam, gravelly | | | | | | | | | | | | sandy loam | | | | | | | | | | | 22-28 |Gravelly coarse sandy |SC, GC-GM |A-1-a, A-2-4,| 0 | 0 |32-78 |28-76 |16-52 |10-33 |18-28 | 4-11 | | loam, gravelly sandy | | A-2-6 | | | | | | | | | | loam, very gravelly | | | | | | | | | | | | coarse sandy loam, very| | | | | | | | | | | | gravelly sandy loam | | | | | | | | | | | 28-59 |Gravelly sandy clay |SC, GC |A-2-6, A-7-6 | 0 | 0 |31-77 |27-76 |23-75 |12-45 |29-43 |13-24 | | loam, very gravelly | | | | | | | | | | | | sandy clay loam | | | | | | | | | | | 59-80 |Gravelly loamy coarse |SC-SM, GP-GM,|A-1-a, A-1-b,| 0 | 0 |33-79 |29-78 |14-50 | 5-24 | 0-28 |NP-11 | | sand, gravelly coarse | SC | A-2-6 | | | | | | | | | | sand, gravelly coarse | | | | | | | | | | | | sandy loam, very | | | | | | | | | | | | gravelly coarse sandy | | | | | | | | | | | | loam, very gravelly | | | | | | | | | | | | coarse sand, very | | | | | | | | | | | | gravelly loamy coarse | | | | | | | | | | | | sand | | | | | | | | | | | | | | | | | | | | | |
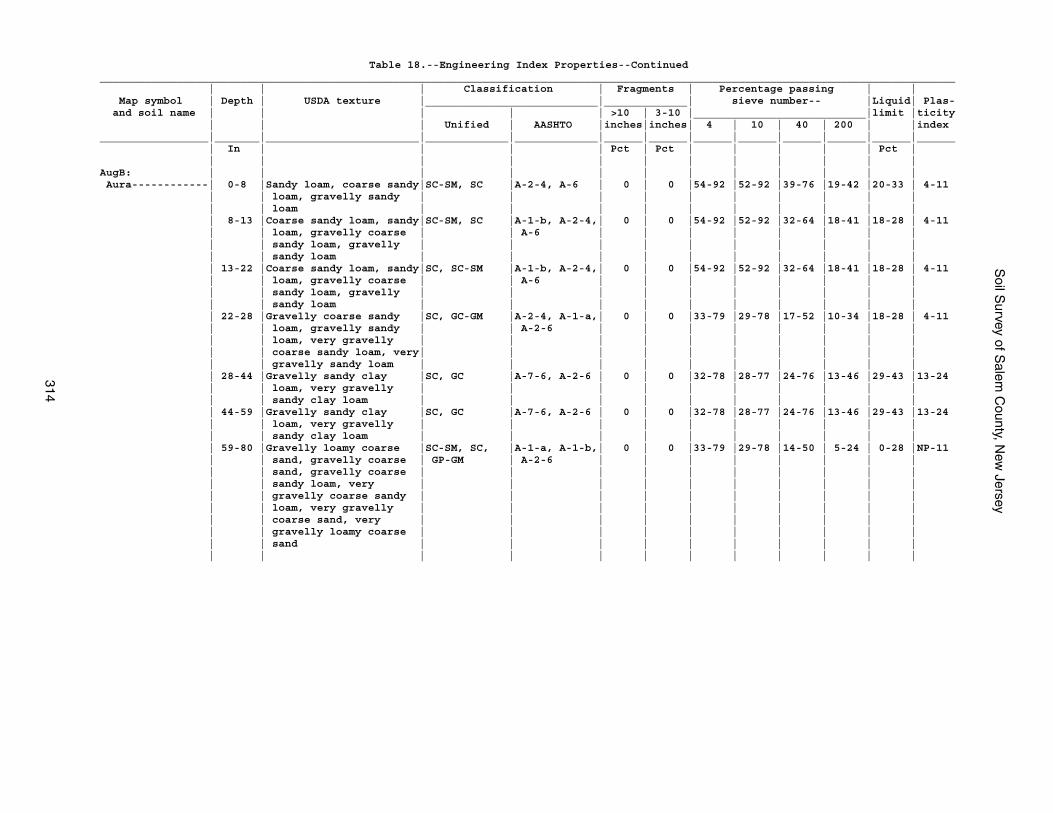
Soil S
urvey of Salem
County, N
ew Jersey
314
Table 18.--Engineering Index Properties--Continued______________________________________________________________________________________________________________________________________ | | | Classification | Fragments | Percentage passing | | Map symbol | Depth | USDA texture |___________________________|_____________| sieve number-- |Liquid| Plas- and soil name | | | | | >10 | 3-10 |___________________________|limit |ticity | | | Unified | AASHTO |inches|inches| 4 | 10 | 40 | 200 | |index_________________|_______|________________________|_____________|_____________|______|______|______|______|______|______|______|______ | In | | | | Pct | Pct | | | | | Pct | | | | | | | | | | | | |AugB: | | | | | | | | | | | | Aura------------| 0-8 |Sandy loam, coarse sandy|SC-SM, SC |A-2-4, A-6 | 0 | 0 |54-92 |52-92 |39-76 |19-42 |20-33 | 4-11 | | loam, gravelly sandy | | | | | | | | | | | | loam | | | | | | | | | | | 8-13 |Coarse sandy loam, sandy|SC-SM, SC |A-1-b, A-2-4,| 0 | 0 |54-92 |52-92 |32-64 |18-41 |18-28 | 4-11 | | loam, gravelly coarse | | A-6 | | | | | | | | | | sandy loam, gravelly | | | | | | | | | | | | sandy loam | | | | | | | | | | | 13-22 |Coarse sandy loam, sandy|SC, SC-SM |A-1-b, A-2-4,| 0 | 0 |54-92 |52-92 |32-64 |18-41 |18-28 | 4-11 | | loam, gravelly coarse | | A-6 | | | | | | | | | | sandy loam, gravelly | | | | | | | | | | | | sandy loam | | | | | | | | | | | 22-28 |Gravelly coarse sandy |SC, GC-GM |A-2-4, A-1-a,| 0 | 0 |33-79 |29-78 |17-52 |10-34 |18-28 | 4-11 | | loam, gravelly sandy | | A-2-6 | | | | | | | | | | loam, very gravelly | | | | | | | | | | | | coarse sandy loam, very| | | | | | | | | | | | gravelly sandy loam | | | | | | | | | | | 28-44 |Gravelly sandy clay |SC, GC |A-7-6, A-2-6 | 0 | 0 |32-78 |28-77 |24-76 |13-46 |29-43 |13-24 | | loam, very gravelly | | | | | | | | | | | | sandy clay loam | | | | | | | | | | | 44-59 |Gravelly sandy clay |SC, GC |A-7-6, A-2-6 | 0 | 0 |32-78 |28-77 |24-76 |13-46 |29-43 |13-24 | | loam, very gravelly | | | | | | | | | | | | sandy clay loam | | | | | | | | | | | 59-80 |Gravelly loamy coarse |SC-SM, SC, |A-1-a, A-1-b,| 0 | 0 |33-79 |29-78 |14-50 | 5-24 | 0-28 |NP-11 | | sand, gravelly coarse | GP-GM | A-2-6 | | | | | | | | | | sand, gravelly coarse | | | | | | | | | | | | sandy loam, very | | | | | | | | | | | | gravelly coarse sandy | | | | | | | | | | | | loam, very gravelly | | | | | | | | | | | | coarse sand, very | | | | | | | | | | | | gravelly loamy coarse | | | | | | | | | | | | sand | | | | | | | | | | | | | | | | | | | | | |
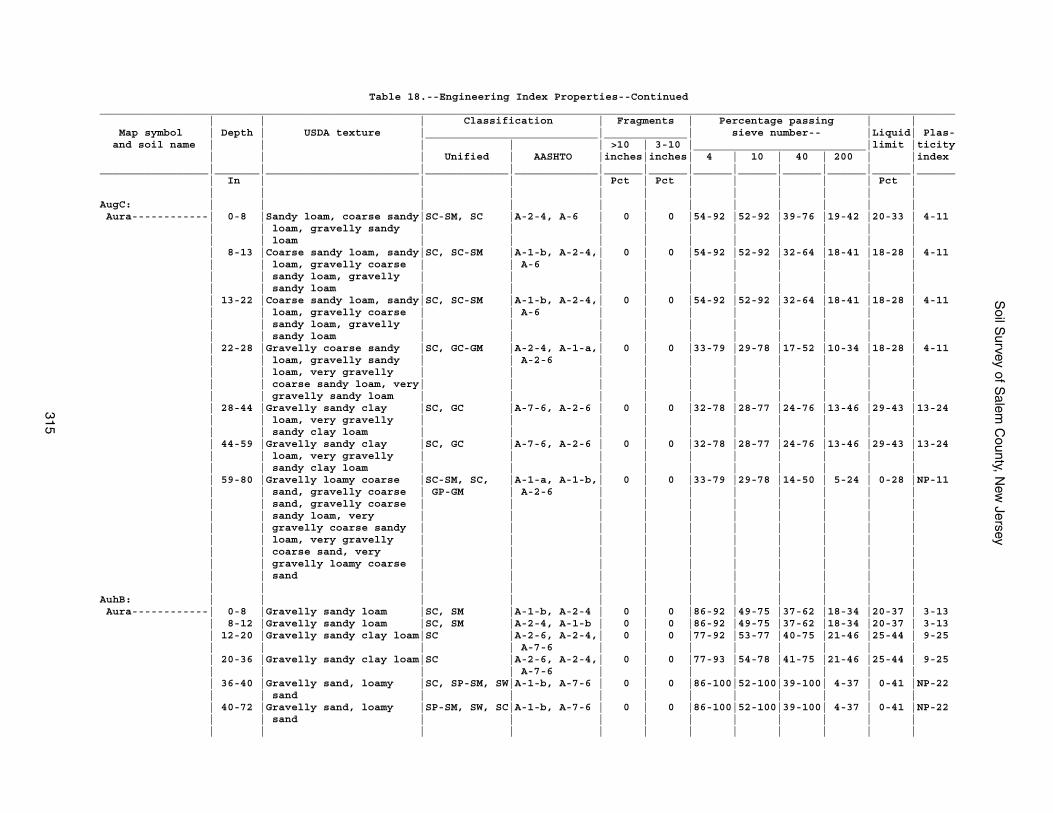
Soil S
urvey of Salem
County, N
ew Jersey
315
Table 18.--Engineering Index Properties--Continued______________________________________________________________________________________________________________________________________ | | | Classification | Fragments | Percentage passing | | Map symbol | Depth | USDA texture |___________________________|_____________| sieve number-- |Liquid| Plas- and soil name | | | | | >10 | 3-10 |___________________________|limit |ticity | | | Unified | AASHTO |inches|inches| 4 | 10 | 40 | 200 | |index_________________|_______|________________________|_____________|_____________|______|______|______|______|______|______|______|______ | In | | | | Pct | Pct | | | | | Pct | | | | | | | | | | | | |AugC: | | | | | | | | | | | | Aura------------| 0-8 |Sandy loam, coarse sandy|SC-SM, SC |A-2-4, A-6 | 0 | 0 |54-92 |52-92 |39-76 |19-42 |20-33 | 4-11 | | loam, gravelly sandy | | | | | | | | | | | | loam | | | | | | | | | | | 8-13 |Coarse sandy loam, sandy|SC, SC-SM |A-1-b, A-2-4,| 0 | 0 |54-92 |52-92 |32-64 |18-41 |18-28 | 4-11 | | loam, gravelly coarse | | A-6 | | | | | | | | | | sandy loam, gravelly | | | | | | | | | | | | sandy loam | | | | | | | | | | | 13-22 |Coarse sandy loam, sandy|SC, SC-SM |A-1-b, A-2-4,| 0 | 0 |54-92 |52-92 |32-64 |18-41 |18-28 | 4-11 | | loam, gravelly coarse | | A-6 | | | | | | | | | | sandy loam, gravelly | | | | | | | | | | | | sandy loam | | | | | | | | | | | 22-28 |Gravelly coarse sandy |SC, GC-GM |A-2-4, A-1-a,| 0 | 0 |33-79 |29-78 |17-52 |10-34 |18-28 | 4-11 | | loam, gravelly sandy | | A-2-6 | | | | | | | | | | loam, very gravelly | | | | | | | | | | | | coarse sandy loam, very| | | | | | | | | | | | gravelly sandy loam | | | | | | | | | | | 28-44 |Gravelly sandy clay |SC, GC |A-7-6, A-2-6 | 0 | 0 |32-78 |28-77 |24-76 |13-46 |29-43 |13-24 | | loam, very gravelly | | | | | | | | | | | | sandy clay loam | | | | | | | | | | | 44-59 |Gravelly sandy clay |SC, GC |A-7-6, A-2-6 | 0 | 0 |32-78 |28-77 |24-76 |13-46 |29-43 |13-24 | | loam, very gravelly | | | | | | | | | | | | sandy clay loam | | | | | | | | | | | 59-80 |Gravelly loamy coarse |SC-SM, SC, |A-1-a, A-1-b,| 0 | 0 |33-79 |29-78 |14-50 | 5-24 | 0-28 |NP-11 | | sand, gravelly coarse | GP-GM | A-2-6 | | | | | | | | | | sand, gravelly coarse | | | | | | | | | | | | sandy loam, very | | | | | | | | | | | | gravelly coarse sandy | | | | | | | | | | | | loam, very gravelly | | | | | | | | | | | | coarse sand, very | | | | | | | | | | | | gravelly loamy coarse | | | | | | | | | | | | sand | | | | | | | | | | | | | | | | | | | | | |AuhB: | | | | | | | | | | | | Aura------------| 0-8 |Gravelly sandy loam |SC, SM |A-1-b, A-2-4 | 0 | 0 |86-92 |49-75 |37-62 |18-34 |20-37 | 3-13 | 8-12 |Gravelly sandy loam |SC, SM |A-2-4, A-1-b | 0 | 0 |86-92 |49-75 |37-62 |18-34 |20-37 | 3-13 | 12-20 |Gravelly sandy clay loam|SC |A-2-6, A-2-4,| 0 | 0 |77-92 |53-77 |40-75 |21-46 |25-44 | 9-25 | | | | A-7-6 | | | | | | | | | 20-36 |Gravelly sandy clay loam|SC |A-2-6, A-2-4,| 0 | 0 |77-93 |54-78 |41-75 |21-46 |25-44 | 9-25 | | | | A-7-6 | | | | | | | | | 36-40 |Gravelly sand, loamy |SC, SP-SM, SW|A-1-b, A-7-6 | 0 | 0 |86-100|52-100|39-100| 4-37 | 0-41 |NP-22 | | sand | | | | | | | | | | | 40-72 |Gravelly sand, loamy |SP-SM, SW, SC|A-1-b, A-7-6 | 0 | 0 |86-100|52-100|39-100| 4-37 | 0-41 |NP-22 | | sand | | | | | | | | | | | | | | | | | | | | | |
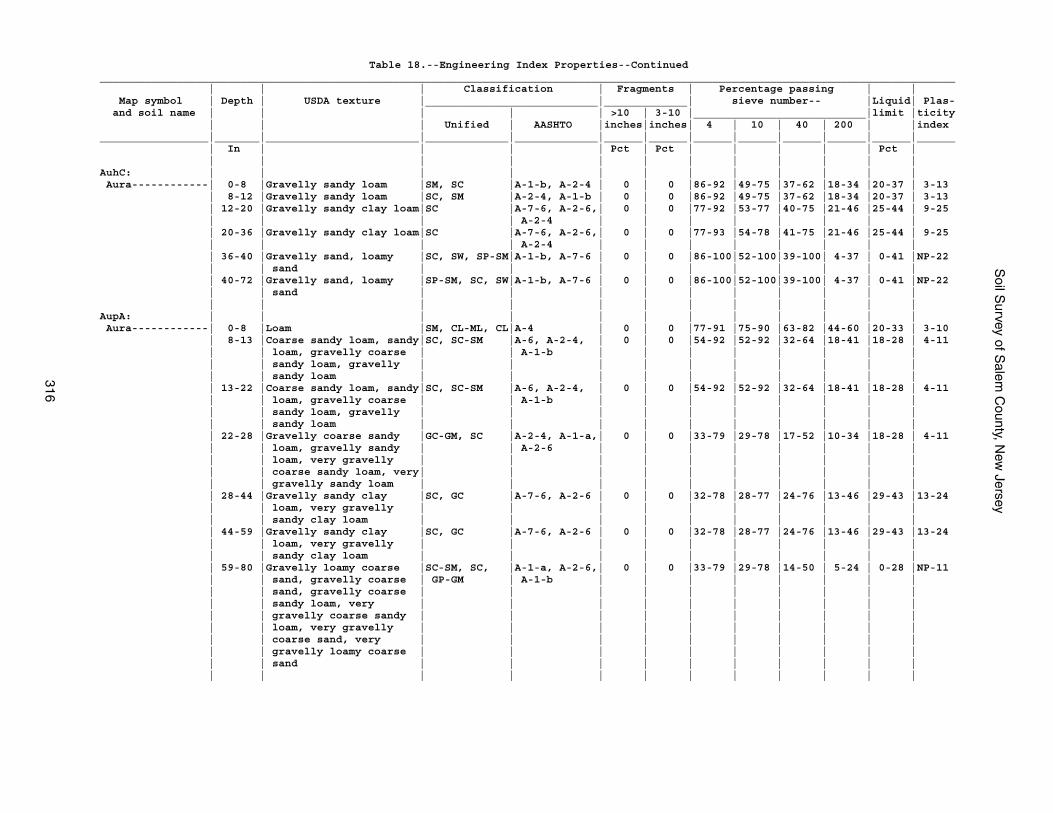
Soil S
urvey of Salem
County, N
ew Jersey
316
Table 18.--Engineering Index Properties--Continued______________________________________________________________________________________________________________________________________ | | | Classification | Fragments | Percentage passing | | Map symbol | Depth | USDA texture |___________________________|_____________| sieve number-- |Liquid| Plas- and soil name | | | | | >10 | 3-10 |___________________________|limit |ticity | | | Unified | AASHTO |inches|inches| 4 | 10 | 40 | 200 | |index_________________|_______|________________________|_____________|_____________|______|______|______|______|______|______|______|______ | In | | | | Pct | Pct | | | | | Pct | | | | | | | | | | | | |AuhC: | | | | | | | | | | | | Aura------------| 0-8 |Gravelly sandy loam |SM, SC |A-1-b, A-2-4 | 0 | 0 |86-92 |49-75 |37-62 |18-34 |20-37 | 3-13 | 8-12 |Gravelly sandy loam |SC, SM |A-2-4, A-1-b | 0 | 0 |86-92 |49-75 |37-62 |18-34 |20-37 | 3-13 | 12-20 |Gravelly sandy clay loam|SC |A-7-6, A-2-6,| 0 | 0 |77-92 |53-77 |40-75 |21-46 |25-44 | 9-25 | | | | A-2-4 | | | | | | | | | 20-36 |Gravelly sandy clay loam|SC |A-7-6, A-2-6,| 0 | 0 |77-93 |54-78 |41-75 |21-46 |25-44 | 9-25 | | | | A-2-4 | | | | | | | | | 36-40 |Gravelly sand, loamy |SC, SW, SP-SM|A-1-b, A-7-6 | 0 | 0 |86-100|52-100|39-100| 4-37 | 0-41 |NP-22 | | sand | | | | | | | | | | | 40-72 |Gravelly sand, loamy |SP-SM, SC, SW|A-1-b, A-7-6 | 0 | 0 |86-100|52-100|39-100| 4-37 | 0-41 |NP-22 | | sand | | | | | | | | | | | | | | | | | | | | | |AupA: | | | | | | | | | | | | Aura------------| 0-8 |Loam |SM, CL-ML, CL|A-4 | 0 | 0 |77-91 |75-90 |63-82 |44-60 |20-33 | 3-10 | 8-13 |Coarse sandy loam, sandy|SC, SC-SM |A-6, A-2-4, | 0 | 0 |54-92 |52-92 |32-64 |18-41 |18-28 | 4-11 | | loam, gravelly coarse | | A-1-b | | | | | | | | | | sandy loam, gravelly | | | | | | | | | | | | sandy loam | | | | | | | | | | | 13-22 |Coarse sandy loam, sandy|SC, SC-SM |A-6, A-2-4, | 0 | 0 |54-92 |52-92 |32-64 |18-41 |18-28 | 4-11 | | loam, gravelly coarse | | A-1-b | | | | | | | | | | sandy loam, gravelly | | | | | | | | | | | | sandy loam | | | | | | | | | | | 22-28 |Gravelly coarse sandy |GC-GM, SC |A-2-4, A-1-a,| 0 | 0 |33-79 |29-78 |17-52 |10-34 |18-28 | 4-11 | | loam, gravelly sandy | | A-2-6 | | | | | | | | | | loam, very gravelly | | | | | | | | | | | | coarse sandy loam, very| | | | | | | | | | | | gravelly sandy loam | | | | | | | | | | | 28-44 |Gravelly sandy clay |SC, GC |A-7-6, A-2-6 | 0 | 0 |32-78 |28-77 |24-76 |13-46 |29-43 |13-24 | | loam, very gravelly | | | | | | | | | | | | sandy clay loam | | | | | | | | | | | 44-59 |Gravelly sandy clay |SC, GC |A-7-6, A-2-6 | 0 | 0 |32-78 |28-77 |24-76 |13-46 |29-43 |13-24 | | loam, very gravelly | | | | | | | | | | | | sandy clay loam | | | | | | | | | | | 59-80 |Gravelly loamy coarse |SC-SM, SC, |A-1-a, A-2-6,| 0 | 0 |33-79 |29-78 |14-50 | 5-24 | 0-28 |NP-11 | | sand, gravelly coarse | GP-GM | A-1-b | | | | | | | | | | sand, gravelly coarse | | | | | | | | | | | | sandy loam, very | | | | | | | | | | | | gravelly coarse sandy | | | | | | | | | | | | loam, very gravelly | | | | | | | | | | | | coarse sand, very | | | | | | | | | | | | gravelly loamy coarse | | | | | | | | | | | | sand | | | | | | | | | | | | | | | | | | | | | |
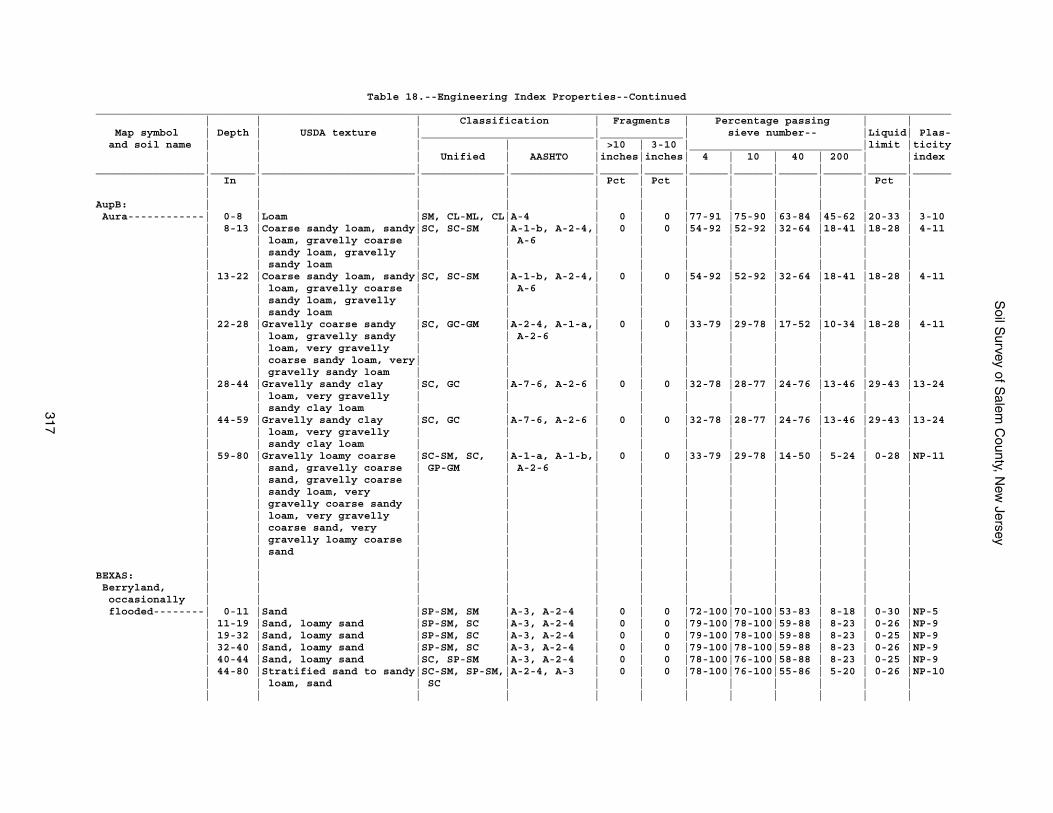
Soil S
urvey of Salem
County, N
ew Jersey
317
Table 18.--Engineering Index Properties--Continued______________________________________________________________________________________________________________________________________ | | | Classification | Fragments | Percentage passing | | Map symbol | Depth | USDA texture |___________________________|_____________| sieve number-- |Liquid| Plas- and soil name | | | | | >10 | 3-10 |___________________________|limit |ticity | | | Unified | AASHTO |inches|inches| 4 | 10 | 40 | 200 | |index_________________|_______|________________________|_____________|_____________|______|______|______|______|______|______|______|______ | In | | | | Pct | Pct | | | | | Pct | | | | | | | | | | | | |AupB: | | | | | | | | | | | | Aura------------| 0-8 |Loam |SM, CL-ML, CL|A-4 | 0 | 0 |77-91 |75-90 |63-84 |45-62 |20-33 | 3-10 | 8-13 |Coarse sandy loam, sandy|SC, SC-SM |A-1-b, A-2-4,| 0 | 0 |54-92 |52-92 |32-64 |18-41 |18-28 | 4-11 | | loam, gravelly coarse | | A-6 | | | | | | | | | | sandy loam, gravelly | | | | | | | | | | | | sandy loam | | | | | | | | | | | 13-22 |Coarse sandy loam, sandy|SC, SC-SM |A-1-b, A-2-4,| 0 | 0 |54-92 |52-92 |32-64 |18-41 |18-28 | 4-11 | | loam, gravelly coarse | | A-6 | | | | | | | | | | sandy loam, gravelly | | | | | | | | | | | | sandy loam | | | | | | | | | | | 22-28 |Gravelly coarse sandy |SC, GC-GM |A-2-4, A-1-a,| 0 | 0 |33-79 |29-78 |17-52 |10-34 |18-28 | 4-11 | | loam, gravelly sandy | | A-2-6 | | | | | | | | | | loam, very gravelly | | | | | | | | | | | | coarse sandy loam, very| | | | | | | | | | | | gravelly sandy loam | | | | | | | | | | | 28-44 |Gravelly sandy clay |SC, GC |A-7-6, A-2-6 | 0 | 0 |32-78 |28-77 |24-76 |13-46 |29-43 |13-24 | | loam, very gravelly | | | | | | | | | | | | sandy clay loam | | | | | | | | | | | 44-59 |Gravelly sandy clay |SC, GC |A-7-6, A-2-6 | 0 | 0 |32-78 |28-77 |24-76 |13-46 |29-43 |13-24 | | loam, very gravelly | | | | | | | | | | | | sandy clay loam | | | | | | | | | | | 59-80 |Gravelly loamy coarse |SC-SM, SC, |A-1-a, A-1-b,| 0 | 0 |33-79 |29-78 |14-50 | 5-24 | 0-28 |NP-11 | | sand, gravelly coarse | GP-GM | A-2-6 | | | | | | | | | | sand, gravelly coarse | | | | | | | | | | | | sandy loam, very | | | | | | | | | | | | gravelly coarse sandy | | | | | | | | | | | | loam, very gravelly | | | | | | | | | | | | coarse sand, very | | | | | | | | | | | | gravelly loamy coarse | | | | | | | | | | | | sand | | | | | | | | | | | | | | | | | | | | | |BEXAS: | | | | | | | | | | | | Berryland, | | | | | | | | | | | | occasionally | | | | | | | | | | | | flooded--------| 0-11 |Sand |SP-SM, SM |A-3, A-2-4 | 0 | 0 |72-100|70-100|53-83 | 8-18 | 0-30 |NP-5 | 11-19 |Sand, loamy sand |SP-SM, SC |A-3, A-2-4 | 0 | 0 |79-100|78-100|59-88 | 8-23 | 0-26 |NP-9 | 19-32 |Sand, loamy sand |SP-SM, SC |A-3, A-2-4 | 0 | 0 |79-100|78-100|59-88 | 8-23 | 0-25 |NP-9 | 32-40 |Sand, loamy sand |SP-SM, SC |A-3, A-2-4 | 0 | 0 |79-100|78-100|59-88 | 8-23 | 0-26 |NP-9 | 40-44 |Sand, loamy sand |SC, SP-SM |A-3, A-2-4 | 0 | 0 |78-100|76-100|58-88 | 8-23 | 0-25 |NP-9 | 44-80 |Stratified sand to sandy|SC-SM, SP-SM,|A-2-4, A-3 | 0 | 0 |78-100|76-100|55-86 | 5-20 | 0-26 |NP-10 | | loam, sand | SC | | | | | | | | | | | | | | | | | | | | |
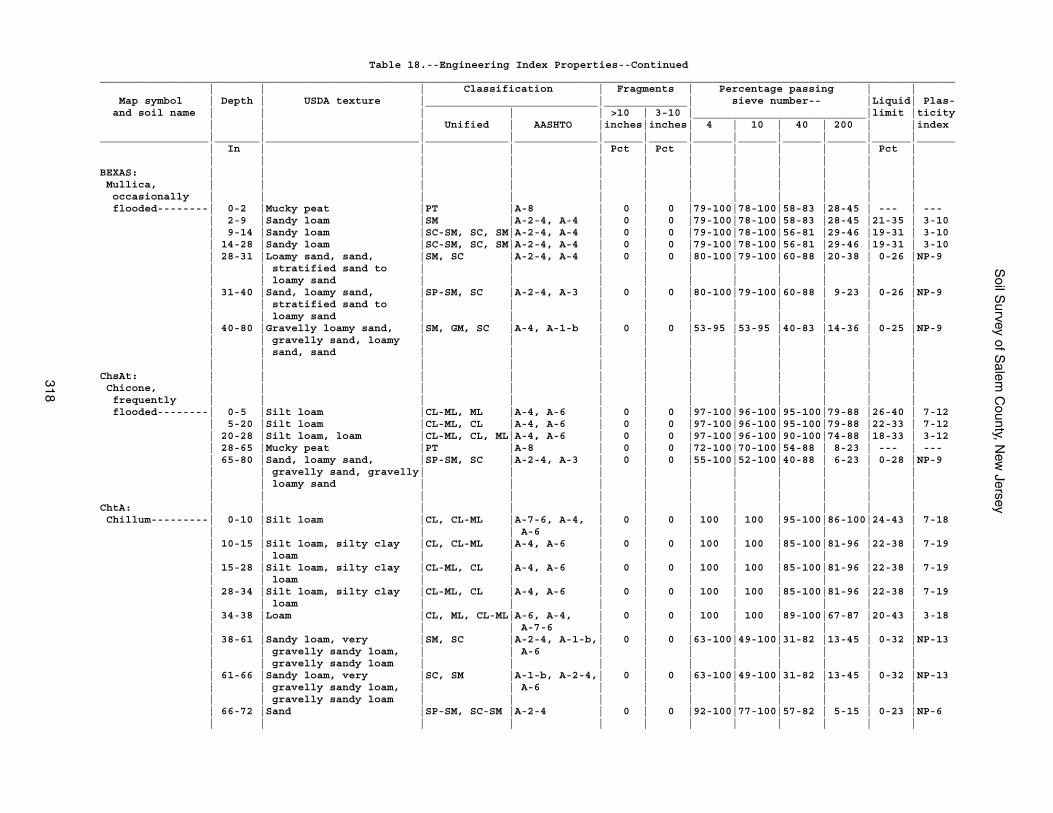
Soil S
urvey of Salem
County, N
ew Jersey
318
Table 18.--Engineering Index Properties--Continued______________________________________________________________________________________________________________________________________ | | | Classification | Fragments | Percentage passing | | Map symbol | Depth | USDA texture |___________________________|_____________| sieve number-- |Liquid| Plas- and soil name | | | | | >10 | 3-10 |___________________________|limit |ticity | | | Unified | AASHTO |inches|inches| 4 | 10 | 40 | 200 | |index_________________|_______|________________________|_____________|_____________|______|______|______|______|______|______|______|______ | In | | | | Pct | Pct | | | | | Pct | | | | | | | | | | | | |BEXAS: | | | | | | | | | | | | Mullica, | | | | | | | | | | | | occasionally | | | | | | | | | | | | flooded--------| 0-2 |Mucky peat |PT |A-8 | 0 | 0 |79-100|78-100|58-83 |28-45 | --- | --- | 2-9 |Sandy loam |SM |A-2-4, A-4 | 0 | 0 |79-100|78-100|58-83 |28-45 |21-35 | 3-10 | 9-14 |Sandy loam |SC-SM, SC, SM|A-2-4, A-4 | 0 | 0 |79-100|78-100|56-81 |29-46 |19-31 | 3-10 | 14-28 |Sandy loam |SC-SM, SC, SM|A-2-4, A-4 | 0 | 0 |79-100|78-100|56-81 |29-46 |19-31 | 3-10 | 28-31 |Loamy sand, sand, |SM, SC |A-2-4, A-4 | 0 | 0 |80-100|79-100|60-88 |20-38 | 0-26 |NP-9 | | stratified sand to | | | | | | | | | | | | loamy sand | | | | | | | | | | | 31-40 |Sand, loamy sand, |SP-SM, SC |A-2-4, A-3 | 0 | 0 |80-100|79-100|60-88 | 9-23 | 0-26 |NP-9 | | stratified sand to | | | | | | | | | | | | loamy sand | | | | | | | | | | | 40-80 |Gravelly loamy sand, |SM, GM, SC |A-4, A-1-b | 0 | 0 |53-95 |53-95 |40-83 |14-36 | 0-25 |NP-9 | | gravelly sand, loamy | | | | | | | | | | | | sand, sand | | | | | | | | | | | | | | | | | | | | | |ChsAt: | | | | | | | | | | | | Chicone, | | | | | | | | | | | | frequently | | | | | | | | | | | | flooded--------| 0-5 |Silt loam |CL-ML, ML |A-4, A-6 | 0 | 0 |97-100|96-100|95-100|79-88 |26-40 | 7-12 | 5-20 |Silt loam |CL-ML, CL |A-4, A-6 | 0 | 0 |97-100|96-100|95-100|79-88 |22-33 | 7-12 | 20-28 |Silt loam, loam |CL-ML, CL, ML|A-4, A-6 | 0 | 0 |97-100|96-100|90-100|74-88 |18-33 | 3-12 | 28-65 |Mucky peat |PT |A-8 | 0 | 0 |72-100|70-100|54-88 | 8-23 | --- | --- | 65-80 |Sand, loamy sand, |SP-SM, SC |A-2-4, A-3 | 0 | 0 |55-100|52-100|40-88 | 6-23 | 0-28 |NP-9 | | gravelly sand, gravelly| | | | | | | | | | | | loamy sand | | | | | | | | | | | | | | | | | | | | | |ChtA: | | | | | | | | | | | | Chillum---------| 0-10 |Silt loam |CL, CL-ML |A-7-6, A-4, | 0 | 0 | 100 | 100 |95-100|86-100|24-43 | 7-18 | | | | A-6 | | | | | | | | | 10-15 |Silt loam, silty clay |CL, CL-ML |A-4, A-6 | 0 | 0 | 100 | 100 |85-100|81-96 |22-38 | 7-19 | | loam | | | | | | | | | | | 15-28 |Silt loam, silty clay |CL-ML, CL |A-4, A-6 | 0 | 0 | 100 | 100 |85-100|81-96 |22-38 | 7-19 | | loam | | | | | | | | | | | 28-34 |Silt loam, silty clay |CL-ML, CL |A-4, A-6 | 0 | 0 | 100 | 100 |85-100|81-96 |22-38 | 7-19 | | loam | | | | | | | | | | | 34-38 |Loam |CL, ML, CL-ML|A-6, A-4, | 0 | 0 | 100 | 100 |89-100|67-87 |20-43 | 3-18 | | | | A-7-6 | | | | | | | | | 38-61 |Sandy loam, very |SM, SC |A-2-4, A-1-b,| 0 | 0 |63-100|49-100|31-82 |13-45 | 0-32 |NP-13 | | gravelly sandy loam, | | A-6 | | | | | | | | | | gravelly sandy loam | | | | | | | | | | | 61-66 |Sandy loam, very |SC, SM |A-1-b, A-2-4,| 0 | 0 |63-100|49-100|31-82 |13-45 | 0-32 |NP-13 | | gravelly sandy loam, | | A-6 | | | | | | | | | | gravelly sandy loam | | | | | | | | | | | 66-72 |Sand |SP-SM, SC-SM |A-2-4 | 0 | 0 |92-100|77-100|57-82 | 5-15 | 0-23 |NP-6 | | | | | | | | | | | |
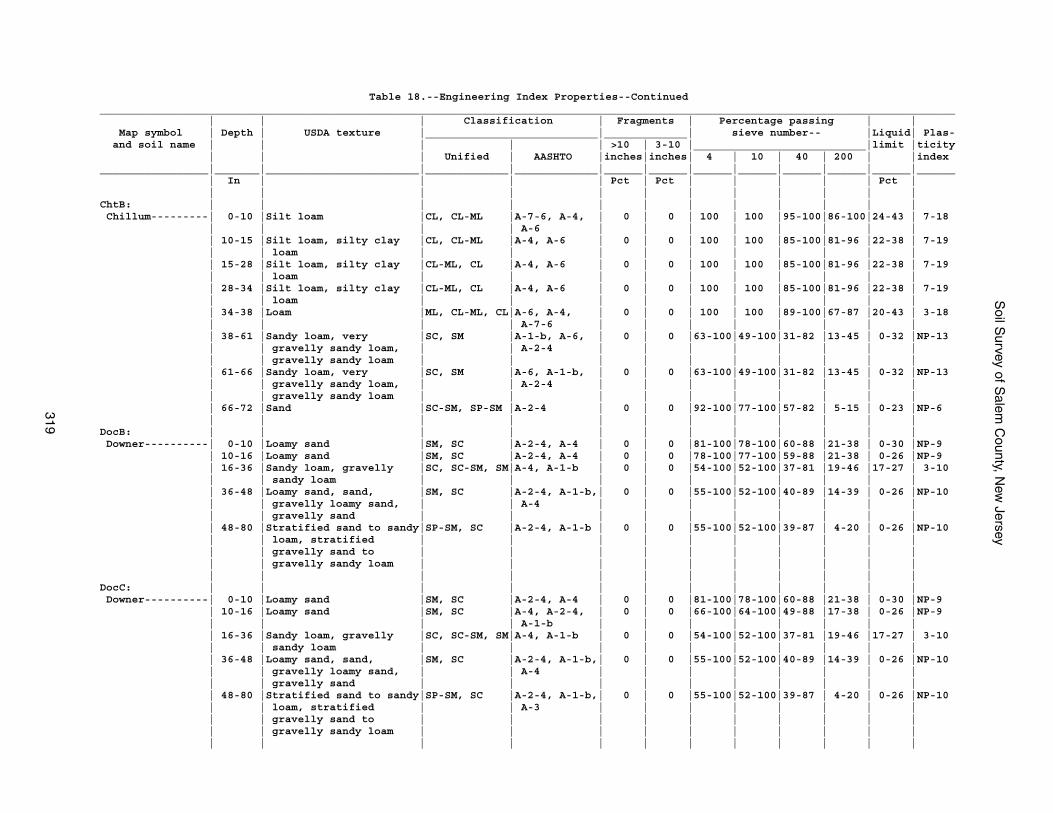
Soil S
urvey of Salem
County, N
ew Jersey
319
Table 18.--Engineering Index Properties--Continued______________________________________________________________________________________________________________________________________ | | | Classification | Fragments | Percentage passing | | Map symbol | Depth | USDA texture |___________________________|_____________| sieve number-- |Liquid| Plas- and soil name | | | | | >10 | 3-10 |___________________________|limit |ticity | | | Unified | AASHTO |inches|inches| 4 | 10 | 40 | 200 | |index_________________|_______|________________________|_____________|_____________|______|______|______|______|______|______|______|______ | In | | | | Pct | Pct | | | | | Pct | | | | | | | | | | | | |ChtB: | | | | | | | | | | | | Chillum---------| 0-10 |Silt loam |CL, CL-ML |A-7-6, A-4, | 0 | 0 | 100 | 100 |95-100|86-100|24-43 | 7-18 | | | | A-6 | | | | | | | | | 10-15 |Silt loam, silty clay |CL, CL-ML |A-4, A-6 | 0 | 0 | 100 | 100 |85-100|81-96 |22-38 | 7-19 | | loam | | | | | | | | | | | 15-28 |Silt loam, silty clay |CL-ML, CL |A-4, A-6 | 0 | 0 | 100 | 100 |85-100|81-96 |22-38 | 7-19 | | loam | | | | | | | | | | | 28-34 |Silt loam, silty clay |CL-ML, CL |A-4, A-6 | 0 | 0 | 100 | 100 |85-100|81-96 |22-38 | 7-19 | | loam | | | | | | | | | | | 34-38 |Loam |ML, CL-ML, CL|A-6, A-4, | 0 | 0 | 100 | 100 |89-100|67-87 |20-43 | 3-18 | | | | A-7-6 | | | | | | | | | 38-61 |Sandy loam, very |SC, SM |A-1-b, A-6, | 0 | 0 |63-100|49-100|31-82 |13-45 | 0-32 |NP-13 | | gravelly sandy loam, | | A-2-4 | | | | | | | | | | gravelly sandy loam | | | | | | | | | | | 61-66 |Sandy loam, very |SC, SM |A-6, A-1-b, | 0 | 0 |63-100|49-100|31-82 |13-45 | 0-32 |NP-13 | | gravelly sandy loam, | | A-2-4 | | | | | | | | | | gravelly sandy loam | | | | | | | | | | | 66-72 |Sand |SC-SM, SP-SM |A-2-4 | 0 | 0 |92-100|77-100|57-82 | 5-15 | 0-23 |NP-6 | | | | | | | | | | | |DocB: | | | | | | | | | | | | Downer----------| 0-10 |Loamy sand |SM, SC |A-2-4, A-4 | 0 | 0 |81-100|78-100|60-88 |21-38 | 0-30 |NP-9 | 10-16 |Loamy sand |SM, SC |A-2-4, A-4 | 0 | 0 |78-100|77-100|59-88 |21-38 | 0-26 |NP-9 | 16-36 |Sandy loam, gravelly |SC, SC-SM, SM|A-4, A-1-b | 0 | 0 |54-100|52-100|37-81 |19-46 |17-27 | 3-10 | | sandy loam | | | | | | | | | | | 36-48 |Loamy sand, sand, |SM, SC |A-2-4, A-1-b,| 0 | 0 |55-100|52-100|40-89 |14-39 | 0-26 |NP-10 | | gravelly loamy sand, | | A-4 | | | | | | | | | | gravelly sand | | | | | | | | | | | 48-80 |Stratified sand to sandy|SP-SM, SC |A-2-4, A-1-b | 0 | 0 |55-100|52-100|39-87 | 4-20 | 0-26 |NP-10 | | loam, stratified | | | | | | | | | | | | gravelly sand to | | | | | | | | | | | | gravelly sandy loam | | | | | | | | | | | | | | | | | | | | | |DocC: | | | | | | | | | | | | Downer----------| 0-10 |Loamy sand |SM, SC |A-2-4, A-4 | 0 | 0 |81-100|78-100|60-88 |21-38 | 0-30 |NP-9 | 10-16 |Loamy sand |SM, SC |A-4, A-2-4, | 0 | 0 |66-100|64-100|49-88 |17-38 | 0-26 |NP-9 | | | | A-1-b | | | | | | | | | 16-36 |Sandy loam, gravelly |SC, SC-SM, SM|A-4, A-1-b | 0 | 0 |54-100|52-100|37-81 |19-46 |17-27 | 3-10 | | sandy loam | | | | | | | | | | | 36-48 |Loamy sand, sand, |SM, SC |A-2-4, A-1-b,| 0 | 0 |55-100|52-100|40-89 |14-39 | 0-26 |NP-10 | | gravelly loamy sand, | | A-4 | | | | | | | | | | gravelly sand | | | | | | | | | | | 48-80 |Stratified sand to sandy|SP-SM, SC |A-2-4, A-1-b,| 0 | 0 |55-100|52-100|39-87 | 4-20 | 0-26 |NP-10 | | loam, stratified | | A-3 | | | | | | | | | | gravelly sand to | | | | | | | | | | | | gravelly sandy loam | | | | | | | | | | | | | | | | | | | | | |
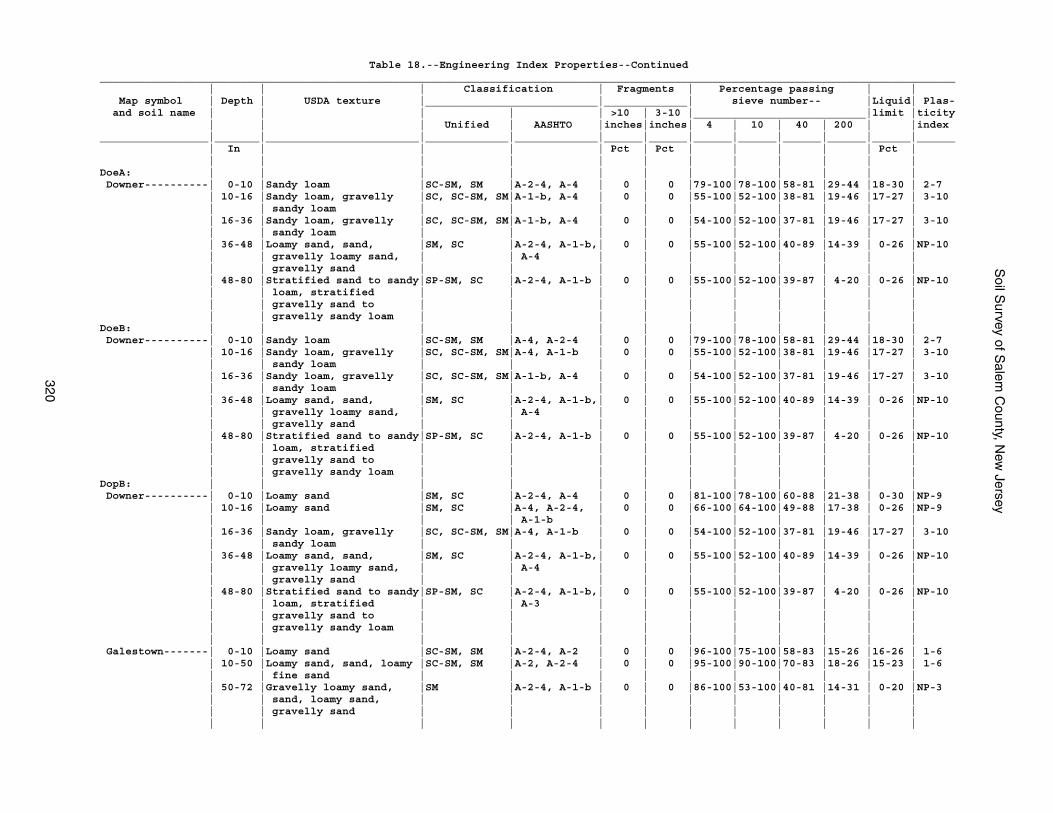
Soil S
urvey of Salem
County, N
ew Jersey
320
Table 18.--Engineering Index Properties--Continued______________________________________________________________________________________________________________________________________ | | | Classification | Fragments | Percentage passing | | Map symbol | Depth | USDA texture |___________________________|_____________| sieve number-- |Liquid| Plas- and soil name | | | | | >10 | 3-10 |___________________________|limit |ticity | | | Unified | AASHTO |inches|inches| 4 | 10 | 40 | 200 | |index_________________|_______|________________________|_____________|_____________|______|______|______|______|______|______|______|______ | In | | | | Pct | Pct | | | | | Pct | | | | | | | | | | | | |DoeA: | | | | | | | | | | | | Downer----------| 0-10 |Sandy loam |SC-SM, SM |A-2-4, A-4 | 0 | 0 |79-100|78-100|58-81 |29-44 |18-30 | 2-7 | 10-16 |Sandy loam, gravelly |SC, SC-SM, SM|A-1-b, A-4 | 0 | 0 |55-100|52-100|38-81 |19-46 |17-27 | 3-10 | | sandy loam | | | | | | | | | | | 16-36 |Sandy loam, gravelly |SC, SC-SM, SM|A-1-b, A-4 | 0 | 0 |54-100|52-100|37-81 |19-46 |17-27 | 3-10 | | sandy loam | | | | | | | | | | | 36-48 |Loamy sand, sand, |SM, SC |A-2-4, A-1-b,| 0 | 0 |55-100|52-100|40-89 |14-39 | 0-26 |NP-10 | | gravelly loamy sand, | | A-4 | | | | | | | | | | gravelly sand | | | | | | | | | | | 48-80 |Stratified sand to sandy|SP-SM, SC |A-2-4, A-1-b | 0 | 0 |55-100|52-100|39-87 | 4-20 | 0-26 |NP-10 | | loam, stratified | | | | | | | | | | | | gravelly sand to | | | | | | | | | | | | gravelly sandy loam | | | | | | | | | |DoeB: | | | | | | | | | | | | Downer----------| 0-10 |Sandy loam |SC-SM, SM |A-4, A-2-4 | 0 | 0 |79-100|78-100|58-81 |29-44 |18-30 | 2-7 | 10-16 |Sandy loam, gravelly |SC, SC-SM, SM|A-4, A-1-b | 0 | 0 |55-100|52-100|38-81 |19-46 |17-27 | 3-10 | | sandy loam | | | | | | | | | | | 16-36 |Sandy loam, gravelly |SC, SC-SM, SM|A-1-b, A-4 | 0 | 0 |54-100|52-100|37-81 |19-46 |17-27 | 3-10 | | sandy loam | | | | | | | | | | | 36-48 |Loamy sand, sand, |SM, SC |A-2-4, A-1-b,| 0 | 0 |55-100|52-100|40-89 |14-39 | 0-26 |NP-10 | | gravelly loamy sand, | | A-4 | | | | | | | | | | gravelly sand | | | | | | | | | | | 48-80 |Stratified sand to sandy|SP-SM, SC |A-2-4, A-1-b | 0 | 0 |55-100|52-100|39-87 | 4-20 | 0-26 |NP-10 | | loam, stratified | | | | | | | | | | | | gravelly sand to | | | | | | | | | | | | gravelly sandy loam | | | | | | | | | |DopB: | | | | | | | | | | | | Downer----------| 0-10 |Loamy sand |SM, SC |A-2-4, A-4 | 0 | 0 |81-100|78-100|60-88 |21-38 | 0-30 |NP-9 | 10-16 |Loamy sand |SM, SC |A-4, A-2-4, | 0 | 0 |66-100|64-100|49-88 |17-38 | 0-26 |NP-9 | | | | A-1-b | | | | | | | | | 16-36 |Sandy loam, gravelly |SC, SC-SM, SM|A-4, A-1-b | 0 | 0 |54-100|52-100|37-81 |19-46 |17-27 | 3-10 | | sandy loam | | | | | | | | | | | 36-48 |Loamy sand, sand, |SM, SC |A-2-4, A-1-b,| 0 | 0 |55-100|52-100|40-89 |14-39 | 0-26 |NP-10 | | gravelly loamy sand, | | A-4 | | | | | | | | | | gravelly sand | | | | | | | | | | | 48-80 |Stratified sand to sandy|SP-SM, SC |A-2-4, A-1-b,| 0 | 0 |55-100|52-100|39-87 | 4-20 | 0-26 |NP-10 | | loam, stratified | | A-3 | | | | | | | | | | gravelly sand to | | | | | | | | | | | | gravelly sandy loam | | | | | | | | | | | | | | | | | | | | | | Galestown-------| 0-10 |Loamy sand |SC-SM, SM |A-2-4, A-2 | 0 | 0 |96-100|75-100|58-83 |15-26 |16-26 | 1-6 | 10-50 |Loamy sand, sand, loamy |SC-SM, SM |A-2, A-2-4 | 0 | 0 |95-100|90-100|70-83 |18-26 |15-23 | 1-6 | | fine sand | | | | | | | | | | | 50-72 |Gravelly loamy sand, |SM |A-2-4, A-1-b | 0 | 0 |86-100|53-100|40-81 |14-31 | 0-20 |NP-3 | | sand, loamy sand, | | | | | | | | | | | | gravelly sand | | | | | | | | | | | | | | | | | | | | | |
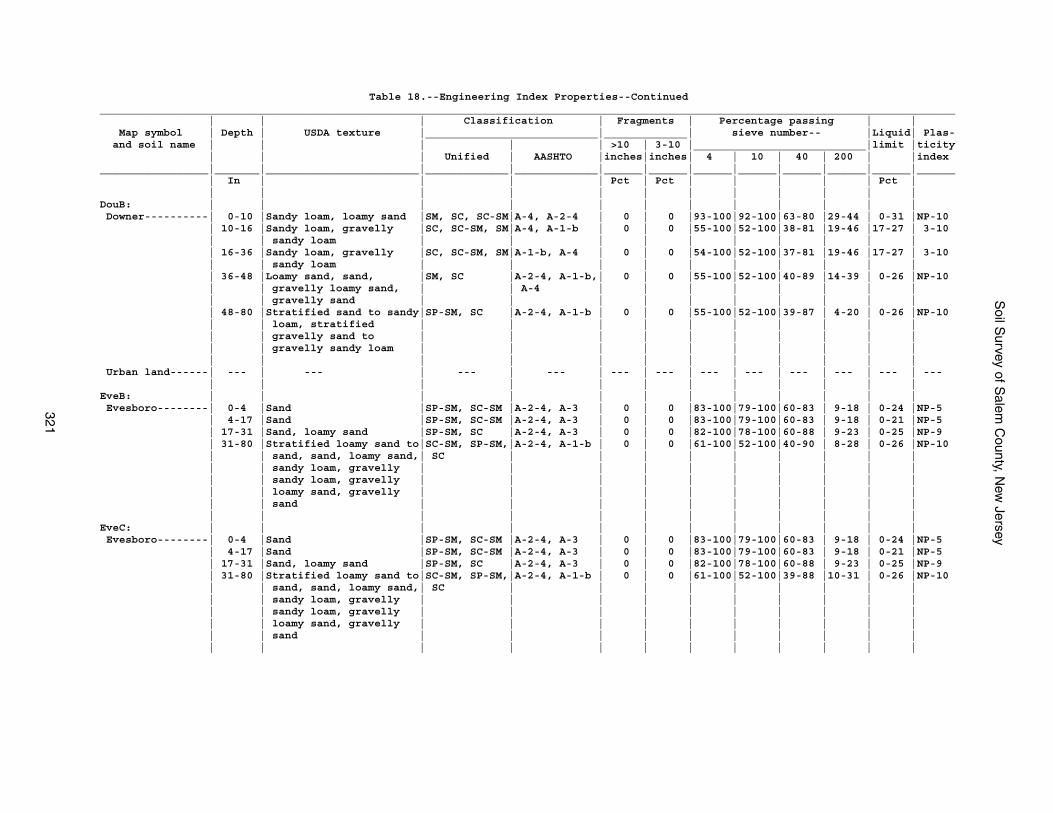
Soil S
urvey of Salem
County, N
ew Jersey
321
Table 18.--Engineering Index Properties--Continued______________________________________________________________________________________________________________________________________ | | | Classification | Fragments | Percentage passing | | Map symbol | Depth | USDA texture |___________________________|_____________| sieve number-- |Liquid| Plas- and soil name | | | | | >10 | 3-10 |___________________________|limit |ticity | | | Unified | AASHTO |inches|inches| 4 | 10 | 40 | 200 | |index_________________|_______|________________________|_____________|_____________|______|______|______|______|______|______|______|______ | In | | | | Pct | Pct | | | | | Pct | | | | | | | | | | | | |DouB: | | | | | | | | | | | | Downer----------| 0-10 |Sandy loam, loamy sand |SM, SC, SC-SM|A-4, A-2-4 | 0 | 0 |93-100|92-100|63-80 |29-44 | 0-31 |NP-10 | 10-16 |Sandy loam, gravelly |SC, SC-SM, SM|A-4, A-1-b | 0 | 0 |55-100|52-100|38-81 |19-46 |17-27 | 3-10 | | sandy loam | | | | | | | | | | | 16-36 |Sandy loam, gravelly |SC, SC-SM, SM|A-1-b, A-4 | 0 | 0 |54-100|52-100|37-81 |19-46 |17-27 | 3-10 | | sandy loam | | | | | | | | | | | 36-48 |Loamy sand, sand, |SM, SC |A-2-4, A-1-b,| 0 | 0 |55-100|52-100|40-89 |14-39 | 0-26 |NP-10 | | gravelly loamy sand, | | A-4 | | | | | | | | | | gravelly sand | | | | | | | | | | | 48-80 |Stratified sand to sandy|SP-SM, SC |A-2-4, A-1-b | 0 | 0 |55-100|52-100|39-87 | 4-20 | 0-26 |NP-10 | | loam, stratified | | | | | | | | | | | | gravelly sand to | | | | | | | | | | | | gravelly sandy loam | | | | | | | | | | | | | | | | | | | | | | Urban land------| --- | --- | --- | --- | --- | --- | --- | --- | --- | --- | --- | --- | | | | | | | | | | | |EveB: | | | | | | | | | | | | Evesboro--------| 0-4 |Sand |SP-SM, SC-SM |A-2-4, A-3 | 0 | 0 |83-100|79-100|60-83 | 9-18 | 0-24 |NP-5 | 4-17 |Sand |SP-SM, SC-SM |A-2-4, A-3 | 0 | 0 |83-100|79-100|60-83 | 9-18 | 0-21 |NP-5 | 17-31 |Sand, loamy sand |SP-SM, SC |A-2-4, A-3 | 0 | 0 |82-100|78-100|60-88 | 9-23 | 0-25 |NP-9 | 31-80 |Stratified loamy sand to|SC-SM, SP-SM,|A-2-4, A-1-b | 0 | 0 |61-100|52-100|40-90 | 8-28 | 0-26 |NP-10 | | sand, sand, loamy sand,| SC | | | | | | | | | | | sandy loam, gravelly | | | | | | | | | | | | sandy loam, gravelly | | | | | | | | | | | | loamy sand, gravelly | | | | | | | | | | | | sand | | | | | | | | | | | | | | | | | | | | | |EveC: | | | | | | | | | | | | Evesboro--------| 0-4 |Sand |SP-SM, SC-SM |A-2-4, A-3 | 0 | 0 |83-100|79-100|60-83 | 9-18 | 0-24 |NP-5 | 4-17 |Sand |SP-SM, SC-SM |A-2-4, A-3 | 0 | 0 |83-100|79-100|60-83 | 9-18 | 0-21 |NP-5 | 17-31 |Sand, loamy sand |SP-SM, SC |A-2-4, A-3 | 0 | 0 |82-100|78-100|60-88 | 9-23 | 0-25 |NP-9 | 31-80 |Stratified loamy sand to|SC-SM, SP-SM,|A-2-4, A-1-b | 0 | 0 |61-100|52-100|39-88 |10-31 | 0-26 |NP-10 | | sand, sand, loamy sand,| SC | | | | | | | | | | | sandy loam, gravelly | | | | | | | | | | | | sandy loam, gravelly | | | | | | | | | | | | loamy sand, gravelly | | | | | | | | | | | | sand | | | | | | | | | | | | | | | | | | | | | |
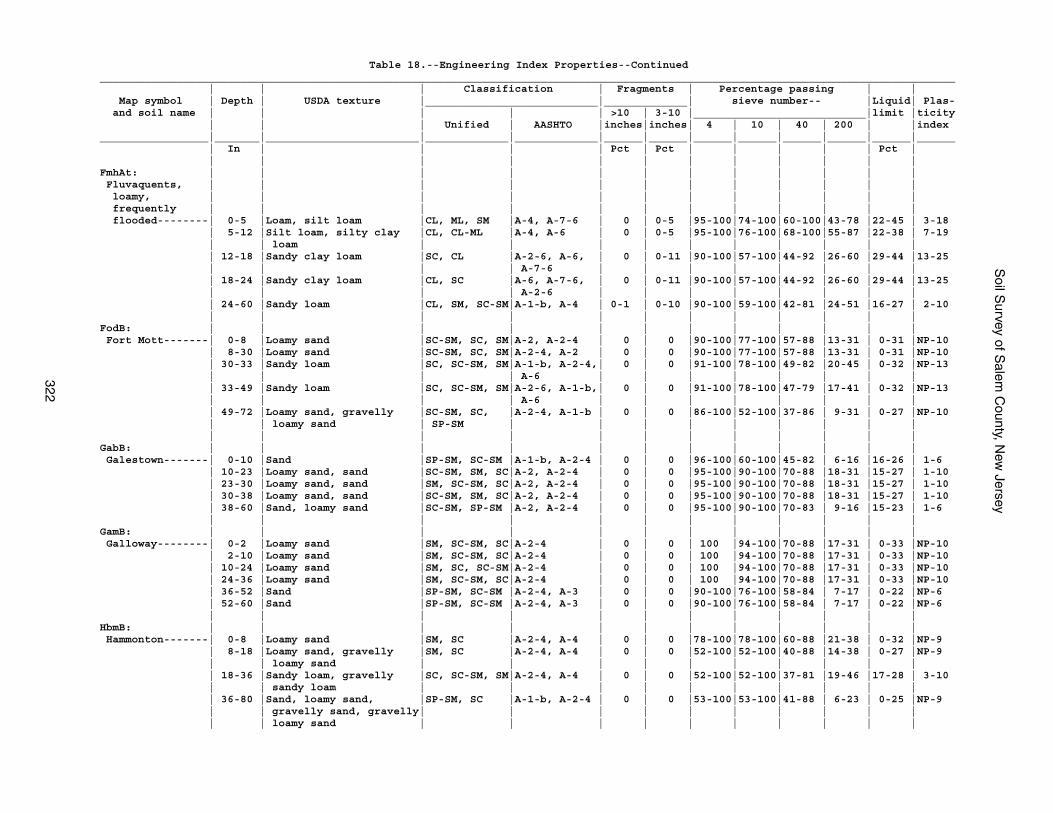
Soil S
urvey of Salem
County, N
ew Jersey
322
Table 18.--Engineering Index Properties--Continued______________________________________________________________________________________________________________________________________ | | | Classification | Fragments | Percentage passing | | Map symbol | Depth | USDA texture |___________________________|_____________| sieve number-- |Liquid| Plas- and soil name | | | | | >10 | 3-10 |___________________________|limit |ticity | | | Unified | AASHTO |inches|inches| 4 | 10 | 40 | 200 | |index_________________|_______|________________________|_____________|_____________|______|______|______|______|______|______|______|______ | In | | | | Pct | Pct | | | | | Pct | | | | | | | | | | | | |FmhAt: | | | | | | | | | | | | Fluvaquents, | | | | | | | | | | | | loamy, | | | | | | | | | | | | frequently | | | | | | | | | | | | flooded--------| 0-5 |Loam, silt loam |CL, ML, SM |A-4, A-7-6 | 0 | 0-5 |95-100|74-100|60-100|43-78 |22-45 | 3-18 | 5-12 |Silt loam, silty clay |CL, CL-ML |A-4, A-6 | 0 | 0-5 |95-100|76-100|68-100|55-87 |22-38 | 7-19 | | loam | | | | | | | | | | | 12-18 |Sandy clay loam |SC, CL |A-2-6, A-6, | 0 | 0-11 |90-100|57-100|44-92 |26-60 |29-44 |13-25 | | | | A-7-6 | | | | | | | | | 18-24 |Sandy clay loam |CL, SC |A-6, A-7-6, | 0 | 0-11 |90-100|57-100|44-92 |26-60 |29-44 |13-25 | | | | A-2-6 | | | | | | | | | 24-60 |Sandy loam |CL, SM, SC-SM|A-1-b, A-4 | 0-1 | 0-10 |90-100|59-100|42-81 |24-51 |16-27 | 2-10 | | | | | | | | | | | |FodB: | | | | | | | | | | | | Fort Mott-------| 0-8 |Loamy sand |SC-SM, SC, SM|A-2, A-2-4 | 0 | 0 |90-100|77-100|57-88 |13-31 | 0-31 |NP-10 | 8-30 |Loamy sand |SC-SM, SC, SM|A-2-4, A-2 | 0 | 0 |90-100|77-100|57-88 |13-31 | 0-31 |NP-10 | 30-33 |Sandy loam |SC, SC-SM, SM|A-1-b, A-2-4,| 0 | 0 |91-100|78-100|49-82 |20-45 | 0-32 |NP-13 | | | | A-6 | | | | | | | | | 33-49 |Sandy loam |SC, SC-SM, SM|A-2-6, A-1-b,| 0 | 0 |91-100|78-100|47-79 |17-41 | 0-32 |NP-13 | | | | A-6 | | | | | | | | | 49-72 |Loamy sand, gravelly |SC-SM, SC, |A-2-4, A-1-b | 0 | 0 |86-100|52-100|37-86 | 9-31 | 0-27 |NP-10 | | loamy sand | SP-SM | | | | | | | | | | | | | | | | | | | | |GabB: | | | | | | | | | | | | Galestown-------| 0-10 |Sand |SP-SM, SC-SM |A-1-b, A-2-4 | 0 | 0 |96-100|60-100|45-82 | 6-16 |16-26 | 1-6 | 10-23 |Loamy sand, sand |SC-SM, SM, SC|A-2, A-2-4 | 0 | 0 |95-100|90-100|70-88 |18-31 |15-27 | 1-10 | 23-30 |Loamy sand, sand |SM, SC-SM, SC|A-2, A-2-4 | 0 | 0 |95-100|90-100|70-88 |18-31 |15-27 | 1-10 | 30-38 |Loamy sand, sand |SC-SM, SM, SC|A-2, A-2-4 | 0 | 0 |95-100|90-100|70-88 |18-31 |15-27 | 1-10 | 38-60 |Sand, loamy sand |SC-SM, SP-SM |A-2, A-2-4 | 0 | 0 |95-100|90-100|70-83 | 9-16 |15-23 | 1-6 | | | | | | | | | | | |GamB: | | | | | | | | | | | | Galloway--------| 0-2 |Loamy sand |SM, SC-SM, SC|A-2-4 | 0 | 0 | 100 |94-100|70-88 |17-31 | 0-33 |NP-10 | 2-10 |Loamy sand |SM, SC-SM, SC|A-2-4 | 0 | 0 | 100 |94-100|70-88 |17-31 | 0-33 |NP-10 | 10-24 |Loamy sand |SM, SC, SC-SM|A-2-4 | 0 | 0 | 100 |94-100|70-88 |17-31 | 0-33 |NP-10 | 24-36 |Loamy sand |SM, SC-SM, SC|A-2-4 | 0 | 0 | 100 |94-100|70-88 |17-31 | 0-33 |NP-10 | 36-52 |Sand |SP-SM, SC-SM |A-2-4, A-3 | 0 | 0 |90-100|76-100|58-84 | 7-17 | 0-22 |NP-6 | 52-60 |Sand |SP-SM, SC-SM |A-2-4, A-3 | 0 | 0 |90-100|76-100|58-84 | 7-17 | 0-22 |NP-6 | | | | | | | | | | | |HbmB: | | | | | | | | | | | | Hammonton-------| 0-8 |Loamy sand |SM, SC |A-2-4, A-4 | 0 | 0 |78-100|78-100|60-88 |21-38 | 0-32 |NP-9 | 8-18 |Loamy sand, gravelly |SM, SC |A-2-4, A-4 | 0 | 0 |52-100|52-100|40-88 |14-38 | 0-27 |NP-9 | | loamy sand | | | | | | | | | | | 18-36 |Sandy loam, gravelly |SC, SC-SM, SM|A-2-4, A-4 | 0 | 0 |52-100|52-100|37-81 |19-46 |17-28 | 3-10 | | sandy loam | | | | | | | | | | | 36-80 |Sand, loamy sand, |SP-SM, SC |A-1-b, A-2-4 | 0 | 0 |53-100|53-100|41-88 | 6-23 | 0-25 |NP-9 | | gravelly sand, gravelly| | | | | | | | | | | | loamy sand | | | | | | | | | |
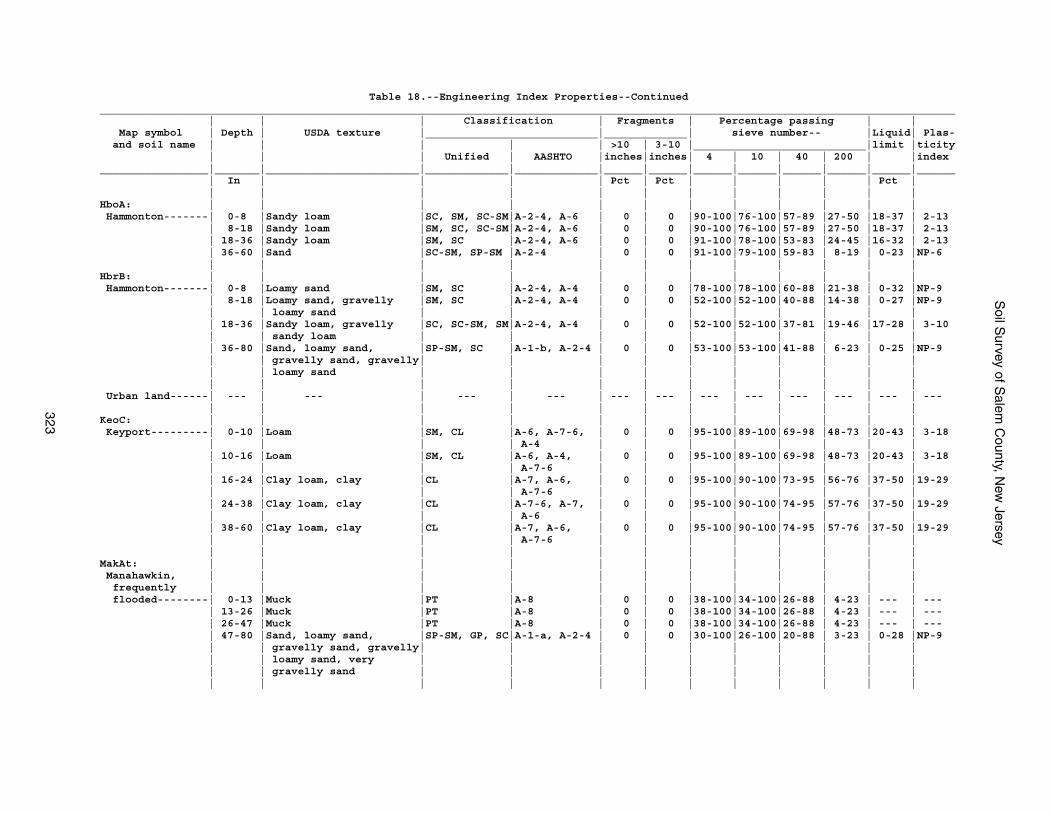
Soil S
urvey of Salem
County, N
ew Jersey
323
Table 18.--Engineering Index Properties--Continued______________________________________________________________________________________________________________________________________ | | | Classification | Fragments | Percentage passing | | Map symbol | Depth | USDA texture |___________________________|_____________| sieve number-- |Liquid| Plas- and soil name | | | | | >10 | 3-10 |___________________________|limit |ticity | | | Unified | AASHTO |inches|inches| 4 | 10 | 40 | 200 | |index_________________|_______|________________________|_____________|_____________|______|______|______|______|______|______|______|______ | In | | | | Pct | Pct | | | | | Pct | | | | | | | | | | | | |HboA: | | | | | | | | | | | | Hammonton-------| 0-8 |Sandy loam |SC, SM, SC-SM|A-2-4, A-6 | 0 | 0 |90-100|76-100|57-89 |27-50 |18-37 | 2-13 | 8-18 |Sandy loam |SM, SC, SC-SM|A-2-4, A-6 | 0 | 0 |90-100|76-100|57-89 |27-50 |18-37 | 2-13 | 18-36 |Sandy loam |SM, SC |A-2-4, A-6 | 0 | 0 |91-100|78-100|53-83 |24-45 |16-32 | 2-13 | 36-60 |Sand |SC-SM, SP-SM |A-2-4 | 0 | 0 |91-100|79-100|59-83 | 8-19 | 0-23 |NP-6 | | | | | | | | | | | |HbrB: | | | | | | | | | | | | Hammonton-------| 0-8 |Loamy sand |SM, SC |A-2-4, A-4 | 0 | 0 |78-100|78-100|60-88 |21-38 | 0-32 |NP-9 | 8-18 |Loamy sand, gravelly |SM, SC |A-2-4, A-4 | 0 | 0 |52-100|52-100|40-88 |14-38 | 0-27 |NP-9 | | loamy sand | | | | | | | | | | | 18-36 |Sandy loam, gravelly |SC, SC-SM, SM|A-2-4, A-4 | 0 | 0 |52-100|52-100|37-81 |19-46 |17-28 | 3-10 | | sandy loam | | | | | | | | | | | 36-80 |Sand, loamy sand, |SP-SM, SC |A-1-b, A-2-4 | 0 | 0 |53-100|53-100|41-88 | 6-23 | 0-25 |NP-9 | | gravelly sand, gravelly| | | | | | | | | | | | loamy sand | | | | | | | | | | | | | | | | | | | | | | Urban land------| --- | --- | --- | --- | --- | --- | --- | --- | --- | --- | --- | --- | | | | | | | | | | | |KeoC: | | | | | | | | | | | | Keyport---------| 0-10 |Loam |SM, CL |A-6, A-7-6, | 0 | 0 |95-100|89-100|69-98 |48-73 |20-43 | 3-18 | | | | A-4 | | | | | | | | | 10-16 |Loam |SM, CL |A-6, A-4, | 0 | 0 |95-100|89-100|69-98 |48-73 |20-43 | 3-18 | | | | A-7-6 | | | | | | | | | 16-24 |Clay loam, clay |CL |A-7, A-6, | 0 | 0 |95-100|90-100|73-95 |56-76 |37-50 |19-29 | | | | A-7-6 | | | | | | | | | 24-38 |Clay loam, clay |CL |A-7-6, A-7, | 0 | 0 |95-100|90-100|74-95 |57-76 |37-50 |19-29 | | | | A-6 | | | | | | | | | 38-60 |Clay loam, clay |CL |A-7, A-6, | 0 | 0 |95-100|90-100|74-95 |57-76 |37-50 |19-29 | | | | A-7-6 | | | | | | | | | | | | | | | | | | | |MakAt: | | | | | | | | | | | | Manahawkin, | | | | | | | | | | | | frequently | | | | | | | | | | | | flooded--------| 0-13 |Muck |PT |A-8 | 0 | 0 |38-100|34-100|26-88 | 4-23 | --- | --- | 13-26 |Muck |PT |A-8 | 0 | 0 |38-100|34-100|26-88 | 4-23 | --- | --- | 26-47 |Muck |PT |A-8 | 0 | 0 |38-100|34-100|26-88 | 4-23 | --- | --- | 47-80 |Sand, loamy sand, |SP-SM, GP, SC|A-1-a, A-2-4 | 0 | 0 |30-100|26-100|20-88 | 3-23 | 0-28 |NP-9 | | gravelly sand, gravelly| | | | | | | | | | | | loamy sand, very | | | | | | | | | | | | gravelly sand | | | | | | | | | | | | | | | | | | | | | |
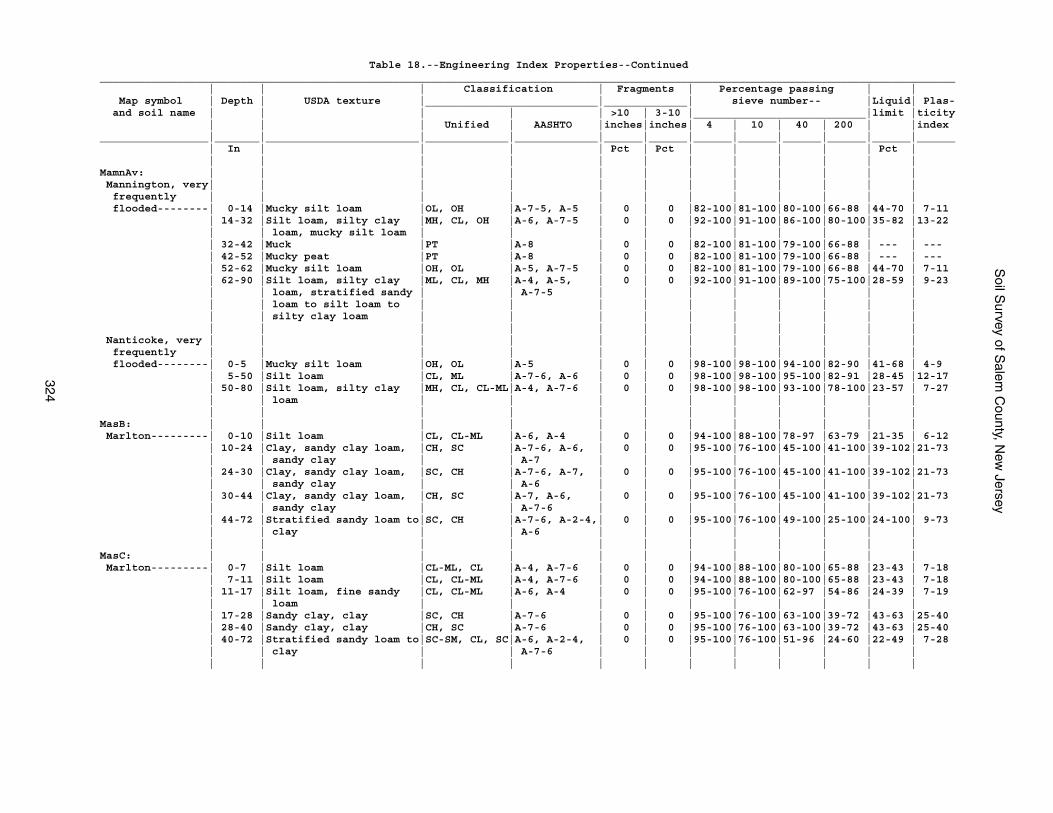
Soil S
urvey of Salem
County, N
ew Jersey
324
Table 18.--Engineering Index Properties--Continued______________________________________________________________________________________________________________________________________ | | | Classification | Fragments | Percentage passing | | Map symbol | Depth | USDA texture |___________________________|_____________| sieve number-- |Liquid| Plas- and soil name | | | | | >10 | 3-10 |___________________________|limit |ticity | | | Unified | AASHTO |inches|inches| 4 | 10 | 40 | 200 | |index_________________|_______|________________________|_____________|_____________|______|______|______|______|______|______|______|______ | In | | | | Pct | Pct | | | | | Pct | | | | | | | | | | | | |MamnAv: | | | | | | | | | | | | Mannington, very| | | | | | | | | | | | frequently | | | | | | | | | | | | flooded--------| 0-14 |Mucky silt loam |OL, OH |A-7-5, A-5 | 0 | 0 |82-100|81-100|80-100|66-88 |44-70 | 7-11 | 14-32 |Silt loam, silty clay |MH, CL, OH |A-6, A-7-5 | 0 | 0 |92-100|91-100|86-100|80-100|35-82 |13-22 | | loam, mucky silt loam | | | | | | | | | | | 32-42 |Muck |PT |A-8 | 0 | 0 |82-100|81-100|79-100|66-88 | --- | --- | 42-52 |Mucky peat |PT |A-8 | 0 | 0 |82-100|81-100|79-100|66-88 | --- | --- | 52-62 |Mucky silt loam |OH, OL |A-5, A-7-5 | 0 | 0 |82-100|81-100|79-100|66-88 |44-70 | 7-11 | 62-90 |Silt loam, silty clay |ML, CL, MH |A-4, A-5, | 0 | 0 |92-100|91-100|89-100|75-100|28-59 | 9-23 | | loam, stratified sandy | | A-7-5 | | | | | | | | | | loam to silt loam to | | | | | | | | | | | | silty clay loam | | | | | | | | | | | | | | | | | | | | | | Nanticoke, very | | | | | | | | | | | | frequently | | | | | | | | | | | | flooded--------| 0-5 |Mucky silt loam |OH, OL |A-5 | 0 | 0 |98-100|98-100|94-100|82-90 |41-68 | 4-9 | 5-50 |Silt loam |CL, ML |A-7-6, A-6 | 0 | 0 |98-100|98-100|95-100|82-91 |28-45 |12-17 | 50-80 |Silt loam, silty clay |MH, CL, CL-ML|A-4, A-7-6 | 0 | 0 |98-100|98-100|93-100|78-100|23-57 | 7-27 | | loam | | | | | | | | | | | | | | | | | | | | | |MasB: | | | | | | | | | | | | Marlton---------| 0-10 |Silt loam |CL, CL-ML |A-6, A-4 | 0 | 0 |94-100|88-100|78-97 |63-79 |21-35 | 6-12 | 10-24 |Clay, sandy clay loam, |CH, SC |A-7-6, A-6, | 0 | 0 |95-100|76-100|45-100|41-100|39-102|21-73 | | sandy clay | | A-7 | | | | | | | | | 24-30 |Clay, sandy clay loam, |SC, CH |A-7-6, A-7, | 0 | 0 |95-100|76-100|45-100|41-100|39-102|21-73 | | sandy clay | | A-6 | | | | | | | | | 30-44 |Clay, sandy clay loam, |CH, SC |A-7, A-6, | 0 | 0 |95-100|76-100|45-100|41-100|39-102|21-73 | | sandy clay | | A-7-6 | | | | | | | | | 44-72 |Stratified sandy loam to|SC, CH |A-7-6, A-2-4,| 0 | 0 |95-100|76-100|49-100|25-100|24-100| 9-73 | | clay | | A-6 | | | | | | | | | | | | | | | | | | | |MasC: | | | | | | | | | | | | Marlton---------| 0-7 |Silt loam |CL-ML, CL |A-4, A-7-6 | 0 | 0 |94-100|88-100|80-100|65-88 |23-43 | 7-18 | 7-11 |Silt loam |CL, CL-ML |A-4, A-7-6 | 0 | 0 |94-100|88-100|80-100|65-88 |23-43 | 7-18 | 11-17 |Silt loam, fine sandy |CL, CL-ML |A-6, A-4 | 0 | 0 |95-100|76-100|62-97 |54-86 |24-39 | 7-19 | | loam | | | | | | | | | | | 17-28 |Sandy clay, clay |SC, CH |A-7-6 | 0 | 0 |95-100|76-100|63-100|39-72 |43-63 |25-40 | 28-40 |Sandy clay, clay |CH, SC |A-7-6 | 0 | 0 |95-100|76-100|63-100|39-72 |43-63 |25-40 | 40-72 |Stratified sandy loam to|SC-SM, CL, SC|A-6, A-2-4, | 0 | 0 |95-100|76-100|51-96 |24-60 |22-49 | 7-28 | | clay | | A-7-6 | | | | | | | | | | | | | | | | | | | |
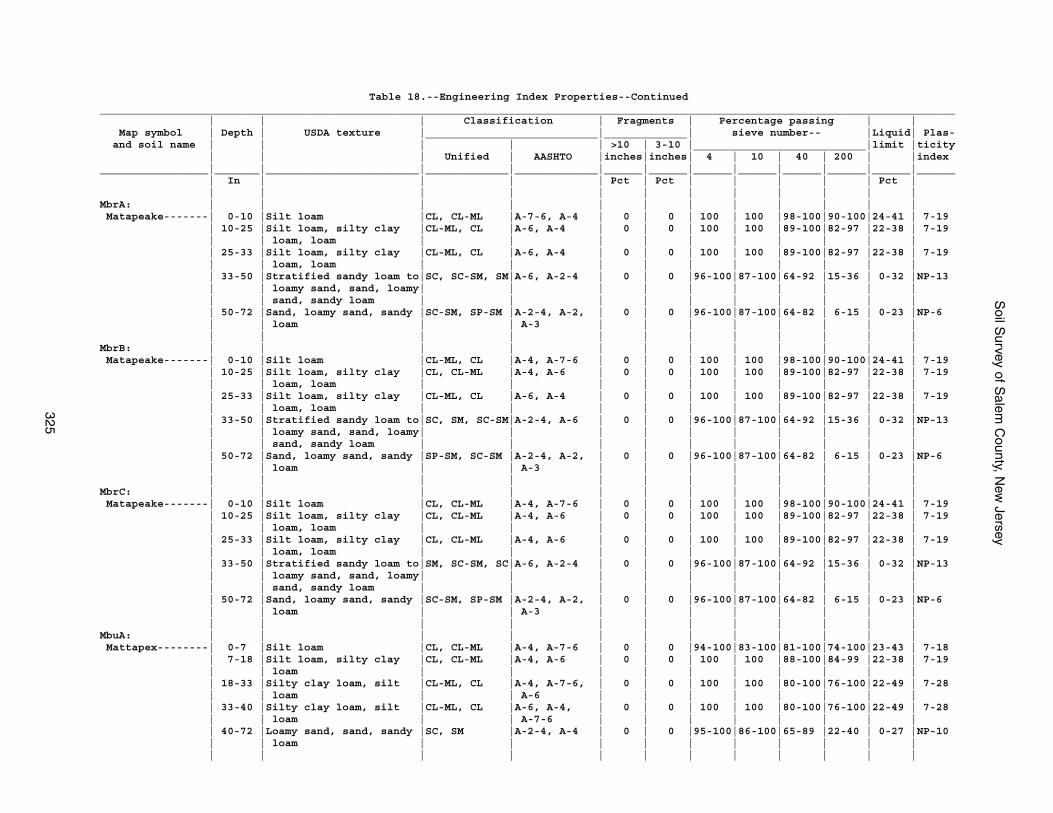
Soil S
urvey of Salem
County, N
ew Jersey
325
Table 18.--Engineering Index Properties--Continued______________________________________________________________________________________________________________________________________ | | | Classification | Fragments | Percentage passing | | Map symbol | Depth | USDA texture |___________________________|_____________| sieve number-- |Liquid| Plas- and soil name | | | | | >10 | 3-10 |___________________________|limit |ticity | | | Unified | AASHTO |inches|inches| 4 | 10 | 40 | 200 | |index_________________|_______|________________________|_____________|_____________|______|______|______|______|______|______|______|______ | In | | | | Pct | Pct | | | | | Pct | | | | | | | | | | | | |MbrA: | | | | | | | | | | | | Matapeake-------| 0-10 |Silt loam |CL, CL-ML |A-7-6, A-4 | 0 | 0 | 100 | 100 |98-100|90-100|24-41 | 7-19 | 10-25 |Silt loam, silty clay |CL-ML, CL |A-6, A-4 | 0 | 0 | 100 | 100 |89-100|82-97 |22-38 | 7-19 | | loam, loam | | | | | | | | | | | 25-33 |Silt loam, silty clay |CL-ML, CL |A-6, A-4 | 0 | 0 | 100 | 100 |89-100|82-97 |22-38 | 7-19 | | loam, loam | | | | | | | | | | | 33-50 |Stratified sandy loam to|SC, SC-SM, SM|A-6, A-2-4 | 0 | 0 |96-100|87-100|64-92 |15-36 | 0-32 |NP-13 | | loamy sand, sand, loamy| | | | | | | | | | | | sand, sandy loam | | | | | | | | | | | 50-72 |Sand, loamy sand, sandy |SC-SM, SP-SM |A-2-4, A-2, | 0 | 0 |96-100|87-100|64-82 | 6-15 | 0-23 |NP-6 | | loam | | A-3 | | | | | | | | | | | | | | | | | | | |MbrB: | | | | | | | | | | | | Matapeake-------| 0-10 |Silt loam |CL-ML, CL |A-4, A-7-6 | 0 | 0 | 100 | 100 |98-100|90-100|24-41 | 7-19 | 10-25 |Silt loam, silty clay |CL, CL-ML |A-4, A-6 | 0 | 0 | 100 | 100 |89-100|82-97 |22-38 | 7-19 | | loam, loam | | | | | | | | | | | 25-33 |Silt loam, silty clay |CL-ML, CL |A-6, A-4 | 0 | 0 | 100 | 100 |89-100|82-97 |22-38 | 7-19 | | loam, loam | | | | | | | | | | | 33-50 |Stratified sandy loam to|SC, SM, SC-SM|A-2-4, A-6 | 0 | 0 |96-100|87-100|64-92 |15-36 | 0-32 |NP-13 | | loamy sand, sand, loamy| | | | | | | | | | | | sand, sandy loam | | | | | | | | | | | 50-72 |Sand, loamy sand, sandy |SP-SM, SC-SM |A-2-4, A-2, | 0 | 0 |96-100|87-100|64-82 | 6-15 | 0-23 |NP-6 | | loam | | A-3 | | | | | | | | | | | | | | | | | | | |MbrC: | | | | | | | | | | | | Matapeake-------| 0-10 |Silt loam |CL, CL-ML |A-4, A-7-6 | 0 | 0 | 100 | 100 |98-100|90-100|24-41 | 7-19 | 10-25 |Silt loam, silty clay |CL, CL-ML |A-4, A-6 | 0 | 0 | 100 | 100 |89-100|82-97 |22-38 | 7-19 | | loam, loam | | | | | | | | | | | 25-33 |Silt loam, silty clay |CL, CL-ML |A-4, A-6 | 0 | 0 | 100 | 100 |89-100|82-97 |22-38 | 7-19 | | loam, loam | | | | | | | | | | | 33-50 |Stratified sandy loam to|SM, SC-SM, SC|A-6, A-2-4 | 0 | 0 |96-100|87-100|64-92 |15-36 | 0-32 |NP-13 | | loamy sand, sand, loamy| | | | | | | | | | | | sand, sandy loam | | | | | | | | | | | 50-72 |Sand, loamy sand, sandy |SC-SM, SP-SM |A-2-4, A-2, | 0 | 0 |96-100|87-100|64-82 | 6-15 | 0-23 |NP-6 | | loam | | A-3 | | | | | | | | | | | | | | | | | | | |MbuA: | | | | | | | | | | | | Mattapex--------| 0-7 |Silt loam |CL, CL-ML |A-4, A-7-6 | 0 | 0 |94-100|83-100|81-100|74-100|23-43 | 7-18 | 7-18 |Silt loam, silty clay |CL, CL-ML |A-4, A-6 | 0 | 0 | 100 | 100 |88-100|84-99 |22-38 | 7-19 | | loam | | | | | | | | | | | 18-33 |Silty clay loam, silt |CL-ML, CL |A-4, A-7-6, | 0 | 0 | 100 | 100 |80-100|76-100|22-49 | 7-28 | | loam | | A-6 | | | | | | | | | 33-40 |Silty clay loam, silt |CL-ML, CL |A-6, A-4, | 0 | 0 | 100 | 100 |80-100|76-100|22-49 | 7-28 | | loam | | A-7-6 | | | | | | | | | 40-72 |Loamy sand, sand, sandy |SC, SM |A-2-4, A-4 | 0 | 0 |95-100|86-100|65-89 |22-40 | 0-27 |NP-10 | | loam | | | | | | | | | | | | | | | | | | | | | |
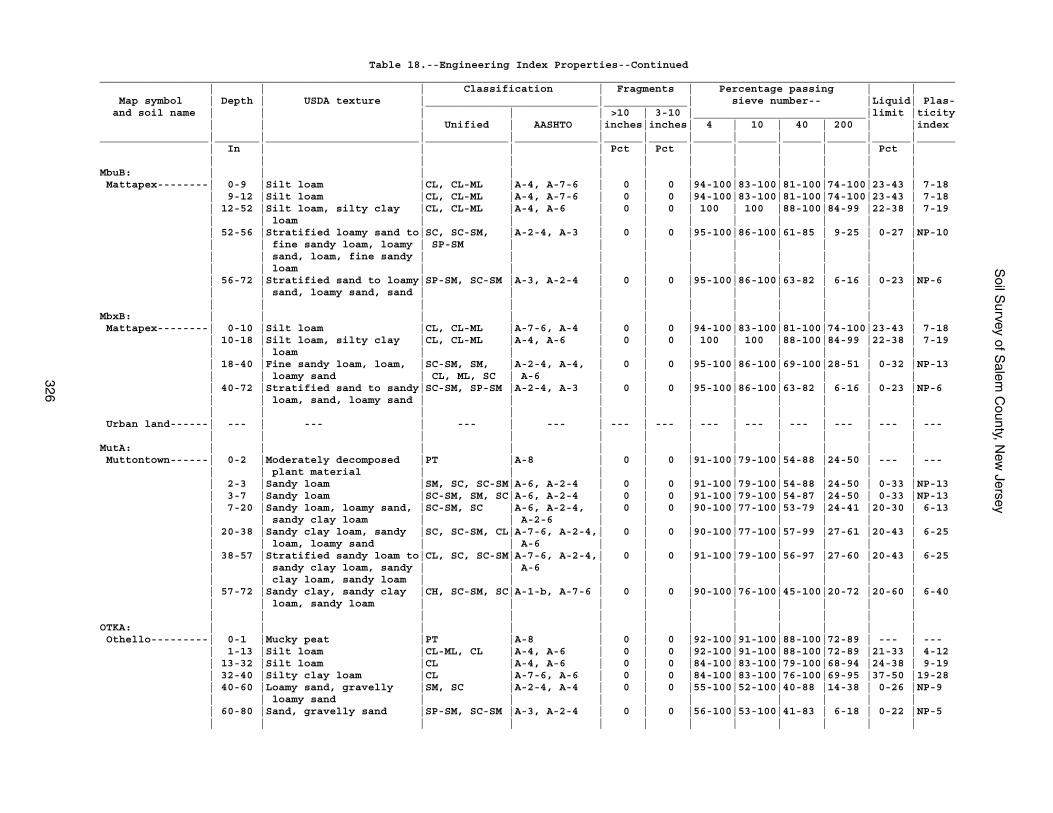
Soil S
urvey of Salem
County, N
ew Jersey
326
Table 18.--Engineering Index Properties--Continued______________________________________________________________________________________________________________________________________ | | | Classification | Fragments | Percentage passing | | Map symbol | Depth | USDA texture |___________________________|_____________| sieve number-- |Liquid| Plas- and soil name | | | | | >10 | 3-10 |___________________________|limit |ticity | | | Unified | AASHTO |inches|inches| 4 | 10 | 40 | 200 | |index_________________|_______|________________________|_____________|_____________|______|______|______|______|______|______|______|______ | In | | | | Pct | Pct | | | | | Pct | | | | | | | | | | | | |MbuB: | | | | | | | | | | | | Mattapex--------| 0-9 |Silt loam |CL, CL-ML |A-4, A-7-6 | 0 | 0 |94-100|83-100|81-100|74-100|23-43 | 7-18 | 9-12 |Silt loam |CL, CL-ML |A-4, A-7-6 | 0 | 0 |94-100|83-100|81-100|74-100|23-43 | 7-18 | 12-52 |Silt loam, silty clay |CL, CL-ML |A-4, A-6 | 0 | 0 | 100 | 100 |88-100|84-99 |22-38 | 7-19 | | loam | | | | | | | | | | | 52-56 |Stratified loamy sand to|SC, SC-SM, |A-2-4, A-3 | 0 | 0 |95-100|86-100|61-85 | 9-25 | 0-27 |NP-10 | | fine sandy loam, loamy | SP-SM | | | | | | | | | | | sand, loam, fine sandy | | | | | | | | | | | | loam | | | | | | | | | | | 56-72 |Stratified sand to loamy|SP-SM, SC-SM |A-3, A-2-4 | 0 | 0 |95-100|86-100|63-82 | 6-16 | 0-23 |NP-6 | | sand, loamy sand, sand | | | | | | | | | | | | | | | | | | | | | |MbxB: | | | | | | | | | | | | Mattapex--------| 0-10 |Silt loam |CL, CL-ML |A-7-6, A-4 | 0 | 0 |94-100|83-100|81-100|74-100|23-43 | 7-18 | 10-18 |Silt loam, silty clay |CL, CL-ML |A-4, A-6 | 0 | 0 | 100 | 100 |88-100|84-99 |22-38 | 7-19 | | loam | | | | | | | | | | | 18-40 |Fine sandy loam, loam, |SC-SM, SM, |A-2-4, A-4, | 0 | 0 |95-100|86-100|69-100|28-51 | 0-32 |NP-13 | | loamy sand | CL, ML, SC | A-6 | | | | | | | | | 40-72 |Stratified sand to sandy|SC-SM, SP-SM |A-2-4, A-3 | 0 | 0 |95-100|86-100|63-82 | 6-16 | 0-23 |NP-6 | | loam, sand, loamy sand | | | | | | | | | | | | | | | | | | | | | | Urban land------| --- | --- | --- | --- | --- | --- | --- | --- | --- | --- | --- | --- | | | | | | | | | | | |MutA: | | | | | | | | | | | | Muttontown------| 0-2 |Moderately decomposed |PT |A-8 | 0 | 0 |91-100|79-100|54-88 |24-50 | --- | --- | | plant material | | | | | | | | | | | 2-3 |Sandy loam |SM, SC, SC-SM|A-6, A-2-4 | 0 | 0 |91-100|79-100|54-88 |24-50 | 0-33 |NP-13 | 3-7 |Sandy loam |SC-SM, SM, SC|A-6, A-2-4 | 0 | 0 |91-100|79-100|54-87 |24-50 | 0-33 |NP-13 | 7-20 |Sandy loam, loamy sand, |SC-SM, SC |A-6, A-2-4, | 0 | 0 |90-100|77-100|53-79 |24-41 |20-30 | 6-13 | | sandy clay loam | | A-2-6 | | | | | | | | | 20-38 |Sandy clay loam, sandy |SC, SC-SM, CL|A-7-6, A-2-4,| 0 | 0 |90-100|77-100|57-99 |27-61 |20-43 | 6-25 | | loam, loamy sand | | A-6 | | | | | | | | | 38-57 |Stratified sandy loam to|CL, SC, SC-SM|A-7-6, A-2-4,| 0 | 0 |91-100|79-100|56-97 |27-60 |20-43 | 6-25 | | sandy clay loam, sandy | | A-6 | | | | | | | | | | clay loam, sandy loam | | | | | | | | | | | 57-72 |Sandy clay, sandy clay |CH, SC-SM, SC|A-1-b, A-7-6 | 0 | 0 |90-100|76-100|45-100|20-72 |20-60 | 6-40 | | loam, sandy loam | | | | | | | | | | | | | | | | | | | | | |OTKA: | | | | | | | | | | | | Othello---------| 0-1 |Mucky peat |PT |A-8 | 0 | 0 |92-100|91-100|88-100|72-89 | --- | --- | 1-13 |Silt loam |CL-ML, CL |A-4, A-6 | 0 | 0 |92-100|91-100|88-100|72-89 |21-33 | 4-12 | 13-32 |Silt loam |CL |A-4, A-6 | 0 | 0 |84-100|83-100|79-100|68-94 |24-38 | 9-19 | 32-40 |Silty clay loam |CL |A-7-6, A-6 | 0 | 0 |84-100|83-100|76-100|69-95 |37-50 |19-28 | 40-60 |Loamy sand, gravelly |SM, SC |A-2-4, A-4 | 0 | 0 |55-100|52-100|40-88 |14-38 | 0-26 |NP-9 | | loamy sand | | | | | | | | | | | 60-80 |Sand, gravelly sand |SP-SM, SC-SM |A-3, A-2-4 | 0 | 0 |56-100|53-100|41-83 | 6-18 | 0-22 |NP-5 | | | | | | | | | | | |
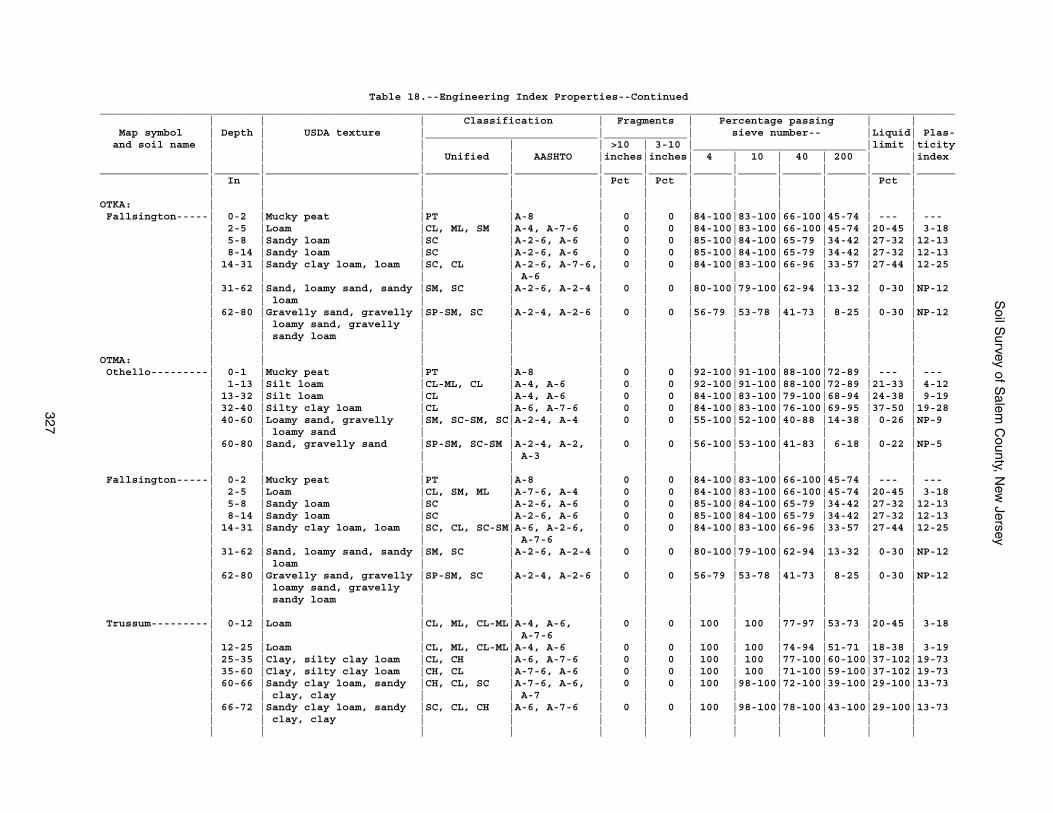
Soil S
urvey of Salem
County, N
ew Jersey
327
Table 18.--Engineering Index Properties--Continued______________________________________________________________________________________________________________________________________ | | | Classification | Fragments | Percentage passing | | Map symbol | Depth | USDA texture |___________________________|_____________| sieve number-- |Liquid| Plas- and soil name | | | | | >10 | 3-10 |___________________________|limit |ticity | | | Unified | AASHTO |inches|inches| 4 | 10 | 40 | 200 | |index_________________|_______|________________________|_____________|_____________|______|______|______|______|______|______|______|______ | In | | | | Pct | Pct | | | | | Pct | | | | | | | | | | | | |OTKA: | | | | | | | | | | | | Fallsington-----| 0-2 |Mucky peat |PT |A-8 | 0 | 0 |84-100|83-100|66-100|45-74 | --- | --- | 2-5 |Loam |CL, ML, SM |A-4, A-7-6 | 0 | 0 |84-100|83-100|66-100|45-74 |20-45 | 3-18 | 5-8 |Sandy loam |SC |A-2-6, A-6 | 0 | 0 |85-100|84-100|65-79 |34-42 |27-32 |12-13 | 8-14 |Sandy loam |SC |A-2-6, A-6 | 0 | 0 |85-100|84-100|65-79 |34-42 |27-32 |12-13 | 14-31 |Sandy clay loam, loam |SC, CL |A-2-6, A-7-6,| 0 | 0 |84-100|83-100|66-96 |33-57 |27-44 |12-25 | | | | A-6 | | | | | | | | | 31-62 |Sand, loamy sand, sandy |SM, SC |A-2-6, A-2-4 | 0 | 0 |80-100|79-100|62-94 |13-32 | 0-30 |NP-12 | | loam | | | | | | | | | | | 62-80 |Gravelly sand, gravelly |SP-SM, SC |A-2-4, A-2-6 | 0 | 0 |56-79 |53-78 |41-73 | 8-25 | 0-30 |NP-12 | | loamy sand, gravelly | | | | | | | | | | | | sandy loam | | | | | | | | | | | | | | | | | | | | | |OTMA: | | | | | | | | | | | | Othello---------| 0-1 |Mucky peat |PT |A-8 | 0 | 0 |92-100|91-100|88-100|72-89 | --- | --- | 1-13 |Silt loam |CL-ML, CL |A-4, A-6 | 0 | 0 |92-100|91-100|88-100|72-89 |21-33 | 4-12 | 13-32 |Silt loam |CL |A-4, A-6 | 0 | 0 |84-100|83-100|79-100|68-94 |24-38 | 9-19 | 32-40 |Silty clay loam |CL |A-6, A-7-6 | 0 | 0 |84-100|83-100|76-100|69-95 |37-50 |19-28 | 40-60 |Loamy sand, gravelly |SM, SC-SM, SC|A-2-4, A-4 | 0 | 0 |55-100|52-100|40-88 |14-38 | 0-26 |NP-9 | | loamy sand | | | | | | | | | | | 60-80 |Sand, gravelly sand |SP-SM, SC-SM |A-2-4, A-2, | 0 | 0 |56-100|53-100|41-83 | 6-18 | 0-22 |NP-5 | | | | A-3 | | | | | | | | | | | | | | | | | | | | Fallsington-----| 0-2 |Mucky peat |PT |A-8 | 0 | 0 |84-100|83-100|66-100|45-74 | --- | --- | 2-5 |Loam |CL, SM, ML |A-7-6, A-4 | 0 | 0 |84-100|83-100|66-100|45-74 |20-45 | 3-18 | 5-8 |Sandy loam |SC |A-2-6, A-6 | 0 | 0 |85-100|84-100|65-79 |34-42 |27-32 |12-13 | 8-14 |Sandy loam |SC |A-2-6, A-6 | 0 | 0 |85-100|84-100|65-79 |34-42 |27-32 |12-13 | 14-31 |Sandy clay loam, loam |SC, CL, SC-SM|A-6, A-2-6, | 0 | 0 |84-100|83-100|66-96 |33-57 |27-44 |12-25 | | | | A-7-6 | | | | | | | | | 31-62 |Sand, loamy sand, sandy |SM, SC |A-2-6, A-2-4 | 0 | 0 |80-100|79-100|62-94 |13-32 | 0-30 |NP-12 | | loam | | | | | | | | | | | 62-80 |Gravelly sand, gravelly |SP-SM, SC |A-2-4, A-2-6 | 0 | 0 |56-79 |53-78 |41-73 | 8-25 | 0-30 |NP-12 | | loamy sand, gravelly | | | | | | | | | | | | sandy loam | | | | | | | | | | | | | | | | | | | | | | Trussum---------| 0-12 |Loam |CL, ML, CL-ML|A-4, A-6, | 0 | 0 | 100 | 100 |77-97 |53-73 |20-45 | 3-18 | | | | A-7-6 | | | | | | | | | 12-25 |Loam |CL, ML, CL-ML|A-4, A-6 | 0 | 0 | 100 | 100 |74-94 |51-71 |18-38 | 3-19 | 25-35 |Clay, silty clay loam |CL, CH |A-6, A-7-6 | 0 | 0 | 100 | 100 |77-100|60-100|37-102|19-73 | 35-60 |Clay, silty clay loam |CH, CL |A-7-6, A-6 | 0 | 0 | 100 | 100 |71-100|59-100|37-102|19-73 | 60-66 |Sandy clay loam, sandy |CH, CL, SC |A-7-6, A-6, | 0 | 0 | 100 |98-100|72-100|39-100|29-100|13-73 | | clay, clay | | A-7 | | | | | | | | | 66-72 |Sandy clay loam, sandy |SC, CL, CH |A-6, A-7-6 | 0 | 0 | 100 |98-100|78-100|43-100|29-100|13-73 | | clay, clay | | | | | | | | | | | | | | | | | | | | | |
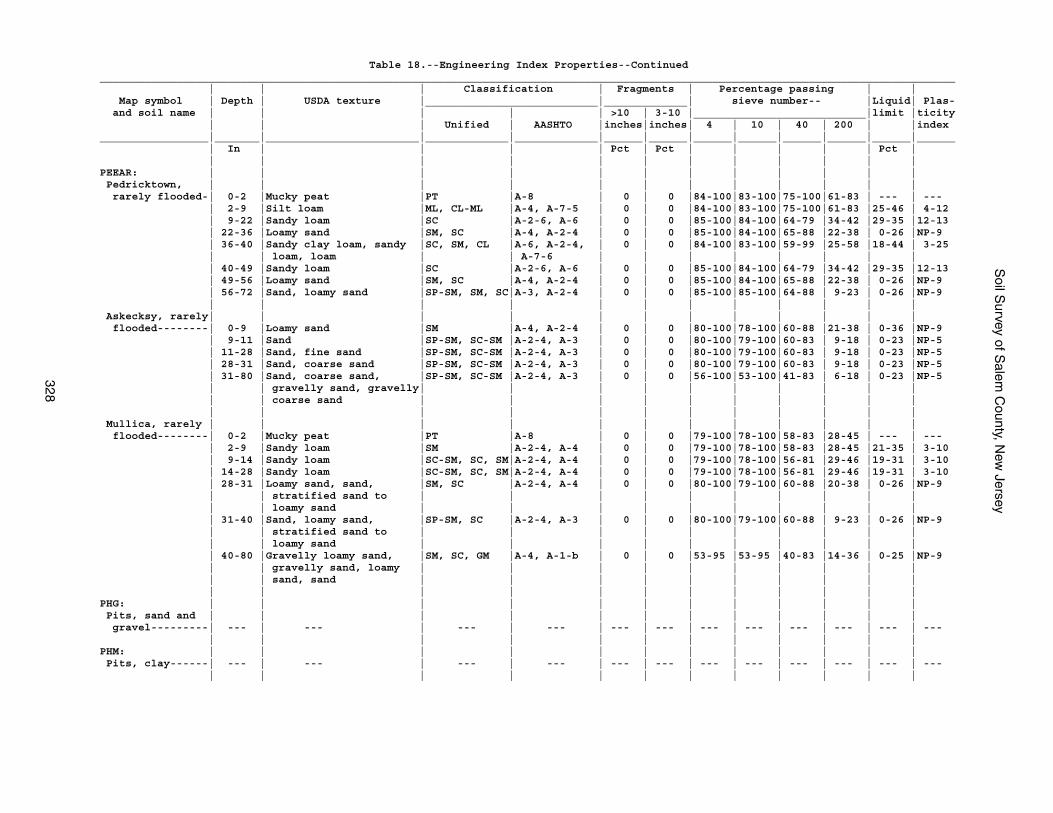
Soil S
urvey of Salem
County, N
ew Jersey
328
Table 18.--Engineering Index Properties--Continued______________________________________________________________________________________________________________________________________ | | | Classification | Fragments | Percentage passing | | Map symbol | Depth | USDA texture |___________________________|_____________| sieve number-- |Liquid| Plas- and soil name | | | | | >10 | 3-10 |___________________________|limit |ticity | | | Unified | AASHTO |inches|inches| 4 | 10 | 40 | 200 | |index_________________|_______|________________________|_____________|_____________|______|______|______|______|______|______|______|______ | In | | | | Pct | Pct | | | | | Pct | | | | | | | | | | | | |PEEAR: | | | | | | | | | | | | Pedricktown, | | | | | | | | | | | | rarely flooded-| 0-2 |Mucky peat |PT |A-8 | 0 | 0 |84-100|83-100|75-100|61-83 | --- | --- | 2-9 |Silt loam |ML, CL-ML |A-4, A-7-5 | 0 | 0 |84-100|83-100|75-100|61-83 |25-46 | 4-12 | 9-22 |Sandy loam |SC |A-2-6, A-6 | 0 | 0 |85-100|84-100|64-79 |34-42 |29-35 |12-13 | 22-36 |Loamy sand |SM, SC |A-4, A-2-4 | 0 | 0 |85-100|84-100|65-88 |22-38 | 0-26 |NP-9 | 36-40 |Sandy clay loam, sandy |SC, SM, CL |A-6, A-2-4, | 0 | 0 |84-100|83-100|59-99 |25-58 |18-44 | 3-25 | | loam, loam | | A-7-6 | | | | | | | | | 40-49 |Sandy loam |SC |A-2-6, A-6 | 0 | 0 |85-100|84-100|64-79 |34-42 |29-35 |12-13 | 49-56 |Loamy sand |SM, SC |A-4, A-2-4 | 0 | 0 |85-100|84-100|65-88 |22-38 | 0-26 |NP-9 | 56-72 |Sand, loamy sand |SP-SM, SM, SC|A-3, A-2-4 | 0 | 0 |85-100|85-100|64-88 | 9-23 | 0-26 |NP-9 | | | | | | | | | | | | Askecksy, rarely| | | | | | | | | | | | flooded--------| 0-9 |Loamy sand |SM |A-4, A-2-4 | 0 | 0 |80-100|78-100|60-88 |21-38 | 0-36 |NP-9 | 9-11 |Sand |SP-SM, SC-SM |A-2-4, A-3 | 0 | 0 |80-100|79-100|60-83 | 9-18 | 0-23 |NP-5 | 11-28 |Sand, fine sand |SP-SM, SC-SM |A-2-4, A-3 | 0 | 0 |80-100|79-100|60-83 | 9-18 | 0-23 |NP-5 | 28-31 |Sand, coarse sand |SP-SM, SC-SM |A-2-4, A-3 | 0 | 0 |80-100|79-100|60-83 | 9-18 | 0-23 |NP-5 | 31-80 |Sand, coarse sand, |SP-SM, SC-SM |A-2-4, A-3 | 0 | 0 |56-100|53-100|41-83 | 6-18 | 0-23 |NP-5 | | gravelly sand, gravelly| | | | | | | | | | | | coarse sand | | | | | | | | | | | | | | | | | | | | | | Mullica, rarely | | | | | | | | | | | | flooded--------| 0-2 |Mucky peat |PT |A-8 | 0 | 0 |79-100|78-100|58-83 |28-45 | --- | --- | 2-9 |Sandy loam |SM |A-2-4, A-4 | 0 | 0 |79-100|78-100|58-83 |28-45 |21-35 | 3-10 | 9-14 |Sandy loam |SC-SM, SC, SM|A-2-4, A-4 | 0 | 0 |79-100|78-100|56-81 |29-46 |19-31 | 3-10 | 14-28 |Sandy loam |SC-SM, SC, SM|A-2-4, A-4 | 0 | 0 |79-100|78-100|56-81 |29-46 |19-31 | 3-10 | 28-31 |Loamy sand, sand, |SM, SC |A-2-4, A-4 | 0 | 0 |80-100|79-100|60-88 |20-38 | 0-26 |NP-9 | | stratified sand to | | | | | | | | | | | | loamy sand | | | | | | | | | | | 31-40 |Sand, loamy sand, |SP-SM, SC |A-2-4, A-3 | 0 | 0 |80-100|79-100|60-88 | 9-23 | 0-26 |NP-9 | | stratified sand to | | | | | | | | | | | | loamy sand | | | | | | | | | | | 40-80 |Gravelly loamy sand, |SM, SC, GM |A-4, A-1-b | 0 | 0 |53-95 |53-95 |40-83 |14-36 | 0-25 |NP-9 | | gravelly sand, loamy | | | | | | | | | | | | sand, sand | | | | | | | | | | | | | | | | | | | | | |PHG: | | | | | | | | | | | | Pits, sand and | | | | | | | | | | | | gravel---------| --- | --- | --- | --- | --- | --- | --- | --- | --- | --- | --- | --- | | | | | | | | | | | |PHM: | | | | | | | | | | | | Pits, clay------| --- | --- | --- | --- | --- | --- | --- | --- | --- | --- | --- | --- | | | | | | | | | | | |
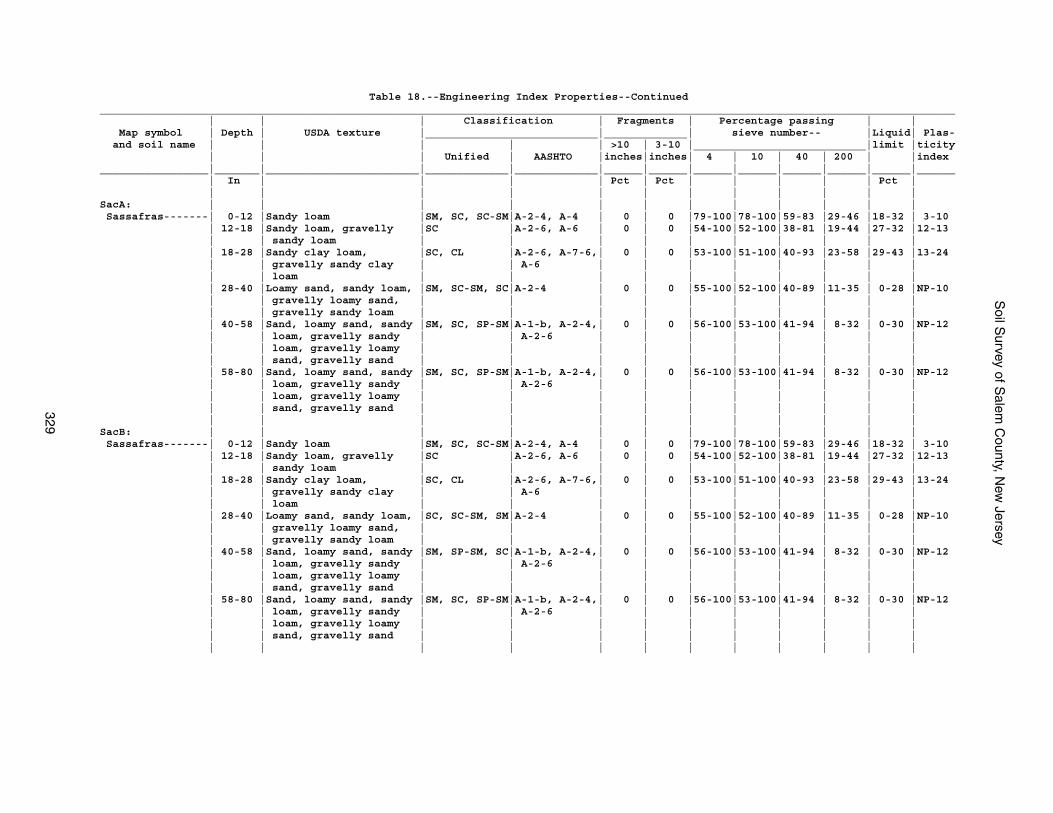
Soil S
urvey of Salem
County, N
ew Jersey
329
Table 18.--Engineering Index Properties--Continued______________________________________________________________________________________________________________________________________ | | | Classification | Fragments | Percentage passing | | Map symbol | Depth | USDA texture |___________________________|_____________| sieve number-- |Liquid| Plas- and soil name | | | | | >10 | 3-10 |___________________________|limit |ticity | | | Unified | AASHTO |inches|inches| 4 | 10 | 40 | 200 | |index_________________|_______|________________________|_____________|_____________|______|______|______|______|______|______|______|______ | In | | | | Pct | Pct | | | | | Pct | | | | | | | | | | | | |SacA: | | | | | | | | | | | | Sassafras-------| 0-12 |Sandy loam |SM, SC, SC-SM|A-2-4, A-4 | 0 | 0 |79-100|78-100|59-83 |29-46 |18-32 | 3-10 | 12-18 |Sandy loam, gravelly |SC |A-2-6, A-6 | 0 | 0 |54-100|52-100|38-81 |19-44 |27-32 |12-13 | | sandy loam | | | | | | | | | | | 18-28 |Sandy clay loam, |SC, CL |A-2-6, A-7-6,| 0 | 0 |53-100|51-100|40-93 |23-58 |29-43 |13-24 | | gravelly sandy clay | | A-6 | | | | | | | | | | loam | | | | | | | | | | | 28-40 |Loamy sand, sandy loam, |SM, SC-SM, SC|A-2-4 | 0 | 0 |55-100|52-100|40-89 |11-35 | 0-28 |NP-10 | | gravelly loamy sand, | | | | | | | | | | | | gravelly sandy loam | | | | | | | | | | | 40-58 |Sand, loamy sand, sandy |SM, SC, SP-SM|A-1-b, A-2-4,| 0 | 0 |56-100|53-100|41-94 | 8-32 | 0-30 |NP-12 | | loam, gravelly sandy | | A-2-6 | | | | | | | | | | loam, gravelly loamy | | | | | | | | | | | | sand, gravelly sand | | | | | | | | | | | 58-80 |Sand, loamy sand, sandy |SM, SC, SP-SM|A-1-b, A-2-4,| 0 | 0 |56-100|53-100|41-94 | 8-32 | 0-30 |NP-12 | | loam, gravelly sandy | | A-2-6 | | | | | | | | | | loam, gravelly loamy | | | | | | | | | | | | sand, gravelly sand | | | | | | | | | | | | | | | | | | | | | |SacB: | | | | | | | | | | | | Sassafras-------| 0-12 |Sandy loam |SM, SC, SC-SM|A-2-4, A-4 | 0 | 0 |79-100|78-100|59-83 |29-46 |18-32 | 3-10 | 12-18 |Sandy loam, gravelly |SC |A-2-6, A-6 | 0 | 0 |54-100|52-100|38-81 |19-44 |27-32 |12-13 | | sandy loam | | | | | | | | | | | 18-28 |Sandy clay loam, |SC, CL |A-2-6, A-7-6,| 0 | 0 |53-100|51-100|40-93 |23-58 |29-43 |13-24 | | gravelly sandy clay | | A-6 | | | | | | | | | | loam | | | | | | | | | | | 28-40 |Loamy sand, sandy loam, |SC, SC-SM, SM|A-2-4 | 0 | 0 |55-100|52-100|40-89 |11-35 | 0-28 |NP-10 | | gravelly loamy sand, | | | | | | | | | | | | gravelly sandy loam | | | | | | | | | | | 40-58 |Sand, loamy sand, sandy |SM, SP-SM, SC|A-1-b, A-2-4,| 0 | 0 |56-100|53-100|41-94 | 8-32 | 0-30 |NP-12 | | loam, gravelly sandy | | A-2-6 | | | | | | | | | | loam, gravelly loamy | | | | | | | | | | | | sand, gravelly sand | | | | | | | | | | | 58-80 |Sand, loamy sand, sandy |SM, SC, SP-SM|A-1-b, A-2-4,| 0 | 0 |56-100|53-100|41-94 | 8-32 | 0-30 |NP-12 | | loam, gravelly sandy | | A-2-6 | | | | | | | | | | loam, gravelly loamy | | | | | | | | | | | | sand, gravelly sand | | | | | | | | | | | | | | | | | | | | | |
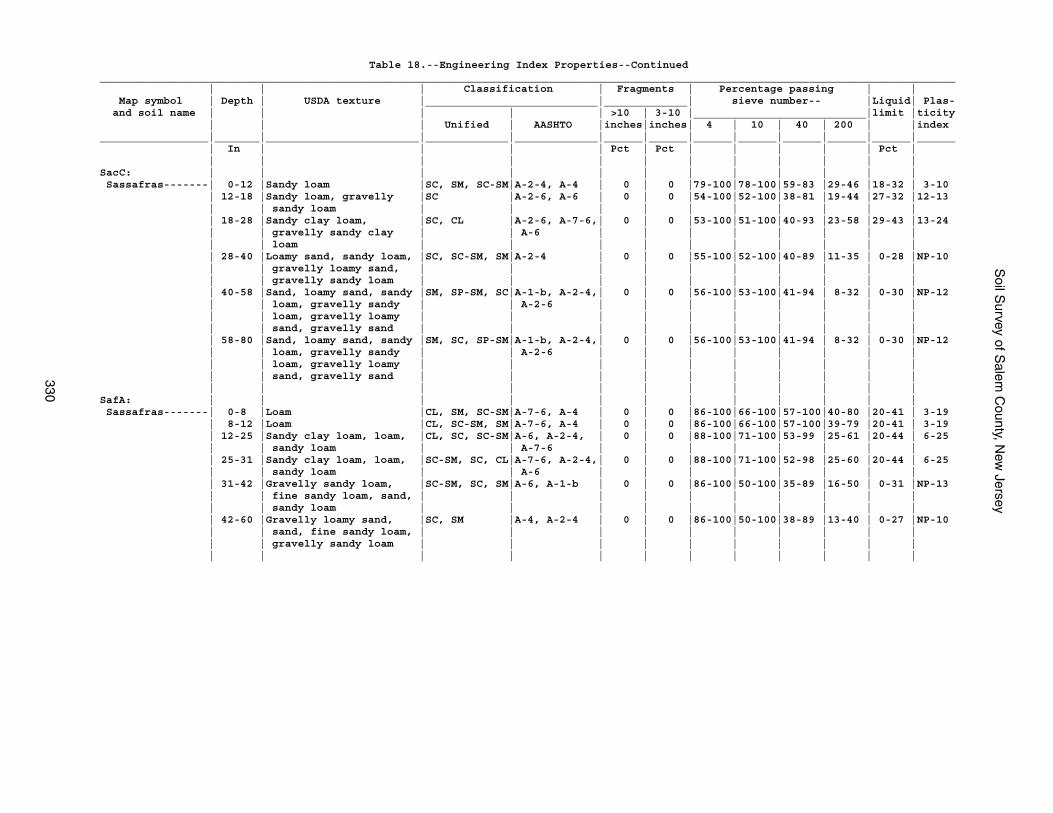
Soil S
urvey of Salem
County, N
ew Jersey
330
Table 18.--Engineering Index Properties--Continued______________________________________________________________________________________________________________________________________ | | | Classification | Fragments | Percentage passing | | Map symbol | Depth | USDA texture |___________________________|_____________| sieve number-- |Liquid| Plas- and soil name | | | | | >10 | 3-10 |___________________________|limit |ticity | | | Unified | AASHTO |inches|inches| 4 | 10 | 40 | 200 | |index_________________|_______|________________________|_____________|_____________|______|______|______|______|______|______|______|______ | In | | | | Pct | Pct | | | | | Pct | | | | | | | | | | | | |SacC: | | | | | | | | | | | | Sassafras-------| 0-12 |Sandy loam |SC, SM, SC-SM|A-2-4, A-4 | 0 | 0 |79-100|78-100|59-83 |29-46 |18-32 | 3-10 | 12-18 |Sandy loam, gravelly |SC |A-2-6, A-6 | 0 | 0 |54-100|52-100|38-81 |19-44 |27-32 |12-13 | | sandy loam | | | | | | | | | | | 18-28 |Sandy clay loam, |SC, CL |A-2-6, A-7-6,| 0 | 0 |53-100|51-100|40-93 |23-58 |29-43 |13-24 | | gravelly sandy clay | | A-6 | | | | | | | | | | loam | | | | | | | | | | | 28-40 |Loamy sand, sandy loam, |SC, SC-SM, SM|A-2-4 | 0 | 0 |55-100|52-100|40-89 |11-35 | 0-28 |NP-10 | | gravelly loamy sand, | | | | | | | | | | | | gravelly sandy loam | | | | | | | | | | | 40-58 |Sand, loamy sand, sandy |SM, SP-SM, SC|A-1-b, A-2-4,| 0 | 0 |56-100|53-100|41-94 | 8-32 | 0-30 |NP-12 | | loam, gravelly sandy | | A-2-6 | | | | | | | | | | loam, gravelly loamy | | | | | | | | | | | | sand, gravelly sand | | | | | | | | | | | 58-80 |Sand, loamy sand, sandy |SM, SC, SP-SM|A-1-b, A-2-4,| 0 | 0 |56-100|53-100|41-94 | 8-32 | 0-30 |NP-12 | | loam, gravelly sandy | | A-2-6 | | | | | | | | | | loam, gravelly loamy | | | | | | | | | | | | sand, gravelly sand | | | | | | | | | | | | | | | | | | | | | |SafA: | | | | | | | | | | | | Sassafras-------| 0-8 |Loam |CL, SM, SC-SM|A-7-6, A-4 | 0 | 0 |86-100|66-100|57-100|40-80 |20-41 | 3-19 | 8-12 |Loam |CL, SC-SM, SM|A-7-6, A-4 | 0 | 0 |86-100|66-100|57-100|39-79 |20-41 | 3-19 | 12-25 |Sandy clay loam, loam, |CL, SC, SC-SM|A-6, A-2-4, | 0 | 0 |88-100|71-100|53-99 |25-61 |20-44 | 6-25 | | sandy loam | | A-7-6 | | | | | | | | | 25-31 |Sandy clay loam, loam, |SC-SM, SC, CL|A-7-6, A-2-4,| 0 | 0 |88-100|71-100|52-98 |25-60 |20-44 | 6-25 | | sandy loam | | A-6 | | | | | | | | | 31-42 |Gravelly sandy loam, |SC-SM, SC, SM|A-6, A-1-b | 0 | 0 |86-100|50-100|35-89 |16-50 | 0-31 |NP-13 | | fine sandy loam, sand, | | | | | | | | | | | | sandy loam | | | | | | | | | | | 42-60 |Gravelly loamy sand, |SC, SM |A-4, A-2-4 | 0 | 0 |86-100|50-100|38-89 |13-40 | 0-27 |NP-10 | | sand, fine sandy loam, | | | | | | | | | | | | gravelly sandy loam | | | | | | | | | | | | | | | | | | | | | |
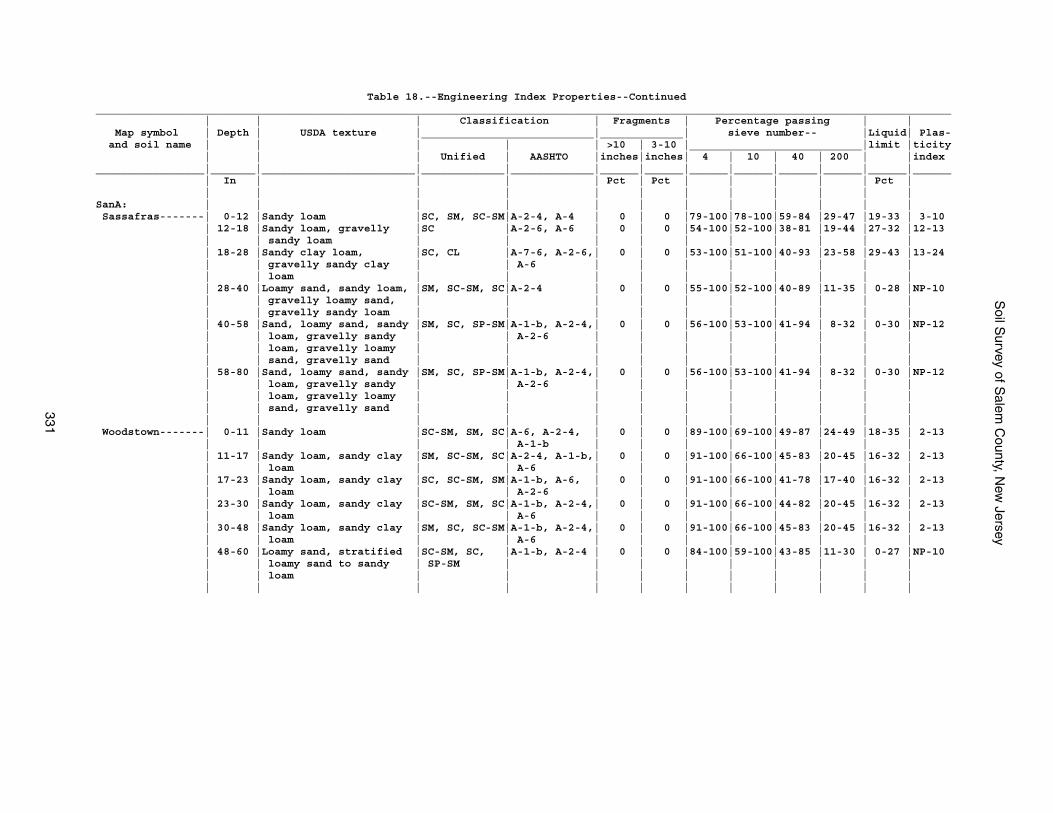
Soil S
urvey of Salem
County, N
ew Jersey
331
Table 18.--Engineering Index Properties--Continued______________________________________________________________________________________________________________________________________ | | | Classification | Fragments | Percentage passing | | Map symbol | Depth | USDA texture |___________________________|_____________| sieve number-- |Liquid| Plas- and soil name | | | | | >10 | 3-10 |___________________________|limit |ticity | | | Unified | AASHTO |inches|inches| 4 | 10 | 40 | 200 | |index_________________|_______|________________________|_____________|_____________|______|______|______|______|______|______|______|______ | In | | | | Pct | Pct | | | | | Pct | | | | | | | | | | | | |SanA: | | | | | | | | | | | | Sassafras-------| 0-12 |Sandy loam |SC, SM, SC-SM|A-2-4, A-4 | 0 | 0 |79-100|78-100|59-84 |29-47 |19-33 | 3-10 | 12-18 |Sandy loam, gravelly |SC |A-2-6, A-6 | 0 | 0 |54-100|52-100|38-81 |19-44 |27-32 |12-13 | | sandy loam | | | | | | | | | | | 18-28 |Sandy clay loam, |SC, CL |A-7-6, A-2-6,| 0 | 0 |53-100|51-100|40-93 |23-58 |29-43 |13-24 | | gravelly sandy clay | | A-6 | | | | | | | | | | loam | | | | | | | | | | | 28-40 |Loamy sand, sandy loam, |SM, SC-SM, SC|A-2-4 | 0 | 0 |55-100|52-100|40-89 |11-35 | 0-28 |NP-10 | | gravelly loamy sand, | | | | | | | | | | | | gravelly sandy loam | | | | | | | | | | | 40-58 |Sand, loamy sand, sandy |SM, SC, SP-SM|A-1-b, A-2-4,| 0 | 0 |56-100|53-100|41-94 | 8-32 | 0-30 |NP-12 | | loam, gravelly sandy | | A-2-6 | | | | | | | | | | loam, gravelly loamy | | | | | | | | | | | | sand, gravelly sand | | | | | | | | | | | 58-80 |Sand, loamy sand, sandy |SM, SC, SP-SM|A-1-b, A-2-4,| 0 | 0 |56-100|53-100|41-94 | 8-32 | 0-30 |NP-12 | | loam, gravelly sandy | | A-2-6 | | | | | | | | | | loam, gravelly loamy | | | | | | | | | | | | sand, gravelly sand | | | | | | | | | | | | | | | | | | | | | | Woodstown-------| 0-11 |Sandy loam |SC-SM, SM, SC|A-6, A-2-4, | 0 | 0 |89-100|69-100|49-87 |24-49 |18-35 | 2-13 | | | | A-1-b | | | | | | | | | 11-17 |Sandy loam, sandy clay |SM, SC-SM, SC|A-2-4, A-1-b,| 0 | 0 |91-100|66-100|45-83 |20-45 |16-32 | 2-13 | | loam | | A-6 | | | | | | | | | 17-23 |Sandy loam, sandy clay |SC, SC-SM, SM|A-1-b, A-6, | 0 | 0 |91-100|66-100|41-78 |17-40 |16-32 | 2-13 | | loam | | A-2-6 | | | | | | | | | 23-30 |Sandy loam, sandy clay |SC-SM, SM, SC|A-1-b, A-2-4,| 0 | 0 |91-100|66-100|44-82 |20-45 |16-32 | 2-13 | | loam | | A-6 | | | | | | | | | 30-48 |Sandy loam, sandy clay |SM, SC, SC-SM|A-1-b, A-2-4,| 0 | 0 |91-100|66-100|45-83 |20-45 |16-32 | 2-13 | | loam | | A-6 | | | | | | | | | 48-60 |Loamy sand, stratified |SC-SM, SC, |A-1-b, A-2-4 | 0 | 0 |84-100|59-100|43-85 |11-30 | 0-27 |NP-10 | | loamy sand to sandy | SP-SM | | | | | | | | | | | loam | | | | | | | | | | | | | | | | | | | | | |
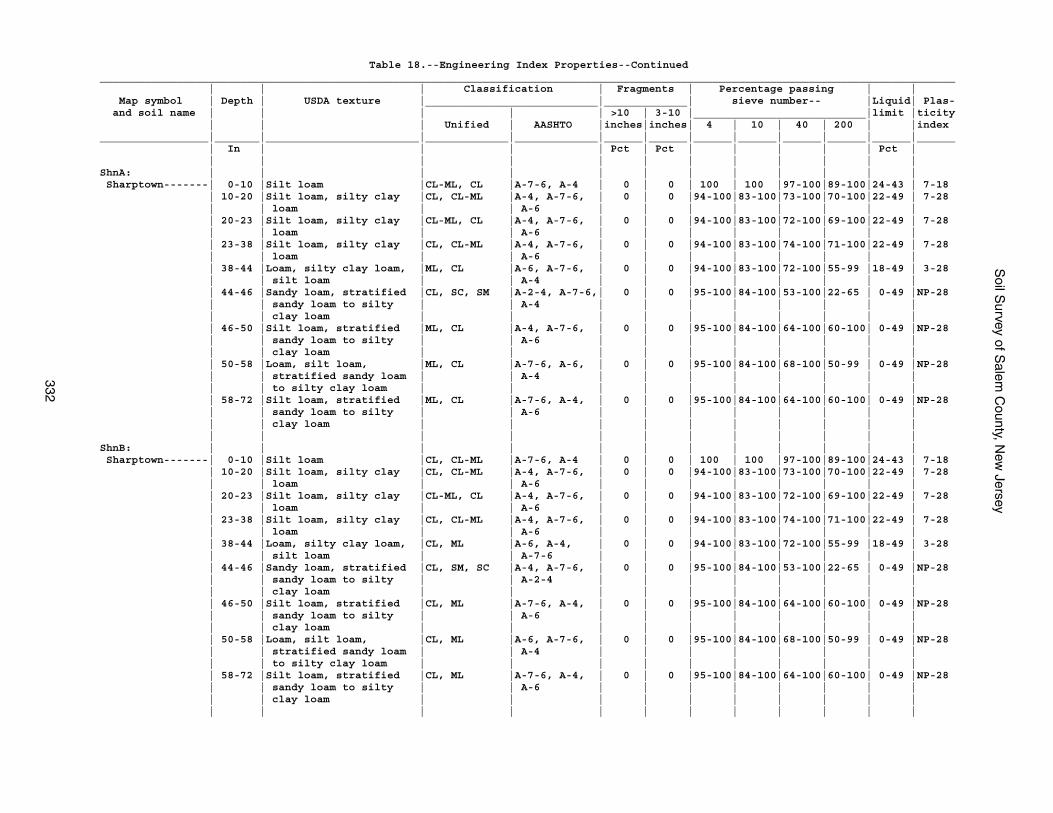
Soil S
urvey of Salem
County, N
ew Jersey
332
Table 18.--Engineering Index Properties--Continued______________________________________________________________________________________________________________________________________ | | | Classification | Fragments | Percentage passing | | Map symbol | Depth | USDA texture |___________________________|_____________| sieve number-- |Liquid| Plas- and soil name | | | | | >10 | 3-10 |___________________________|limit |ticity | | | Unified | AASHTO |inches|inches| 4 | 10 | 40 | 200 | |index_________________|_______|________________________|_____________|_____________|______|______|______|______|______|______|______|______ | In | | | | Pct | Pct | | | | | Pct | | | | | | | | | | | | |ShnA: | | | | | | | | | | | | Sharptown-------| 0-10 |Silt loam |CL-ML, CL |A-7-6, A-4 | 0 | 0 | 100 | 100 |97-100|89-100|24-43 | 7-18 | 10-20 |Silt loam, silty clay |CL, CL-ML |A-4, A-7-6, | 0 | 0 |94-100|83-100|73-100|70-100|22-49 | 7-28 | | loam | | A-6 | | | | | | | | | 20-23 |Silt loam, silty clay |CL-ML, CL |A-4, A-7-6, | 0 | 0 |94-100|83-100|72-100|69-100|22-49 | 7-28 | | loam | | A-6 | | | | | | | | | 23-38 |Silt loam, silty clay |CL, CL-ML |A-4, A-7-6, | 0 | 0 |94-100|83-100|74-100|71-100|22-49 | 7-28 | | loam | | A-6 | | | | | | | | | 38-44 |Loam, silty clay loam, |ML, CL |A-6, A-7-6, | 0 | 0 |94-100|83-100|72-100|55-99 |18-49 | 3-28 | | silt loam | | A-4 | | | | | | | | | 44-46 |Sandy loam, stratified |CL, SC, SM |A-2-4, A-7-6,| 0 | 0 |95-100|84-100|53-100|22-65 | 0-49 |NP-28 | | sandy loam to silty | | A-4 | | | | | | | | | | clay loam | | | | | | | | | | | 46-50 |Silt loam, stratified |ML, CL |A-4, A-7-6, | 0 | 0 |95-100|84-100|64-100|60-100| 0-49 |NP-28 | | sandy loam to silty | | A-6 | | | | | | | | | | clay loam | | | | | | | | | | | 50-58 |Loam, silt loam, |ML, CL |A-7-6, A-6, | 0 | 0 |95-100|84-100|68-100|50-99 | 0-49 |NP-28 | | stratified sandy loam | | A-4 | | | | | | | | | | to silty clay loam | | | | | | | | | | | 58-72 |Silt loam, stratified |ML, CL |A-7-6, A-4, | 0 | 0 |95-100|84-100|64-100|60-100| 0-49 |NP-28 | | sandy loam to silty | | A-6 | | | | | | | | | | clay loam | | | | | | | | | | | | | | | | | | | | | |ShnB: | | | | | | | | | | | | Sharptown-------| 0-10 |Silt loam |CL, CL-ML |A-7-6, A-4 | 0 | 0 | 100 | 100 |97-100|89-100|24-43 | 7-18 | 10-20 |Silt loam, silty clay |CL, CL-ML |A-4, A-7-6, | 0 | 0 |94-100|83-100|73-100|70-100|22-49 | 7-28 | | loam | | A-6 | | | | | | | | | 20-23 |Silt loam, silty clay |CL-ML, CL |A-4, A-7-6, | 0 | 0 |94-100|83-100|72-100|69-100|22-49 | 7-28 | | loam | | A-6 | | | | | | | | | 23-38 |Silt loam, silty clay |CL, CL-ML |A-4, A-7-6, | 0 | 0 |94-100|83-100|74-100|71-100|22-49 | 7-28 | | loam | | A-6 | | | | | | | | | 38-44 |Loam, silty clay loam, |CL, ML |A-6, A-4, | 0 | 0 |94-100|83-100|72-100|55-99 |18-49 | 3-28 | | silt loam | | A-7-6 | | | | | | | | | 44-46 |Sandy loam, stratified |CL, SM, SC |A-4, A-7-6, | 0 | 0 |95-100|84-100|53-100|22-65 | 0-49 |NP-28 | | sandy loam to silty | | A-2-4 | | | | | | | | | | clay loam | | | | | | | | | | | 46-50 |Silt loam, stratified |CL, ML |A-7-6, A-4, | 0 | 0 |95-100|84-100|64-100|60-100| 0-49 |NP-28 | | sandy loam to silty | | A-6 | | | | | | | | | | clay loam | | | | | | | | | | | 50-58 |Loam, silt loam, |CL, ML |A-6, A-7-6, | 0 | 0 |95-100|84-100|68-100|50-99 | 0-49 |NP-28 | | stratified sandy loam | | A-4 | | | | | | | | | | to silty clay loam | | | | | | | | | | | 58-72 |Silt loam, stratified |CL, ML |A-7-6, A-4, | 0 | 0 |95-100|84-100|64-100|60-100| 0-49 |NP-28 | | sandy loam to silty | | A-6 | | | | | | | | | | clay loam | | | | | | | | | | | | | | | | | | | | | |
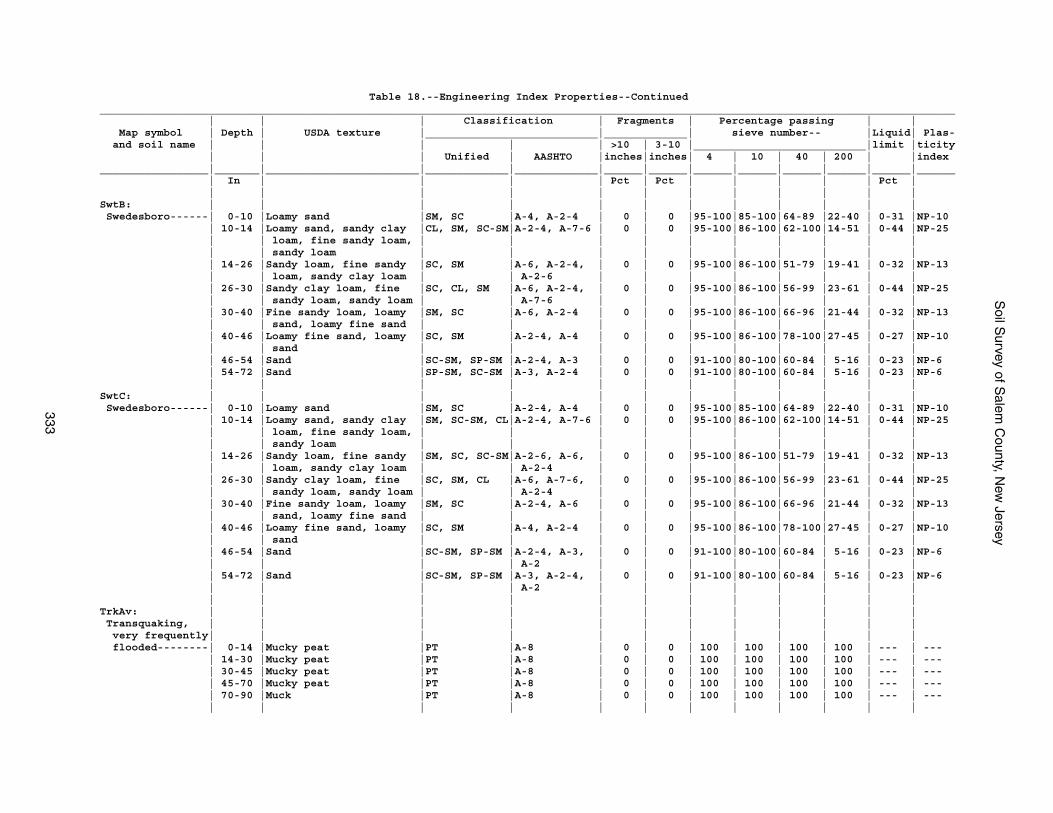
Soil S
urvey of Salem
County, N
ew Jersey
333
Table 18.--Engineering Index Properties--Continued______________________________________________________________________________________________________________________________________ | | | Classification | Fragments | Percentage passing | | Map symbol | Depth | USDA texture |___________________________|_____________| sieve number-- |Liquid| Plas- and soil name | | | | | >10 | 3-10 |___________________________|limit |ticity | | | Unified | AASHTO |inches|inches| 4 | 10 | 40 | 200 | |index_________________|_______|________________________|_____________|_____________|______|______|______|______|______|______|______|______ | In | | | | Pct | Pct | | | | | Pct | | | | | | | | | | | | |SwtB: | | | | | | | | | | | | Swedesboro------| 0-10 |Loamy sand |SM, SC |A-4, A-2-4 | 0 | 0 |95-100|85-100|64-89 |22-40 | 0-31 |NP-10 | 10-14 |Loamy sand, sandy clay |CL, SM, SC-SM|A-2-4, A-7-6 | 0 | 0 |95-100|86-100|62-100|14-51 | 0-44 |NP-25 | | loam, fine sandy loam, | | | | | | | | | | | | sandy loam | | | | | | | | | | | 14-26 |Sandy loam, fine sandy |SC, SM |A-6, A-2-4, | 0 | 0 |95-100|86-100|51-79 |19-41 | 0-32 |NP-13 | | loam, sandy clay loam | | A-2-6 | | | | | | | | | 26-30 |Sandy clay loam, fine |SC, CL, SM |A-6, A-2-4, | 0 | 0 |95-100|86-100|56-99 |23-61 | 0-44 |NP-25 | | sandy loam, sandy loam | | A-7-6 | | | | | | | | | 30-40 |Fine sandy loam, loamy |SM, SC |A-6, A-2-4 | 0 | 0 |95-100|86-100|66-96 |21-44 | 0-32 |NP-13 | | sand, loamy fine sand | | | | | | | | | | | 40-46 |Loamy fine sand, loamy |SC, SM |A-2-4, A-4 | 0 | 0 |95-100|86-100|78-100|27-45 | 0-27 |NP-10 | | sand | | | | | | | | | | | 46-54 |Sand |SC-SM, SP-SM |A-2-4, A-3 | 0 | 0 |91-100|80-100|60-84 | 5-16 | 0-23 |NP-6 | 54-72 |Sand |SP-SM, SC-SM |A-3, A-2-4 | 0 | 0 |91-100|80-100|60-84 | 5-16 | 0-23 |NP-6 | | | | | | | | | | | |SwtC: | | | | | | | | | | | | Swedesboro------| 0-10 |Loamy sand |SM, SC |A-2-4, A-4 | 0 | 0 |95-100|85-100|64-89 |22-40 | 0-31 |NP-10 | 10-14 |Loamy sand, sandy clay |SM, SC-SM, CL|A-2-4, A-7-6 | 0 | 0 |95-100|86-100|62-100|14-51 | 0-44 |NP-25 | | loam, fine sandy loam, | | | | | | | | | | | | sandy loam | | | | | | | | | | | 14-26 |Sandy loam, fine sandy |SM, SC, SC-SM|A-2-6, A-6, | 0 | 0 |95-100|86-100|51-79 |19-41 | 0-32 |NP-13 | | loam, sandy clay loam | | A-2-4 | | | | | | | | | 26-30 |Sandy clay loam, fine |SC, SM, CL |A-6, A-7-6, | 0 | 0 |95-100|86-100|56-99 |23-61 | 0-44 |NP-25 | | sandy loam, sandy loam | | A-2-4 | | | | | | | | | 30-40 |Fine sandy loam, loamy |SM, SC |A-2-4, A-6 | 0 | 0 |95-100|86-100|66-96 |21-44 | 0-32 |NP-13 | | sand, loamy fine sand | | | | | | | | | | | 40-46 |Loamy fine sand, loamy |SC, SM |A-4, A-2-4 | 0 | 0 |95-100|86-100|78-100|27-45 | 0-27 |NP-10 | | sand | | | | | | | | | | | 46-54 |Sand |SC-SM, SP-SM |A-2-4, A-3, | 0 | 0 |91-100|80-100|60-84 | 5-16 | 0-23 |NP-6 | | | | A-2 | | | | | | | | | 54-72 |Sand |SC-SM, SP-SM |A-3, A-2-4, | 0 | 0 |91-100|80-100|60-84 | 5-16 | 0-23 |NP-6 | | | | A-2 | | | | | | | | | | | | | | | | | | | |TrkAv: | | | | | | | | | | | | Transquaking, | | | | | | | | | | | | very frequently| | | | | | | | | | | | flooded--------| 0-14 |Mucky peat |PT |A-8 | 0 | 0 | 100 | 100 | 100 | 100 | --- | --- | 14-30 |Mucky peat |PT |A-8 | 0 | 0 | 100 | 100 | 100 | 100 | --- | --- | 30-45 |Mucky peat |PT |A-8 | 0 | 0 | 100 | 100 | 100 | 100 | --- | --- | 45-70 |Mucky peat |PT |A-8 | 0 | 0 | 100 | 100 | 100 | 100 | --- | --- | 70-90 |Muck |PT |A-8 | 0 | 0 | 100 | 100 | 100 | 100 | --- | --- | | | | | | | | | | | |
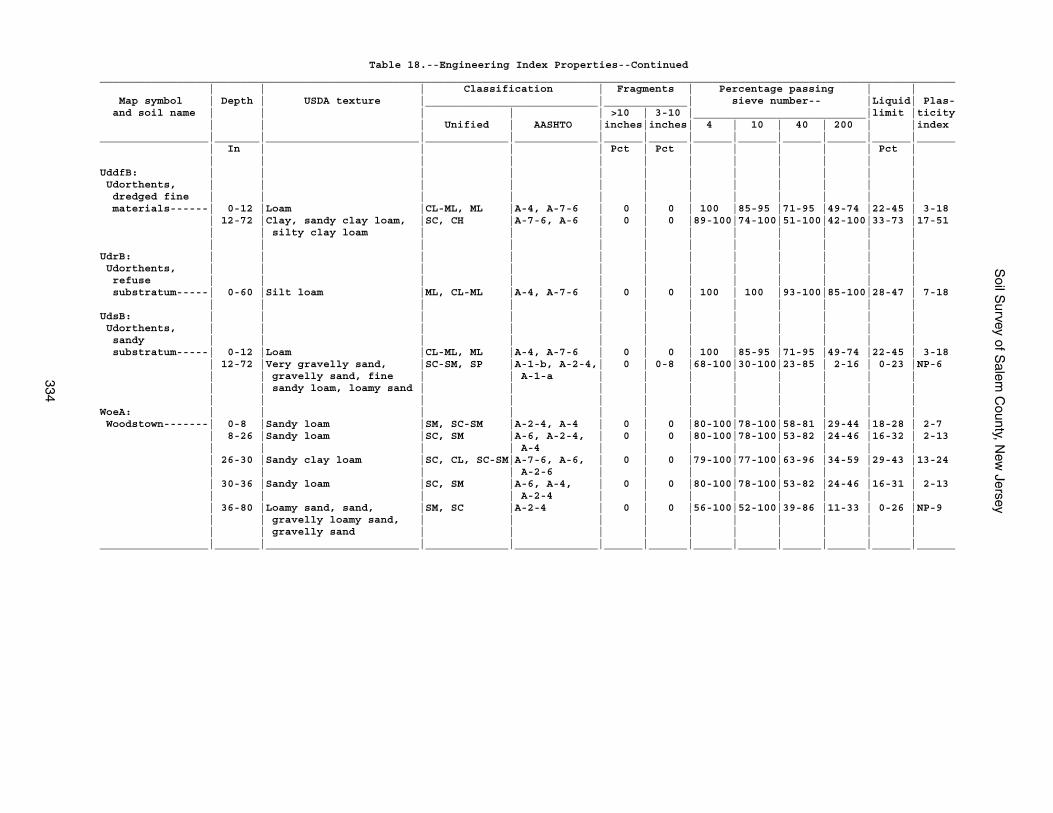
Soil S
urvey of Salem
County, N
ew Jersey
334
Table 18.--Engineering Index Properties--Continued______________________________________________________________________________________________________________________________________ | | | Classification | Fragments | Percentage passing | | Map symbol | Depth | USDA texture |___________________________|_____________| sieve number-- |Liquid| Plas- and soil name | | | | | >10 | 3-10 |___________________________|limit |ticity | | | Unified | AASHTO |inches|inches| 4 | 10 | 40 | 200 | |index_________________|_______|________________________|_____________|_____________|______|______|______|______|______|______|______|______ | In | | | | Pct | Pct | | | | | Pct | | | | | | | | | | | | |UddfB: | | | | | | | | | | | | Udorthents, | | | | | | | | | | | | dredged fine | | | | | | | | | | | | materials------| 0-12 |Loam |CL-ML, ML |A-4, A-7-6 | 0 | 0 | 100 |85-95 |71-95 |49-74 |22-45 | 3-18 | 12-72 |Clay, sandy clay loam, |SC, CH |A-7-6, A-6 | 0 | 0 |89-100|74-100|51-100|42-100|33-73 |17-51 | | silty clay loam | | | | | | | | | | | | | | | | | | | | | |UdrB: | | | | | | | | | | | | Udorthents, | | | | | | | | | | | | refuse | | | | | | | | | | | | substratum-----| 0-60 |Silt loam |ML, CL-ML |A-4, A-7-6 | 0 | 0 | 100 | 100 |93-100|85-100|28-47 | 7-18 | | | | | | | | | | | |UdsB: | | | | | | | | | | | | Udorthents, | | | | | | | | | | | | sandy | | | | | | | | | | | | substratum-----| 0-12 |Loam |CL-ML, ML |A-4, A-7-6 | 0 | 0 | 100 |85-95 |71-95 |49-74 |22-45 | 3-18 | 12-72 |Very gravelly sand, |SC-SM, SP |A-1-b, A-2-4,| 0 | 0-8 |68-100|30-100|23-85 | 2-16 | 0-23 |NP-6 | | gravelly sand, fine | | A-1-a | | | | | | | | | | sandy loam, loamy sand | | | | | | | | | | | | | | | | | | | | | |WoeA: | | | | | | | | | | | | Woodstown-------| 0-8 |Sandy loam |SM, SC-SM |A-2-4, A-4 | 0 | 0 |80-100|78-100|58-81 |29-44 |18-28 | 2-7 | 8-26 |Sandy loam |SC, SM |A-6, A-2-4, | 0 | 0 |80-100|78-100|53-82 |24-46 |16-32 | 2-13 | | | | A-4 | | | | | | | | | 26-30 |Sandy clay loam |SC, CL, SC-SM|A-7-6, A-6, | 0 | 0 |79-100|77-100|63-96 |34-59 |29-43 |13-24 | | | | A-2-6 | | | | | | | | | 30-36 |Sandy loam |SC, SM |A-6, A-4, | 0 | 0 |80-100|78-100|53-82 |24-46 |16-31 | 2-13 | | | | A-2-4 | | | | | | | | | 36-80 |Loamy sand, sand, |SM, SC |A-2-4 | 0 | 0 |56-100|52-100|39-86 |11-33 | 0-26 |NP-9 | | gravelly loamy sand, | | | | | | | | | | | | gravelly sand | | | | | | | | | |_________________|_______|________________________|_____________|_____________|______|______|______|______|______|______|______|______
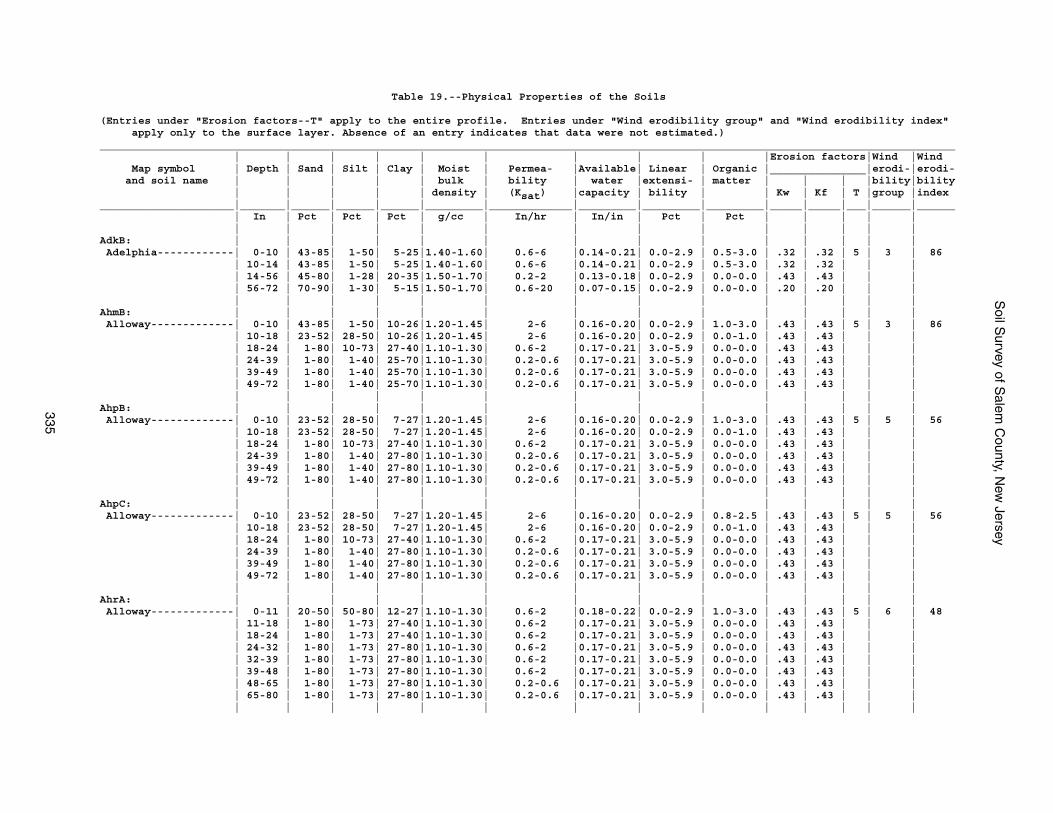
Soil S
urvey of Salem
County, N
ew Jersey
335
Table 19.--Physical Properties of the Soils
(Entries under "Erosion factors--T" apply to the entire profile. Entries under "Wind erodibility group" and "Wind erodibility index" apply only to the surface layer. Absence of an entry indicates that data were not estimated.)______________________________________________________________________________________________________________________________________ | | | | | | | | | |Erosion factors|Wind |Wind Map symbol | Depth | Sand | Silt | Clay | Moist | Permea- |Available| Linear | Organic |_______________|erodi-|erodi- and soil name | | | | | bulk | bility | water |extensi- | matter | | | |bility|bility | | | | | density | (Ksat) |capacity | bility | | Kw | Kf | T |group |index_____________________|_______|______|______|______|_________|_____________|_________|_________|_________|_____|_____|___|______|______ | In | Pct | Pct | Pct | g/cc | In/hr | In/in | Pct | Pct | | | | | | | | | | | | | | | | | | |AdkB: | | | | | | | | | | | | | | Adelphia------------| 0-10 | 43-85| 1-50| 5-25|1.40-1.60| 0.6-6 |0.14-0.21| 0.0-2.9 | 0.5-3.0 | .32 | .32 | 5 | 3 | 86 | 10-14 | 43-85| 1-50| 5-25|1.40-1.60| 0.6-6 |0.14-0.21| 0.0-2.9 | 0.5-3.0 | .32 | .32 | | | | 14-56 | 45-80| 1-28| 20-35|1.50-1.70| 0.2-2 |0.13-0.18| 0.0-2.9 | 0.0-0.0 | .43 | .43 | | | | 56-72 | 70-90| 1-30| 5-15|1.50-1.70| 0.6-20 |0.07-0.15| 0.0-2.9 | 0.0-0.0 | .20 | .20 | | | | | | | | | | | | | | | | |AhmB: | | | | | | | | | | | | | | Alloway-------------| 0-10 | 43-85| 1-50| 10-26|1.20-1.45| 2-6 |0.16-0.20| 0.0-2.9 | 1.0-3.0 | .43 | .43 | 5 | 3 | 86 | 10-18 | 23-52| 28-50| 10-26|1.20-1.45| 2-6 |0.16-0.20| 0.0-2.9 | 0.0-1.0 | .43 | .43 | | | | 18-24 | 1-80| 10-73| 27-40|1.10-1.30| 0.6-2 |0.17-0.21| 3.0-5.9 | 0.0-0.0 | .43 | .43 | | | | 24-39 | 1-80| 1-40| 25-70|1.10-1.30| 0.2-0.6 |0.17-0.21| 3.0-5.9 | 0.0-0.0 | .43 | .43 | | | | 39-49 | 1-80| 1-40| 25-70|1.10-1.30| 0.2-0.6 |0.17-0.21| 3.0-5.9 | 0.0-0.0 | .43 | .43 | | | | 49-72 | 1-80| 1-40| 25-70|1.10-1.30| 0.2-0.6 |0.17-0.21| 3.0-5.9 | 0.0-0.0 | .43 | .43 | | | | | | | | | | | | | | | | |AhpB: | | | | | | | | | | | | | | Alloway-------------| 0-10 | 23-52| 28-50| 7-27|1.20-1.45| 2-6 |0.16-0.20| 0.0-2.9 | 1.0-3.0 | .43 | .43 | 5 | 5 | 56 | 10-18 | 23-52| 28-50| 7-27|1.20-1.45| 2-6 |0.16-0.20| 0.0-2.9 | 0.0-1.0 | .43 | .43 | | | | 18-24 | 1-80| 10-73| 27-40|1.10-1.30| 0.6-2 |0.17-0.21| 3.0-5.9 | 0.0-0.0 | .43 | .43 | | | | 24-39 | 1-80| 1-40| 27-80|1.10-1.30| 0.2-0.6 |0.17-0.21| 3.0-5.9 | 0.0-0.0 | .43 | .43 | | | | 39-49 | 1-80| 1-40| 27-80|1.10-1.30| 0.2-0.6 |0.17-0.21| 3.0-5.9 | 0.0-0.0 | .43 | .43 | | | | 49-72 | 1-80| 1-40| 27-80|1.10-1.30| 0.2-0.6 |0.17-0.21| 3.0-5.9 | 0.0-0.0 | .43 | .43 | | | | | | | | | | | | | | | | |AhpC: | | | | | | | | | | | | | | Alloway-------------| 0-10 | 23-52| 28-50| 7-27|1.20-1.45| 2-6 |0.16-0.20| 0.0-2.9 | 0.8-2.5 | .43 | .43 | 5 | 5 | 56 | 10-18 | 23-52| 28-50| 7-27|1.20-1.45| 2-6 |0.16-0.20| 0.0-2.9 | 0.0-1.0 | .43 | .43 | | | | 18-24 | 1-80| 10-73| 27-40|1.10-1.30| 0.6-2 |0.17-0.21| 3.0-5.9 | 0.0-0.0 | .43 | .43 | | | | 24-39 | 1-80| 1-40| 27-80|1.10-1.30| 0.2-0.6 |0.17-0.21| 3.0-5.9 | 0.0-0.0 | .43 | .43 | | | | 39-49 | 1-80| 1-40| 27-80|1.10-1.30| 0.2-0.6 |0.17-0.21| 3.0-5.9 | 0.0-0.0 | .43 | .43 | | | | 49-72 | 1-80| 1-40| 27-80|1.10-1.30| 0.2-0.6 |0.17-0.21| 3.0-5.9 | 0.0-0.0 | .43 | .43 | | | | | | | | | | | | | | | | |AhrA: | | | | | | | | | | | | | | Alloway-------------| 0-11 | 20-50| 50-80| 12-27|1.10-1.30| 0.6-2 |0.18-0.22| 0.0-2.9 | 1.0-3.0 | .43 | .43 | 5 | 6 | 48 | 11-18 | 1-80| 1-73| 27-40|1.10-1.30| 0.6-2 |0.17-0.21| 3.0-5.9 | 0.0-0.0 | .43 | .43 | | | | 18-24 | 1-80| 1-73| 27-40|1.10-1.30| 0.6-2 |0.17-0.21| 3.0-5.9 | 0.0-0.0 | .43 | .43 | | | | 24-32 | 1-80| 1-73| 27-80|1.10-1.30| 0.6-2 |0.17-0.21| 3.0-5.9 | 0.0-0.0 | .43 | .43 | | | | 32-39 | 1-80| 1-73| 27-80|1.10-1.30| 0.6-2 |0.17-0.21| 3.0-5.9 | 0.0-0.0 | .43 | .43 | | | | 39-48 | 1-80| 1-73| 27-80|1.10-1.30| 0.6-2 |0.17-0.21| 3.0-5.9 | 0.0-0.0 | .43 | .43 | | | | 48-65 | 1-80| 1-73| 27-80|1.10-1.30| 0.2-0.6 |0.17-0.21| 3.0-5.9 | 0.0-0.0 | .43 | .43 | | | | 65-80 | 1-80| 1-73| 27-80|1.10-1.30| 0.2-0.6 |0.17-0.21| 3.0-5.9 | 0.0-0.0 | .43 | .43 | | | | | | | | | | | | | | | | |
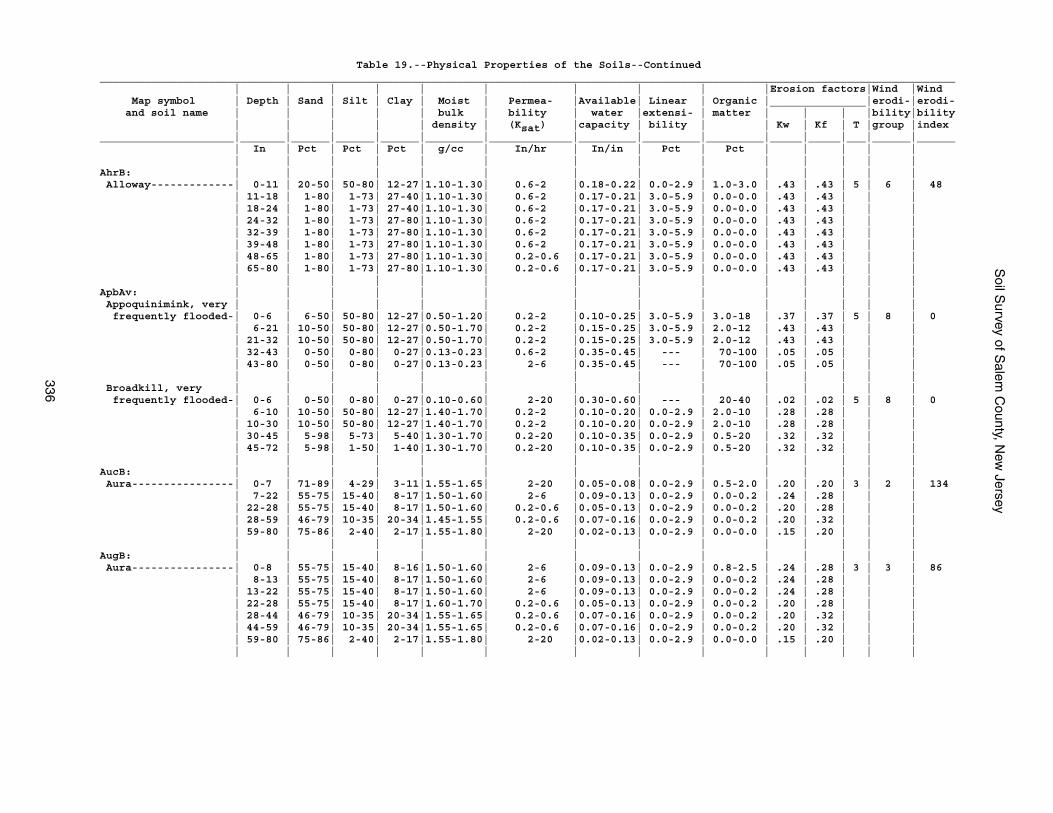
Soil S
urvey of Salem
County, N
ew Jersey
336
Table 19.--Physical Properties of the Soils--Continued______________________________________________________________________________________________________________________________________ | | | | | | | | | |Erosion factors|Wind |Wind Map symbol | Depth | Sand | Silt | Clay | Moist | Permea- |Available| Linear | Organic |_______________|erodi-|erodi- and soil name | | | | | bulk | bility | water |extensi- | matter | | | |bility|bility | | | | | density | (Ksat) |capacity | bility | | Kw | Kf | T |group |index_____________________|_______|______|______|______|_________|_____________|_________|_________|_________|_____|_____|___|______|______ | In | Pct | Pct | Pct | g/cc | In/hr | In/in | Pct | Pct | | | | | | | | | | | | | | | | | | |AhrB: | | | | | | | | | | | | | | Alloway-------------| 0-11 | 20-50| 50-80| 12-27|1.10-1.30| 0.6-2 |0.18-0.22| 0.0-2.9 | 1.0-3.0 | .43 | .43 | 5 | 6 | 48 | 11-18 | 1-80| 1-73| 27-40|1.10-1.30| 0.6-2 |0.17-0.21| 3.0-5.9 | 0.0-0.0 | .43 | .43 | | | | 18-24 | 1-80| 1-73| 27-40|1.10-1.30| 0.6-2 |0.17-0.21| 3.0-5.9 | 0.0-0.0 | .43 | .43 | | | | 24-32 | 1-80| 1-73| 27-80|1.10-1.30| 0.6-2 |0.17-0.21| 3.0-5.9 | 0.0-0.0 | .43 | .43 | | | | 32-39 | 1-80| 1-73| 27-80|1.10-1.30| 0.6-2 |0.17-0.21| 3.0-5.9 | 0.0-0.0 | .43 | .43 | | | | 39-48 | 1-80| 1-73| 27-80|1.10-1.30| 0.6-2 |0.17-0.21| 3.0-5.9 | 0.0-0.0 | .43 | .43 | | | | 48-65 | 1-80| 1-73| 27-80|1.10-1.30| 0.2-0.6 |0.17-0.21| 3.0-5.9 | 0.0-0.0 | .43 | .43 | | | | 65-80 | 1-80| 1-73| 27-80|1.10-1.30| 0.2-0.6 |0.17-0.21| 3.0-5.9 | 0.0-0.0 | .43 | .43 | | | | | | | | | | | | | | | | |ApbAv: | | | | | | | | | | | | | | Appoquinimink, very | | | | | | | | | | | | | | frequently flooded-| 0-6 | 6-50| 50-80| 12-27|0.50-1.20| 0.2-2 |0.10-0.25| 3.0-5.9 | 3.0-18 | .37 | .37 | 5 | 8 | 0 | 6-21 | 10-50| 50-80| 12-27|0.50-1.70| 0.2-2 |0.15-0.25| 3.0-5.9 | 2.0-12 | .43 | .43 | | | | 21-32 | 10-50| 50-80| 12-27|0.50-1.70| 0.2-2 |0.15-0.25| 3.0-5.9 | 2.0-12 | .43 | .43 | | | | 32-43 | 0-50| 0-80| 0-27|0.13-0.23| 0.6-2 |0.35-0.45| --- | 70-100 | .05 | .05 | | | | 43-80 | 0-50| 0-80| 0-27|0.13-0.23| 2-6 |0.35-0.45| --- | 70-100 | .05 | .05 | | | | | | | | | | | | | | | | | Broadkill, very | | | | | | | | | | | | | | frequently flooded-| 0-6 | 0-50| 0-80| 0-27|0.10-0.60| 2-20 |0.30-0.60| --- | 20-40 | .02 | .02 | 5 | 8 | 0 | 6-10 | 10-50| 50-80| 12-27|1.40-1.70| 0.2-2 |0.10-0.20| 0.0-2.9 | 2.0-10 | .28 | .28 | | | | 10-30 | 10-50| 50-80| 12-27|1.40-1.70| 0.2-2 |0.10-0.20| 0.0-2.9 | 2.0-10 | .28 | .28 | | | | 30-45 | 5-98| 5-73| 5-40|1.30-1.70| 0.2-20 |0.10-0.35| 0.0-2.9 | 0.5-20 | .32 | .32 | | | | 45-72 | 5-98| 1-50| 1-40|1.30-1.70| 0.2-20 |0.10-0.35| 0.0-2.9 | 0.5-20 | .32 | .32 | | | | | | | | | | | | | | | | |AucB: | | | | | | | | | | | | | | Aura----------------| 0-7 | 71-89| 4-29| 3-11|1.55-1.65| 2-20 |0.05-0.08| 0.0-2.9 | 0.5-2.0 | .20 | .20 | 3 | 2 | 134 | 7-22 | 55-75| 15-40| 8-17|1.50-1.60| 2-6 |0.09-0.13| 0.0-2.9 | 0.0-0.2 | .24 | .28 | | | | 22-28 | 55-75| 15-40| 8-17|1.50-1.60| 0.2-0.6 |0.05-0.13| 0.0-2.9 | 0.0-0.2 | .20 | .28 | | | | 28-59 | 46-79| 10-35| 20-34|1.45-1.55| 0.2-0.6 |0.07-0.16| 0.0-2.9 | 0.0-0.2 | .20 | .32 | | | | 59-80 | 75-86| 2-40| 2-17|1.55-1.80| 2-20 |0.02-0.13| 0.0-2.9 | 0.0-0.0 | .15 | .20 | | | | | | | | | | | | | | | | |AugB: | | | | | | | | | | | | | | Aura----------------| 0-8 | 55-75| 15-40| 8-16|1.50-1.60| 2-6 |0.09-0.13| 0.0-2.9 | 0.8-2.5 | .24 | .28 | 3 | 3 | 86 | 8-13 | 55-75| 15-40| 8-17|1.50-1.60| 2-6 |0.09-0.13| 0.0-2.9 | 0.0-0.2 | .24 | .28 | | | | 13-22 | 55-75| 15-40| 8-17|1.50-1.60| 2-6 |0.09-0.13| 0.0-2.9 | 0.0-0.2 | .24 | .28 | | | | 22-28 | 55-75| 15-40| 8-17|1.60-1.70| 0.2-0.6 |0.05-0.13| 0.0-2.9 | 0.0-0.2 | .20 | .28 | | | | 28-44 | 46-79| 10-35| 20-34|1.55-1.65| 0.2-0.6 |0.07-0.16| 0.0-2.9 | 0.0-0.2 | .20 | .32 | | | | 44-59 | 46-79| 10-35| 20-34|1.55-1.65| 0.2-0.6 |0.07-0.16| 0.0-2.9 | 0.0-0.2 | .20 | .32 | | | | 59-80 | 75-86| 2-40| 2-17|1.55-1.80| 2-20 |0.02-0.13| 0.0-2.9 | 0.0-0.0 | .15 | .20 | | | | | | | | | | | | | | | | |
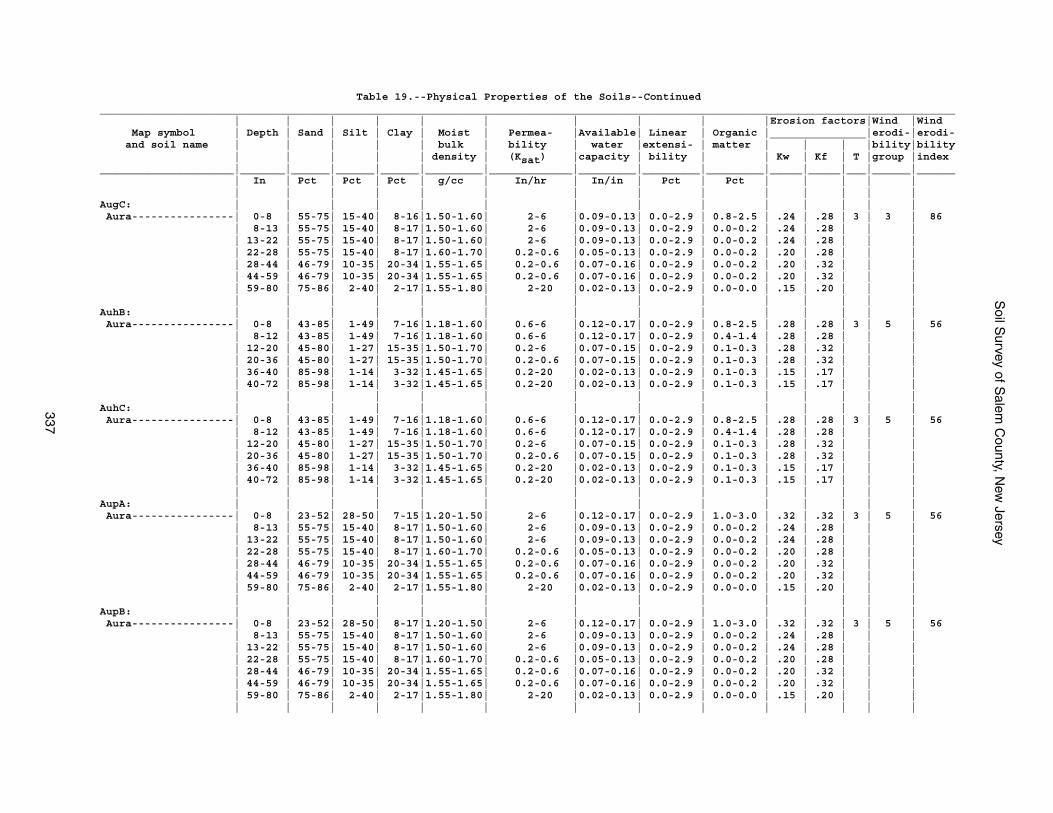
Soil S
urvey of Salem
County, N
ew Jersey
337
Table 19.--Physical Properties of the Soils--Continued______________________________________________________________________________________________________________________________________ | | | | | | | | | |Erosion factors|Wind |Wind Map symbol | Depth | Sand | Silt | Clay | Moist | Permea- |Available| Linear | Organic |_______________|erodi-|erodi- and soil name | | | | | bulk | bility | water |extensi- | matter | | | |bility|bility | | | | | density | (Ksat) |capacity | bility | | Kw | Kf | T |group |index_____________________|_______|______|______|______|_________|_____________|_________|_________|_________|_____|_____|___|______|______ | In | Pct | Pct | Pct | g/cc | In/hr | In/in | Pct | Pct | | | | | | | | | | | | | | | | | | |AugC: | | | | | | | | | | | | | | Aura----------------| 0-8 | 55-75| 15-40| 8-16|1.50-1.60| 2-6 |0.09-0.13| 0.0-2.9 | 0.8-2.5 | .24 | .28 | 3 | 3 | 86 | 8-13 | 55-75| 15-40| 8-17|1.50-1.60| 2-6 |0.09-0.13| 0.0-2.9 | 0.0-0.2 | .24 | .28 | | | | 13-22 | 55-75| 15-40| 8-17|1.50-1.60| 2-6 |0.09-0.13| 0.0-2.9 | 0.0-0.2 | .24 | .28 | | | | 22-28 | 55-75| 15-40| 8-17|1.60-1.70| 0.2-0.6 |0.05-0.13| 0.0-2.9 | 0.0-0.2 | .20 | .28 | | | | 28-44 | 46-79| 10-35| 20-34|1.55-1.65| 0.2-0.6 |0.07-0.16| 0.0-2.9 | 0.0-0.2 | .20 | .32 | | | | 44-59 | 46-79| 10-35| 20-34|1.55-1.65| 0.2-0.6 |0.07-0.16| 0.0-2.9 | 0.0-0.2 | .20 | .32 | | | | 59-80 | 75-86| 2-40| 2-17|1.55-1.80| 2-20 |0.02-0.13| 0.0-2.9 | 0.0-0.0 | .15 | .20 | | | | | | | | | | | | | | | | |AuhB: | | | | | | | | | | | | | | Aura----------------| 0-8 | 43-85| 1-49| 7-16|1.18-1.60| 0.6-6 |0.12-0.17| 0.0-2.9 | 0.8-2.5 | .28 | .28 | 3 | 5 | 56 | 8-12 | 43-85| 1-49| 7-16|1.18-1.60| 0.6-6 |0.12-0.17| 0.0-2.9 | 0.4-1.4 | .28 | .28 | | | | 12-20 | 45-80| 1-27| 15-35|1.50-1.70| 0.2-6 |0.07-0.15| 0.0-2.9 | 0.1-0.3 | .28 | .32 | | | | 20-36 | 45-80| 1-27| 15-35|1.50-1.70| 0.2-0.6 |0.07-0.15| 0.0-2.9 | 0.1-0.3 | .28 | .32 | | | | 36-40 | 85-98| 1-14| 3-32|1.45-1.65| 0.2-20 |0.02-0.13| 0.0-2.9 | 0.1-0.3 | .15 | .17 | | | | 40-72 | 85-98| 1-14| 3-32|1.45-1.65| 0.2-20 |0.02-0.13| 0.0-2.9 | 0.1-0.3 | .15 | .17 | | | | | | | | | | | | | | | | |AuhC: | | | | | | | | | | | | | | Aura----------------| 0-8 | 43-85| 1-49| 7-16|1.18-1.60| 0.6-6 |0.12-0.17| 0.0-2.9 | 0.8-2.5 | .28 | .28 | 3 | 5 | 56 | 8-12 | 43-85| 1-49| 7-16|1.18-1.60| 0.6-6 |0.12-0.17| 0.0-2.9 | 0.4-1.4 | .28 | .28 | | | | 12-20 | 45-80| 1-27| 15-35|1.50-1.70| 0.2-6 |0.07-0.15| 0.0-2.9 | 0.1-0.3 | .28 | .32 | | | | 20-36 | 45-80| 1-27| 15-35|1.50-1.70| 0.2-0.6 |0.07-0.15| 0.0-2.9 | 0.1-0.3 | .28 | .32 | | | | 36-40 | 85-98| 1-14| 3-32|1.45-1.65| 0.2-20 |0.02-0.13| 0.0-2.9 | 0.1-0.3 | .15 | .17 | | | | 40-72 | 85-98| 1-14| 3-32|1.45-1.65| 0.2-20 |0.02-0.13| 0.0-2.9 | 0.1-0.3 | .15 | .17 | | | | | | | | | | | | | | | | |AupA: | | | | | | | | | | | | | | Aura----------------| 0-8 | 23-52| 28-50| 7-15|1.20-1.50| 2-6 |0.12-0.17| 0.0-2.9 | 1.0-3.0 | .32 | .32 | 3 | 5 | 56 | 8-13 | 55-75| 15-40| 8-17|1.50-1.60| 2-6 |0.09-0.13| 0.0-2.9 | 0.0-0.2 | .24 | .28 | | | | 13-22 | 55-75| 15-40| 8-17|1.50-1.60| 2-6 |0.09-0.13| 0.0-2.9 | 0.0-0.2 | .24 | .28 | | | | 22-28 | 55-75| 15-40| 8-17|1.60-1.70| 0.2-0.6 |0.05-0.13| 0.0-2.9 | 0.0-0.2 | .20 | .28 | | | | 28-44 | 46-79| 10-35| 20-34|1.55-1.65| 0.2-0.6 |0.07-0.16| 0.0-2.9 | 0.0-0.2 | .20 | .32 | | | | 44-59 | 46-79| 10-35| 20-34|1.55-1.65| 0.2-0.6 |0.07-0.16| 0.0-2.9 | 0.0-0.2 | .20 | .32 | | | | 59-80 | 75-86| 2-40| 2-17|1.55-1.80| 2-20 |0.02-0.13| 0.0-2.9 | 0.0-0.0 | .15 | .20 | | | | | | | | | | | | | | | | |AupB: | | | | | | | | | | | | | | Aura----------------| 0-8 | 23-52| 28-50| 8-17|1.20-1.50| 2-6 |0.12-0.17| 0.0-2.9 | 1.0-3.0 | .32 | .32 | 3 | 5 | 56 | 8-13 | 55-75| 15-40| 8-17|1.50-1.60| 2-6 |0.09-0.13| 0.0-2.9 | 0.0-0.2 | .24 | .28 | | | | 13-22 | 55-75| 15-40| 8-17|1.50-1.60| 2-6 |0.09-0.13| 0.0-2.9 | 0.0-0.2 | .24 | .28 | | | | 22-28 | 55-75| 15-40| 8-17|1.60-1.70| 0.2-0.6 |0.05-0.13| 0.0-2.9 | 0.0-0.2 | .20 | .28 | | | | 28-44 | 46-79| 10-35| 20-34|1.55-1.65| 0.2-0.6 |0.07-0.16| 0.0-2.9 | 0.0-0.2 | .20 | .32 | | | | 44-59 | 46-79| 10-35| 20-34|1.55-1.65| 0.2-0.6 |0.07-0.16| 0.0-2.9 | 0.0-0.2 | .20 | .32 | | | | 59-80 | 75-86| 2-40| 2-17|1.55-1.80| 2-20 |0.02-0.13| 0.0-2.9 | 0.0-0.0 | .15 | .20 | | | | | | | | | | | | | | | | |
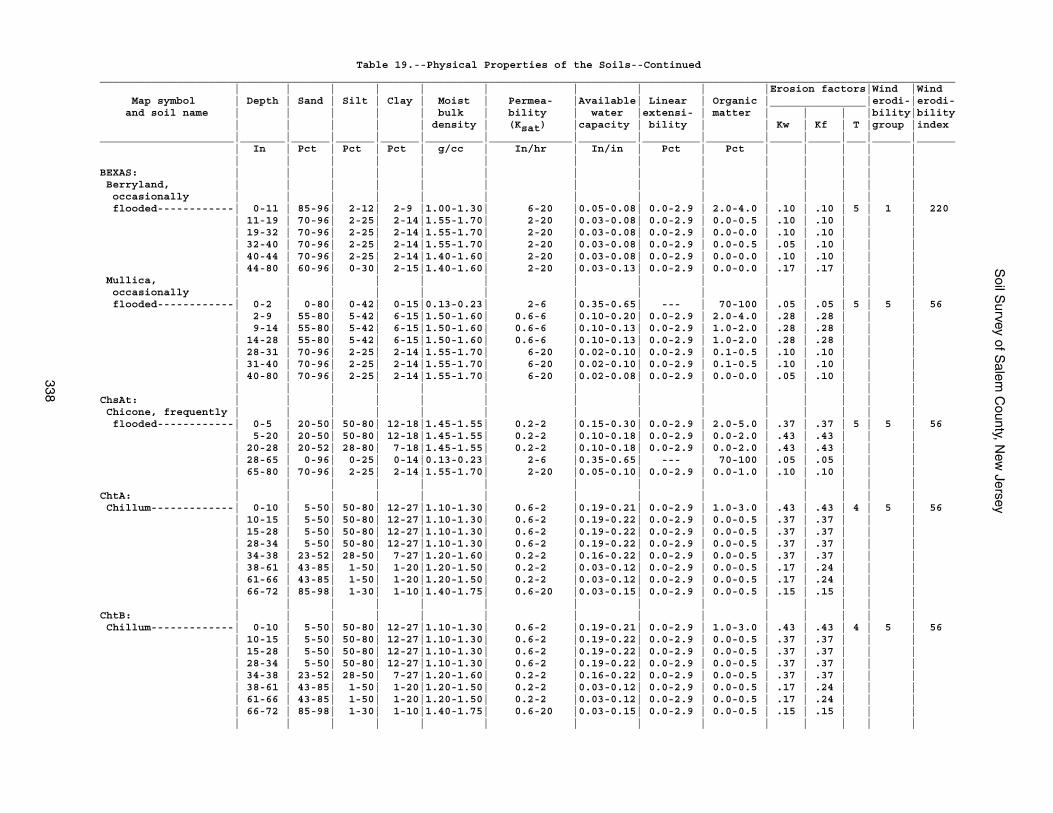
Soil S
urvey of Salem
County, N
ew Jersey
338
Table 19.--Physical Properties of the Soils--Continued______________________________________________________________________________________________________________________________________ | | | | | | | | | |Erosion factors|Wind |Wind Map symbol | Depth | Sand | Silt | Clay | Moist | Permea- |Available| Linear | Organic |_______________|erodi-|erodi- and soil name | | | | | bulk | bility | water |extensi- | matter | | | |bility|bility | | | | | density | (Ksat) |capacity | bility | | Kw | Kf | T |group |index_____________________|_______|______|______|______|_________|_____________|_________|_________|_________|_____|_____|___|______|______ | In | Pct | Pct | Pct | g/cc | In/hr | In/in | Pct | Pct | | | | | | | | | | | | | | | | | | |BEXAS: | | | | | | | | | | | | | | Berryland, | | | | | | | | | | | | | | occasionally | | | | | | | | | | | | | | flooded------------| 0-11 | 85-96| 2-12| 2-9 |1.00-1.30| 6-20 |0.05-0.08| 0.0-2.9 | 2.0-4.0 | .10 | .10 | 5 | 1 | 220 | 11-19 | 70-96| 2-25| 2-14|1.55-1.70| 2-20 |0.03-0.08| 0.0-2.9 | 0.0-0.5 | .10 | .10 | | | | 19-32 | 70-96| 2-25| 2-14|1.55-1.70| 2-20 |0.03-0.08| 0.0-2.9 | 0.0-0.0 | .10 | .10 | | | | 32-40 | 70-96| 2-25| 2-14|1.55-1.70| 2-20 |0.03-0.08| 0.0-2.9 | 0.0-0.5 | .05 | .10 | | | | 40-44 | 70-96| 2-25| 2-14|1.40-1.60| 2-20 |0.03-0.08| 0.0-2.9 | 0.0-0.0 | .10 | .10 | | | | 44-80 | 60-96| 0-30| 2-15|1.40-1.60| 2-20 |0.03-0.13| 0.0-2.9 | 0.0-0.0 | .17 | .17 | | | Mullica, | | | | | | | | | | | | | | occasionally | | | | | | | | | | | | | | flooded------------| 0-2 | 0-80| 0-42| 0-15|0.13-0.23| 2-6 |0.35-0.65| --- | 70-100 | .05 | .05 | 5 | 5 | 56 | 2-9 | 55-80| 5-42| 6-15|1.50-1.60| 0.6-6 |0.10-0.20| 0.0-2.9 | 2.0-4.0 | .28 | .28 | | | | 9-14 | 55-80| 5-42| 6-15|1.50-1.60| 0.6-6 |0.10-0.13| 0.0-2.9 | 1.0-2.0 | .28 | .28 | | | | 14-28 | 55-80| 5-42| 6-15|1.50-1.60| 0.6-6 |0.10-0.13| 0.0-2.9 | 1.0-2.0 | .28 | .28 | | | | 28-31 | 70-96| 2-25| 2-14|1.55-1.70| 6-20 |0.02-0.10| 0.0-2.9 | 0.1-0.5 | .10 | .10 | | | | 31-40 | 70-96| 2-25| 2-14|1.55-1.70| 6-20 |0.02-0.10| 0.0-2.9 | 0.1-0.5 | .10 | .10 | | | | 40-80 | 70-96| 2-25| 2-14|1.55-1.70| 6-20 |0.02-0.08| 0.0-2.9 | 0.0-0.0 | .05 | .10 | | | | | | | | | | | | | | | | |ChsAt: | | | | | | | | | | | | | | Chicone, frequently | | | | | | | | | | | | | | flooded------------| 0-5 | 20-50| 50-80| 12-18|1.45-1.55| 0.2-2 |0.15-0.30| 0.0-2.9 | 2.0-5.0 | .37 | .37 | 5 | 5 | 56 | 5-20 | 20-50| 50-80| 12-18|1.45-1.55| 0.2-2 |0.10-0.18| 0.0-2.9 | 0.0-2.0 | .43 | .43 | | | | 20-28 | 20-52| 28-80| 7-18|1.45-1.55| 0.2-2 |0.10-0.18| 0.0-2.9 | 0.0-2.0 | .43 | .43 | | | | 28-65 | 0-96| 0-25| 0-14|0.13-0.23| 2-6 |0.35-0.65| --- | 70-100 | .05 | .05 | | | | 65-80 | 70-96| 2-25| 2-14|1.55-1.70| 2-20 |0.05-0.10| 0.0-2.9 | 0.0-1.0 | .10 | .10 | | | | | | | | | | | | | | | | |ChtA: | | | | | | | | | | | | | | Chillum-------------| 0-10 | 5-50| 50-80| 12-27|1.10-1.30| 0.6-2 |0.19-0.21| 0.0-2.9 | 1.0-3.0 | .43 | .43 | 4 | 5 | 56 | 10-15 | 5-50| 50-80| 12-27|1.10-1.30| 0.6-2 |0.19-0.22| 0.0-2.9 | 0.0-0.5 | .37 | .37 | | | | 15-28 | 5-50| 50-80| 12-27|1.10-1.30| 0.6-2 |0.19-0.22| 0.0-2.9 | 0.0-0.5 | .37 | .37 | | | | 28-34 | 5-50| 50-80| 12-27|1.10-1.30| 0.6-2 |0.19-0.22| 0.0-2.9 | 0.0-0.5 | .37 | .37 | | | | 34-38 | 23-52| 28-50| 7-27|1.20-1.60| 0.2-2 |0.16-0.22| 0.0-2.9 | 0.0-0.5 | .37 | .37 | | | | 38-61 | 43-85| 1-50| 1-20|1.20-1.50| 0.2-2 |0.03-0.12| 0.0-2.9 | 0.0-0.5 | .17 | .24 | | | | 61-66 | 43-85| 1-50| 1-20|1.20-1.50| 0.2-2 |0.03-0.12| 0.0-2.9 | 0.0-0.5 | .17 | .24 | | | | 66-72 | 85-98| 1-30| 1-10|1.40-1.75| 0.6-20 |0.03-0.15| 0.0-2.9 | 0.0-0.5 | .15 | .15 | | | | | | | | | | | | | | | | |ChtB: | | | | | | | | | | | | | | Chillum-------------| 0-10 | 5-50| 50-80| 12-27|1.10-1.30| 0.6-2 |0.19-0.21| 0.0-2.9 | 1.0-3.0 | .43 | .43 | 4 | 5 | 56 | 10-15 | 5-50| 50-80| 12-27|1.10-1.30| 0.6-2 |0.19-0.22| 0.0-2.9 | 0.0-0.5 | .37 | .37 | | | | 15-28 | 5-50| 50-80| 12-27|1.10-1.30| 0.6-2 |0.19-0.22| 0.0-2.9 | 0.0-0.5 | .37 | .37 | | | | 28-34 | 5-50| 50-80| 12-27|1.10-1.30| 0.6-2 |0.19-0.22| 0.0-2.9 | 0.0-0.5 | .37 | .37 | | | | 34-38 | 23-52| 28-50| 7-27|1.20-1.60| 0.2-2 |0.16-0.22| 0.0-2.9 | 0.0-0.5 | .37 | .37 | | | | 38-61 | 43-85| 1-50| 1-20|1.20-1.50| 0.2-2 |0.03-0.12| 0.0-2.9 | 0.0-0.5 | .17 | .24 | | | | 61-66 | 43-85| 1-50| 1-20|1.20-1.50| 0.2-2 |0.03-0.12| 0.0-2.9 | 0.0-0.5 | .17 | .24 | | | | 66-72 | 85-98| 1-30| 1-10|1.40-1.75| 0.6-20 |0.03-0.15| 0.0-2.9 | 0.0-0.5 | .15 | .15 | | | | | | | | | | | | | | | | |
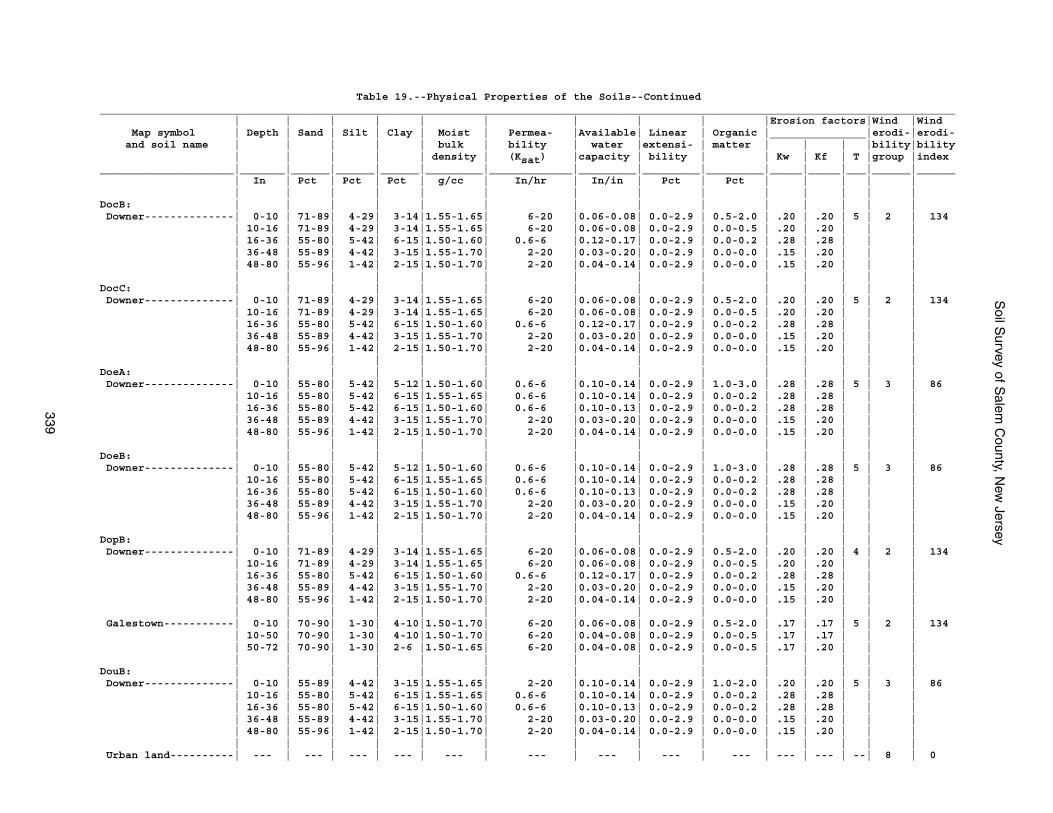
Soil S
urvey of Salem
County, N
ew Jersey
339
Table 19.--Physical Properties of the Soils--Continued______________________________________________________________________________________________________________________________________ | | | | | | | | | |Erosion factors|Wind |Wind Map symbol | Depth | Sand | Silt | Clay | Moist | Permea- |Available| Linear | Organic |_______________|erodi-|erodi- and soil name | | | | | bulk | bility | water |extensi- | matter | | | |bility|bility | | | | | density | (Ksat) |capacity | bility | | Kw | Kf | T |group |index_____________________|_______|______|______|______|_________|_____________|_________|_________|_________|_____|_____|___|______|______ | In | Pct | Pct | Pct | g/cc | In/hr | In/in | Pct | Pct | | | | | | | | | | | | | | | | | | |DocB: | | | | | | | | | | | | | | Downer--------------| 0-10 | 71-89| 4-29| 3-14|1.55-1.65| 6-20 |0.06-0.08| 0.0-2.9 | 0.5-2.0 | .20 | .20 | 5 | 2 | 134 | 10-16 | 71-89| 4-29| 3-14|1.55-1.65| 6-20 |0.06-0.08| 0.0-2.9 | 0.0-0.5 | .20 | .20 | | | | 16-36 | 55-80| 5-42| 6-15|1.50-1.60| 0.6-6 |0.12-0.17| 0.0-2.9 | 0.0-0.2 | .28 | .28 | | | | 36-48 | 55-89| 4-42| 3-15|1.55-1.70| 2-20 |0.03-0.20| 0.0-2.9 | 0.0-0.0 | .15 | .20 | | | | 48-80 | 55-96| 1-42| 2-15|1.50-1.70| 2-20 |0.04-0.14| 0.0-2.9 | 0.0-0.0 | .15 | .20 | | | | | | | | | | | | | | | | |DocC: | | | | | | | | | | | | | | Downer--------------| 0-10 | 71-89| 4-29| 3-14|1.55-1.65| 6-20 |0.06-0.08| 0.0-2.9 | 0.5-2.0 | .20 | .20 | 5 | 2 | 134 | 10-16 | 71-89| 4-29| 3-14|1.55-1.65| 6-20 |0.06-0.08| 0.0-2.9 | 0.0-0.5 | .20 | .20 | | | | 16-36 | 55-80| 5-42| 6-15|1.50-1.60| 0.6-6 |0.12-0.17| 0.0-2.9 | 0.0-0.2 | .28 | .28 | | | | 36-48 | 55-89| 4-42| 3-15|1.55-1.70| 2-20 |0.03-0.20| 0.0-2.9 | 0.0-0.0 | .15 | .20 | | | | 48-80 | 55-96| 1-42| 2-15|1.50-1.70| 2-20 |0.04-0.14| 0.0-2.9 | 0.0-0.0 | .15 | .20 | | | | | | | | | | | | | | | | |DoeA: | | | | | | | | | | | | | | Downer--------------| 0-10 | 55-80| 5-42| 5-12|1.50-1.60| 0.6-6 |0.10-0.14| 0.0-2.9 | 1.0-3.0 | .28 | .28 | 5 | 3 | 86 | 10-16 | 55-80| 5-42| 6-15|1.55-1.65| 0.6-6 |0.10-0.14| 0.0-2.9 | 0.0-0.2 | .28 | .28 | | | | 16-36 | 55-80| 5-42| 6-15|1.50-1.60| 0.6-6 |0.10-0.13| 0.0-2.9 | 0.0-0.2 | .28 | .28 | | | | 36-48 | 55-89| 4-42| 3-15|1.55-1.70| 2-20 |0.03-0.20| 0.0-2.9 | 0.0-0.0 | .15 | .20 | | | | 48-80 | 55-96| 1-42| 2-15|1.50-1.70| 2-20 |0.04-0.14| 0.0-2.9 | 0.0-0.0 | .15 | .20 | | | | | | | | | | | | | | | | |DoeB: | | | | | | | | | | | | | | Downer--------------| 0-10 | 55-80| 5-42| 5-12|1.50-1.60| 0.6-6 |0.10-0.14| 0.0-2.9 | 1.0-3.0 | .28 | .28 | 5 | 3 | 86 | 10-16 | 55-80| 5-42| 6-15|1.55-1.65| 0.6-6 |0.10-0.14| 0.0-2.9 | 0.0-0.2 | .28 | .28 | | | | 16-36 | 55-80| 5-42| 6-15|1.50-1.60| 0.6-6 |0.10-0.13| 0.0-2.9 | 0.0-0.2 | .28 | .28 | | | | 36-48 | 55-89| 4-42| 3-15|1.55-1.70| 2-20 |0.03-0.20| 0.0-2.9 | 0.0-0.0 | .15 | .20 | | | | 48-80 | 55-96| 1-42| 2-15|1.50-1.70| 2-20 |0.04-0.14| 0.0-2.9 | 0.0-0.0 | .15 | .20 | | | | | | | | | | | | | | | | |DopB: | | | | | | | | | | | | | | Downer--------------| 0-10 | 71-89| 4-29| 3-14|1.55-1.65| 6-20 |0.06-0.08| 0.0-2.9 | 0.5-2.0 | .20 | .20 | 4 | 2 | 134 | 10-16 | 71-89| 4-29| 3-14|1.55-1.65| 6-20 |0.06-0.08| 0.0-2.9 | 0.0-0.5 | .20 | .20 | | | | 16-36 | 55-80| 5-42| 6-15|1.50-1.60| 0.6-6 |0.12-0.17| 0.0-2.9 | 0.0-0.2 | .28 | .28 | | | | 36-48 | 55-89| 4-42| 3-15|1.55-1.70| 2-20 |0.03-0.20| 0.0-2.9 | 0.0-0.0 | .15 | .20 | | | | 48-80 | 55-96| 1-42| 2-15|1.50-1.70| 2-20 |0.04-0.14| 0.0-2.9 | 0.0-0.0 | .15 | .20 | | | | | | | | | | | | | | | | | Galestown-----------| 0-10 | 70-90| 1-30| 4-10|1.50-1.70| 6-20 |0.06-0.08| 0.0-2.9 | 0.5-2.0 | .17 | .17 | 5 | 2 | 134 | 10-50 | 70-90| 1-30| 4-10|1.50-1.70| 6-20 |0.04-0.08| 0.0-2.9 | 0.0-0.5 | .17 | .17 | | | | 50-72 | 70-90| 1-30| 2-6 |1.50-1.65| 6-20 |0.04-0.08| 0.0-2.9 | 0.0-0.5 | .17 | .20 | | | | | | | | | | | | | | | | |DouB: | | | | | | | | | | | | | | Downer--------------| 0-10 | 55-89| 4-42| 3-15|1.55-1.65| 2-20 |0.10-0.14| 0.0-2.9 | 1.0-2.0 | .20 | .20 | 5 | 3 | 86 | 10-16 | 55-80| 5-42| 6-15|1.55-1.65| 0.6-6 |0.10-0.14| 0.0-2.9 | 0.0-0.2 | .28 | .28 | | | | 16-36 | 55-80| 5-42| 6-15|1.50-1.60| 0.6-6 |0.10-0.13| 0.0-2.9 | 0.0-0.2 | .28 | .28 | | | | 36-48 | 55-89| 4-42| 3-15|1.55-1.70| 2-20 |0.03-0.20| 0.0-2.9 | 0.0-0.0 | .15 | .20 | | | | 48-80 | 55-96| 1-42| 2-15|1.50-1.70| 2-20 |0.04-0.14| 0.0-2.9 | 0.0-0.0 | .15 | .20 | | | | | | | | | | | | | | | | | Urban land----------| --- | --- | --- | --- | --- | --- | --- | --- | --- | --- | --- | --| 8 | 0
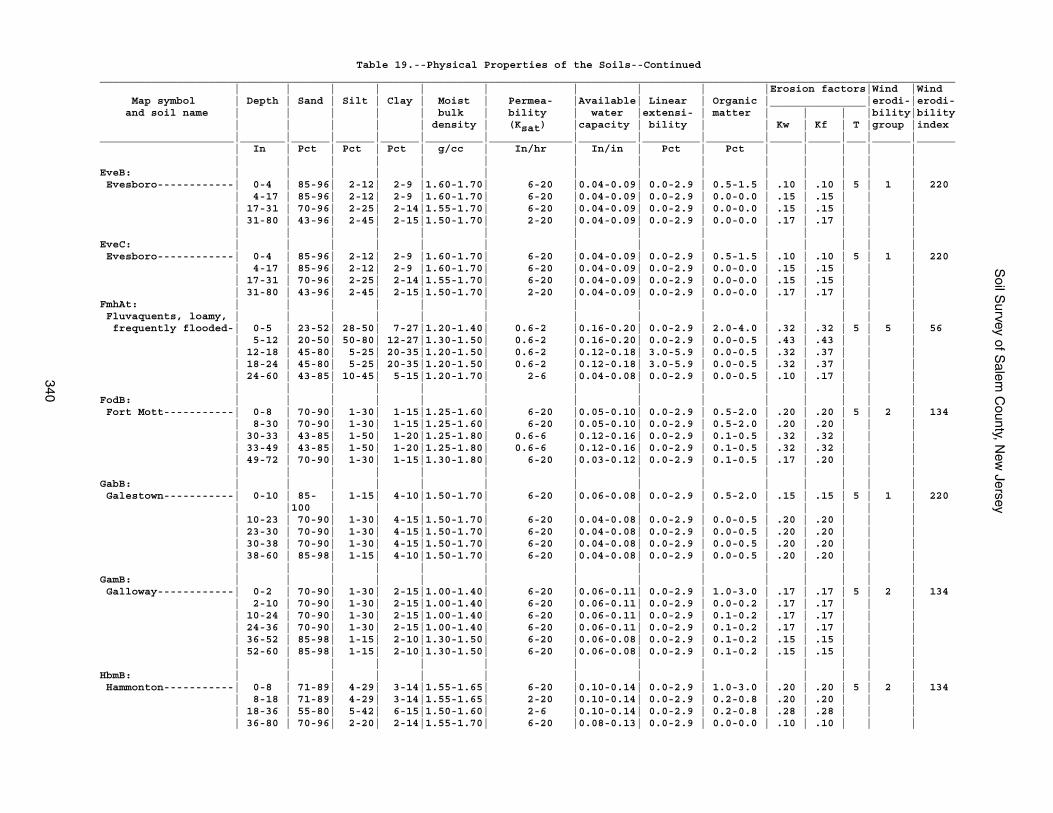
Soil S
urvey of Salem
County, N
ew Jersey
340
Table 19.--Physical Properties of the Soils--Continued______________________________________________________________________________________________________________________________________ | | | | | | | | | |Erosion factors|Wind |Wind Map symbol | Depth | Sand | Silt | Clay | Moist | Permea- |Available| Linear | Organic |_______________|erodi-|erodi- and soil name | | | | | bulk | bility | water |extensi- | matter | | | |bility|bility | | | | | density | (Ksat) |capacity | bility | | Kw | Kf | T |group |index_____________________|_______|______|______|______|_________|_____________|_________|_________|_________|_____|_____|___|______|______ | In | Pct | Pct | Pct | g/cc | In/hr | In/in | Pct | Pct | | | | | | | | | | | | | | | | | | |EveB: | | | | | | | | | | | | | | Evesboro------------| 0-4 | 85-96| 2-12| 2-9 |1.60-1.70| 6-20 |0.04-0.09| 0.0-2.9 | 0.5-1.5 | .10 | .10 | 5 | 1 | 220 | 4-17 | 85-96| 2-12| 2-9 |1.60-1.70| 6-20 |0.04-0.09| 0.0-2.9 | 0.0-0.0 | .15 | .15 | | | | 17-31 | 70-96| 2-25| 2-14|1.55-1.70| 6-20 |0.04-0.09| 0.0-2.9 | 0.0-0.0 | .15 | .15 | | | | 31-80 | 43-96| 2-45| 2-15|1.50-1.70| 2-20 |0.04-0.09| 0.0-2.9 | 0.0-0.0 | .17 | .17 | | | | | | | | | | | | | | | | |EveC: | | | | | | | | | | | | | | Evesboro------------| 0-4 | 85-96| 2-12| 2-9 |1.60-1.70| 6-20 |0.04-0.09| 0.0-2.9 | 0.5-1.5 | .10 | .10 | 5 | 1 | 220 | 4-17 | 85-96| 2-12| 2-9 |1.60-1.70| 6-20 |0.04-0.09| 0.0-2.9 | 0.0-0.0 | .15 | .15 | | | | 17-31 | 70-96| 2-25| 2-14|1.55-1.70| 6-20 |0.04-0.09| 0.0-2.9 | 0.0-0.0 | .15 | .15 | | | | 31-80 | 43-96| 2-45| 2-15|1.50-1.70| 2-20 |0.04-0.09| 0.0-2.9 | 0.0-0.0 | .17 | .17 | | |FmhAt: | | | | | | | | | | | | | | Fluvaquents, loamy, | | | | | | | | | | | | | | frequently flooded-| 0-5 | 23-52| 28-50| 7-27|1.20-1.40| 0.6-2 |0.16-0.20| 0.0-2.9 | 2.0-4.0 | .32 | .32 | 5 | 5 | 56 | 5-12 | 20-50| 50-80| 12-27|1.30-1.50| 0.6-2 |0.16-0.20| 0.0-2.9 | 0.0-0.5 | .43 | .43 | | | | 12-18 | 45-80| 5-25| 20-35|1.20-1.50| 0.6-2 |0.12-0.18| 3.0-5.9 | 0.0-0.5 | .32 | .37 | | | | 18-24 | 45-80| 5-25| 20-35|1.20-1.50| 0.6-2 |0.12-0.18| 3.0-5.9 | 0.0-0.5 | .32 | .37 | | | | 24-60 | 43-85| 10-45| 5-15|1.20-1.70| 2-6 |0.04-0.08| 0.0-2.9 | 0.0-0.5 | .10 | .17 | | | | | | | | | | | | | | | | |FodB: | | | | | | | | | | | | | | Fort Mott-----------| 0-8 | 70-90| 1-30| 1-15|1.25-1.60| 6-20 |0.05-0.10| 0.0-2.9 | 0.5-2.0 | .20 | .20 | 5 | 2 | 134 | 8-30 | 70-90| 1-30| 1-15|1.25-1.60| 6-20 |0.05-0.10| 0.0-2.9 | 0.5-2.0 | .20 | .20 | | | | 30-33 | 43-85| 1-50| 1-20|1.25-1.80| 0.6-6 |0.12-0.16| 0.0-2.9 | 0.1-0.5 | .32 | .32 | | | | 33-49 | 43-85| 1-50| 1-20|1.25-1.80| 0.6-6 |0.12-0.16| 0.0-2.9 | 0.1-0.5 | .32 | .32 | | | | 49-72 | 70-90| 1-30| 1-15|1.30-1.80| 6-20 |0.03-0.12| 0.0-2.9 | 0.1-0.5 | .17 | .20 | | | | | | | | | | | | | | | | |GabB: | | | | | | | | | | | | | | Galestown-----------| 0-10 | 85- | 1-15| 4-10|1.50-1.70| 6-20 |0.06-0.08| 0.0-2.9 | 0.5-2.0 | .15 | .15 | 5 | 1 | 220 | |100 | | | | | | | | | | | | | 10-23 | 70-90| 1-30| 4-15|1.50-1.70| 6-20 |0.04-0.08| 0.0-2.9 | 0.0-0.5 | .20 | .20 | | | | 23-30 | 70-90| 1-30| 4-15|1.50-1.70| 6-20 |0.04-0.08| 0.0-2.9 | 0.0-0.5 | .20 | .20 | | | | 30-38 | 70-90| 1-30| 4-15|1.50-1.70| 6-20 |0.04-0.08| 0.0-2.9 | 0.0-0.5 | .20 | .20 | | | | 38-60 | 85-98| 1-15| 4-10|1.50-1.70| 6-20 |0.04-0.08| 0.0-2.9 | 0.0-0.5 | .20 | .20 | | | | | | | | | | | | | | | | |GamB: | | | | | | | | | | | | | | Galloway------------| 0-2 | 70-90| 1-30| 2-15|1.00-1.40| 6-20 |0.06-0.11| 0.0-2.9 | 1.0-3.0 | .17 | .17 | 5 | 2 | 134 | 2-10 | 70-90| 1-30| 2-15|1.00-1.40| 6-20 |0.06-0.11| 0.0-2.9 | 0.0-0.2 | .17 | .17 | | | | 10-24 | 70-90| 1-30| 2-15|1.00-1.40| 6-20 |0.06-0.11| 0.0-2.9 | 0.1-0.2 | .17 | .17 | | | | 24-36 | 70-90| 1-30| 2-15|1.00-1.40| 6-20 |0.06-0.11| 0.0-2.9 | 0.1-0.2 | .17 | .17 | | | | 36-52 | 85-98| 1-15| 2-10|1.30-1.50| 6-20 |0.06-0.08| 0.0-2.9 | 0.1-0.2 | .15 | .15 | | | | 52-60 | 85-98| 1-15| 2-10|1.30-1.50| 6-20 |0.06-0.08| 0.0-2.9 | 0.1-0.2 | .15 | .15 | | | | | | | | | | | | | | | | |HbmB: | | | | | | | | | | | | | | Hammonton-----------| 0-8 | 71-89| 4-29| 3-14|1.55-1.65| 6-20 |0.10-0.14| 0.0-2.9 | 1.0-3.0 | .20 | .20 | 5 | 2 | 134 | 8-18 | 71-89| 4-29| 3-14|1.55-1.65| 2-20 |0.10-0.14| 0.0-2.9 | 0.2-0.8 | .20 | .20 | | | | 18-36 | 55-80| 5-42| 6-15|1.50-1.60| 2-6 |0.10-0.14| 0.0-2.9 | 0.2-0.8 | .28 | .28 | | | | 36-80 | 70-96| 2-20| 2-14|1.55-1.70| 6-20 |0.08-0.13| 0.0-2.9 | 0.0-0.0 | .10 | .10 | | |
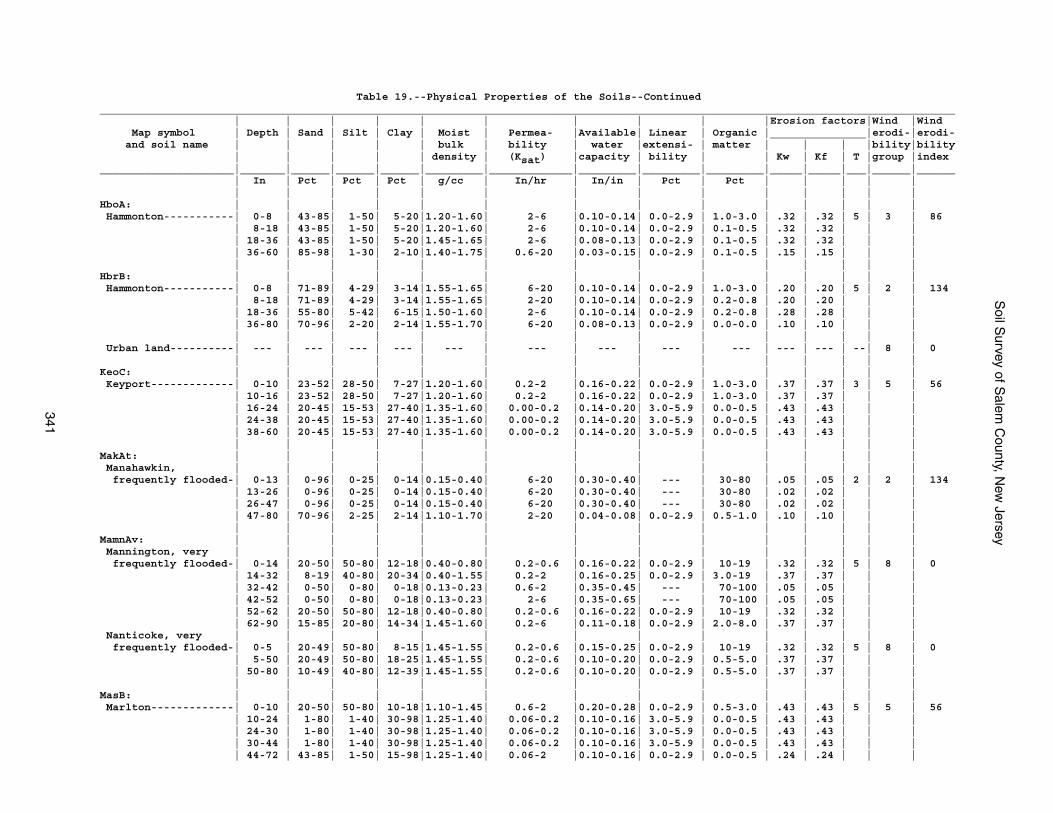
Soil S
urvey of Salem
County, N
ew Jersey
341
Table 19.--Physical Properties of the Soils--Continued______________________________________________________________________________________________________________________________________ | | | | | | | | | |Erosion factors|Wind |Wind Map symbol | Depth | Sand | Silt | Clay | Moist | Permea- |Available| Linear | Organic |_______________|erodi-|erodi- and soil name | | | | | bulk | bility | water |extensi- | matter | | | |bility|bility | | | | | density | (Ksat) |capacity | bility | | Kw | Kf | T |group |index_____________________|_______|______|______|______|_________|_____________|_________|_________|_________|_____|_____|___|______|______ | In | Pct | Pct | Pct | g/cc | In/hr | In/in | Pct | Pct | | | | | | | | | | | | | | | | | | |HboA: | | | | | | | | | | | | | | Hammonton-----------| 0-8 | 43-85| 1-50| 5-20|1.20-1.60| 2-6 |0.10-0.14| 0.0-2.9 | 1.0-3.0 | .32 | .32 | 5 | 3 | 86 | 8-18 | 43-85| 1-50| 5-20|1.20-1.60| 2-6 |0.10-0.14| 0.0-2.9 | 0.1-0.5 | .32 | .32 | | | | 18-36 | 43-85| 1-50| 5-20|1.45-1.65| 2-6 |0.08-0.13| 0.0-2.9 | 0.1-0.5 | .32 | .32 | | | | 36-60 | 85-98| 1-30| 2-10|1.40-1.75| 0.6-20 |0.03-0.15| 0.0-2.9 | 0.1-0.5 | .15 | .15 | | | | | | | | | | | | | | | | |HbrB: | | | | | | | | | | | | | | Hammonton-----------| 0-8 | 71-89| 4-29| 3-14|1.55-1.65| 6-20 |0.10-0.14| 0.0-2.9 | 1.0-3.0 | .20 | .20 | 5 | 2 | 134 | 8-18 | 71-89| 4-29| 3-14|1.55-1.65| 2-20 |0.10-0.14| 0.0-2.9 | 0.2-0.8 | .20 | .20 | | | | 18-36 | 55-80| 5-42| 6-15|1.50-1.60| 2-6 |0.10-0.14| 0.0-2.9 | 0.2-0.8 | .28 | .28 | | | | 36-80 | 70-96| 2-20| 2-14|1.55-1.70| 6-20 |0.08-0.13| 0.0-2.9 | 0.0-0.0 | .10 | .10 | | | | | | | | | | | | | | | | | Urban land----------| --- | --- | --- | --- | --- | --- | --- | --- | --- | --- | --- | --| 8 | 0 | | | | | | | | | | | | | |KeoC: | | | | | | | | | | | | | | Keyport-------------| 0-10 | 23-52| 28-50| 7-27|1.20-1.60| 0.2-2 |0.16-0.22| 0.0-2.9 | 1.0-3.0 | .37 | .37 | 3 | 5 | 56 | 10-16 | 23-52| 28-50| 7-27|1.20-1.60| 0.2-2 |0.16-0.22| 0.0-2.9 | 1.0-3.0 | .37 | .37 | | | | 16-24 | 20-45| 15-53| 27-40|1.35-1.60| 0.00-0.2 |0.14-0.20| 3.0-5.9 | 0.0-0.5 | .43 | .43 | | | | 24-38 | 20-45| 15-53| 27-40|1.35-1.60| 0.00-0.2 |0.14-0.20| 3.0-5.9 | 0.0-0.5 | .43 | .43 | | | | 38-60 | 20-45| 15-53| 27-40|1.35-1.60| 0.00-0.2 |0.14-0.20| 3.0-5.9 | 0.0-0.5 | .43 | .43 | | | | | | | | | | | | | | | | |MakAt: | | | | | | | | | | | | | | Manahawkin, | | | | | | | | | | | | | | frequently flooded-| 0-13 | 0-96| 0-25| 0-14|0.15-0.40| 6-20 |0.30-0.40| --- | 30-80 | .05 | .05 | 2 | 2 | 134 | 13-26 | 0-96| 0-25| 0-14|0.15-0.40| 6-20 |0.30-0.40| --- | 30-80 | .02 | .02 | | | | 26-47 | 0-96| 0-25| 0-14|0.15-0.40| 6-20 |0.30-0.40| --- | 30-80 | .02 | .02 | | | | 47-80 | 70-96| 2-25| 2-14|1.10-1.70| 2-20 |0.04-0.08| 0.0-2.9 | 0.5-1.0 | .10 | .10 | | | | | | | | | | | | | | | | |MamnAv: | | | | | | | | | | | | | | Mannington, very | | | | | | | | | | | | | | frequently flooded-| 0-14 | 20-50| 50-80| 12-18|0.40-0.80| 0.2-0.6 |0.16-0.22| 0.0-2.9 | 10-19 | .32 | .32 | 5 | 8 | 0 | 14-32 | 8-19| 40-80| 20-34|0.40-1.55| 0.2-2 |0.16-0.25| 0.0-2.9 | 3.0-19 | .37 | .37 | | | | 32-42 | 0-50| 0-80| 0-18|0.13-0.23| 0.6-2 |0.35-0.45| --- | 70-100 | .05 | .05 | | | | 42-52 | 0-50| 0-80| 0-18|0.13-0.23| 2-6 |0.35-0.65| --- | 70-100 | .05 | .05 | | | | 52-62 | 20-50| 50-80| 12-18|0.40-0.80| 0.2-0.6 |0.16-0.22| 0.0-2.9 | 10-19 | .32 | .32 | | | | 62-90 | 15-85| 20-80| 14-34|1.45-1.60| 0.2-6 |0.11-0.18| 0.0-2.9 | 2.0-8.0 | .37 | .37 | | | Nanticoke, very | | | | | | | | | | | | | | frequently flooded-| 0-5 | 20-49| 50-80| 8-15|1.45-1.55| 0.2-0.6 |0.15-0.25| 0.0-2.9 | 10-19 | .32 | .32 | 5 | 8 | 0 | 5-50 | 20-49| 50-80| 18-25|1.45-1.55| 0.2-0.6 |0.10-0.20| 0.0-2.9 | 0.5-5.0 | .37 | .37 | | | | 50-80 | 10-49| 40-80| 12-39|1.45-1.55| 0.2-0.6 |0.10-0.20| 0.0-2.9 | 0.5-5.0 | .37 | .37 | | | | | | | | | | | | | | | | |MasB: | | | | | | | | | | | | | | Marlton-------------| 0-10 | 20-50| 50-80| 10-18|1.10-1.45| 0.6-2 |0.20-0.28| 0.0-2.9 | 0.5-3.0 | .43 | .43 | 5 | 5 | 56 | 10-24 | 1-80| 1-40| 30-98|1.25-1.40| 0.06-0.2 |0.10-0.16| 3.0-5.9 | 0.0-0.5 | .43 | .43 | | | | 24-30 | 1-80| 1-40| 30-98|1.25-1.40| 0.06-0.2 |0.10-0.16| 3.0-5.9 | 0.0-0.5 | .43 | .43 | | | | 30-44 | 1-80| 1-40| 30-98|1.25-1.40| 0.06-0.2 |0.10-0.16| 3.0-5.9 | 0.0-0.5 | .43 | .43 | | | | 44-72 | 43-85| 1-50| 15-98|1.25-1.40| 0.06-2 |0.10-0.16| 0.0-2.9 | 0.0-0.5 | .24 | .24 | | |
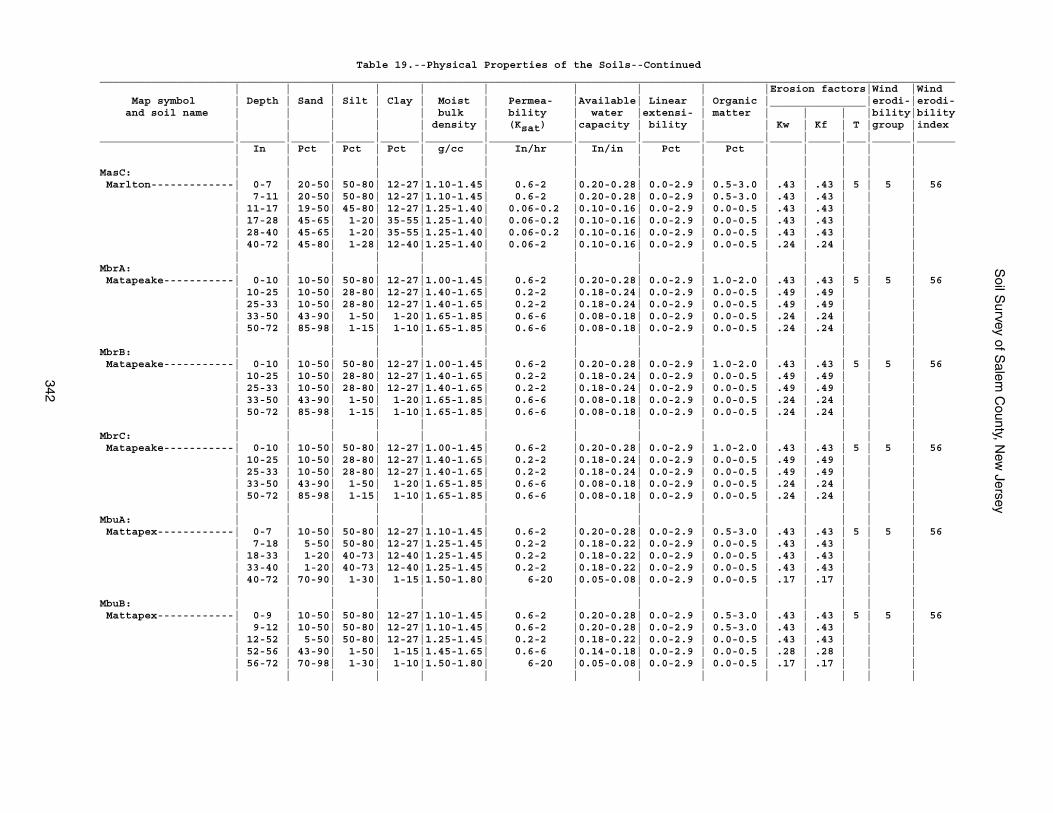
Soil S
urvey of Salem
County, N
ew Jersey
342
Table 19.--Physical Properties of the Soils--Continued______________________________________________________________________________________________________________________________________ | | | | | | | | | |Erosion factors|Wind |Wind Map symbol | Depth | Sand | Silt | Clay | Moist | Permea- |Available| Linear | Organic |_______________|erodi-|erodi- and soil name | | | | | bulk | bility | water |extensi- | matter | | | |bility|bility | | | | | density | (Ksat) |capacity | bility | | Kw | Kf | T |group |index_____________________|_______|______|______|______|_________|_____________|_________|_________|_________|_____|_____|___|______|______ | In | Pct | Pct | Pct | g/cc | In/hr | In/in | Pct | Pct | | | | | | | | | | | | | | | | | | |MasC: | | | | | | | | | | | | | | Marlton-------------| 0-7 | 20-50| 50-80| 12-27|1.10-1.45| 0.6-2 |0.20-0.28| 0.0-2.9 | 0.5-3.0 | .43 | .43 | 5 | 5 | 56 | 7-11 | 20-50| 50-80| 12-27|1.10-1.45| 0.6-2 |0.20-0.28| 0.0-2.9 | 0.5-3.0 | .43 | .43 | | | | 11-17 | 19-50| 45-80| 12-27|1.25-1.40| 0.06-0.2 |0.10-0.16| 0.0-2.9 | 0.0-0.5 | .43 | .43 | | | | 17-28 | 45-65| 1-20| 35-55|1.25-1.40| 0.06-0.2 |0.10-0.16| 0.0-2.9 | 0.0-0.5 | .43 | .43 | | | | 28-40 | 45-65| 1-20| 35-55|1.25-1.40| 0.06-0.2 |0.10-0.16| 0.0-2.9 | 0.0-0.5 | .43 | .43 | | | | 40-72 | 45-80| 1-28| 12-40|1.25-1.40| 0.06-2 |0.10-0.16| 0.0-2.9 | 0.0-0.5 | .24 | .24 | | | | | | | | | | | | | | | | |MbrA: | | | | | | | | | | | | | | Matapeake-----------| 0-10 | 10-50| 50-80| 12-27|1.00-1.45| 0.6-2 |0.20-0.28| 0.0-2.9 | 1.0-2.0 | .43 | .43 | 5 | 5 | 56 | 10-25 | 10-50| 28-80| 12-27|1.40-1.65| 0.2-2 |0.18-0.24| 0.0-2.9 | 0.0-0.5 | .49 | .49 | | | | 25-33 | 10-50| 28-80| 12-27|1.40-1.65| 0.2-2 |0.18-0.24| 0.0-2.9 | 0.0-0.5 | .49 | .49 | | | | 33-50 | 43-90| 1-50| 1-20|1.65-1.85| 0.6-6 |0.08-0.18| 0.0-2.9 | 0.0-0.5 | .24 | .24 | | | | 50-72 | 85-98| 1-15| 1-10|1.65-1.85| 0.6-6 |0.08-0.18| 0.0-2.9 | 0.0-0.5 | .24 | .24 | | | | | | | | | | | | | | | | |MbrB: | | | | | | | | | | | | | | Matapeake-----------| 0-10 | 10-50| 50-80| 12-27|1.00-1.45| 0.6-2 |0.20-0.28| 0.0-2.9 | 1.0-2.0 | .43 | .43 | 5 | 5 | 56 | 10-25 | 10-50| 28-80| 12-27|1.40-1.65| 0.2-2 |0.18-0.24| 0.0-2.9 | 0.0-0.5 | .49 | .49 | | | | 25-33 | 10-50| 28-80| 12-27|1.40-1.65| 0.2-2 |0.18-0.24| 0.0-2.9 | 0.0-0.5 | .49 | .49 | | | | 33-50 | 43-90| 1-50| 1-20|1.65-1.85| 0.6-6 |0.08-0.18| 0.0-2.9 | 0.0-0.5 | .24 | .24 | | | | 50-72 | 85-98| 1-15| 1-10|1.65-1.85| 0.6-6 |0.08-0.18| 0.0-2.9 | 0.0-0.5 | .24 | .24 | | | | | | | | | | | | | | | | |MbrC: | | | | | | | | | | | | | | Matapeake-----------| 0-10 | 10-50| 50-80| 12-27|1.00-1.45| 0.6-2 |0.20-0.28| 0.0-2.9 | 1.0-2.0 | .43 | .43 | 5 | 5 | 56 | 10-25 | 10-50| 28-80| 12-27|1.40-1.65| 0.2-2 |0.18-0.24| 0.0-2.9 | 0.0-0.5 | .49 | .49 | | | | 25-33 | 10-50| 28-80| 12-27|1.40-1.65| 0.2-2 |0.18-0.24| 0.0-2.9 | 0.0-0.5 | .49 | .49 | | | | 33-50 | 43-90| 1-50| 1-20|1.65-1.85| 0.6-6 |0.08-0.18| 0.0-2.9 | 0.0-0.5 | .24 | .24 | | | | 50-72 | 85-98| 1-15| 1-10|1.65-1.85| 0.6-6 |0.08-0.18| 0.0-2.9 | 0.0-0.5 | .24 | .24 | | | | | | | | | | | | | | | | |MbuA: | | | | | | | | | | | | | | Mattapex------------| 0-7 | 10-50| 50-80| 12-27|1.10-1.45| 0.6-2 |0.20-0.28| 0.0-2.9 | 0.5-3.0 | .43 | .43 | 5 | 5 | 56 | 7-18 | 5-50| 50-80| 12-27|1.25-1.45| 0.2-2 |0.18-0.22| 0.0-2.9 | 0.0-0.5 | .43 | .43 | | | | 18-33 | 1-20| 40-73| 12-40|1.25-1.45| 0.2-2 |0.18-0.22| 0.0-2.9 | 0.0-0.5 | .43 | .43 | | | | 33-40 | 1-20| 40-73| 12-40|1.25-1.45| 0.2-2 |0.18-0.22| 0.0-2.9 | 0.0-0.5 | .43 | .43 | | | | 40-72 | 70-90| 1-30| 1-15|1.50-1.80| 6-20 |0.05-0.08| 0.0-2.9 | 0.0-0.5 | .17 | .17 | | | | | | | | | | | | | | | | |MbuB: | | | | | | | | | | | | | | Mattapex------------| 0-9 | 10-50| 50-80| 12-27|1.10-1.45| 0.6-2 |0.20-0.28| 0.0-2.9 | 0.5-3.0 | .43 | .43 | 5 | 5 | 56 | 9-12 | 10-50| 50-80| 12-27|1.10-1.45| 0.6-2 |0.20-0.28| 0.0-2.9 | 0.5-3.0 | .43 | .43 | | | | 12-52 | 5-50| 50-80| 12-27|1.25-1.45| 0.2-2 |0.18-0.22| 0.0-2.9 | 0.0-0.5 | .43 | .43 | | | | 52-56 | 43-90| 1-50| 1-15|1.45-1.65| 0.6-6 |0.14-0.18| 0.0-2.9 | 0.0-0.5 | .28 | .28 | | | | 56-72 | 70-98| 1-30| 1-10|1.50-1.80| 6-20 |0.05-0.08| 0.0-2.9 | 0.0-0.5 | .17 | .17 | | | | | | | | | | | | | | | | |
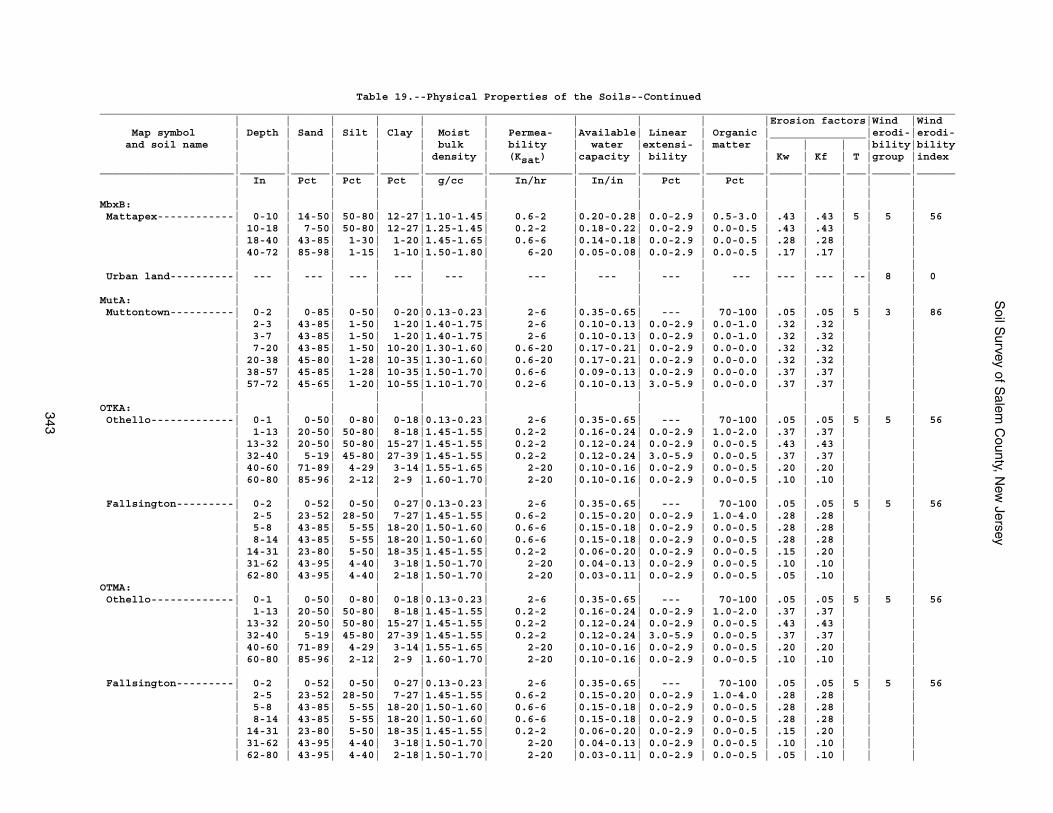
Soil S
urvey of Salem
County, N
ew Jersey
343
Table 19.--Physical Properties of the Soils--Continued______________________________________________________________________________________________________________________________________ | | | | | | | | | |Erosion factors|Wind |Wind Map symbol | Depth | Sand | Silt | Clay | Moist | Permea- |Available| Linear | Organic |_______________|erodi-|erodi- and soil name | | | | | bulk | bility | water |extensi- | matter | | | |bility|bility | | | | | density | (Ksat) |capacity | bility | | Kw | Kf | T |group |index_____________________|_______|______|______|______|_________|_____________|_________|_________|_________|_____|_____|___|______|______ | In | Pct | Pct | Pct | g/cc | In/hr | In/in | Pct | Pct | | | | | | | | | | | | | | | | | | |MbxB: | | | | | | | | | | | | | | Mattapex------------| 0-10 | 14-50| 50-80| 12-27|1.10-1.45| 0.6-2 |0.20-0.28| 0.0-2.9 | 0.5-3.0 | .43 | .43 | 5 | 5 | 56 | 10-18 | 7-50| 50-80| 12-27|1.25-1.45| 0.2-2 |0.18-0.22| 0.0-2.9 | 0.0-0.5 | .43 | .43 | | | | 18-40 | 43-85| 1-30| 1-20|1.45-1.65| 0.6-6 |0.14-0.18| 0.0-2.9 | 0.0-0.5 | .28 | .28 | | | | 40-72 | 85-98| 1-15| 1-10|1.50-1.80| 6-20 |0.05-0.08| 0.0-2.9 | 0.0-0.5 | .17 | .17 | | | | | | | | | | | | | | | | | Urban land----------| --- | --- | --- | --- | --- | --- | --- | --- | --- | --- | --- | --| 8 | 0 | | | | | | | | | | | | | |MutA: | | | | | | | | | | | | | | Muttontown----------| 0-2 | 0-85| 0-50| 0-20|0.13-0.23| 2-6 |0.35-0.65| --- | 70-100 | .05 | .05 | 5 | 3 | 86 | 2-3 | 43-85| 1-50| 1-20|1.40-1.75| 2-6 |0.10-0.13| 0.0-2.9 | 0.0-1.0 | .32 | .32 | | | | 3-7 | 43-85| 1-50| 1-20|1.40-1.75| 2-6 |0.10-0.13| 0.0-2.9 | 0.0-1.0 | .32 | .32 | | | | 7-20 | 43-85| 1-50| 10-20|1.30-1.60| 0.6-20 |0.17-0.21| 0.0-2.9 | 0.0-0.0 | .32 | .32 | | | | 20-38 | 45-80| 1-28| 10-35|1.30-1.60| 0.6-20 |0.17-0.21| 0.0-2.9 | 0.0-0.0 | .32 | .32 | | | | 38-57 | 45-85| 1-28| 10-35|1.50-1.70| 0.6-6 |0.09-0.13| 0.0-2.9 | 0.0-0.0 | .37 | .37 | | | | 57-72 | 45-65| 1-20| 10-55|1.10-1.70| 0.2-6 |0.10-0.13| 3.0-5.9 | 0.0-0.0 | .37 | .37 | | | | | | | | | | | | | | | | |OTKA: | | | | | | | | | | | | | | Othello-------------| 0-1 | 0-50| 0-80| 0-18|0.13-0.23| 2-6 |0.35-0.65| --- | 70-100 | .05 | .05 | 5 | 5 | 56 | 1-13 | 20-50| 50-80| 8-18|1.45-1.55| 0.2-2 |0.16-0.24| 0.0-2.9 | 1.0-2.0 | .37 | .37 | | | | 13-32 | 20-50| 50-80| 15-27|1.45-1.55| 0.2-2 |0.12-0.24| 0.0-2.9 | 0.0-0.5 | .43 | .43 | | | | 32-40 | 5-19| 45-80| 27-39|1.45-1.55| 0.2-2 |0.12-0.24| 3.0-5.9 | 0.0-0.5 | .37 | .37 | | | | 40-60 | 71-89| 4-29| 3-14|1.55-1.65| 2-20 |0.10-0.16| 0.0-2.9 | 0.0-0.5 | .20 | .20 | | | | 60-80 | 85-96| 2-12| 2-9 |1.60-1.70| 2-20 |0.10-0.16| 0.0-2.9 | 0.0-0.5 | .10 | .10 | | | | | | | | | | | | | | | | | Fallsington---------| 0-2 | 0-52| 0-50| 0-27|0.13-0.23| 2-6 |0.35-0.65| --- | 70-100 | .05 | .05 | 5 | 5 | 56 | 2-5 | 23-52| 28-50| 7-27|1.45-1.55| 0.6-2 |0.15-0.20| 0.0-2.9 | 1.0-4.0 | .28 | .28 | | | | 5-8 | 43-85| 5-55| 18-20|1.50-1.60| 0.6-6 |0.15-0.18| 0.0-2.9 | 0.0-0.5 | .28 | .28 | | | | 8-14 | 43-85| 5-55| 18-20|1.50-1.60| 0.6-6 |0.15-0.18| 0.0-2.9 | 0.0-0.5 | .28 | .28 | | | | 14-31 | 23-80| 5-50| 18-35|1.45-1.55| 0.2-2 |0.06-0.20| 0.0-2.9 | 0.0-0.5 | .15 | .20 | | | | 31-62 | 43-95| 4-40| 3-18|1.50-1.70| 2-20 |0.04-0.13| 0.0-2.9 | 0.0-0.5 | .10 | .10 | | | | 62-80 | 43-95| 4-40| 2-18|1.50-1.70| 2-20 |0.03-0.11| 0.0-2.9 | 0.0-0.5 | .05 | .10 | | |OTMA: | | | | | | | | | | | | | | Othello-------------| 0-1 | 0-50| 0-80| 0-18|0.13-0.23| 2-6 |0.35-0.65| --- | 70-100 | .05 | .05 | 5 | 5 | 56 | 1-13 | 20-50| 50-80| 8-18|1.45-1.55| 0.2-2 |0.16-0.24| 0.0-2.9 | 1.0-2.0 | .37 | .37 | | | | 13-32 | 20-50| 50-80| 15-27|1.45-1.55| 0.2-2 |0.12-0.24| 0.0-2.9 | 0.0-0.5 | .43 | .43 | | | | 32-40 | 5-19| 45-80| 27-39|1.45-1.55| 0.2-2 |0.12-0.24| 3.0-5.9 | 0.0-0.5 | .37 | .37 | | | | 40-60 | 71-89| 4-29| 3-14|1.55-1.65| 2-20 |0.10-0.16| 0.0-2.9 | 0.0-0.5 | .20 | .20 | | | | 60-80 | 85-96| 2-12| 2-9 |1.60-1.70| 2-20 |0.10-0.16| 0.0-2.9 | 0.0-0.5 | .10 | .10 | | | | | | | | | | | | | | | | | Fallsington---------| 0-2 | 0-52| 0-50| 0-27|0.13-0.23| 2-6 |0.35-0.65| --- | 70-100 | .05 | .05 | 5 | 5 | 56 | 2-5 | 23-52| 28-50| 7-27|1.45-1.55| 0.6-2 |0.15-0.20| 0.0-2.9 | 1.0-4.0 | .28 | .28 | | | | 5-8 | 43-85| 5-55| 18-20|1.50-1.60| 0.6-6 |0.15-0.18| 0.0-2.9 | 0.0-0.5 | .28 | .28 | | | | 8-14 | 43-85| 5-55| 18-20|1.50-1.60| 0.6-6 |0.15-0.18| 0.0-2.9 | 0.0-0.5 | .28 | .28 | | | | 14-31 | 23-80| 5-50| 18-35|1.45-1.55| 0.2-2 |0.06-0.20| 0.0-2.9 | 0.0-0.5 | .15 | .20 | | | | 31-62 | 43-95| 4-40| 3-18|1.50-1.70| 2-20 |0.04-0.13| 0.0-2.9 | 0.0-0.5 | .10 | .10 | | | | 62-80 | 43-95| 4-40| 2-18|1.50-1.70| 2-20 |0.03-0.11| 0.0-2.9 | 0.0-0.5 | .05 | .10 | | |
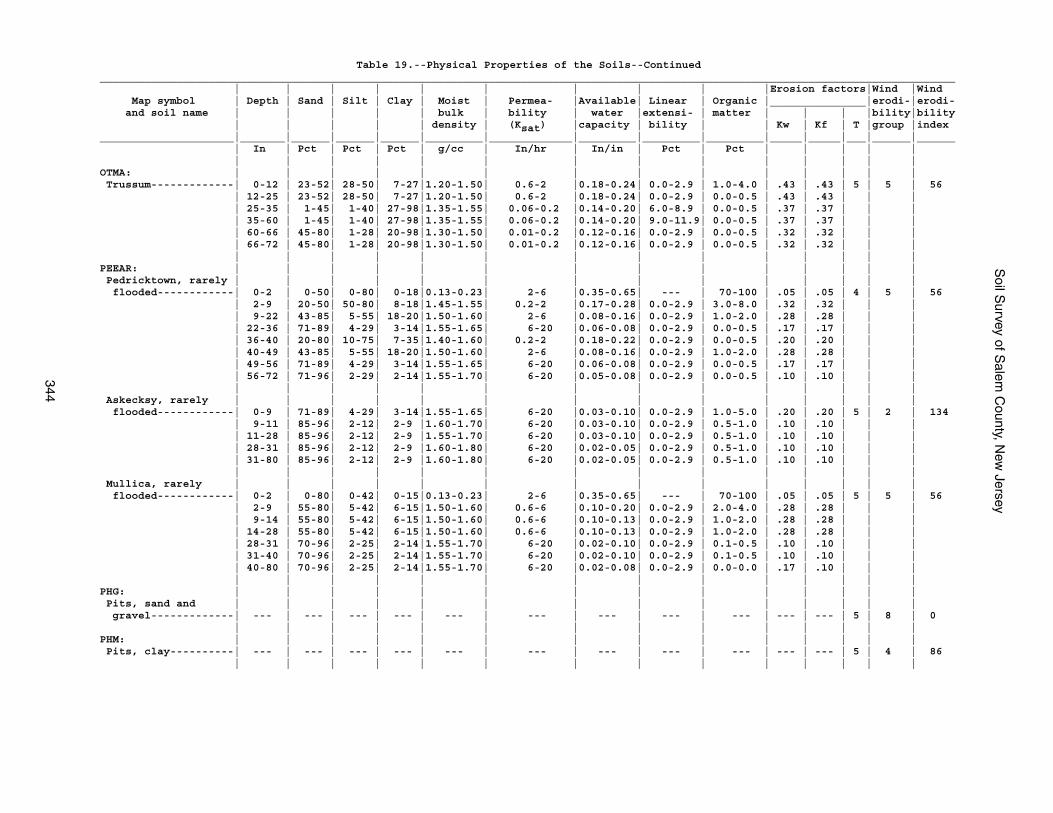
Soil S
urvey of Salem
County, N
ew Jersey
344
Table 19.--Physical Properties of the Soils--Continued______________________________________________________________________________________________________________________________________ | | | | | | | | | |Erosion factors|Wind |Wind Map symbol | Depth | Sand | Silt | Clay | Moist | Permea- |Available| Linear | Organic |_______________|erodi-|erodi- and soil name | | | | | bulk | bility | water |extensi- | matter | | | |bility|bility | | | | | density | (Ksat) |capacity | bility | | Kw | Kf | T |group |index_____________________|_______|______|______|______|_________|_____________|_________|_________|_________|_____|_____|___|______|______ | In | Pct | Pct | Pct | g/cc | In/hr | In/in | Pct | Pct | | | | | | | | | | | | | | | | | | |OTMA: | | | | | | | | | | | | | | Trussum-------------| 0-12 | 23-52| 28-50| 7-27|1.20-1.50| 0.6-2 |0.18-0.24| 0.0-2.9 | 1.0-4.0 | .43 | .43 | 5 | 5 | 56 | 12-25 | 23-52| 28-50| 7-27|1.20-1.50| 0.6-2 |0.18-0.24| 0.0-2.9 | 0.0-0.5 | .43 | .43 | | | | 25-35 | 1-45| 1-40| 27-98|1.35-1.55| 0.06-0.2 |0.14-0.20| 6.0-8.9 | 0.0-0.5 | .37 | .37 | | | | 35-60 | 1-45| 1-40| 27-98|1.35-1.55| 0.06-0.2 |0.14-0.20| 9.0-11.9| 0.0-0.5 | .37 | .37 | | | | 60-66 | 45-80| 1-28| 20-98|1.30-1.50| 0.01-0.2 |0.12-0.16| 0.0-2.9 | 0.0-0.5 | .32 | .32 | | | | 66-72 | 45-80| 1-28| 20-98|1.30-1.50| 0.01-0.2 |0.12-0.16| 0.0-2.9 | 0.0-0.5 | .32 | .32 | | | | | | | | | | | | | | | | |PEEAR: | | | | | | | | | | | | | | Pedricktown, rarely | | | | | | | | | | | | | | flooded------------| 0-2 | 0-50| 0-80| 0-18|0.13-0.23| 2-6 |0.35-0.65| --- | 70-100 | .05 | .05 | 4 | 5 | 56 | 2-9 | 20-50| 50-80| 8-18|1.45-1.55| 0.2-2 |0.17-0.28| 0.0-2.9 | 3.0-8.0 | .32 | .32 | | | | 9-22 | 43-85| 5-55| 18-20|1.50-1.60| 2-6 |0.08-0.16| 0.0-2.9 | 1.0-2.0 | .28 | .28 | | | | 22-36 | 71-89| 4-29| 3-14|1.55-1.65| 6-20 |0.06-0.08| 0.0-2.9 | 0.0-0.5 | .17 | .17 | | | | 36-40 | 20-80| 10-75| 7-35|1.40-1.60| 0.2-2 |0.18-0.22| 0.0-2.9 | 0.0-0.5 | .20 | .20 | | | | 40-49 | 43-85| 5-55| 18-20|1.50-1.60| 2-6 |0.08-0.16| 0.0-2.9 | 1.0-2.0 | .28 | .28 | | | | 49-56 | 71-89| 4-29| 3-14|1.55-1.65| 6-20 |0.06-0.08| 0.0-2.9 | 0.0-0.5 | .17 | .17 | | | | 56-72 | 71-96| 2-29| 2-14|1.55-1.70| 6-20 |0.05-0.08| 0.0-2.9 | 0.0-0.5 | .10 | .10 | | | | | | | | | | | | | | | | | Askecksy, rarely | | | | | | | | | | | | | | flooded------------| 0-9 | 71-89| 4-29| 3-14|1.55-1.65| 6-20 |0.03-0.10| 0.0-2.9 | 1.0-5.0 | .20 | .20 | 5 | 2 | 134 | 9-11 | 85-96| 2-12| 2-9 |1.60-1.70| 6-20 |0.03-0.10| 0.0-2.9 | 0.5-1.0 | .10 | .10 | | | | 11-28 | 85-96| 2-12| 2-9 |1.55-1.70| 6-20 |0.03-0.10| 0.0-2.9 | 0.5-1.0 | .10 | .10 | | | | 28-31 | 85-96| 2-12| 2-9 |1.60-1.80| 6-20 |0.02-0.05| 0.0-2.9 | 0.5-1.0 | .10 | .10 | | | | 31-80 | 85-96| 2-12| 2-9 |1.60-1.80| 6-20 |0.02-0.05| 0.0-2.9 | 0.5-1.0 | .10 | .10 | | | | | | | | | | | | | | | | | Mullica, rarely | | | | | | | | | | | | | | flooded------------| 0-2 | 0-80| 0-42| 0-15|0.13-0.23| 2-6 |0.35-0.65| --- | 70-100 | .05 | .05 | 5 | 5 | 56 | 2-9 | 55-80| 5-42| 6-15|1.50-1.60| 0.6-6 |0.10-0.20| 0.0-2.9 | 2.0-4.0 | .28 | .28 | | | | 9-14 | 55-80| 5-42| 6-15|1.50-1.60| 0.6-6 |0.10-0.13| 0.0-2.9 | 1.0-2.0 | .28 | .28 | | | | 14-28 | 55-80| 5-42| 6-15|1.50-1.60| 0.6-6 |0.10-0.13| 0.0-2.9 | 1.0-2.0 | .28 | .28 | | | | 28-31 | 70-96| 2-25| 2-14|1.55-1.70| 6-20 |0.02-0.10| 0.0-2.9 | 0.1-0.5 | .10 | .10 | | | | 31-40 | 70-96| 2-25| 2-14|1.55-1.70| 6-20 |0.02-0.10| 0.0-2.9 | 0.1-0.5 | .10 | .10 | | | | 40-80 | 70-96| 2-25| 2-14|1.55-1.70| 6-20 |0.02-0.08| 0.0-2.9 | 0.0-0.0 | .17 | .10 | | | | | | | | | | | | | | | | |PHG: | | | | | | | | | | | | | | Pits, sand and | | | | | | | | | | | | | | gravel-------------| --- | --- | --- | --- | --- | --- | --- | --- | --- | --- | --- | 5 | 8 | 0 | | | | | | | | | | | | | |PHM: | | | | | | | | | | | | | | Pits, clay----------| --- | --- | --- | --- | --- | --- | --- | --- | --- | --- | --- | 5 | 4 | 86 | | | | | | | | | | | | | |
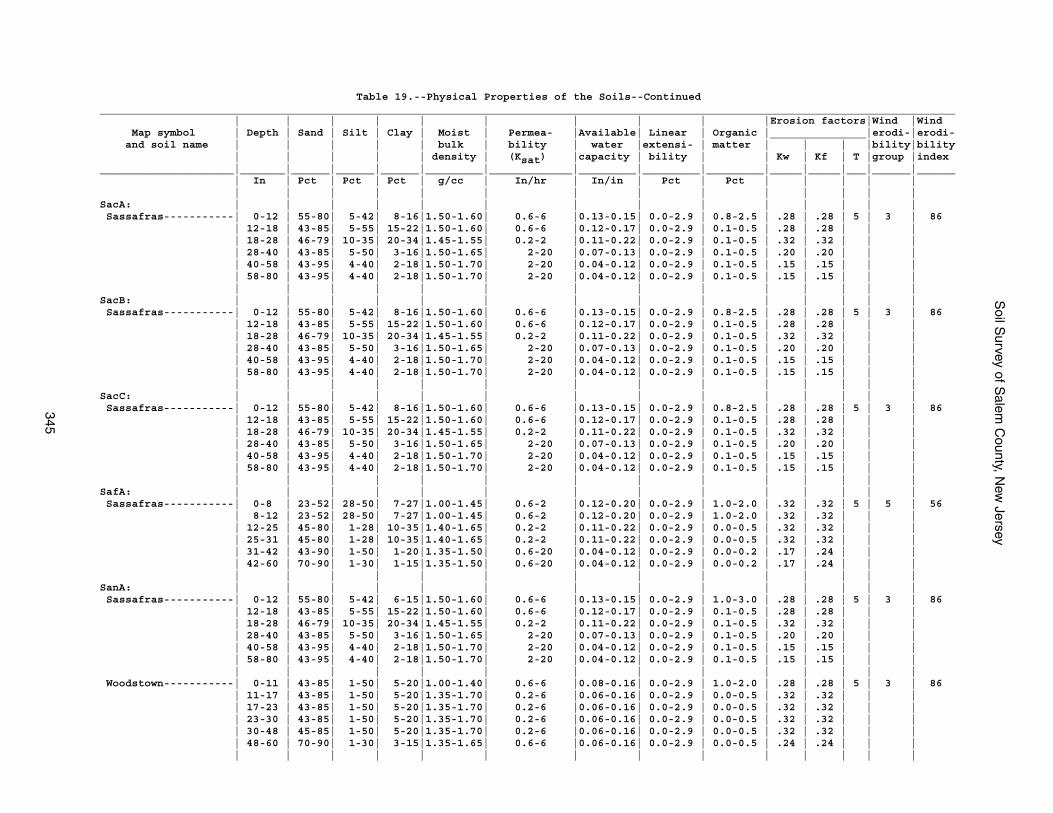
Soil S
urvey of Salem
County, N
ew Jersey
345
Table 19.--Physical Properties of the Soils--Continued______________________________________________________________________________________________________________________________________ | | | | | | | | | |Erosion factors|Wind |Wind Map symbol | Depth | Sand | Silt | Clay | Moist | Permea- |Available| Linear | Organic |_______________|erodi-|erodi- and soil name | | | | | bulk | bility | water |extensi- | matter | | | |bility|bility | | | | | density | (Ksat) |capacity | bility | | Kw | Kf | T |group |index_____________________|_______|______|______|______|_________|_____________|_________|_________|_________|_____|_____|___|______|______ | In | Pct | Pct | Pct | g/cc | In/hr | In/in | Pct | Pct | | | | | | | | | | | | | | | | | | |SacA: | | | | | | | | | | | | | | Sassafras-----------| 0-12 | 55-80| 5-42| 8-16|1.50-1.60| 0.6-6 |0.13-0.15| 0.0-2.9 | 0.8-2.5 | .28 | .28 | 5 | 3 | 86 | 12-18 | 43-85| 5-55| 15-22|1.50-1.60| 0.6-6 |0.12-0.17| 0.0-2.9 | 0.1-0.5 | .28 | .28 | | | | 18-28 | 46-79| 10-35| 20-34|1.45-1.55| 0.2-2 |0.11-0.22| 0.0-2.9 | 0.1-0.5 | .32 | .32 | | | | 28-40 | 43-85| 5-50| 3-16|1.50-1.65| 2-20 |0.07-0.13| 0.0-2.9 | 0.1-0.5 | .20 | .20 | | | | 40-58 | 43-95| 4-40| 2-18|1.50-1.70| 2-20 |0.04-0.12| 0.0-2.9 | 0.1-0.5 | .15 | .15 | | | | 58-80 | 43-95| 4-40| 2-18|1.50-1.70| 2-20 |0.04-0.12| 0.0-2.9 | 0.1-0.5 | .15 | .15 | | | | | | | | | | | | | | | | |SacB: | | | | | | | | | | | | | | Sassafras-----------| 0-12 | 55-80| 5-42| 8-16|1.50-1.60| 0.6-6 |0.13-0.15| 0.0-2.9 | 0.8-2.5 | .28 | .28 | 5 | 3 | 86 | 12-18 | 43-85| 5-55| 15-22|1.50-1.60| 0.6-6 |0.12-0.17| 0.0-2.9 | 0.1-0.5 | .28 | .28 | | | | 18-28 | 46-79| 10-35| 20-34|1.45-1.55| 0.2-2 |0.11-0.22| 0.0-2.9 | 0.1-0.5 | .32 | .32 | | | | 28-40 | 43-85| 5-50| 3-16|1.50-1.65| 2-20 |0.07-0.13| 0.0-2.9 | 0.1-0.5 | .20 | .20 | | | | 40-58 | 43-95| 4-40| 2-18|1.50-1.70| 2-20 |0.04-0.12| 0.0-2.9 | 0.1-0.5 | .15 | .15 | | | | 58-80 | 43-95| 4-40| 2-18|1.50-1.70| 2-20 |0.04-0.12| 0.0-2.9 | 0.1-0.5 | .15 | .15 | | | | | | | | | | | | | | | | |SacC: | | | | | | | | | | | | | | Sassafras-----------| 0-12 | 55-80| 5-42| 8-16|1.50-1.60| 0.6-6 |0.13-0.15| 0.0-2.9 | 0.8-2.5 | .28 | .28 | 5 | 3 | 86 | 12-18 | 43-85| 5-55| 15-22|1.50-1.60| 0.6-6 |0.12-0.17| 0.0-2.9 | 0.1-0.5 | .28 | .28 | | | | 18-28 | 46-79| 10-35| 20-34|1.45-1.55| 0.2-2 |0.11-0.22| 0.0-2.9 | 0.1-0.5 | .32 | .32 | | | | 28-40 | 43-85| 5-50| 3-16|1.50-1.65| 2-20 |0.07-0.13| 0.0-2.9 | 0.1-0.5 | .20 | .20 | | | | 40-58 | 43-95| 4-40| 2-18|1.50-1.70| 2-20 |0.04-0.12| 0.0-2.9 | 0.1-0.5 | .15 | .15 | | | | 58-80 | 43-95| 4-40| 2-18|1.50-1.70| 2-20 |0.04-0.12| 0.0-2.9 | 0.1-0.5 | .15 | .15 | | | | | | | | | | | | | | | | |SafA: | | | | | | | | | | | | | | Sassafras-----------| 0-8 | 23-52| 28-50| 7-27|1.00-1.45| 0.6-2 |0.12-0.20| 0.0-2.9 | 1.0-2.0 | .32 | .32 | 5 | 5 | 56 | 8-12 | 23-52| 28-50| 7-27|1.00-1.45| 0.6-2 |0.12-0.20| 0.0-2.9 | 1.0-2.0 | .32 | .32 | | | | 12-25 | 45-80| 1-28| 10-35|1.40-1.65| 0.2-2 |0.11-0.22| 0.0-2.9 | 0.0-0.5 | .32 | .32 | | | | 25-31 | 45-80| 1-28| 10-35|1.40-1.65| 0.2-2 |0.11-0.22| 0.0-2.9 | 0.0-0.5 | .32 | .32 | | | | 31-42 | 43-90| 1-50| 1-20|1.35-1.50| 0.6-20 |0.04-0.12| 0.0-2.9 | 0.0-0.2 | .17 | .24 | | | | 42-60 | 70-90| 1-30| 1-15|1.35-1.50| 0.6-20 |0.04-0.12| 0.0-2.9 | 0.0-0.2 | .17 | .24 | | | | | | | | | | | | | | | | |SanA: | | | | | | | | | | | | | | Sassafras-----------| 0-12 | 55-80| 5-42| 6-15|1.50-1.60| 0.6-6 |0.13-0.15| 0.0-2.9 | 1.0-3.0 | .28 | .28 | 5 | 3 | 86 | 12-18 | 43-85| 5-55| 15-22|1.50-1.60| 0.6-6 |0.12-0.17| 0.0-2.9 | 0.1-0.5 | .28 | .28 | | | | 18-28 | 46-79| 10-35| 20-34|1.45-1.55| 0.2-2 |0.11-0.22| 0.0-2.9 | 0.1-0.5 | .32 | .32 | | | | 28-40 | 43-85| 5-50| 3-16|1.50-1.65| 2-20 |0.07-0.13| 0.0-2.9 | 0.1-0.5 | .20 | .20 | | | | 40-58 | 43-95| 4-40| 2-18|1.50-1.70| 2-20 |0.04-0.12| 0.0-2.9 | 0.1-0.5 | .15 | .15 | | | | 58-80 | 43-95| 4-40| 2-18|1.50-1.70| 2-20 |0.04-0.12| 0.0-2.9 | 0.1-0.5 | .15 | .15 | | | | | | | | | | | | | | | | | Woodstown-----------| 0-11 | 43-85| 1-50| 5-20|1.00-1.40| 0.6-6 |0.08-0.16| 0.0-2.9 | 1.0-2.0 | .28 | .28 | 5 | 3 | 86 | 11-17 | 43-85| 1-50| 5-20|1.35-1.70| 0.2-6 |0.06-0.16| 0.0-2.9 | 0.0-0.5 | .32 | .32 | | | | 17-23 | 43-85| 1-50| 5-20|1.35-1.70| 0.2-6 |0.06-0.16| 0.0-2.9 | 0.0-0.5 | .32 | .32 | | | | 23-30 | 43-85| 1-50| 5-20|1.35-1.70| 0.2-6 |0.06-0.16| 0.0-2.9 | 0.0-0.5 | .32 | .32 | | | | 30-48 | 45-85| 1-50| 5-20|1.35-1.70| 0.2-6 |0.06-0.16| 0.0-2.9 | 0.0-0.5 | .32 | .32 | | | | 48-60 | 70-90| 1-30| 3-15|1.35-1.65| 0.6-6 |0.06-0.16| 0.0-2.9 | 0.0-0.5 | .24 | .24 | | | | | | | | | | | | | | | | |
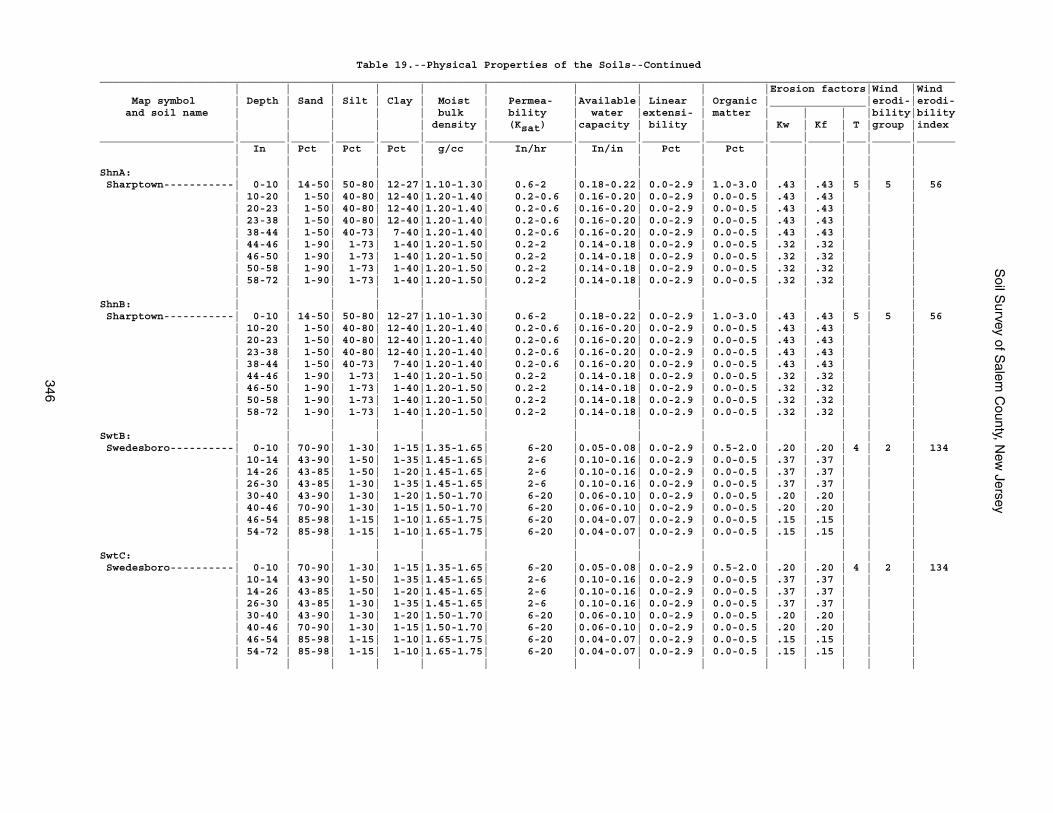
Soil S
urvey of Salem
County, N
ew Jersey
346
Table 19.--Physical Properties of the Soils--Continued______________________________________________________________________________________________________________________________________ | | | | | | | | | |Erosion factors|Wind |Wind Map symbol | Depth | Sand | Silt | Clay | Moist | Permea- |Available| Linear | Organic |_______________|erodi-|erodi- and soil name | | | | | bulk | bility | water |extensi- | matter | | | |bility|bility | | | | | density | (Ksat) |capacity | bility | | Kw | Kf | T |group |index_____________________|_______|______|______|______|_________|_____________|_________|_________|_________|_____|_____|___|______|______ | In | Pct | Pct | Pct | g/cc | In/hr | In/in | Pct | Pct | | | | | | | | | | | | | | | | | | |ShnA: | | | | | | | | | | | | | | Sharptown-----------| 0-10 | 14-50| 50-80| 12-27|1.10-1.30| 0.6-2 |0.18-0.22| 0.0-2.9 | 1.0-3.0 | .43 | .43 | 5 | 5 | 56 | 10-20 | 1-50| 40-80| 12-40|1.20-1.40| 0.2-0.6 |0.16-0.20| 0.0-2.9 | 0.0-0.5 | .43 | .43 | | | | 20-23 | 1-50| 40-80| 12-40|1.20-1.40| 0.2-0.6 |0.16-0.20| 0.0-2.9 | 0.0-0.5 | .43 | .43 | | | | 23-38 | 1-50| 40-80| 12-40|1.20-1.40| 0.2-0.6 |0.16-0.20| 0.0-2.9 | 0.0-0.5 | .43 | .43 | | | | 38-44 | 1-50| 40-73| 7-40|1.20-1.40| 0.2-0.6 |0.16-0.20| 0.0-2.9 | 0.0-0.5 | .43 | .43 | | | | 44-46 | 1-90| 1-73| 1-40|1.20-1.50| 0.2-2 |0.14-0.18| 0.0-2.9 | 0.0-0.5 | .32 | .32 | | | | 46-50 | 1-90| 1-73| 1-40|1.20-1.50| 0.2-2 |0.14-0.18| 0.0-2.9 | 0.0-0.5 | .32 | .32 | | | | 50-58 | 1-90| 1-73| 1-40|1.20-1.50| 0.2-2 |0.14-0.18| 0.0-2.9 | 0.0-0.5 | .32 | .32 | | | | 58-72 | 1-90| 1-73| 1-40|1.20-1.50| 0.2-2 |0.14-0.18| 0.0-2.9 | 0.0-0.5 | .32 | .32 | | | | | | | | | | | | | | | | |ShnB: | | | | | | | | | | | | | | Sharptown-----------| 0-10 | 14-50| 50-80| 12-27|1.10-1.30| 0.6-2 |0.18-0.22| 0.0-2.9 | 1.0-3.0 | .43 | .43 | 5 | 5 | 56 | 10-20 | 1-50| 40-80| 12-40|1.20-1.40| 0.2-0.6 |0.16-0.20| 0.0-2.9 | 0.0-0.5 | .43 | .43 | | | | 20-23 | 1-50| 40-80| 12-40|1.20-1.40| 0.2-0.6 |0.16-0.20| 0.0-2.9 | 0.0-0.5 | .43 | .43 | | | | 23-38 | 1-50| 40-80| 12-40|1.20-1.40| 0.2-0.6 |0.16-0.20| 0.0-2.9 | 0.0-0.5 | .43 | .43 | | | | 38-44 | 1-50| 40-73| 7-40|1.20-1.40| 0.2-0.6 |0.16-0.20| 0.0-2.9 | 0.0-0.5 | .43 | .43 | | | | 44-46 | 1-90| 1-73| 1-40|1.20-1.50| 0.2-2 |0.14-0.18| 0.0-2.9 | 0.0-0.5 | .32 | .32 | | | | 46-50 | 1-90| 1-73| 1-40|1.20-1.50| 0.2-2 |0.14-0.18| 0.0-2.9 | 0.0-0.5 | .32 | .32 | | | | 50-58 | 1-90| 1-73| 1-40|1.20-1.50| 0.2-2 |0.14-0.18| 0.0-2.9 | 0.0-0.5 | .32 | .32 | | | | 58-72 | 1-90| 1-73| 1-40|1.20-1.50| 0.2-2 |0.14-0.18| 0.0-2.9 | 0.0-0.5 | .32 | .32 | | | | | | | | | | | | | | | | |SwtB: | | | | | | | | | | | | | | Swedesboro----------| 0-10 | 70-90| 1-30| 1-15|1.35-1.65| 6-20 |0.05-0.08| 0.0-2.9 | 0.5-2.0 | .20 | .20 | 4 | 2 | 134 | 10-14 | 43-90| 1-50| 1-35|1.45-1.65| 2-6 |0.10-0.16| 0.0-2.9 | 0.0-0.5 | .37 | .37 | | | | 14-26 | 43-85| 1-50| 1-20|1.45-1.65| 2-6 |0.10-0.16| 0.0-2.9 | 0.0-0.5 | .37 | .37 | | | | 26-30 | 43-85| 1-30| 1-35|1.45-1.65| 2-6 |0.10-0.16| 0.0-2.9 | 0.0-0.5 | .37 | .37 | | | | 30-40 | 43-90| 1-30| 1-20|1.50-1.70| 6-20 |0.06-0.10| 0.0-2.9 | 0.0-0.5 | .20 | .20 | | | | 40-46 | 70-90| 1-30| 1-15|1.50-1.70| 6-20 |0.06-0.10| 0.0-2.9 | 0.0-0.5 | .20 | .20 | | | | 46-54 | 85-98| 1-15| 1-10|1.65-1.75| 6-20 |0.04-0.07| 0.0-2.9 | 0.0-0.5 | .15 | .15 | | | | 54-72 | 85-98| 1-15| 1-10|1.65-1.75| 6-20 |0.04-0.07| 0.0-2.9 | 0.0-0.5 | .15 | .15 | | | | | | | | | | | | | | | | |SwtC: | | | | | | | | | | | | | | Swedesboro----------| 0-10 | 70-90| 1-30| 1-15|1.35-1.65| 6-20 |0.05-0.08| 0.0-2.9 | 0.5-2.0 | .20 | .20 | 4 | 2 | 134 | 10-14 | 43-90| 1-50| 1-35|1.45-1.65| 2-6 |0.10-0.16| 0.0-2.9 | 0.0-0.5 | .37 | .37 | | | | 14-26 | 43-85| 1-50| 1-20|1.45-1.65| 2-6 |0.10-0.16| 0.0-2.9 | 0.0-0.5 | .37 | .37 | | | | 26-30 | 43-85| 1-30| 1-35|1.45-1.65| 2-6 |0.10-0.16| 0.0-2.9 | 0.0-0.5 | .37 | .37 | | | | 30-40 | 43-90| 1-30| 1-20|1.50-1.70| 6-20 |0.06-0.10| 0.0-2.9 | 0.0-0.5 | .20 | .20 | | | | 40-46 | 70-90| 1-30| 1-15|1.50-1.70| 6-20 |0.06-0.10| 0.0-2.9 | 0.0-0.5 | .20 | .20 | | | | 46-54 | 85-98| 1-15| 1-10|1.65-1.75| 6-20 |0.04-0.07| 0.0-2.9 | 0.0-0.5 | .15 | .15 | | | | 54-72 | 85-98| 1-15| 1-10|1.65-1.75| 6-20 |0.04-0.07| 0.0-2.9 | 0.0-0.5 | .15 | .15 | | | | | | | | | | | | | | | | |
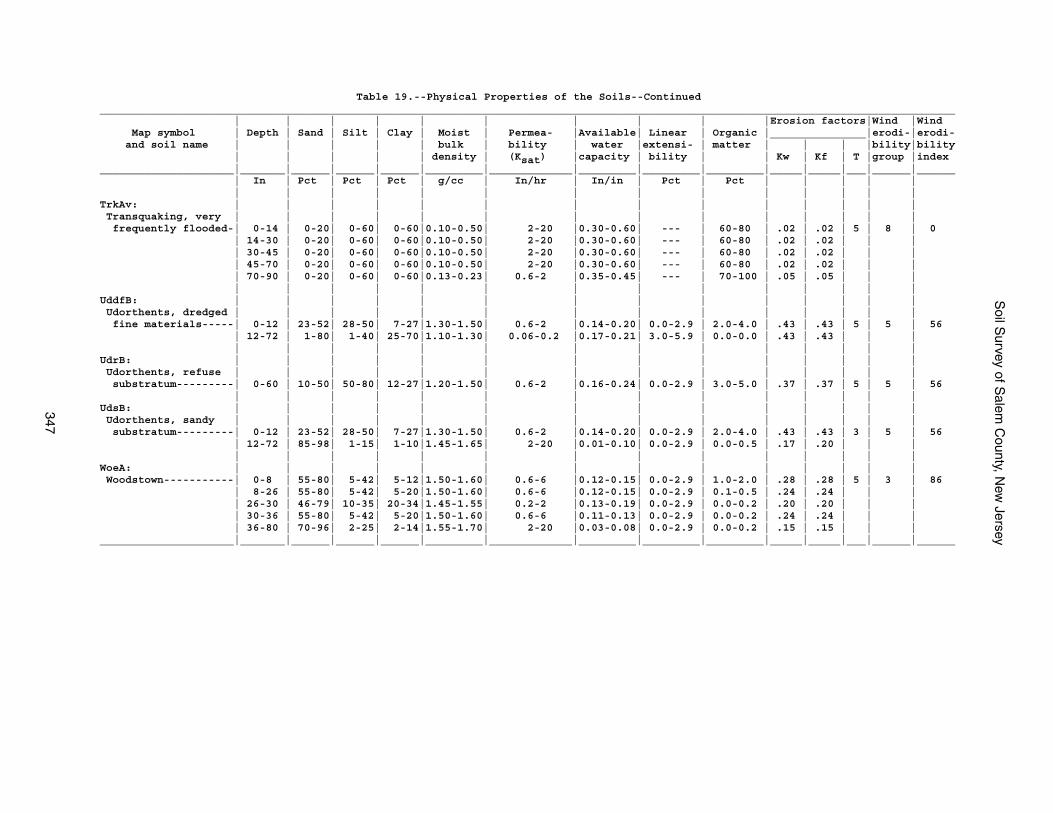
Soil S
urvey of Salem
County, N
ew Jersey
347
Table 19.--Physical Properties of the Soils--Continued______________________________________________________________________________________________________________________________________ | | | | | | | | | |Erosion factors|Wind |Wind Map symbol | Depth | Sand | Silt | Clay | Moist | Permea- |Available| Linear | Organic |_______________|erodi-|erodi- and soil name | | | | | bulk | bility | water |extensi- | matter | | | |bility|bility | | | | | density | (Ksat) |capacity | bility | | Kw | Kf | T |group |index_____________________|_______|______|______|______|_________|_____________|_________|_________|_________|_____|_____|___|______|______ | In | Pct | Pct | Pct | g/cc | In/hr | In/in | Pct | Pct | | | | | | | | | | | | | | | | | | |TrkAv: | | | | | | | | | | | | | | Transquaking, very | | | | | | | | | | | | | | frequently flooded-| 0-14 | 0-20| 0-60| 0-60|0.10-0.50| 2-20 |0.30-0.60| --- | 60-80 | .02 | .02 | 5 | 8 | 0 | 14-30 | 0-20| 0-60| 0-60|0.10-0.50| 2-20 |0.30-0.60| --- | 60-80 | .02 | .02 | | | | 30-45 | 0-20| 0-60| 0-60|0.10-0.50| 2-20 |0.30-0.60| --- | 60-80 | .02 | .02 | | | | 45-70 | 0-20| 0-60| 0-60|0.10-0.50| 2-20 |0.30-0.60| --- | 60-80 | .02 | .02 | | | | 70-90 | 0-20| 0-60| 0-60|0.13-0.23| 0.6-2 |0.35-0.45| --- | 70-100 | .05 | .05 | | | | | | | | | | | | | | | | |UddfB: | | | | | | | | | | | | | | Udorthents, dredged | | | | | | | | | | | | | | fine materials-----| 0-12 | 23-52| 28-50| 7-27|1.30-1.50| 0.6-2 |0.14-0.20| 0.0-2.9 | 2.0-4.0 | .43 | .43 | 5 | 5 | 56 | 12-72 | 1-80| 1-40| 25-70|1.10-1.30| 0.06-0.2 |0.17-0.21| 3.0-5.9 | 0.0-0.0 | .43 | .43 | | | | | | | | | | | | | | | | |UdrB: | | | | | | | | | | | | | | Udorthents, refuse | | | | | | | | | | | | | | substratum---------| 0-60 | 10-50| 50-80| 12-27|1.20-1.50| 0.6-2 |0.16-0.24| 0.0-2.9 | 3.0-5.0 | .37 | .37 | 5 | 5 | 56 | | | | | | | | | | | | | |UdsB: | | | | | | | | | | | | | | Udorthents, sandy | | | | | | | | | | | | | | substratum---------| 0-12 | 23-52| 28-50| 7-27|1.30-1.50| 0.6-2 |0.14-0.20| 0.0-2.9 | 2.0-4.0 | .43 | .43 | 3 | 5 | 56 | 12-72 | 85-98| 1-15| 1-10|1.45-1.65| 2-20 |0.01-0.10| 0.0-2.9 | 0.0-0.5 | .17 | .20 | | | | | | | | | | | | | | | | |WoeA: | | | | | | | | | | | | | | Woodstown-----------| 0-8 | 55-80| 5-42| 5-12|1.50-1.60| 0.6-6 |0.12-0.15| 0.0-2.9 | 1.0-2.0 | .28 | .28 | 5 | 3 | 86 | 8-26 | 55-80| 5-42| 5-20|1.50-1.60| 0.6-6 |0.12-0.15| 0.0-2.9 | 0.1-0.5 | .24 | .24 | | | | 26-30 | 46-79| 10-35| 20-34|1.45-1.55| 0.2-2 |0.13-0.19| 0.0-2.9 | 0.0-0.2 | .20 | .20 | | | | 30-36 | 55-80| 5-42| 5-20|1.50-1.60| 0.6-6 |0.11-0.13| 0.0-2.9 | 0.0-0.2 | .24 | .24 | | | | 36-80 | 70-96| 2-25| 2-14|1.55-1.70| 2-20 |0.03-0.08| 0.0-2.9 | 0.0-0.2 | .15 | .15 | | |_____________________|_______|______|______|______|_________|_____________|_________|_________|_________|_____|_____|___|______|______
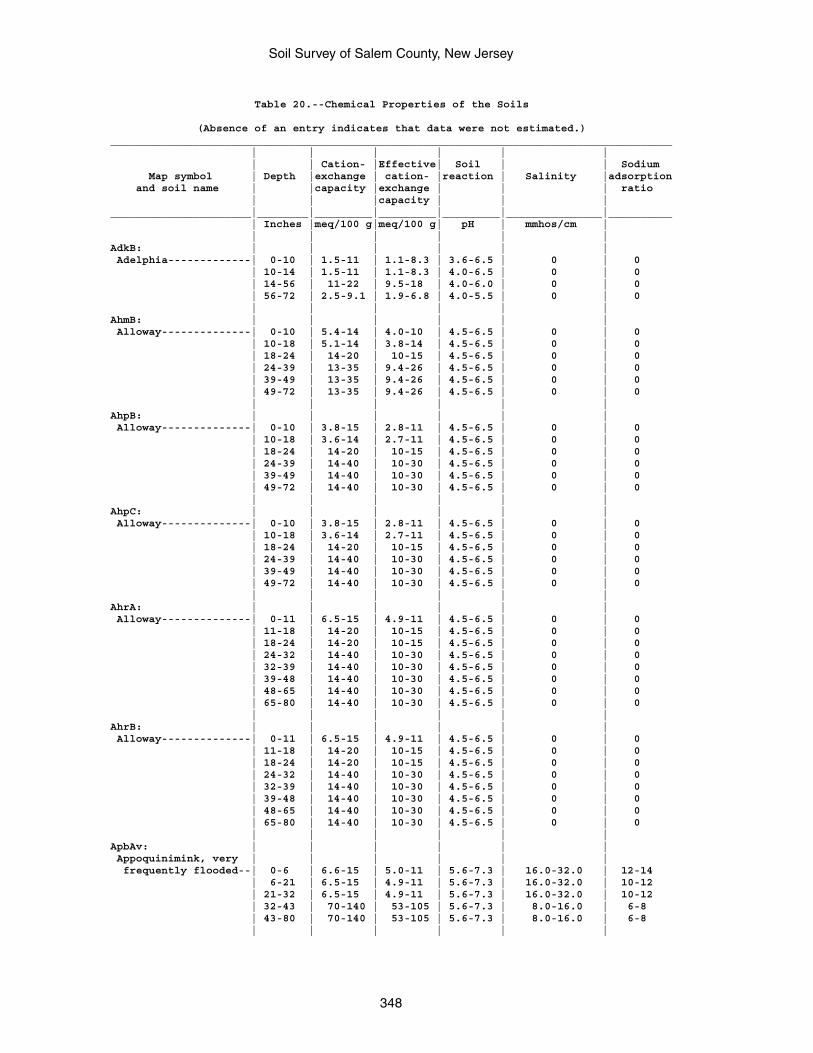
Soil Survey of Salem County, New Jersey
348
Table 20.--Chemical Properties of the Soils
(Absence of an entry indicates that data were not estimated.)________________________________________________________________________________________ | | | | | | | | Cation- |Effective| Soil | | Sodium Map symbol | Depth |exchange | cation- |reaction | Salinity |adsorption and soil name | |capacity |exchange | | | ratio | | |capacity | | |______________________|________|_________|_________|_________|_______________|__________ | Inches |meq/100 g|meq/100 g| pH | mmhos/cm | | | | | | |AdkB: | | | | | | Adelphia-------------| 0-10 | 1.5-11 | 1.1-8.3 | 3.6-6.5 | 0 | 0 | 10-14 | 1.5-11 | 1.1-8.3 | 4.0-6.5 | 0 | 0 | 14-56 | 11-22 | 9.5-18 | 4.0-6.0 | 0 | 0 | 56-72 | 2.5-9.1 | 1.9-6.8 | 4.0-5.5 | 0 | 0 | | | | | |AhmB: | | | | | | Alloway--------------| 0-10 | 5.4-14 | 4.0-10 | 4.5-6.5 | 0 | 0 | 10-18 | 5.1-14 | 3.8-14 | 4.5-6.5 | 0 | 0 | 18-24 | 14-20 | 10-15 | 4.5-6.5 | 0 | 0 | 24-39 | 13-35 | 9.4-26 | 4.5-6.5 | 0 | 0 | 39-49 | 13-35 | 9.4-26 | 4.5-6.5 | 0 | 0 | 49-72 | 13-35 | 9.4-26 | 4.5-6.5 | 0 | 0 | | | | | |AhpB: | | | | | | Alloway--------------| 0-10 | 3.8-15 | 2.8-11 | 4.5-6.5 | 0 | 0 | 10-18 | 3.6-14 | 2.7-11 | 4.5-6.5 | 0 | 0 | 18-24 | 14-20 | 10-15 | 4.5-6.5 | 0 | 0 | 24-39 | 14-40 | 10-30 | 4.5-6.5 | 0 | 0 | 39-49 | 14-40 | 10-30 | 4.5-6.5 | 0 | 0 | 49-72 | 14-40 | 10-30 | 4.5-6.5 | 0 | 0 | | | | | |AhpC: | | | | | | Alloway--------------| 0-10 | 3.8-15 | 2.8-11 | 4.5-6.5 | 0 | 0 | 10-18 | 3.6-14 | 2.7-11 | 4.5-6.5 | 0 | 0 | 18-24 | 14-20 | 10-15 | 4.5-6.5 | 0 | 0 | 24-39 | 14-40 | 10-30 | 4.5-6.5 | 0 | 0 | 39-49 | 14-40 | 10-30 | 4.5-6.5 | 0 | 0 | 49-72 | 14-40 | 10-30 | 4.5-6.5 | 0 | 0 | | | | | |AhrA: | | | | | | Alloway--------------| 0-11 | 6.5-15 | 4.9-11 | 4.5-6.5 | 0 | 0 | 11-18 | 14-20 | 10-15 | 4.5-6.5 | 0 | 0 | 18-24 | 14-20 | 10-15 | 4.5-6.5 | 0 | 0 | 24-32 | 14-40 | 10-30 | 4.5-6.5 | 0 | 0 | 32-39 | 14-40 | 10-30 | 4.5-6.5 | 0 | 0 | 39-48 | 14-40 | 10-30 | 4.5-6.5 | 0 | 0 | 48-65 | 14-40 | 10-30 | 4.5-6.5 | 0 | 0 | 65-80 | 14-40 | 10-30 | 4.5-6.5 | 0 | 0 | | | | | |AhrB: | | | | | | Alloway--------------| 0-11 | 6.5-15 | 4.9-11 | 4.5-6.5 | 0 | 0 | 11-18 | 14-20 | 10-15 | 4.5-6.5 | 0 | 0 | 18-24 | 14-20 | 10-15 | 4.5-6.5 | 0 | 0 | 24-32 | 14-40 | 10-30 | 4.5-6.5 | 0 | 0 | 32-39 | 14-40 | 10-30 | 4.5-6.5 | 0 | 0 | 39-48 | 14-40 | 10-30 | 4.5-6.5 | 0 | 0 | 48-65 | 14-40 | 10-30 | 4.5-6.5 | 0 | 0 | 65-80 | 14-40 | 10-30 | 4.5-6.5 | 0 | 0 | | | | | |ApbAv: | | | | | | Appoquinimink, very | | | | | | frequently flooded--| 0-6 | 6.6-15 | 5.0-11 | 5.6-7.3 | 16.0-32.0 | 12-14 | 6-21 | 6.5-15 | 4.9-11 | 5.6-7.3 | 16.0-32.0 | 10-12 | 21-32 | 6.5-15 | 4.9-11 | 5.6-7.3 | 16.0-32.0 | 10-12 | 32-43 | 70-140 | 53-105 | 5.6-7.3 | 8.0-16.0 | 6-8 | 43-80 | 70-140 | 53-105 | 5.6-7.3 | 8.0-16.0 | 6-8 | | | | | |
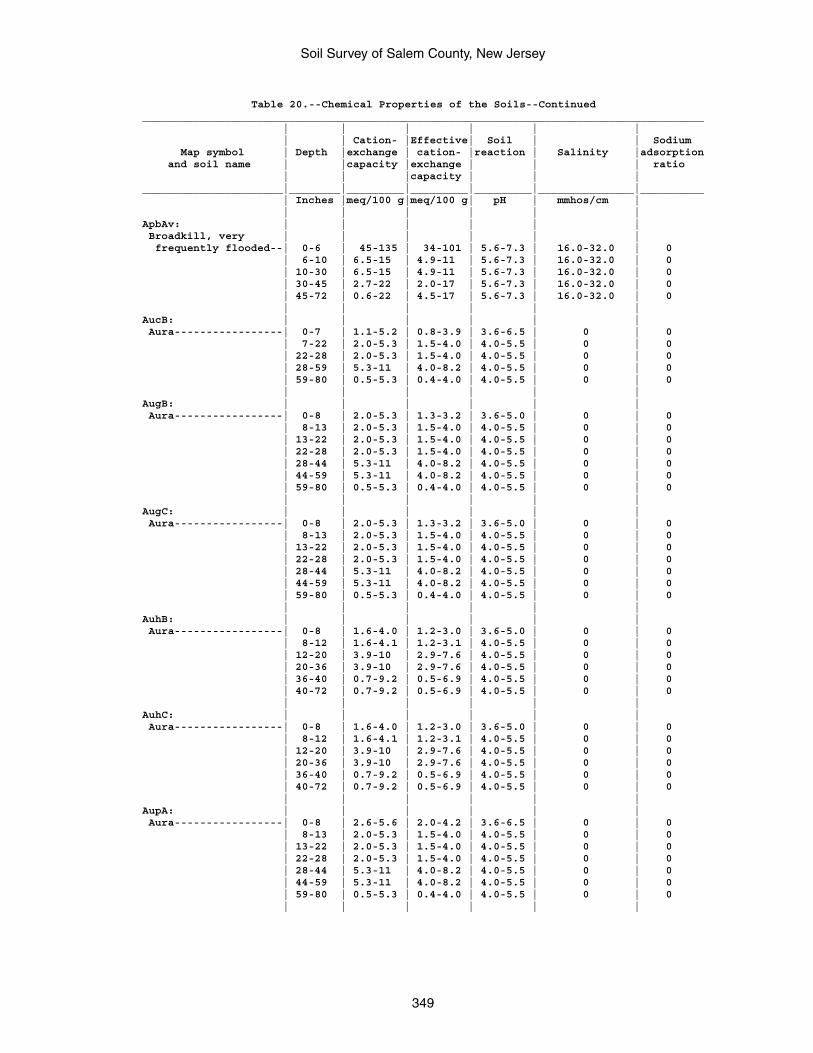
Soil Survey of Salem County, New Jersey
349
Table 20.--Chemical Properties of the Soils--Continued________________________________________________________________________________________ | | | | | | | | Cation- |Effective| Soil | | Sodium Map symbol | Depth |exchange | cation- |reaction | Salinity |adsorption and soil name | |capacity |exchange | | | ratio | | |capacity | | |______________________|________|_________|_________|_________|_______________|__________ | Inches |meq/100 g|meq/100 g| pH | mmhos/cm | | | | | | |ApbAv: | | | | | | Broadkill, very | | | | | | frequently flooded--| 0-6 | 45-135 | 34-101 | 5.6-7.3 | 16.0-32.0 | 0 | 6-10 | 6.5-15 | 4.9-11 | 5.6-7.3 | 16.0-32.0 | 0 | 10-30 | 6.5-15 | 4.9-11 | 5.6-7.3 | 16.0-32.0 | 0 | 30-45 | 2.7-22 | 2.0-17 | 5.6-7.3 | 16.0-32.0 | 0 | 45-72 | 0.6-22 | 4.5-17 | 5.6-7.3 | 16.0-32.0 | 0 | | | | | |AucB: | | | | | | Aura-----------------| 0-7 | 1.1-5.2 | 0.8-3.9 | 3.6-6.5 | 0 | 0 | 7-22 | 2.0-5.3 | 1.5-4.0 | 4.0-5.5 | 0 | 0 | 22-28 | 2.0-5.3 | 1.5-4.0 | 4.0-5.5 | 0 | 0 | 28-59 | 5.3-11 | 4.0-8.2 | 4.0-5.5 | 0 | 0 | 59-80 | 0.5-5.3 | 0.4-4.0 | 4.0-5.5 | 0 | 0 | | | | | |AugB: | | | | | | Aura-----------------| 0-8 | 2.0-5.3 | 1.3-3.2 | 3.6-5.0 | 0 | 0 | 8-13 | 2.0-5.3 | 1.5-4.0 | 4.0-5.5 | 0 | 0 | 13-22 | 2.0-5.3 | 1.5-4.0 | 4.0-5.5 | 0 | 0 | 22-28 | 2.0-5.3 | 1.5-4.0 | 4.0-5.5 | 0 | 0 | 28-44 | 5.3-11 | 4.0-8.2 | 4.0-5.5 | 0 | 0 | 44-59 | 5.3-11 | 4.0-8.2 | 4.0-5.5 | 0 | 0 | 59-80 | 0.5-5.3 | 0.4-4.0 | 4.0-5.5 | 0 | 0 | | | | | |AugC: | | | | | | Aura-----------------| 0-8 | 2.0-5.3 | 1.3-3.2 | 3.6-5.0 | 0 | 0 | 8-13 | 2.0-5.3 | 1.5-4.0 | 4.0-5.5 | 0 | 0 | 13-22 | 2.0-5.3 | 1.5-4.0 | 4.0-5.5 | 0 | 0 | 22-28 | 2.0-5.3 | 1.5-4.0 | 4.0-5.5 | 0 | 0 | 28-44 | 5.3-11 | 4.0-8.2 | 4.0-5.5 | 0 | 0 | 44-59 | 5.3-11 | 4.0-8.2 | 4.0-5.5 | 0 | 0 | 59-80 | 0.5-5.3 | 0.4-4.0 | 4.0-5.5 | 0 | 0 | | | | | |AuhB: | | | | | | Aura-----------------| 0-8 | 1.6-4.0 | 1.2-3.0 | 3.6-5.0 | 0 | 0 | 8-12 | 1.6-4.1 | 1.2-3.1 | 4.0-5.5 | 0 | 0 | 12-20 | 3.9-10 | 2.9-7.6 | 4.0-5.5 | 0 | 0 | 20-36 | 3.9-10 | 2.9-7.6 | 4.0-5.5 | 0 | 0 | 36-40 | 0.7-9.2 | 0.5-6.9 | 4.0-5.5 | 0 | 0 | 40-72 | 0.7-9.2 | 0.5-6.9 | 4.0-5.5 | 0 | 0 | | | | | |AuhC: | | | | | | Aura-----------------| 0-8 | 1.6-4.0 | 1.2-3.0 | 3.6-5.0 | 0 | 0 | 8-12 | 1.6-4.1 | 1.2-3.1 | 4.0-5.5 | 0 | 0 | 12-20 | 3.9-10 | 2.9-7.6 | 4.0-5.5 | 0 | 0 | 20-36 | 3.9-10 | 2.9-7.6 | 4.0-5.5 | 0 | 0 | 36-40 | 0.7-9.2 | 0.5-6.9 | 4.0-5.5 | 0 | 0 | 40-72 | 0.7-9.2 | 0.5-6.9 | 4.0-5.5 | 0 | 0 | | | | | |AupA: | | | | | | Aura-----------------| 0-8 | 2.6-5.6 | 2.0-4.2 | 3.6-6.5 | 0 | 0 | 8-13 | 2.0-5.3 | 1.5-4.0 | 4.0-5.5 | 0 | 0 | 13-22 | 2.0-5.3 | 1.5-4.0 | 4.0-5.5 | 0 | 0 | 22-28 | 2.0-5.3 | 1.5-4.0 | 4.0-5.5 | 0 | 0 | 28-44 | 5.3-11 | 4.0-8.2 | 4.0-5.5 | 0 | 0 | 44-59 | 5.3-11 | 4.0-8.2 | 4.0-5.5 | 0 | 0 | 59-80 | 0.5-5.3 | 0.4-4.0 | 4.0-5.5 | 0 | 0 | | | | | |
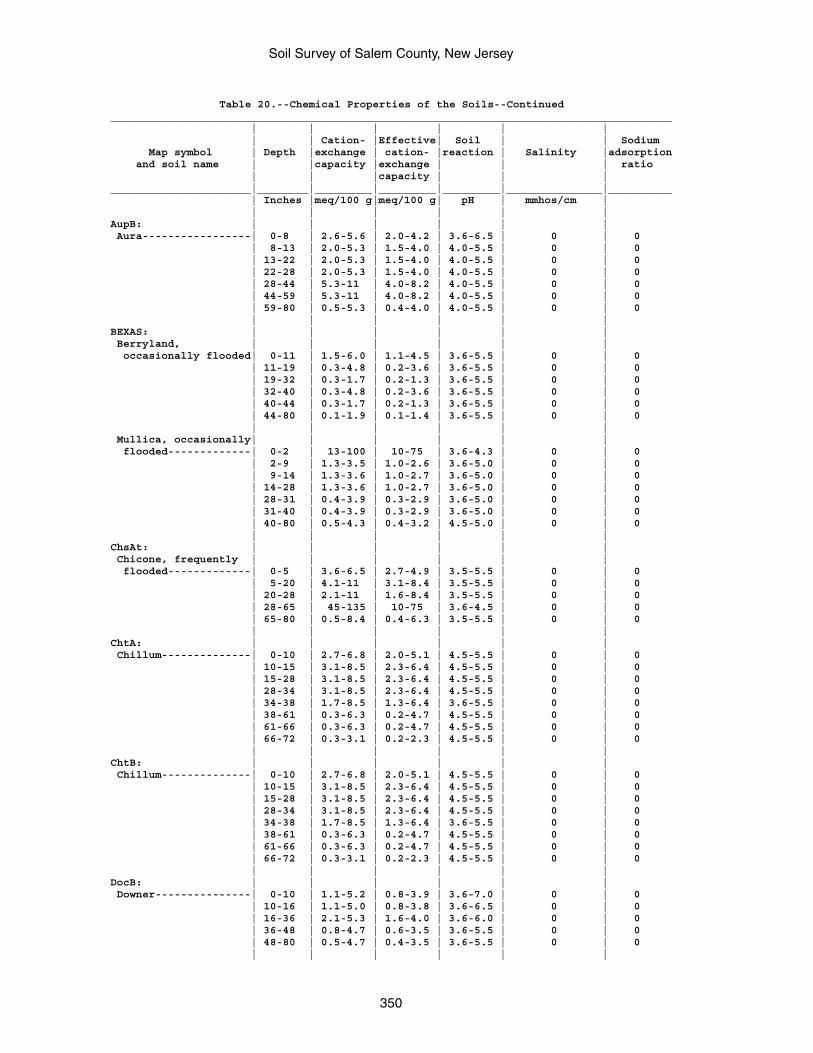
Soil Survey of Salem County, New Jersey
350
Table 20.--Chemical Properties of the Soils--Continued________________________________________________________________________________________ | | | | | | | | Cation- |Effective| Soil | | Sodium Map symbol | Depth |exchange | cation- |reaction | Salinity |adsorption and soil name | |capacity |exchange | | | ratio | | |capacity | | |______________________|________|_________|_________|_________|_______________|__________ | Inches |meq/100 g|meq/100 g| pH | mmhos/cm | | | | | | |AupB: | | | | | | Aura-----------------| 0-8 | 2.6-5.6 | 2.0-4.2 | 3.6-6.5 | 0 | 0 | 8-13 | 2.0-5.3 | 1.5-4.0 | 4.0-5.5 | 0 | 0 | 13-22 | 2.0-5.3 | 1.5-4.0 | 4.0-5.5 | 0 | 0 | 22-28 | 2.0-5.3 | 1.5-4.0 | 4.0-5.5 | 0 | 0 | 28-44 | 5.3-11 | 4.0-8.2 | 4.0-5.5 | 0 | 0 | 44-59 | 5.3-11 | 4.0-8.2 | 4.0-5.5 | 0 | 0 | 59-80 | 0.5-5.3 | 0.4-4.0 | 4.0-5.5 | 0 | 0 | | | | | |BEXAS: | | | | | | Berryland, | | | | | | occasionally flooded| 0-11 | 1.5-6.0 | 1.1-4.5 | 3.6-5.5 | 0 | 0 | 11-19 | 0.3-4.8 | 0.2-3.6 | 3.6-5.5 | 0 | 0 | 19-32 | 0.3-1.7 | 0.2-1.3 | 3.6-5.5 | 0 | 0 | 32-40 | 0.3-4.8 | 0.2-3.6 | 3.6-5.5 | 0 | 0 | 40-44 | 0.3-1.7 | 0.2-1.3 | 3.6-5.5 | 0 | 0 | 44-80 | 0.1-1.9 | 0.1-1.4 | 3.6-5.5 | 0 | 0 | | | | | | Mullica, occasionally| | | | | | flooded-------------| 0-2 | 13-100 | 10-75 | 3.6-4.3 | 0 | 0 | 2-9 | 1.3-3.5 | 1.0-2.6 | 3.6-5.0 | 0 | 0 | 9-14 | 1.3-3.6 | 1.0-2.7 | 3.6-5.0 | 0 | 0 | 14-28 | 1.3-3.6 | 1.0-2.7 | 3.6-5.0 | 0 | 0 | 28-31 | 0.4-3.9 | 0.3-2.9 | 3.6-5.0 | 0 | 0 | 31-40 | 0.4-3.9 | 0.3-2.9 | 3.6-5.0 | 0 | 0 | 40-80 | 0.5-4.3 | 0.4-3.2 | 4.5-5.0 | 0 | 0 | | | | | |ChsAt: | | | | | | Chicone, frequently | | | | | | flooded-------------| 0-5 | 3.6-6.5 | 2.7-4.9 | 3.5-5.5 | 0 | 0 | 5-20 | 4.1-11 | 3.1-8.4 | 3.5-5.5 | 0 | 0 | 20-28 | 2.1-11 | 1.6-8.4 | 3.5-5.5 | 0 | 0 | 28-65 | 45-135 | 10-75 | 3.6-4.5 | 0 | 0 | 65-80 | 0.5-8.4 | 0.4-6.3 | 3.5-5.5 | 0 | 0 | | | | | |ChtA: | | | | | | Chillum--------------| 0-10 | 2.7-6.8 | 2.0-5.1 | 4.5-5.5 | 0 | 0 | 10-15 | 3.1-8.5 | 2.3-6.4 | 4.5-5.5 | 0 | 0 | 15-28 | 3.1-8.5 | 2.3-6.4 | 4.5-5.5 | 0 | 0 | 28-34 | 3.1-8.5 | 2.3-6.4 | 4.5-5.5 | 0 | 0 | 34-38 | 1.7-8.5 | 1.3-6.4 | 3.6-5.5 | 0 | 0 | 38-61 | 0.3-6.3 | 0.2-4.7 | 4.5-5.5 | 0 | 0 | 61-66 | 0.3-6.3 | 0.2-4.7 | 4.5-5.5 | 0 | 0 | 66-72 | 0.3-3.1 | 0.2-2.3 | 4.5-5.5 | 0 | 0 | | | | | |ChtB: | | | | | | Chillum--------------| 0-10 | 2.7-6.8 | 2.0-5.1 | 4.5-5.5 | 0 | 0 | 10-15 | 3.1-8.5 | 2.3-6.4 | 4.5-5.5 | 0 | 0 | 15-28 | 3.1-8.5 | 2.3-6.4 | 4.5-5.5 | 0 | 0 | 28-34 | 3.1-8.5 | 2.3-6.4 | 4.5-5.5 | 0 | 0 | 34-38 | 1.7-8.5 | 1.3-6.4 | 3.6-5.5 | 0 | 0 | 38-61 | 0.3-6.3 | 0.2-4.7 | 4.5-5.5 | 0 | 0 | 61-66 | 0.3-6.3 | 0.2-4.7 | 4.5-5.5 | 0 | 0 | 66-72 | 0.3-3.1 | 0.2-2.3 | 4.5-5.5 | 0 | 0 | | | | | |DocB: | | | | | | Downer---------------| 0-10 | 1.1-5.2 | 0.8-3.9 | 3.6-7.0 | 0 | 0 | 10-16 | 1.1-5.0 | 0.8-3.8 | 3.6-6.5 | 0 | 0 | 16-36 | 2.1-5.3 | 1.6-4.0 | 3.6-6.0 | 0 | 0 | 36-48 | 0.8-4.7 | 0.6-3.5 | 3.6-5.5 | 0 | 0 | 48-80 | 0.5-4.7 | 0.4-3.5 | 3.6-5.5 | 0 | 0 | | | | | |
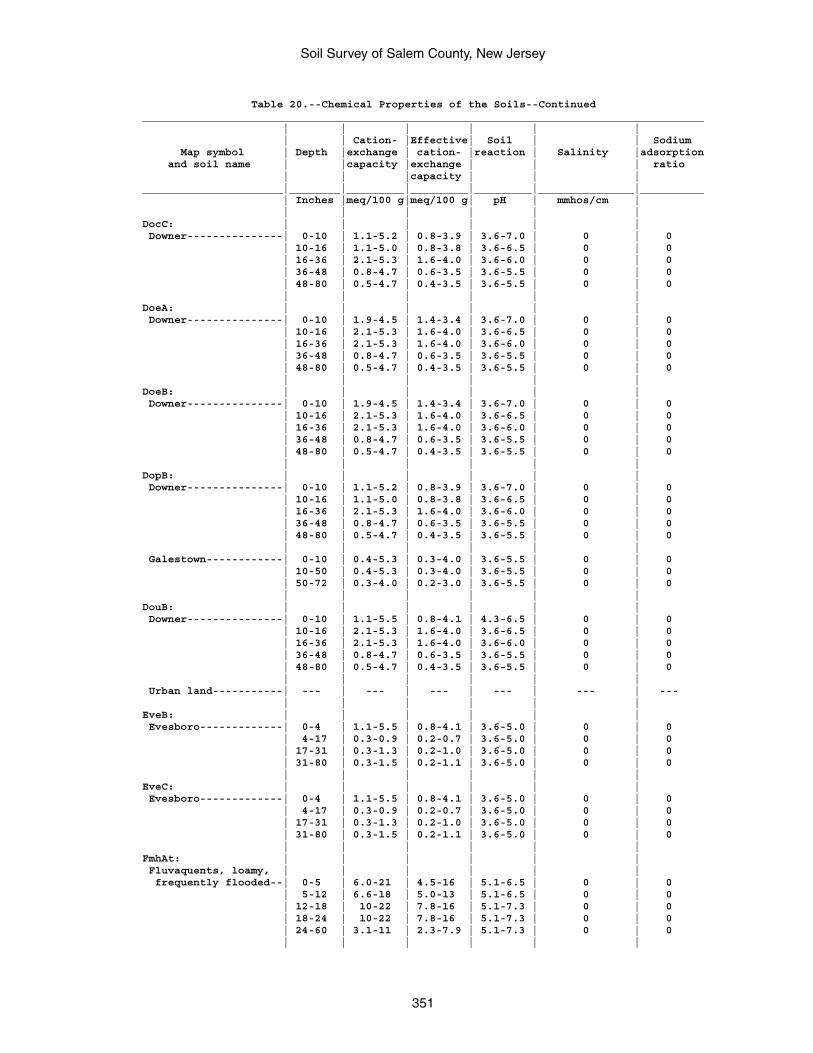
Soil Survey of Salem County, New Jersey
351
Table 20.--Chemical Properties of the Soils--Continued________________________________________________________________________________________ | | | | | | | | Cation- |Effective| Soil | | Sodium Map symbol | Depth |exchange | cation- |reaction | Salinity |adsorption and soil name | |capacity |exchange | | | ratio | | |capacity | | |______________________|________|_________|_________|_________|_______________|__________ | Inches |meq/100 g|meq/100 g| pH | mmhos/cm | | | | | | |DocC: | | | | | | Downer---------------| 0-10 | 1.1-5.2 | 0.8-3.9 | 3.6-7.0 | 0 | 0 | 10-16 | 1.1-5.0 | 0.8-3.8 | 3.6-6.5 | 0 | 0 | 16-36 | 2.1-5.3 | 1.6-4.0 | 3.6-6.0 | 0 | 0 | 36-48 | 0.8-4.7 | 0.6-3.5 | 3.6-5.5 | 0 | 0 | 48-80 | 0.5-4.7 | 0.4-3.5 | 3.6-5.5 | 0 | 0 | | | | | |DoeA: | | | | | | Downer---------------| 0-10 | 1.9-4.5 | 1.4-3.4 | 3.6-7.0 | 0 | 0 | 10-16 | 2.1-5.3 | 1.6-4.0 | 3.6-6.5 | 0 | 0 | 16-36 | 2.1-5.3 | 1.6-4.0 | 3.6-6.0 | 0 | 0 | 36-48 | 0.8-4.7 | 0.6-3.5 | 3.6-5.5 | 0 | 0 | 48-80 | 0.5-4.7 | 0.4-3.5 | 3.6-5.5 | 0 | 0 | | | | | |DoeB: | | | | | | Downer---------------| 0-10 | 1.9-4.5 | 1.4-3.4 | 3.6-7.0 | 0 | 0 | 10-16 | 2.1-5.3 | 1.6-4.0 | 3.6-6.5 | 0 | 0 | 16-36 | 2.1-5.3 | 1.6-4.0 | 3.6-6.0 | 0 | 0 | 36-48 | 0.8-4.7 | 0.6-3.5 | 3.6-5.5 | 0 | 0 | 48-80 | 0.5-4.7 | 0.4-3.5 | 3.6-5.5 | 0 | 0 | | | | | |DopB: | | | | | | Downer---------------| 0-10 | 1.1-5.2 | 0.8-3.9 | 3.6-7.0 | 0 | 0 | 10-16 | 1.1-5.0 | 0.8-3.8 | 3.6-6.5 | 0 | 0 | 16-36 | 2.1-5.3 | 1.6-4.0 | 3.6-6.0 | 0 | 0 | 36-48 | 0.8-4.7 | 0.6-3.5 | 3.6-5.5 | 0 | 0 | 48-80 | 0.5-4.7 | 0.4-3.5 | 3.6-5.5 | 0 | 0 | | | | | | Galestown------------| 0-10 | 0.4-5.3 | 0.3-4.0 | 3.6-5.5 | 0 | 0 | 10-50 | 0.4-5.3 | 0.3-4.0 | 3.6-5.5 | 0 | 0 | 50-72 | 0.3-4.0 | 0.2-3.0 | 3.6-5.5 | 0 | 0 | | | | | |DouB: | | | | | | Downer---------------| 0-10 | 1.1-5.5 | 0.8-4.1 | 4.3-6.5 | 0 | 0 | 10-16 | 2.1-5.3 | 1.6-4.0 | 3.6-6.5 | 0 | 0 | 16-36 | 2.1-5.3 | 1.6-4.0 | 3.6-6.0 | 0 | 0 | 36-48 | 0.8-4.7 | 0.6-3.5 | 3.6-5.5 | 0 | 0 | 48-80 | 0.5-4.7 | 0.4-3.5 | 3.6-5.5 | 0 | 0 | | | | | | Urban land-----------| --- | --- | --- | --- | --- | --- | | | | | |EveB: | | | | | | Evesboro-------------| 0-4 | 1.1-5.5 | 0.8-4.1 | 3.6-5.0 | 0 | 0 | 4-17 | 0.3-0.9 | 0.2-0.7 | 3.6-5.0 | 0 | 0 | 17-31 | 0.3-1.3 | 0.2-1.0 | 3.6-5.0 | 0 | 0 | 31-80 | 0.3-1.5 | 0.2-1.1 | 3.6-5.0 | 0 | 0 | | | | | |EveC: | | | | | | Evesboro-------------| 0-4 | 1.1-5.5 | 0.8-4.1 | 3.6-5.0 | 0 | 0 | 4-17 | 0.3-0.9 | 0.2-0.7 | 3.6-5.0 | 0 | 0 | 17-31 | 0.3-1.3 | 0.2-1.0 | 3.6-5.0 | 0 | 0 | 31-80 | 0.3-1.5 | 0.2-1.1 | 3.6-5.0 | 0 | 0 | | | | | |FmhAt: | | | | | | Fluvaquents, loamy, | | | | | | frequently flooded--| 0-5 | 6.0-21 | 4.5-16 | 5.1-6.5 | 0 | 0 | 5-12 | 6.6-18 | 5.0-13 | 5.1-6.5 | 0 | 0 | 12-18 | 10-22 | 7.8-16 | 5.1-7.3 | 0 | 0 | 18-24 | 10-22 | 7.8-16 | 5.1-7.3 | 0 | 0 | 24-60 | 3.1-11 | 2.3-7.9 | 5.1-7.3 | 0 | 0 | | | | | |
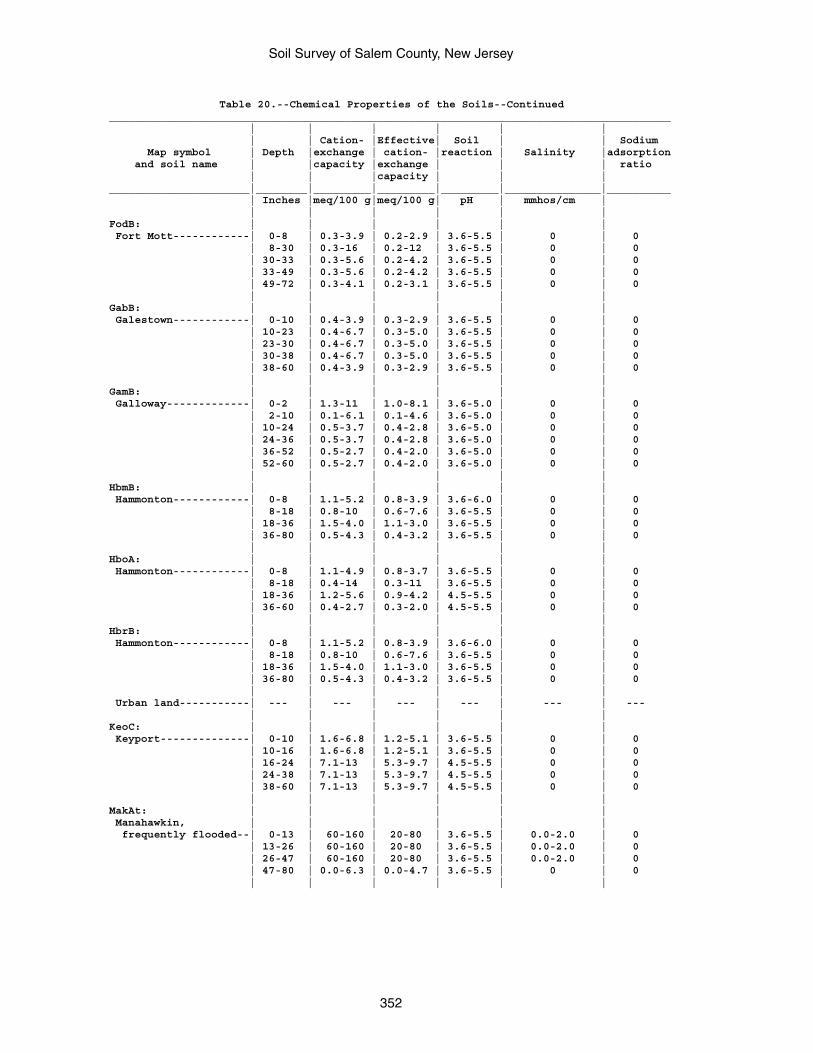
Soil Survey of Salem County, New Jersey
352
Table 20.--Chemical Properties of the Soils--Continued________________________________________________________________________________________ | | | | | | | | Cation- |Effective| Soil | | Sodium Map symbol | Depth |exchange | cation- |reaction | Salinity |adsorption and soil name | |capacity |exchange | | | ratio | | |capacity | | |______________________|________|_________|_________|_________|_______________|__________ | Inches |meq/100 g|meq/100 g| pH | mmhos/cm | | | | | | |FodB: | | | | | | Fort Mott------------| 0-8 | 0.3-3.9 | 0.2-2.9 | 3.6-5.5 | 0 | 0 | 8-30 | 0.3-16 | 0.2-12 | 3.6-5.5 | 0 | 0 | 30-33 | 0.3-5.6 | 0.2-4.2 | 3.6-5.5 | 0 | 0 | 33-49 | 0.3-5.6 | 0.2-4.2 | 3.6-5.5 | 0 | 0 | 49-72 | 0.3-4.1 | 0.2-3.1 | 3.6-5.5 | 0 | 0 | | | | | |GabB: | | | | | | Galestown------------| 0-10 | 0.4-3.9 | 0.3-2.9 | 3.6-5.5 | 0 | 0 | 10-23 | 0.4-6.7 | 0.3-5.0 | 3.6-5.5 | 0 | 0 | 23-30 | 0.4-6.7 | 0.3-5.0 | 3.6-5.5 | 0 | 0 | 30-38 | 0.4-6.7 | 0.3-5.0 | 3.6-5.5 | 0 | 0 | 38-60 | 0.4-3.9 | 0.3-2.9 | 3.6-5.5 | 0 | 0 | | | | | |GamB: | | | | | | Galloway-------------| 0-2 | 1.3-11 | 1.0-8.1 | 3.6-5.0 | 0 | 0 | 2-10 | 0.1-6.1 | 0.1-4.6 | 3.6-5.0 | 0 | 0 | 10-24 | 0.5-3.7 | 0.4-2.8 | 3.6-5.0 | 0 | 0 | 24-36 | 0.5-3.7 | 0.4-2.8 | 3.6-5.0 | 0 | 0 | 36-52 | 0.5-2.7 | 0.4-2.0 | 3.6-5.0 | 0 | 0 | 52-60 | 0.5-2.7 | 0.4-2.0 | 3.6-5.0 | 0 | 0 | | | | | |HbmB: | | | | | | Hammonton------------| 0-8 | 1.1-5.2 | 0.8-3.9 | 3.6-6.0 | 0 | 0 | 8-18 | 0.8-10 | 0.6-7.6 | 3.6-5.5 | 0 | 0 | 18-36 | 1.5-4.0 | 1.1-3.0 | 3.6-5.5 | 0 | 0 | 36-80 | 0.5-4.3 | 0.4-3.2 | 3.6-5.5 | 0 | 0 | | | | | |HboA: | | | | | | Hammonton------------| 0-8 | 1.1-4.9 | 0.8-3.7 | 3.6-5.5 | 0 | 0 | 8-18 | 0.4-14 | 0.3-11 | 3.6-5.5 | 0 | 0 | 18-36 | 1.2-5.6 | 0.9-4.2 | 4.5-5.5 | 0 | 0 | 36-60 | 0.4-2.7 | 0.3-2.0 | 4.5-5.5 | 0 | 0 | | | | | |HbrB: | | | | | | Hammonton------------| 0-8 | 1.1-5.2 | 0.8-3.9 | 3.6-6.0 | 0 | 0 | 8-18 | 0.8-10 | 0.6-7.6 | 3.6-5.5 | 0 | 0 | 18-36 | 1.5-4.0 | 1.1-3.0 | 3.6-5.5 | 0 | 0 | 36-80 | 0.5-4.3 | 0.4-3.2 | 3.6-5.5 | 0 | 0 | | | | | | Urban land-----------| --- | --- | --- | --- | --- | --- | | | | | |KeoC: | | | | | | Keyport--------------| 0-10 | 1.6-6.8 | 1.2-5.1 | 3.6-5.5 | 0 | 0 | 10-16 | 1.6-6.8 | 1.2-5.1 | 3.6-5.5 | 0 | 0 | 16-24 | 7.1-13 | 5.3-9.7 | 4.5-5.5 | 0 | 0 | 24-38 | 7.1-13 | 5.3-9.7 | 4.5-5.5 | 0 | 0 | 38-60 | 7.1-13 | 5.3-9.7 | 4.5-5.5 | 0 | 0 | | | | | |MakAt: | | | | | | Manahawkin, | | | | | | frequently flooded--| 0-13 | 60-160 | 20-80 | 3.6-5.5 | 0.0-2.0 | 0 | 13-26 | 60-160 | 20-80 | 3.6-5.5 | 0.0-2.0 | 0 | 26-47 | 60-160 | 20-80 | 3.6-5.5 | 0.0-2.0 | 0 | 47-80 | 0.0-6.3 | 0.0-4.7 | 3.6-5.5 | 0 | 0 | | | | | |
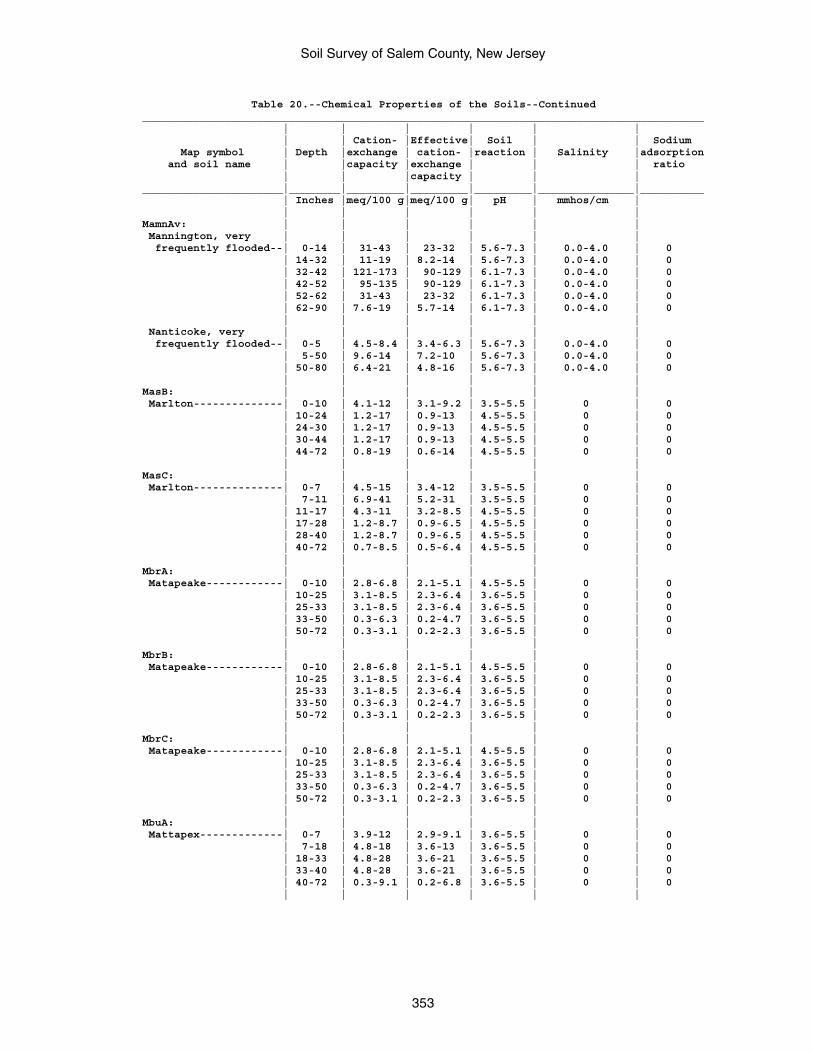
Soil Survey of Salem County, New Jersey
353
Table 20.--Chemical Properties of the Soils--Continued________________________________________________________________________________________ | | | | | | | | Cation- |Effective| Soil | | Sodium Map symbol | Depth |exchange | cation- |reaction | Salinity |adsorption and soil name | |capacity |exchange | | | ratio | | |capacity | | |______________________|________|_________|_________|_________|_______________|__________ | Inches |meq/100 g|meq/100 g| pH | mmhos/cm | | | | | | |MamnAv: | | | | | | Mannington, very | | | | | | frequently flooded--| 0-14 | 31-43 | 23-32 | 5.6-7.3 | 0.0-4.0 | 0 | 14-32 | 11-19 | 8.2-14 | 5.6-7.3 | 0.0-4.0 | 0 | 32-42 | 121-173 | 90-129 | 6.1-7.3 | 0.0-4.0 | 0 | 42-52 | 95-135 | 90-129 | 6.1-7.3 | 0.0-4.0 | 0 | 52-62 | 31-43 | 23-32 | 6.1-7.3 | 0.0-4.0 | 0 | 62-90 | 7.6-19 | 5.7-14 | 6.1-7.3 | 0.0-4.0 | 0 | | | | | | Nanticoke, very | | | | | | frequently flooded--| 0-5 | 4.5-8.4 | 3.4-6.3 | 5.6-7.3 | 0.0-4.0 | 0 | 5-50 | 9.6-14 | 7.2-10 | 5.6-7.3 | 0.0-4.0 | 0 | 50-80 | 6.4-21 | 4.8-16 | 5.6-7.3 | 0.0-4.0 | 0 | | | | | |MasB: | | | | | | Marlton--------------| 0-10 | 4.1-12 | 3.1-9.2 | 3.5-5.5 | 0 | 0 | 10-24 | 1.2-17 | 0.9-13 | 4.5-5.5 | 0 | 0 | 24-30 | 1.2-17 | 0.9-13 | 4.5-5.5 | 0 | 0 | 30-44 | 1.2-17 | 0.9-13 | 4.5-5.5 | 0 | 0 | 44-72 | 0.8-19 | 0.6-14 | 4.5-5.5 | 0 | 0 | | | | | |MasC: | | | | | | Marlton--------------| 0-7 | 4.5-15 | 3.4-12 | 3.5-5.5 | 0 | 0 | 7-11 | 6.9-41 | 5.2-31 | 3.5-5.5 | 0 | 0 | 11-17 | 4.3-11 | 3.2-8.5 | 4.5-5.5 | 0 | 0 | 17-28 | 1.2-8.7 | 0.9-6.5 | 4.5-5.5 | 0 | 0 | 28-40 | 1.2-8.7 | 0.9-6.5 | 4.5-5.5 | 0 | 0 | 40-72 | 0.7-8.5 | 0.5-6.4 | 4.5-5.5 | 0 | 0 | | | | | |MbrA: | | | | | | Matapeake------------| 0-10 | 2.8-6.8 | 2.1-5.1 | 4.5-5.5 | 0 | 0 | 10-25 | 3.1-8.5 | 2.3-6.4 | 3.6-5.5 | 0 | 0 | 25-33 | 3.1-8.5 | 2.3-6.4 | 3.6-5.5 | 0 | 0 | 33-50 | 0.3-6.3 | 0.2-4.7 | 3.6-5.5 | 0 | 0 | 50-72 | 0.3-3.1 | 0.2-2.3 | 3.6-5.5 | 0 | 0 | | | | | |MbrB: | | | | | | Matapeake------------| 0-10 | 2.8-6.8 | 2.1-5.1 | 4.5-5.5 | 0 | 0 | 10-25 | 3.1-8.5 | 2.3-6.4 | 3.6-5.5 | 0 | 0 | 25-33 | 3.1-8.5 | 2.3-6.4 | 3.6-5.5 | 0 | 0 | 33-50 | 0.3-6.3 | 0.2-4.7 | 3.6-5.5 | 0 | 0 | 50-72 | 0.3-3.1 | 0.2-2.3 | 3.6-5.5 | 0 | 0 | | | | | |MbrC: | | | | | | Matapeake------------| 0-10 | 2.8-6.8 | 2.1-5.1 | 4.5-5.5 | 0 | 0 | 10-25 | 3.1-8.5 | 2.3-6.4 | 3.6-5.5 | 0 | 0 | 25-33 | 3.1-8.5 | 2.3-6.4 | 3.6-5.5 | 0 | 0 | 33-50 | 0.3-6.3 | 0.2-4.7 | 3.6-5.5 | 0 | 0 | 50-72 | 0.3-3.1 | 0.2-2.3 | 3.6-5.5 | 0 | 0 | | | | | |MbuA: | | | | | | Mattapex-------------| 0-7 | 3.9-12 | 2.9-9.1 | 3.6-5.5 | 0 | 0 | 7-18 | 4.8-18 | 3.6-13 | 3.6-5.5 | 0 | 0 | 18-33 | 4.8-28 | 3.6-21 | 3.6-5.5 | 0 | 0 | 33-40 | 4.8-28 | 3.6-21 | 3.6-5.5 | 0 | 0 | 40-72 | 0.3-9.1 | 0.2-6.8 | 3.6-5.5 | 0 | 0 | | | | | |
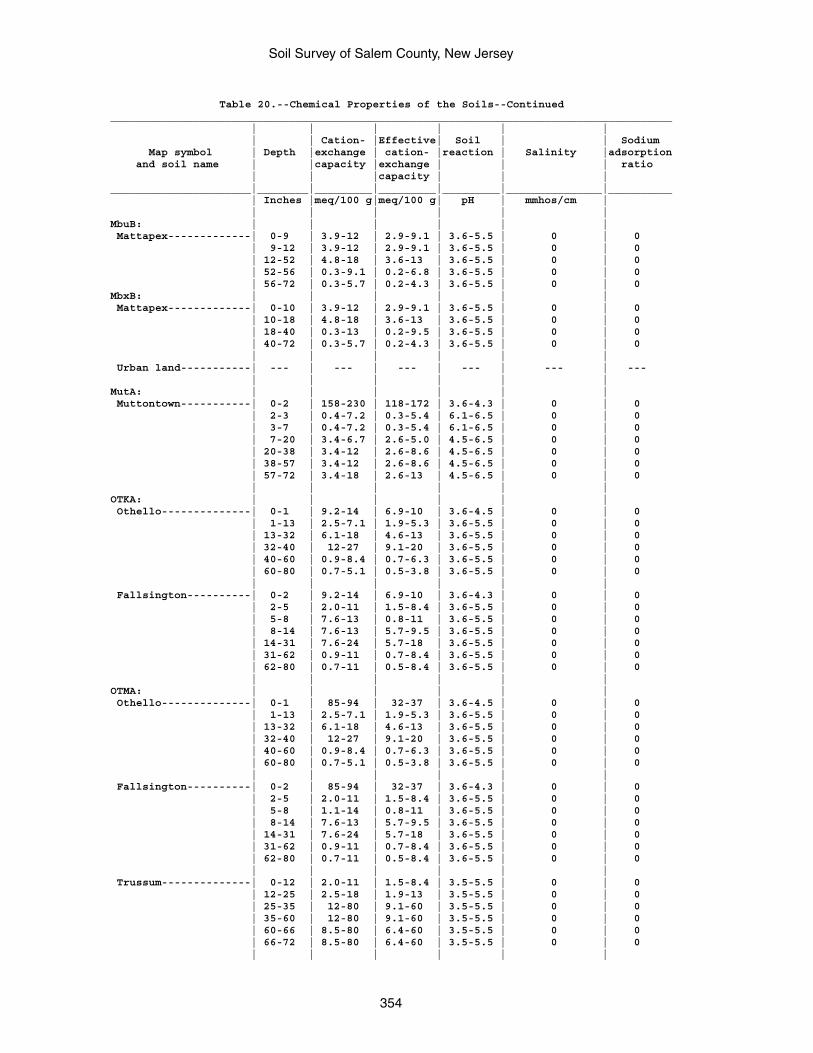
Soil Survey of Salem County, New Jersey
354
Table 20.--Chemical Properties of the Soils--Continued________________________________________________________________________________________ | | | | | | | | Cation- |Effective| Soil | | Sodium Map symbol | Depth |exchange | cation- |reaction | Salinity |adsorption and soil name | |capacity |exchange | | | ratio | | |capacity | | |______________________|________|_________|_________|_________|_______________|__________ | Inches |meq/100 g|meq/100 g| pH | mmhos/cm | | | | | | |MbuB: | | | | | | Mattapex-------------| 0-9 | 3.9-12 | 2.9-9.1 | 3.6-5.5 | 0 | 0 | 9-12 | 3.9-12 | 2.9-9.1 | 3.6-5.5 | 0 | 0 | 12-52 | 4.8-18 | 3.6-13 | 3.6-5.5 | 0 | 0 | 52-56 | 0.3-9.1 | 0.2-6.8 | 3.6-5.5 | 0 | 0 | 56-72 | 0.3-5.7 | 0.2-4.3 | 3.6-5.5 | 0 | 0MbxB: | | | | | | Mattapex-------------| 0-10 | 3.9-12 | 2.9-9.1 | 3.6-5.5 | 0 | 0 | 10-18 | 4.8-18 | 3.6-13 | 3.6-5.5 | 0 | 0 | 18-40 | 0.3-13 | 0.2-9.5 | 3.6-5.5 | 0 | 0 | 40-72 | 0.3-5.7 | 0.2-4.3 | 3.6-5.5 | 0 | 0 | | | | | | Urban land-----------| --- | --- | --- | --- | --- | --- | | | | | |MutA: | | | | | | Muttontown-----------| 0-2 | 158-230 | 118-172 | 3.6-4.3 | 0 | 0 | 2-3 | 0.4-7.2 | 0.3-5.4 | 6.1-6.5 | 0 | 0 | 3-7 | 0.4-7.2 | 0.3-5.4 | 6.1-6.5 | 0 | 0 | 7-20 | 3.4-6.7 | 2.6-5.0 | 4.5-6.5 | 0 | 0 | 20-38 | 3.4-12 | 2.6-8.6 | 4.5-6.5 | 0 | 0 | 38-57 | 3.4-12 | 2.6-8.6 | 4.5-6.5 | 0 | 0 | 57-72 | 3.4-18 | 2.6-13 | 4.5-6.5 | 0 | 0 | | | | | |OTKA: | | | | | | Othello--------------| 0-1 | 9.2-14 | 6.9-10 | 3.6-4.5 | 0 | 0 | 1-13 | 2.5-7.1 | 1.9-5.3 | 3.6-5.5 | 0 | 0 | 13-32 | 6.1-18 | 4.6-13 | 3.6-5.5 | 0 | 0 | 32-40 | 12-27 | 9.1-20 | 3.6-5.5 | 0 | 0 | 40-60 | 0.9-8.4 | 0.7-6.3 | 3.6-5.5 | 0 | 0 | 60-80 | 0.7-5.1 | 0.5-3.8 | 3.6-5.5 | 0 | 0 | | | | | | Fallsington----------| 0-2 | 9.2-14 | 6.9-10 | 3.6-4.3 | 0 | 0 | 2-5 | 2.0-11 | 1.5-8.4 | 3.6-5.5 | 0 | 0 | 5-8 | 7.6-13 | 0.8-11 | 3.6-5.5 | 0 | 0 | 8-14 | 7.6-13 | 5.7-9.5 | 3.6-5.5 | 0 | 0 | 14-31 | 7.6-24 | 5.7-18 | 3.6-5.5 | 0 | 0 | 31-62 | 0.9-11 | 0.7-8.4 | 3.6-5.5 | 0 | 0 | 62-80 | 0.7-11 | 0.5-8.4 | 3.6-5.5 | 0 | 0 | | | | | |OTMA: | | | | | | Othello--------------| 0-1 | 85-94 | 32-37 | 3.6-4.5 | 0 | 0 | 1-13 | 2.5-7.1 | 1.9-5.3 | 3.6-5.5 | 0 | 0 | 13-32 | 6.1-18 | 4.6-13 | 3.6-5.5 | 0 | 0 | 32-40 | 12-27 | 9.1-20 | 3.6-5.5 | 0 | 0 | 40-60 | 0.9-8.4 | 0.7-6.3 | 3.6-5.5 | 0 | 0 | 60-80 | 0.7-5.1 | 0.5-3.8 | 3.6-5.5 | 0 | 0 | | | | | | Fallsington----------| 0-2 | 85-94 | 32-37 | 3.6-4.3 | 0 | 0 | 2-5 | 2.0-11 | 1.5-8.4 | 3.6-5.5 | 0 | 0 | 5-8 | 1.1-14 | 0.8-11 | 3.6-5.5 | 0 | 0 | 8-14 | 7.6-13 | 5.7-9.5 | 3.6-5.5 | 0 | 0 | 14-31 | 7.6-24 | 5.7-18 | 3.6-5.5 | 0 | 0 | 31-62 | 0.9-11 | 0.7-8.4 | 3.6-5.5 | 0 | 0 | 62-80 | 0.7-11 | 0.5-8.4 | 3.6-5.5 | 0 | 0 | | | | | | Trussum--------------| 0-12 | 2.0-11 | 1.5-8.4 | 3.5-5.5 | 0 | 0 | 12-25 | 2.5-18 | 1.9-13 | 3.5-5.5 | 0 | 0 | 25-35 | 12-80 | 9.1-60 | 3.5-5.5 | 0 | 0 | 35-60 | 12-80 | 9.1-60 | 3.5-5.5 | 0 | 0 | 60-66 | 8.5-80 | 6.4-60 | 3.5-5.5 | 0 | 0 | 66-72 | 8.5-80 | 6.4-60 | 3.5-5.5 | 0 | 0 | | | | | |
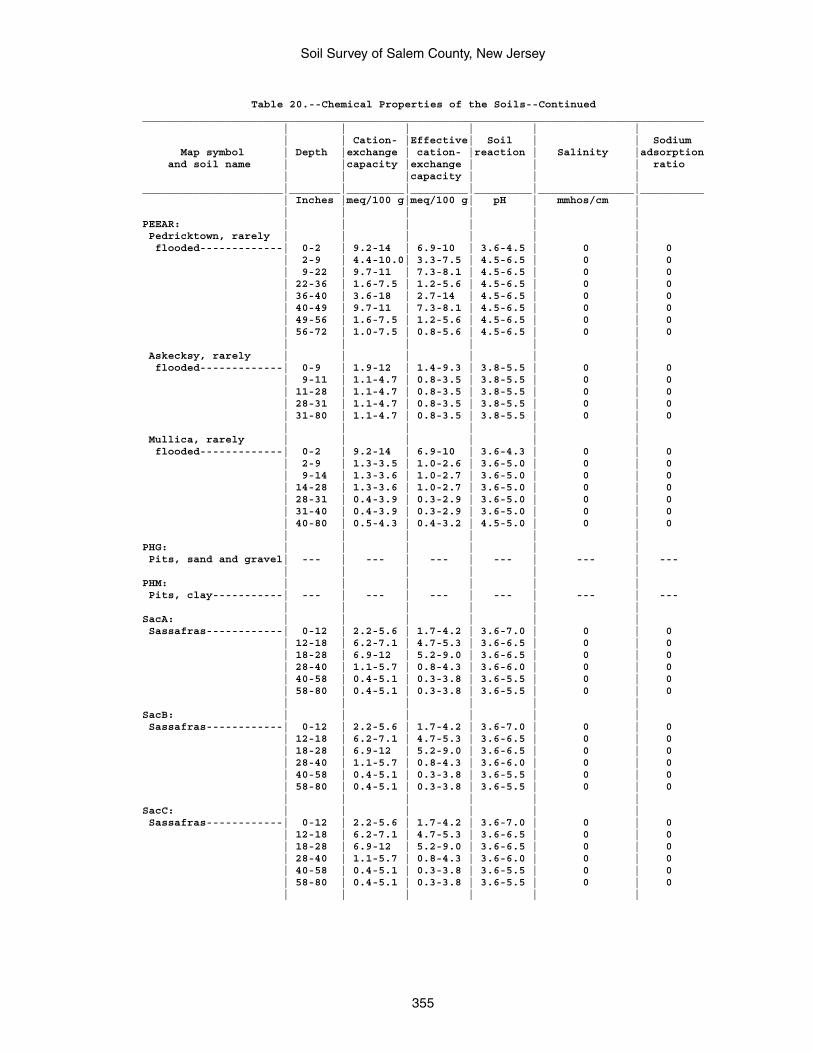
Soil Survey of Salem County, New Jersey
355
Table 20.--Chemical Properties of the Soils--Continued________________________________________________________________________________________ | | | | | | | | Cation- |Effective| Soil | | Sodium Map symbol | Depth |exchange | cation- |reaction | Salinity |adsorption and soil name | |capacity |exchange | | | ratio | | |capacity | | |______________________|________|_________|_________|_________|_______________|__________ | Inches |meq/100 g|meq/100 g| pH | mmhos/cm | | | | | | |PEEAR: | | | | | | Pedricktown, rarely | | | | | | flooded-------------| 0-2 | 9.2-14 | 6.9-10 | 3.6-4.5 | 0 | 0 | 2-9 | 4.4-10.0| 3.3-7.5 | 4.5-6.5 | 0 | 0 | 9-22 | 9.7-11 | 7.3-8.1 | 4.5-6.5 | 0 | 0 | 22-36 | 1.6-7.5 | 1.2-5.6 | 4.5-6.5 | 0 | 0 | 36-40 | 3.6-18 | 2.7-14 | 4.5-6.5 | 0 | 0 | 40-49 | 9.7-11 | 7.3-8.1 | 4.5-6.5 | 0 | 0 | 49-56 | 1.6-7.5 | 1.2-5.6 | 4.5-6.5 | 0 | 0 | 56-72 | 1.0-7.5 | 0.8-5.6 | 4.5-6.5 | 0 | 0 | | | | | | Askecksy, rarely | | | | | | flooded-------------| 0-9 | 1.9-12 | 1.4-9.3 | 3.8-5.5 | 0 | 0 | 9-11 | 1.1-4.7 | 0.8-3.5 | 3.8-5.5 | 0 | 0 | 11-28 | 1.1-4.7 | 0.8-3.5 | 3.8-5.5 | 0 | 0 | 28-31 | 1.1-4.7 | 0.8-3.5 | 3.8-5.5 | 0 | 0 | 31-80 | 1.1-4.7 | 0.8-3.5 | 3.8-5.5 | 0 | 0 | | | | | | Mullica, rarely | | | | | | flooded-------------| 0-2 | 9.2-14 | 6.9-10 | 3.6-4.3 | 0 | 0 | 2-9 | 1.3-3.5 | 1.0-2.6 | 3.6-5.0 | 0 | 0 | 9-14 | 1.3-3.6 | 1.0-2.7 | 3.6-5.0 | 0 | 0 | 14-28 | 1.3-3.6 | 1.0-2.7 | 3.6-5.0 | 0 | 0 | 28-31 | 0.4-3.9 | 0.3-2.9 | 3.6-5.0 | 0 | 0 | 31-40 | 0.4-3.9 | 0.3-2.9 | 3.6-5.0 | 0 | 0 | 40-80 | 0.5-4.3 | 0.4-3.2 | 4.5-5.0 | 0 | 0 | | | | | |PHG: | | | | | | Pits, sand and gravel| --- | --- | --- | --- | --- | --- | | | | | |PHM: | | | | | | Pits, clay-----------| --- | --- | --- | --- | --- | --- | | | | | |SacA: | | | | | | Sassafras------------| 0-12 | 2.2-5.6 | 1.7-4.2 | 3.6-7.0 | 0 | 0 | 12-18 | 6.2-7.1 | 4.7-5.3 | 3.6-6.5 | 0 | 0 | 18-28 | 6.9-12 | 5.2-9.0 | 3.6-6.5 | 0 | 0 | 28-40 | 1.1-5.7 | 0.8-4.3 | 3.6-6.0 | 0 | 0 | 40-58 | 0.4-5.1 | 0.3-3.8 | 3.6-5.5 | 0 | 0 | 58-80 | 0.4-5.1 | 0.3-3.8 | 3.6-5.5 | 0 | 0 | | | | | |SacB: | | | | | | Sassafras------------| 0-12 | 2.2-5.6 | 1.7-4.2 | 3.6-7.0 | 0 | 0 | 12-18 | 6.2-7.1 | 4.7-5.3 | 3.6-6.5 | 0 | 0 | 18-28 | 6.9-12 | 5.2-9.0 | 3.6-6.5 | 0 | 0 | 28-40 | 1.1-5.7 | 0.8-4.3 | 3.6-6.0 | 0 | 0 | 40-58 | 0.4-5.1 | 0.3-3.8 | 3.6-5.5 | 0 | 0 | 58-80 | 0.4-5.1 | 0.3-3.8 | 3.6-5.5 | 0 | 0 | | | | | |SacC: | | | | | | Sassafras------------| 0-12 | 2.2-5.6 | 1.7-4.2 | 3.6-7.0 | 0 | 0 | 12-18 | 6.2-7.1 | 4.7-5.3 | 3.6-6.5 | 0 | 0 | 18-28 | 6.9-12 | 5.2-9.0 | 3.6-6.5 | 0 | 0 | 28-40 | 1.1-5.7 | 0.8-4.3 | 3.6-6.0 | 0 | 0 | 40-58 | 0.4-5.1 | 0.3-3.8 | 3.6-5.5 | 0 | 0 | 58-80 | 0.4-5.1 | 0.3-3.8 | 3.6-5.5 | 0 | 0 | | | | | |
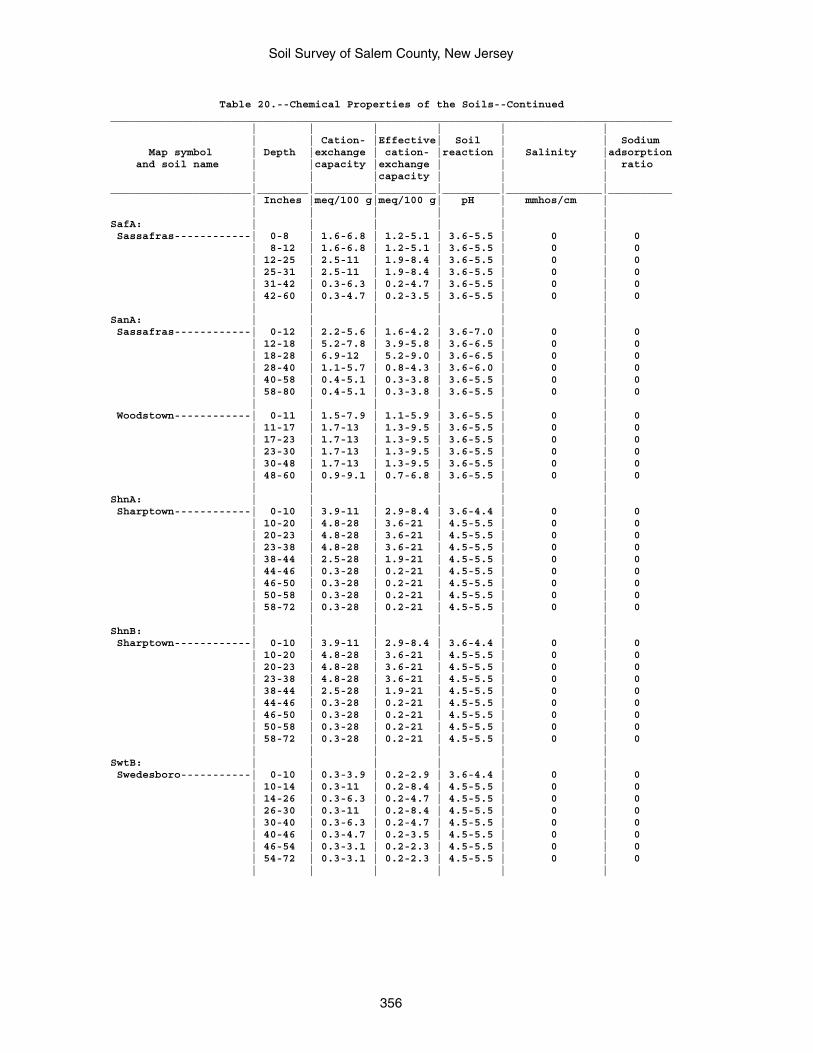
Soil Survey of Salem County, New Jersey
356
Table 20.--Chemical Properties of the Soils--Continued________________________________________________________________________________________ | | | | | | | | Cation- |Effective| Soil | | Sodium Map symbol | Depth |exchange | cation- |reaction | Salinity |adsorption and soil name | |capacity |exchange | | | ratio | | |capacity | | |______________________|________|_________|_________|_________|_______________|__________ | Inches |meq/100 g|meq/100 g| pH | mmhos/cm | | | | | | |SafA: | | | | | | Sassafras------------| 0-8 | 1.6-6.8 | 1.2-5.1 | 3.6-5.5 | 0 | 0 | 8-12 | 1.6-6.8 | 1.2-5.1 | 3.6-5.5 | 0 | 0 | 12-25 | 2.5-11 | 1.9-8.4 | 3.6-5.5 | 0 | 0 | 25-31 | 2.5-11 | 1.9-8.4 | 3.6-5.5 | 0 | 0 | 31-42 | 0.3-6.3 | 0.2-4.7 | 3.6-5.5 | 0 | 0 | 42-60 | 0.3-4.7 | 0.2-3.5 | 3.6-5.5 | 0 | 0 | | | | | |SanA: | | | | | | Sassafras------------| 0-12 | 2.2-5.6 | 1.6-4.2 | 3.6-7.0 | 0 | 0 | 12-18 | 5.2-7.8 | 3.9-5.8 | 3.6-6.5 | 0 | 0 | 18-28 | 6.9-12 | 5.2-9.0 | 3.6-6.5 | 0 | 0 | 28-40 | 1.1-5.7 | 0.8-4.3 | 3.6-6.0 | 0 | 0 | 40-58 | 0.4-5.1 | 0.3-3.8 | 3.6-5.5 | 0 | 0 | 58-80 | 0.4-5.1 | 0.3-3.8 | 3.6-5.5 | 0 | 0 | | | | | | Woodstown------------| 0-11 | 1.5-7.9 | 1.1-5.9 | 3.6-5.5 | 0 | 0 | 11-17 | 1.7-13 | 1.3-9.5 | 3.6-5.5 | 0 | 0 | 17-23 | 1.7-13 | 1.3-9.5 | 3.6-5.5 | 0 | 0 | 23-30 | 1.7-13 | 1.3-9.5 | 3.6-5.5 | 0 | 0 | 30-48 | 1.7-13 | 1.3-9.5 | 3.6-5.5 | 0 | 0 | 48-60 | 0.9-9.1 | 0.7-6.8 | 3.6-5.5 | 0 | 0 | | | | | |ShnA: | | | | | | Sharptown------------| 0-10 | 3.9-11 | 2.9-8.4 | 3.6-4.4 | 0 | 0 | 10-20 | 4.8-28 | 3.6-21 | 4.5-5.5 | 0 | 0 | 20-23 | 4.8-28 | 3.6-21 | 4.5-5.5 | 0 | 0 | 23-38 | 4.8-28 | 3.6-21 | 4.5-5.5 | 0 | 0 | 38-44 | 2.5-28 | 1.9-21 | 4.5-5.5 | 0 | 0 | 44-46 | 0.3-28 | 0.2-21 | 4.5-5.5 | 0 | 0 | 46-50 | 0.3-28 | 0.2-21 | 4.5-5.5 | 0 | 0 | 50-58 | 0.3-28 | 0.2-21 | 4.5-5.5 | 0 | 0 | 58-72 | 0.3-28 | 0.2-21 | 4.5-5.5 | 0 | 0 | | | | | |ShnB: | | | | | | Sharptown------------| 0-10 | 3.9-11 | 2.9-8.4 | 3.6-4.4 | 0 | 0 | 10-20 | 4.8-28 | 3.6-21 | 4.5-5.5 | 0 | 0 | 20-23 | 4.8-28 | 3.6-21 | 4.5-5.5 | 0 | 0 | 23-38 | 4.8-28 | 3.6-21 | 4.5-5.5 | 0 | 0 | 38-44 | 2.5-28 | 1.9-21 | 4.5-5.5 | 0 | 0 | 44-46 | 0.3-28 | 0.2-21 | 4.5-5.5 | 0 | 0 | 46-50 | 0.3-28 | 0.2-21 | 4.5-5.5 | 0 | 0 | 50-58 | 0.3-28 | 0.2-21 | 4.5-5.5 | 0 | 0 | 58-72 | 0.3-28 | 0.2-21 | 4.5-5.5 | 0 | 0 | | | | | |SwtB: | | | | | | Swedesboro-----------| 0-10 | 0.3-3.9 | 0.2-2.9 | 3.6-4.4 | 0 | 0 | 10-14 | 0.3-11 | 0.2-8.4 | 4.5-5.5 | 0 | 0 | 14-26 | 0.3-6.3 | 0.2-4.7 | 4.5-5.5 | 0 | 0 | 26-30 | 0.3-11 | 0.2-8.4 | 4.5-5.5 | 0 | 0 | 30-40 | 0.3-6.3 | 0.2-4.7 | 4.5-5.5 | 0 | 0 | 40-46 | 0.3-4.7 | 0.2-3.5 | 4.5-5.5 | 0 | 0 | 46-54 | 0.3-3.1 | 0.2-2.3 | 4.5-5.5 | 0 | 0 | 54-72 | 0.3-3.1 | 0.2-2.3 | 4.5-5.5 | 0 | 0 | | | | | |
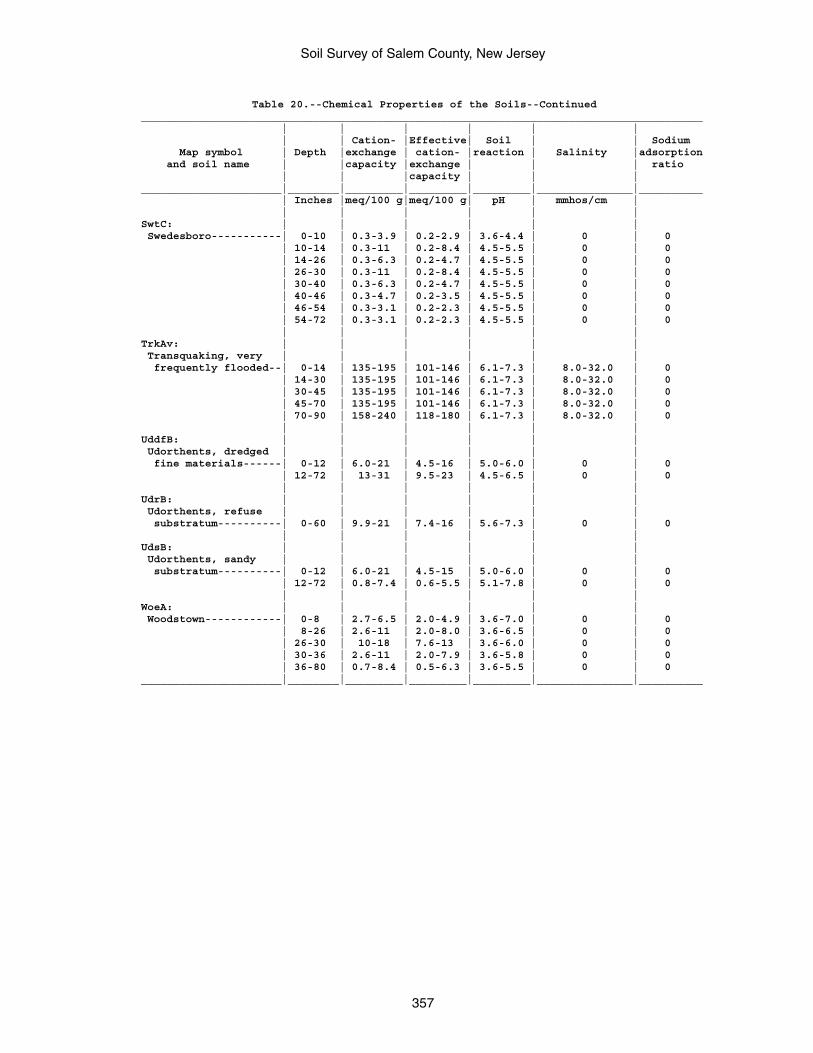
Soil Survey of Salem County, New Jersey
357
Table 20.--Chemical Properties of the Soils--Continued________________________________________________________________________________________ | | | | | | | | Cation- |Effective| Soil | | Sodium Map symbol | Depth |exchange | cation- |reaction | Salinity |adsorption and soil name | |capacity |exchange | | | ratio | | |capacity | | |______________________|________|_________|_________|_________|_______________|__________ | Inches |meq/100 g|meq/100 g| pH | mmhos/cm | | | | | | |SwtC: | | | | | | Swedesboro-----------| 0-10 | 0.3-3.9 | 0.2-2.9 | 3.6-4.4 | 0 | 0 | 10-14 | 0.3-11 | 0.2-8.4 | 4.5-5.5 | 0 | 0 | 14-26 | 0.3-6.3 | 0.2-4.7 | 4.5-5.5 | 0 | 0 | 26-30 | 0.3-11 | 0.2-8.4 | 4.5-5.5 | 0 | 0 | 30-40 | 0.3-6.3 | 0.2-4.7 | 4.5-5.5 | 0 | 0 | 40-46 | 0.3-4.7 | 0.2-3.5 | 4.5-5.5 | 0 | 0 | 46-54 | 0.3-3.1 | 0.2-2.3 | 4.5-5.5 | 0 | 0 | 54-72 | 0.3-3.1 | 0.2-2.3 | 4.5-5.5 | 0 | 0 | | | | | |TrkAv: | | | | | | Transquaking, very | | | | | | frequently flooded--| 0-14 | 135-195 | 101-146 | 6.1-7.3 | 8.0-32.0 | 0 | 14-30 | 135-195 | 101-146 | 6.1-7.3 | 8.0-32.0 | 0 | 30-45 | 135-195 | 101-146 | 6.1-7.3 | 8.0-32.0 | 0 | 45-70 | 135-195 | 101-146 | 6.1-7.3 | 8.0-32.0 | 0 | 70-90 | 158-240 | 118-180 | 6.1-7.3 | 8.0-32.0 | 0 | | | | | |UddfB: | | | | | | Udorthents, dredged | | | | | | fine materials------| 0-12 | 6.0-21 | 4.5-16 | 5.0-6.0 | 0 | 0 | 12-72 | 13-31 | 9.5-23 | 4.5-6.5 | 0 | 0 | | | | | |UdrB: | | | | | | Udorthents, refuse | | | | | | substratum----------| 0-60 | 9.9-21 | 7.4-16 | 5.6-7.3 | 0 | 0 | | | | | |UdsB: | | | | | | Udorthents, sandy | | | | | | substratum----------| 0-12 | 6.0-21 | 4.5-15 | 5.0-6.0 | 0 | 0 | 12-72 | 0.8-7.4 | 0.6-5.5 | 5.1-7.8 | 0 | 0 | | | | | |WoeA: | | | | | | Woodstown------------| 0-8 | 2.7-6.5 | 2.0-4.9 | 3.6-7.0 | 0 | 0 | 8-26 | 2.6-11 | 2.0-8.0 | 3.6-6.5 | 0 | 0 | 26-30 | 10-18 | 7.6-13 | 3.6-6.0 | 0 | 0 | 30-36 | 2.6-11 | 2.0-7.9 | 3.6-5.8 | 0 | 0 | 36-80 | 0.7-8.4 | 0.5-6.3 | 3.6-5.5 | 0 | 0______________________|________|_________|_________|_________|_______________|__________
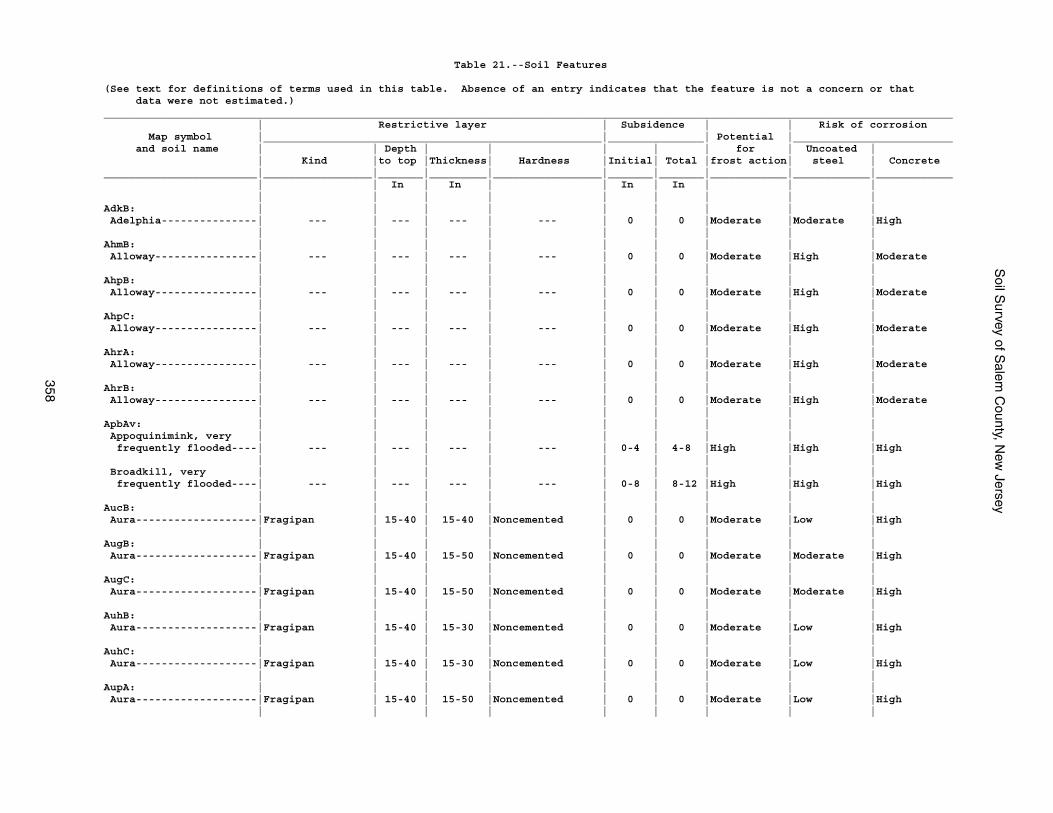
Soil S
urvey of Salem
County, N
ew Jersey
358
Table 21.--Soil Features
(See text for definitions of terms used in this table. Absence of an entry indicates that the feature is not a concern or that data were not estimated.)_____________________________________________________________________________________________________________________________________ | Restrictive layer | Subsidence | | Risk of corrosion Map symbol |_____________________________________________________|_______________| Potential |_________________________ and soil name | | Depth | | | | | for | Uncoated | | Kind |to top |Thickness| Hardness |Initial| Total |frost action| steel | Concrete________________________|_________________|_______|_________|_________________|_______|_______|____________|____________|____________ | | In | In | | In | In | | | | | | | | | | | |AdkB: | | | | | | | | | Adelphia---------------| --- | --- | --- | --- | 0 | 0 |Moderate |Moderate |High | | | | | | | | |AhmB: | | | | | | | | | Alloway----------------| --- | --- | --- | --- | 0 | 0 |Moderate |High |Moderate | | | | | | | | |AhpB: | | | | | | | | | Alloway----------------| --- | --- | --- | --- | 0 | 0 |Moderate |High |Moderate | | | | | | | | |AhpC: | | | | | | | | | Alloway----------------| --- | --- | --- | --- | 0 | 0 |Moderate |High |Moderate | | | | | | | | |AhrA: | | | | | | | | | Alloway----------------| --- | --- | --- | --- | 0 | 0 |Moderate |High |Moderate | | | | | | | | |AhrB: | | | | | | | | | Alloway----------------| --- | --- | --- | --- | 0 | 0 |Moderate |High |Moderate | | | | | | | | |ApbAv: | | | | | | | | | Appoquinimink, very | | | | | | | | | frequently flooded----| --- | --- | --- | --- | 0-4 | 4-8 |High |High |High | | | | | | | | | Broadkill, very | | | | | | | | | frequently flooded----| --- | --- | --- | --- | 0-8 | 8-12 |High |High |High | | | | | | | | |AucB: | | | | | | | | | Aura-------------------|Fragipan | 15-40 | 15-40 |Noncemented | 0 | 0 |Moderate |Low |High | | | | | | | | |AugB: | | | | | | | | | Aura-------------------|Fragipan | 15-40 | 15-50 |Noncemented | 0 | 0 |Moderate |Moderate |High | | | | | | | | |AugC: | | | | | | | | | Aura-------------------|Fragipan | 15-40 | 15-50 |Noncemented | 0 | 0 |Moderate |Moderate |High | | | | | | | | |AuhB: | | | | | | | | | Aura-------------------|Fragipan | 15-40 | 15-30 |Noncemented | 0 | 0 |Moderate |Low |High | | | | | | | | |AuhC: | | | | | | | | | Aura-------------------|Fragipan | 15-40 | 15-30 |Noncemented | 0 | 0 |Moderate |Low |High | | | | | | | | |AupA: | | | | | | | | | Aura-------------------|Fragipan | 15-40 | 15-50 |Noncemented | 0 | 0 |Moderate |Low |High | | | | | | | | |
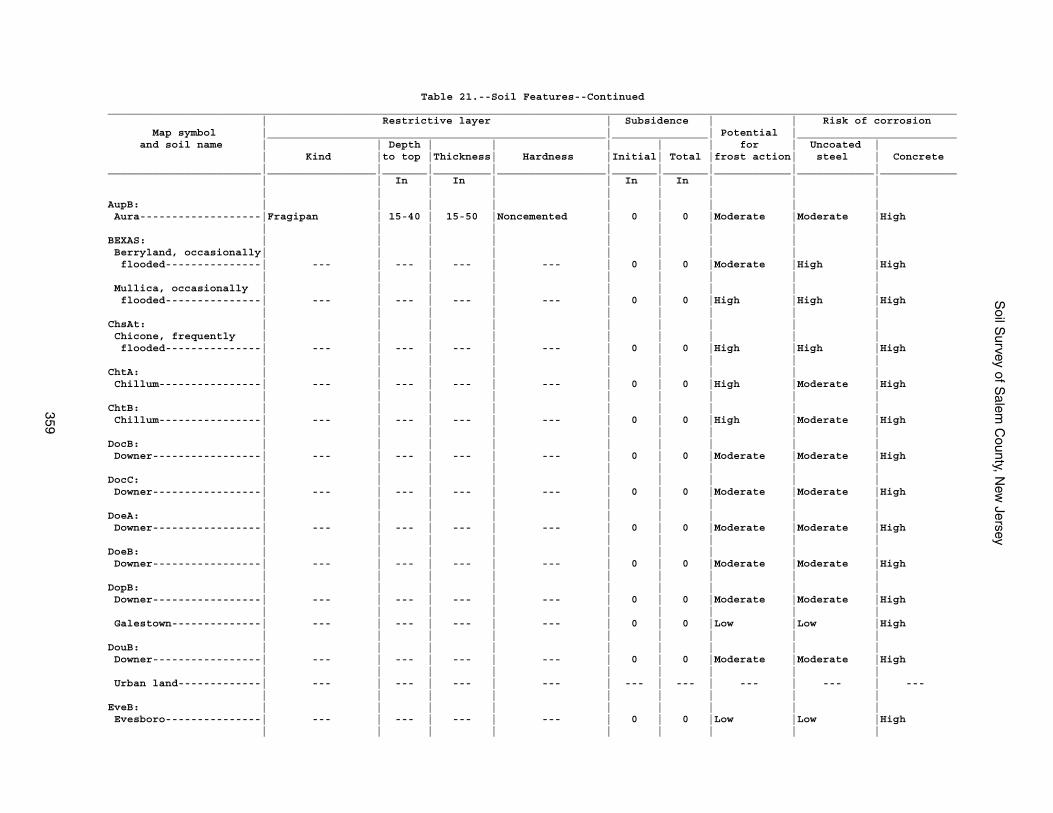
Soil S
urvey of Salem
County, N
ew Jersey
359
Table 21.--Soil Features--Continued_____________________________________________________________________________________________________________________________________ | Restrictive layer | Subsidence | | Risk of corrosion Map symbol |_____________________________________________________|_______________| Potential |_________________________ and soil name | | Depth | | | | | for | Uncoated | | Kind |to top |Thickness| Hardness |Initial| Total |frost action| steel | Concrete________________________|_________________|_______|_________|_________________|_______|_______|____________|____________|____________ | | In | In | | In | In | | | | | | | | | | | |AupB: | | | | | | | | | Aura-------------------|Fragipan | 15-40 | 15-50 |Noncemented | 0 | 0 |Moderate |Moderate |High | | | | | | | | |BEXAS: | | | | | | | | | Berryland, occasionally| | | | | | | | | flooded---------------| --- | --- | --- | --- | 0 | 0 |Moderate |High |High | | | | | | | | | Mullica, occasionally | | | | | | | | | flooded---------------| --- | --- | --- | --- | 0 | 0 |High |High |High | | | | | | | | |ChsAt: | | | | | | | | | Chicone, frequently | | | | | | | | | flooded---------------| --- | --- | --- | --- | 0 | 0 |High |High |High | | | | | | | | |ChtA: | | | | | | | | | Chillum----------------| --- | --- | --- | --- | 0 | 0 |High |Moderate |High | | | | | | | | |ChtB: | | | | | | | | | Chillum----------------| --- | --- | --- | --- | 0 | 0 |High |Moderate |High | | | | | | | | |DocB: | | | | | | | | | Downer-----------------| --- | --- | --- | --- | 0 | 0 |Moderate |Moderate |High | | | | | | | | |DocC: | | | | | | | | | Downer-----------------| --- | --- | --- | --- | 0 | 0 |Moderate |Moderate |High | | | | | | | | |DoeA: | | | | | | | | | Downer-----------------| --- | --- | --- | --- | 0 | 0 |Moderate |Moderate |High | | | | | | | | |DoeB: | | | | | | | | | Downer-----------------| --- | --- | --- | --- | 0 | 0 |Moderate |Moderate |High | | | | | | | | |DopB: | | | | | | | | | Downer-----------------| --- | --- | --- | --- | 0 | 0 |Moderate |Moderate |High | | | | | | | | | Galestown--------------| --- | --- | --- | --- | 0 | 0 |Low |Low |High | | | | | | | | |DouB: | | | | | | | | | Downer-----------------| --- | --- | --- | --- | 0 | 0 |Moderate |Moderate |High | | | | | | | | | Urban land-------------| --- | --- | --- | --- | --- | --- | --- | --- | --- | | | | | | | | |EveB: | | | | | | | | | Evesboro---------------| --- | --- | --- | --- | 0 | 0 |Low |Low |High | | | | | | | | |
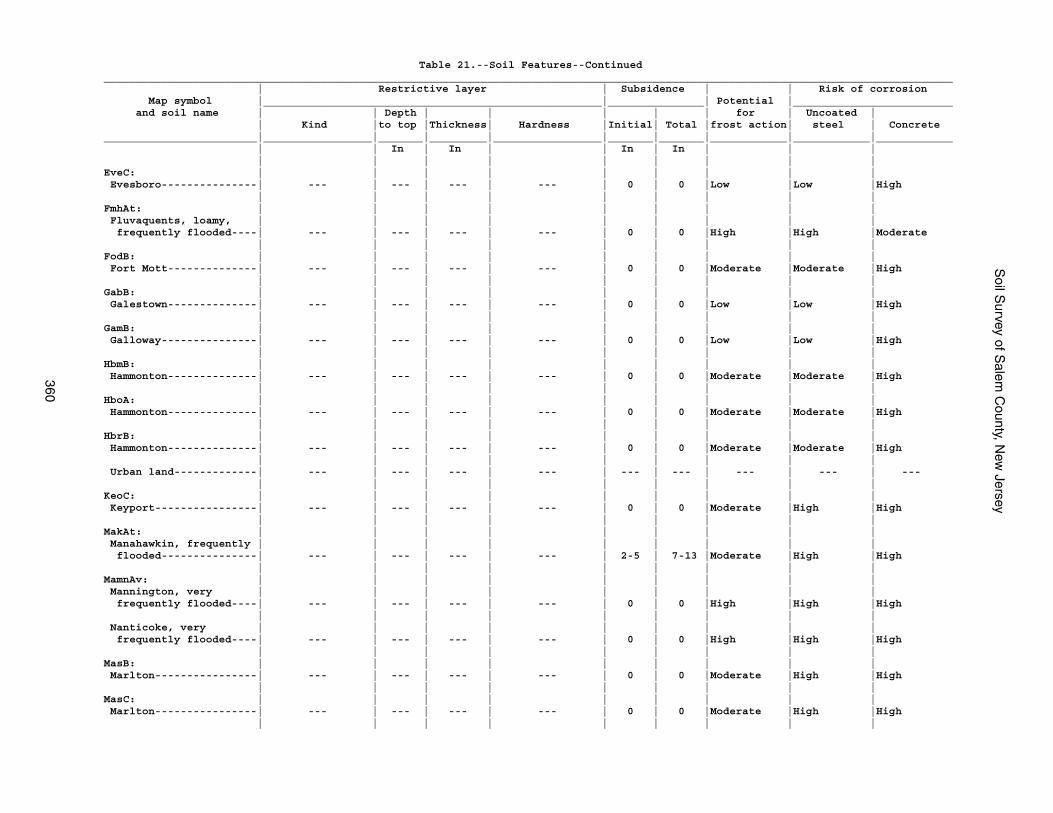
Soil S
urvey of Salem
County, N
ew Jersey
360
Table 21.--Soil Features--Continued_____________________________________________________________________________________________________________________________________ | Restrictive layer | Subsidence | | Risk of corrosion Map symbol |_____________________________________________________|_______________| Potential |_________________________ and soil name | | Depth | | | | | for | Uncoated | | Kind |to top |Thickness| Hardness |Initial| Total |frost action| steel | Concrete________________________|_________________|_______|_________|_________________|_______|_______|____________|____________|____________ | | In | In | | In | In | | | | | | | | | | | |EveC: | | | | | | | | | Evesboro---------------| --- | --- | --- | --- | 0 | 0 |Low |Low |High | | | | | | | | |FmhAt: | | | | | | | | | Fluvaquents, loamy, | | | | | | | | | frequently flooded----| --- | --- | --- | --- | 0 | 0 |High |High |Moderate | | | | | | | | |FodB: | | | | | | | | | Fort Mott--------------| --- | --- | --- | --- | 0 | 0 |Moderate |Moderate |High | | | | | | | | |GabB: | | | | | | | | | Galestown--------------| --- | --- | --- | --- | 0 | 0 |Low |Low |High | | | | | | | | |GamB: | | | | | | | | | Galloway---------------| --- | --- | --- | --- | 0 | 0 |Low |Low |High | | | | | | | | |HbmB: | | | | | | | | | Hammonton--------------| --- | --- | --- | --- | 0 | 0 |Moderate |Moderate |High | | | | | | | | |HboA: | | | | | | | | | Hammonton--------------| --- | --- | --- | --- | 0 | 0 |Moderate |Moderate |High | | | | | | | | |HbrB: | | | | | | | | | Hammonton--------------| --- | --- | --- | --- | 0 | 0 |Moderate |Moderate |High | | | | | | | | | Urban land-------------| --- | --- | --- | --- | --- | --- | --- | --- | --- | | | | | | | | |KeoC: | | | | | | | | | Keyport----------------| --- | --- | --- | --- | 0 | 0 |Moderate |High |High | | | | | | | | |MakAt: | | | | | | | | | Manahawkin, frequently | | | | | | | | | flooded---------------| --- | --- | --- | --- | 2-5 | 7-13 |Moderate |High |High | | | | | | | | |MamnAv: | | | | | | | | | Mannington, very | | | | | | | | | frequently flooded----| --- | --- | --- | --- | 0 | 0 |High |High |High | | | | | | | | | Nanticoke, very | | | | | | | | | frequently flooded----| --- | --- | --- | --- | 0 | 0 |High |High |High | | | | | | | | |MasB: | | | | | | | | | Marlton----------------| --- | --- | --- | --- | 0 | 0 |Moderate |High |High | | | | | | | | |MasC: | | | | | | | | | Marlton----------------| --- | --- | --- | --- | 0 | 0 |Moderate |High |High | | | | | | | | |
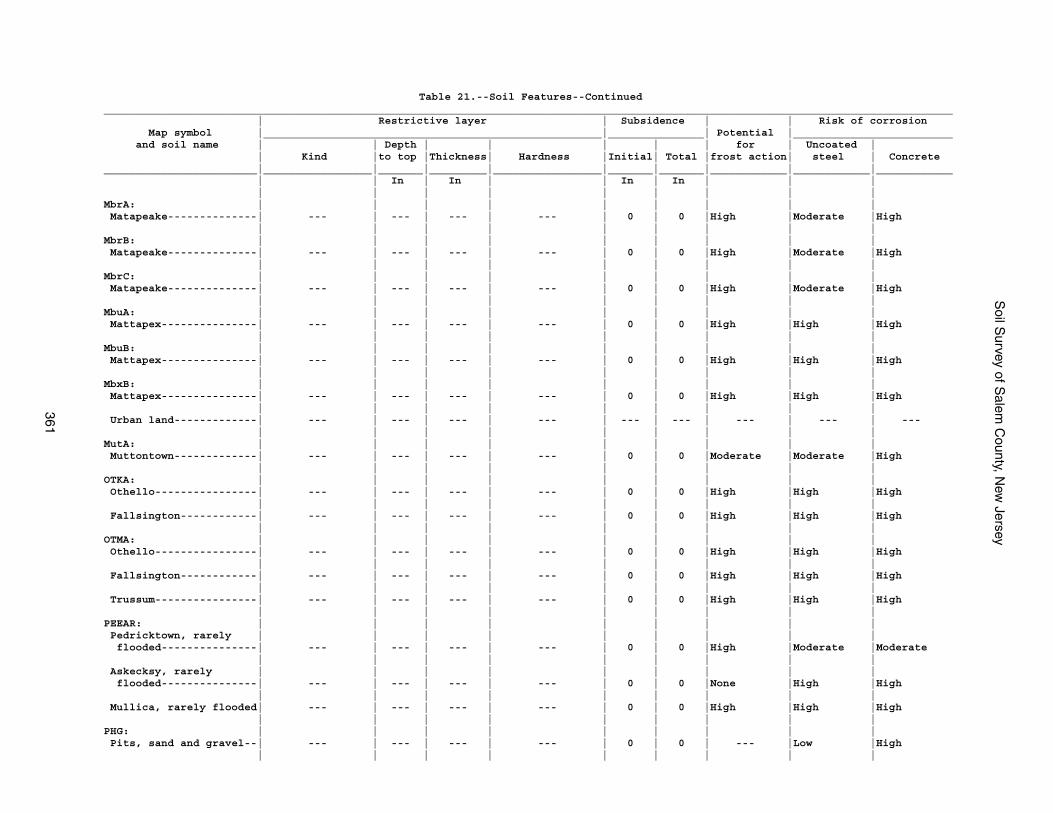
Soil S
urvey of Salem
County, N
ew Jersey
361
Table 21.--Soil Features--Continued_____________________________________________________________________________________________________________________________________ | Restrictive layer | Subsidence | | Risk of corrosion Map symbol |_____________________________________________________|_______________| Potential |_________________________ and soil name | | Depth | | | | | for | Uncoated | | Kind |to top |Thickness| Hardness |Initial| Total |frost action| steel | Concrete________________________|_________________|_______|_________|_________________|_______|_______|____________|____________|____________ | | In | In | | In | In | | | | | | | | | | | |MbrA: | | | | | | | | | Matapeake--------------| --- | --- | --- | --- | 0 | 0 |High |Moderate |High | | | | | | | | |MbrB: | | | | | | | | | Matapeake--------------| --- | --- | --- | --- | 0 | 0 |High |Moderate |High | | | | | | | | |MbrC: | | | | | | | | | Matapeake--------------| --- | --- | --- | --- | 0 | 0 |High |Moderate |High | | | | | | | | |MbuA: | | | | | | | | | Mattapex---------------| --- | --- | --- | --- | 0 | 0 |High |High |High | | | | | | | | |MbuB: | | | | | | | | | Mattapex---------------| --- | --- | --- | --- | 0 | 0 |High |High |High | | | | | | | | |MbxB: | | | | | | | | | Mattapex---------------| --- | --- | --- | --- | 0 | 0 |High |High |High | | | | | | | | | Urban land-------------| --- | --- | --- | --- | --- | --- | --- | --- | --- | | | | | | | | |MutA: | | | | | | | | | Muttontown-------------| --- | --- | --- | --- | 0 | 0 |Moderate |Moderate |High | | | | | | | | |OTKA: | | | | | | | | | Othello----------------| --- | --- | --- | --- | 0 | 0 |High |High |High | | | | | | | | | Fallsington------------| --- | --- | --- | --- | 0 | 0 |High |High |High | | | | | | | | |OTMA: | | | | | | | | | Othello----------------| --- | --- | --- | --- | 0 | 0 |High |High |High | | | | | | | | | Fallsington------------| --- | --- | --- | --- | 0 | 0 |High |High |High | | | | | | | | | Trussum----------------| --- | --- | --- | --- | 0 | 0 |High |High |High | | | | | | | | |PEEAR: | | | | | | | | | Pedricktown, rarely | | | | | | | | | flooded---------------| --- | --- | --- | --- | 0 | 0 |High |Moderate |Moderate | | | | | | | | | Askecksy, rarely | | | | | | | | | flooded---------------| --- | --- | --- | --- | 0 | 0 |None |High |High | | | | | | | | | Mullica, rarely flooded| --- | --- | --- | --- | 0 | 0 |High |High |High | | | | | | | | |PHG: | | | | | | | | | Pits, sand and gravel--| --- | --- | --- | --- | 0 | 0 | --- |Low |High | | | | | | | | |
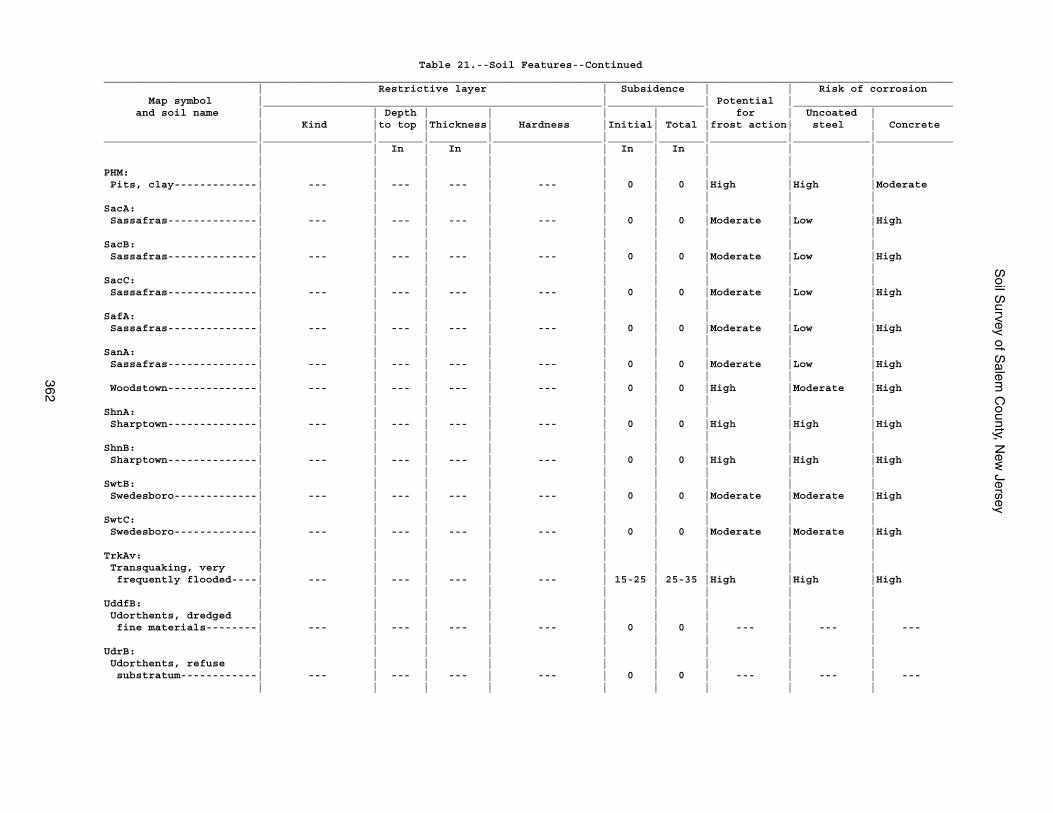
Soil S
urvey of Salem
County, N
ew Jersey
362
Table 21.--Soil Features--Continued_____________________________________________________________________________________________________________________________________ | Restrictive layer | Subsidence | | Risk of corrosion Map symbol |_____________________________________________________|_______________| Potential |_________________________ and soil name | | Depth | | | | | for | Uncoated | | Kind |to top |Thickness| Hardness |Initial| Total |frost action| steel | Concrete________________________|_________________|_______|_________|_________________|_______|_______|____________|____________|____________ | | In | In | | In | In | | | | | | | | | | | |PHM: | | | | | | | | | Pits, clay-------------| --- | --- | --- | --- | 0 | 0 |High |High |Moderate | | | | | | | | |SacA: | | | | | | | | | Sassafras--------------| --- | --- | --- | --- | 0 | 0 |Moderate |Low |High | | | | | | | | |SacB: | | | | | | | | | Sassafras--------------| --- | --- | --- | --- | 0 | 0 |Moderate |Low |High | | | | | | | | |SacC: | | | | | | | | | Sassafras--------------| --- | --- | --- | --- | 0 | 0 |Moderate |Low |High | | | | | | | | |SafA: | | | | | | | | | Sassafras--------------| --- | --- | --- | --- | 0 | 0 |Moderate |Low |High | | | | | | | | |SanA: | | | | | | | | | Sassafras--------------| --- | --- | --- | --- | 0 | 0 |Moderate |Low |High | | | | | | | | | Woodstown--------------| --- | --- | --- | --- | 0 | 0 |High |Moderate |High | | | | | | | | |ShnA: | | | | | | | | | Sharptown--------------| --- | --- | --- | --- | 0 | 0 |High |High |High | | | | | | | | |ShnB: | | | | | | | | | Sharptown--------------| --- | --- | --- | --- | 0 | 0 |High |High |High | | | | | | | | |SwtB: | | | | | | | | | Swedesboro-------------| --- | --- | --- | --- | 0 | 0 |Moderate |Moderate |High | | | | | | | | |SwtC: | | | | | | | | | Swedesboro-------------| --- | --- | --- | --- | 0 | 0 |Moderate |Moderate |High | | | | | | | | |TrkAv: | | | | | | | | | Transquaking, very | | | | | | | | | frequently flooded----| --- | --- | --- | --- | 15-25 | 25-35 |High |High |High | | | | | | | | |UddfB: | | | | | | | | | Udorthents, dredged | | | | | | | | | fine materials--------| --- | --- | --- | --- | 0 | 0 | --- | --- | --- | | | | | | | | |UdrB: | | | | | | | | | Udorthents, refuse | | | | | | | | | substratum------------| --- | --- | --- | --- | 0 | 0 | --- | --- | --- | | | | | | | | |
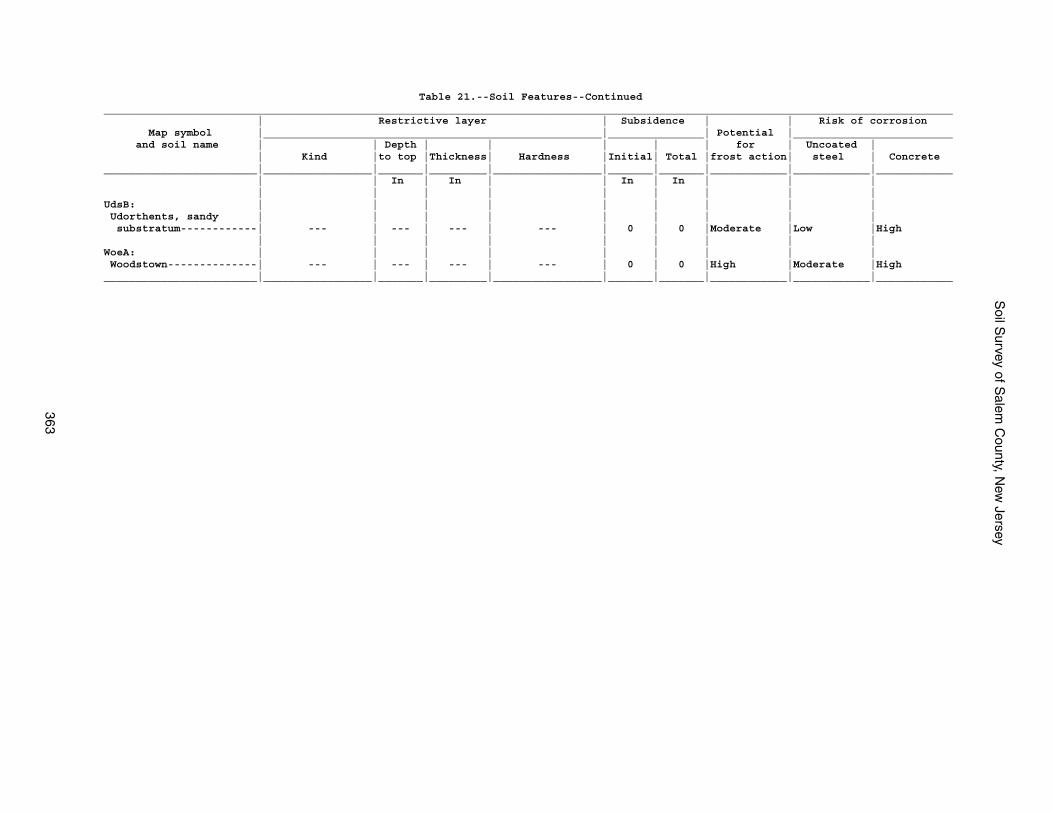
Soil S
urvey of Salem
County, N
ew Jersey
363
Table 21.--Soil Features--Continued_____________________________________________________________________________________________________________________________________ | Restrictive layer | Subsidence | | Risk of corrosion Map symbol |_____________________________________________________|_______________| Potential |_________________________ and soil name | | Depth | | | | | for | Uncoated | | Kind |to top |Thickness| Hardness |Initial| Total |frost action| steel | Concrete________________________|_________________|_______|_________|_________________|_______|_______|____________|____________|____________ | | In | In | | In | In | | | | | | | | | | | |UdsB: | | | | | | | | | Udorthents, sandy | | | | | | | | | substratum------------| --- | --- | --- | --- | 0 | 0 |Moderate |Low |High | | | | | | | | |WoeA: | | | | | | | | | Woodstown--------------| --- | --- | --- | --- | 0 | 0 |High |Moderate |High________________________|_________________|_______|_________|_________________|_______|_______|____________|____________|____________
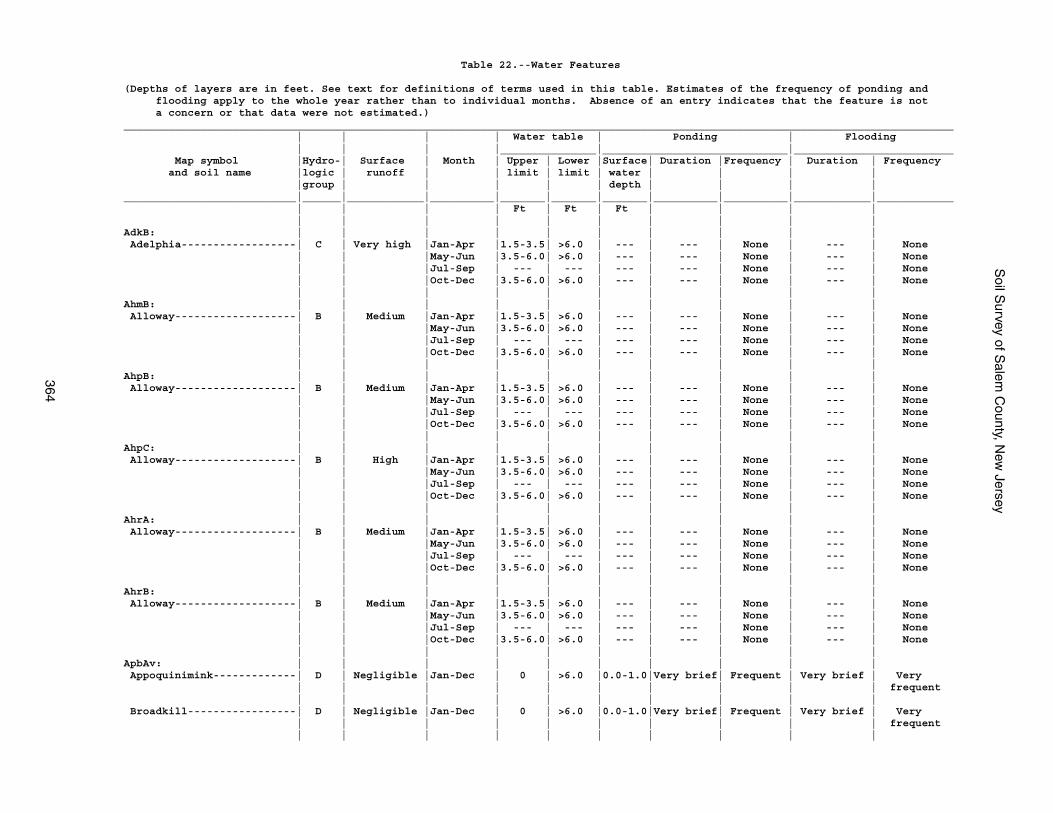
Soil S
urvey of Salem
County, N
ew Jersey
364
Table 22.--Water Features
(Depths of layers are in feet. See text for definitions of terms used in this table. Estimates of the frequency of ponding and flooding apply to the whole year rather than to individual months. Absence of an entry indicates that the feature is not a concern or that data were not estimated.)__________________________________________________________________________________________________________________________________ | | | | Water table | Ponding | Flooding | | | |_______________|_____________________________|_________________________ Map symbol |Hydro-| Surface | Month | Upper | Lower |Surface| Duration |Frequency | Duration | Frequency and soil name |logic | runoff | | limit | limit | water | | | | |group | | | | | depth | | | |___________________________|______|____________|__________|_______|_______|_______|__________|__________|____________|____________ | | | | Ft | Ft | Ft | | | | | | | | | | | | | |AdkB: | | | | | | | | | | Adelphia------------------| C | Very high |Jan-Apr |1.5-3.5| >6.0 | --- | --- | None | --- | None | | |May-Jun |3.5-6.0| >6.0 | --- | --- | None | --- | None | | |Jul-Sep | --- | --- | --- | --- | None | --- | None | | |Oct-Dec |3.5-6.0| >6.0 | --- | --- | None | --- | None | | | | | | | | | |AhmB: | | | | | | | | | | Alloway-------------------| B | Medium |Jan-Apr |1.5-3.5| >6.0 | --- | --- | None | --- | None | | |May-Jun |3.5-6.0| >6.0 | --- | --- | None | --- | None | | |Jul-Sep | --- | --- | --- | --- | None | --- | None | | |Oct-Dec |3.5-6.0| >6.0 | --- | --- | None | --- | None | | | | | | | | | |AhpB: | | | | | | | | | | Alloway-------------------| B | Medium |Jan-Apr |1.5-3.5| >6.0 | --- | --- | None | --- | None | | |May-Jun |3.5-6.0| >6.0 | --- | --- | None | --- | None | | |Jul-Sep | --- | --- | --- | --- | None | --- | None | | |Oct-Dec |3.5-6.0| >6.0 | --- | --- | None | --- | None | | | | | | | | | |AhpC: | | | | | | | | | | Alloway-------------------| B | High |Jan-Apr |1.5-3.5| >6.0 | --- | --- | None | --- | None | | |May-Jun |3.5-6.0| >6.0 | --- | --- | None | --- | None | | |Jul-Sep | --- | --- | --- | --- | None | --- | None | | |Oct-Dec |3.5-6.0| >6.0 | --- | --- | None | --- | None | | | | | | | | | |AhrA: | | | | | | | | | | Alloway-------------------| B | Medium |Jan-Apr |1.5-3.5| >6.0 | --- | --- | None | --- | None | | |May-Jun |3.5-6.0| >6.0 | --- | --- | None | --- | None | | |Jul-Sep | --- | --- | --- | --- | None | --- | None | | |Oct-Dec |3.5-6.0| >6.0 | --- | --- | None | --- | None | | | | | | | | | |AhrB: | | | | | | | | | | Alloway-------------------| B | Medium |Jan-Apr |1.5-3.5| >6.0 | --- | --- | None | --- | None | | |May-Jun |3.5-6.0| >6.0 | --- | --- | None | --- | None | | |Jul-Sep | --- | --- | --- | --- | None | --- | None | | |Oct-Dec |3.5-6.0| >6.0 | --- | --- | None | --- | None | | | | | | | | | |ApbAv: | | | | | | | | | | Appoquinimink-------------| D | Negligible |Jan-Dec | 0 | >6.0 |0.0-1.0|Very brief| Frequent | Very brief | Very | | | | | | | | | | frequent | | | | | | | | | | Broadkill-----------------| D | Negligible |Jan-Dec | 0 | >6.0 |0.0-1.0|Very brief| Frequent | Very brief | Very | | | | | | | | | | frequent | | | | | | | | | |
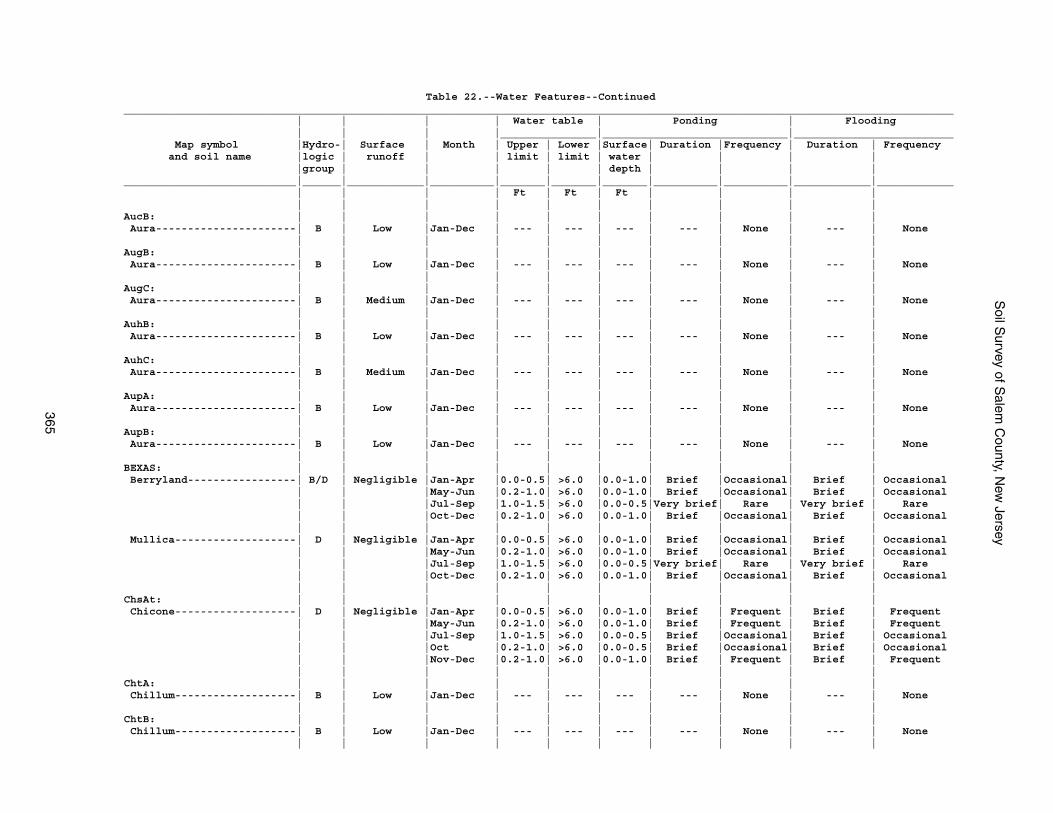
Soil S
urvey of Salem
County, N
ew Jersey
365
Table 22.--Water Features--Continued__________________________________________________________________________________________________________________________________ | | | | Water table | Ponding | Flooding | | | |_______________|_____________________________|_________________________ Map symbol |Hydro-| Surface | Month | Upper | Lower |Surface| Duration |Frequency | Duration | Frequency and soil name |logic | runoff | | limit | limit | water | | | | |group | | | | | depth | | | |___________________________|______|____________|__________|_______|_______|_______|__________|__________|____________|____________ | | | | Ft | Ft | Ft | | | | | | | | | | | | | |AucB: | | | | | | | | | | Aura----------------------| B | Low |Jan-Dec | --- | --- | --- | --- | None | --- | None | | | | | | | | | |AugB: | | | | | | | | | | Aura----------------------| B | Low |Jan-Dec | --- | --- | --- | --- | None | --- | None | | | | | | | | | |AugC: | | | | | | | | | | Aura----------------------| B | Medium |Jan-Dec | --- | --- | --- | --- | None | --- | None | | | | | | | | | |AuhB: | | | | | | | | | | Aura----------------------| B | Low |Jan-Dec | --- | --- | --- | --- | None | --- | None | | | | | | | | | |AuhC: | | | | | | | | | | Aura----------------------| B | Medium |Jan-Dec | --- | --- | --- | --- | None | --- | None | | | | | | | | | |AupA: | | | | | | | | | | Aura----------------------| B | Low |Jan-Dec | --- | --- | --- | --- | None | --- | None | | | | | | | | | |AupB: | | | | | | | | | | Aura----------------------| B | Low |Jan-Dec | --- | --- | --- | --- | None | --- | None | | | | | | | | | |BEXAS: | | | | | | | | | | Berryland-----------------| B/D | Negligible |Jan-Apr |0.0-0.5| >6.0 |0.0-1.0| Brief |Occasional| Brief | Occasional | | |May-Jun |0.2-1.0| >6.0 |0.0-1.0| Brief |Occasional| Brief | Occasional | | |Jul-Sep |1.0-1.5| >6.0 |0.0-0.5|Very brief| Rare | Very brief | Rare | | |Oct-Dec |0.2-1.0| >6.0 |0.0-1.0| Brief |Occasional| Brief | Occasional | | | | | | | | | | Mullica-------------------| D | Negligible |Jan-Apr |0.0-0.5| >6.0 |0.0-1.0| Brief |Occasional| Brief | Occasional | | |May-Jun |0.2-1.0| >6.0 |0.0-1.0| Brief |Occasional| Brief | Occasional | | |Jul-Sep |1.0-1.5| >6.0 |0.0-0.5|Very brief| Rare | Very brief | Rare | | |Oct-Dec |0.2-1.0| >6.0 |0.0-1.0| Brief |Occasional| Brief | Occasional | | | | | | | | | |ChsAt: | | | | | | | | | | Chicone-------------------| D | Negligible |Jan-Apr |0.0-0.5| >6.0 |0.0-1.0| Brief | Frequent | Brief | Frequent | | |May-Jun |0.2-1.0| >6.0 |0.0-1.0| Brief | Frequent | Brief | Frequent | | |Jul-Sep |1.0-1.5| >6.0 |0.0-0.5| Brief |Occasional| Brief | Occasional | | |Oct |0.2-1.0| >6.0 |0.0-0.5| Brief |Occasional| Brief | Occasional | | |Nov-Dec |0.2-1.0| >6.0 |0.0-1.0| Brief | Frequent | Brief | Frequent | | | | | | | | | |ChtA: | | | | | | | | | | Chillum-------------------| B | Low |Jan-Dec | --- | --- | --- | --- | None | --- | None | | | | | | | | | |ChtB: | | | | | | | | | | Chillum-------------------| B | Low |Jan-Dec | --- | --- | --- | --- | None | --- | None | | | | | | | | | |
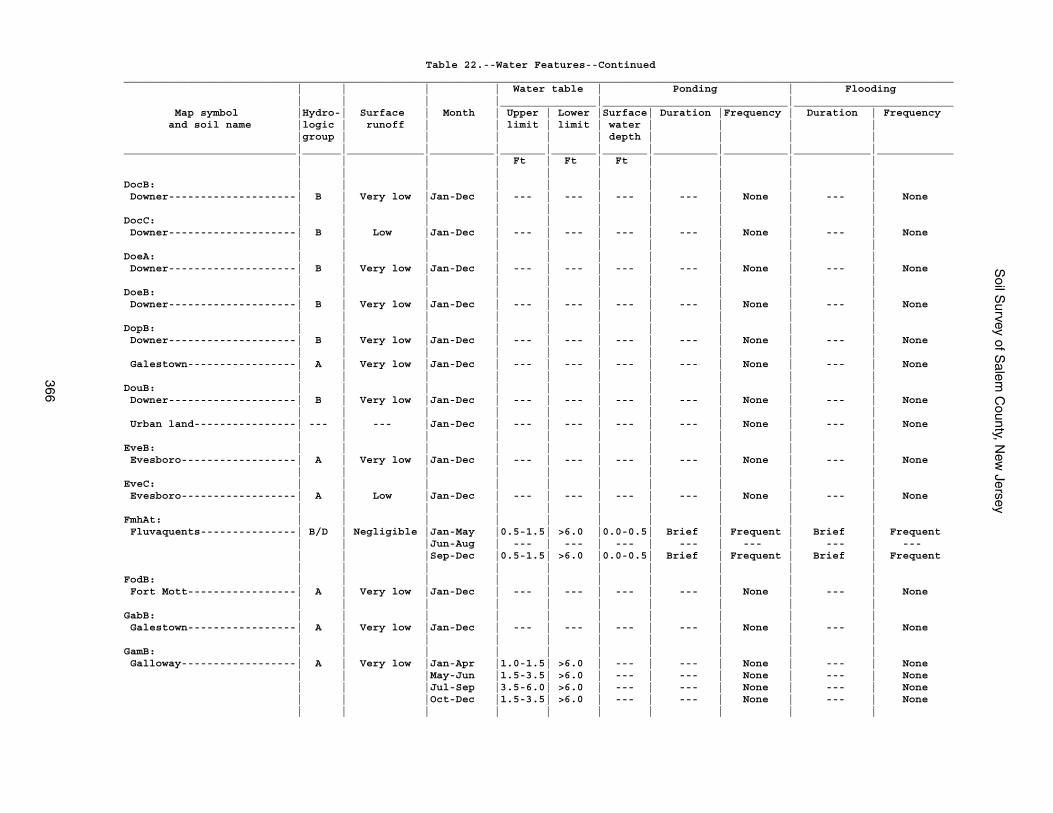
Soil S
urvey of Salem
County, N
ew Jersey
366
Table 22.--Water Features--Continued__________________________________________________________________________________________________________________________________ | | | | Water table | Ponding | Flooding | | | |_______________|_____________________________|_________________________ Map symbol |Hydro-| Surface | Month | Upper | Lower |Surface| Duration |Frequency | Duration | Frequency and soil name |logic | runoff | | limit | limit | water | | | | |group | | | | | depth | | | |___________________________|______|____________|__________|_______|_______|_______|__________|__________|____________|____________ | | | | Ft | Ft | Ft | | | | | | | | | | | | | |DocB: | | | | | | | | | | Downer--------------------| B | Very low |Jan-Dec | --- | --- | --- | --- | None | --- | None | | | | | | | | | |DocC: | | | | | | | | | | Downer--------------------| B | Low |Jan-Dec | --- | --- | --- | --- | None | --- | None | | | | | | | | | |DoeA: | | | | | | | | | | Downer--------------------| B | Very low |Jan-Dec | --- | --- | --- | --- | None | --- | None | | | | | | | | | |DoeB: | | | | | | | | | | Downer--------------------| B | Very low |Jan-Dec | --- | --- | --- | --- | None | --- | None | | | | | | | | | |DopB: | | | | | | | | | | Downer--------------------| B | Very low |Jan-Dec | --- | --- | --- | --- | None | --- | None | | | | | | | | | | Galestown-----------------| A | Very low |Jan-Dec | --- | --- | --- | --- | None | --- | None | | | | | | | | | |DouB: | | | | | | | | | | Downer--------------------| B | Very low |Jan-Dec | --- | --- | --- | --- | None | --- | None | | | | | | | | | | Urban land----------------| --- | --- |Jan-Dec | --- | --- | --- | --- | None | --- | None | | | | | | | | | |EveB: | | | | | | | | | | Evesboro------------------| A | Very low |Jan-Dec | --- | --- | --- | --- | None | --- | None | | | | | | | | | |EveC: | | | | | | | | | | Evesboro------------------| A | Low |Jan-Dec | --- | --- | --- | --- | None | --- | None | | | | | | | | | |FmhAt: | | | | | | | | | | Fluvaquents---------------| B/D | Negligible |Jan-May |0.5-1.5| >6.0 |0.0-0.5| Brief | Frequent | Brief | Frequent | | |Jun-Aug | --- | --- | --- | --- | --- | --- | --- | | |Sep-Dec |0.5-1.5| >6.0 |0.0-0.5| Brief | Frequent | Brief | Frequent | | | | | | | | | |FodB: | | | | | | | | | | Fort Mott-----------------| A | Very low |Jan-Dec | --- | --- | --- | --- | None | --- | None | | | | | | | | | |GabB: | | | | | | | | | | Galestown-----------------| A | Very low |Jan-Dec | --- | --- | --- | --- | None | --- | None | | | | | | | | | |GamB: | | | | | | | | | | Galloway------------------| A | Very low |Jan-Apr |1.0-1.5| >6.0 | --- | --- | None | --- | None | | |May-Jun |1.5-3.5| >6.0 | --- | --- | None | --- | None | | |Jul-Sep |3.5-6.0| >6.0 | --- | --- | None | --- | None | | |Oct-Dec |1.5-3.5| >6.0 | --- | --- | None | --- | None | | | | | | | | | |
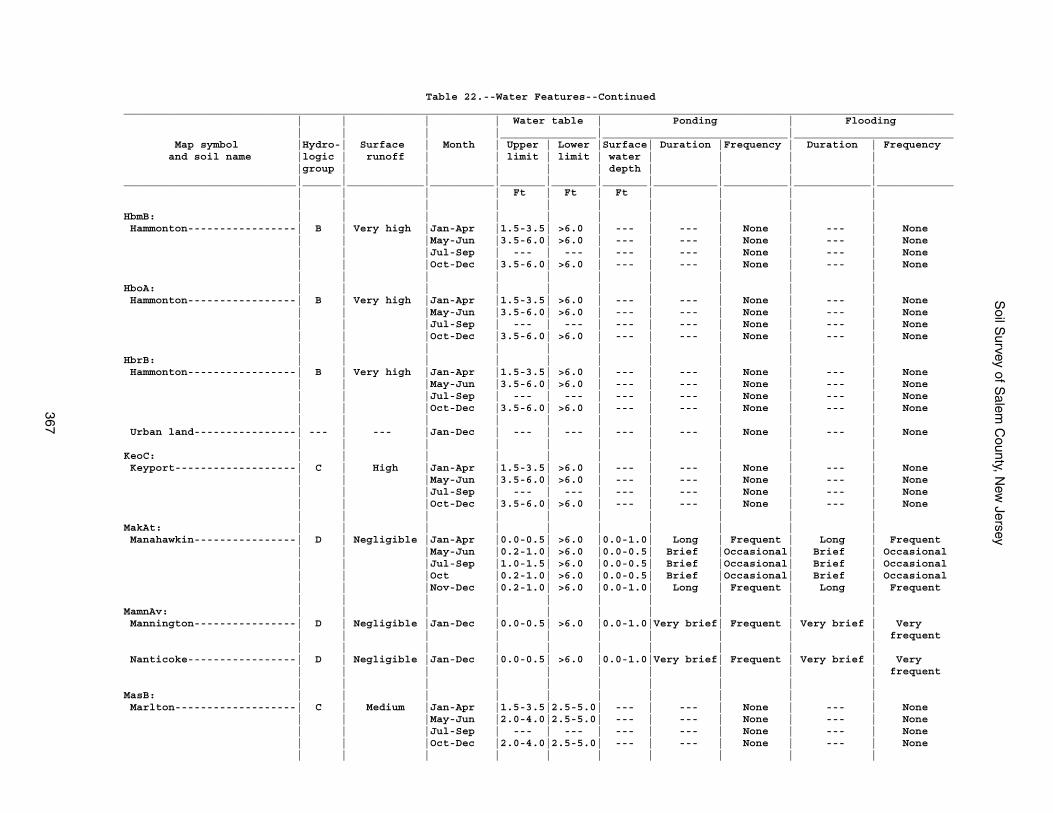
Soil S
urvey of Salem
County, N
ew Jersey
367
Table 22.--Water Features--Continued__________________________________________________________________________________________________________________________________ | | | | Water table | Ponding | Flooding | | | |_______________|_____________________________|_________________________ Map symbol |Hydro-| Surface | Month | Upper | Lower |Surface| Duration |Frequency | Duration | Frequency and soil name |logic | runoff | | limit | limit | water | | | | |group | | | | | depth | | | |___________________________|______|____________|__________|_______|_______|_______|__________|__________|____________|____________ | | | | Ft | Ft | Ft | | | | | | | | | | | | | |HbmB: | | | | | | | | | | Hammonton-----------------| B | Very high |Jan-Apr |1.5-3.5| >6.0 | --- | --- | None | --- | None | | |May-Jun |3.5-6.0| >6.0 | --- | --- | None | --- | None | | |Jul-Sep | --- | --- | --- | --- | None | --- | None | | |Oct-Dec |3.5-6.0| >6.0 | --- | --- | None | --- | None | | | | | | | | | |HboA: | | | | | | | | | | Hammonton-----------------| B | Very high |Jan-Apr |1.5-3.5| >6.0 | --- | --- | None | --- | None | | |May-Jun |3.5-6.0| >6.0 | --- | --- | None | --- | None | | |Jul-Sep | --- | --- | --- | --- | None | --- | None | | |Oct-Dec |3.5-6.0| >6.0 | --- | --- | None | --- | None | | | | | | | | | |HbrB: | | | | | | | | | | Hammonton-----------------| B | Very high |Jan-Apr |1.5-3.5| >6.0 | --- | --- | None | --- | None | | |May-Jun |3.5-6.0| >6.0 | --- | --- | None | --- | None | | |Jul-Sep | --- | --- | --- | --- | None | --- | None | | |Oct-Dec |3.5-6.0| >6.0 | --- | --- | None | --- | None | | | | | | | | | | Urban land----------------| --- | --- |Jan-Dec | --- | --- | --- | --- | None | --- | None | | | | | | | | | |KeoC: | | | | | | | | | | Keyport-------------------| C | High |Jan-Apr |1.5-3.5| >6.0 | --- | --- | None | --- | None | | |May-Jun |3.5-6.0| >6.0 | --- | --- | None | --- | None | | |Jul-Sep | --- | --- | --- | --- | None | --- | None | | |Oct-Dec |3.5-6.0| >6.0 | --- | --- | None | --- | None | | | | | | | | | |MakAt: | | | | | | | | | | Manahawkin----------------| D | Negligible |Jan-Apr |0.0-0.5| >6.0 |0.0-1.0| Long | Frequent | Long | Frequent | | |May-Jun |0.2-1.0| >6.0 |0.0-0.5| Brief |Occasional| Brief | Occasional | | |Jul-Sep |1.0-1.5| >6.0 |0.0-0.5| Brief |Occasional| Brief | Occasional | | |Oct |0.2-1.0| >6.0 |0.0-0.5| Brief |Occasional| Brief | Occasional | | |Nov-Dec |0.2-1.0| >6.0 |0.0-1.0| Long | Frequent | Long | Frequent | | | | | | | | | |MamnAv: | | | | | | | | | | Mannington----------------| D | Negligible |Jan-Dec |0.0-0.5| >6.0 |0.0-1.0|Very brief| Frequent | Very brief | Very | | | | | | | | | | frequent | | | | | | | | | | Nanticoke-----------------| D | Negligible |Jan-Dec |0.0-0.5| >6.0 |0.0-1.0|Very brief| Frequent | Very brief | Very | | | | | | | | | | frequent | | | | | | | | | |MasB: | | | | | | | | | | Marlton-------------------| C | Medium |Jan-Apr |1.5-3.5|2.5-5.0| --- | --- | None | --- | None | | |May-Jun |2.0-4.0|2.5-5.0| --- | --- | None | --- | None | | |Jul-Sep | --- | --- | --- | --- | None | --- | None | | |Oct-Dec |2.0-4.0|2.5-5.0| --- | --- | None | --- | None | | | | | | | | | |
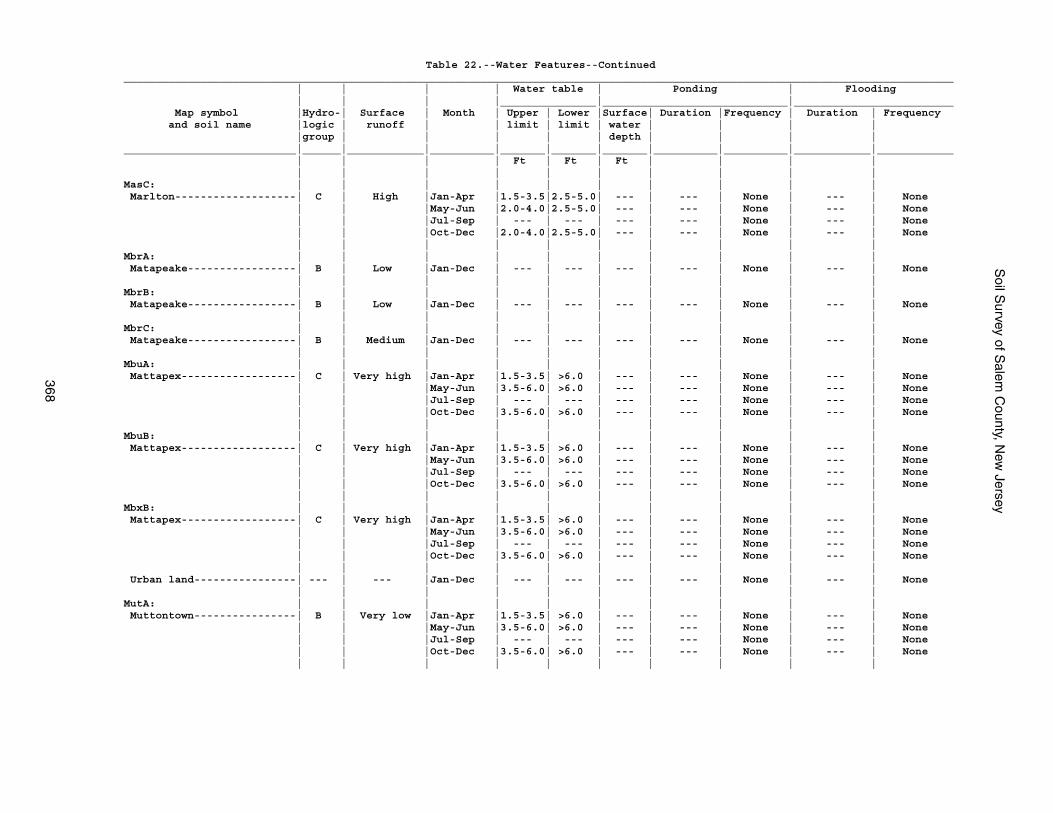
Soil S
urvey of Salem
County, N
ew Jersey
368
Table 22.--Water Features--Continued__________________________________________________________________________________________________________________________________ | | | | Water table | Ponding | Flooding | | | |_______________|_____________________________|_________________________ Map symbol |Hydro-| Surface | Month | Upper | Lower |Surface| Duration |Frequency | Duration | Frequency and soil name |logic | runoff | | limit | limit | water | | | | |group | | | | | depth | | | |___________________________|______|____________|__________|_______|_______|_______|__________|__________|____________|____________ | | | | Ft | Ft | Ft | | | | | | | | | | | | | |MasC: | | | | | | | | | | Marlton-------------------| C | High |Jan-Apr |1.5-3.5|2.5-5.0| --- | --- | None | --- | None | | |May-Jun |2.0-4.0|2.5-5.0| --- | --- | None | --- | None | | |Jul-Sep | --- | --- | --- | --- | None | --- | None | | |Oct-Dec |2.0-4.0|2.5-5.0| --- | --- | None | --- | None | | | | | | | | | |MbrA: | | | | | | | | | | Matapeake-----------------| B | Low |Jan-Dec | --- | --- | --- | --- | None | --- | None | | | | | | | | | |MbrB: | | | | | | | | | | Matapeake-----------------| B | Low |Jan-Dec | --- | --- | --- | --- | None | --- | None | | | | | | | | | |MbrC: | | | | | | | | | | Matapeake-----------------| B | Medium |Jan-Dec | --- | --- | --- | --- | None | --- | None | | | | | | | | | |MbuA: | | | | | | | | | | Mattapex------------------| C | Very high |Jan-Apr |1.5-3.5| >6.0 | --- | --- | None | --- | None | | |May-Jun |3.5-6.0| >6.0 | --- | --- | None | --- | None | | |Jul-Sep | --- | --- | --- | --- | None | --- | None | | |Oct-Dec |3.5-6.0| >6.0 | --- | --- | None | --- | None | | | | | | | | | |MbuB: | | | | | | | | | | Mattapex------------------| C | Very high |Jan-Apr |1.5-3.5| >6.0 | --- | --- | None | --- | None | | |May-Jun |3.5-6.0| >6.0 | --- | --- | None | --- | None | | |Jul-Sep | --- | --- | --- | --- | None | --- | None | | |Oct-Dec |3.5-6.0| >6.0 | --- | --- | None | --- | None | | | | | | | | | |MbxB: | | | | | | | | | | Mattapex------------------| C | Very high |Jan-Apr |1.5-3.5| >6.0 | --- | --- | None | --- | None | | |May-Jun |3.5-6.0| >6.0 | --- | --- | None | --- | None | | |Jul-Sep | --- | --- | --- | --- | None | --- | None | | |Oct-Dec |3.5-6.0| >6.0 | --- | --- | None | --- | None | | | | | | | | | | Urban land----------------| --- | --- |Jan-Dec | --- | --- | --- | --- | None | --- | None | | | | | | | | | |MutA: | | | | | | | | | | Muttontown----------------| B | Very low |Jan-Apr |1.5-3.5| >6.0 | --- | --- | None | --- | None | | |May-Jun |3.5-6.0| >6.0 | --- | --- | None | --- | None | | |Jul-Sep | --- | --- | --- | --- | None | --- | None | | |Oct-Dec |3.5-6.0| >6.0 | --- | --- | None | --- | None | | | | | | | | | |
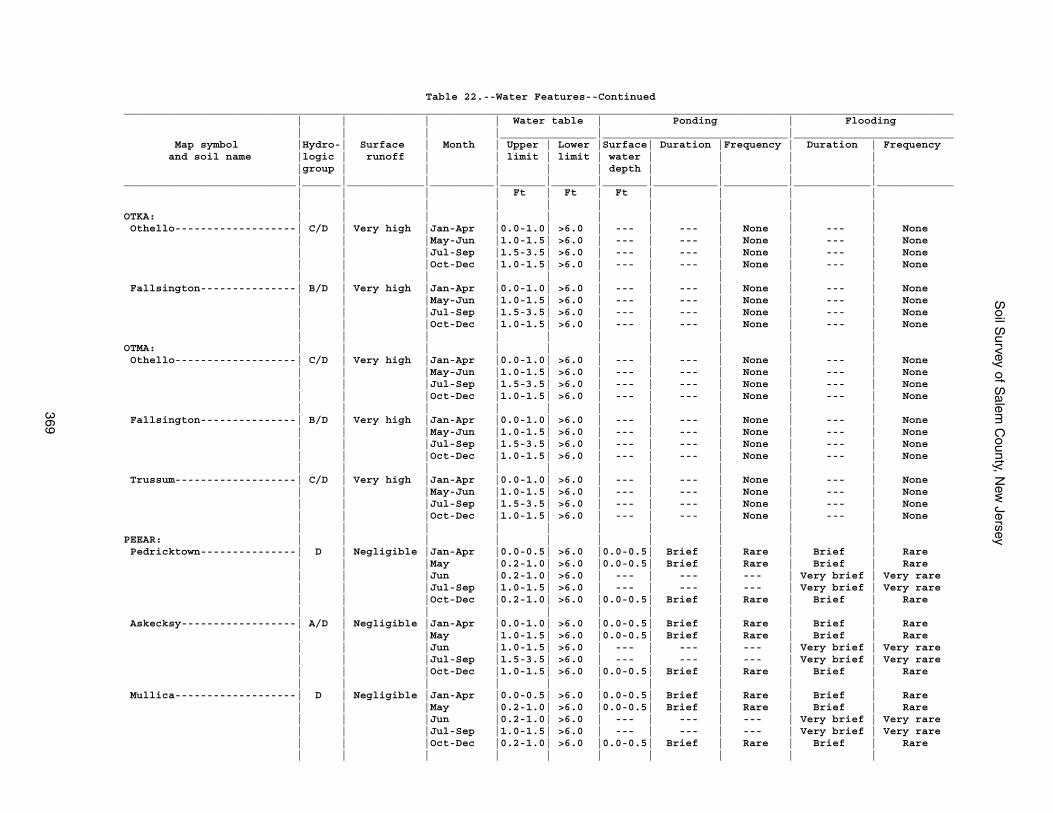
Soil S
urvey of Salem
County, N
ew Jersey
369
Table 22.--Water Features--Continued__________________________________________________________________________________________________________________________________ | | | | Water table | Ponding | Flooding | | | |_______________|_____________________________|_________________________ Map symbol |Hydro-| Surface | Month | Upper | Lower |Surface| Duration |Frequency | Duration | Frequency and soil name |logic | runoff | | limit | limit | water | | | | |group | | | | | depth | | | |___________________________|______|____________|__________|_______|_______|_______|__________|__________|____________|____________ | | | | Ft | Ft | Ft | | | | | | | | | | | | | |OTKA: | | | | | | | | | | Othello-------------------| C/D | Very high |Jan-Apr |0.0-1.0| >6.0 | --- | --- | None | --- | None | | |May-Jun |1.0-1.5| >6.0 | --- | --- | None | --- | None | | |Jul-Sep |1.5-3.5| >6.0 | --- | --- | None | --- | None | | |Oct-Dec |1.0-1.5| >6.0 | --- | --- | None | --- | None | | | | | | | | | | Fallsington---------------| B/D | Very high |Jan-Apr |0.0-1.0| >6.0 | --- | --- | None | --- | None | | |May-Jun |1.0-1.5| >6.0 | --- | --- | None | --- | None | | |Jul-Sep |1.5-3.5| >6.0 | --- | --- | None | --- | None | | |Oct-Dec |1.0-1.5| >6.0 | --- | --- | None | --- | None | | | | | | | | | |OTMA: | | | | | | | | | | Othello-------------------| C/D | Very high |Jan-Apr |0.0-1.0| >6.0 | --- | --- | None | --- | None | | |May-Jun |1.0-1.5| >6.0 | --- | --- | None | --- | None | | |Jul-Sep |1.5-3.5| >6.0 | --- | --- | None | --- | None | | |Oct-Dec |1.0-1.5| >6.0 | --- | --- | None | --- | None | | | | | | | | | | Fallsington---------------| B/D | Very high |Jan-Apr |0.0-1.0| >6.0 | --- | --- | None | --- | None | | |May-Jun |1.0-1.5| >6.0 | --- | --- | None | --- | None | | |Jul-Sep |1.5-3.5| >6.0 | --- | --- | None | --- | None | | |Oct-Dec |1.0-1.5| >6.0 | --- | --- | None | --- | None | | | | | | | | | | Trussum-------------------| C/D | Very high |Jan-Apr |0.0-1.0| >6.0 | --- | --- | None | --- | None | | |May-Jun |1.0-1.5| >6.0 | --- | --- | None | --- | None | | |Jul-Sep |1.5-3.5| >6.0 | --- | --- | None | --- | None | | |Oct-Dec |1.0-1.5| >6.0 | --- | --- | None | --- | None | | | | | | | | | |PEEAR: | | | | | | | | | | Pedricktown---------------| D | Negligible |Jan-Apr |0.0-0.5| >6.0 |0.0-0.5| Brief | Rare | Brief | Rare | | |May |0.2-1.0| >6.0 |0.0-0.5| Brief | Rare | Brief | Rare | | |Jun |0.2-1.0| >6.0 | --- | --- | --- | Very brief | Very rare | | |Jul-Sep |1.0-1.5| >6.0 | --- | --- | --- | Very brief | Very rare | | |Oct-Dec |0.2-1.0| >6.0 |0.0-0.5| Brief | Rare | Brief | Rare | | | | | | | | | | Askecksy------------------| A/D | Negligible |Jan-Apr |0.0-1.0| >6.0 |0.0-0.5| Brief | Rare | Brief | Rare | | |May |1.0-1.5| >6.0 |0.0-0.5| Brief | Rare | Brief | Rare | | |Jun |1.0-1.5| >6.0 | --- | --- | --- | Very brief | Very rare | | |Jul-Sep |1.5-3.5| >6.0 | --- | --- | --- | Very brief | Very rare | | |Oct-Dec |1.0-1.5| >6.0 |0.0-0.5| Brief | Rare | Brief | Rare | | | | | | | | | | Mullica-------------------| D | Negligible |Jan-Apr |0.0-0.5| >6.0 |0.0-0.5| Brief | Rare | Brief | Rare | | |May |0.2-1.0| >6.0 |0.0-0.5| Brief | Rare | Brief | Rare | | |Jun |0.2-1.0| >6.0 | --- | --- | --- | Very brief | Very rare | | |Jul-Sep |1.0-1.5| >6.0 | --- | --- | --- | Very brief | Very rare | | |Oct-Dec |0.2-1.0| >6.0 |0.0-0.5| Brief | Rare | Brief | Rare | | | | | | | | | |
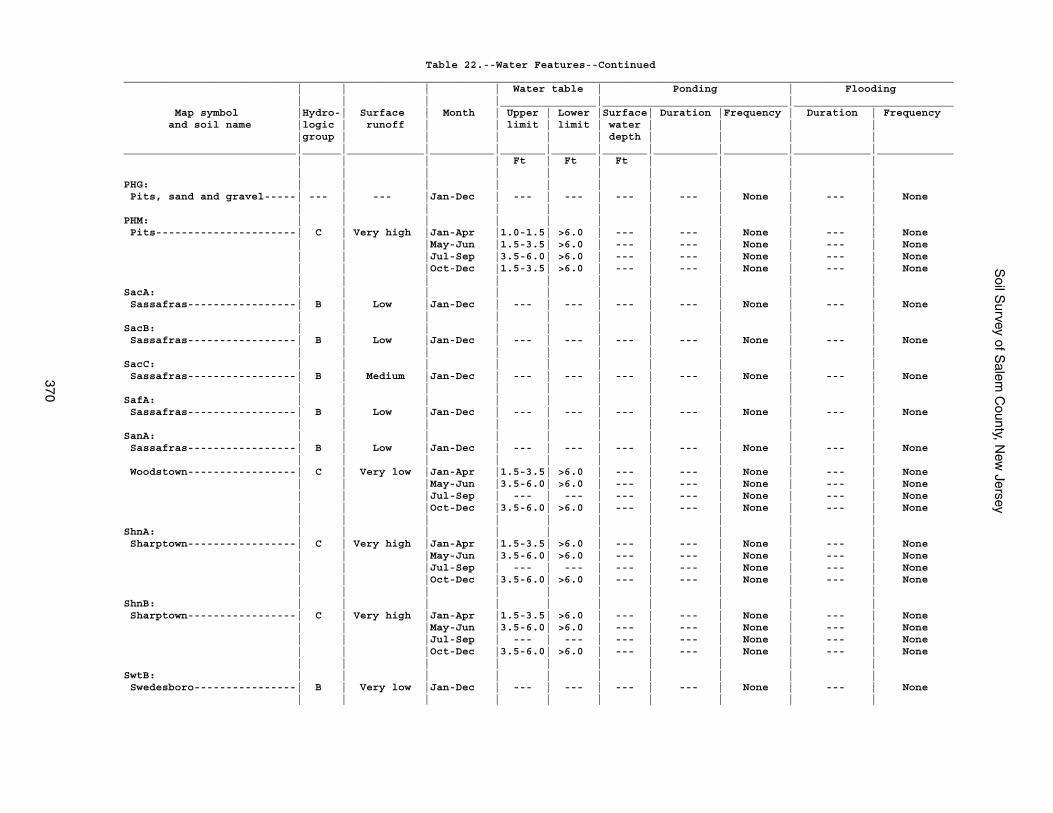
Soil S
urvey of Salem
County, N
ew Jersey
370
Table 22.--Water Features--Continued__________________________________________________________________________________________________________________________________ | | | | Water table | Ponding | Flooding | | | |_______________|_____________________________|_________________________ Map symbol |Hydro-| Surface | Month | Upper | Lower |Surface| Duration |Frequency | Duration | Frequency and soil name |logic | runoff | | limit | limit | water | | | | |group | | | | | depth | | | |___________________________|______|____________|__________|_______|_______|_______|__________|__________|____________|____________ | | | | Ft | Ft | Ft | | | | | | | | | | | | | |PHG: | | | | | | | | | | Pits, sand and gravel-----| --- | --- |Jan-Dec | --- | --- | --- | --- | None | --- | None | | | | | | | | | |PHM: | | | | | | | | | | Pits----------------------| C | Very high |Jan-Apr |1.0-1.5| >6.0 | --- | --- | None | --- | None | | |May-Jun |1.5-3.5| >6.0 | --- | --- | None | --- | None | | |Jul-Sep |3.5-6.0| >6.0 | --- | --- | None | --- | None | | |Oct-Dec |1.5-3.5| >6.0 | --- | --- | None | --- | None | | | | | | | | | |SacA: | | | | | | | | | | Sassafras-----------------| B | Low |Jan-Dec | --- | --- | --- | --- | None | --- | None | | | | | | | | | |SacB: | | | | | | | | | | Sassafras-----------------| B | Low |Jan-Dec | --- | --- | --- | --- | None | --- | None | | | | | | | | | |SacC: | | | | | | | | | | Sassafras-----------------| B | Medium |Jan-Dec | --- | --- | --- | --- | None | --- | None | | | | | | | | | |SafA: | | | | | | | | | | Sassafras-----------------| B | Low |Jan-Dec | --- | --- | --- | --- | None | --- | None | | | | | | | | | |SanA: | | | | | | | | | | Sassafras-----------------| B | Low |Jan-Dec | --- | --- | --- | --- | None | --- | None | | | | | | | | | | Woodstown-----------------| C | Very low |Jan-Apr |1.5-3.5| >6.0 | --- | --- | None | --- | None | | |May-Jun |3.5-6.0| >6.0 | --- | --- | None | --- | None | | |Jul-Sep | --- | --- | --- | --- | None | --- | None | | |Oct-Dec |3.5-6.0| >6.0 | --- | --- | None | --- | None | | | | | | | | | |ShnA: | | | | | | | | | | Sharptown-----------------| C | Very high |Jan-Apr |1.5-3.5| >6.0 | --- | --- | None | --- | None | | |May-Jun |3.5-6.0| >6.0 | --- | --- | None | --- | None | | |Jul-Sep | --- | --- | --- | --- | None | --- | None | | |Oct-Dec |3.5-6.0| >6.0 | --- | --- | None | --- | None | | | | | | | | | |ShnB: | | | | | | | | | | Sharptown-----------------| C | Very high |Jan-Apr |1.5-3.5| >6.0 | --- | --- | None | --- | None | | |May-Jun |3.5-6.0| >6.0 | --- | --- | None | --- | None | | |Jul-Sep | --- | --- | --- | --- | None | --- | None | | |Oct-Dec |3.5-6.0| >6.0 | --- | --- | None | --- | None | | | | | | | | | |SwtB: | | | | | | | | | | Swedesboro----------------| B | Very low |Jan-Dec | --- | --- | --- | --- | None | --- | None | | | | | | | | | |
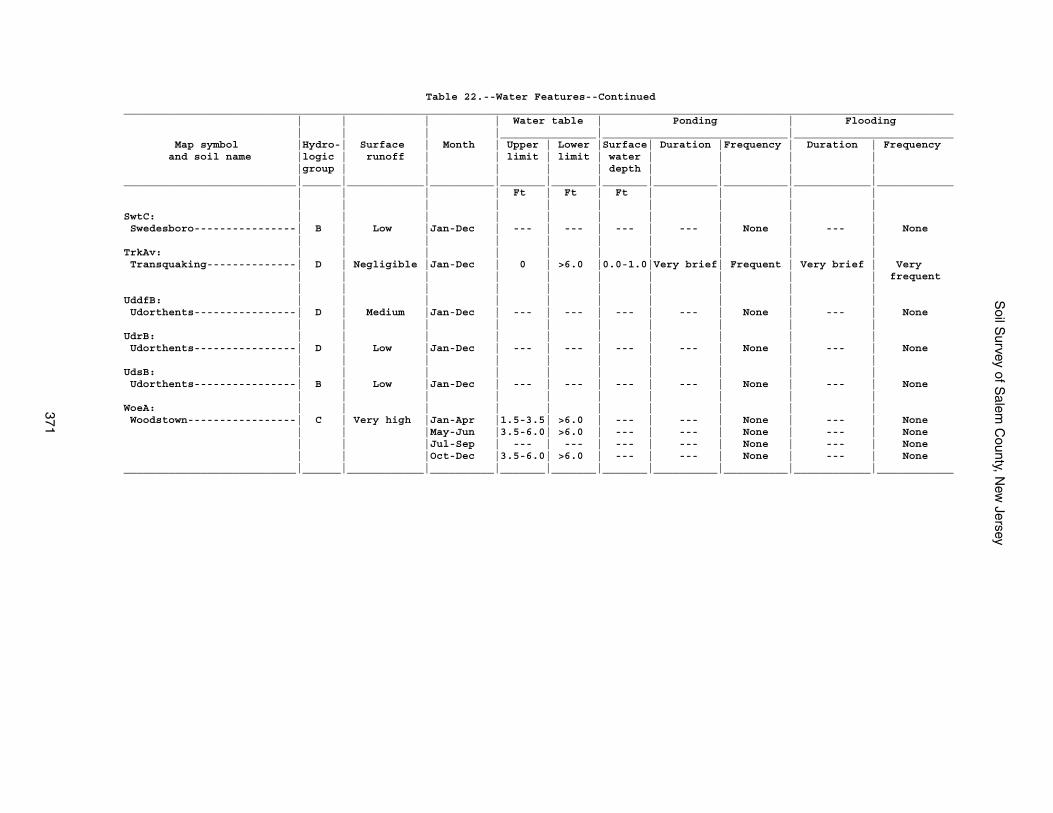
Soil S
urvey of Salem
County, N
ew Jersey
371
Table 22.--Water Features--Continued__________________________________________________________________________________________________________________________________ | | | | Water table | Ponding | Flooding | | | |_______________|_____________________________|_________________________ Map symbol |Hydro-| Surface | Month | Upper | Lower |Surface| Duration |Frequency | Duration | Frequency and soil name |logic | runoff | | limit | limit | water | | | | |group | | | | | depth | | | |___________________________|______|____________|__________|_______|_______|_______|__________|__________|____________|____________ | | | | Ft | Ft | Ft | | | | | | | | | | | | | |SwtC: | | | | | | | | | | Swedesboro----------------| B | Low |Jan-Dec | --- | --- | --- | --- | None | --- | None | | | | | | | | | |TrkAv: | | | | | | | | | | Transquaking--------------| D | Negligible |Jan-Dec | 0 | >6.0 |0.0-1.0|Very brief| Frequent | Very brief | Very | | | | | | | | | | frequent | | | | | | | | | |UddfB: | | | | | | | | | | Udorthents----------------| D | Medium |Jan-Dec | --- | --- | --- | --- | None | --- | None | | | | | | | | | |UdrB: | | | | | | | | | | Udorthents----------------| D | Low |Jan-Dec | --- | --- | --- | --- | None | --- | None | | | | | | | | | |UdsB: | | | | | | | | | | Udorthents----------------| B | Low |Jan-Dec | --- | --- | --- | --- | None | --- | None | | | | | | | | | |WoeA: | | | | | | | | | | Woodstown-----------------| C | Very high |Jan-Apr |1.5-3.5| >6.0 | --- | --- | None | --- | None | | |May-Jun |3.5-6.0| >6.0 | --- | --- | None | --- | None | | |Jul-Sep | --- | --- | --- | --- | None | --- | None | | |Oct-Dec |3.5-6.0| >6.0 | --- | --- | None | --- | None___________________________|______|____________|__________|_______|_______|_______|__________|__________|____________|____________
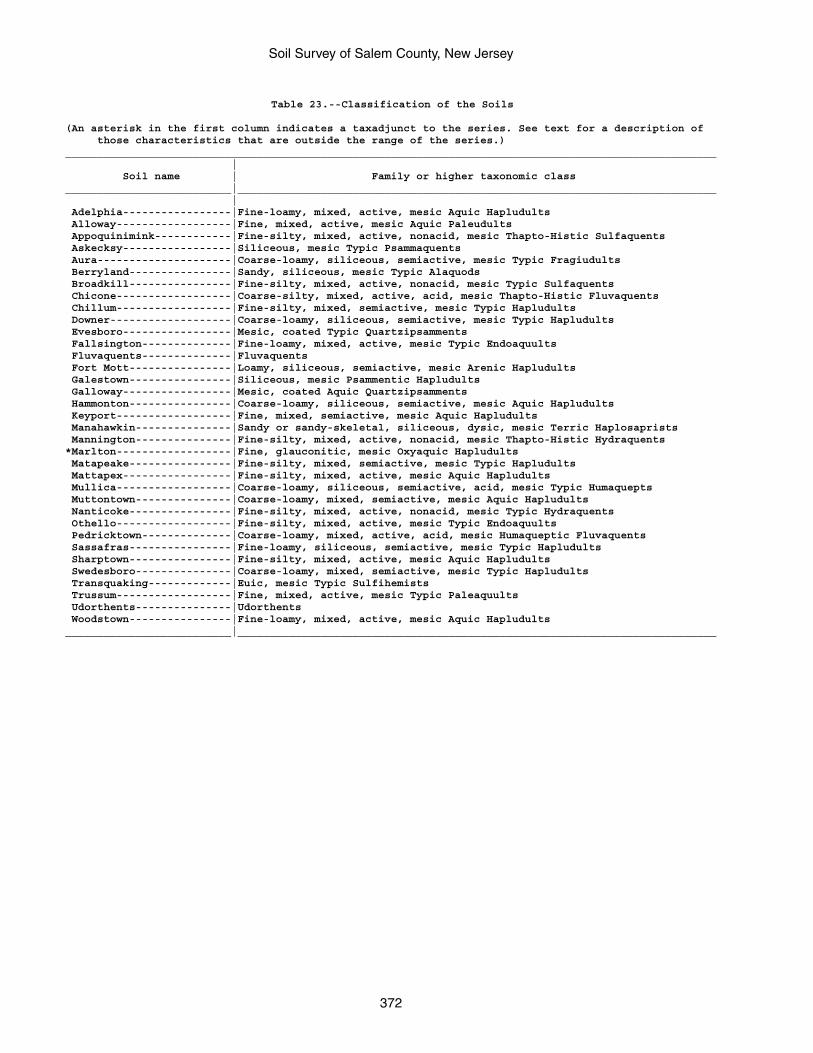
Soil Survey of Salem County, New Jersey
372
Table 23.--Classification of the Soils
(An asterisk in the first column indicates a taxadjunct to the series. See text for a description of those characteristics that are outside the range of the series.)______________________________________________________________________________________________________ | Soil name | Family or higher taxonomic class__________________________|___________________________________________________________________________ | Adelphia-----------------|Fine-loamy, mixed, active, mesic Aquic Hapludults Alloway------------------|Fine, mixed, active, mesic Aquic Paleudults Appoquinimink------------|Fine-silty, mixed, active, nonacid, mesic Thapto-Histic Sulfaquents Askecksy-----------------|Siliceous, mesic Typic Psammaquents Aura---------------------|Coarse-loamy, siliceous, semiactive, mesic Typic Fragiudults Berryland----------------|Sandy, siliceous, mesic Typic Alaquods Broadkill----------------|Fine-silty, mixed, active, nonacid, mesic Typic Sulfaquents Chicone------------------|Coarse-silty, mixed, active, acid, mesic Thapto-Histic Fluvaquents Chillum------------------|Fine-silty, mixed, semiactive, mesic Typic Hapludults Downer-------------------|Coarse-loamy, siliceous, semiactive, mesic Typic Hapludults Evesboro-----------------|Mesic, coated Typic Quartzipsamments Fallsington--------------|Fine-loamy, mixed, active, mesic Typic Endoaquults Fluvaquents--------------|Fluvaquents Fort Mott----------------|Loamy, siliceous, semiactive, mesic Arenic Hapludults Galestown----------------|Siliceous, mesic Psammentic Hapludults Galloway-----------------|Mesic, coated Aquic Quartzipsamments Hammonton----------------|Coarse-loamy, siliceous, semiactive, mesic Aquic Hapludults Keyport------------------|Fine, mixed, semiactive, mesic Aquic Hapludults Manahawkin---------------|Sandy or sandy-skeletal, siliceous, dysic, mesic Terric Haplosaprists Mannington---------------|Fine-silty, mixed, active, nonacid, mesic Thapto-Histic Hydraquents*Marlton------------------|Fine, glauconitic, mesic Oxyaquic Hapludults Matapeake----------------|Fine-silty, mixed, semiactive, mesic Typic Hapludults Mattapex-----------------|Fine-silty, mixed, active, mesic Aquic Hapludults Mullica------------------|Coarse-loamy, siliceous, semiactive, acid, mesic Typic Humaquepts Muttontown---------------|Coarse-loamy, mixed, semiactive, mesic Aquic Hapludults Nanticoke----------------|Fine-silty, mixed, active, nonacid, mesic Typic Hydraquents Othello------------------|Fine-silty, mixed, active, mesic Typic Endoaquults Pedricktown--------------|Coarse-loamy, mixed, active, acid, mesic Humaqueptic Fluvaquents Sassafras----------------|Fine-loamy, siliceous, semiactive, mesic Typic Hapludults Sharptown----------------|Fine-silty, mixed, active, mesic Aquic Hapludults Swedesboro---------------|Coarse-loamy, mixed, semiactive, mesic Typic Hapludults Transquaking-------------|Euic, mesic Typic Sulfihemists Trussum------------------|Fine, mixed, active, mesic Typic Paleaquults Udorthents---------------|Udorthents Woodstown----------------|Fine-loamy, mixed, active, mesic Aquic Hapludults__________________________|___________________________________________________________________________
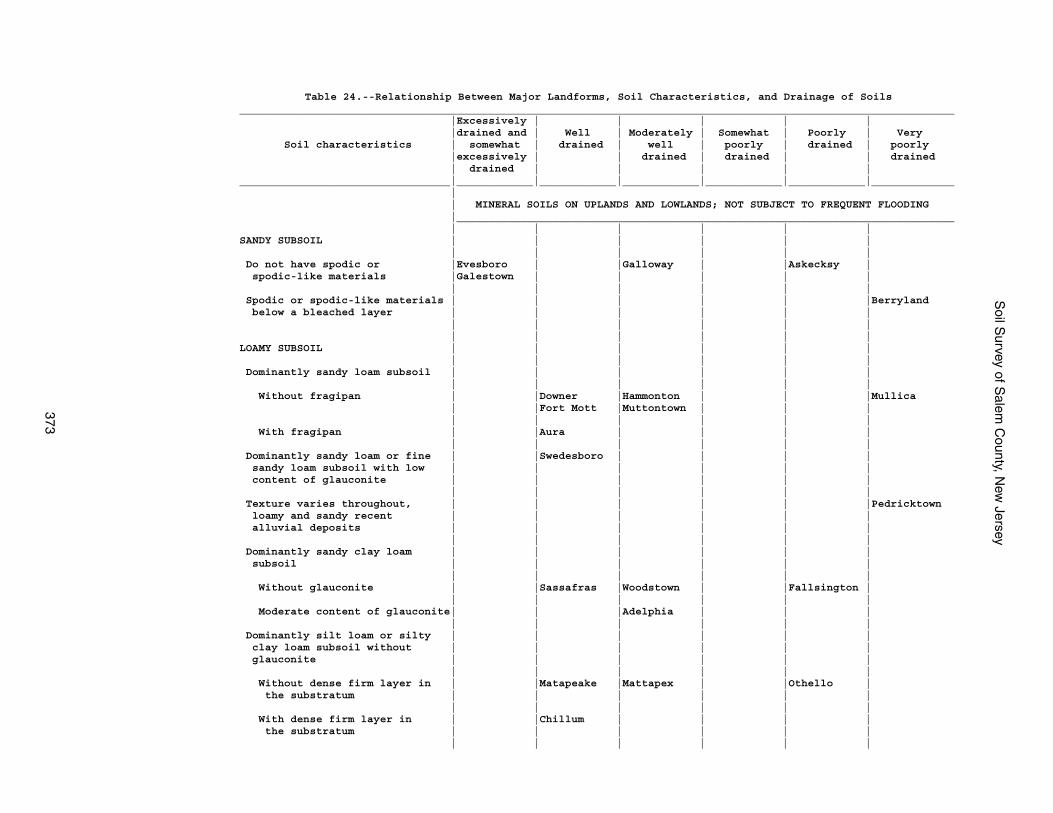
Soil S
urvey of Salem
County, N
ew Jersey
373
Table 24.--Relationship Between Major Landforms, Soil Characteristics, and Drainage of Soils________________________________________________________________________________________________________________ |Excessively | | | | | |drained and | Well | Moderately | Somewhat | Poorly | Very Soil characteristics | somewhat | drained | well | poorly | drained | poorly |excessively | | drained | drained | | drained | drained | | | | |_________________________________|____________|____________|____________|____________|____________|_____________ | | MINERAL SOILS ON UPLANDS AND LOWLANDS; NOT SUBJECT TO FREQUENT FLOODING |______________________________________________________________________________ | | | | | |SANDY SUBSOIL | | | | | | | | | | | | Do not have spodic or |Evesboro | |Galloway | |Askecksy | spodic-like materials |Galestown | | | | | | | | | | | Spodic or spodic-like materials | | | | | |Berryland below a bleached layer | | | | | | | | | | | | | | | | | |LOAMY SUBSOIL | | | | | | | | | | | | Dominantly sandy loam subsoil | | | | | | | | | | | | Without fragipan | |Downer |Hammonton | | |Mullica | |Fort Mott |Muttontown | | | | | | | | | With fragipan | |Aura | | | | | | | | | | Dominantly sandy loam or fine | |Swedesboro | | | | sandy loam subsoil with low | | | | | | content of glauconite | | | | | | | | | | | | Texture varies throughout, | | | | | |Pedricktown loamy and sandy recent | | | | | | alluvial deposits | | | | | | | | | | | | Dominantly sandy clay loam | | | | | | subsoil | | | | | | | | | | | | Without glauconite | |Sassafras |Woodstown | |Fallsington | | | | | | | Moderate content of glauconite| | |Adelphia | | | | | | | | | Dominantly silt loam or silty | | | | | | clay loam subsoil without | | | | | | glauconite | | | | | | | | | | | | Without dense firm layer in | |Matapeake |Mattapex | |Othello | the substratum | | | | | | | | | | | | With dense firm layer in | |Chillum | | | | the substratum | | | | | | | | | | | |
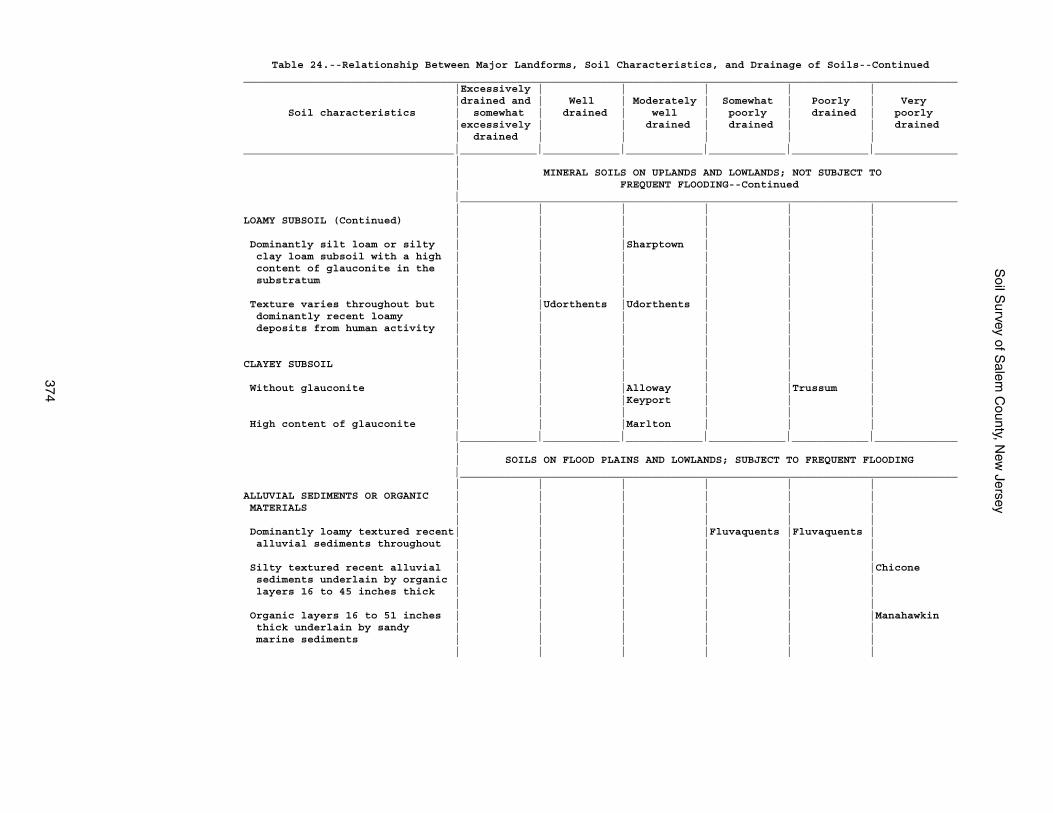
Soil S
urvey of Salem
County, N
ew Jersey
374
Table 24.--Relationship Between Major Landforms, Soil Characteristics, and Drainage of Soils--Continued________________________________________________________________________________________________________________ |Excessively | | | | | |drained and | Well | Moderately | Somewhat | Poorly | Very Soil characteristics | somewhat | drained | well | poorly | drained | poorly |excessively | | drained | drained | | drained | drained | | | | |_________________________________|____________|____________|____________|____________|____________|_____________ | | MINERAL SOILS ON UPLANDS AND LOWLANDS; NOT SUBJECT TO | FREQUENT FLOODING--Continued |______________________________________________________________________________ | | | | | |LOAMY SUBSOIL (Continued) | | | | | | | | | | | | Dominantly silt loam or silty | | |Sharptown | | | clay loam subsoil with a high | | | | | | content of glauconite in the | | | | | | substratum | | | | | | | | | | | | Texture varies throughout but | |Udorthents |Udorthents | | | dominantly recent loamy | | | | | | deposits from human activity | | | | | | | | | | | | | | | | | |CLAYEY SUBSOIL | | | | | | | | | | | | Without glauconite | | |Alloway | |Trussum | | | |Keyport | | | | | | | | | High content of glauconite | | |Marlton | | | |____________|____________|____________|____________|____________|_____________ | | SOILS ON FLOOD PLAINS AND LOWLANDS; SUBJECT TO FREQUENT FLOODING |______________________________________________________________________________ | | | | | |ALLUVIAL SEDIMENTS OR ORGANIC | | | | | | MATERIALS | | | | | | | | | | | | Dominantly loamy textured recent| | | |Fluvaquents |Fluvaquents | alluvial sediments throughout | | | | | | | | | | | | Silty textured recent alluvial | | | | | |Chicone sediments underlain by organic | | | | | | layers 16 to 45 inches thick | | | | | | | | | | | | Organic layers 16 to 51 inches | | | | | |Manahawkin thick underlain by sandy | | | | | | marine sediments | | | | | | | | | | | |
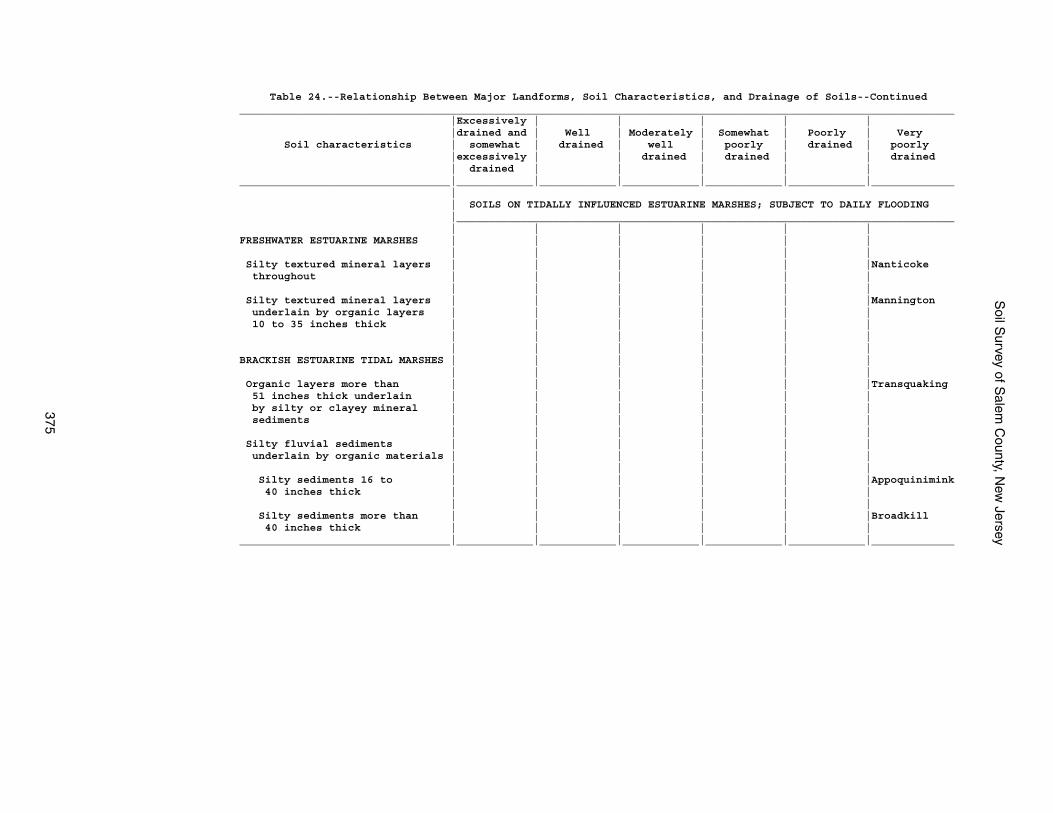
Soil S
urvey of Salem
County, N
ew Jersey
375
Table 24.--Relationship Between Major Landforms, Soil Characteristics, and Drainage of Soils--Continued________________________________________________________________________________________________________________ |Excessively | | | | | |drained and | Well | Moderately | Somewhat | Poorly | Very Soil characteristics | somewhat | drained | well | poorly | drained | poorly |excessively | | drained | drained | | drained | drained | | | | |_________________________________|____________|____________|____________|____________|____________|_____________ | | SOILS ON TIDALLY INFLUENCED ESTUARINE MARSHES; SUBJECT TO DAILY FLOODING |______________________________________________________________________________ | | | | | |FRESHWATER ESTUARINE MARSHES | | | | | | | | | | | | Silty textured mineral layers | | | | | |Nanticoke throughout | | | | | | | | | | | | Silty textured mineral layers | | | | | |Mannington underlain by organic layers | | | | | | 10 to 35 inches thick | | | | | | | | | | | | | | | | | |BRACKISH ESTUARINE TIDAL MARSHES | | | | | | | | | | | | Organic layers more than | | | | | |Transquaking 51 inches thick underlain | | | | | | by silty or clayey mineral | | | | | | sediments | | | | | | | | | | | | Silty fluvial sediments | | | | | | underlain by organic materials | | | | | | | | | | | | Silty sediments 16 to | | | | | |Appoquinimink 40 inches thick | | | | | | | | | | | | Silty sediments more than | | | | | |Broadkill 40 inches thick | | | | | |_________________________________|____________|____________|____________|____________|____________|_____________

The Natural Resources Conservation Service (NRCS) is committed to making itsinformation accessible to all of its customers and employees. If you are experiencingaccessibility issues and need assistance, please contact our Helpdesk by phone at1-800-457-3642 or by e-mail at [email protected]. For assistancewith publications that include maps, graphs, or similar forms of information, you mayalso wish to contact our State or local office. You can locate the correct office andphone number at http://offices.sc.egov.usda.gov/locator/app.
NRCS Accessibility Statement