Embed Size (px)
Citation preview
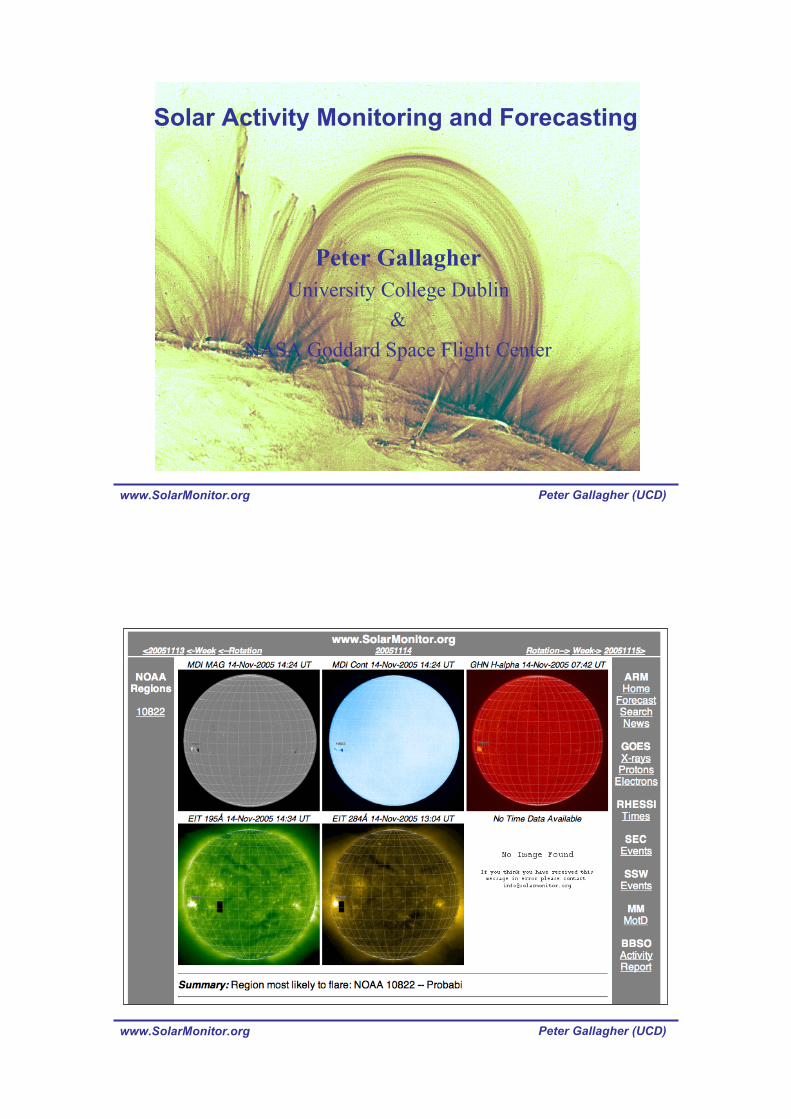
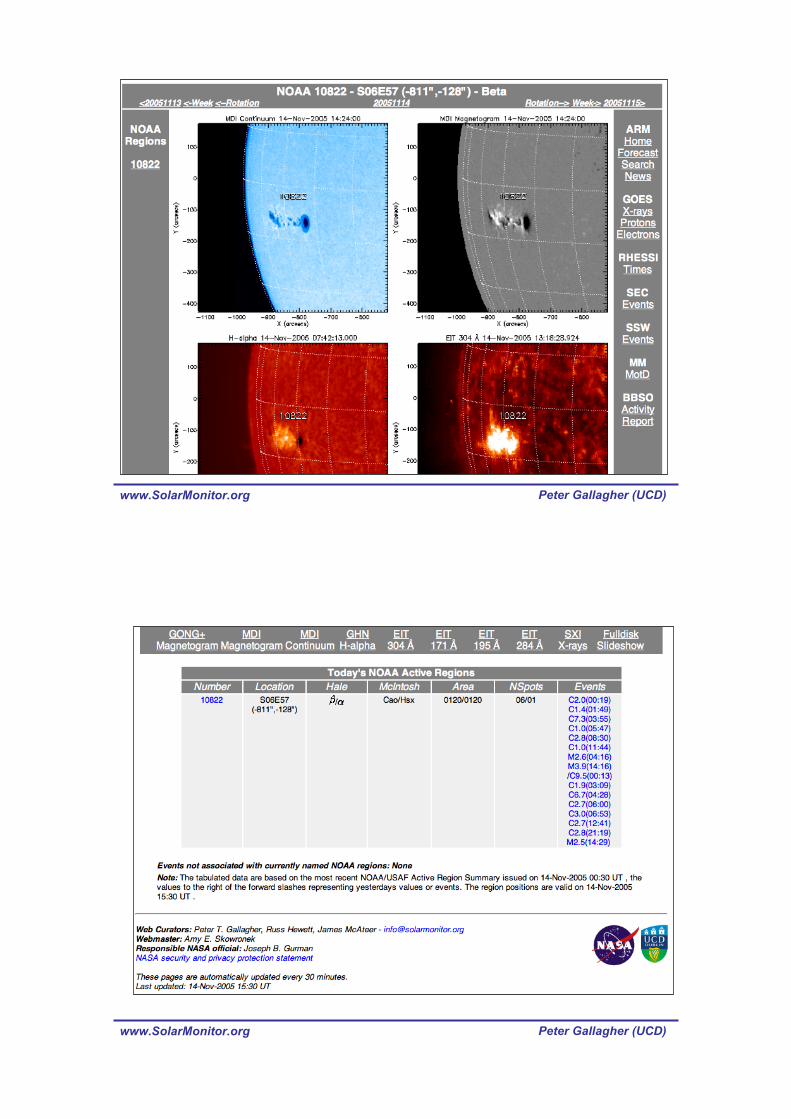
www.SolarMonitor.org Peter Gallagher (UCD)
Solar Activity Monitoring and Forecasting
Peter Gallagher
University College Dublin
&
NASA Goddard Space Flight Center
www.SolarMonitor.org Peter Gallagher (UCD)
www.SolarMonitor.org Peter Gallagher (UCD)
www.SolarMonitor.org Peter Gallagher (UCD)
www.SolarMonitor.org Peter Gallagher (UCD)
www.SolarMonitor.org Peter Gallagher (UCD)
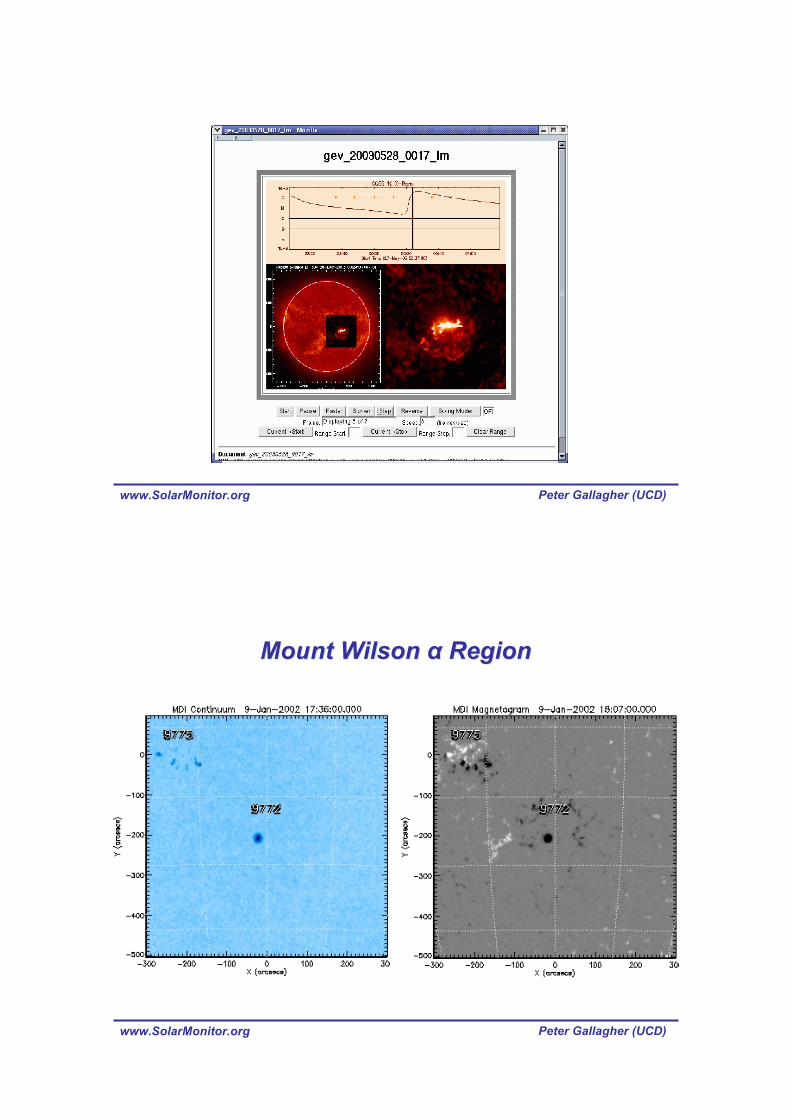
Mount Wilson Mount Wilson !! Region Region
www.SolarMonitor.org Peter Gallagher (UCD)
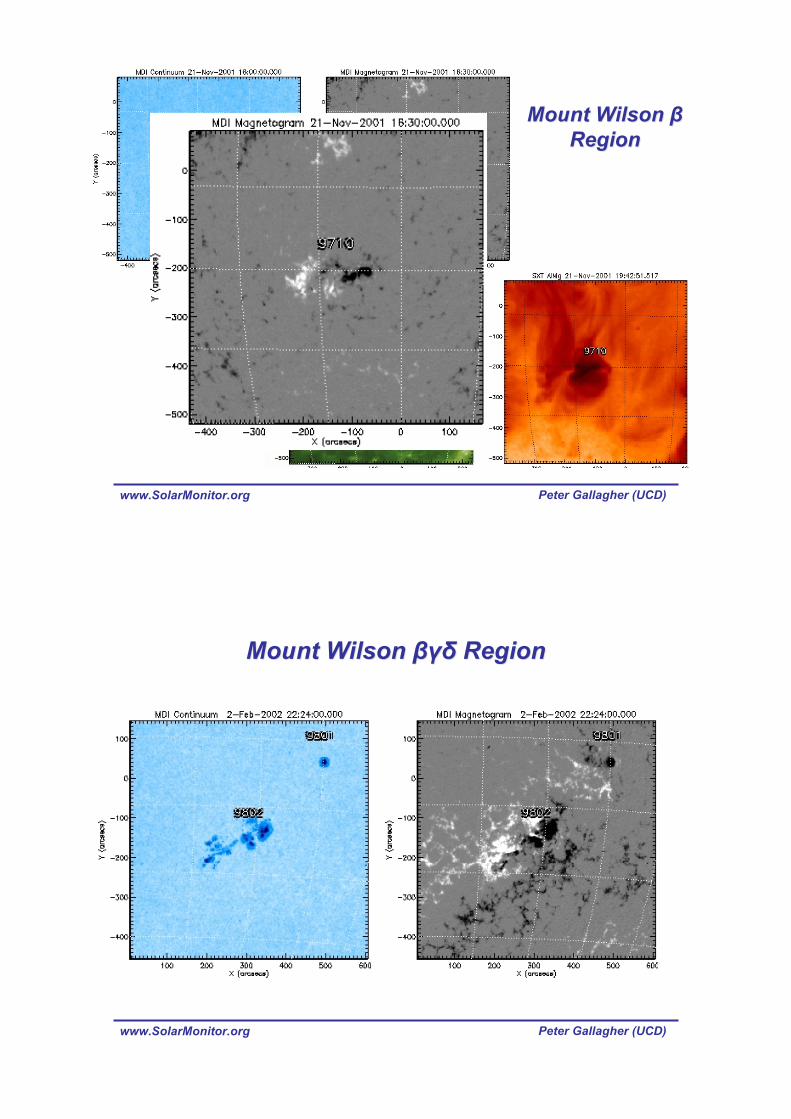
Mount Wilson Mount Wilson ""
RegionRegion
www.SolarMonitor.org Peter Gallagher (UCD)
Mount Wilson Mount Wilson "#$"#$ Region Region
www.SolarMonitor.org Peter Gallagher (UCD)
Active Region Active Region CharacterisationCharacterisation
Include measures that are physically motivated and that give a measure of
energy storage/release:
o Fractal dimension: relates to the active region complexity.
o Field gradient: indicative of energy build-up in the photosphere.
o Neutral lines: related to energy release locations.
o Emerging flux regions: can act as energy release triggers.
o Wavelet analysis: diagnostic of small and large scale morphology.
www.SolarMonitor.org Peter Gallagher (UCD)
Fractal Dimension - MotivationFractal Dimension - Motivation
o Turbulent plasma motions => fields follow a random walk.
o Percolation theory: geometry of flux concentrations on the solar surface naturally
result in fractals (Vlahos et al., 2002; Schrijver et al., 1992; Seiden & Wentzel,
1996).
o Magnetic fields scale in a self-similar and fractal manner.
o Correlation between Mt. Wilson classification and fractal dimension
(McAteer, Gallagher, et al., ApJ 2005).
o Measuring the fractal dimension of an active region magnetic field is an essentially
global investigation of the scaling properties of the magnetic field.
www.SolarMonitor.org Peter Gallagher (UCD)
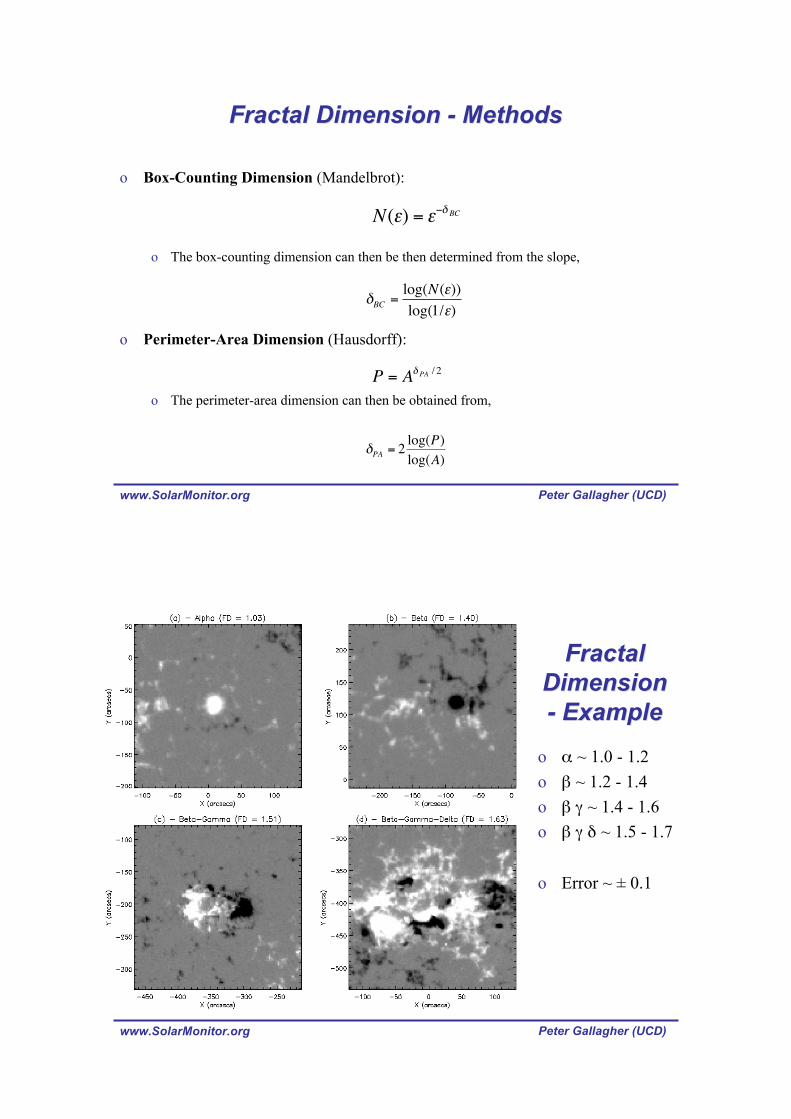
Fractal Dimension - MethodsFractal Dimension - Methods
o Box-Counting Dimension (Mandelbrot):
o The box-counting dimension can then be then determined from the slope,
o Perimeter-Area Dimension (Hausdorff):
o The perimeter-area dimension can then be obtained from,
!
N(") = "#$ BC
!
"BC
=log(N(#))
log(1/#)
!
P = A"PA/ 2
!
"PA
= 2log(P)
log(A)
www.SolarMonitor.org Peter Gallagher (UCD)
FractalFractal
DimensionDimension
- Example- Example
o ! ~ 1.0 - 1.2
o " ~ 1.2 - 1.4
o " # ~ 1.4 - 1.6
o " # $ ~ 1.5 - 1.7
o Error ~ ± 0.1
www.SolarMonitor.org Peter Gallagher (UCD)
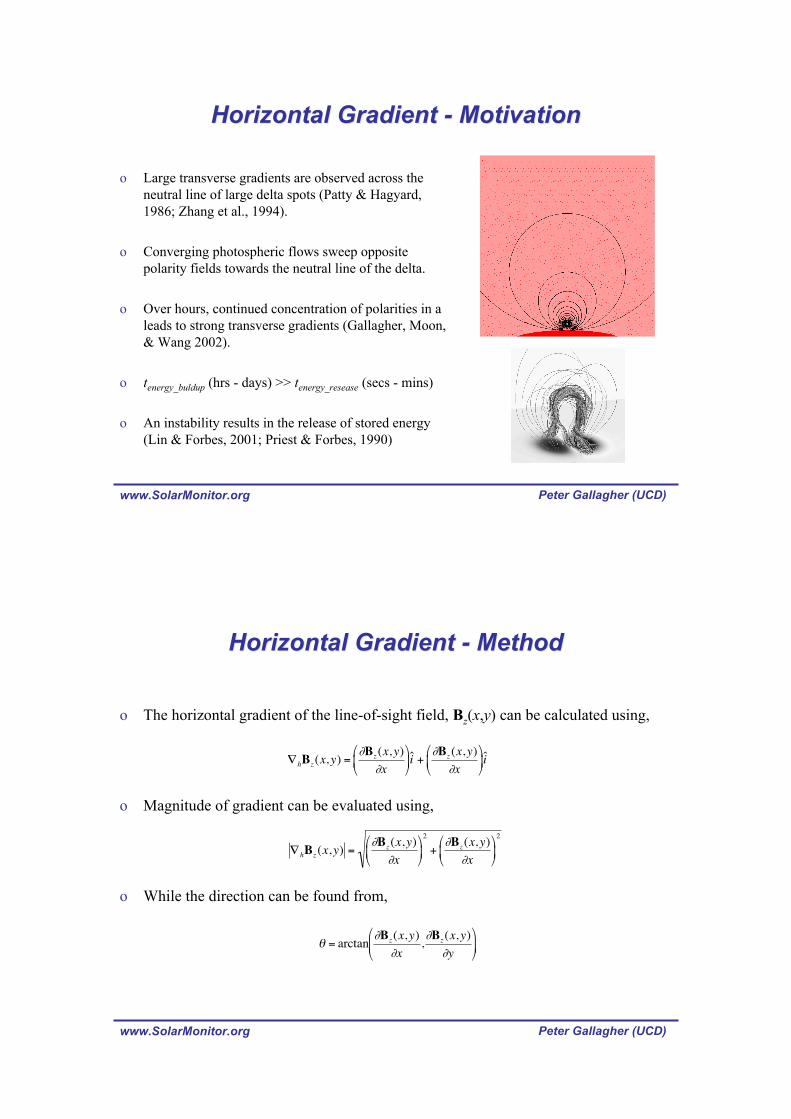
o Large transverse gradients are observed across the
neutral line of large delta spots (Patty & Hagyard,
1986; Zhang et al., 1994).
o Converging photospheric flows sweep opposite
polarity fields towards the neutral line of the delta.
o Over hours, continued concentration of polarities in a
leads to strong transverse gradients (Gallagher, Moon,
& Wang 2002).
o tenergy_buldup (hrs - days) >> tenergy_resease (secs - mins)
o An instability results in the release of stored energy
(Lin & Forbes, 2001; Priest & Forbes, 1990)
Horizontal Gradient - MotivationHorizontal Gradient - Motivation
www.SolarMonitor.org Peter Gallagher (UCD)
Horizontal Gradient - MethodHorizontal Gradient - Method
o The horizontal gradient of the line-of-sight field, Bz(x,y) can be calculated using,
o Magnitude of gradient can be evaluated using,
o While the direction can be found from,
!
"hBz(x, y) =#Bz (x, y)
#x
$
% &
'
( ) ̂ i +
#Bz (x, y)
#x
$
% &
'
( ) ̂ i
!
"hBz (x,y) =#Bz (x,y)
#x
$
% &
'
( )
2
+#Bz(x,y)
#x
$
% &
'
( )
2
!
" = arctan#Bz(x,y)
#x,#Bz(x,y)
#y
$
% &
'
( )
www.SolarMonitor.org Peter Gallagher (UCD)
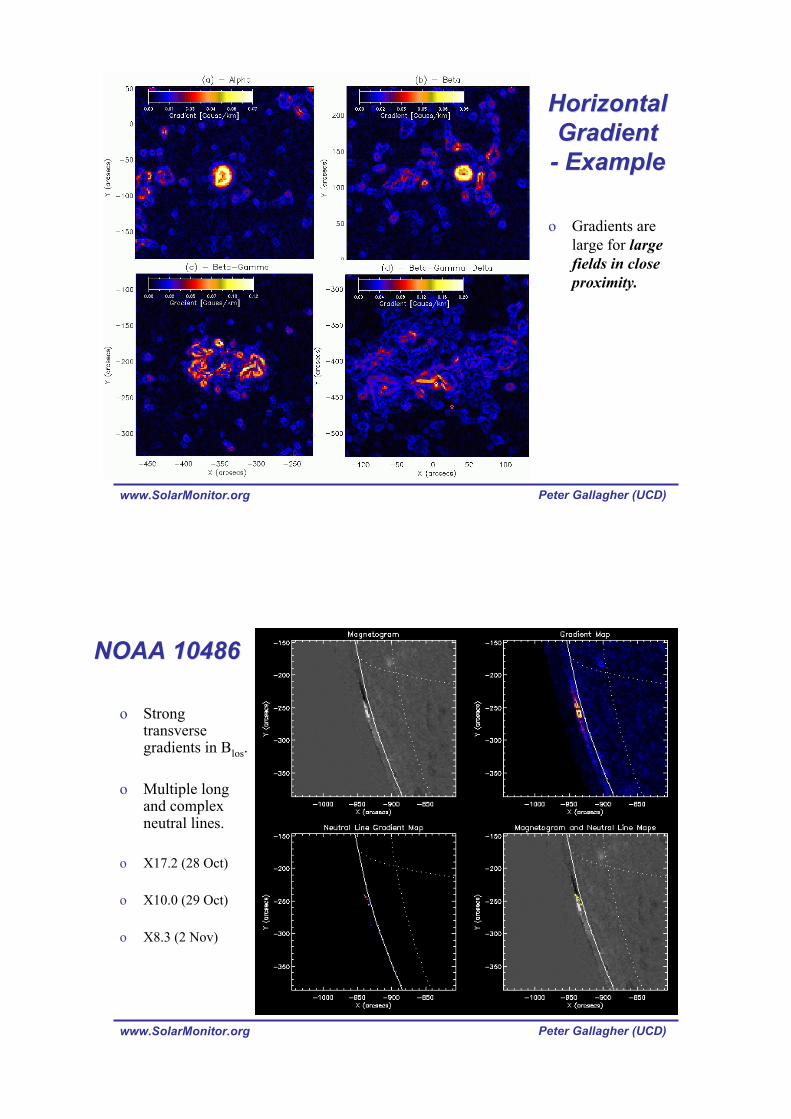
HorizontalHorizontal
GradientGradient
- Example- Example
o Gradients are
large for large
fields in close
proximity.
www.SolarMonitor.org Peter Gallagher (UCD)
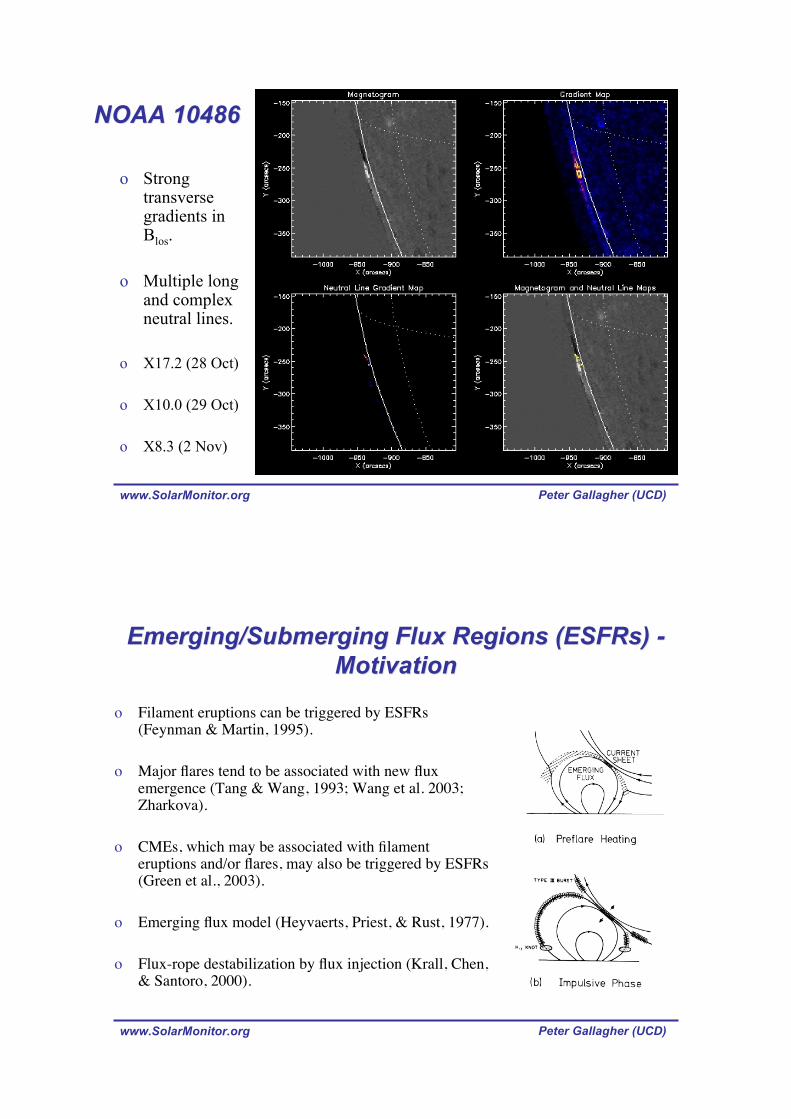
NOAA 10486NOAA 10486
o Strongtransversegradients in Blos.
o Multiple longand complexneutral lines.
o X17.2 (28 Oct)
o X10.0 (29 Oct)
o X8.3 (2 Nov)
www.SolarMonitor.org Peter Gallagher (UCD)
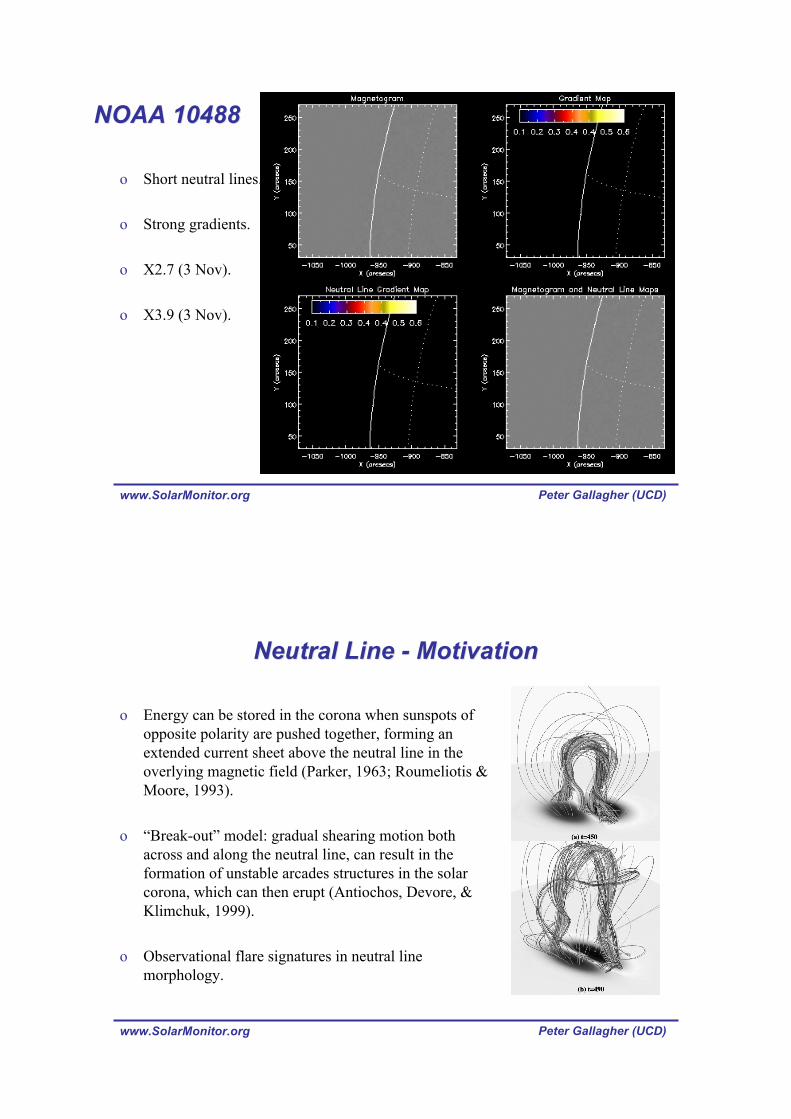
NOAA 10488NOAA 10488
o Short neutral lines.
o Strong gradients.
o X2.7 (3 Nov).
o X3.9 (3 Nov).
www.SolarMonitor.org Peter Gallagher (UCD)
Neutral Line - MotivationNeutral Line - Motivation
o Energy can be stored in the corona when sunspots of
opposite polarity are pushed together, forming an
extended current sheet above the neutral line in the
overlying magnetic field (Parker, 1963; Roumeliotis &
Moore, 1993).
o “Break-out” model: gradual shearing motion both
across and along the neutral line, can result in the
formation of unstable arcades structures in the solar
corona, which can then erupt (Antiochos, Devore, &
Klimchuk, 1999).
o Observational flare signatures in neutral line
morphology.
www.SolarMonitor.org Peter Gallagher (UCD)
Neutral Line - MethodNeutral Line - Method
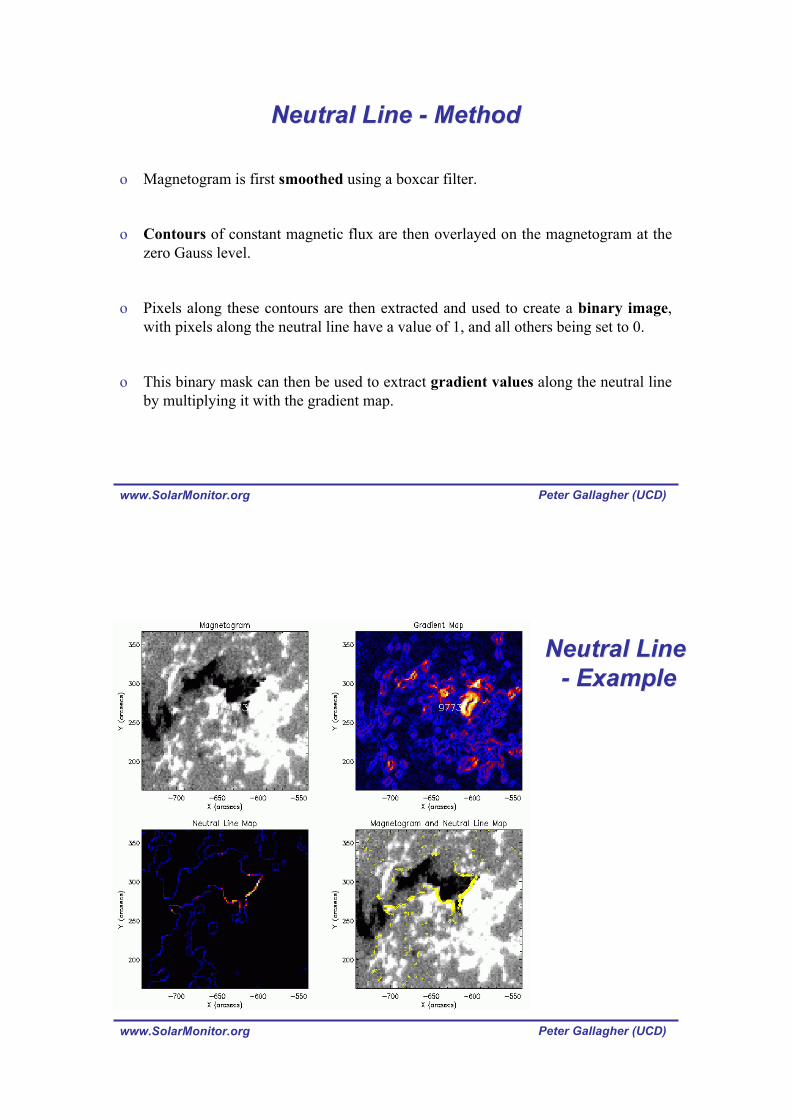
o Magnetogram is first smoothed using a boxcar filter.
o Contours of constant magnetic flux are then overlayed on the magnetogram at the
zero Gauss level.
o Pixels along these contours are then extracted and used to create a binary image,
with pixels along the neutral line have a value of 1, and all others being set to 0.
o This binary mask can then be used to extract gradient values along the neutral line
by multiplying it with the gradient map.
www.SolarMonitor.org Peter Gallagher (UCD)
Neutral LineNeutral Line
- Example - Example
www.SolarMonitor.org Peter Gallagher (UCD)
NOAA 10486NOAA 10486
o Strongtransversegradients inBlos.
o Multiple longand complexneutral lines.
o X17.2 (28 Oct)
o X10.0 (29 Oct)
o X8.3 (2 Nov)
www.SolarMonitor.org Peter Gallagher (UCD)
Emerging/Submerging Flux Regions (Emerging/Submerging Flux Regions (ESFRsESFRs) -) -
MotivationMotivation
o Filament eruptions can be triggered by ESFRs(Feynman & Martin, 1995).
o Major flares tend to be associated with new fluxemergence (Tang & Wang, 1993; Wang et al. 2003;Zharkova).
o CMEs, which may be associated with filamenteruptions and/or flares, may also be triggered by ESFRs(Green et al., 2003).
o Emerging flux model (Heyvaerts, Priest, & Rust, 1977).
o Flux-rope destabilization by flux injection (Krall, Chen,& Santoro, 2000).
www.SolarMonitor.org Peter Gallagher (UCD)
Emerging/Submerging Flux Regions (Emerging/Submerging Flux Regions (ESFRsESFRs) -) -
MethodMethod
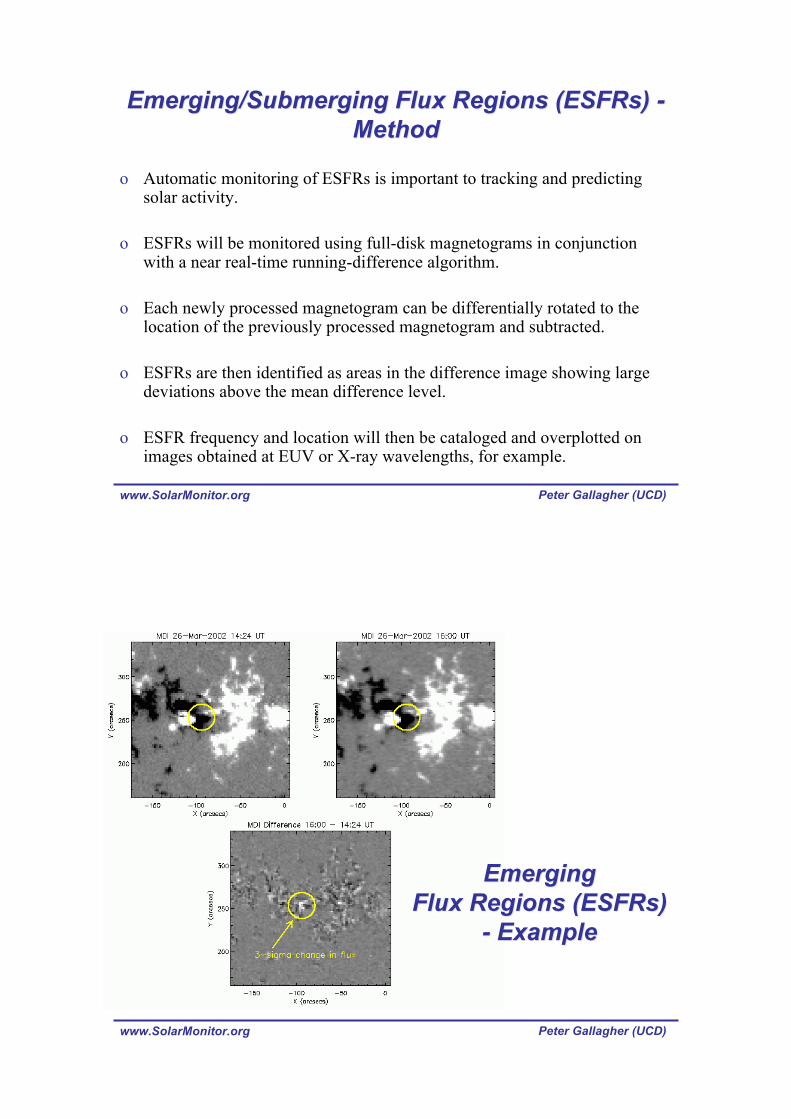
o Automatic monitoring of ESFRs is important to tracking and predictingsolar activity.
o ESFRs will be monitored using full-disk magnetograms in conjunctionwith a near real-time running-difference algorithm.
o Each newly processed magnetogram can be differentially rotated to thelocation of the previously processed magnetogram and subtracted.
o ESFRs are then identified as areas in the difference image showing largedeviations above the mean difference level.
o ESFR frequency and location will then be cataloged and overplotted onimages obtained at EUV or X-ray wavelengths, for example.
www.SolarMonitor.org Peter Gallagher (UCD)
EmergingEmerging
Flux Regions (Flux Regions (ESFRsESFRs))
- Example- Example
www.SolarMonitor.org Peter Gallagher (UCD)
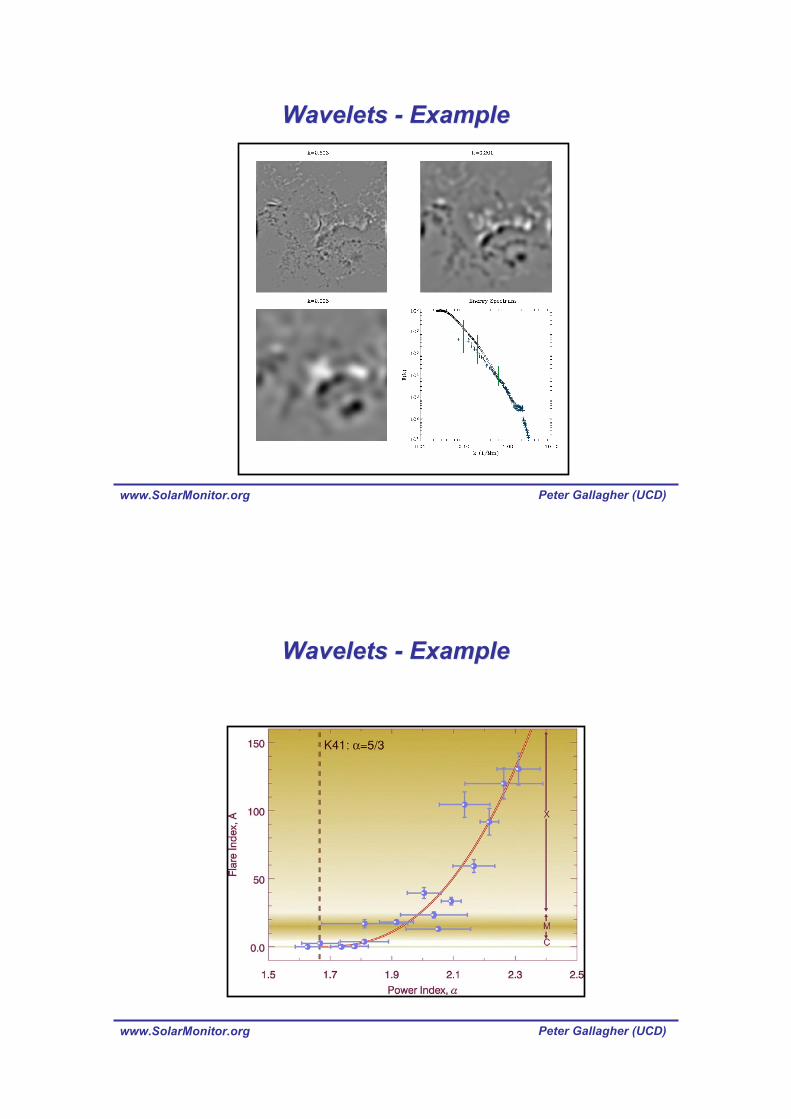
Wavelets - MotivationWavelets - Motivation
o Measuring the fractal dimension of an active region magnetic field is an
essentially global investigation of the scaling properties of the magnetic
field.
o =>overlooks spatially localized scale features, such as the
emergence/submergence of flux tubes.
o A wavelet analysis of magnetograms can identify such regions.
o Wavelets give distribution of length-scales => crucial for active region
characterisation.
www.SolarMonitor.org Peter Gallagher (UCD)
o Test the suitability of various wavelet decomposition schemes (Haar, a
trous, etc.)
o Find and characterize the local scale content of magnetograms and analyze
this in the context of flare occurrence locations, times, rates and flux
emergence/submergence.
o Characterize the evolution of spatial distribution of magnetogram scale
content via entropy measures.
Wavelets - MethodWavelets - Method
www.SolarMonitor.org Peter Gallagher (UCD)
Wavelets - ExampleWavelets - Example
www.SolarMonitor.org Peter Gallagher (UCD)
Wavelets - ExampleWavelets - Example
www.SolarMonitor.org Peter Gallagher (UCD)
o Autonomous:
o Operation via image processing.
o Distributed:
o Essential for real-time operation in SDO, STEREO, etc era.
o Redundant:
o Must be operational 24/7. Servers in US, Europe and Korea.
o Integrated:
o Must connect events on the Sun to events on and near Earth/planets.
Future DirectionsFuture Directions
www.SolarMonitor.org Peter Gallagher (UCD)
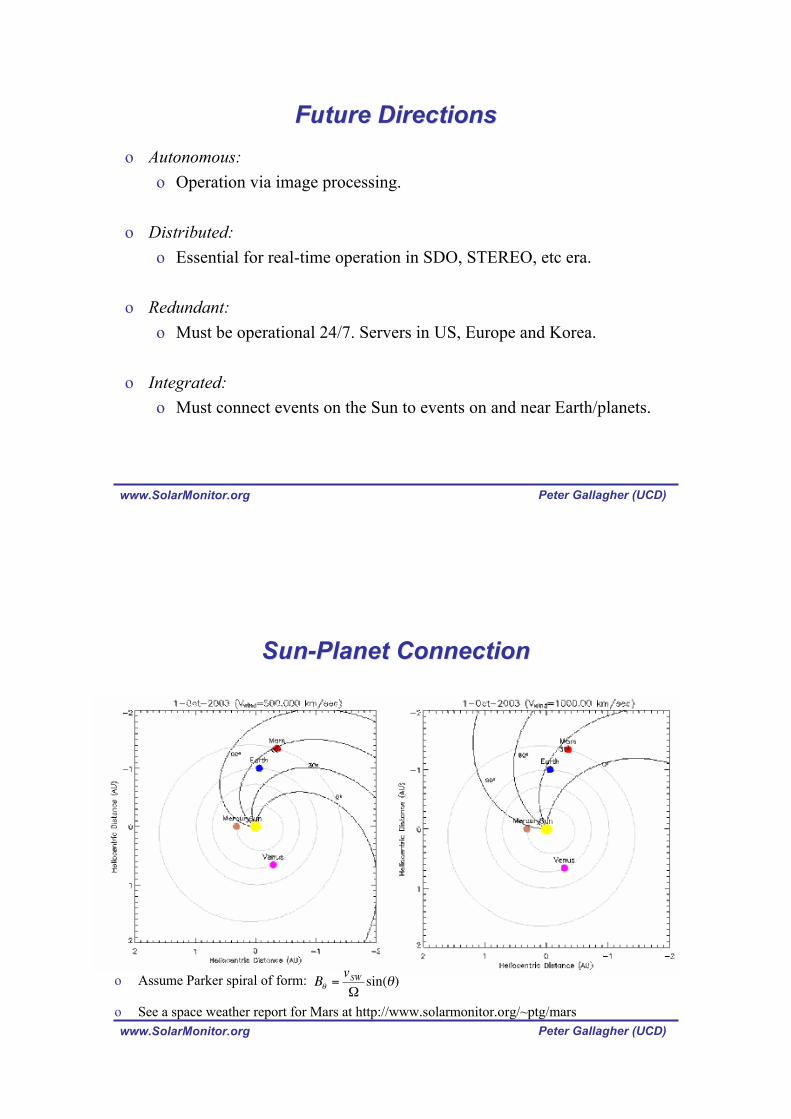
Sun-Planet ConnectionSun-Planet Connection
o Assume Parker spiral of form:
!
B" =vSW
#sin(")
o See a space weather report for Mars at http://www.solarmonitor.org/~ptg/mars

www.SolarMonitor.org Peter Gallagher (UCD)
FundingFunding
o Funded until now by NASA.
o Imagine Technologies Ltd. (www.imagine-technologies.com) proposal
accepted by Enterprise Ireland for space weather market analysis (!40k).
o Proposal submitted to Science Foundation Ireland for R&D (!1M).
o No current European funding - looking to partner/collaborate with
companies/researchers/agencies in Europe.
www.SolarMonitor.org Peter Gallagher (UCD)
Collaborators/ThanksCollaborators/Thanks
o James McAteer, Jack Ireland, Alex Young, Russ Hewett
NASA Goddard Space Flight Centre
o Paul Conlon and Claire Whelan
University College Dublin
o COST 724 - funding to make this presentation.