Embed Size (px)
Citation preview
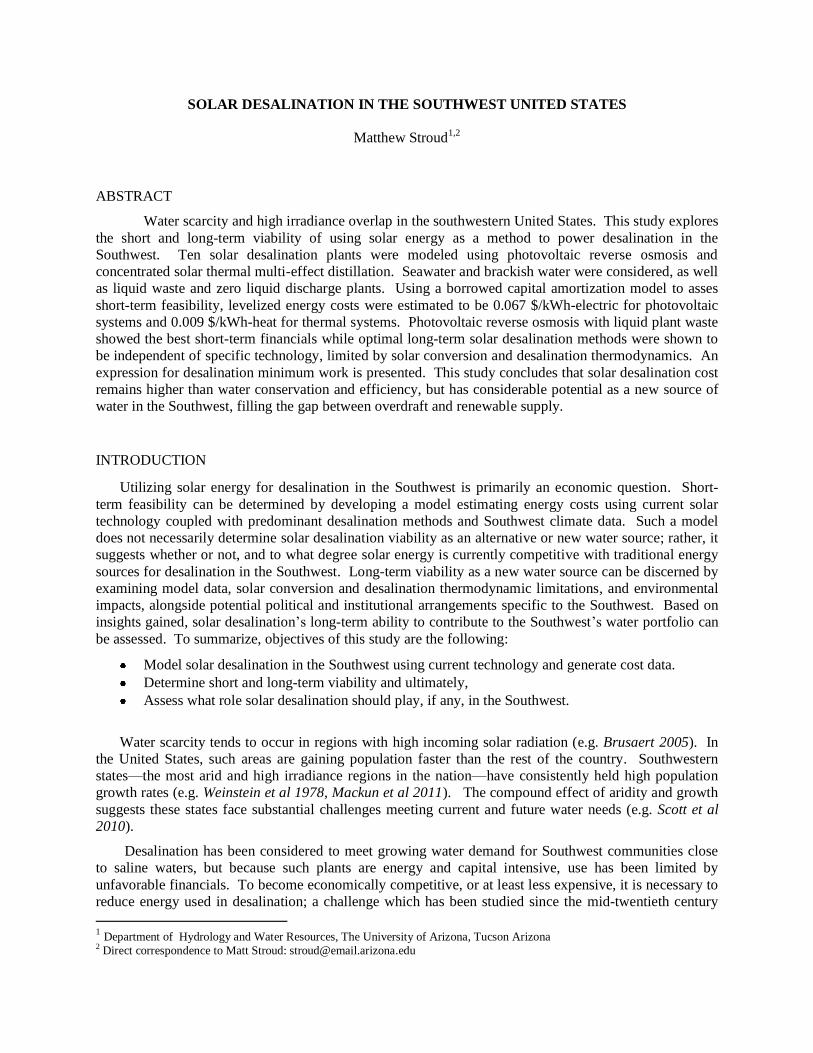
SOLAR DESALINATION IN THE SOUTHWEST UNITED STATES
Matthew Stroud1,2
ABSTRACT
Water scarcity and high irradiance overlap in the southwestern United States. This study explores
the short and long-term viability of using solar energy as a method to power desalination in the
Southwest. Ten solar desalination plants were modeled using photovoltaic reverse osmosis and
concentrated solar thermal multi-effect distillation. Seawater and brackish water were considered, as well
as liquid waste and zero liquid discharge plants. Using a borrowed capital amortization model to asses
short-term feasibility, levelized energy costs were estimated to be 0.067 $/kWh-electric for photovoltaic
systems and 0.009 $/kWh-heat for thermal systems. Photovoltaic reverse osmosis with liquid plant waste
showed the best short-term financials while optimal long-term solar desalination methods were shown to
be independent of specific technology, limited by solar conversion and desalination thermodynamics. An
expression for desalination minimum work is presented. This study concludes that solar desalination cost
remains higher than water conservation and efficiency, but has considerable potential as a new source of
water in the Southwest, filling the gap between overdraft and renewable supply.
INTRODUCTION
Utilizing solar energy for desalination in the Southwest is primarily an economic question. Short-
term feasibility can be determined by developing a model estimating energy costs using current solar
technology coupled with predominant desalination methods and Southwest climate data. Such a model
does not necessarily determine solar desalination viability as an alternative or new water source; rather, it
suggests whether or not, and to what degree solar energy is currently competitive with traditional energy
sources for desalination in the Southwest. Long-term viability as a new water source can be discerned by
examining model data, solar conversion and desalination thermodynamic limitations, and environmental
impacts, alongside potential political and institutional arrangements specific to the Southwest. Based on
insights gained, solar desalination’s long-term ability to contribute to the Southwest’s water portfolio can
be assessed. To summarize, objectives of this study are the following:
Model solar desalination in the Southwest using current technology and generate cost data.
Determine short and long-term viability and ultimately,
Assess what role solar desalination should play, if any, in the Southwest.
Water scarcity tends to occur in regions with high incoming solar radiation (e.g. Brusaert 2005). In
the United States, such areas are gaining population faster than the rest of the country. Southwestern
states—the most arid and high irradiance regions in the nation—have consistently held high population
growth rates (e.g. Weinstein et al 1978, Mackun et al 2011). The compound effect of aridity and growth
suggests these states face substantial challenges meeting current and future water needs (e.g. Scott et al
2010).
Desalination has been considered to meet growing water demand for Southwest communities close
to saline waters, but because such plants are energy and capital intensive, use has been limited by
unfavorable financials. To become economically competitive, or at least less expensive, it is necessary to
reduce energy used in desalination; a challenge which has been studied since the mid-twentieth century
1 Department of Hydrology and Water Resources, The University of Arizona, Tucson Arizona
2 Direct correspondence to Matt Stroud: [email protected]
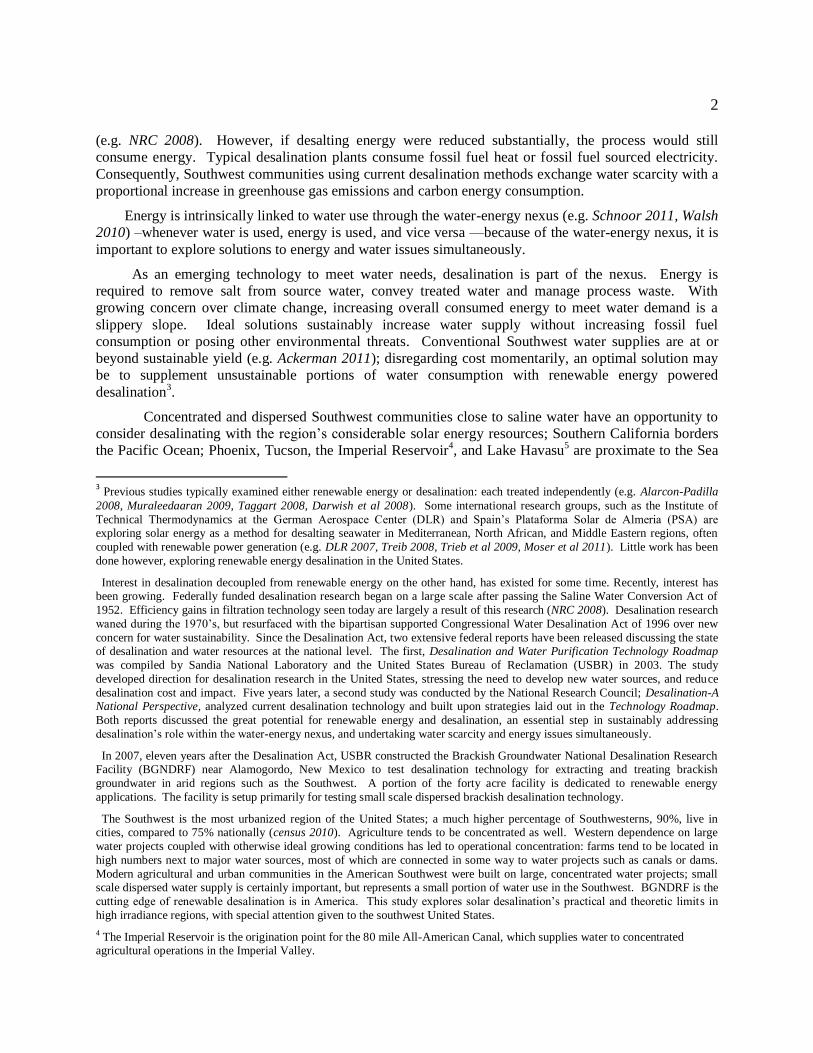
2 (e.g. NRC 2008). However, if desalting energy were reduced substantially, the process would still
consume energy. Typical desalination plants consume fossil fuel heat or fossil fuel sourced electricity.
Consequently, Southwest communities using current desalination methods exchange water scarcity with a
proportional increase in greenhouse gas emissions and carbon energy consumption.
Energy is intrinsically linked to water use through the water-energy nexus (e.g. Schnoor 2011, Walsh
2010) –whenever water is used, energy is used, and vice versa —because of the water-energy nexus, it is
important to explore solutions to energy and water issues simultaneously.
As an emerging technology to meet water needs, desalination is part of the nexus. Energy is
required to remove salt from source water, convey treated water and manage process waste. With
growing concern over climate change, increasing overall consumed energy to meet water demand is a
slippery slope. Ideal solutions sustainably increase water supply without increasing fossil fuel
consumption or posing other environmental threats. Conventional Southwest water supplies are at or
beyond sustainable yield (e.g. Ackerman 2011); disregarding cost momentarily, an optimal solution may
be to supplement unsustainable portions of water consumption with renewable energy powered
desalination3.
Concentrated and dispersed Southwest communities close to saline water have an opportunity to
consider desalinating with the region’s considerable solar energy resources; Southern California borders
the Pacific Ocean; Phoenix, Tucson, the Imperial Reservoir4, and Lake Havasu
5 are proximate to the Sea
3 Previous studies typically examined either renewable energy or desalination: each treated independently (e.g. Alarcon-Padilla
2008, Muraleedaaran 2009, Taggart 2008, Darwish et al 2008). Some international research groups, such as the Institute of
Technical Thermodynamics at the German Aerospace Center (DLR) and Spain’s Plataforma Solar de Almeria (PSA) are exploring solar energy as a method for desalting seawater in Mediterranean, North African, and Middle Eastern regions, often
coupled with renewable power generation (e.g. DLR 2007, Treib 2008, Trieb et al 2009, Moser et al 2011). Little work has been
done however, exploring renewable energy desalination in the United States.
Interest in desalination decoupled from renewable energy on the other hand, has existed for some time. Recently, interest has been growing. Federally funded desalination research began on a large scale after passing the Saline Water Conversion Act of
1952. Efficiency gains in filtration technology seen today are largely a result of this research (NRC 2008). Desalination research
waned during the 1970’s, but resurfaced with the bipartisan supported Congressional Water Desalination Act of 1996 over new
concern for water sustainability. Since the Desalination Act, two extensive federal reports have been released discussing the state of desalination and water resources at the national level. The first, Desalination and Water Purification Technology Roadmap
was compiled by Sandia National Laboratory and the United States Bureau of Reclamation (USBR) in 2003. The study
developed direction for desalination research in the United States, stressing the need to develop new water sources, and reduce
desalination cost and impact. Five years later, a second study was conducted by the National Research Council; Desalination-A National Perspective, analyzed current desalination technology and built upon strategies laid out in the Technology Roadmap.
Both reports discussed the great potential for renewable energy and desalination, an essential step in sustainably addressing
desalination’s role within the water-energy nexus, and undertaking water scarcity and energy issues simultaneously.
In 2007, eleven years after the Desalination Act, USBR constructed the Brackish Groundwater National Desalination Research Facility (BGNDRF) near Alamogordo, New Mexico to test desalination technology for extracting and treating brackish
groundwater in arid regions such as the Southwest. A portion of the forty acre facility is dedicated to renewable energy
applications. The facility is setup primarily for testing small scale dispersed brackish desalination technology.
The Southwest is the most urbanized region of the United States; a much higher percentage of Southwesterns, 90%, live in cities, compared to 75% nationally (census 2010). Agriculture tends to be concentrated as well. Western dependence on large
water projects coupled with otherwise ideal growing conditions has led to operational concentration: farms tend to be located in
high numbers next to major water sources, most of which are connected in some way to water projects such as canals or dams.
Modern agricultural and urban communities in the American Southwest were built on large, concentrated water projects; small scale dispersed water supply is certainly important, but represents a small portion of water use in the Southwest. BGNDRF is the
cutting edge of renewable desalination is in America. This study explores solar desalination’s practical and theoretic limits in
high irradiance regions, with special attention given to the southwest United States.
4 The Imperial Reservoir is the origination point for the 80 mile All-American Canal, which supplies water to concentrated agricultural operations in the Imperial Valley.
3 of Cortez, relative to historic Western water projects
6. Inland areas across the Southwest also have the
option of using solar energy to desalt potentially substantial brackish groundwater reserves7 (e.g. Brady et
al 2005).
Feasibility of solar desalination in the Southwest is primarily a question of economic viability.
Energy consumption does not depend on natural resources such as fossil fuels, modifying traditional
financial models. Energy consumption constitutes 90% of operational costs in typical distillation plants,
and 75% in filtration systems, so changing energy sources is substantial8 (e.g. NRC 2008). By examining
solar powered desalination economics, insight can be gained into minimizing or possibly eliminating
regional water resource overexploitation—filling the gap between sustainable yield and water
consumption. Solar desalination has potential to be a new Southwest water source, addressing the water-
energy nexus and water scarcity simultaneously. Estimating short-term economics offers insight into
long-term viability of using solar energy to desalinate in the Southwest, however; short and long-term
solutions may differ. The ultimate viability of solar desalination depends less on current technology and
more on limiting thermodynamics, environmental impacts, and the politics of water in the Southwest.
5 Lake Havasu is the origination point for Central Arizona Project and Colorado River Aqueduct, supplying urban and
agricultural use water to central and southern Arizona, and southern California. 6 The Central Arizona Project is 336 miles long, the Colorado River Aqueduct is 242 miles long, the Los Angeles Aqueduct is
419 miles long, and the California Aqueduct is 700 miles long. The distance from the Sea of Cortez is to Lake Havasu is 195
miles as a straight line for example; the distance of a conveyance system would be longer and would also require elevation change energy.
7 Benefits of water users switching to new water sources like desalination stretch beyond a single consumer. Water is a shared resource; nowhere is this more evident than the Southwest. Consumers divide water portions with other users through a regulated
system of appropriation. One appropriator using a new source of water could theoretically create that same amount of water for
others. For example, if southern California’s Metropolitan Water District (MWD) stopped using Colorado River water,
additional water could be made available for other appropriators, far away from the Los Angeles Basin. The limiting factor in this theoretical system is cost.
8 Although fuel-powered desalination continues to become more efficient, cost reductions realized through efficiency gains can
be offset by increased energy and capital costs. By switching to a technology driven energy source such as collected solar
radiation, production energy is unaffected by rising fuel prices, and at the macro scale, energy prices decrease with time as collection systems become less expensive. Energy prices dipped after the 1970’s oil embargo, but oil, natural gas, and electricity
prices (electricity is typically a product of burning coal, oil, or natural gas) have been steadily rising, and are projected to
continue rising (EIA 2012): fossil fuel prices are increasing, or flat. Collector costs trends for parabolic concentrators are
decreasing. Although cost-to-consumer data is limited, solar energy is becoming less expensive while traditional non-renewable energy is not, though; a direct comparison with non-renewable energy sources and solar energy can be tricky. The two systems
transfer energy differently, with different levels of technological development, and different greater economic effect (like reduce
environmental and health impacts). These differences make projecting cost, with confidence, difficult. For example, fuel-
burning power systems have existed since the eighteenth century; the technology is mature and today, power plants using fuel burning technology can be built and operated at high levels of financial competitiveness. Despite renewable energy interest, solar
collecting power systems rely on research, development, and investment in nascent technology. Long-term cost comparisons can
be nebulous. Projections exist, but cannot fully consider future tax credits for renewable technology, legislation, investment
capital, technological advances, carbon treaties, and other market factors. Establishing a price tag for such a system embodies risk, and often, a disregard for many of the greater economic benefits of sustainability. Comparing fossil fuel and solar power
can be done, but quantitative conclusions must be followed by qualitative reasoning to extract a more accurate measure of cost
and long-term viability.

4 DESALINATION TECHNOLOGY
Desalination technology is typically distinguished by separation technique: filtration or
distillation. Within this study, short-term solar desalination costs are estimated using reverse osmosis
filtration and multi-effect distillation. Without redesigning either process, both methods are essentially an
energy load; energy is generated by a solar power plant and supplied to a desalination plant.
Conceptually, modeled components can be thought of as purchased off-the-shelf and configured in the
manner detailed below. While necessary for determining short-term feasibility, this off-the-shelf
approach limits energy and capital performance, as well as the types of systems that can be modeled.
This limitation however, predominantly effects short-term conclusions. Long-term viability is bound by
the thermodynamics of solar conversion and desalination.
Desalination requires a minimum amount of work, inherent to saline solution properties and not
specific desalination methods (Speigler and El-Sayed 1994). Desalination can be thought of as physically
separating pure water from dissolved ions in solution (water being the solvent). Minimum work required
to separate pure water from solution is the reversible portion of energy exerted to overcome chemical
potential between dissolved ions and water (Stoughton and Lietzke 1965). Particular desalting techniques
are principally vehicles applying this work; energy used in excess of the minimum is loss (for a thorough
conceptualization and proof of desalination minimum work, contact the author:
[email protected]). Assuming isothermal conditions, desalination minimum work for a fixed
volume of saltwater can be expressed as:
(1)
Where,
W = work [kWh/m3 (of produced freshwater)]
S1 = initial salinity [‰]
bw1 = initial density of saline water [kg/m3]
v1 = initial volume [m3]
A = vapor pressure-salinity coefficient = 0.000537 [‰-1]
R = universal gas constant = 8.314462 [J/(mol∙K)]
T = temperature [K]
v2 = final volume (volume of brine) [m3]
vmol = molar volume of water = 0.018 [L/mol]
ρ0 = pure water density [kg/m3]
ρs = average density of constituent dissolved salts [kg/m3]
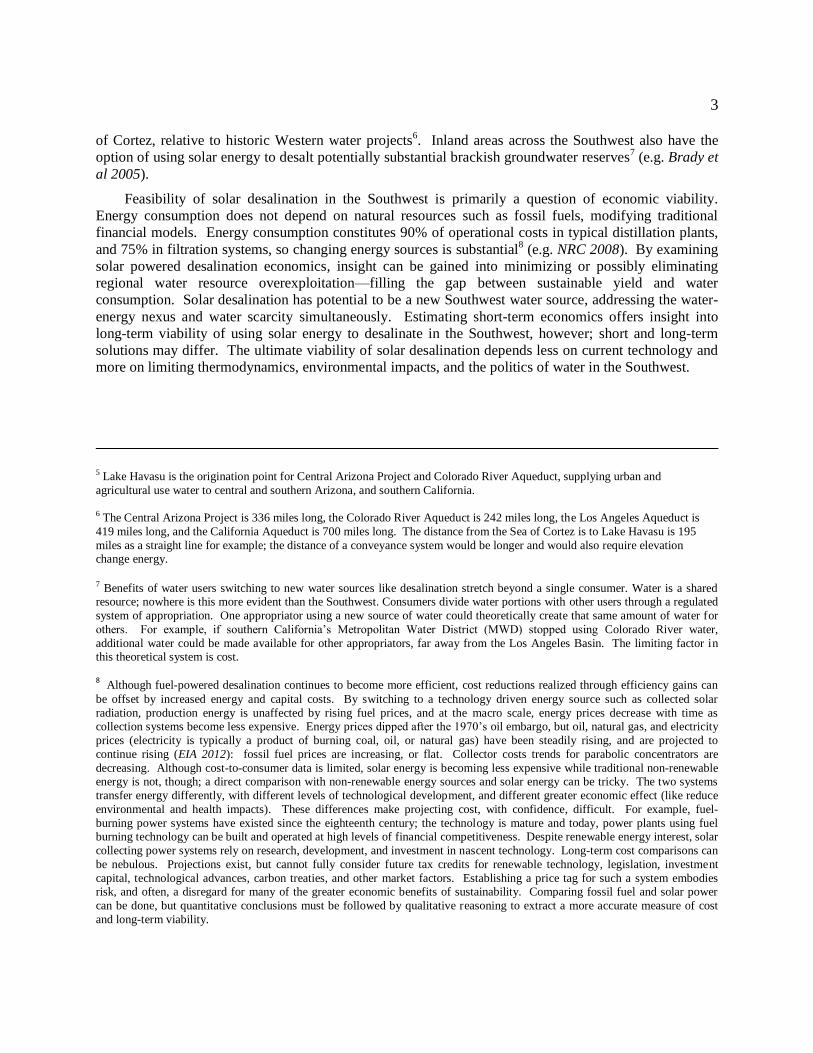
Minimum desalination work for typical seawater and brackish water at various temperatures is
shown in figure 1 and 2, below, respectively. Work increases as the relative percent of pure water volume
separated from solution, or recovery, increases—as salinity increases minimum work required to separate
water from dissolved ions also increases. As figures 1 and 2 show, required work accelerates toward high
recovery and increases linearly with water temperature (equation 1). At zero recovery, desalting typical
seawater at 25 °C requires 0.7086 kWh/m3
(kWh of energy per m3 of produced fresh water). Under
similar conditions, brackish water requires 0.042 kWh/m3.
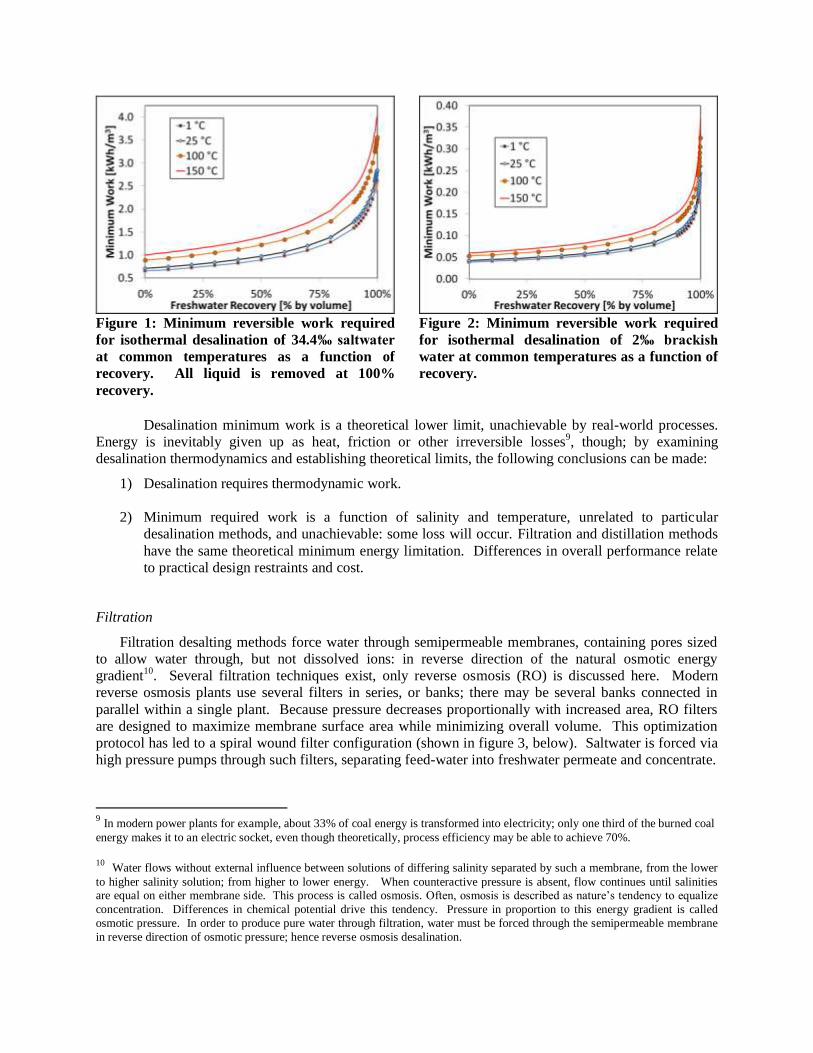
Figure 1: Minimum reversible work required
for isothermal desalination of 34.4‰ saltwater
at common temperatures as a function of
recovery. All liquid is removed at 100%
recovery.
Figure 2: Minimum reversible work required
for isothermal desalination of 2‰ brackish
water at common temperatures as a function of
recovery.
Desalination minimum work is a theoretical lower limit, unachievable by real-world processes.
Energy is inevitably given up as heat, friction or other irreversible losses9, though; by examining
desalination thermodynamics and establishing theoretical limits, the following conclusions can be made:
1) Desalination requires thermodynamic work.
2) Minimum required work is a function of salinity and temperature, unrelated to particular
desalination methods, and unachievable: some loss will occur. Filtration and distillation methods
have the same theoretical minimum energy limitation. Differences in overall performance relate
to practical design restraints and cost.
Filtration
Filtration desalting methods force water through semipermeable membranes, containing pores sized
to allow water through, but not dissolved ions: in reverse direction of the natural osmotic energy
gradient10
. Several filtration techniques exist, only reverse osmosis (RO) is discussed here. Modern
reverse osmosis plants use several filters in series, or banks; there may be several banks connected in
parallel within a single plant. Because pressure decreases proportionally with increased area, RO filters
are designed to maximize membrane surface area while minimizing overall volume. This optimization
protocol has led to a spiral wound filter configuration (shown in figure 3, below). Saltwater is forced via
high pressure pumps through such filters, separating feed-water into freshwater permeate and concentrate.
9 In modern power plants for example, about 33% of coal energy is transformed into electricity; only one third of the burned coal
energy makes it to an electric socket, even though theoretically, process efficiency may be able to achieve 70%.
10
Water flows without external influence between solutions of differing salinity separated by such a membrane, from the lower
to higher salinity solution; from higher to lower energy. When counteractive pressure is absent, flow continues until salinities are equal on either membrane side. This process is called osmosis. Often, osmosis is described as nature’s tendency to equalize
concentration. Differences in chemical potential drive this tendency. Pressure in proportion to this energy gradient is called
osmotic pressure. In order to produce pure water through filtration, water must be forced through the semipermeable membrane
in reverse direction of osmotic pressure; hence reverse osmosis desalination.
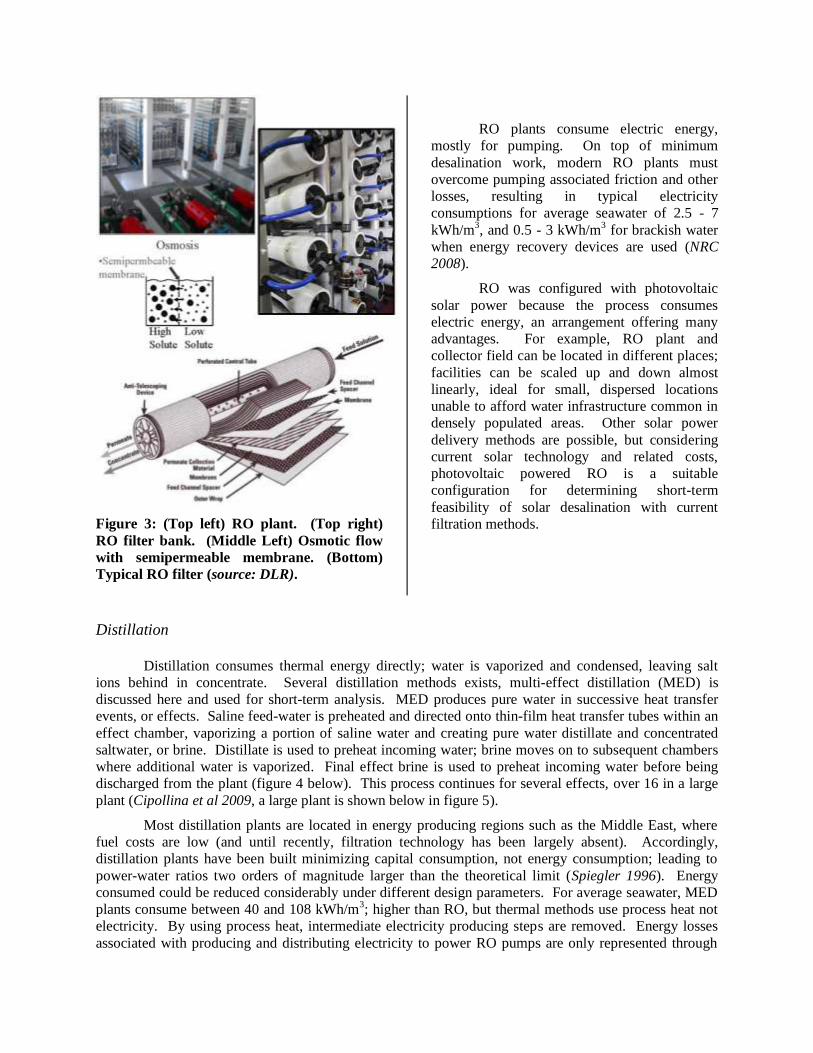
Figure 3: (Top left) RO plant. (Top right)
RO filter bank. (Middle Left) Osmotic flow
with semipermeable membrane. (Bottom)
Typical RO filter (source: DLR).
RO plants consume electric energy,
mostly for pumping. On top of minimum
desalination work, modern RO plants must
overcome pumping associated friction and other
losses, resulting in typical electricity
consumptions for average seawater of 2.5 - 7
kWh/m3, and 0.5 - 3 kWh/m
3 for brackish water
when energy recovery devices are used (NRC
2008).
RO was configured with photovoltaic
solar power because the process consumes
electric energy, an arrangement offering many
advantages. For example, RO plant and
collector field can be located in different places;
facilities can be scaled up and down almost
linearly, ideal for small, dispersed locations
unable to afford water infrastructure common in
densely populated areas. Other solar power
delivery methods are possible, but considering
current solar technology and related costs,
photovoltaic powered RO is a suitable
configuration for determining short-term
feasibility of solar desalination with current
filtration methods.
Distillation
Distillation consumes thermal energy directly; water is vaporized and condensed, leaving salt
ions behind in concentrate. Several distillation methods exists, multi-effect distillation (MED) is
discussed here and used for short-term analysis. MED produces pure water in successive heat transfer
events, or effects. Saline feed-water is preheated and directed onto thin-film heat transfer tubes within an
effect chamber, vaporizing a portion of saline water and creating pure water distillate and concentrated
saltwater, or brine. Distillate is used to preheat incoming water; brine moves on to subsequent chambers
where additional water is vaporized. Final effect brine is used to preheat incoming water before being
discharged from the plant (figure 4 below). This process continues for several effects, over 16 in a large
plant (Cipollina et al 2009, a large plant is shown below in figure 5).
Most distillation plants are located in energy producing regions such as the Middle East, where
fuel costs are low (and until recently, filtration technology has been largely absent). Accordingly,
distillation plants have been built minimizing capital consumption, not energy consumption; leading to
power-water ratios two orders of magnitude larger than the theoretical limit (Spiegler 1996). Energy
consumed could be reduced considerably under different design parameters. For average seawater, MED
plants consume between 40 and 108 kWh/m3; higher than RO, but thermal methods use process heat not
electricity. By using process heat, intermediate electricity producing steps are removed. Energy losses
associated with producing and distributing electricity to power RO pumps are only represented through
7 cost: consumption appears much lower, but actual differences depend on electricity producing efficiency.
For example, 2.5 kWh of electricity may consume 10 kWh of coal, if the overall process is 25% efficient.
Total RO carbon efficiency may differ from nameplate energy consumption.
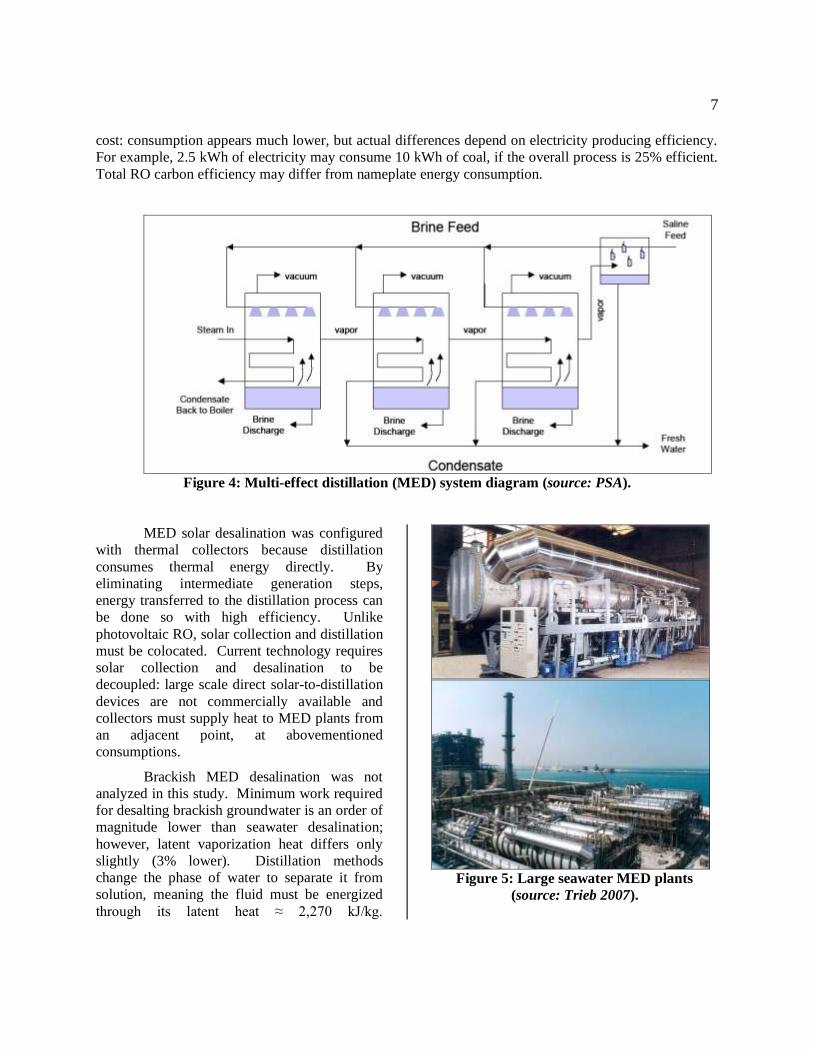
Figure 4: Multi-effect distillation (MED) system diagram (source: PSA).
MED solar desalination was configured
with thermal collectors because distillation
consumes thermal energy directly. By
eliminating intermediate generation steps,
energy transferred to the distillation process can
be done so with high efficiency. Unlike
photovoltaic RO, solar collection and distillation
must be colocated. Current technology requires
solar collection and desalination to be
decoupled: large scale direct solar-to-distillation
devices are not commercially available and
collectors must supply heat to MED plants from
an adjacent point, at abovementioned
consumptions.
Brackish MED desalination was not
analyzed in this study. Minimum work required
for desalting brackish groundwater is an order of
magnitude lower than seawater desalination;
however, latent vaporization heat differs only
slightly (3% lower). Distillation methods
change the phase of water to separate it from
solution, meaning the fluid must be energized
through its latent heat ≈ 2,270 kJ/kg.
Figure 5: Large seawater MED plants
(source: Trieb 2007).

8
Latent heat can be transferred from distilled vapor and brine to incoming feed-water, but heat
transfer requires a temperature difference; each time heat is transferred, a portion of the available 2,270
kJ/kg is given up as loss or remains in the higher energy fluid. Additionally, as water flows through
various plant components latent energy is converted to friction and other irreversible losses. At low
salinities, osmotic pressure—a direct surrogate for minimum work, is much lower than irreversible
pumping friction losses at the facility scale; though filtration and distillation share the same theoretical
minimum energy, filtration methods have a practical advantage at low salinities whereas distillation
energy consumption is similar to that of higher salinity feed-water. In other words, low salinity filtration
methods consume mostly friction loss energy, not desalination work. At higher salinities, desalination
work becomes a major process energy component, and distillation is practical. This dilemma is especially
true when modeling off-the-shelf components using validated and bankable software. A theoretical
system could be devised and modeled using some kind of high performing distillation method especially
built for brackish water, but without empirical data from a prototype or industry for example, comparing
the theoretical system to off-the-shelf equipment is outside the short-term feasibility scope of this study.
Long-term solutions may differ.
Environmental Concerns
Both methods require feed-water pre-treatment and product post-treatment. Filtration requires
more treatment to prevent membrane fouling; usually biocides and other additives, although pre-filtering
is emerging as an alternative (NRC 2008, WHO 2007). Desalted water is soft with low alkalinity. Carbon
dioxide, calcium hydroxide or other substances must be added to product water to prevent excess
infrastructure wear. Any chemical treatment creates a potential hazard which must be addressed. Both
methods produce concentrate, which also generates ecological hazards. Environmental issues are
discussed at length in Desalination for Safe Water Supply (WHO 2007) in which potential impacts are
categorized in four areas: 1) source water acquisition, 2) produced freshwater, 3) process waste and
concentrate management, and 4) greenhouse gas emissions.
Relevant aspects of items three and four are addressed in this study. As mentioned earlier, water
is bound to energy through the water-energy nexus; a central motive in pursuing this study was the
assessment of greenhouse gas minimization while developing new water sources. Solar desalination
decouples water from greenhouse gas emissions, fundamentally side-stepping item four, but not item
three: plant waste and concentrate.
Modern desalination methods produce two product streams from feed-water: freshwater and
concentrate. Concentrate is usually discharged back into source waters, where temperature differences
and high salinity can have detrimental effects on local ecosystems. Concentrate can be eliminated
entirely by low recovery, removing nearly all liquid from feed-water, or forward osmosis energy
recovery. Typical seawater contains 35 grams of salt per kilogram of water, amounting to 1.6% of total
volume; a small portion, fit for solid waste disposal or industry. Complete liquid phase removal requires
minimum work four times that of zero recovery: 2.84 kWh/m3 for seawater. Current zero liquid discharge
(ZLD) technologies, such as crystallization or vaporization are additional to initial desalination, adding 20
kWh/m3 energy consumption and increased capital (e.g. Bond and Veerapaneni 2007). Models
developed in this study explore liquid discharge (LD) and ZLD methods. Perhaps the best option for
sweater desalination, forward osmosis energy recovery, has not been commercially developed. This
waste management technique was therefore not modeled, but it is considered in the discussion.
While solar power is an Earth-friendly energy producing method, like virtually all human
activity, it causes some environmental impacts such as manufacturing waste, eventual disposal, and site
construction. Solar energy impact can be minimized, along with cost, through sustainable manufacturing,
9 construction, and efficient solar conversion. The latter can be partially accomplished by exploiting areas
of high irradiance, such as the Southwest.
SOLAR ENERGY AND THE SOUTHWEST
The Southwest is bombarded with a tremendous amount of solar energy. On an annually
averaged day, Arizona receives 1.9 billion MWh of incoming solar energy, equivalent to 260 million tons
of coal, 6.4 trillion cubic feet of natural gas, or 1.2 billion barrels of oil (calculated from Renewable
Energy Atlas 2002 and National Renewable Energy Laboratory solar resource maps). California’s desert
region, about a sixth of the state, receives 300 million barrels-equivalent daily, most of which is reflected
back into space. Instead, a portion of this solar radiation can be collected and converted to work.
Accounting for radiative entropy production, theoretical solar energy-to-useful-work conversion
efficiency is limited to ≈ 93% (Wurfel 2002), i.e. in an isotropic process, 100 W hitting a surface can be
converted to 93 W of useful work, such as electricity, mechanical power or desalination. There are
additional limitations based on concentration optics, material restrictions, and other practical
considerations. Limitations included, converting a small portion of regional incoming radiation can
supply the Southwest and national power needs.
Converting solar energy to work, a desalination necessity, can be done in several ways. The
atmosphere is essentially a large, 2% efficient solar powered heat engine (e.g. M. A. Barranco-Jimenez et
al 1996, Devos 1992); wind energy is therefore solar energy with low overall efficiency, but global
collection area. Natural plant photosynthesis converts ≈ 1% of solar energy to combustible biomass (e.g.
Hall and Rao 1999). Solar energy can be converted to work at much higher efficiencies by thermal
concentration or photovoltaic effect.
Concentrated Solar Energy
Solar energy can be converted to work thermally just as a coal-fired power plant converts heat to
mechanical power and electricity. Sunlight radiation hitting a body raises the object’s surface
temperature according to Stefan-Boltzmann’s Law for grey body radiation (e.g. Petela 2010):
(2)
Where,
J = irradiance [W/m2]
ε = emissivity [-]
σ = Stefan-Boltzmann constant; 5.67×10⁻⁸
[W/m2-K4]
T = absolute temperature [K]
Maximum work any thermal system can generate is governed by temperature differences between
heat source and sink11
through Carnot efficiency, which is bound between 0 and 1 (e.g. Petela 2010):
(3)
Where,
T = absolute temperature [K or R]
11 Like a boiler and condenser, respectively.
10
Theoretical efficiency can be raised by increasing source temperature (denominator on the
rightmost term of equation 3). Referring to equation 2, Stefan-Boltzmann’s Law, raising source
temperature by radiation heat transfer requires a decrease in emissivity and an increase in incident
radiation per unit area ( ). Solar radiation is concentrated to raise incident radiation per unit
area, which subsequently raises source temperature, increasing maximum possible conversion efficiency
(Conventional solar stills were disregarded in this study because of low operating temperature differences,
leading to low overall thermal efficiencies and poor economics at moderate and large scales) .
Increasing radiation per unit area proportionally increases temperature to the fourth root (equation
2). Theoretical temperature limits and subsequent efficiencies are reached when sunlight is fully
concentrated. Based on the Earth-Sun solid angle, theoretical concentration is limited to 46,165, i.e. a 1
m2 area collecting incoming Sunlight can be focused onto an area 1/46,165 m
2 (Landsberg and Baruch
1989). Prior to reaching 93% solar-to-work conversion by full concentration, material properties such as
strength and melting point become a limiting factor. With current materials, literature reports
concentrated solar thermal maximum efficiencies above 60% and below 85% (e.g. Price et al 2002,
Smestad et al 1990); far higher than other renewable energy sources. Summarizing concentrated solar
thermal principles:
1) Maximum theoretical work increases with increased source temperature
2) Maximum temperature is proportional to irradiance
3) Concentrating solar radiation increases source temperature and consequently, overall possible
efficiency
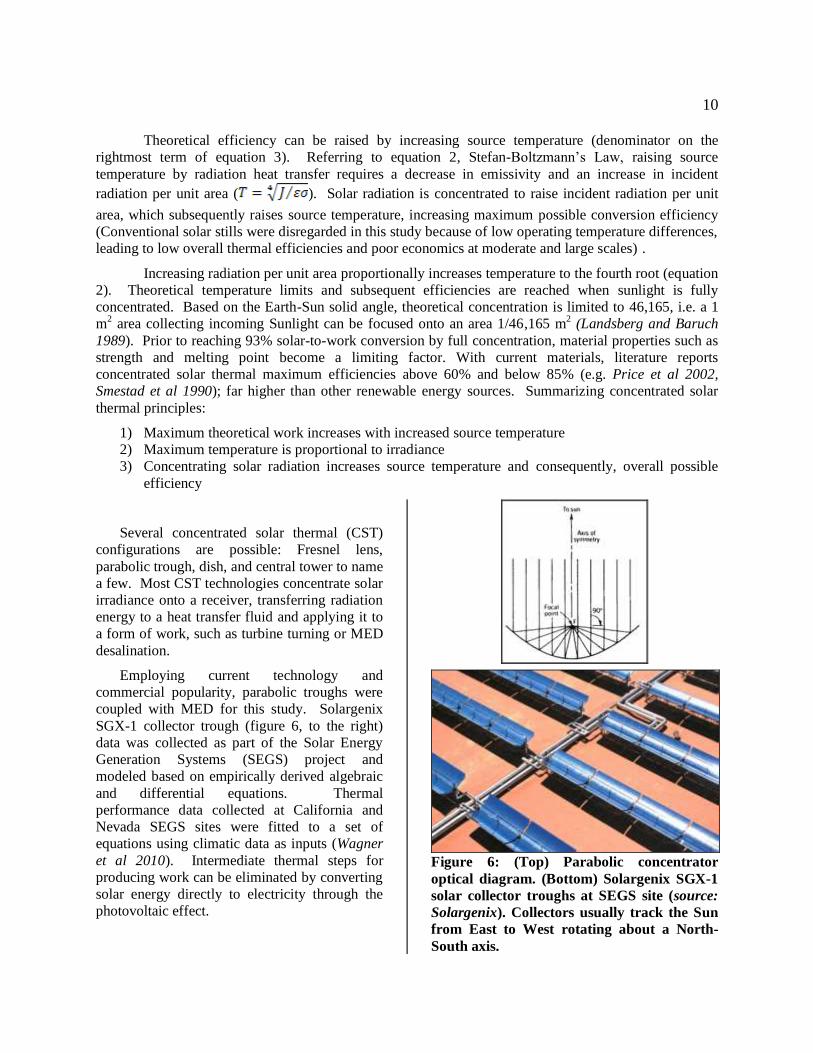
Several concentrated solar thermal (CST)
configurations are possible: Fresnel lens,
parabolic trough, dish, and central tower to name
a few. Most CST technologies concentrate solar
irradiance onto a receiver, transferring radiation
energy to a heat transfer fluid and applying it to
a form of work, such as turbine turning or MED
desalination.
Employing current technology and
commercial popularity, parabolic troughs were
coupled with MED for this study. Solargenix
SGX-1 collector trough (figure 6, to the right)
data was collected as part of the Solar Energy
Generation Systems (SEGS) project and
modeled based on empirically derived algebraic
and differential equations. Thermal
performance data collected at California and
Nevada SEGS sites were fitted to a set of
equations using climatic data as inputs (Wagner
et al 2010). Intermediate thermal steps for
producing work can be eliminated by converting
solar energy directly to electricity through the
photovoltaic effect.
Figure 6: (Top) Parabolic concentrator
optical diagram. (Bottom) Solargenix SGX-1
solar collector troughs at SEGS site (source:
Solargenix). Collectors usually track the Sun
from East to West rotating about a North-
South axis.

Photovoltaic Power
Solar energy can be converted directly to electricity through the photovoltaic effect: radiation hitting
adjacent positively and negatively doped semiconductors force electrons loose, creating a voltage drop
across the medium, or cell. Direct current can be drawn from cells by affixing conductors across the
medium. Multiple cells configured in a plane create a solar panel or module; multiple connected modules
are called an array. Photovoltaic (PV) solar power is bound by the same greater limitations as all solar
energy conversion systems, although, at the system level they functionally differ from solar thermal
power. Literature suggests ultimate efficiencies between 60% for non-concentrating cells and 85% with
full concentration (e.g. Wurfel 2002, Henry 1980, Reis 1981, Turner 2006, Devos 1981).
Modern commercial solar cells are typically
18% peak efficient; 100 W of solar radiation
hitting a solar panel will be converted to 18 W,
at most. As a result of manufacturing subsides,
recent photovoltaic trends favor low cost high
volume PV cells rather than high conversion
efficiency. Given prevailing trends, low cost flat
plat PV collectors were chosen for the model as
opposed to high efficiency panels or
concentration. PV cells benefit from
concentration as well, but system performance is
not linked to cell temperature as with solar
thermal power systems. Concentration increases
photon intensity per unit area, increasing the
number of photons available to free electrons.
Compared to thermal systems, concentration is
not as necessary for economical work extraction.
This study couples RO desalination with a
modeled version of SunPower 305 WHT PV
panels (figure 7). PV performance data
collected over a 12 year period was fitted to a
series of empirically based equations, similar to
the trough model mentioned above (King 2004).
Figure 7: (Top) Conceptual diagram of
photovoltaic cell. (Bottom) SunPower WHT
PV panel (source: SunPower).
METHOD
Blythe California was selected as the solar collection point. The location was chosen based on its
representative Southwest climate, suitable for solar energy conversion attributable to high irradiance with
little cloud cover and virtually no snow. Blythe has a daily average irradiance of 7.223 kWh/m2/day
(2636.3 kWh/m2/year). Data generated using this site is suitable for qualitatively analyzing solar potential
at many Southwest locations, including coastal locations in Mexico. However, the data does not describe
coastal California or some high altitude regions, with prolonged snow cover.

12 Ten solar desalination plants were modeled. Individual models were selected to cover reasonable
configuration diversity, giving short-term cost a complete view12
. Each model covers a likely
combination of current solar technology, desalination method, desalting volume, feed-water salinity, and
waste management technique. In total, they offer a holistic view of Southwest solar desalination short-
term feasibility at moderate to large scale13
.
Model Structure
The models were conceptually constructed employing two basic configurations: concentrated
solar thermal multi-effect distillation and photovoltaic reverse osmosis (CST-MED and PV-RO,
respectively). At the system level, CST-MED desalts by concentrating sun-radiation on an absorber,
transferring heat to a fluid and supplying it to an MED desalination process. Saline feed-water is passed
through a series of vaporization effects, and separated into pure water distillate and concentrate. The
concentrate is discharged or sent to a ZLD process (figure 8, below).
PV-RO desalts by collecting solar energy with photovoltaic panels, inverting DC-to-AC and
supplying pump electricity. Saline feed-water is forced through parallel filter banks, separating
freshwater permeate and concentrate (figure 9, below). Like CST-MED, concentrate is discharged or sent
to a ZLD process. ZLD specifications were treated separately from the initial desalination process.
Associated capital and energy consumptions were applied as off-the-shelf components, limiting short-
term capital and energy performance. Desalination performance was assumed to operate in constant
proportion to solar conversion. For example, seawater RO requires 2.5 kWh/m3— a PV power plant
supplying 5 kWh of electricity produces 2 m3 of fresh water. This relationship type was assumed linear
and instantaneous at all scales; no system acceleration, deceleration, storage, or lag was considered.
Desalting volume is purely a function of load and solar power performance.
12 For example, model one produces 40,000 m3(of freshwater)/day from brackish sources using photovoltaic powered reverse
osmosis with liquid concentrate discharge. Model ten produces 300,000 m3/day from seawater using multi-effect distillation with
zero liquid discharge. Both deliver alike consumable products with different methods and dissimilar economics. Some models
share process aspects; 13
Climate data was obtained from the 1991-2005 National Solar Radiation Database (NSRD). The NSRD contains hourly
climate data, collected and modeled. Primary solar data is modeled with a hybrid of the SUNY satellite-to-irradiance model and
METSTAT; a ground based model which interpolates data between meteorological observation points using a deterministic
algorithm (Maxwell 1997, Schillings et al 2002). SUNY data are verified at several ground-truth stations, and generated using
measured inputs from Geostationary Operational Environmental Satellites (GOES) at 1 km x 1km resolution (Perez et al 2009). NSRD primary meteorological data was obtained from the National Climate Data Center (NCDC). The NCDC data are also
interpolated between meteorological observation points at 1 km x 1 km resolution. Based on a confidence algorithm, a single
time-step may contain NSRD data from any or all aforementioned sources: SUNY, METSTAT, and NCDC (Wilcox et al 2007).
The NSRD data are compiled to produce a seamless typical meteorological year (TMY) compositing several possible candidate months into a representative year. For example at Blythe, data exists for 12 years. Of 12 Januaries possible, January 1995 may
be selected as most representative of all observed Januaries. Data for a different month, say July, may come from July 2003.
The final product, 12 months of climate data suitable for solar modeling, may contain monthly data from different or similar
years for each month. TMY’s are assembled based on a four step process developed by Sandia National Laboratories (Hall et al 1978). Irradiance cumulative density functions (CDF) are calculated for each candidate month; those exhibiting CDF’s closet to
the long-term CDF are ranked in respective order. The highest ranked also exhibiting dry bulb temperature frequencies closest to
the long-term average becomes the representative month, which is assembled with others to form a TMY. Since 1961, three
TMY datasets have been generated; the third, TMY3, was used in this study.
Blythe is considered a class II site; data is seamless, but 12 years are available, opposed to 15 required for class I sites. Each
location contains 8,760 lines of data and 68 fields (a complete descriptive list can be found in Wilcox and Marion 2008). TMY3
primary data are: 1) total global radiation, 2) direct solar radiation, 3) diffuse-horizontal radiation, 4) dry-bulb temperature, 5)
dew-point (wet-bulb) temperature, 6) humidity, 7) aerosol optical depth (presence and opaqueness of cloud cover), 8) precipitation, and 9) ambient pressure.

13
Figure 8: Concentrated solar thermal multi-effect distillation (CST-MED) conceptual system
diagram. Thermal energy is collected by parabolic troughs concentrating radiation on an absorber
which transfers heat to a fluid. Steam is created and supplied to a MED desalination process.
Condensate is returned to the solar collection field. Saline feed-water is passed through a series of
vaporization effects, and separated into pure water distillate and concentrate. Both product
streams are used to preheat feed-water. Concentrate is discharged or sent to a ZLD process.
Distillate is treated and sent to consumers.
Solar Desalination Model Simulation
Solar conversion performance was simulated using the System Advisor Model (SAM) software
package, developed by the National Renewable Energy Laboratory (NREL)14
. Solar plants were sized
iteratively. Desalination demand was assumed to be constant over the year and annual desalination
volumes were used to specify energy consumption, as irradiance is an annual cycle. Knowing target
energy production, a design point insolation was selected for the collection location, Blythe, giving a
baseline energy production. The simulation was run, and adjusted up or down to meet required load15
.
14 SAM runs a financial model and separate time-series simulator, TRNSYS, which itself executes several component based sub-
models. Component models are algebraic or differential equations solved at hourly time steps with built-in convergence criteria and smoothing; a transient thermal system, like a solar power plant, configured improperly cannot converge, although it may run
poorly. Among other items, users specify climate data and solar technology specifications (mentioned above); TRNSYS inputs
TMY3 data at hourly time steps, calculating annual energy output, which SAM extrapolates over the lifecycle term. 15 Model one for example, was sized to deliver 40,000 m3/day at 0.5 kWh/m3, requiring 7,300 MWh/year. Given the Blythe
climate data, model one annual energy demand corresponded to a 3,650 kWdc design point array size. The PV-RO simulations followed this protocol closely. The CST-MED simulations required manual post-processing. SAM was developed primarily for
electricity production, which PV-RO uses; however, CST-MED consumes process heat. Work and capital dedicated to the
electricity producing power block was disregarded. For CST-MED, SAM was essentially used to model parabolic trough
collector field thermal performance. In order to size a field, annual thermal energy was exported, given a work efficiency of 35% — half the optical efficiency—and applied to MED desalination. This process was iterated until the plant size was appropriate.

14
Figure 9: Photovoltaic reverse osmosis (PV-RO) conceptual system diagram. Solar energy is
collected by photovoltaic panels and converted to alternating current electricity. Saline feed-water
is pumped through parallel filter banks, separating it into fresh water permeate and concentrate.
Recovery devices transfer energy to the feed-water from both product streams. Concentrate is
discharged or sent to a ZLD process. Permeate is treated and sent to consumers.
Financial Model
SAM’s built-in financial model covers a wide range of finance options, too detailed and specific
for the purposes of this study. The built-in model was generally disregarded and replaced with a custom,
spreadsheet based model. In place of SAM’s financial model, a simplified initial capital and amortization
approached was used to calculate total cost and payback for each configuration, treating desalting and
solar capital separately. Initial capital was estimated by means of current industry pricing (e.g. GWI
2010, O'Connell et al 2006). Model financials are constructed as an outright ownership with borrowed
money; conceptually, a water provider buys a solar desalination plant using a loan, paid off in annual
increments16
. Total cost was calculated using annuity present value:
(3)
Where,
TC = total cost [$]
n = term [years]
IC = initial capital (cost) [$]
i = annual interest rate [-]
16 This approach was chosen as opposed to more complex financial-owner structures like power purchase agreements, design-
bid-build-own-operate-transfer, or target internal rate of return. Such structures are important, but can potentially bog down
substantive points.

15
Solar technology is competing with other energy sources—the primary data extracted from the
models is solar energy cost, which was calculated based on expected plant life through the levelized cost
of energy (LCOE): total cost divided by total energy generated [$/kWh] or total cost divided by total
freshwater generated [$/m3]. Payback period and net present value (NPV) for solar energy relative to
traditional sources was calculated at common energy prices. Standard federal renewable energy subsidies
were applied to the solar power plant, however, no other subsidies or incentives for solar energy or
desalination were considered. Non-borrowed costs, like operation and maintenance were bundled
together for both plants. Assuming PV plants need nominal maintenance, and CST-MED colocation
ensures operating costs will be shared; CST-MED operational cost will insignificantly increase over
conventional MED. Desalination plants are not fully commoditized; capital and operational costs vary
widely. Within this study, short-term feasibility analysis treats solar technology and desalination
somewhat separately: costs for each are initially generated individually, and short-term emphasis is placed
on using solar energy as an alternative to traditional sources for desalination. Current cost projections
factor less in the long-term, as technology can exhibit abrupt price drops. Again, this study assumes short
and long-term conclusions may differ.
Model Assumptions
The simulations assume water produced can be supplied when it is produced. Solar insolation
levels are seasonal and therefore solar power plants produce more energy in summer than winter. A solar
powered desalination plant would potentially produce more fresh water during periods of high
insolation—perhaps in disproportion to demand. The model does not consider demand-supply mismatch.
This assumption was validated conceptually by assuming a reservoir is available, storing excess water
over the course of a year, much like a dammed lake. For grid-tied PV systems it is also possible to sell
excess energy and buy supplemental energy, essentially creating a pseudo reservoir. Conveyance was not
considered in any model either; it may or may not be a limiting factor. For dispersed brackish
groundwater desalination, conveyance would likely be of little importance. However, for major seawater
desalination operations intent on delivering water inland, conveyance cost may be high or even
prohibitive.
Model Output
SAM outputs hourly data using TMY3 inputs over the solar plant lifecycle term. Each model
contains 8,760 lines of hourly performance output data plus additional information addressing system
degradation, lifecycle and financials. Data was exported and manipulated to reduce volume, summarizing
important information.
RESULTS
To provide a notion of solar model performance, a six day hourly sample output for model one is
presented in figure 10, below. As the figure shows, solar conversion is periodic and predictable (a distinct
solar energy advantage) but viewed yearly, daily irradiance oscillations change magnitude significantly,
leading compound periodic output. Annual model one performance is shown below in figure 11,
although compound oscillations are not visible. Other models display similar outputs. Relevant SAM
output was exported to the custom financial model which calculated solar energy cost, then solar
desalination cost.

Figure 10: Sample of hourly simulation
output for model one, spanning six days in
May of TMY3, Blythe CA. Model one is
configured for desalting brackish water using
photovoltaic reverse osmosis and liquid waste
discharge.
Figure 11: Annual simulation output for
model one showing energy production and
cumulative freshwater conversion. At the
monthly time-step resolution shown here,
daily oscillations are not visible.
Energy Cost
Desalting Levelized Cost of Energy (LCOE)—which is distinct from total desalination cost and
discussed below—varied from 0.034 to 1.346 $/m3
(of product water) for brackish feed-water, and 0.1768
to 1.346 $/m3 for seawater, assuming a 30 year power plant life. PV-RO desalts water at the lowest rate,
however, CST-MED generates the lowest cost per kWh of work, at 0.009 $/kWh-heat. CST power has
much shorter payback periods and higher NPV, using a 30 year lifecycle. Resulting differences in
desalination energy costs are purely due to current RO and MED energy requirements. Applying current
technology constraints, PV-RO with liquid plant discharge is the most energy effective solar desalination
method; PV-RO ZLD is the least (for a detailed cost table, contact the author).
Solar Desalination Cost
Capital and operating costs for typical desalination plants were used in conjunction with
estimated solar LCOE (GWI 2010). Desalination costs follow the same trend exhibited by solar
financials: PV-RO with liquid discharge is least expensive. Solar desalination total cost itemization is
presented in Table 1, below. As an addendum to the table, desalination unit costs using traditional energy
sources at typical rates are presented below solar costs. CST-MED offers the greatest economy over
traditional sources, but due to current process energy requirements, MED product water is 30% more
costly than RO, if concentrate is discharged from the plant. ZLD filtration on the other hand is expensive:
PV electricity costs more than CST process heat; PV-RO ZLD consumes energy on scale with CST-
MED, overtaking distillation cost. As Table 1 shows, utilizing solar energy for desalination is feasible.
Short and long-term viability and solar desalination potential are discussed in the next section.

17 Table 1: Solar desalination costs using Southwest climate data for each model at typical plant costs
(Desalination plant costs: GWI 2010)
1 2 3 4 5 6 7 8 9 10
- BrackishBrackish or
SeaBrackish
Brackish or
SeaSea Sea
-
-
- LD ZLD LD ZLD LD LD LD LD ZLD ZLD
m^3/day 40,000 40,000 300,000 300,000 40,000 300,000 40,000 300,000 40,000 300,000
Plant Cost $ 16,520,000 122,320,000 107,700,000 792,600,000 61,160,000 396,300,000
Annualized capital costs 0.08 0.29 0.07 0.29 0.29 0.25 0.22 0.22 0.22 0.22
Parts/maintenance 0.04 0.04 0.04 0.04 0.04 0.04 0.01 0.01 0.01 0.01
Chemicals 0.04 0.06 0.04 0.06 0.06 0.06 0.08 0.08 0.08 0.08
Labor 0.03 0.03 0.03 0.03 0.03 0.03 0.08 0.08 0.08 0.08
Membranes 0.02 0.04 0.02 0.04 0.04 0.04 0 0 0 0
Solar thermal energy 0 0 0 0 0 0 0.373 0.371 0.539 0.557
PV electric energy 0.034 1.346 0.034 1.346 0.168 0.168 0.06 0.06 0.06 0.06
ZLD* 0.00 0.70 0.00 0.70 0.00 0.00 0.00 0.00 0.70 0.70
$/m^3 0.24 2.50 0.23 2.50 0.63 0.59 0.82 0.82 1.69 1.70
@ 0.02 $/kWh - - - - - - 1.25 1.25 2.35 2.35
@ 0.04 $/kWh 0.23 1.96 0.22 1.96 0.56 0.52 2.05 2.05 3.55 3.55
@ 0.07 $/kWh 0.25 2.56 0.24 2.56 0.64 0.60 3.25 3.25 5.35 5.35
@ 0.1 $/kWh 0.26 3.16 0.25 3.16 0.71 0.67 4.45 4.45 7.15 7.15
@ 0.2 $/kWh 0.31 5.16 0.30 5.16 0.96 0.92 - - - -
*represetative cost without energy; ZLD energy costs were bundled in solar costs
**@ given energy consumption rates and lifecycle
UnitsFiltration Models
RO
PV
Distillation Models
Sea
MED
CST
Model Description
Desalintion type
Solar Type
Waste manangement
Plant Size
Trad
itio
nal
en
erg
y
de
sali
nat
ion
pri
ces
$/m^3
Total Solar Desalintion Cost**
$/m^3
Saline water type
Typ
ical
De
sali
nat
ion
pla
nt
cost
s
DISCUSSION
Solar desalination viability must be analyzed in the context of alternatives. Results suggest solar
energy is a viable alternative to traditional energy sources for desalination in the Southwest under the
stated regime—however, expending capital performing a function the hydrologic cycle already does to
some degree may be challenging to accomplish cost effectively. Moreover, modern Southwest
communities have a plethora of alternative water augmentations. Assessing potential short and long-term
roles of solar desalination in the Southwest entails considering regional water infrastructure, alternatives
and institutional arrangements necessary to apply, manage and distribute water in the Southwest.
Water in the Southwest
Southwestern communities have always faced water scarcity challenges. Drought is largely
believed to have forced Anasazi emigration from the four corners area during the twelfth and thirteenth
centuries; original Occidental homesteaders west of the 100th meridian were often the first of their
ancestry to need irrigation (e.g. Benson et al 2006, Reisner 1986). As urban populations in the West
boomed, water challenges continued and swelled, leading to large scale measures (large dams, canals,
active water resource monitoring and management for example). Modern Southwest communities rely on
a sophisticated infrastructure to supply this precious resource in such an arid climate, necessitating
government institutions on all levels to bolster the region through costly water projects and management.

18
While large water projects helped shape the West, these ventures also have consequences and
shortcomings. Lake Mead and Lake Powell supply surface water to millions of Southwesterners while
concealing and destroying two massive, stunning canyons beneath their waters. Riparian area loss
associated with dams can have significant, negative impacts on local ecosystems (e.g. New 2008).
Furthermore, fluctuations in renewable water supply limit surface water reliability. The Southern Nevada
Water Authority for example, funded a third intake to extract water from Lake Mead because the others
are potentially above the waterline in extreme drought (SNWA 2010). The Southwest also exploits
substantial quantities of groundwater; western states are dotted by many thousands of production wells
for urban and rural consumers—many tap aquifers not renewable on human timescales (e.g. Reisner
1986). Subsidence resulting from groundwater overdraft became such an issue in Arizona, the state water
resources department created an active monitoring group (the AzLSG). There are many other examples of
the consequential nature of modern Southwest water allocation.
Yet Southwest populations thrive: for decades water extension efforts have enabled people to
live in the Sunbelt without fully reckoning with their unsustainable use of water. As a potential new
source, desalination must economically17
coordinate with alternatives; groundwater, dams, water
transfers, and conservation-reuse are the most prevalent water augmentations in the Southwest.
Non-saline groundwater supplies the Southwest with 31% of its total freshwater withdrawals18
(USGS 2005). The Southwest relies on a network of wells which mine regional aquifers, giving local
communities access to water with limited, unsustainable recharge; turning on the faucet in the Southwest
typically drains unsustainable aquifers. In short, current groundwater practices are inadequate (e.g. USGS
2005). In addition, aquifer overexploitation can wreak havoc at the ground surface. Fine grained clay
and silt aquitards compress when desaturated and permanently reduce pore volume, triggering subsidence
(e.g. Waltham 1989). Over the past half-century western states have begun to shift away from
groundwater reliance as much as possible, better utilizing surface water and conservation to increase
supply. Still, groundwater remains a key resource, and cheap. Pumping groundwater at 200 ft requires
0.24 kWh/m3 on average, or using a nominal energy rate
19, 0.0168 $/m
3—14 times less than desalting
brackish groundwater. However, desalting brackish water may extend a regions net water yield by many
years, especially in dispersed, remote locations.
Southwesterners withdraw the other 69% of their water from surface sources (USGS 2005). To
extend surface water, western states began building large dams during the twentieth century through
federal support. Dams were once considered environmentally benign; although this view has been
increasingly criticized as being shortsighted (e.g. New 2008). The era of large dam construction in the
Southwest seems to be over, but those dams already built have exceptional lifespan. Southwest dam
infrastructure is likely to stay in its current form for the foreseeable future. Any short or long-term water
alternatives, like desalination, must work with current dam infrastructure.
Water suppliers have been able to further extend regional supply for some consumers by
purchasing water rights. Western states use prior appropriation for water rights, essentially stating “first
17 Conventionally, terms economic and financial can be used interchangeably; in this study, those terms overlap, but are
distinguished: a commodity resource like water may have an explicit cost different from its economic cost. For example, a portion of nonrenewable water might have a lower metered cost, but negative economic impact in the form of subsidence,
greenhouse gas emissions, unsustainability, and so on; whereas the same portion of solar desalinated water may be sustainable
and benefit economically, yet bill higher. Under this regime, the financial cost and greater economic impact of similar products
differ, a view de-commoditizing freshwater.
18 Withdrawals are extracted water, not necessarily treated or consumed.
19 0.07 $/kWh

19 in time, first in right”. When water is scarce, junior appropriators, those with rights claimed later in time,
must give up their portion of water to senior or less junior right holders. This right can be sold and
purchased as property, transferring an appropriator’s allotment and seniority to a new user (e.g. Sullivan
et al 2011). Water suppliers in the Southwest have adopted a practice of purchasing water rights from
farmers to supply urban users; typically leaving farmland dormant, or purchased in addition to the water
right and fallowed.
Water transfers also encompass water moved from one basin to another; usually doing so by a
combination of canals and dams. At a regional scale, transfers are not a new source of water. They are
often contentious as well. Although water rights are property in the traditional sense, water is not. The
hydrogeology affecting a series of rights may not necessarily fit with the intended transfer, leading some
consumers to worry that they must do without. Water availability is an underpinning factor of a
Southwestern community’s ability to thrive: no water, no economy. There are additional cautions and
limitations regarding water transfers. When diverted surface water rights are repurposed for urban use
the quality of water delivered to downstream appropriators typically degrades (e.g. Sullivan et al 2011).
Farmers or municipalities accustomed to receiving water containing mostly fertilizer runoff now receive a
blend of surface water and treated sewage, leading to quarrels, public outcry and additional treatment
cost. Food security is another water transfer issue. Whenever farmland is fallowed through water right
transfers, crops formally grown there are frequently outsourced to a different country, effectively
reducing the United States’ ability to produce food, or regulate food production (e.g. NRC 2008). Apples
once grown in Arizona may be imported from Mexico or elsewhere, where labor laws and agricultural
practices are further from the eye of regulators and consumers. Often, when compared to the original
production location, more transportation energy is expended as well, increasing agricultural carbon
footprint. Transporting food over longer distances also increases the potential for transporting foreign
and invasive species. Water transfers are a useful tool, but negatively affect water quality; shift economic
potential of Southwestern communities from local agriculture; and increase greenhouse gas production
and reliance on foreign agriculture. Like groundwater and dams, water transfers have augmented supply
in the Southwest, but there are limited buyable rights; rights not structured around sustainability, simply
ordered through a superimposed water market.
Perhaps the most effective augmentation tool is conservation and reuse (e.g. NRC 2008, Sandia
and USBR 2004). Conservation is playing a central role in Southwestern water supply because cutting
water consumption increases supply by an equal proportion and some efforts are effective enough to have
a negative overall cost. For example, reducing household consumption by half is equal to supplying
enough water for another household of equal size (e.g. Sandia and USBR 2003). Whenever water is
supplied, it needs to be treated, conveyed, possibly heated, and treated again. By reducing the amount of
water used, infrastructure life is extended, energy consumption is reduced, and less treatment per user is
required. Well-functioning low-flow toilets pay the user. Reducing shower length reduces water use,
pumping power and heating cost. The compound effect is a negative cost.
Water reuse—treated waste water—has also augmented supply. Most current practices treat
sewage and storm water at a central plant and return it to areas of use through special infrastructure
(separate pipes)20
. Treated water is used mostly for ornamental irrigation like golf courses and lawns, but
new uses are emerging as technology matures. Reuse has the distinct advantage of being the only water
augmentation option that increases with increasing use and population.
Conservation and reuse are effective tools in enhancing water resources; however, each is limited
as a pseudo new source. Much of the consumed water in the Southwest is overdraft groundwater;
20 Reuse cost can be reduced by treating water on sight; keeping and treating grey water while sending black water to a central treatment facility for more sophisticated reclamation (e.g. Sandia and USBR 2003).
20 conservation and reuse extend aquifer yield, but do not replace the source. Conservation and reuse
amplify water resources within limits.
Despite effective management practices, augmentation efforts have restricted applicability;
current water practices in the Southwest are unsustainable. The only long-term Southwest sustainability
solution is using renewable water supply as efficiently as possible and introducing new, sustainable water
sources (e.g. NRC 2008, Sandia and USBR 2003). Solar desalination is a sensible option.
Solar Desalination Short-Term Feasibility
Model results show off-the-shelf solar desalination is a promising alternative to traditionally
powered desalting methods, favoring filtration and liquid discharge methods for sea and brackish water.
However, concentrated solar thermal multi-effect distillation (CST-MED) methods produce zero –liquid
discharge (ZLD) more cost effectively. Short-term feasibility is a function of climate, method, subsidies,
capital ability, competition energy costs, and use regime.
Potential model pitfalls and limitations are found in use regime and cost assumptions. Typically,
only private entities can capitalize on subsidies whereas large water providers are usually government
agencies. Alternative funding structures can be created, allowing private, subsidizable utilities to step in
as power plant purchaser. However, privately funded ventures seek maximum return on investment, and
most likely offer little, if any, cost advantage over grid power. An alternative at the institutional level
may involve creating government owned corporations able to accept subsidies.
Capital ability and traditional energy cost are also important feasibility factors. Levelized Cost of
Energy (LCOE) was calculated using a 3% interest rate over 30 years; a small rate increase can change
solar competitiveness. In a similar way, competition energy prices can change feasibility. Solar power’s
economic feasibility hinges on traditional energy costs being higher than LCOE. Using photovoltaic
reverse osmosis (PV-RO) model parameters, solar filtration desalination becomes uncompetitive at
traditional energy prices below 0.067 $/kWh. Short-term feasibility as a function of financial structure
can be increased by acquiring subsidies, securing a low interest rate, and increasing plant life (lowering
LCOE). Little can be done actively about competition energy; prices are set by a global market. Though,
this dilemma may not be an issue: at the time of this study, Southwest water providers were paying
higher rates for electricity than photovoltaic LCOE: between 0.075 and 0.12 $/kWh depending on
interruptibility (e.g. TEP 2011). Cost-volatile natural gas was being sold to public utilities for 0.66
$/therm—double the cost of CST process heat in the Southwest.
Use regime must also be considered. Models assumed an instantaneous, linear relationship
between solar irradiance and desalination. Modern equipment usually requires steady state operation at
specified rates; whereas solar energy is transient. To better complement off-the-shelf desalting
equipment, system storage may be required, increasing costs21
.
Conveyance also plays a significant role. Conveyance infrastructure in the West tends to be
substantial, as mentioned above. Desalted water conveyed inland could easily become infeasible using
off-the-shelf methods. Still, held closely to the stated regime, solar desalination is a cost effective
alternative to traditionally power desalination.
Solar desalination cost under the stated regime ranged from 0.24 $/m3 for brackish desalination
with liquid discharge to 2.50 $/m3 for filtration ZLD configurations. To put those figure in perspective,
21 For example, the Yuma Desalting Plant operates based on Colorado River salinity, not the Sun. While it may be financially
beneficial to power the RO plant with photovoltaics, some form of storage would have to be considered, raising LCOE. The storage could be battery banks, a water reservoir, or a power agreement with traditional electricity suppliers.

21 the Central Arizona Project delivers Colorado River water to southern Arizona for approximately 0.12
$/m3, and Tucson Water bills residential consumers 0.78 $/m
3 (CAP Annual Report 2010, Tucson Water
Rate Schedule 2012). Current solar desalination costs are above water transferring charges yet below
billing rates for urban customers. Western farms were charged a range of rates, from 0.00455 to 0.0179
$/m3 for off-farm surface irrigation; though, these rates are heavily subsidies (USDA 1999)
22.
Furthermore, as stated in the introduction and objectives, short-term solar desalination analysis focuses
primarily on solar energy as an alternative to traditional power options on a financial basis only.
Comparing current desalination costs directly to other options is useful, but somewhat detracts away from
the central point of exploring solar radiation as an alternative fuel for desalination as a method of solving
water and energy issues simultaneously.
In the context of alternative water augmentations, solar desalination is more costly, but
potentially more ecofriendly. Short-term feasibility depends on the greater economic and political value
of sustainable water. Groundwater is less expensive, but nonrenewable. Dams and water transfers are
effective but limited. Conservation and reuse are effective and generally inexpensive, but ultimately
limited as well. To summarize, off-the-shelf solar desalination is feasible and competitive with
traditionally power desalination, yet remains more expensive than efficient use and unsustainable
practices. In other words, Southwestern communities considering brackish and seawater desalination
should also consider solar power as an energy source for the process; however, it is unlikely that the
explicit cost of solar desalination using off-the-shelf components will be less costly than using
conservation and unsustainable alternatives. Solar desalination is distinguished from alternative water
augmentations as having the prized characteristic of sustainably creating a new water source.
Desalination is the only new water source option for Southwest basins; solar desalination is a new water
source that also addresses the water-energy nexus and greenhouse gas emissions. Long-term viability
follows similar reasoning.
Solar Desalination Long-Term Viability
Based on model results, off-the-shelf solar desalination appears to be a capable alternative to
traditionally powered methods, particularly for filtration and liquid discharge type desalination.
Assuming proper waste treatment, solar desalination is more costly than conservation and reuse, but
22 A thorough investigation of western water total costs is a study in and of itself. Agricultural consumers typically do not pay
true water costs, so comparing the explicit cost of an alternative water resource option to subsidized rates can be misleading. Western water funding policy relies on a broad implicit principal of adding cost elsewhere in the economy in order to ensure
agriculture is profitable and therefore available to produce food. The food is consumed by tax payers who all share the cost of
water and pay a discounted rate for groceries at market. Financial benefit is not guaranteed, but cost efficiency can be gained by
centralizing water appropriations; payback is theorized to occur by allowing consumers to generate economic gain spending less on food and more in other sections of the economy which are more likely to expand wealth at a higher rate, like technology.
The explicit cost of a particular approach to resource attainment—water or otherwise, is often disconnected from the greater
economy of the approach. For example, some agricultural consumers downstream of Glen Canyon Dam may pay 0.079 $/m3 for
off-farm surface water, but the actual cost is the rate plus subsidies plus one canyon. How much did the canyon cost? In 1966, when Glen Canyon Dam shut its diversions and began turning Glen Canyon into Lake Powell, the canyon had no assessed
financial value: it only offered the greater economic benefit of enhancing natural enjoyment of the environment. Today however,
natural enjoyment carries significant economic weight. The Grand Canyon has become ingrained as Arizona’s image to the
world; millions of tourists and hikers come to the state every year, generating huge sums of money. Yet the Grand Canyon was set for damming, to be buried underneath a manmade lake like its neighbor Glen Canyon (Hundley 1975). One could argue the
value of Glen Canyon to be on scale with the Grand Canyon, so the actual cost paid for irrigation generated by the dam would
have to include lost revenue (projected revenue minus actual revenue generated by Lake Powell operations). This theoretical
figure still would not address the implicit economic benefits of environmental preservation.
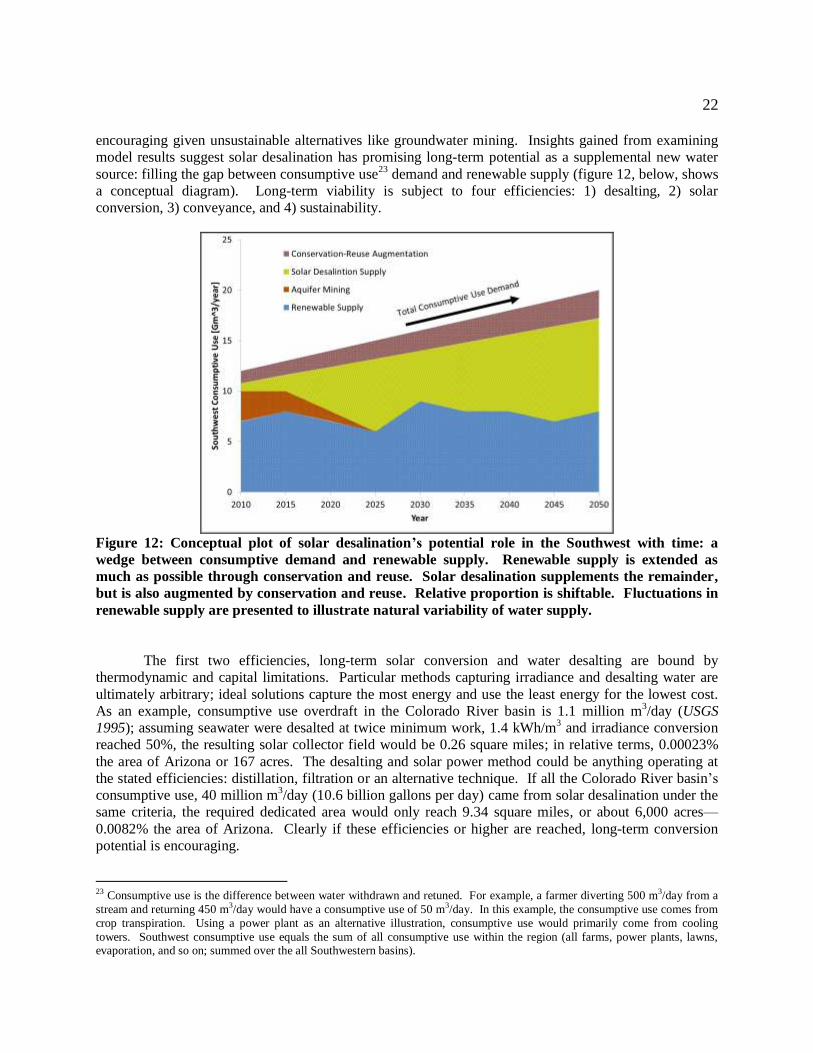
22 encouraging given unsustainable alternatives like groundwater mining. Insights gained from examining
model results suggest solar desalination has promising long-term potential as a supplemental new water
source: filling the gap between consumptive use23
demand and renewable supply (figure 12, below, shows
a conceptual diagram). Long-term viability is subject to four efficiencies: 1) desalting, 2) solar
conversion, 3) conveyance, and 4) sustainability.
Figure 12: Conceptual plot of solar desalination’s potential role in the Southwest with time: a
wedge between consumptive demand and renewable supply. Renewable supply is extended as
much as possible through conservation and reuse. Solar desalination supplements the remainder,
but is also augmented by conservation and reuse. Relative proportion is shiftable. Fluctuations in
renewable supply are presented to illustrate natural variability of water supply.
The first two efficiencies, long-term solar conversion and water desalting are bound by
thermodynamic and capital limitations. Particular methods capturing irradiance and desalting water are
ultimately arbitrary; ideal solutions capture the most energy and use the least energy for the lowest cost.
As an example, consumptive use overdraft in the Colorado River basin is 1.1 million m3/day (USGS
1995); assuming seawater were desalted at twice minimum work, 1.4 kWh/m3 and irradiance conversion
reached 50%, the resulting solar collector field would be 0.26 square miles; in relative terms, 0.00023%
the area of Arizona or 167 acres. The desalting and solar power method could be anything operating at
the stated efficiencies: distillation, filtration or an alternative technique. If all the Colorado River basin’s
consumptive use, 40 million m3/day (10.6 billion gallons per day) came from solar desalination under the
same criteria, the required dedicated area would only reach 9.34 square miles, or about 6,000 acres—
0.0082% the area of Arizona. Clearly if these efficiencies or higher are reached, long-term conversion
potential is encouraging.
23 Consumptive use is the difference between water withdrawn and retuned. For example, a farmer diverting 500 m3/day from a
stream and returning 450 m3/day would have a consumptive use of 50 m3/day. In this example, the consumptive use comes from
crop transpiration. Using a power plant as an alternative illustration, consumptive use would primarily come from cooling
towers. Southwest consumptive use equals the sum of all consumptive use within the region (all farms, power plants, lawns, evaporation, and so on; summed over the all Southwestern basins).
23
Conveyance (viability efficiency 3) issues are more complicated. Southwest communities tend to
be concentrated along water projects; 90% of Southwest inhabitants live in urban areas (census 2010).
Farmland tends to be clustered along water projects as well. Long-term conveyance viability capitalizes
on current infrastructure and management to the extent possible. Piping desalted ocean water to Las
Vegas for example is more costly than allowing the city to appropriate additional Colorado River water
from Lake Mead; desalting water for downstream appropriators often increases supply for those upstream
because most water along the Colorado River reach begins as snowmelt far upriver and tributary.
Optimal long-term conveyance solutions prevent downstream consumers from using nonrenewable
supply to the extent possible with least capital.
For instance, building a desalination conveyance network from the Sea of Cortez to Lake Havasu
may be an enormous project, but benefits are equally scaled: assuming existing canals can handle
expanded flow with relatively minor investment, the Municipal Water District of Southern California,
much of Southern Arizona, and most regional agriculture—nearly 30 million consumers, would no longer
consume basin water, making more water available as far north as the upper portion of the Central Valley
and Wyoming, and as far east as New Mexico and Colorado. Those few beyond the explicit and implicit
benefits of such a system could potentially exploit brackish groundwater, but are ultimately limited by
local supply. In the Southwest, communities falling under this situation are usually small water
consumers. Large water consuming operations would benefit from moving to areas implicitly or
explicitly serviced by a desalination supply network.
It may be necessary to revisit the West’s notion of water rights, sharing new infrastructure costs
across all those who benefit in the region, not just those who consume the water directly—a shared cost
structure increases solar desalination capability and the overall ability of the Southwest to economically
source water: an underpinning factor of regional vitality. The canal described here presents a unique
opportunity to bolster international relations with Mexico.
The last long-term viability element, sustainability (efficiency 4) is somewhat uncertain and
intricate24
. Solar desalination is fundamentally decoupled from the water energy-nexus in that no
greenhouse gasses are emitted; however, desalination still has the potential to generate waste. Minimum
work dictates that removing all liquid from seawater requires substantial energy per unit product, but
simply dumping brine back into source water is detrimental and unsustainable. True solar desalination
sustainability requires no waste. Potential no-waste solutions are likely to fall into one of two forms: 1)
plant waste is repurposed for industrial use, or 2) no net concentrate is generated. The latter requires only
a small amount of fresh water is removed from feed before returning to source or the overall process
returns waste to its natural state (seawater). Returning brine salinity to that of seawater is an attractive
option.
When desalting for the purposes of creating freshwater from seawater, energy must be supplied to
the system because of the relative energy states of freshwater and seawater; chemical potential is higher
for freshwater. Considering seawater waste management, the roles are reversed: brine is at a lower
energy state than seawater so forward osmosis is possible. The sea acts as an infinite reservoir of pure
water, while the brine creates a salinity difference across the filter which will last until dissolved ion
concentrations are equal on either side of the membrane. The energy can potentially be captured and used
to minimize net desalination process energy (desalination minimum work is the reversible portion of the
desalination process—some of the energy expended can be recovered).
Alternatively, recovered salts can potentially be repurposed for industrial uses, like sodium
batteries, molten energy storage, or hydrocratic generators to name a few. Industrial repurposing
24 As with many ecofriendly alternatives, disparity exists between financial costs and economic benefit; sustainability is often seen as optional.
24 necessitates a step beyond ZLD: zero discharge desalination (ZDD). ZDD entails ZLD scale energy;
however, waste repurposed as industrial fodder can be sold, transforming concentrate from a liability to
an asset. ZDD theoretically creates two beneficial product streams. Additional capital would be required
for any of the preceding waste management techniques, but long-term viability hinges on sustainability
skill and mindset.
Solar desalination is a feasible and promising tool to replace nonrenewable water sources for
much of the Southwest. Long-term viability depends on solar conversion, desalination, and conveyance
efficiency, as well as sustainable waste practices. Practicality increases with greater centralization, cost
sharing, current infrastructure utilization, and Southwest communities acting together.
CONCLUSION
A solar desalination model utilizing Southwest climate data and current technology was
constructed, generating cost data. Short and long-term viability of solar desalination in the Southwest
was determined, and used to assess what role solar desalination should play in the region. Solar
desalination was found to be feasible in both the short and long-term. This result depends on subsidies,
the cost of money and competing energy costs; bearing that in mind, using current solar and desalination
technology in the Southwest is financially viable in the short-term. Long-term technology trends favor
improved solar and water conversion rates. Intuitively, solar desalination viability should increase with
time; even so, solar desalination feasibility compared to traditional methods does not address desalination
as a new, alternative water source. Furthermore, water in the Southwest is a fundamental social force:
politics and institutional arrangements necessary for wide scale implementation are significant feasibility
factors. In general, motivated and collaborative water resource managers, politicians and other leaders
acting together over the entire Southwest in advance of impending water crises will increase solar
desalination feasibility. On the other hand, treating water resource issues at small scales or at the ‘last-
minute’ will decrease feasibility (e.g. NRC 2008, Sandia and USBR 2003). Solar desalination cost still
remains higher than efficiently using renewable water sources, but through greater solar and water
conversion efficiency, strategic conveyance, and ecofriendly waste management, solar desalination has
considerable potential as a groundbreaking, sustainable source of water in the Southwest.

25
REFERENCES
Ackerman, Fred, and Elizabeth A. Stanton. The Last Drop: Climate Change and the Southwest Water
Crises. Somerville, MA: Stockholm Environment Institute U.S, 2011. Internet resource.
Alarcon-Padilla, Diego-Cesar, et al. "First Experimental Results of a New Hybrid solar/gas Multi-Effect
Distillation System: The AQUASOL Project." Desalination 220.1-3 (2008): 619-25. Print.
Al-Karaghouli, Ali, David Renne, and Lawrence L. Kazmerski. "Solar and Wind Opportunities for Water
Desalination in the Arab Regions." Renewable & Sustainable Energy Reviews 13.9 (2009): 2397-
407. Print.
Alnaser, W. E., F. Trieb, and G. Knies. "The Potential of Concentrated Solar Power (CSP) in the GCC
Countries." Proceedings of ISES Solar World Congress 2007.Solar Energy and Human Settlement
(2007)Print.
Armenta-Deu, C. "Effects of Temperature and Salt Concentration on Distilled Water Production."
Renewable Energy 25.2 (2002): 281-92. Print.
Ayala, Claudio O., et al. "Local Model Predictive Controller in a Solar Desalination Plant Collector
Field." Renewable Energy 36.11 (2011): 3001-12. Print.
BarrancoJimenez, MA, and F. AnguloBrown. "A Nonendoreversible Model for Wind Energy as a Solar-
Driven Heat Engine." Journal of Applied Physics 80.9 (1996): 4872-6. Print.
Benson, Larry, Kenneth Petersen, and John Stein. "Anasazi (pre-Columbian Native-American)
Migrations During the Middle-12th and Late-13th Centuries - Were They Drought Induced?"
Climatic Change. 83 (2007): 1-2. Print.
Bond, Rick, and Srinivas Veerapaneni. Zero Liquid Discharge for Inland Desalination. Denver, Colo.;
s.l.: Awwa Research Foundation : American Water Works Association ; IWA Publishing, 2007.
Print.
Brady, Patrick V., et al. "Inland Desalination: Challenges and Research Needs." Journal of Contemporary
Water Research & Education 132.1 (2009): 46-51. Print.
Brutsaert, Wilfried,. Hydrology : An Introduction. Cambridge; New York: Cambridge University Press,
2005. Print.
(CAP) Central Arizona Project Annual Report. Phoenix, AZ: Protecting Our Resources, 2010. Print
Cipollina, Andrea, Giorgio Micale, and Lucio Rizzuti. "Seawater desalination conventional and
renewable energy processes." 2009.Web.
Cohen, G. E., D. W. Kearney, and H. W. Price. "Performance History and Future Costs of Parabolic
Trough Solar Electric Systems." Journal De Physique Iv 9.P3 (1999): 169-79. Print.
Darwish, M. A., N. M. Al-Najem, and N. Lior. "Towards Sustainable Seawater Desalting in the Gulf
Area." Desalination 235.1-3 (2009): 58-87. Print.
26 Devos, A., and H. Pauwels. "On the Thermodynamic Limit of Photo-Voltaic Energy-Conversion."
Applied Physics 25.2 (1981): 119-25. Print.
Devos, A., and P. Vanderwel. "Endoreversible Models for the Conversion of Solar-Energy into Wind
Energy (Journal of Nonequilibrium Thermodynamics, Vol 17, Pg 77, 1992)." Journal of Non-
Equilibrium Thermodynamics 17.3 (1992): U302,&. Print.
DOE/Lawrence Berkeley National Laboratory. "Installed cost of solar photovoltaic systems in U.S.
declined significantly in 2010 and 2011." ScienceDaily, 15 Sep. 2011. Web. 27 Feb. 2012.
Eck, M., et al. "Solar Thermal Power Plants for the Spanish Electricity Market." International Journal of
Energy Technology and Policy 5.3 (2007)Print.
El-Nashar, A. M. "The Economic Feasibility of Small Solar MED Seawater Desalination Plants for
Remote Arid Areas." Desalination 134.1-3 (2001): 173-86. Print.
EIA - Annual Energy Outlook. Washington, DC: Energy Information Administration U.S. Dept. of
Energy, 2012. Internet resource.
Fiorenza, G., V. K. Sharma, and G. Braccio. "Techno-Economic Evaluation of a Solar Powered Water
Desalination Plant." Energy Conversion and Management 44.14 (2003): 2217-40. Print.
Garcia-Rodriguez, L., and C. Gomez-Camacho. "Thermoeconomic Analysis of a Solar Parabolic Trough
Collector Distillation Plant." Desalination 122.2-3 (1999): 215-24. Print.
Garcia-Rodriguez, L., A. I. Palmero-Marrero, and C. Gomez-Camacho. "Application of Direct Steam
Generation into a Solar Parabolic Trough Collector to Multieffect Distillation." Desalination 125.1-3
(1999): 139-45. Print.
Garcia-Rodriguez, L., and C. Gomez-Camacho. "Comparison of Solar Thermal Technologies for
Applications in Seawater Desalination." Desalination 142.2 (2002): 135-42. Print.
Ghermandi, Andrea, and Rami Messalem. "Solar-Driven Desalination with Reverse Osmosis: The State
of the Art." Desalination and Water Treatment 7.1-3 (2009): 285-96. Print.
Ghobeity, Amin, et al. "Optimal Time-Invariant Operation of a Power and Water Cogeneration Solar-
Thermal Plant." Solar Energy 85.9 (2011): 2295-320. Print.
GWI - Desalination Markets 2010. Global Water Intelligence. Oxford: Media Analytics Ltd, 2010. Print.
Greenlee, L. F., et al. "Reverse Osmosis Desalination: Water Sources, Technology, and Today's
Challenges." Water research 43.9 (2009): 2317-48. Print.
Hall, D. O., K. K. Rao, and Institute of Biology. Photosynthesis. Cambridge, UK; New York: Cambridge
University Press, 1999. Print.
Hall, Irving J., and Sandia National Laboratories. Generation of Typical Meteorological Years for 26
SOLMET Stations. Albuquerque, N.M.: Sandia Laboratories, 1978. Print.

27 Harder, N. -P, and P. Wurfel. "Theoretical Limits of Thermophotovoltaic Solar Energy Conversion."
Semiconductor science and technology. 18 (2003): S151-7. Print.
Henry, C. H. "Limiting Efficiencies of Ideal Single and Multiple Energy-Gap Terrestrial Solar-Cells."
Journal of Applied Physics 51.8 (1980): 4494-500. Print.
Hoffman, D. "The Application of Solar-Energy for Large-Scale Seawater Desalination." Desalination
89.2 (1992): 115-84. Print.
Hundley, Norris. Water and the West: The Colorado River Compact and the Politics of Water in the
American West. Berkeley: University of California Press, 1975. Print.
Kenny, J. F., and Geological Survey (U.S.). "Estimated use of water in the United States in 2005."
2009.Web.
Khawaji, Akili D., Ibrahim K. Kutubkhanah, and Jong-Mihn Wie. "Advances in Seawater Desalination
Technologies." Desalination 221.1-3 (2008): 47-69. Print.
King, David L., et al. "Photovoltaic array performance model." 2004.Web.
Kruger D., et al. "Parabolic Trough Collector Testing in the Frame of the REACt Project." Desalination
Desalination 220.1-3 (2008): 612-8. Print.
Renewable Energy Atlas of the West : A Guide to the Region's Resource Potential. Boulder, Colo.: Land
and Water Fund of the Rockies, 2002.
Landsberg, P. T., and P. Baruch. "The Thermodynamics of the Conversion of Radiation Energy for
Photovoltaics." Journal of Physics A-Mathematical and General 22.11 (1989): 1911-26. Print.
Libert, J. J., and A. Maurel. "Desalination and Renewable Energies - a Few Recent Developments."
Desalination 39.1-3 (1981): 363-72. Print.
Mabrouk, A. A., A. S. Nafey, and H. E. S. Fath. "Analysis of a New Design of a Multi-Stage Flash-
Mechanical Vapor Compression Desalination Process." Desalination 204.1-3 (2007): 482-500. Print.
Mackun, Paul J, Steven Wilson, Thomas R. Fischetti, and Justyna Goworowska. Population Distribution
and Change: 2000 to 2010. Washington, D.C.: U.S. Dept. of Commerce, Economics and Statistics
Administration, U.S. Census Bureau, 2011. Print.
Mandani, F., H. Ettouney, and H. El-Dessouky. "LiBr-H2O Absorption Heat Pump for Single-Effect
Evaporation Desalination Process." Desalination 128.2 (2000): 161-76. Print.
Maraver, Daniel, Javier Uche, and Javier Royo. "Assessment of High Temperature Organic Rankine
Cycle Engine for Polygeneration with MED Desalination: A Preliminary Approach." Energy
Conversion and Management 53.1 (2012): 108-17. Print.
Maurel, A. "Desalination by Renewable Energies." Entropie 16.96 (1980)Print.

28 Maxwell, E. L. "METSTAT - the Solar Radiation Model used in the Production of the National Solar
Radiation Data Base (NSRDB)." SOLAR ENERGY -PHOENIX ARIZONA THEN NEW YORK- 62.4
(1998): 263-80. Print.
Mittelman, Gur, Ornit Mouchtar, and Abraham Dayan. "Large-Scale Solar Thermal Desalination Plants:
A Review." Heat Transfer Engineering 28.11 (2007): 924-30. Print.
Mohamed, A. M. I., and N. A. El-Minshawy. "Theoretical Investigation of Solar Humidification-
Dehumidification Desalination System using Parabolic Trough Concentrators." Energy Conversion
and Management 52.10 (2011): 3112-9. Print.
Moser, Massimo, et al. "The MED-CSD Project: Potential for Concentrating Solar Power Desalination
Development in Mediterranean Countries." Journal of Solar Energy Engineering-Transactions of the
Asme 133.3 (2011): 031012. Print.
Muraleedaaran S., et al. "Is Reverse Osmosis Effective for Produced Water Purification? Viability and
Economic Analysis." SPE West.Reg.Meet.Proc.SPE Western Regional Meeting Proceedings (2009):
1-16. Print.
National Renewable Energy Laboratory (NREL) (U.S.)., United States. Dept. of Energy., and United
States. Dept. of Energy. Office of Scientific and Technical Information. "Parabolic-Trough
Technology Roadmap A Pathway for Sustained Commercial Development and Deployment of
Parabolic-Trough Technology." 1999.Web.
National Renewable Energy Laboratory (NREL) (U.S.)., United States. Dept. of Energy., and United
States. Dept. of Energy. Office of Scientific and Technical Information. Assessment of Parabolic
Trough and Power Tower Solar Technology Cost and Performance Forecasts. Golden, Colo: 2003.
Internet resource.
NRC - Desalination: A National Perspective. Washington, D.C: National Research Council (U.S.).
Committee on Advancing Desalination Technology; National Academies Press, 2008. Print.
New, Thomas, and Zongqiang Xie. "Impacts of Large Dams on Riparian Vegetation: Applying Global
Experience to the Case of China's Three Gorges Dam." Biodiversity and Conservation 17.13 (2008):
3149-63. Print.
Noone, Corey J., et al. "Site Selection for Hillside Central Receiver Solar Thermal Plants." Solar Energy
85.5 (2011): 839-48. Print.
O'Connell, R, L Stoddard, and J Abiecunas. Economic, Energy, and Environmental Benefits of
Concentrating Solar Power in California. Washington, D.C: United States. Dept. of Energy, 2006.
Internet resource.
Petela, Ryszard. Engineering Thermodynamics of Thermal Radiation for Solar Power Utilization. New
York: McGraw Hill, 2010. Internet resource. Fernandez-Garcia, A., et al. "Parabolic-Trough Solar
Collectors and their Applications." Renewable and Sustainable Energy Reviews 14.7 (2010): 1695-
721. Print.
29 Perez, R., and J. Schlemmer. "Validation of the SUNY Satellite Model in a Meteosat Environment."
PROCEEDINGS OF THE SOLAR CONFERENCE 7 (2009): 3850-83. Print.
Perez, Richard, et al. "A New Operational Model for Satellite-Derived Irradiances: Description and
Validation." Solar Energy 73.5 (2002): 307. Print.
Price, H., et al. "Advances in Parabolic Trough Solar Power Technology." Transactions of the
ASME.Journal of Solar Energy Engineering 124.2 (2002)Print.
Raluy, R. G., L. Serra, and J. Uche. "Life Cycle Assessment of Water Production Technologies - Part 1:
Life Cycle Assessment of Different Commercial Desalination Technologies (MSF, MED, RO)."
International Journal of Life Cycle Assessment 10.4 (2005): 285-93. Print.
Reisner, Marc. Cadillac Desert : The American West and its Disappearing Water. New York, N.Y.,
U.S.A.: Viking, 1986. Print.
Ries, H. "Thermodynamic Limitations of the Concentration of Electromagnetic-Radiation." Journal of the
Optical Society of America 72.3 (1982): 380-5. Print.
Sandia and USBR. Review of the Desalination and Water Purification Technology Roadmap.
Washington, D.C: National Academies Press, 2004. Sandia National Laboratories and United States
Bureau of Reclamation. Internet resource.
Schillings, C., Pereira, E., Perez, R., “High Resolution Solar Energy Resources Assessment Within the
UNEP-Project SWERA.” World Renewable Energy Congress VII, Cologne, Germany, 29 June - 5
July, 2002
Scott, Christopher A., and Martin J. Pasqualetti. "Energy and Water Resources Scarcity: Critical
Infrastructure for Growth and Economic Development in Arizona and Sonora." Natural Resources
Journal 50.3 (2010): 645-82. Print.
Shaban, H. I. "Reverse-Osmosis Membranes for Seawater Desalination State-of-the-Art." Separation and
Purification Methods 19.2 (1990): 121-31. Print.
Shaw, Randall. “Solar Desalination.” E-mail between Matthew Stroud and Randall Shaw (facility
manager at United States Bureau of Reclamation Brackish Groundwater National Desalination
Research Facility). 19-21 September 2011
SNWA – “2010 Annual Report.” Southern Nevada Water Authority. (2010) snwa.com
Slocum, Alexander H., et al. "Concentrated Solar Power on Demand." Solar Energy 85.7 (2011): 1519-
29. Print.
Spiegler, K. S., and Y. M. El-Sayed. A Desalination Primer : Introductory Book for Students and
Newcomers to Desalination. Santa Maria Imbaro, Italy: Balaban Desalination Publications, 1994.
Print.
Spiegler, K. S. "The Energetics of Desalination Processes." Desalination 134.1-3 (2001): 109-28. Print.

30 Sullivan, Thomas F. P., and Christopher L. Bell. Environmental Law Handbook. Lanham, Md.:
Government Institutes, 2011. Print.
Taggart, S. "Parabolic Troughs: CSPs Quiet Achiever." RENEWABLE ENERGY FOCUS 9.2 (2008):
46,48,50. Print.
Tellez, Diego, et al. "Evaluation of Technologies for a Desalination Operation and Disposal in the
Tularosa Basin, New Mexico." Desalination 249.3 (2009): 983-90. Print.
TEP – “Pricing Plan PS-43 Municipal Water Pumping Service”. Tucson Electric Power. (2008). Internet
resource.
Trieb, Franz, et al. "Technologies for Large Scale Seawater Desalination using Concentrated Solar
Radiation." Desalination 235.1-3 (2009): 33-43. Print.
Trieb, Franz, and Hans Mueller-Steinhagen. "Concentrating Solar Power for Seawater Desalination in the
Middle East and North Africa." Desalination 220.1-3 (2008): 165-83. Print.
Trieb, Franz, and Hans Mueller-Steinhagen. "Europe-Middle East-North Africa Cooperation for
Sustainable Electricity and Water." Sustainability Science 2.2 (2007): 205-19. Print.
(USDA) Farm and Ranch Irrigation Survey (1998), National Agricultural Statistics Service, U.S.
Department of Agriculture (1999). Summarized by the Economic Research Service, USDA. (1999 )
Print.
Wade, N. M. "Distillation Plant Development and Cost Update." Desalination 136.1-3 (2001): 3-12.
Print.
Wagner, Michael J., Paul Gilman, and National Renewable Energy Laboratory (U.S.). "Technical manual
for the SAM Physical Trough model." 2011.Web.
Waltham, Tony. Ground Subsidence. Glasgow; New York: Blackie ; Chapman and Hall, 1989. Print.
Weinstein, Bernard L., and Robert E. Firestine . Regional Growth and Decline in the United States : The
Rise of the Sunbelt and the Decline of the Northeast. New York: Praeger Publishers, 1978. Print.
Wilcox, Stephen, William Marion, and National Renewable Energy Laboratory (U.S.). Users’ Manual for
TMY3 Data Sets. Golden, CO: National Renewable Energy Laboratory, 2007. Print.
Wilcox, Stephen, and National Renewable Energy Laboratory (U.S.). "National solar radiation database
1991-2005 update user's manual." 2007.Web.
WHO – Desalination for Safe Water Supply, Guidance on risk assessment and risk management
procedures to ensure the safety of desalinated drinking-water. Geneva: World Health Organization,
Public Health and the Environment. 2011. Print.
Xiong YaXuan, et al. "Numerical Investigation of Thermal Performance of Heat Loss of Parabolic
Trough Receiver." Science China-Technological Sciences 53.2 (2010): 444-52. Print.