Embed Size (px)
Citation preview
Claremont CollegesScholarship @ Claremont
CMC Senior Theses CMC Student Scholarship
2010
Solar Development in the Mojave DesertJoseph B. SwartleyClaremont McKenna College
This Open Access Senior Thesis is brought to you by Scholarship@Claremont. It has been accepted for inclusion in this collection by an authorizedadministrator. For more information, please contact [email protected].
Recommended CitationSwartley, Joseph B., "Solar Development in the Mojave Desert" (2010). CMC Senior Theses. Paper 74.http://scholarship.claremont.edu/cmc_theses/74
CLAREMONT McKENNA COLLEGE
SOLAR DEVELOPMENT IN THE MOJAVE DESERT
SUBMITTED TO
PROFESSOR EMIL J. MORHARDT
AND
DEAN GREGORY HESS
BY
JOSEPH SWARTLEY
FOR
SENIOR THESIS
FALL/2010 NOVEMBER 29, 2010

i
Table of Contents
List of Figures ..................................................................................................................... ii
List of Tables ...................................................................................................................... ii
Acknowledgments.............................................................................................................. iii
1 Introduction ................................................................................................................. 1
1.1 Climate Change .................................................................................................... 4
1.2 Renewable energy ................................................................................................ 6
1.3 Solar electricity generation................................................................................... 8
1.3.1 Photovoltaics ................................................................................................. 9
1.3.2 Concentrated solar ...................................................................................... 10
2 Mojave Desert............................................................................................................ 17
2.1 Geography, climate, and ecology ....................................................................... 18
2.2 Policies affecting solar development.................................................................. 21
2.2.1 Federal policy.............................................................................................. 21
2.2.2 California and regional policy .................................................................... 26
2.3 Benefits of solar in the Mojave Desert ............................................................... 31
3 Impacts....................................................................................................................... 34
3.1 Land use ............................................................................................................. 34
3.2 Desert ecosystem ................................................................................................ 37
3.3 Endangered species ............................................................................................ 39
3.4 Transmission lines .............................................................................................. 41
3.5 Water use ............................................................................................................ 42
3.6 Air quality .......................................................................................................... 44
3.7 Socioeconomic effects........................................................................................ 45
3.8 Aesthetic effects ................................................................................................. 46
4 Conclusion ................................................................................................................. 47
4.1 Recommendations .............................................................................................. 47
4.2 Conclusion .......................................................................................................... 49
Alphabetical List of Sources ............................................................................................. 51
ii
List of Figures
Figure 1-1. United States net electricity generation (by energy sector, 2009)……………6
Figure 1-2. Parabolic trough CSP plant………………………………………..………...11
Figure 1-3. Average daily solar radiation in the United States…………………………..15
Figure 2-1. Map of the Mojave Desert…………………………………………………...19
Figure 2-2. California total system power (by source, 2008) …......…………………….28
Figure 2-3. Bureau of Land Management California Desert District……………………30
Figure 3-1. Some environmental groups views on solar development………….……….40
List of Tables
Table 1-1. Global social, economic, and environmental trends over time………...…..….3
Table 3-1. Land use efficiency by project size and technology type…………...……..…35
Table 3-2. Water use efficiency based on annual water
consumption per project and technology………………………........………...…43
iii
Acknowledgments
I would like to thank Professors McHenry and Christian for getting me interested in solar
issues in the Mojave Desert. If it weren’t for their annual trip to the Mojave Desert with
Environmental Law students, I would not be writing on this topic. I would also like to
recognize and thank Alice Bond of The Wilderness Society and Laura Cunningham of
Basin and Range Watch for their guidance during the research phase of my thesis.
1
1 Introduction
While it is difficult to imagine today, there once existed a time when nature was
large and the human race was not. During these years, civilizations coexisted with nature
without altering or disturbing it, appreciative of what Mother Nature had provided for
them. When Christopher Columbus reached the Americas in 1492, he did not write of
smokestacks, skyscrapers, or street signs, but instead of the inherent beauty of the
unconquered land, uncharted seas, and the magnificent flora and fauna that he and his
crew encountered. When Meriwether Lewis and William Clark set off on their famous
expedition to the Pacific coast, they did not write of highways, casinos, or oil rigs, but
instead of the wild grizzly bears and bighorn sheep that roamed throughout the land. The
clear skies, blue waters, herds of wild animals and flocks of elegant birds dominated the
landscape; yet somewhere between then and now, something was lost. The human race is
now large and getting larger, and nature appears to be shrinking at an alarming rate. As
the human population continues to grow, it is easy to see that the global economy is
putting more and more pressure on the environment, and in the not too distant future
catastrophe will strike.
Concern surrounding the degradation of the natural environment in the United
States, however, is not a new issue by any means. The modern American environmental
movement began in the early 1960s, years before the creation of the Environmental
Protection Agency by President Nixon. When Rachel Carson published her book, Silent
Spring, in 1962 about the harmful effect of pesticides on bird species, she was not
expecting to gather as large a fan base as she did. Her book, extremely detailed and very
2
well-written, attracted attention around the nation and around the world, becoming
Houghton Mifflin’s best seller with sales reaching over a half of a million copies in its
first year. Carson discussed in great depth the use of DDT and other synthetic pesticides
and their poisonous effects on wildlife, the environment, and human health. Her results
spurred an anti-chemical and anti-pesticide movement, eventually leading to a ban of
DDT in the United States. One writer even proclaimed, “Silent Spring played in the
history of environmentalism roughly the same role that Uncle Tom's Cabin played in the
abolitionist movement.”1
Fears about the state of the environment gained even further public attention when
biologist Paul R. Ehrlich published The Population Bomb in 1968. His book, which sold
over two million copies, warned the world of a massive increase in population growth
that would lead to high environmental degradation and starvation and death for hundreds
of millions of people. Ehrlich held that wealthy and technologically advanced countries
like the United States have a significantly greater impact on the depletion of natural
resources and the health of the planet than do poorer countries.2 Both Carson and
Ehrlich’s ideas were criticized but ultimately succeeded in thrusting environmental issues
into the forefront of public and political thought.
Over the course of the last four decades, the global environmental movement has
shifted its direction and focus from conservation and contamination to the mitigation of
anthropogenic climate change, one of the most pressing issues that the world is currently
facing. Environmentalism today can be described as “the principle approaches to date for
1 Jack Lewis, “The Birth of EPA,” EPA Journal, November 1985. 2 Jacqueline V. Switzer, Environmental Politics: Domestic and Global Dimensions (New York: St
Martin’s Press, Inc., 1994), 9.
3
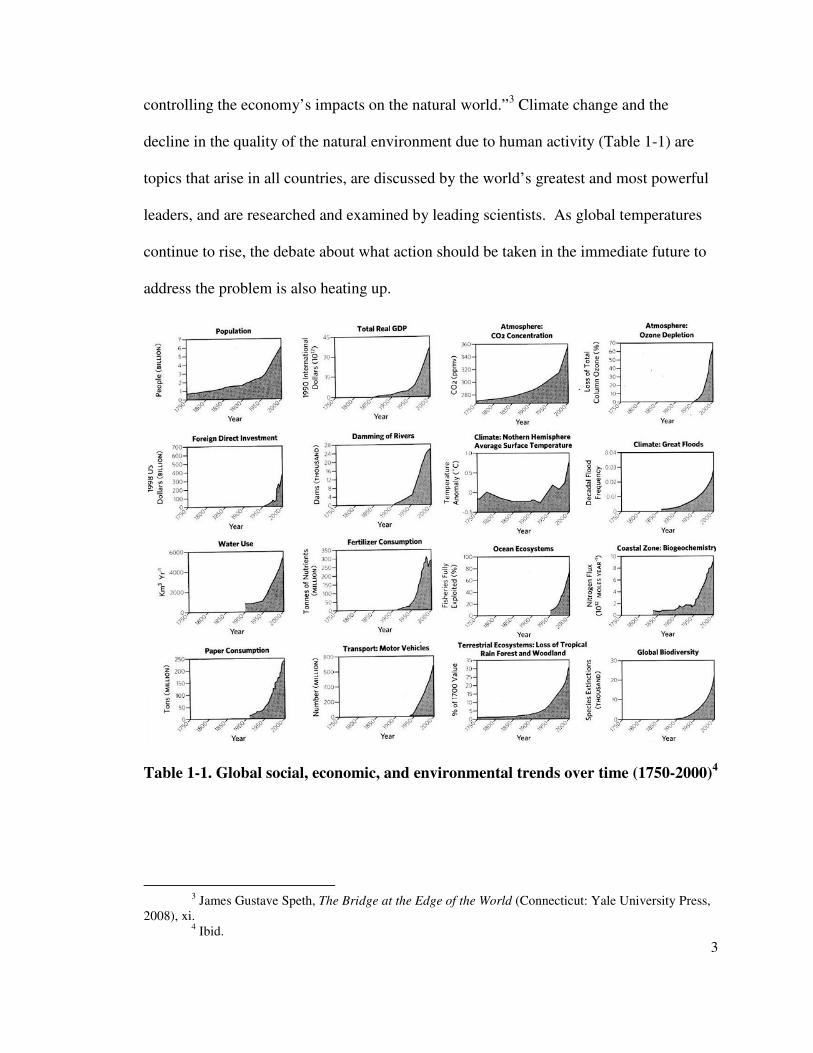
controlling the economy’s impacts on the natural world.”3 Climate change and the
decline in the quality of the natural environment due to human activity (Table 1-1) are
topics that arise in all countries, are discussed by the world’s greatest and most powerful
leaders, and are researched and examined by leading scientists. As global temperatures
continue to rise, the debate about what action should be taken in the immediate future to
address the problem is also heating up.
Table 1-1. Global social, economic, and environmental trends over time (1750-2000)4
3 James Gustave Speth, The Bridge at the Edge of the World (Connecticut: Yale University Press,
2008), xi. 4 Ibid.
4
1.1 Climate Change
For more than two centuries, humans have been spewing “greenhouse gases” into
the atmosphere through the burning of fossil fuels, deforestation, and the development of
land, causing the planet’s surface temperature to increase at an accelerated rate.
Greenhouse gases are naturally occurring gases that exist in the atmosphere and prevent
heat from escaping Earth and entering space. These gases absorb the energy released
from the planet and then radiate most of this heat back to the Earth’s surface, creating
what is called a “greenhouse effect”; without this process, life on Earth would not be
viable. However, due to human activity and the increased amount of these gases in the
atmosphere, this process has been intensified and the global average temperature has
increased.
The Intergovernmental Panel on Climate Change, a United Nations’ scientific
body, calculated in their 2007 Assessment Report that “the 100-year linear warming trend
(1906-2005) was 0.74C, with most of the warming occurring in the past 50 years. The
warming for the next 20 years is projected to be 0.2C per decade.”5 If warming continues
as projected, a number of negative impacts will be observed: a rise in sea level, increased
risk of plant and animal species extinction, more intense and frequent severe weather
events such as hurricanes and tornadoes, higher number of droughts and floods, glacier
melting, earlier spring events, and changes in flora and fauna ranges, among others.
Although numerous gases contribute to climate change, atmospheric carbon dioxide
(CO2) is the primary contributor. Scientists and climate change activists advocate the idea
5 United Nations Framework Convention on Climate Change, “Fact sheet: Climate change science
– the status of climate change science today,” November 2010, available from http://unfccc.int/press/fact_sheets/items/4987.php; Internet: accessed November 4, 2010, 2.
5
of a target for a “safe” level of atmospheric CO2 that will steer the Earth clear of
irreversible climate catastrophe. Currently, atmospheric CO2 levels are around 385 parts
per million (ppm). In the pre-industrial world and during the preceding ten thousand
years, however, levels hovered around 280 ppm. The majority of scientists concur that
“paleoclimate evidence and ongoing climate change suggest that CO2 will need to be
reduced from its current 385 ppm to at most 350 ppm, but likely less than that.”6 This
CO2 target level, though formidable and difficult to achieve, is necessary for the survival
of the planet.
The phasing out of fossil fuels is widely accepted as the most pragmatic and
effective way of decreasing the high concentration of greenhouse gases in the
atmosphere. Some of the world’s most developed countries are beginning to pave the way
for technological innovation and the implementation of new technologies to aid this
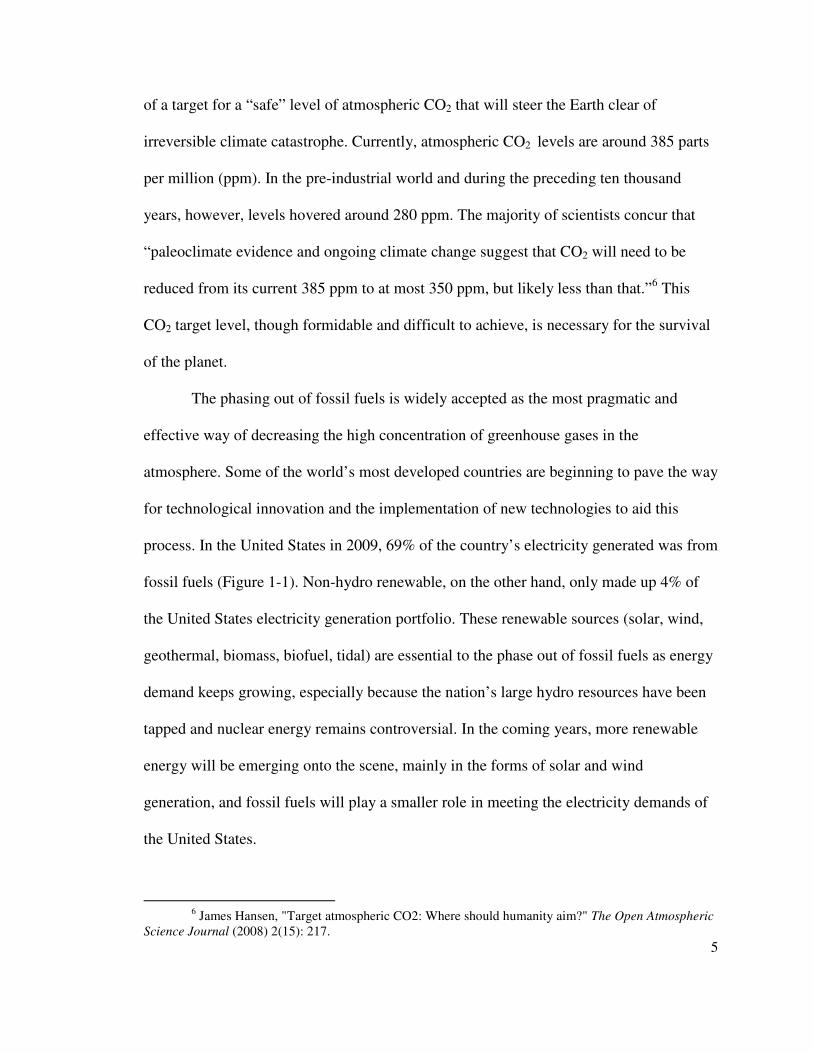
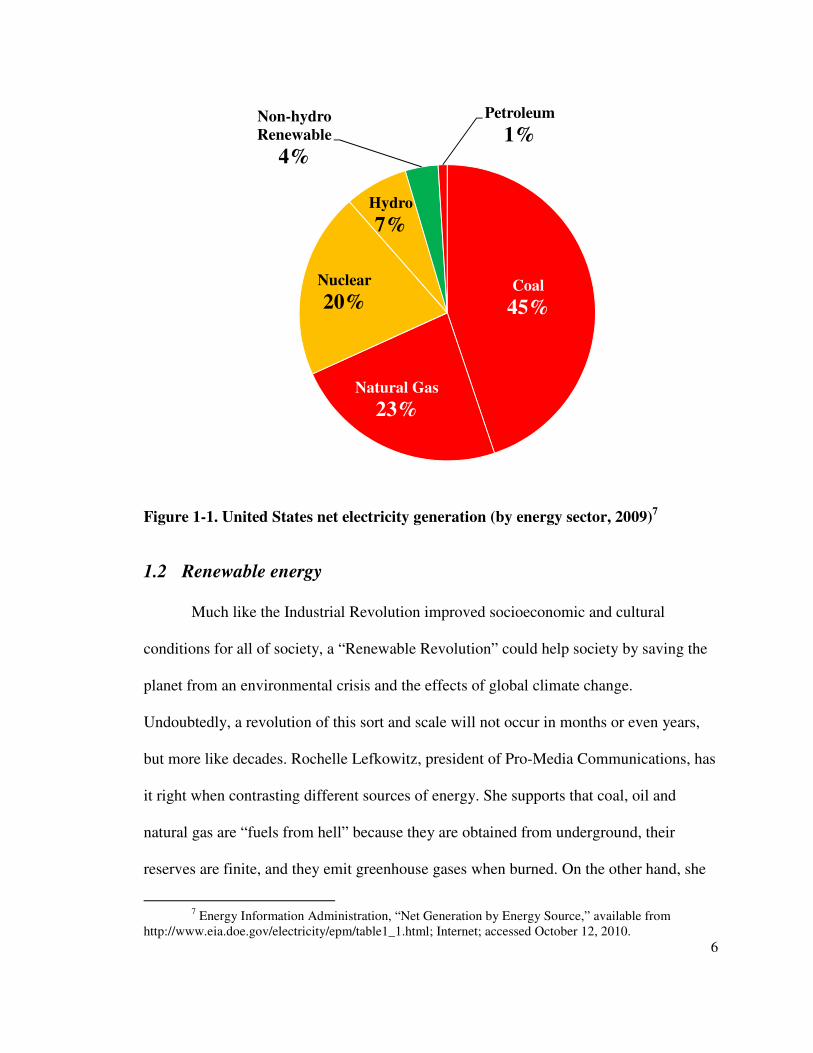
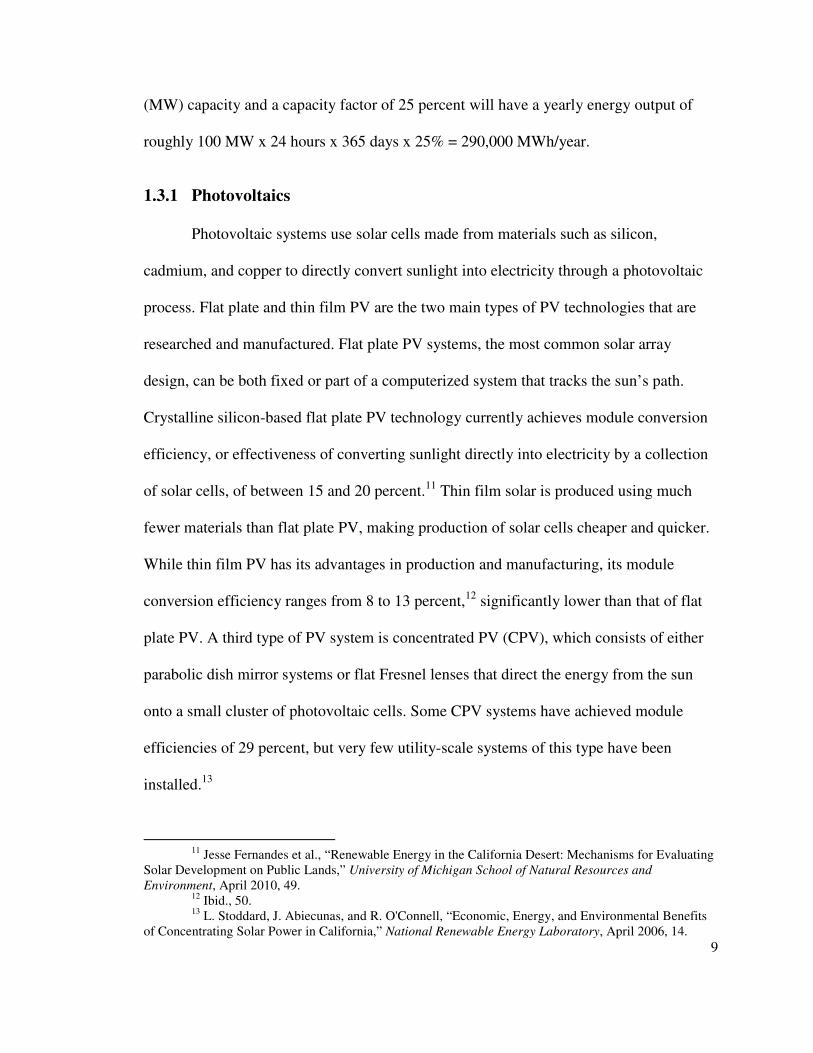
process. In the United States in 2009, 69% of the country’s electricity generated was from
fossil fuels (Figure 1-1). Non-hydro renewable, on the other hand, only made up 4% of
the United States electricity generation portfolio. These renewable sources (solar, wind,
geothermal, biomass, biofuel, tidal) are essential to the phase out of fossil fuels as energy
demand keeps growing, especially because the nation’s large hydro resources have been
tapped and nuclear energy remains controversial. In the coming years, more renewable
energy will be emerging onto the scene, mainly in the forms of solar and wind
generation, and fossil fuels will play a smaller role in meeting the electricity demands of
the United States.
6 James Hansen, "Target atmospheric CO2: Where should humanity aim?" The Open Atmospheric
Science Journal (2008) 2(15): 217.
6
Figure 1-1. United States net electricity generation (by energy sector, 2009)
7
1.2 Renewable energy
Much like the Industrial Revolution improved socioeconomic and cultural
conditions for all of society, a “Renewable Revolution” could help society by saving the
planet from an environmental crisis and the effects of global climate change.
Undoubtedly, a revolution of this sort and scale will not occur in months or even years,
but more like decades. Rochelle Lefkowitz, president of Pro-Media Communications, has
it right when contrasting different sources of energy. She supports that coal, oil and
natural gas are “fuels from hell” because they are obtained from underground, their
reserves are finite, and they emit greenhouse gases when burned. On the other hand, she
7 Energy Information Administration, “Net Generation by Energy Source,” available from
http://www.eia.doe.gov/electricity/epm/table1_1.html; Internet; accessed October 12, 2010.
Coal
45%
Natural Gas
23%
Nuclear
20%
Hydro
7%
Non-hydro
Renewable
4%
Petroleum
1%
7
holds that solar, wind, hydroelectric, tidal, and biomass are “fuels from heaven” because
they originate from above ground, are inherently renewable, and do not emit harmful
gases when used.8 It is these heavenly fuels that will power the United States and the
planet into a more promising future. In addition to the obvious advantage of limiting the
effects of climate change, there are numerous other benefits that would come with a
renewable energy revolution.
Much of the debate surrounding renewable energy at the moment concerns the
economic viability of implementing such projects. The United States is in the midst of the
worst economic downturn in recent history. Unemployment in some parts of the country
has hit record highs, and the forecast for the coming years is bleak. The introduction of a
new industry, especially with a focus on manufacturing and construction, has the
potential to create millions of jobs and spur technological innovation. The green sector, if
grown to the scale needed to transform the energy portfolio of the United States, could
help to carry the nation out of the downturn and employ the jobless. Furthermore, the
economic risk associated with relying on petroleum and other fuels that have fluctuating
prices would diminish, as the energy sector would be powered by free and limitless raw
materials.
Another worry of the American government and public is national security.
Thomas Friedman, in his book Hot, Flat, and Crowded, argues that the United States and
other high energy-consuming countries are pumping “hundreds of billions of dollars a
year” into oil-producing countries and thereby, “strengthening nondemocratic actors and
8 Thomas Friedman, Hot, Flat, and Crowded (New York: Farrar, Straus, and Giroux, 2008), 32.
8
trends” in these countries ruled by what Friedman calls “petrodictators.”9 A country
powered by renewable energy would avoid this trend and would help to put an end to
petrodictatorships. In a 2007 report entitled “National Security and the Threat of Climate
Change,” former United States Army Chief of Staff, General Gordon R. Sullivan states:
“We never have 100 percent certainty. We never have it. If you wait until you have 100
percent certainty, something bad is going to happen on the battlefield. That’s something
we know. You have to act with incomplete information.”10 The deployment of renewable
energy would help to avoid “something bad” that could happen in the future due to the
effects of climate change.
1.3 Solar electricity generation
Though the idea of converting sunlight into electricity has been around for
hundreds of years, the solar power industry has made great advancements in just the last
30 years in terms of utility-scale solar generation, meaning the use of solar plants capable
of producing more power than distributed generation or rooftop systems. There are two
distinct ways of capturing the sun’s energy and utilizing it to power homes: directly
through the use of photovoltaics (PV) and indirectly using concentrated solar power
(CSP). Both types of solar technologies require large tracts of land and access to
freshwater. The efficiency of power plants that utilize intermittent energy sources such as
sunlight or wind is measured by its capacity factor, or the ratio between the plant’s actual
output and its normal maximum output. For example, a power plant with 100 megawatts
9 Ibid., 42. 10 Center for Naval Analyses, “National Security and the Threat of Climate Change,” April 1,
2007, available from http://www.cna.org/reports/climate; Internet; accessed October 30, 2010, 10.
9
(MW) capacity and a capacity factor of 25 percent will have a yearly energy output of
roughly 100 MW x 24 hours x 365 days x 25% = 290,000 MWh/year.
1.3.1 Photovoltaics
Photovoltaic systems use solar cells made from materials such as silicon,
cadmium, and copper to directly convert sunlight into electricity through a photovoltaic
process. Flat plate and thin film PV are the two main types of PV technologies that are
researched and manufactured. Flat plate PV systems, the most common solar array
design, can be both fixed or part of a computerized system that tracks the sun’s path.
Crystalline silicon-based flat plate PV technology currently achieves module conversion
efficiency, or effectiveness of converting sunlight directly into electricity by a collection
of solar cells, of between 15 and 20 percent.11 Thin film solar is produced using much
fewer materials than flat plate PV, making production of solar cells cheaper and quicker.
While thin film PV has its advantages in production and manufacturing, its module
conversion efficiency ranges from 8 to 13 percent,12 significantly lower than that of flat
plate PV. A third type of PV system is concentrated PV (CPV), which consists of either
parabolic dish mirror systems or flat Fresnel lenses that direct the energy from the sun
onto a small cluster of photovoltaic cells. Some CPV systems have achieved module
efficiencies of 29 percent, but very few utility-scale systems of this type have been
installed.13
11 Jesse Fernandes et al., “Renewable Energy in the California Desert: Mechanisms for Evaluating
Solar Development on Public Lands,” University of Michigan School of Natural Resources and
Environment, April 2010, 49. 12 Ibid., 50. 13 L. Stoddard, J. Abiecunas, and R. O'Connell, “Economic, Energy, and Environmental Benefits
of Concentrating Solar Power in California,” National Renewable Energy Laboratory, April 2006, 14.
10
Photovoltaic technology has seen a steady increase in efficiency and a steady
decline in production cost since the first solar cells were manufactured years ago. Today,
solar PV is in use in more than one hundred countries and is the fastest-growing power
technology in the world.14 One major hurdle that PV must overcome is its inability to
store energy so that a plant can provide energy when the sun goes down. Some argue that
solar PV cannot really establish itself as a major power source until an efficient and
inexpensive battery is invented to store the large amount of electrons produced. Also,
water use is a concern for the future of PV technology, as solar arrays need to be washed
regularly. Though the amount of water required is nominal, every drop of water is
important, especially in desert regions where water resources are scarce.
1.3.2 Concentrated solar
The second way of harnessing the sun’s energy is through concentrated solar
power, also known as solar thermal power. CSP systems employ mirrors or lenses to
concentrate large amounts of sunlight onto a receiver to produce heat and drive a gas or
steam-driven engine. There are three main types of CSP: parabolic trough, power tower,
and dish engine.
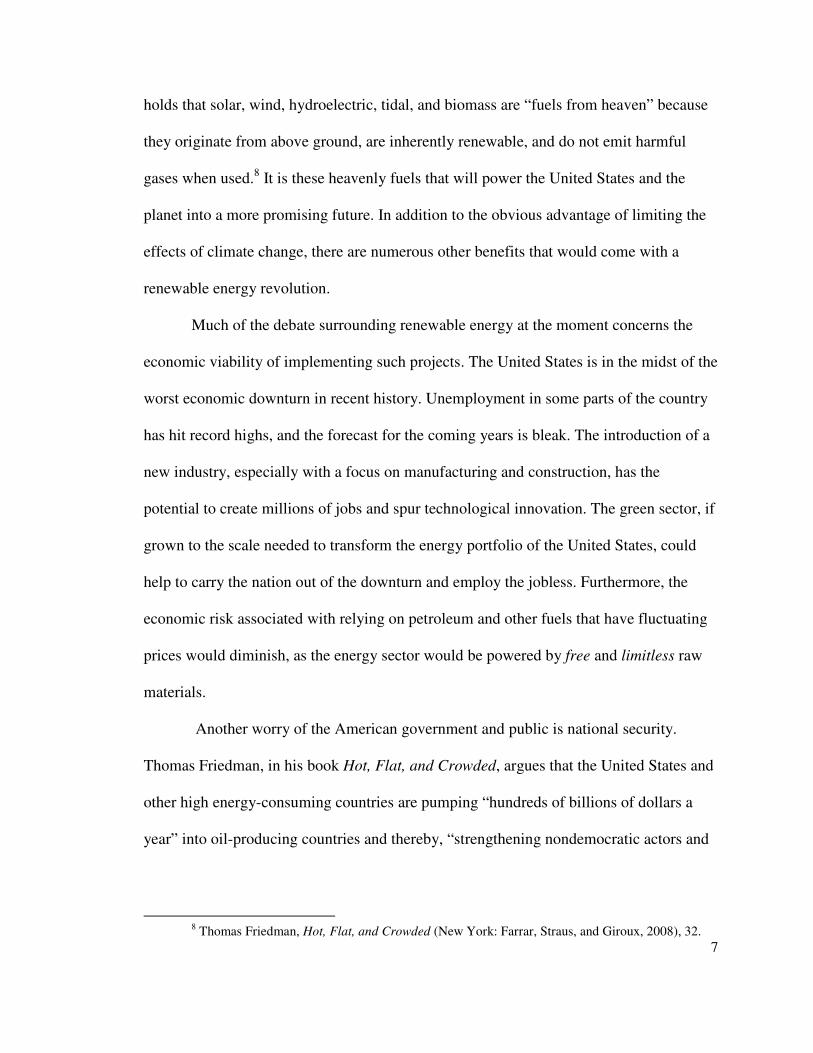
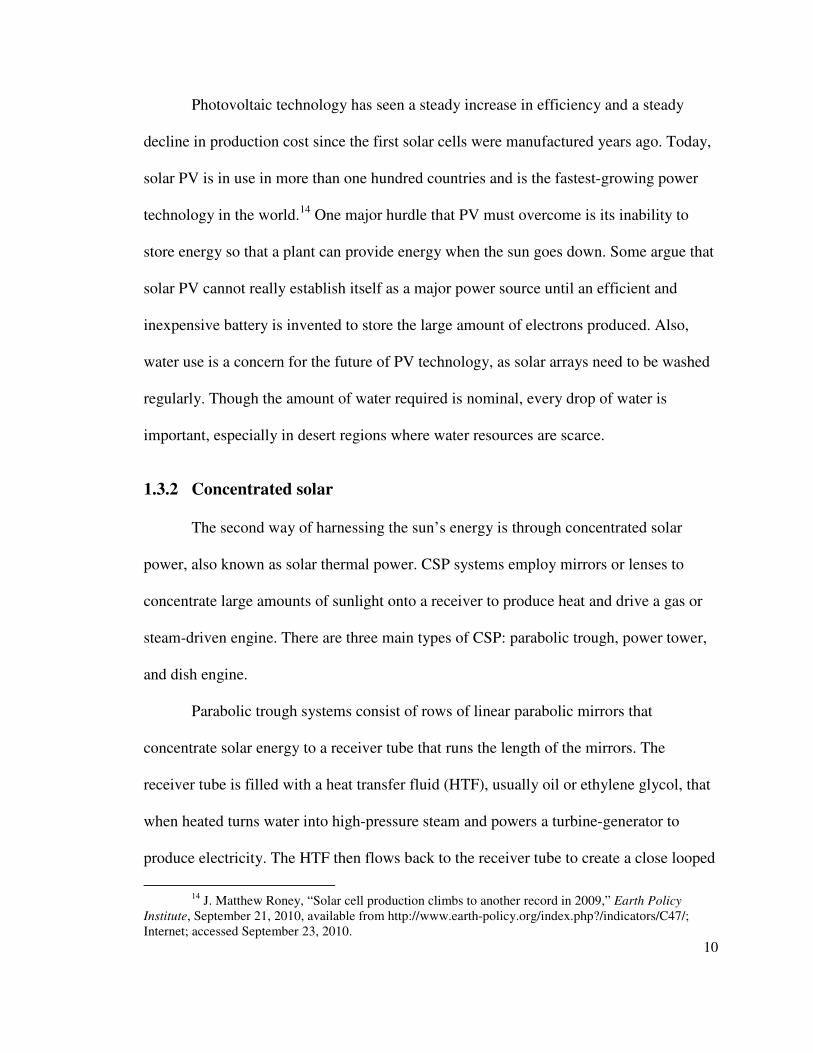
Parabolic trough systems consist of rows of linear parabolic mirrors that
concentrate solar energy to a receiver tube that runs the length of the mirrors. The
receiver tube is filled with a heat transfer fluid (HTF), usually oil or ethylene glycol, that
when heated turns water into high-pressure steam and powers a turbine-generator to
produce electricity. The HTF then flows back to the receiver tube to create a close looped
14 J. Matthew Roney, “Solar cell production climbs to another record in 2009,” Earth Policy
Institute, September 21, 2010, available from http://www.earth-policy.org/index.php?/indicators/C47/; Internet; accessed September 23, 2010.
11
system (Figure 1-3). Parabolic trough systems are quite efficient, achieving “at least a 25
percent capacity factor, which means about a quarter of the sun’s energy that is captured
by the system is converted to usable electricity.”15
For the past 25 years, parabolic trough plants have been in use around the world.
The construction of the Solar Energy Generating Systems (SEGS) I through IX plants
between 1985 and 1991 proved very important for CSP technology promotion and
advancement. The system, located in the Mojave Desert with a total capacity of 354 MW,
is the largest solar power plant in the world, and its success has demonstrated that CSP is
reliable, efficient, and can produce at utility-scale.16 Because of parabolic trough systems’
long-time use and research done on generating plants, there is very detailed information
and data available regarding construction, operation, and the economic and
environmental impacts of this type of CSP.
Figure 1-2. Parabolic trough CSP plant17
15 Jesse Fernandes et al., “Renewable Energy in the California Desert,” 46. 16 Stoddard, Abiecunas, and O'Connell, “Economic, Energy, and Environmental Benefits of
Concentrating Solar Power in California,” 15. 17 Department of Energy, “Linear Concentrators Research and Development,” available from
http://www1.eere.energy.gov/solar/linear_concentrator_rnd.html; Internet; accessed November 3, 2010.
12
The second CSP technology is power tower systems. These systems are
comprised of a large field with thousands of heliostats, or sun-tracking, computer-
controlled mirrors, that follow the sun and reflect sunlight onto a central receiver located
on top of a 300 to 650 foot-tall tower. Much like parabolic trough CSP, the central
receiver contains a HTF that is fed to a heat exchanger where high-pressure steam is
created to drive a turbine. Power towers are also close-looped systems, and therefore, the
water and HTF need not be replaced regularly. Today, the only commercial power tower
system in use is an 11-megawatt plant located in Seville, Spain.18 Interest in this
technology has risen in recent years and numerous pending projects utilize this type of
technology.
Finally, dish engine systems, sometimes called dish Sterling systems, use stand-
alone, dish-shaped reflectors to direct sunlight onto a central receiver mounted on a boom
at the focal point. The reflectors follow the sun’s path across the horizon using a two-axis
tracker. Hydrogen or helium is heated by the reflected light in the receiver, and the gas
drives a Stirling engine-generator located at the end of the boom in a power conversion
unit. The generator produces electricity to be fed directly to the grid. The gas is then air-
cooled and returned to the system. Dish Stirling systems, “the most efficient of any solar
technology…are being promoted (with good reason) as good investments, especially
versatile for large-scale and distributed set-ups.”19 Reaching a capacity factor of up to 31
18 Ibid. 19 Christian Hunold and Steven Leitner, “‘Hasta la vista, Baby!’ The Solar Grand Plan,
Environmentalism, and Social Constructions of the Mojave Desert,” paper presented at the annual meeting of the WPSA, Hyatt Regency Vancouver, Canada, March 19, 2009, available from http://www.allacademic.com/meta/p317497_ index.html; Internet; accessed September 20, 2010, 6.
13
percent,20 this type of CSP could become competitive in distributed markets thanks to its
modular structure and ability to be mass-produced. Because each dish engine unit can
function separately, these systems are ideal for small, remote applications but can also be
used in large arrays to produce electricity at commercial scale.
Solar thermal power plants present numerous advantages over photovoltaic
technology. CSP plants exhibit economies of scale, meaning that cost per kilowatt
declines as the plant’s size increases. For example, the larger the field of heliostats that
concentrates sunlight onto the central receiver in a power tower system, the greater the
plant’s generation capacity. Adding more heliostats to a field is a much more inexpensive
procedure compared to the construction of a new plant to produce the same net
generation capacity gain. Also, in regions with high irradiation such as the Mojave
Desert, solar thermal projects are more economically feasible due to low manufacturing
costs. One of the biggest advantages that solar thermal holds offers over PV is the ability
to store energy through heat.
Though dish Stirling technology does not lend itself to thermal storage yet, both
parabolic trough and power tower CSP are capable of utilizing varying types of energy
storage. Energy storage allows for greater flexibility in electricity production, making the
systems more dispatchable, or able to generate electricity when the grid demands it like
after sunset or periods when cloud cover restricts insolation. Most thermal storage
technologies employed at parabolic trough plants are two-tank, indirect systems, which
consist of a hot and a cold storage tank that are filled with molten salt. The hot HTF
flows through heat exchangers while cold molten salt from the cold tank is run counter
20 Fernandes et al., “Renewable Energy in the California Desert,” 48.
14
currently through the exchangers and heated. The heated molten salt is then stored in the
hot storage tank, and when this energy is demanded later, “the system simply operates in
reverse to reheat the solar heat transfer fluid, which generates steam to run the power
plant.” 21 The system is “indirect” because the fluid used for storage is different than the
fluid directly heated by the sun in the receiver tubes, and the heat must be transferred
through an oil-to-salt and salt-back-to-oil exchange.
Thermal energy storage in power tower CSP is a simpler process than in parabolic
trough CSP. Power tower systems are able to use a direct, two-tank system because
molten salt is used both as the HTF and the storage medium. When the HTF is heated by
the concentration of the sun’s rays, the molten salt can be transported directly to the hot
storage tank, where it will remain until the stored energy is needed to produce electricity.
This process increases a power tower plant’s “capacity factor from 34 to over 40
percent.”22 Because of its less complex nature, energy storage systems for power tower
CSP are less expensive to construct and maintain than those of parabolic trough systems,
making power tower technology more competitive in the US market in the near future.23
In addition to thermal energy storage to generate electricity when the grid demands it,
parabolic trough and power tower plants can utilize hybrid fossil fuel systems to increase
dispatchability.
While advancements in energy storage technology and solar research and
development will increase module conversion efficiency and capacity factor, the driving
21 National Renewable Energy Laboratory, “Parabolic Trough Thermal Energy Storage
Technology,” available from http://www.nrel.gov/csp/troughnet/thermal_energy_ storage.html#tank; Internet; accessed November 1, 2010.
22 Fernandes et al., “Renewable Energy in the California Desert,” 47. 23 Craig Turchi et al., “Current and Future Costs for Parabolic Trough and Power Tower Systems
in the US Market,” National Renewable Energy Laboratory, October 2010.
15
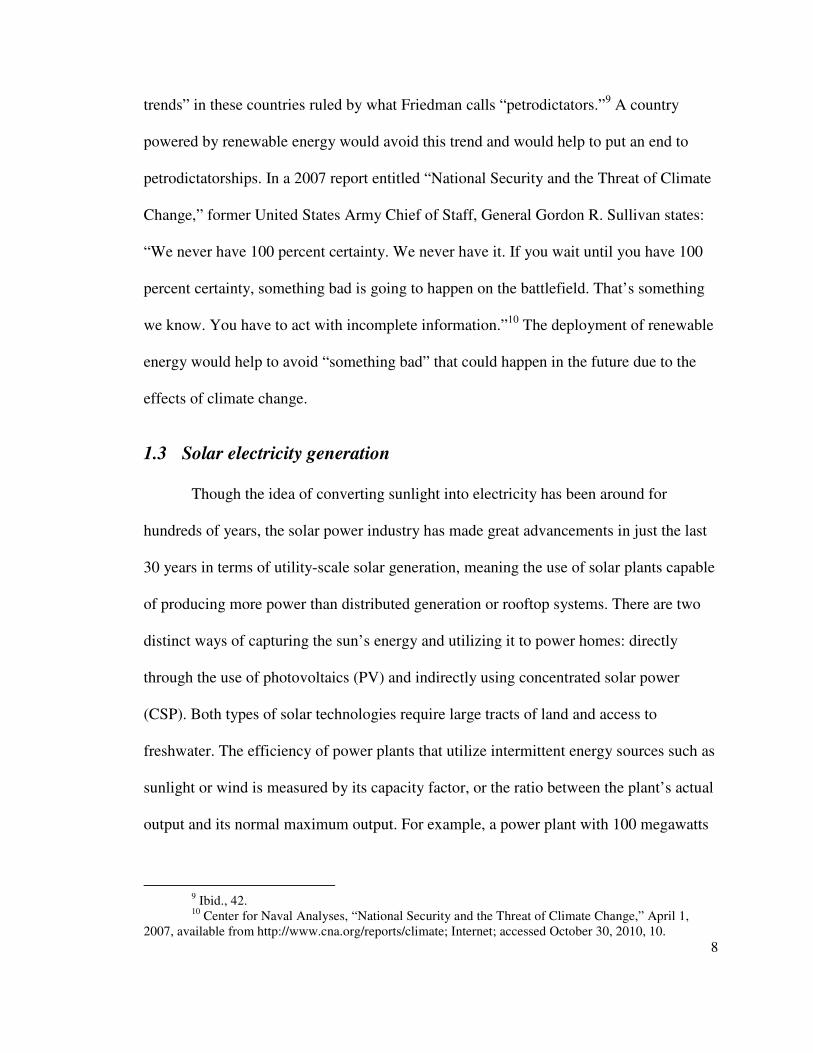
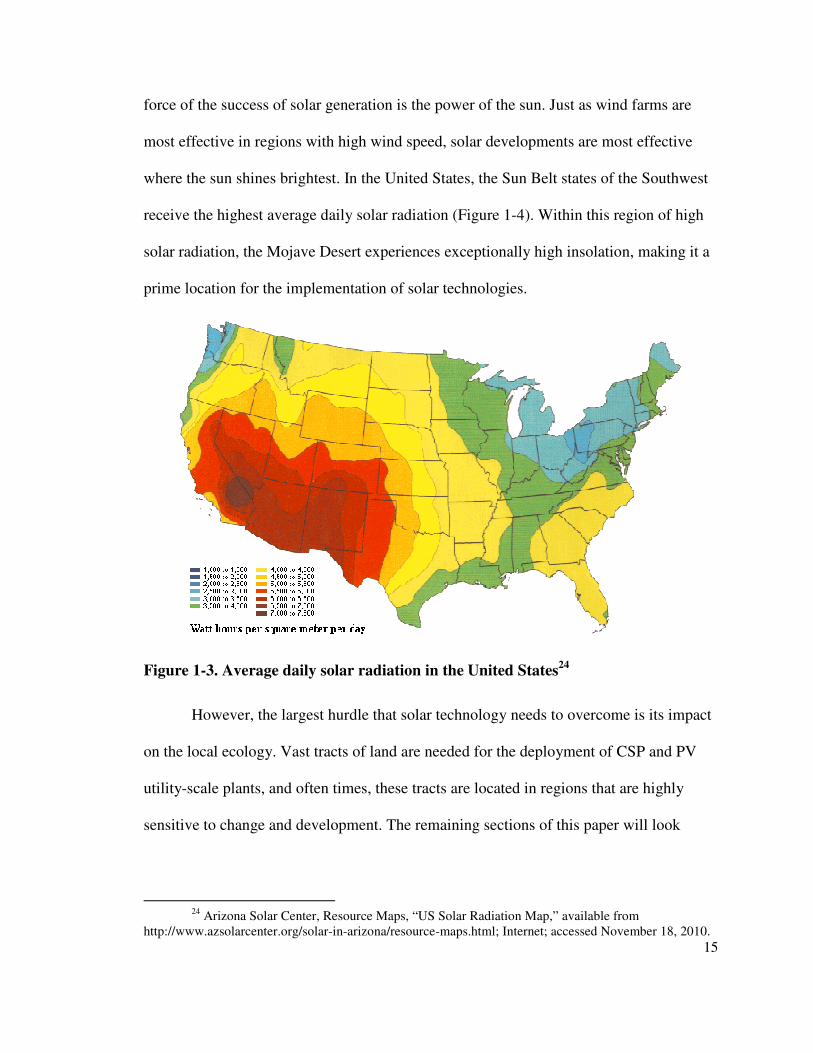
force of the success of solar generation is the power of the sun. Just as wind farms are
most effective in regions with high wind speed, solar developments are most effective
where the sun shines brightest. In the United States, the Sun Belt states of the Southwest
receive the highest average daily solar radiation (Figure 1-4). Within this region of high
solar radiation, the Mojave Desert experiences exceptionally high insolation, making it a
prime location for the implementation of solar technologies.
Figure 1-3. Average daily solar radiation in the United States24
However, the largest hurdle that solar technology needs to overcome is its impact
on the local ecology. Vast tracts of land are needed for the deployment of CSP and PV
utility-scale plants, and often times, these tracts are located in regions that are highly
sensitive to change and development. The remaining sections of this paper will look
24 Arizona Solar Center, Resource Maps, “US Solar Radiation Map,” available from
http://www.azsolarcenter.org/solar-in-arizona/resource-maps.html; Internet; accessed November 18, 2010.

16
specifically at solar development in the Mojave Desert and the policies and issues
affecting its future.
17
2 Mojave Desert
One of the characteristics that separate a desert from other climate regions is its
unchanging and static nature. Before humans began to inhabit and develop vast areas of
the world’s deserts (i.e. Las Vegas, Phoenix, Cairo, etc.), desert climates remained
largely unchanged for millions of years. Not only did the landscape experience little
alteration, but just about everything moved slowly also. Desert tortoises crept quietly and
undisturbed along the desert floor in search of grasses and wildflowers; cacti and sage
brush grew at a snail’s pace with little access to water; the rate of soil development and
weathering was undetectable.
All of a sudden at the start of the 21st century, humans started to alter the speed of
things in the desert. Historically, the Mojave Desert has seen incredible habitat loss
caused mainly by military use, mining, grazing, agriculture, infrastructure construction,
off-highway vehicle use, and energy generation. Because of its slow recovery time from
disturbance, deserts are incredibly fragile and “apparently minor actions can cause long-
term effects on soils and ground water and long-lasting consequences for plant and
animal populations and communities.”25 The “industrialization” of the Mojave Desert
due to its renewable energy potential especially has been occurring at an astonishing rate
in recent years, causing alarm among conservationists and desert advocacy groups. As the
United States and California move forward with renewable energy initiatives and projects
25 J. M. Randall et al., “Mojave Desert Ecoregional Assessment,” Unpublished Report. The Nature
Conservancy, San Francisco, California, September 2010, available from http://conserveonline.org/workspaces/mojave/ documents/mojave-desert-ecoregional- 2010/@@view.html; Internet; accessed September 14, 2010, 1.
18
in the Mojave Desert, it is important to understand and then minimize the detrimental
effects that large fields of CSP and PV have on the local ecosystem.
At present, the California Bureau of Land Management (BLM) is processing 31
large solar energy applications that, if all were to be approved and constructed, would
have a total capacity of 16,979 MW and cover 210,558 acres. Since September 2010, the
BLM has approved six solar applications in California with a total combined capacity of
3,038 MW and coverage of 23,625 acres. These six projects, if built as planned, will
generate enough electricity to power at least 911,050 homes and will create 4,751 jobs.26
2.1 Geography, climate, and ecology
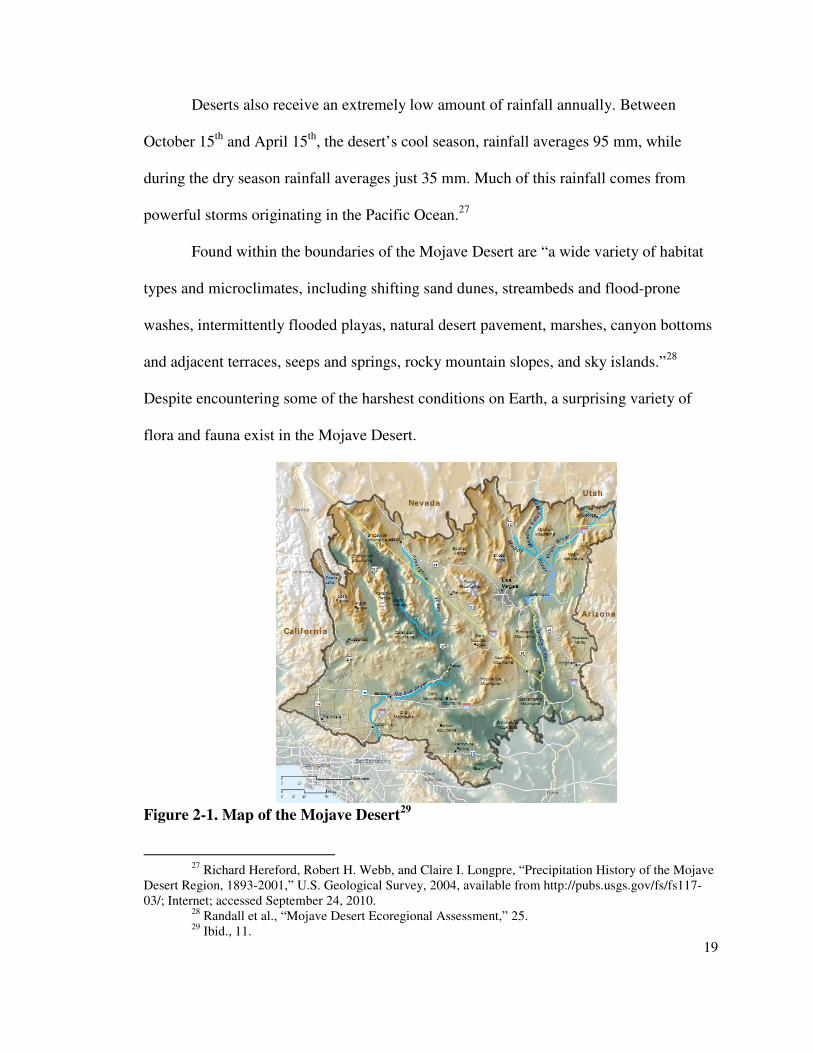
The Mojave Desert is located mostly in southeastern California and southern
Nevada, but also reaches western Arizona and the southwestern tip of Utah. The region
spans over 32 million acres of land with roughly 20 million acres occupying the state of
California, about one-fifth of the state’s total area (Figure 2-1). Considered one of North
America’s last great wilderness areas, the Mojave Desert remains untouched by human
activity in most areas. The desert is a land of extremes; brutal winds, extreme
temperatures, blistering sunlight, and severe aridity make the region seemingly difficult
to sustain life. Death Valley, located in the Mojave Desert, is both the lowest and hottest
place in North America and can experience temperatures greater than 130 degrees
Fahrenheit. Other regions of the desert record temperatures below 20 °F in the valleys
and below 0 °F at higher elevations during the winter.
26 Bureau of Land Management, “Solar Applications and Authorizations,” available from
http://www.blm.gov/pgdata/content/ca/en/fo/cdd/alternative_energy/ SolarEnergy.html; Internet; accessed November 23, 2010.
19
Deserts also receive an extremely low amount of rainfall annually. Between
October 15th and April 15th, the desert’s cool season, rainfall averages 95 mm, while
during the dry season rainfall averages just 35 mm. Much of this rainfall comes from
powerful storms originating in the Pacific Ocean.27
Found within the boundaries of the Mojave Desert are “a wide variety of habitat
types and microclimates, including shifting sand dunes, streambeds and flood-prone
washes, intermittently flooded playas, natural desert pavement, marshes, canyon bottoms
and adjacent terraces, seeps and springs, rocky mountain slopes, and sky islands.”28
Despite encountering some of the harshest conditions on Earth, a surprising variety of
flora and fauna exist in the Mojave Desert.
Figure 2-1. Map of the Mojave Desert29
27 Richard Hereford, Robert H. Webb, and Claire I. Longpre, “Precipitation History of the Mojave
Desert Region, 1893-2001,” U.S. Geological Survey, 2004, available from http://pubs.usgs.gov/fs/fs117-03/; Internet; accessed September 24, 2010.
28 Randall et al., “Mojave Desert Ecoregional Assessment,” 25. 29 Ibid., 11.
20
Home to over 2,400 native plant and animal species, at least 72 of which are
endemic, meaning they are found nowhere else, the Mojave Desert is one of the most
biologically diverse regions in the 48 contiguous United States.30 The region’s
geographic isolation has allowed for great speciation and high biodiversity. The
California portion of the Mojave Desert alone supports 439 vertebrate species, including
252 species of birds, 101 mammals, 57 reptiles, 10 amphibians, and 19 fishes. Out of
these species, 14 are endemic to the Mojave Desert and 28 are on the federal threatened
or endangered species list, including the desert tortoise, Devil’s Hole pupfish, and the
desert bighorn sheep.31 Most of these animals have adapted to the arid and hot conditions
of the desert over the course of millions of years and rely on the vegetation and diverse
habitats for their survival.
One of the best ways to determine where the desert begins is to look for the
presence of certain desert plant species; creosote bush and Joshua trees are abundant in
the Mojave Desert and serve as great indicators of the desert’s boundaries.32 Though
dominated mainly by perennial plant species such as willows and scrub, the Mojave
Desert boasts more than 250 ephemeral plant species. Out of these plants, 80-90 are
endemic33 and 16 are federally listed as threatened or endangered. Desert conditions do
not regularly allow new plant establishment, therefore many plant communities are long-
lived and fragile.
30 B.M. Pavlik, The California Deserts: an ecological rediscovery (Berkeley and Los Angeles:
University of California Press, 2008). 31 Randall et al., “Mojave Desert Ecoregional Assessment,” 23. 32 Sia Morhardt and Emil Morhardt, California Desert Wildflowers (Berkeley and Los Angeles:
University of California Press, 2004) 4. 33 R. M. Turner, “Mojave desertscrub,” Desert Plants 4 (1982): 157-168.
21
2.2 Policies affecting solar development
Beginning in 1981 with the completion of the 10 MW Solar One plant and the
subsequent completion of the SEGS I-IX between 1984 and 1990, the California desert
has been regarded as the state’s and the country’s most promising region for the
development of utility-scale solar because of its solar resources and proximity to large,
expanding cities. According to the Department of Energy’s (DOE) preliminary 2009
statistics, the United States’ net summer capacity of solar was 603 MW. California
provided the bulk of this capacity with 446 MW, while nearby states Nevada, Arizona,
and Colorado provided 89 MW, 11 MW, and 14 MW, respectively.34 With the help of
federal and state policy incentivizing the growth of solar, the Mojave Desert can become
a hotbed for renewable energy generation and significantly increase these capacity
figures. Over the course of the last 30 years, policies have been enacted that have both
helped and hindered the growth of solar energy.
2.2.1 Federal policy
In spite of the project development during the 1980s and a promising outlook for
the future, the Reagan Administration slashed the budget allocated for renewable energy
research and development by nearly 90 percent between 1981 and 1989, leaving solar
developers in the dust as cheaper, fossil fuel-based sources of energy commanded the
market.35 Little happened for years in the solar industry, and during 2001 and 2002,
California experienced an energy crisis consisting of rolling summer blackouts following
34 Energy Information Administration, “Total Renewable Net Summer Capacity by Energy Source
and State, 2009,” August 2010, available from http://www.eia.doe.gov/ cneaf/alternate/page/renew_energy_consump/table8.html; Internet; accessed September 13, 2010.
35 Fernandes et al., “Renewable Energy in the California Desert,” 58.
22
the deregulation of the energy industry and price hikes and manipulation by energy
companies like Enron. This crisis forced the state and the country to rethink energy
policy. Of the many outcomes of the crisis, certainly the most important was the
recognition of the energy industry’s overdependence on foreign sources, thus the demand
for solar and other renewables increased. Today, the United States makes up less than 5%
of the world population but consumes roughly 23% of the energy produced. As of 2005,
the United States was the world’s second greatest emitter of greenhouse gases, slightly
behind China.36 While these figures may not change drastically for decades, it is
necessary that the United States government adopt policies that make the energy
consumed more sustainable.
One of the largest energy bills in years, the Energy Policy Act of 2005 altered
federal energy policy in an attempt to fight an expanding array of energy problems. With
regards to renewable energy development, the bill authorized loan guarantees and
subsidies for alternative energy producers, giving “a short term boost to the developers
and investors waiting for better economic incentives to build utility-scale solar
facilities.”37 Tax incentives for solar developers increased from 10 to 30 percent and the
production tax credit was extended through December 31, 2007. The legislation
established Clean Energy Renewable Bonds (CREBs) that allow tax-exempt entities such
as governmental organizations or electric cooperatives to issue interest-free bonds. With
this program, the borrower only pays back the principal of the bond while the bondholder
receives federal tax credits in place of traditional interest payments. These tax credits
36 Bill Gross, “Sustainable Energy,” 2010 Nelson Speaker Series, Harvey Mudd College,
Claremont, California, October 22, 2010. 37 Fernandes et al., “Renewable Energy in the California Desert,” 60.
23
help to make investments in solar power less risky and foster solar power purchase
agreements between developers and utilities. In addition, the Energy Policy Act of 2005
states that within ten years of the date of enactment, the Secretary of the Interior should
“seek to have approved non-hydropower renewable energy projects located on the public
lands with a generation capacity of at least 10,000 megawatts of electricity.''38
However, at the same time that the Energy Policy Act of 2005 aided the
development of renewable energy, the bill also benefited big oil companies with “billions
of dollars in tax and royalty relief to encourage drilling for oil and gas in the Gulf of
Mexico and other offshore areas. There was even a $50-million annual earmark to
support technical research for the industry.”39 Policies such as this hinder the renewable
industry’s goal of achieving grid-parity, meaning the cost of generating electricity is
equal to, or cheaper than the cost of conventional energy sources.
Three years later, the Energy Improvement and Extension Act of 2008, part of the
Emergency Economic Stabilization Act of 2008, further extended tax credits and the
CREBs program. The 30 percent investment tax credit for solar energy property was
extended through 2016 and an additional $800 million in CREBs was authorized for a
period of two years.40
Early on in Barack Obama’s campaign for president in 2007 and 2008, it was very
clear that, if elected, he would maintain a strong focus on the deployment of renewable
energy. Once in office, President Obama enacted a Renewable Portfolio Standard (RPS)
38 Library of Congress, “Bill Summary and Status: Energy Policy Act of 2005,” available from
http://thomas.loc.gov/cgi-bin/bdquery/z?d109:h6:; Internet; accessed October 12, 2010. 39 Kim Geiger and Tom Hamburger, “Oil companies have a rich history of U.S. subsidies,” Los
Angeles Times, May 25, 2010. 40 Department of Energy, “The Emergency Economic Stabilization Act of 2008: Energy Tax
Incentives,” available from http://www.energy.gov/media/HR_1424.pdf; Internet; accessed October 12, 2010.
24
that set a 2025 goal requiring that 25 percent of the United States’ power originate from
renewable sources. According to the DOE, there are currently 24 states plus the District
of Columbia that have enacted similar RPS goals.41 In an important symbolic step
showing his continued commitment to his goal, President Obama agreed to install solar
hot water panels and PV technology on the White House roof. Also under his command,
the Department of the Interior (DOI) has promised to increase renewable energy capacity
on public lands by at least 9,000 MW by 2011, making the Energy Policy Act’s target of
10,000 MW by 2015 very feasible.42
When the economy took a turn for the worse and entered a recession in December
of 2007, the American public looked to the government for answers. Congress passed the
American Recovery and Reinvestment Act of 2009 (ARRA), often known as the stimulus
package, on February 17, 2009, with roughly $787 billion worth of initiatives aimed at
creating jobs and spurring investment and consumer spending. The stimulus package
earmarked a significant sum of money to renewable energy. More than $16.8 billion went
toward funding the DOE’s Office of Energy Efficiency and Renewable Energy (EERE).
Additional money was allocated for a new renewable energy grant program that provides
30 percent grants in the form of a cash payment in lieu of investment tax credits for
projects that break ground before 2011. Billions more went towards investing in energy
41 Department of Energy, “States with Renewable Portfolio Standards,” available from
http://apps1.eere.energy.gov/states/maps/renewable_portfolio_states.cfm; Internet; accessed October 29, 2010.
42 Department of the Interior, “New Energy Frontier,” available from http://www.doi.gov/whatwedo/energy/index.cfm; Internet; accessed October 29, 2010.
25
and grid efficiency, transmission technologies, electric vehicles, and renewable energy
research.43
Developers and investors over the past few years have been critical of the
application process for large-scale solar, claiming that it is too long and expensive.
Nevertheless, the application and approval process for large plants is very important in
addressing the specific effects of each particular project. In California, projects with a
generating capacity of 50 MW or greater must endure an extensive review process,
requiring approval from both the BLM and the California Energy Commission (CEC).
Per state and federal law, the proposal must include an environmental assessment (EA)
and an environmental impact statement (EIS) under the National Environmental
Protection and an environmental impact report (EIR) under the California Environmental
Quality Act. If an EA determines that a project will have significant effect on the
environment, then an EIS and EIR need to be prepared. Both documents state the purpose
and need for the proposed project, analyze its environmental and socioeconomic impacts,
discuss alternatives, and incorporate a public scoping period. Once completed, the final
process is to obtain a right-of-way (ROW) grant from the BLM, if the project is to be
located on public lands, and an Application for Certification (AFC) from the CEC.
In April of 2009, the BLM announced that they would be implementing a “fast-
track” program that would speed up the review process of renewable energy projects if
developers could prove their commitment and readiness. The program strives to approve
as many proposed solar projects as possible so that they can be eligible for the ARRA’s
43 Internal Revenue Service, “Energy Incentives for Businesses in the American Recovery and
Reinvestment Act,” available from http://www.irs.gov/newsroom/article/ 0,,id=209564,00. html; Internet; accessed October 29, 2010.
26
grants that expire at the end of 2010 and the United States can meet its RPS goals. Ethan
Zindler, Head of Policy Analysis at Bloomberg New Energy Finance, believes that
“large-scale CSP stands to benefit. Right now, the process of filing for an individual EIS
for each project is long and time-consuming and expensive. Anything to make the
process more streamlined, fast-trackable and predictable would be a good thing.”44 The
Administration hopes to achieve exactly this in order to make solar development more
attractive for developers and investors.
2.2.2 California and regional policy
In California, where the majority of solar projects in the United States have been
proposed or already approved, the state government has enacted numerous policies in just
the last decade that promote the development of solar. Leading the way in renewable
energy and battling climate change, California is making itself one of the best states to
deploy renewable energy projects. Most significantly, the state adopted what is
considered to be the world’s most ambitious law to combat climate change.
Signed into law by Governor Arnold Schwarzenegger on September 27, 2006, the
Global Warming Solutions Act, usually referred to as simply AB 32, uses market-based
incentives to reduce the state’s carbon emissions to 1990 levels by 2020 and to 80 percent
below 1990 levels by 2050. The timetable created by the bill attempts to bring California
into compliance with the Kyoto Protocol, which the Bush Administration rejected on the
federal level in 2001. As noted in the bill, large emitters are required to report annual
greenhouse gas emissions and an emissions limit will be implemented on January 1, 2012
44 Bob Moser, “The BLM fast track: Speeding CSP project development in the US?” CSP Today,
July 16, 2010, available from http://social.csptoday.com/industry-insight/blm-fast-track-speeding-csp-project-development-us; Internet; accessed November 6, 2010.
27
with the possible utilization of a market-based cap-and-trade system.45 Overall, AB 32
encourages the development of renewable technologies and the adoption of small and
large-scale alternative energies such as solar in order to cut harmful emissions that
contribute to global warming.
California has also set RPS targets of its own. Established in 2002, its target was
accelerated in 2003 under Energy Action Plan I to require “electric corporations to
increase procurement from eligible renewable energy resources by at least 1% of their
retail sales annually, until they reach 20% by 2010.” 46 Senate Bill 107 later codified the
deadline, the most aggressive in the United States, into law. Two years later, Governor
Schwarzenegger issued Executive Order S-14-08 mandating that utilities reach 33 percent
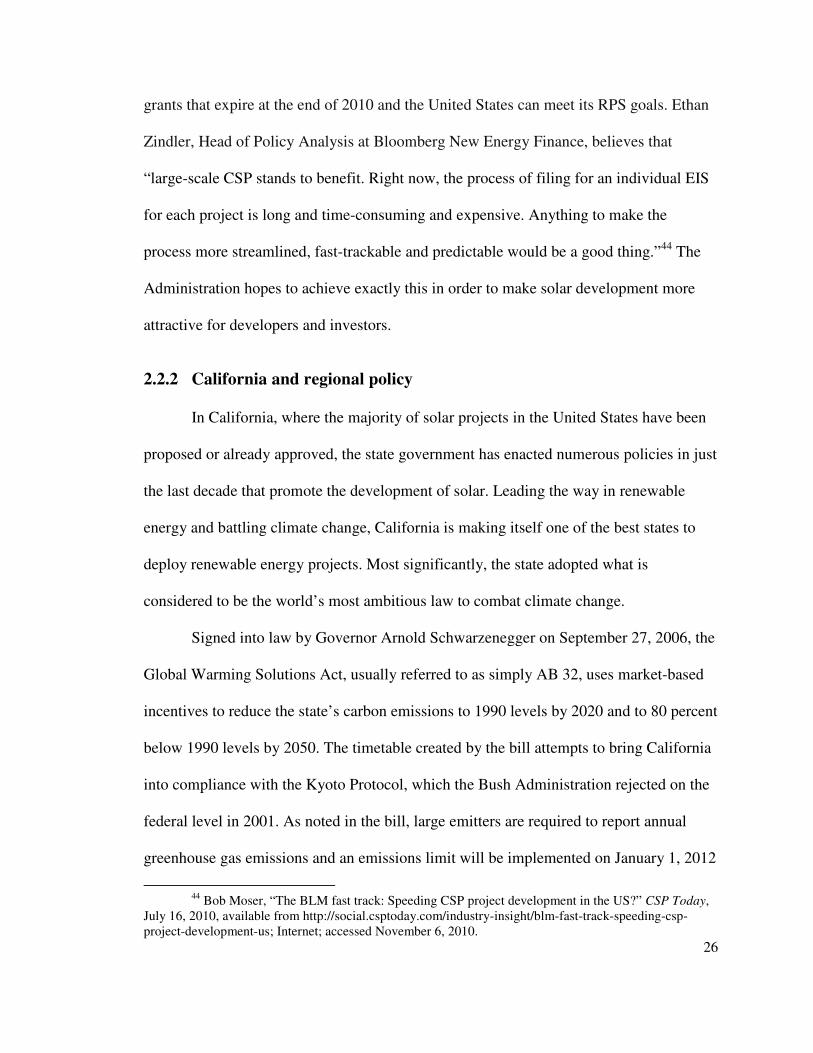
renewable sources by 2020.47 In 2008, non-hydro renewable made up just 11% of
California’s total system power (Figure 2-2). In order to meet the 33% RPS target,
renewable electricity generation needs to triple from 27 terawatt hours (TWh) in 2009 to
approximately 75 TWh in 2020.48 These ambitious goals set out by the state have further
helped spur solar development. In order to facilitate this rise in solar, numerous new
transmission lines must be built to transmit the electricity generated from renewable
sources in the desert and other remote areas to the consumer.
45 California Air Resources Board, “Assembly Bill 32: Global Warming Solutions Act,” available
from http://www.arb.ca.gov/cc/ab32/ab32.htm; Internet; accessed October 15, 2010. 46 California Public Utilities Commission, “RPS Program Overview,” available from
http://www.cpuc.ca.gov/PUC/energy/Renewables/overview.htm; Internet; accessed October 15, 2010. 47 Office of the Governor, “Executive Order S-14-08,” November 17, 2008, available from
http://www.gov.ca.gov/executive-order/11072/; Internet; accessed October 15, 2010. 48 California Public Utilities Commission, “33% Renewables Portfolio Standard Implementation
Analysis Preliminary Results,” June 2009, available from http://www.cpuc.ca.gov/PUC/energy/Renewables/hot/33implementation.htm; Internet; accessed October 20, 2010.
28
Figure 2-2. California total system power (by source, 2008)49
To address the issue of transmission lines, California has adopted the statewide
Renewable Energy Transmission Initiative (RETI). The RETI effort seeks to identify the
transmission projects and transmission corridors that are needed in order to meet the RPS
goals. The initiative also hopes to prepare transmission line plans for projects that are the
most inexpensive and have few effects on the natural environment.50 The issues regarding
transmission line siting and construction will be discussed in the next chapter.
Because of the influx of solar applications since RPS and other state and federal
mandates have been implemented, the DOE and DOI have begun to prepare a Solar
Energy Development Programmatic EIS (PEIS) that would help to expedite the long and
expensive application process for solar projects. The PEIS covers the six western states of
49 California Energy Commission, “Total Electricity System Power,” available from
http://energyalmanac.ca.gov/electricity/system_power/2008_total_system_ power.html; Internet; accessed September 23, 2010.
50 California Energy Commission, “Renewable Energy Transmission Initiative,” available from http://www1.eere.energy.gov/solar/linear_concentrator_rnd.html; Internet; accessed September 29, 2010.
Coal18%Large Hydro
11%
Natural Gas46%
Nuclear14%
Biomass2%
Geothermal5%
Small Hydro2%
Solar0.2%
Wind2%Renewables
11%
29
California, Arizona, Colorado, New Mexico, Nevada, and Utah and will assess the
environmental, cultural, and socioeconomic impacts of “broad agency actions, such as the
development of programs or the setting of national policy.”51 More specifically, the PEIS
will steer future application decisions, evaluate the cumulative effects of numerous
projects, consider mitigation strategies, and identify BLM lands that are potentially
environmentally suitable for development. If the BLM offices in the six-state study area
were to adopt a new solar energy development program, the agency would be better
equipped to process and review new project applications, resulting in more sustainable
projects in predetermined areas and quicker application turnover.
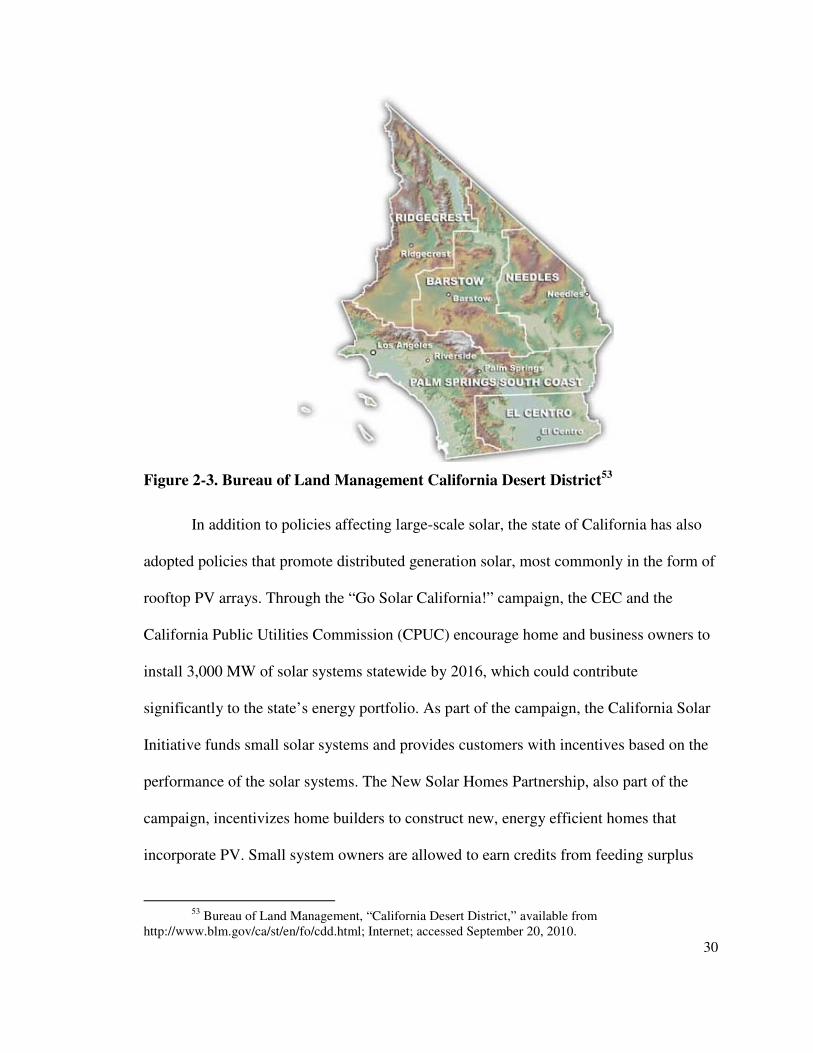
The BLM’s fast-track program in California, also aimed at dealing with the influx
of solar applications, has been very successful up to date. Of the eight solar projects in
the BLM’s California Desert District (Figure 2-3) considered for the fast-track process,
seven have been approved. In an October 2010 interview with online magazine Yale
Environment 360, John Woolard, CEO of BrightSource Energy, proclaimed that the
United States has “done 74,000 permits for oil and gas in the last 20 years and we finally
have five or six for solar. That’s a good step forward. The agencies are learning how to
permit, they’re learning how to move forward.”52 He adds that if policies continue to be
implemented that accelerate the application and approval process, the future looks bright
for solar energy development.
51 Department of Energy and Department of the Interior, “Solar Energy PEIS Fact Sheet,”
available from http://solareis.anl.gov/documents/index.cfm; Internet; accessed November 9, 2010. 52 Todd Woody, “In California’s Mojave Desert, Solar-Thermal Projects Take Off,” Yael
Environment 360, October 27, 2010, available from http://e360.yale.edu/content/feature.msp?id=2334; Internet; accessed November 3, 2010.
30
Figure 2-3. Bureau of Land Management California Desert District53
In addition to policies affecting large-scale solar, the state of California has also
adopted policies that promote distributed generation solar, most commonly in the form of
rooftop PV arrays. Through the “Go Solar California!” campaign, the CEC and the
California Public Utilities Commission (CPUC) encourage home and business owners to
install 3,000 MW of solar systems statewide by 2016, which could contribute
significantly to the state’s energy portfolio. As part of the campaign, the California Solar
Initiative funds small solar systems and provides customers with incentives based on the
performance of the solar systems. The New Solar Homes Partnership, also part of the
campaign, incentivizes home builders to construct new, energy efficient homes that
incorporate PV. Small system owners are allowed to earn credits from feeding surplus
53 Bureau of Land Management, “California Desert District,” available from
http://www.blm.gov/ca/st/en/fo/cdd.html; Internet; accessed September 20, 2010.
31
electricity back to the grid through net-metering. Moreover, feed-in tariffs currently
permit the owners of small systems to sign 10-20 year contracts with utility companies,
allowing them to sell electricity at a calculated price.
One outcome of all of the debate and legislation affecting solar energy is that it
has created a divide amongst interested and affected parties, sometimes pitting “green
versus green.” The main argument is whether combating the long-term effects of global
climate change through the generation of carbon-free electricity is worth compromising
the local environment affected by solar projects. While many of the aforementioned
policies promote solar development, they do not deal directly with conservation efforts.
As a result, conservationists have raised questions concerning the ecological impacts of
solar projects and whether siting decisions are made in a responsible manner.
Introduced to the United States Senate in December 2009, one bill hopes to bridge
this divide. The California Desert Protection Act of 2010, proposed by Diane Feinstein
(D-CA), would establish nearly 1.1 million acres as national monuments or wilderness
designations, rendering them permanently undevelopable. However, of the 351,000 acres
of land designated by the BLM as Solar Energy Study Areas, none would be affected by
the legislation. The bill also contains provisions to increase solar development on military
lands and expedite renewable energy projects proposed on private lands.54
2.3 Benefits of solar in the Mojave Desert
Solar development in the Mojave Desert would come with numerous benefits to
the state and region. Most significantly, solar development would create thousands of
54 Campaign for the California Desert, “Renewable Energy Development Fact Sheet,” available
from http://www.californiadesert.org/; Internet; accessed October 23, 2010.
32
jobs in a region that is suffering greatly from the effects of the recession. In July of 2010,
San Bernardino and Riverside counties experienced unemployment rates of 14.8% and
15.4%, respectively, among some of the highest in the country. 55 Unemployment rates
this high in these counties have not been recorded since 1990 when the Bureau of Labor
Statistics began recording countywide employment data. The demand for “green” jobs
due to solar plant construction and operations would most certainly help to curb
unemployment rates in the desert region.
There exist few places in the world that are so predisposed to such favorable solar
generation conditions as the Mojave Desert. With high solar radiation, large cities nearby,
millions of acres of undeveloped land, and advantageous government policies, California
and the Mojave Desert can become the world’s hub for solar technologies. The state,
already home to many “cleantech” startups, could attract even more companies, investors,
research organizations, and innovators to the region, which would generate revenue for
both the state and desert region.
A 2006 National Renewable Energy Laboratory (NREL) study of the economic
and environmental benefits of CSP development in California calculated results assuming
a scenario in which 4,000 MW of CSP would be deployed by 2020. They found that
power generation by CSP power plants in place of natural gas plants would offset “at
least 300 tons per year of NOx emissions, 180 tons of CO emissions per year, and
7,600,000 tons per year of CO2.” The report also concluded that CSP plant operations
would create more permanent jobs than a natural gas plant and each dollar spent on CSP
55 Bureau of Labor Statistics, “Local Area Unemployment Statistics,” available from
http://bls.gov/data/; Internet; accessed November 24, 2010.
33
compared to each dollar spent on natural gas plants contributes more to California’s
Gross State Product.56
56 Stoddard, Abiecunas, and O'Connell, “Economic, Energy, and Environmental Benefits of
Concentrating Solar Power in California,” 11.
34
3 Impacts
There are many challenges that come with utility-scale solar power generation in
the Mojave Desert. Though solar energy systems contribute to the sustainable
development of human activities because of their use of clean and renewable sources, just
like any method of electricity generation, solar plants have detrimental impacts on the
environment. The goal of permitting agencies and participating parties is to minimize the
negative effects of solar development on the environment, plant and animal species, and
humans. Because of the considerable pressures placed on permitting agencies by the state
and federal government to quickly review proposals in order to meet RPS targets and
other requirements, some of the impacts can be given insufficient attention or looked over
completely. Though the extent and severity of the impacts of solar development cannot
be 100 percent known for certain because such few solar plants have been operated at a
large scale, mitigation measures and sensible planning must be utilized before solar
deployment.
3.1 Land use
All commercial-scale solar plants require vast tracts of land to generate electricity.
For technologies exhibiting economies of scale, the larger the solar field, the more
efficient the power system is, and therefore it is often in the developers’ best interest to
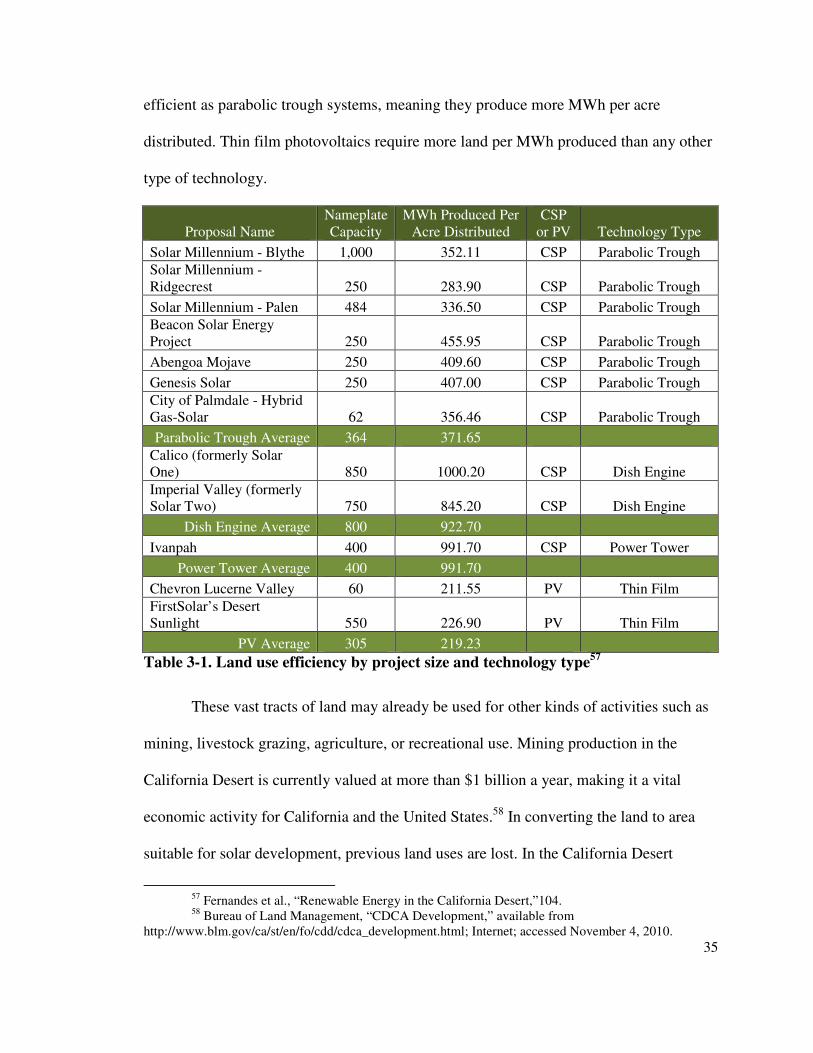
construct systems that span thousands of acres. Solar thermal technology has a clear
advantage over photovoltaic technology in terms of land use because of its higher
efficiency (Table 3-1). Based on data from current and proposed solar plants with varying
CSP technology types, power tower and dish engine systems are more than twice as
35
efficient as parabolic trough systems, meaning they produce more MWh per acre
distributed. Thin film photovoltaics require more land per MWh produced than any other
type of technology.
Proposal Name Nameplate Capacity
MWh Produced Per Acre Distributed
CSP or PV Technology Type
Solar Millennium - Blythe 1,000 352.11 CSP Parabolic Trough
Solar Millennium - Ridgecrest 250 283.90 CSP Parabolic Trough
Solar Millennium - Palen 484 336.50 CSP Parabolic Trough
Beacon Solar Energy Project 250 455.95 CSP Parabolic Trough
Abengoa Mojave 250 409.60 CSP Parabolic Trough
Genesis Solar 250 407.00 CSP Parabolic Trough
City of Palmdale - Hybrid Gas-Solar 62 356.46 CSP Parabolic Trough
Parabolic Trough Average 364 371.65
Calico (formerly Solar One) 850 1000.20 CSP Dish Engine
Imperial Valley (formerly Solar Two) 750 845.20 CSP Dish Engine
Dish Engine Average 800 922.70
Ivanpah 400 991.70 CSP Power Tower
Power Tower Average 400 991.70
Chevron Lucerne Valley 60 211.55 PV Thin Film
FirstSolar’s Desert Sunlight 550 226.90 PV Thin Film
PV Average 305 219.23
Table 3-1. Land use efficiency by project size and technology type57
These vast tracts of land may already be used for other kinds of activities such as
mining, livestock grazing, agriculture, or recreational use. Mining production in the
California Desert is currently valued at more than $1 billion a year, making it a vital
economic activity for California and the United States.58 In converting the land to area
suitable for solar development, previous land uses are lost. In the California Desert
57 Fernandes et al., “Renewable Energy in the California Desert,”104. 58 Bureau of Land Management, “CDCA Development,” available from
http://www.blm.gov/ca/st/en/fo/cdd/cdca_development.html; Internet; accessed November 4, 2010.
36
Conservation Area, the BLM is in charge of protecting and preserving close to 11 million
acres. This responsibility involves overseeing and defending the natural, historic,
recreational and economic assets of the California Desert.
Not under the oversight of the BLM are the 4,743,574 acres of the Mojave Desert
that are privately owned or the 139,154 acres that belong to Native American tribal
lands.59 Much of the Mojave Desert can be described as a “checkerboard” of public and
private land, making development across many acres difficult because projects may cross
tracts of land that belong to multiple private landowners. Some developers prefer the
advantages of siting on public land only: working with one federal landowner (as
opposed to many private landowners), the capability of returning the land if the project
does not go through, the fast-tracking process. Others prefer the advantages of siting on
private land: a faster permitting process, a fixed price for the land used, often level land
from previous agricultural use. Despite the differences of constructing solar power on
public versus private land, the impacts of such projects can be observed outside of just
the acres designated for development. Solar facilities require roads to facilitate the
construction and operation of the plants and transmission lines to facilitate the
transmission of electricity to areas where there is demand. These construction activities
further alter the natural landscape.
One recent study looked at the importance of the Mojave Desert as a carbon sink.
The authors found that the “desert ecosystem CO2 exchange may be playing a much
larger role in global carbon cycling…than previously assumed.60 The construction of
59 Randall et al., “Mojave Desert Ecoregional Assessment,” 18. 60 George Wohlfahrt, Lynn F. Fenstermaker, and John A. Arnone III, “Large annual net
ecosystem CO2 uptake of a Mojave Desert ecosystem,” Global Change Biology (2008) 14: 1475-1487.
37
solar systems involves the destruction of soil, plants, and animals through bulldozing, the
grading of land, and the installation of facility structures. This process releases large
amounts of carbon into the atmosphere and reduces the future carbon sequestration
abilities of the ecosystem.61 Whether this release of carbon is greater than the amount of
carbon saved from entering the atmosphere by utilizing renewable technologies instead of
conventional energy sources is unknown and debated.
3.2 Desert ecosystem
The most obvious impact of solar electricity generation in the Mojave Desert is its
degradation of the ecosystem. The implementation of CSP and PV systems causes
incalculable effects on the stability, diversity, and productivity of the desert’s land and
plant and animal species. These impacts are both seen in the short-term and long-term.
After grading, vegetation removal, and soil disturbance has occurred, “recovery to
predisturbance plant cover and biomass may take 50–300 years, while complete
ecosystem recovery may require over 3000 years.”62 The desert’s slow rate of recovery
means that natural landscapes would be affected for many years after the construction
and/or decommission of solar projects.
Arrays of photovoltaics and mirrors across large fields obstruct natural sunlight,
rainfall, and drainage. This interference could result in diminished plant growth, poor soil
stability, soil compaction, vulnerability to wind erosion, increased dust emission, altered
nutrient cycles, uneven water infiltration, and diverted water flow, among other impacts.
61 Holly Campbell et al., “Here Comes the Sun: Solar Thermal in the Mojave Desert – Carbon
Reduction or Loss of Sequestration?” March 13, 2009, 22. 62 Jeffrey E. Lovich and David Bainbridge, “Anthropogenic Degradation of the Southern
California Desert Ecosystem and Prospects for Natural Recovery and Restoration,” Environmental
Management 24 (1999): 309.
38
Ecological impacts such as these can completely alter the Mojave Desert’s natural cycles
that have made the region suitable for the native flora and fauna for millions of years.
One considerable concern indicated by desert biologists is the proliferation of
fires in the future, a direct result of human activity. In the desert, native species,
especially perennial plants, are not adapted to frequent fires. Solar development
facilitates the spread of invasive plant species, which increase the frequency of fires. The
decomposition of organic matter in the desert occurs at a slow rate, therefore the buildup
of plant material acts as added fuel for destructive fires. Invasive grasses and shrubs such
as Bromus, Schismus, and Salsola have decreased plant community spacing and increased
groundcover, making the California desert much more vulnerable to fire.63 The potential
for Mojave Desert ecosystems to recover from such blazes is low.
Accidental chemical discharges or leakages also represent a threat to the health of
the ecosystem. PV technology is sometimes made up of hazardous materials, and if
damaged during the life of the plant, these materials can pollute the surrounding
environment. The HTF of CSP systems are of more concern because the fluid is often
heated to a very high temperature, thus posing a fire risk if discharged or leaked. Other
fluids found at the solar facilities can be hazardous and could damage the plant and
animal species. If any of these fluids were to reach soil or groundwater, there would be a
danger to the public as well.64
Vehicle traffic in the Mojave Desert has been the cause of the deaths of numerous
animal species. The deaths of desert tortoises and other animals attempting to cross roads
63 Ibid., 318. 64 Theocharis Tsoutsos, Niki Frantzeskaki, and Vassilis Gekas, “Environmental impacts from the
solar energy technologies,” Energy Policy 33 (2005) 289-296.
39
are inevitable even though measures have been taken to try to mitigate the problem.
Increased vehicle traffic for construction activities and general plant operations would
surely increase the number of unintended fatal vehicle strikes. Vehicles and construction
equipment also facilitate the introduction of nonnative and invasive plant species, acting
as transporters of seeds from one place to another.
The Mojave Desert is a critical corridor for wide-ranging species such as the
jackrabbit and desert bighorn sheep. Fences (serving as security for the solar plants and
as a barrier to prevent wildlife from entering project sites) and roads can block off these
corridors, restricting or blocking a species’ ability to migrate or access suitable habitat
areas. For example, the desert bighorn sheep might abstain from crossing a busy road
because of the risk of getting hit, essentially resulting in a loss of habitat due to
fragmentation.
3.3 Endangered species
The Mojave Desert’s geographic isolation has allowed for great speciation and high
biodiversity. However, speciation as a result of isolation has also made species more
susceptible to extinction by limiting their natural habitats to specific regions and reducing
their population size due to reproductive isolation. The Endangered Species Act (ESA),
signed into law in 1973, was designed to prevent the extinction of species by protecting
threatened plants and animals, preserving critical habitat areas, enacting recovery plans,
and prohibiting activities that may further endanger a listed species. Numerous federally
listed species call the Mojave Desert home. Although critically endangered, endangered,
40
and vulnerable species are protected under federal law, the imminent rise in solar
developments will adversely affect these populations.
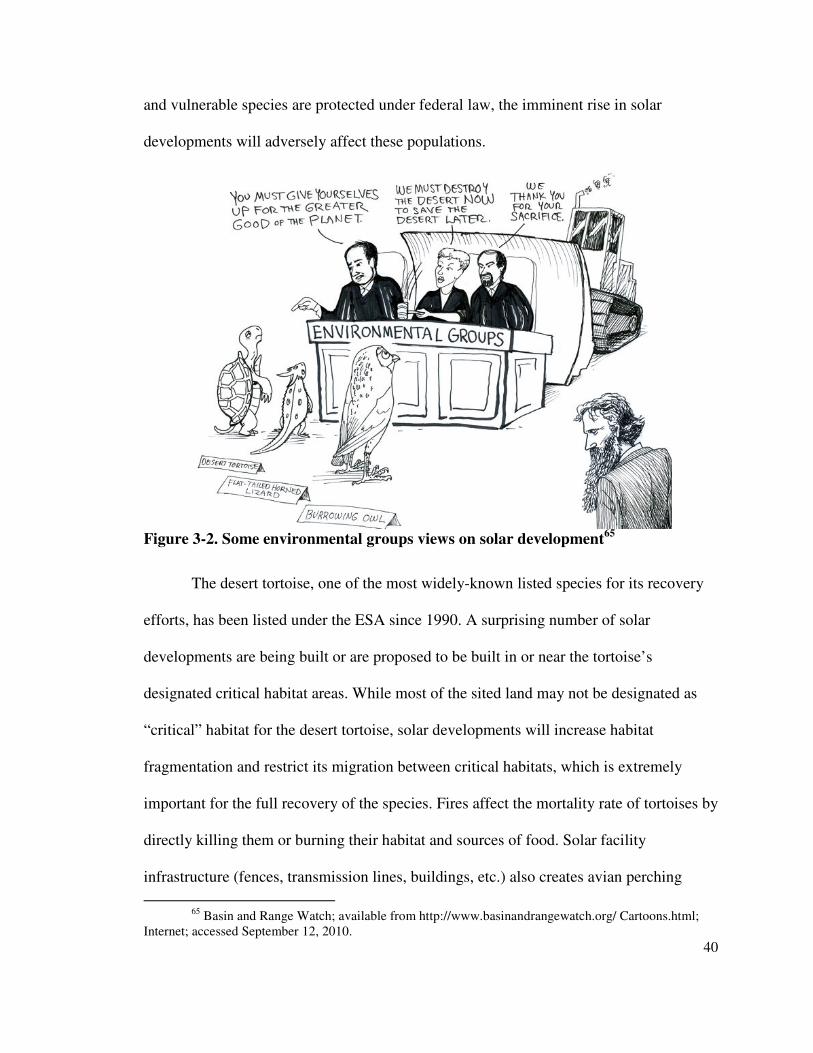
Figure 3-2. Some environmental groups views on solar development
65
The desert tortoise, one of the most widely-known listed species for its recovery
efforts, has been listed under the ESA since 1990. A surprising number of solar
developments are being built or are proposed to be built in or near the tortoise’s
designated critical habitat areas. While most of the sited land may not be designated as
“critical” habitat for the desert tortoise, solar developments will increase habitat
fragmentation and restrict its migration between critical habitats, which is extremely
important for the full recovery of the species. Fires affect the mortality rate of tortoises by
directly killing them or burning their habitat and sources of food. Solar facility
infrastructure (fences, transmission lines, buildings, etc.) also creates avian perching
65 Basin and Range Watch; available from http://www.basinandrangewatch.org/ Cartoons.html;
Internet; accessed September 12, 2010.
41
opportunities that could increase the number of birds that prey on the newly-hatched
desert tortoise such as the common raven. As a result of these various impacts,
populations have seen continued declines for a number of years.66
Other endangered species such as the Coachella Valley fringe-toed lizard and the
foxtail cactus face similar scenarios. Whether they are threatened by invasive species,
decreased water availability, or greater human presence, endangered species in the
Mojave Desert are fighting for survival because of an increase in solar development.
3.4 Transmission lines
In order to bring the approved solar projects on line in California, massive
improvements to existing transmission line and construction of entirely new transmission
lines are necessary. The state’s RETI aims to facilitate transmission corridor designation
and transmission siting permitting. Solar developers maintain that “while solar projects
are in the fast-lane, transmission projects are still in the slow-lane.” John Woolard
compares the encouragement of solar energy development in the desert without
transmission infrastructure to support it to “promoting interstate commerce without the
infrastructure to achieve it.”67 Though transmission lines are characterized by long,
narrow corridors, their impacts are not confined to their immediate areas; their impacts
usually extend far past the physical structures and linear corridors.
While transmission lines are necessary, just as roads and fences cause habitat loss,
degradation, and fragmentation, transmission lines cut across hundreds of miles, disrupt
the natural environment, and pose a fire risk. Soil disturbance during construction allows
66 Fernandes et al., “Renewable Energy in the California Desert,” 118. 67 Todd Woody, “In California’s Mojave Desert, Solar-Thermal Projects Take Off.”
42
the intrusion of invasive plant species and contributes to soil erosion. Transmission
towers placed on sloped land can significantly increase wind erosion and erosion from
water runoff.
When transmission lines are first constructed, the recovery of the disturbed land is
gradual. Immediately following construction, invasive ephemeral plant species inhabit
the area, but perennial plant species could not return for more than five years after.68
Increased human access via roads accompanying transmission lines can hinder this plant
growth and deter animals from inhabiting the corridor.
3.5 Water use
Solar electricity systems require significant amounts of water annually to operate
and have very serious impacts on groundwater and surface water availability. In the
Mojave Desert, where water resources are scarce, water use is a very heated issue.
Parabolic trough plants and power towers sometimes use water as an HTF and for cooling
systems. They also use a very small amount of water for washing heliostats and mirrors.
Photovoltaic plants do not require cooling systems and only use water to clean dust and
other particles off of PV arrays to improve efficiency.
CSP technology types are capable of using either a wet or dry-cooling system.
Though water is inexpensive and effective for cooling, water scarcity issues have forced
some projects to employ dry-cooling. Dry-cooling systems utilize fans to blow air
directly across solar arrays and wet-cooling systems utilize water to create an evaporative
cooling effect. While dry-cooling drastically reduces water consumption, overall power
68 Lovich and Bainbridge, “Anthropogenic Degradation of the Southern California Desert
Ecosystem and Prospects for Natural Recovery and Restoration,” 314.
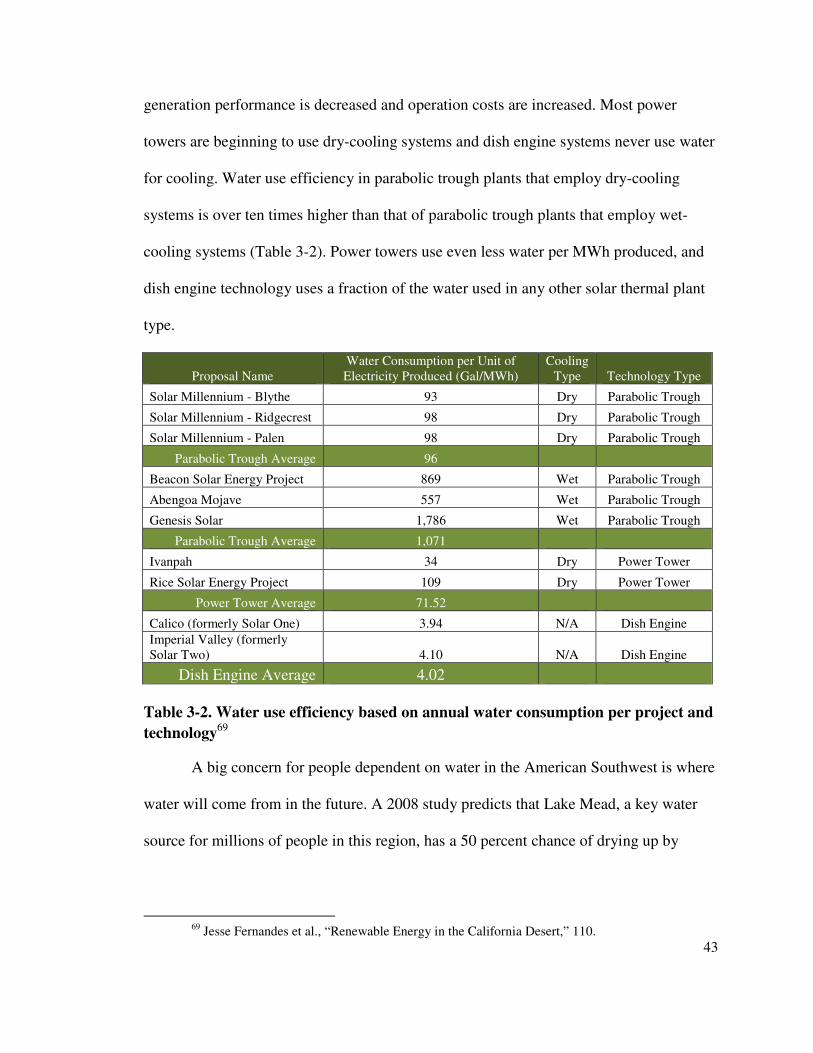
43
generation performance is decreased and operation costs are increased. Most power
towers are beginning to use dry-cooling systems and dish engine systems never use water
for cooling. Water use efficiency in parabolic trough plants that employ dry-cooling
systems is over ten times higher than that of parabolic trough plants that employ wet-
cooling systems (Table 3-2). Power towers use even less water per MWh produced, and
dish engine technology uses a fraction of the water used in any other solar thermal plant
type.
Proposal Name Water Consumption per Unit of Electricity Produced (Gal/MWh)
Cooling Type Technology Type
Solar Millennium - Blythe 93 Dry Parabolic Trough
Solar Millennium - Ridgecrest 98 Dry Parabolic Trough
Solar Millennium - Palen 98 Dry Parabolic Trough
Parabolic Trough Average 96
Beacon Solar Energy Project 869 Wet Parabolic Trough
Abengoa Mojave 557 Wet Parabolic Trough
Genesis Solar 1,786 Wet Parabolic Trough
Parabolic Trough Average 1,071
Ivanpah 34 Dry Power Tower
Rice Solar Energy Project 109 Dry Power Tower
Power Tower Average 71.52
Calico (formerly Solar One) 3.94 N/A Dish Engine
Imperial Valley (formerly Solar Two) 4.10 N/A Dish Engine
Dish Engine Average 4.02
Table 3-2. Water use efficiency based on annual water consumption per project and
technology69
A big concern for people dependent on water in the American Southwest is where
water will come from in the future. A 2008 study predicts that Lake Mead, a key water
source for millions of people in this region, has a 50 percent chance of drying up by
69 Jesse Fernandes et al., “Renewable Energy in the California Desert,” 110.
44
2021.70 If Lake Mead does dry up as predicted, southwestern states will have a severe
crisis on their hands. The hydrology of the desert has already exhibited its sensitivity to
regional water use as increased consumption from cities like Las Vegas has directly
affected groundwater systems.
3.6 Air quality
Though global air quality will generally benefit from the deployment of CSP and
PV, local air quality could suffer. The Mojave Desert is a region that has very little air
pollution because of its lack of industry and its vast tracts of undeveloped land. With the
introduction of more solar facilities to the desert, more emissions of pollutants into the
atmosphere would occur. Sometimes, solar thermal plants are used in conjunction with
hybrid fossil fuel systems to generate electricity during the night or when it's cloudy. In
the SEGS plants in the Mojave Desert, generated power from natural gas systems
accounts for about ten percent of total generation power per year.71 Electricity generation
from fossil fuels used in conjunction with solar plants produces harmful emissions that
affect the local environment.
Additional emissions would come from increased traffic to and from the solar
generating facilities. During construction, a temporary increase in emissions from
construction vehicles and equipment would be seen. Nitrogen deposition would increase
due to human activities and is known to be a threat to biodiversity and ecosystems
70Robert Monroe, “Lake Mead could be dry by 2021,” UC San Diego, February 12, 2008,
available from http://ucsdnews.ucsd.edu/newsrel/science/02-08LakeMead.asp; Internet; accessed November 12, 2010.
71 Hunold and Leitner, “‘Hasta la vista, Baby!’ The Solar Grand Plan, Environmentalism, and Social Constructions of the Mojave Desert,” Paper presented at the annual meeting of the WPSA, Hyatt Regency Vancouver, Vancouver, BC Canada, March 19 2009, available from http://www.allacademic.com/meta/p317497_index.html; Internet; accessed September 20, 2010, 5.
45
because of its toxicity to native plants and apparent benefit to non-native species.72
Impaired visibility from the emission of air pollutants would also impact the region’s
aesthetic value.
3.7 Socioeconomic effects
The previous sections focus on the environmental effects of solar development
but do not address the socioeconomic dimensions that the entire region will confront.
Some residents of the desert have formed solar development opposition groups that hope
to convince developers and permitting agencies to mitigate the negative socioeconomic
effects of large-scale solar. Unlike some states, communities in the Mojave Desert will
not receive rent payments from the development of solar despite the fact that they will
bear the brunt of the negative impacts that come with solar generation. Instead, lease
payments from projects on BLM lands are paid to the U.S. Treasury and are not directly
seen by Californians. Additionally, because of heightened demand for land in the Mojave
Desert from solar developers, the cost of private land has risen from around $500 an acre
to $10,000 an acre in the past five years.73 On the other hand, land costs could also
decrease if transmission lines are built close by, disrupting the landscape vista. Desert
residents and visitors will also see increased traffic and pollution.
Solar generation will offer local communities job opportunities, mainly in
manufacturing and construction. The exact number of jobs to be created in the near future
from solar development is unknown, but employment will provide the local economy
with more revenue, spurring investment and local economic growth. It is also unclear
72 J. M. Randall et al., “Mojave Desert Ecoregional Assessment,” 62. 73 Campbell et al., “Here Comes the Sun: Solar Thermal in the Mojave Desert – Carbon Reduction
or Loss of Sequestration?” 10.
46
whether tourism, recreational activities, or quality of life will increase or decrease as a
result of development.
3.8 Aesthetic effects
The aesthetic effects of solar development, though highly subjective, are also
important to recognize. Along with increased traffic and visible pollution, residents could
be affected by noise pollution and the appearance of solar arrays, transmission lines, new
roads, and other accompanying infrastructure. Visual externalities such as construction
workers, traffic, and transmission lines could have a measurable impact on tourism in the
Mojave Desert. While many visitors already flock to the desert to visit the national parks
and monuments, solar farms could increase or decrease tourism based on public
perception.74 Similar to the public perception of wind farms, some believe that solar
farms negatively affect the public vista whereas others might see the solar farms as a
tourist attraction.
Noise pollution from solar thermal plants that employ dry cooling could diminish
the quality of life for nearby residents as well. The giant fans used for cooling create a
noise that could disturb residents, making camping, hiking, and other recreational
activities less enjoyable. The types of transmission poles installed in certain locations
have been known to create controversy and details regarding pole visibility, color, and
size are often included in environmental impact statements.
74 Tsoutsos, Frantzeskaki, and Gekas, “Environmental impacts from the solar energy
technologies,” 292.
47
4 Conclusion
As the United States and California continue to increase solar energy generation
in the near future, it is important to address all of the issues and challenges presented by
each project. Policymakers, permitting authorities, investors, developers, and residents
alike must work together to identify the impacts of solar development, determine the best
ways to mitigate the negative impacts, and ultimately implement the technology
responsibly. All actors involved must make informed land use decision making in order
to avoid lasting and pervasive impacts. By utilizing an ecological approach that builds
from the ground-up and understands the local environment, challenges confronted can be
dealt with more easily.
4.1 Recommendations
Given the analysis of policies affecting solar development and the benefits and
impacts of solar generation in the Mojave Desert, this section offers fundamental yet
useful recommendations that aim to support continued growth of large-scale solar and
avoid or mitigate negative impacts:
1. Projects should be “smart from the start,” meaning they should be sited on
level, degraded or disturbed land with low value for wildlife, near existing
roads, transmission lines, and water sources. Brownfield sites should be
explored as options. Lands of highest conservation value, critical for the long-
term conservation of biodiversity, should remain untouched. Where projects
are not located is as important as where they are located. Solar developments
48
should also minimize aesthetic effects by listening to public input. Also,
planning should begin early and involve cooperation between developers,
permitting agencies, and the public.
2. Habitat fragmentation should be minimized by building transmission lines (if
necessary) near roads.
3. Solar arrays should be constructed with as few points of contact with the land
as possible so the ecosystem is less disturbed.
4. Efficient technologies (power towers, dish engine, parabolic trough, CPV)
should be promoted in the near-term until other technologies become more
efficient. This way, the amount of land and water used per MWh generated is
reduced.
5. Dry-cooling systems should be favored in parabolic trough and power tower
systems because of the adverse effects of water use on the desert ecosystem
and the uncertainty of the availability of water in the near future.
6. It is necessary to recognize the cumulative, regional-level impacts of utility-
scale solar development and various policies affecting solar. For example, it is
important to know if water use in Nevada affects the Mojave Desert
ecosystem in California.
7. A program should be developed whereby local communities receive money
from the rent payments to the U.S. Treasury in order to compensate for the
negative socioeconomic effects.
49
8. Subsidies to big oil companies should be cut. During years of record profit for
oil companies, the federal government was pouring money into programs that
offered tax breaks and royalty waivers to encourage offshore drilling.
9. Government policies should continue to subsidize renewable energy
development in order to make solar energy technologies more competitive in
the marketplace. If government agencies stop “incentives that vastly reduce
the risks to investors, solar companies planning another dozen or so plants say
they may not be able to raise enough capital to proceed.”75
10. Research and development in solar technologies and energy transmission
infrastructure should be supported by both the federal government and
California government in order to improve efficiency, spur innovation, and
potentially bring in money from the sale of solar energy products and services.
4.2 Conclusion
Solar development in the Mojave Desert of California comes with numerous
advantages. The region, state, and country would stand to benefit from job growth,
diversification and security of energy sources, independence from foreign fuels,
innovation, and a reduction of greenhouse gas emissions. Despite these benefits, solar
energy still faces a long road ahead. The Mojave Desert is a fragile ecosystem sensitive to
minor changes, and pressures from solar developers are testing its limits. Policies and
strategies need to be formulated that will accommodate solar development while
preventing or mitigating the adverse impacts of solar energy generation in the Mojave
75 Todd Woody, “Solar Power Projects Face Potential Hurdles,” New York Times, October 28,
2010, available from http://www.nytimes.com/2010/10/29/business/energy-environment/29solar.html?_r=2; Internet; accessed October 29, 2010.

50
Desert. This paper is intended to provide an overview of the issues surrounding solar
development in the Mojave Desert.
51
Alphabetical List of Sources
1. Arizona Solar Center, Resource Maps. “US Solar Radiation Map.” Available from http://www.azsolarcenter.org/solar-in-arizona/resource-maps.html; Internet; accessed November 18, 2010.
2. Bureau of Labor Statistics. “Local Area Unemployment Statistics.” Available from http://bls.gov/data/; Internet; accessed November 24, 2010.
3. Bureau of Land Management. “California Desert District.” Available from http://www.blm.gov/ca/st/en/fo/cdd.html; Internet; accessed September 20, 2010.
4. Bureau of Land Management. “CDCA Development” Available from http://www.blm.gov/ca/st/en/fo/cdd/cdca_development.html; Internet; accessed November 4, 2010.
5. Bureau of Land Management. “Solar Applications and Authorizations.” Available from http://www.blm.gov/pgdata/content/ca/en/fo/cdd/alternative_energy/ SolarEnergy.html; Internet; accessed November 23, 2010.
6. California Air Resources Board. “Assembly Bill 32: Global Warming Solutions Act.” Available from http://www.arb.ca.gov/cc/ab32/ab32.htm; Internet; accessed October 15, 2010.
7. California Energy Commission. “Renewable Energy Transmission Initiative.” Available from http://www1.eere.energy.gov/solar/linear_concentrator_rnd.html; Internet; accessed September 29, 2010.
8. California Energy Commission. “Total Electricity System Power.” Available from http://energyalmanac.ca.gov/electricity/system_power/2008_total_system_ power.html; Internet; accessed September 23, 2010.
9. California Public Utilities Commission. “33% Renewables Portfolio Standard Implementation Analysis Preliminary Results.” June 2009, available from http://www.cpuc.ca.gov/PUC/energy/Renewables/hot/33implementation.htm; Internet; accessed October 20, 2010.
10. California Public Utilities Commission. “RPS Program Overview.” Available from http://www.cpuc.ca.gov/PUC/energy/Renewables/overview.htm; Internet; accessed October 15, 2010.
11. Campaign for the California Desert. “Renewable Energy Development Fact Sheet.” Available from http://www.californiadesert.org/; Internet; accessed October 23, 2010.
12. Campbell, Holly, Abby P. Metzger, Deidra Spencer, Stacey Miller, and Erika Allen Wolters. “Here Comes the Sun: Solar Thermal in the Mojave Desert – Carbon Reduction or Loss of Sequestration?” March 13, 2009.
13. Center for Naval Analyses. “National Security and the Threat of Climate Change.” April 1, 2007, available from http://www.cna.org/reports/climate; Internet; accessed October 30, 2010.
14. Department of Energy. “Linear Concentrators Research and Development.” Available from http://www1.eere.energy.gov/solar/linear_concentrator_rnd.html; Internet; accessed November 3, 2010.
52
15. Department of Energy. “States with Renewable Portfolio Standards.” Available from http://apps1.eere.energy.gov/states/maps/renewable_portfolio_states.cfm; Internet; accessed October 29, 2010.
16. Department of Energy. “The Emergency Economic Stabilization Act of 2008: Energy Tax Incentives.” Available from http://www.energy.gov/media/HR_1424.pdf; Internet; accessed October 12, 2010.
17. Department of Energy and Department of the Interior. “Solar Energy PEIS Fact Sheet.” Available from http://solareis.anl.gov/documents/index.cfm; Internet; accessed November 9, 2010.
18. Department of the Interior. “New Energy Frontier.” Available from http://www.doi.gov/whatwedo/energy/index.cfm; Internet; accessed October 29, 2010.
19. Energy Information Administration. “Net Generation by Energy Source.” Available from http://www.eia.doe.gov/electricity/epm/table1_1.html; Internet; accessed October 12, 2010.
20. Energy Information Administration. “Total Renewable Net Summer Capacity by Energy Source and State, 2009.” August 2010, available from http://www.eia.doe.gov/cneaf/alternate/page/renew_energy_consump/table8.html; Internet; accessed September 13, 2010.
21. Fernandes, Jesse, Natalie Flynn, Samantha Gibbes, Matthew Griffis, Takahiro Isshiki, Sean Killian, Laura Palombi, Nerissa Rujanavech, Sarah Tomsky, and Meredith Tondro. “Renewable Energy in the California Desert: Mechanisms for Evaluating Solar Development on Public Lands.” University of Michigan School
of Natural Resources and Environment, April 2010. 22. Friedman, Thomas. Hot, Flat, and Crowded. New York: Farrar, Straus, and
Giroux, 2008. 23. Geiger, Kim, and Tom Hamburger. “Oil companies have a rich history of U.S.
subsidies.” Los Angeles Times, May 25, 2010. 24. Gross, Bill. “Sustainable Energy.” 2010 Nelson Speaker Series. Harvey Mudd
College, Claremont, California, October 22, 2010. 25. Hansen, James. "Target atmospheric CO2: Where should humanity aim?" The
Open Atmospheric Science Journal (2008) 2(15): 217. 26. Hereford, Richard, Robert H. Webb, and Claire I. Longpre. “Precipitation History
of the Mojave Desert Region, 1893-2001.” U.S. Geological Survey, 2004, available from http://pubs.usgs.gov/fs/fs117-03/; Internet; accessed September 24, 2010.
27. Hunold, Christian, and Steven Leitner. “‘Hasta la vista, Baby!’ The Solar Grand Plan, Environmentalism, and Social Constructions of the Mojave Desert.” Paper presented at the annual meeting of the WPSA, Hyatt Regency Vancouver, Canada, March 19, 2009, available from http://www.allacademic.com/meta/ p317497_index.html; Internet; accessed September 20, 2010.
28. Internal Revenue Service. “Energy Incentives for Businesses in the American Recovery and Reinvestment Act.” Available from http://www.irs.gov/newsroom/article/0,,id=209564,00. html; Internet; accessed October 29, 2010.
53
29. Lewis, Jack. “The Birth of EPA.” EPA Journal (November 1985). 30. Library of Congress. “Bill Summary and Status: Energy Policy Act of 2005.”
Available from http://thomas.loc.gov/cgi-bin/bdquery/z?d109:h6:; Internet; accessed October 12, 2010.
31. Lovich, Jeffrey E., and David Bainbridge. “Anthropogenic Degradation of the Southern California Desert Ecosystem and Prospects for Natural Recovery and Restoration.” Environmental Management 24 (1999): 309-326.
32. Morhardt, Sia and Emil Morhardt, California Desert Wildflowers. Berkeley and Los Angeles: University of California Press, 2004.
33. Moser, Bob. “The BLM fast track: Speeding CSP project development in the US?” CSP Today, July 16, 2010, available from http://social.csptoday.com/industry-insight/blm-fast-track-speeding-csp-project-development-us; Internet; accessed November 6, 2010.
34. National Renewable Energy Laboratory. “Parabolic Trough Thermal Energy Storage Technology.” Available from http://www.nrel.gov/csp/troughnet/thermal _ energy_ storage.html#tank; Internet; accessed November 1, 2010.
35. Office of the Governor. “Executive Order S-14-08.” November 17, 2008, available from http://www.gov.ca.gov/executive-order/11072/; Internet; accessed October 15, 2010.
36. Pavlik, B.M. The California Deserts: an ecological rediscovery. Berkeley and Los Angeles: University of California Press, 2008.
37. Randall, John M., Sophie S. Parker, James Moore, Brian Cohen, Laura Crane, Bill Christian, Dick Cameron, Jason B. MacKenzie, Kirk Klausmeyer, and Scott Morrison. “Mojave Desert Ecoregional Assessment.” Unpublished Report. The
Nature Conservancy. San Francisco, California, September 2010, available from http://conserveonline.org/ workspaces/mojave/documents/mojave-desert-ecoregional- 2010/@@view.html; Internet; accessed September 14, 2010.
38. Roney, J. Matthew. “Solar cell production climbs to another record in 2009.” Earth Policy Institute, September 21, 2010, available from http://www.earth-policy.org/index.php?/indicators/C47/; Internet; accessed September 23, 2010.
39. Speth, James Gustave. The Bridge at the Edge of the World. Connecticut: Yale University Press, 2008.
40. Stoddard, L., J. Abiecunas, and R. O'Connell. “Economic, Energy, and Environmental Benefits of Concentrating Solar Power in California.” National Renewable Energy Laboratory, April 2006.
41. Switzer, Jacqueline V. Environmental Politics: Domestic and Global
Dimensions. New York: St Martin’s Press, Inc., 1994. 42. Tsoutsos, Theocharis, Niki Frantzeskaki, and Vassilis Gekas. “Environmental
impacts from the solar energy technologies.” Energy Policy 33 (2005) 289-296. 43. Turchi, Craig, Mark Mehos, Clifford K. Ho, and Gregory J. Kolb. “Current and
Future Costs for Parabolic Trough and Power Tower Systems in the US Market.” National Renewable Energy Laboratory, October 2010.
44. Turner, R. M. “Mojave desertscrub.” Desert Plants 4 (1982): 157-168. 45. United Nations Framework Convention on Climate Change. “Fact sheet: Climate
change science – the status of climate change science today.” November 2010,
54
available from http://unfccc.int/press/fact_sheets/items/4987.php; Internet: accessed November 4, 2010.
46. Wohlfahrt, George, Lynn F. Fenstermaker, and John A. Arnone III. “Large annual net ecosystem CO2 uptake of a Mojave Desert ecosystem.” Global Change
Biology (2008) 14: 1475-1487. 47. Woody, Todd. “In California’s Mojave Desert, Solar-Thermal Projects Take Off.”
Yael Environment 360, October 27, 2010, available from http://e360.yale.edu/content/feature.msp?id=2334; Internet; accessed November 3, 2010.
48. Woody, Todd. “Solar Power Projects Face Potential Hurdles.” New York Times, October 28, 2010, available from http://www.nytimes.com/2010/10/29/business/energy-environment/29solar.html?_r=2; Internet; accessed October 29, 2010.