Embed Size (px)
Citation preview
Solar Energy Potential on the Largest Rooftops in the United States
September 2016
The National Center for Sustainable Transportation Undergraduate Fellowship Report
Rebecca R. Hernandez, University of California, Davis
Esther Robles De Wence, University of California, Davis
Praewa Boonlue, University of California, Davis
About the National Center for Sustainable Transportation The National Center for Sustainable Transportation is a consortium of leading universities committed to advancing an environmentally sustainable transportation system through cutting-edge research, direct policy engagement, and education of our future leaders. Consortium members include: University of California, Davis; University of California, Riverside; University of Southern California; California State University, Long Beach; Georgia Institute of Technology; and University of Vermont. More information can be found at: ncst.ucdavis.edu.
U.S. Department of Transportation (USDOT) Disclaimer The contents of this report reflect the views of the authors, who are responsible for the facts and the accuracy of the information presented herein. This document is disseminated under the sponsorship of the United States Department of Transportation’s University Transportation Centers program, in the interest of information exchange. The U.S. Government assumes no liability for the contents or use thereof.
Acknowledgments This study was funded by a grant from the National Center for Sustainable Transportation (NCST), supported by USDOT through the University Transportation Centers program. The authors would like to thank the NCST and USDOT for their support of university-based research in transportation, and especially for the funding provided in support of this project. We would like to thank our mentor, Dr. Rebecca R. Hernandez, for her endless support on our research. We would also like to mention Jaime Wence, August Goers, Madison Hoffacker and Ben White.
Solar Energy Potential on the Largest Rooftops in the United States A National Center for Sustainable Transportation Research Report
September 2016
Rebecca Hernandez11, Esther Robles 12, Praewa Boonlue12
1Department of Land, Air and Water Resources, University of California, Davis, California 2Department of Environmental Science and Policy, University of California, Davis, California

1
TABLE OF CONTENTS Introduction ................................................................................................................................2
Objectives ...................................................................................................................................3
Methods .....................................................................................................................................4
Identification and Ranking of United States Commercial Buildings Rooftop Footprint .............4
Aurora Solar Energy Platform Tool ..........................................................................................5
Estimating Technical Potential of Rooftops from Aurora Solar Energy Platform ......................5
Analysis of Technical Potential of Rooftops .............................................................................7
Expected Results .........................................................................................................................7
Total Rooftop Area Statistical Analysis of Energy Generation Potential ...................................8
Amount of Land Potentially Spared and Emissions Mitigation .................................................9
Determine the Utility and Value of Aurora for Similar Projects ................................................9
Discussion ...................................................................................................................................9
Images from Aurora Solar Energy Platform ...............................................................................10
References ................................................................................................................................14
2
Introduction The global reduction of anthropogenic greenhouse gas (GHG) emissions stemming from energy development and generation for human activities is of exigent concern in the mitigation of climate change. The generation of all energy for human use produces GHGs directly through life-cycle emissions associated with the extraction of raw materials, operation of energy infrastructure, and decommissioning activities (Fthenakis and Kim 2009). For example, in the United States (US), the electric power sector generates 30% of US total GHG emissions--67% of which are from fossil fuels (EPA 2016). Less considered are GHG emissions associated with the siting of energy infrastructure, which can augment lifecycle GHG emissions of energy owing to land-use and land-cover change (Hernandez et al 2015a). Solar energy, specifically photovoltaic (PV) systems, have lifecycle GHG emissions of 46 g CO2eq/kWh, comparable to geothermal (i.e., 45 g of CO2eq/kWh), but greater than hydropower and ocean energy (4 and 8 g of CO2eq/kWh, respectively; IPCC 2011). However, unlike other renewables, individual PV modules and PV power plants can be integrated into diverse recipient environments, which in certain places, including rooftops, parking lots, and EPA sites, can obviate the need for additional land-use and land-cover change (DeMarco et al. 2014, Hernandez et al. 2014, Hernandez 2015b). The potential to integrate PV into the built environment and other land sparing environments has been of increasing interest as pressure for the conservation of natural habitat and biodiversity and land for food production has risen globally (Hernandez et al 2015a). Several studies have underscored the role of residential and commercial rooftop PV solar energy to contribute to local and regional renewable energy generation goals across diverse human-dominated landscapes and near demand loads (Hernandez et al 2013, Hernandez et al. 2014). In addition to land sparing, environmental co-benefits of rooftop PV include lower electricity costs to ratepayer (Kaufman et al., 2016), enhanced energy efficiency, increased human health and well-being, and the reduction of urban heat islands (Taha 2013, Masson et al. 2014, Salamanca 2016). In contrast, ground-mounted utility-scale solar energy power plant requires vast amounts of land which can create unique trade-offs for biodiversity and ecosystem services when sited in natural areas (Dale et al 2011). For example, Solar Star, one of the largest PV solar plant (579 MWAC) occupies 3,212 acres (Wesoff 2015). Ground-mounted utility-scale solar installations may have direct environmental impacts within the construction zone; however, it may also facilitate the development of additional infrastructure in previously undeveloped land nearby, a process known as energy sprawl (Dale et al 2011). The generation potential of rooftop PV is determined by multiple factors, including the PV technology type (e.g., bifacial cells), system design and density, materials (e.g., crystalline silicon, cadmium telluride), manufacturer, location, and weather (Gagnon et al 2016). Data-intensive data and technologies, including geographic information systems, energy resource modeling, and decision support tools can be employed to evaluate and quantify geographical, technological, and economic factors that affect system performance (NREL 2016). Today, there are various modeling tools available that integrate sophisticated data packages and simulate
3
system design and performance across various spatial and temporal scales, including ArcGIS’s Solar Analysis and Solar Radiation tools, NREL’s System Advisor Model (SAM) and PVWatts, PVsyst (PC-based software, pvsyst.com), PVsol (Valentin Software), Folsom Labs (solar design software, www.folsomlabs.com), and SolarDesignTool (www.solardesigntool.com). The Aurora Solar Energy Platform (Aurora, www.aurorasolar.com) is a cloud-based software platform that combines solar PV system design and productivity reports of PV modules, incorporating location, roof configuration, roof setbacks, and a detailed shading analysis (Aurora Solar 2016). Impacts to land owing to renewable energy development often result in land degradation and depend on the duration, intensity, and reversibility of the disturbance (Dale et al 2011). The potential to overcome these impacts often involve changes in land use practices and mitigation; however, such impacts can be obviated entirely when PV systems are sited on rooftops in lieu of natural systems. Commercial buildings, often have large, flat, and unobstructed (e.g., trees) rooftop space. Within the US, these types of structures have been increasing in area 22% since 2003 (CBECS 2012). Specifically, US commercial buildings, which include warehouses and distribution centers, constructed between 1960 to 1999 have an average floor space of 1,514 m2 (16,300 sq. feet) while those assembled after 2000 have a floor space of 1,774 m2 (19,100 sq. feet) on average (CBECS 2012). A study was conducted on the rooftops of 5,418 elementary schools in Korea to determine the feasibility of achieving net-zero energy solar buildings through rooftop PV systems (Koo 2013). The study found that the potential for the building to become net zero-energy is higher if the ratio of (person/roof area) is lower (Koo 2013). Another study by Ordonez compared the technical potential of rooftop PV system on residential homes in Spain with the total energy consumption of the residential sector in the country and found that PV installations would satisfy 78.89% of all energy needs (Ordonez 2010). With increasing energy efficiency and reduction in energy consumption, rooftop PV systems can be a viable method to optimizing energy generation. Our study showcases an important techno-ecological synergy, the use of rooftops within built environment for utility-scale solar energy projects, to support the generation of clean energy while eliminating the need for land-use and land-cover change in natural environments.
Objectives In this study, we seek to (1) quantify the technical potential of rooftop-mounted PV systems deployed on 25 of the largest buildings in the United States, (2) assess the utility of Aurora for modeling commercial rooftop area, quantifying solar resources therein, and evaluating optimal PV system design, performance, and functionality, (3) compare potential generation to electricity consumption for each building separately, and (4) quantify the amount of land-sparing under the counterfactual scenario that equivalent capacity was developed as ground-mounted, utility-scale PV power plants.
4
Methods
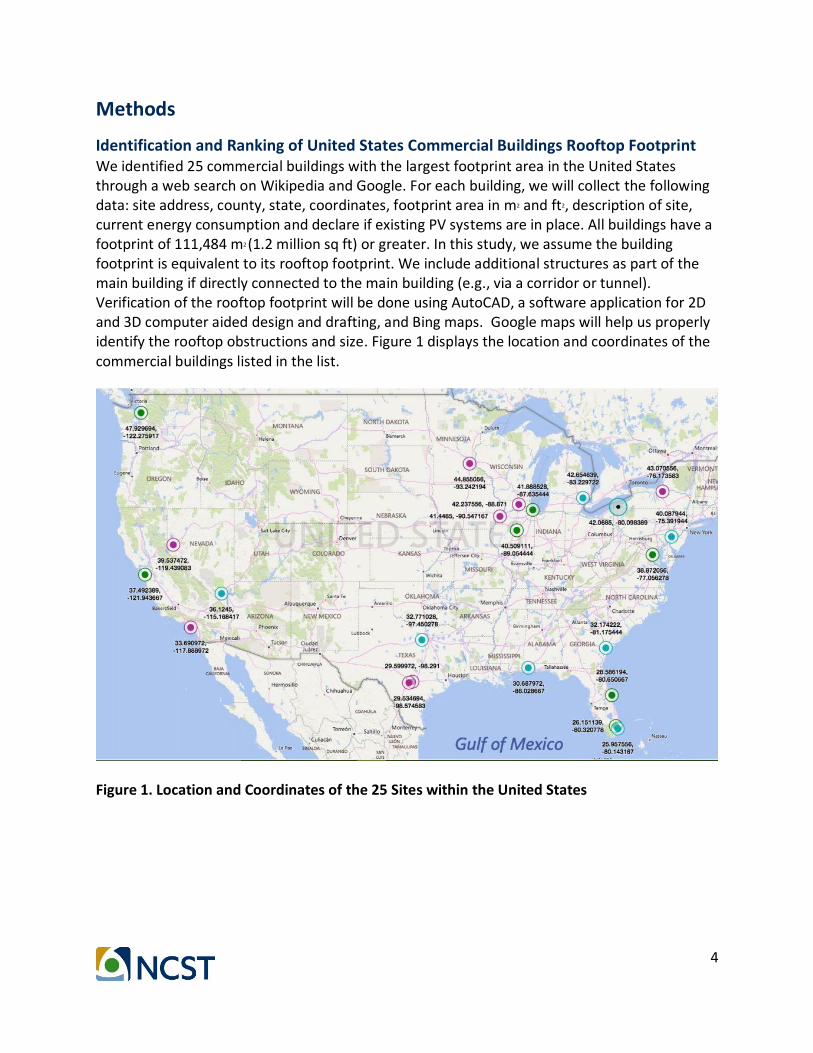
Identification and Ranking of United States Commercial Buildings Rooftop Footprint We identified 25 commercial buildings with the largest footprint area in the United States through a web search on Wikipedia and Google. For each building, we will collect the following data: site address, county, state, coordinates, footprint area in m2 and ft2, description of site, current energy consumption and declare if existing PV systems are in place. All buildings have a footprint of 111,484 m2 (1.2 million sq ft) or greater. In this study, we assume the building footprint is equivalent to its rooftop footprint. We include additional structures as part of the main building if directly connected to the main building (e.g., via a corridor or tunnel). Verification of the rooftop footprint will be done using AutoCAD, a software application for 2D and 3D computer aided design and drafting, and Bing maps. Google maps will help us properly identify the rooftop obstructions and size. Figure 1 displays the location and coordinates of the commercial buildings listed in the list.
Figure 1. Location and Coordinates of the 25 Sites within the United States
5
Aurora Solar Energy Platform Tool We will use the Aurora Solar Energy Platform, which is a cloud-based platform that enable users to create accurate and code compliant solar PV engineering designs. Aurora modeling tools for rooftop areas include 2D and 3D system design as well as LiDar, shading analysis, financial analysis, and sale proposals. The Advanced Engineering option in Aurora ensures that the generated PV systems are code compliance, which can accelerate permitting for installations. (Number of customers) utilizes Aurora as of July 2016 and the platform processes over 5,000 projects weekly (Trina Success 2016). The National Renewable Energy Laboratory (NREL) examined the performance of Aurora’s simulating engine and compared it to other PV modeling tools, such as ArcGIS, NREL’s System Advisor Model (SAM), PVsyst, PVsol, and PVWatts (Freeman and Simon 2015). The NREL’s study concluded that Aurora achieved an annual error of ± 6% and a hourly normalized RMSE of 4.5 % on predicted performance data (Freeman and Simon 2015). The tolerance interval of the shading analysis is ± 3.00 Solar Access Values (SAVs) with LiDAR and ± 5.00 SAVs without LiDAR (Freeman and Simon 2015).
Estimating Technical Potential of Rooftops from Aurora Solar Energy Platform Aurora Solar Energy platform will aid in determining the technical potential of rooftop area. The modeling tools developed by Aurora are designed to estimate the area of rooftop spaces and detect building height, rooftop edges, and all obstructions (e.g., tree shading) using LiDAR in 2D and 3D. We plan to avoid any obstruction that precludes PV installation across the rooftop space and comply with the minimum easement requirements for each building depending on its location. Further, we will adhere to the fire code requirements of each location as well as comply to the design and construction standards developed by the International Code Council (ICC). The ICC guidelines are adopted in various global markets and throughout the US by federal agencies, such as Architect of the Capitol, Department of State, and Department of Defense. In the 2D map view, we will determine the setbacks for solar panels along with outlining the rooftop area, various obstructions and surrounding trees. In the 3D view, we plan to set the appropriate height for building, obstructions and trees with assistance from LiDAR. Within the ‘Design’ view, we intend on adding a PV system with appropriate modules, string inverter, DC optimizer, and microinverter. Further research will help us to determine additional options such as the optimal tilt of solar panels, appropriate panel texture, row spacing, and minimum Solar Access Percentages (SAP). When no compliance errors are detected in Aurora, we will run simulations to predict the performance and the technical potential of the system with given parameters.
Parameter Specifications
Module The solar PV module selected for modeling in Aurora is SPR-X21-345-com from the manufacturer, SunPower Corp. This model has a monocrystalline silicon (mono-SI) technology and is suitable for commercial or large-scale PV systems. We selected the manufacturer SunPower Corp, because it has the highest average PSI rating with 9.76 out of 10 among its competitors (Principal Solar Institute). This module has the highest efficiency percentage (21.50%) under Standard Test Conditions (STC) and the highest PSI rating (11.05) according to
6
the database on Aurora Solar platform. It has a Pmax under STC of 345.00 W and Pmax under PTC of 320.20 W. Furthermore, the temperature coefficient at Pmax is lower than other commercial panels from SunPower Corp. at -0.3%/Celsius. The power output warranty period for this model is 25 years, which we believe will be satisfactory for commercial PV systems modeled in this study. The operating temperature for this model ranges from -40.00 Celsius to 85.00 Celsius, which are within the temperature limits of all 25 locations.
Central Inverter The central inverter selected for the modeling of PV system in this study is the Sunny Tripower 24000TL-US manufactured by SMA Solar Technology. We selected the Sunny Tripower series as the central inverter, because they are ‘versatile specialist’ for large-scale commercial and industrial plants. In addition, the Sunny Tripower is also compatible with the PV module that we chose from SunPower. The maximum usable DC power is 24,500 W with the maximum DC input voltage at 1,000 V. The output voltage is 480.0 V and it is a three-phase central inverter. The Tripower is a commercial dual-MPPT transformerless inverter. The maximum efficiency is at 98.5% with the CEC efficiency at 98.0%. The Sunny Tripower is able to operate between the temperature range of -25 C to 60 C and is compatible with mounting angle that ranges from 15o to 90o. This model is UL-certified (1741, 1699B), UL is a global independent safety science company that develops standards for products by testing of systems/services.
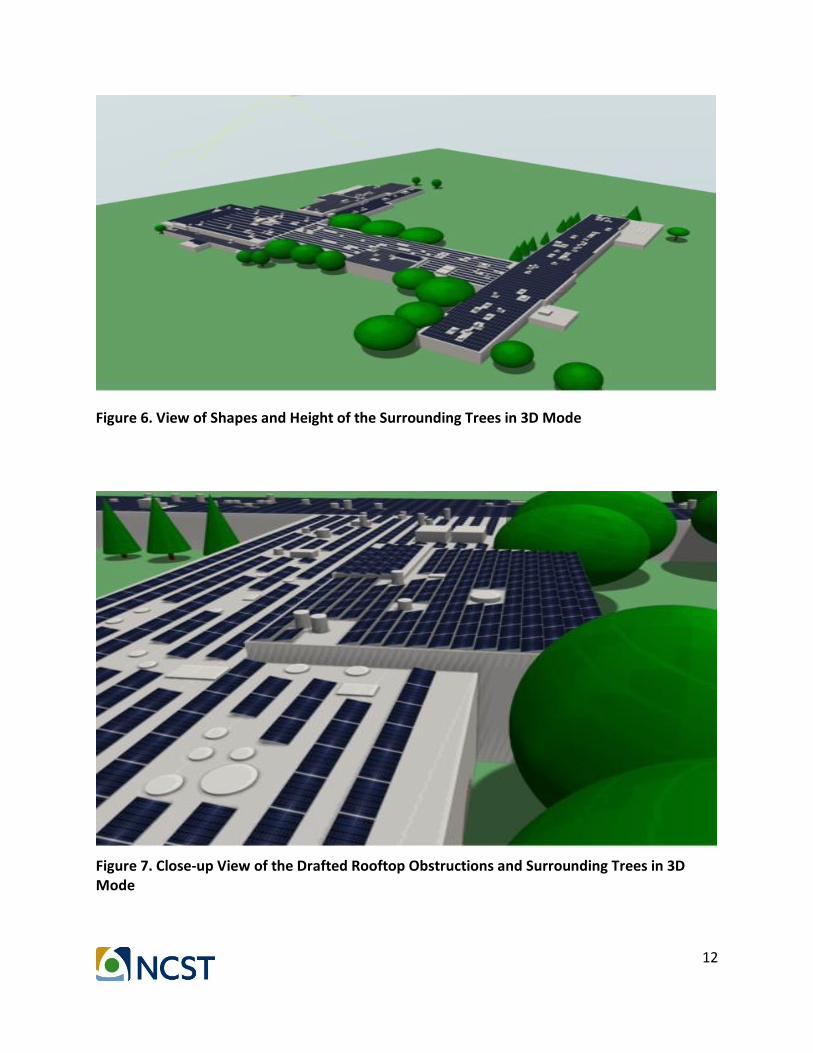
Mounting of System PV panels will be East-West oriented in a dual-tilt (sawtooth) system. We are choosing the sawtooth orientation, because Aurora offers the option between the fill mode of normal orientation and sawtooth. According to SunPower, the dual-tilt system has a ground coverage ratio of around 0.91, while the normal orientation has a ground coverage ratio from 0.5-0.8.
Inclination of PV Modules Having the modules at its optimal inclination in accordance to the location’s latitude can increase the energy gain by the system of up to 12% (George & Anto 2012). Similar to the methods presented by Salem and Kinab 2015, we decided to run different simulations from a range of 5 degrees to 30 degrees in increments of 5 degrees.
Clearance Requirements We are following the clearance requirements from the 2008 Solar PV Installation Guideline by the California Department of Forestry and Fire Protection Office of the State Fire Marshal. We selected the option for large commercial buildings with 4’ walkways with 8’ x 4’ venting opportunities every 20’. Table 1 summarizes the type of clearance and its requirements put forth by the installation guide.
7
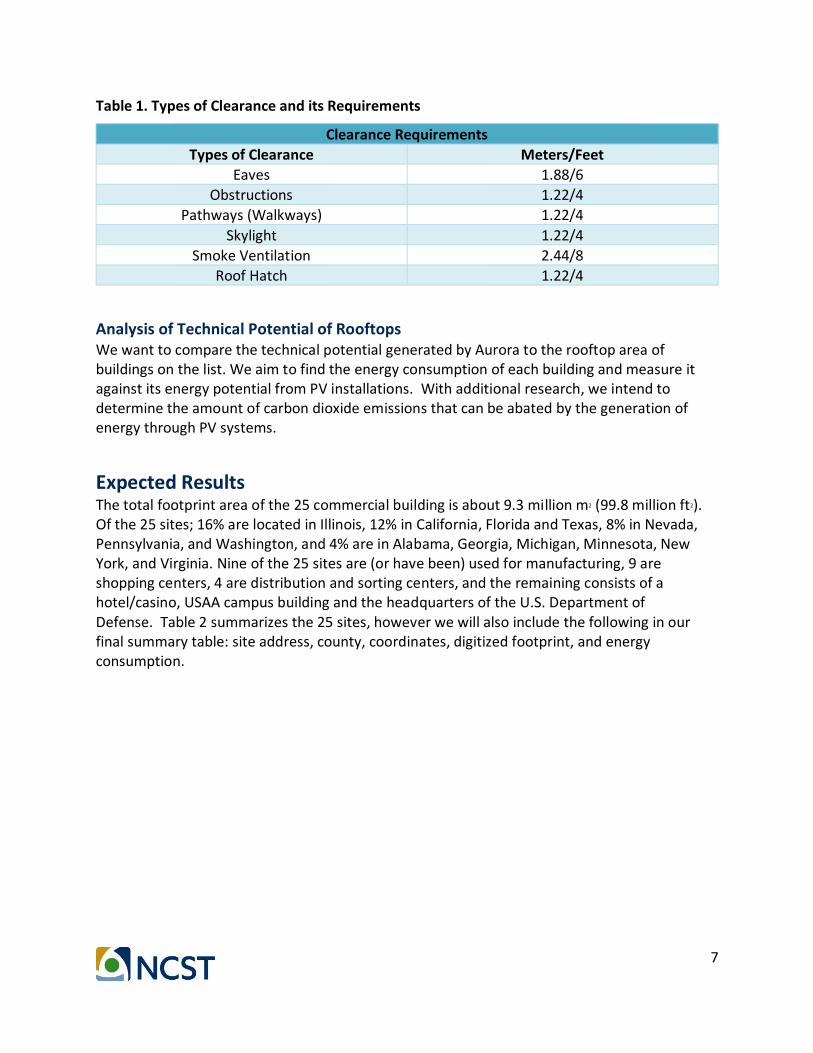
Table 1. Types of Clearance and its Requirements
Analysis of Technical Potential of Rooftops We want to compare the technical potential generated by Aurora to the rooftop area of buildings on the list. We aim to find the energy consumption of each building and measure it against its energy potential from PV installations. With additional research, we intend to determine the amount of carbon dioxide emissions that can be abated by the generation of energy through PV systems.
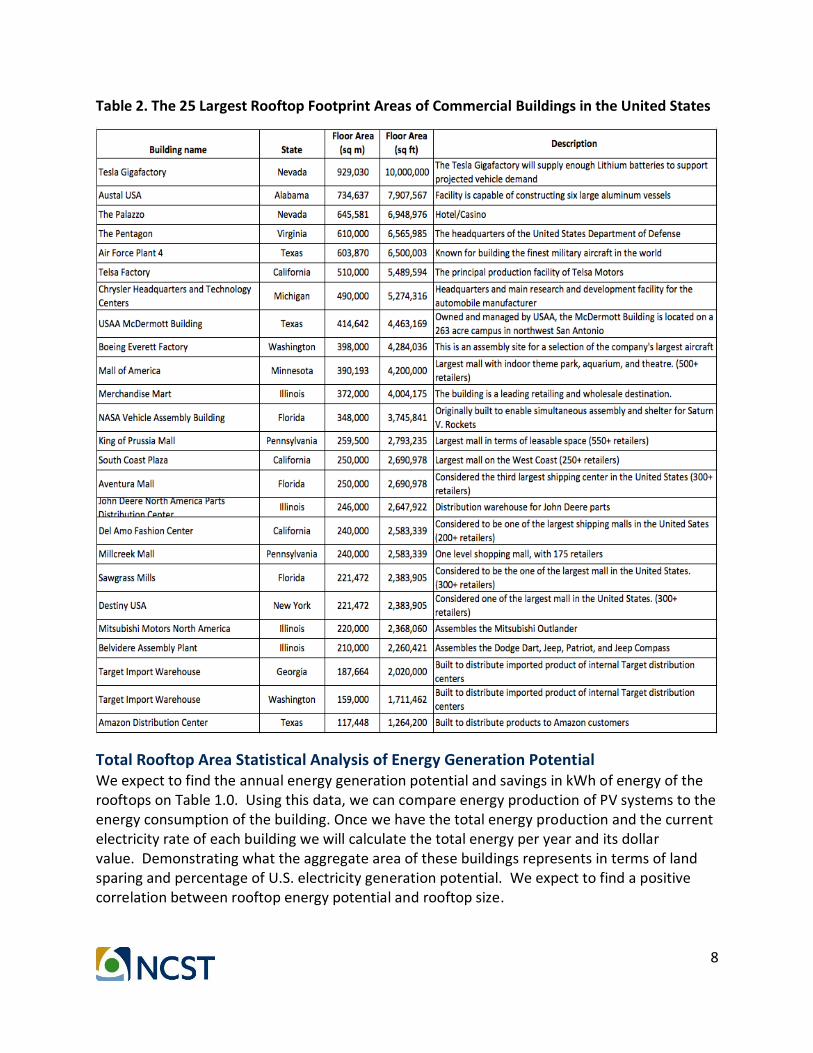
Expected Results The total footprint area of the 25 commercial building is about 9.3 million m2 (99.8 million ft2). Of the 25 sites; 16% are located in Illinois, 12% in California, Florida and Texas, 8% in Nevada, Pennsylvania, and Washington, and 4% are in Alabama, Georgia, Michigan, Minnesota, New York, and Virginia. Nine of the 25 sites are (or have been) used for manufacturing, 9 are shopping centers, 4 are distribution and sorting centers, and the remaining consists of a hotel/casino, USAA campus building and the headquarters of the U.S. Department of Defense. Table 2 summarizes the 25 sites, however we will also include the following in our final summary table: site address, county, coordinates, digitized footprint, and energy consumption.
Clearance Requirements
Types of Clearance Meters/Feet
Eaves 1.88/6
Obstructions 1.22/4
Pathways (Walkways) 1.22/4
Skylight 1.22/4
Smoke Ventilation 2.44/8
Roof Hatch 1.22/4
8
Table 2. The 25 Largest Rooftop Footprint Areas of Commercial Buildings in the United States
Total Rooftop Area Statistical Analysis of Energy Generation Potential We expect to find the annual energy generation potential and savings in kWh of energy of the rooftops on Table 1.0. Using this data, we can compare energy production of PV systems to the energy consumption of the building. Once we have the total energy production and the current electricity rate of each building we will calculate the total energy per year and its dollar value. Demonstrating what the aggregate area of these buildings represents in terms of land sparing and percentage of U.S. electricity generation potential. We expect to find a positive correlation between rooftop energy potential and rooftop size.
9
Amount of Land Potentially Spared and Emissions Mitigation Since the total footprint area of the 25 sites is estimated to be 9.3 million m2, we can estimate the hectares of land that can be spared by using rooftops. Once the 25 sites are drafted and digitized using AutoCAD and Aurora, respectively. We will be able to demonstrate the potential land sparing and reduction of impacts to the environment. We also expect to find the amount of land potentially spared and possible market stimulus for PV technology that will lower the costs. We seek to discover the total amount of CO2 emissions that can be abated by PV system installation, practicability of turning commercial buildings into zero energy buildings and the utility/value of Aurora for similar projects.
Determine the Utility and Value of Aurora for Similar Projects By utilizing Aurora, we hope our study to be a launching point for future studies to evaluate rooftop solar potential. Being that, Aurora has the ability to perform detailed and accurate PV system performance reports. It’s tools and features allows for minimal system errors and its tools have been validated by NREL, offering high level of confidence.
Discussion This project will provide a high level overview of photovoltaic energy potential on 25 of the largest commercial building rooftops in the United States and proposes the utility of Aurora as a method to obtain solar radiation data, LiDAR and total rooftop area. This study will be important to commercial buildings by optimizing energy production while minimizing costs and footprint of energy. Results from this study may lead to better management decisions on land use, solar energy production and reduction in CO2 emissions for commercial buildings in the United States. We expect our results to augment what has been done in the past and see where improvements are necessary or seek other options for utility scale solar power. Although similar objectives, this proposed study can provide a new, easier approach to determining potential of PV system and can be a blueprint for other studies. The results from this study will also be critical to state and federal-level decision making on the appropriate siting of renewable energy infrastructure. Specifically, our study demonstrates the use of the built environment as an important and overlooked techno-ecological synergy for solar energy development.
10
Images from Aurora Solar Energy Platform
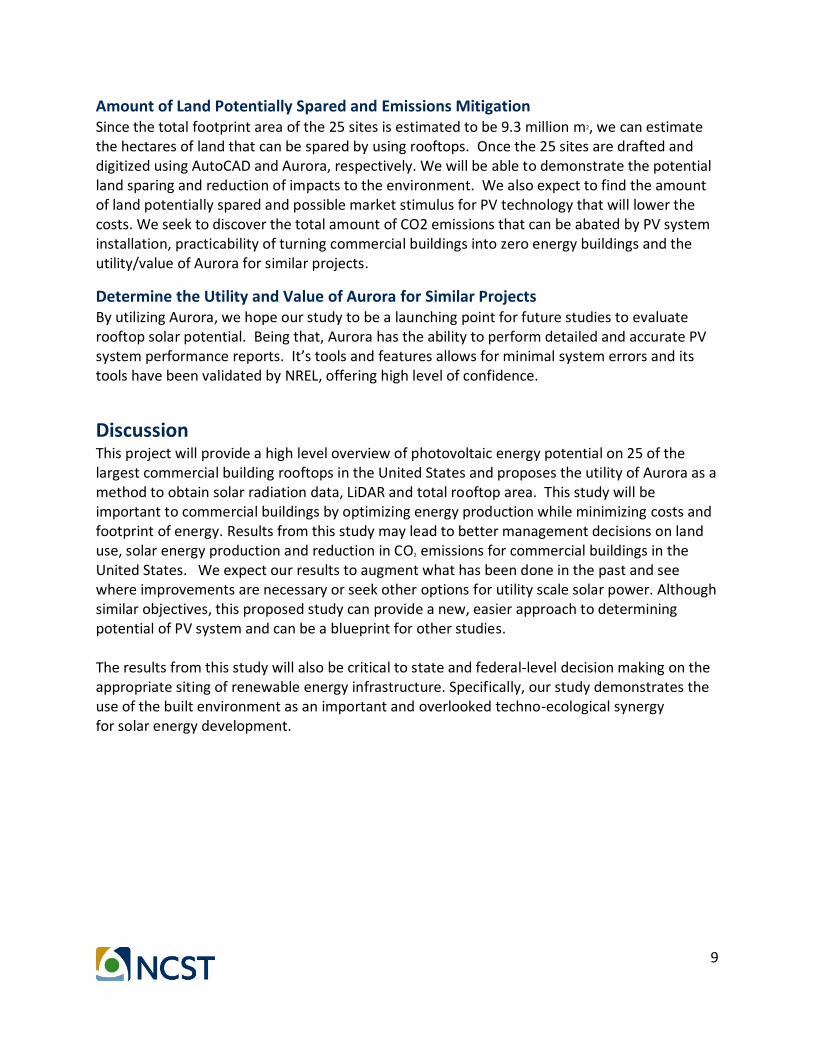
Figure 2. Rooftop Drafting of the Boeing Everett Factory in Everett, Washington.
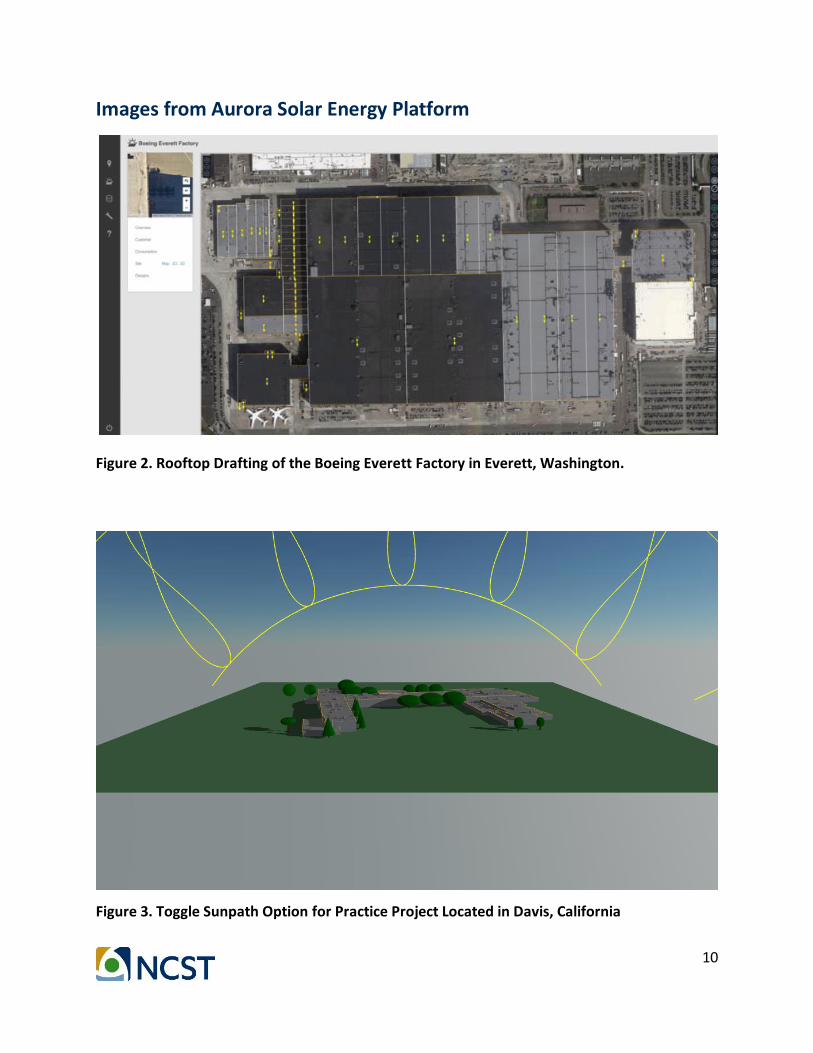
Figure 3. Toggle Sunpath Option for Practice Project Located in Davis, California
11
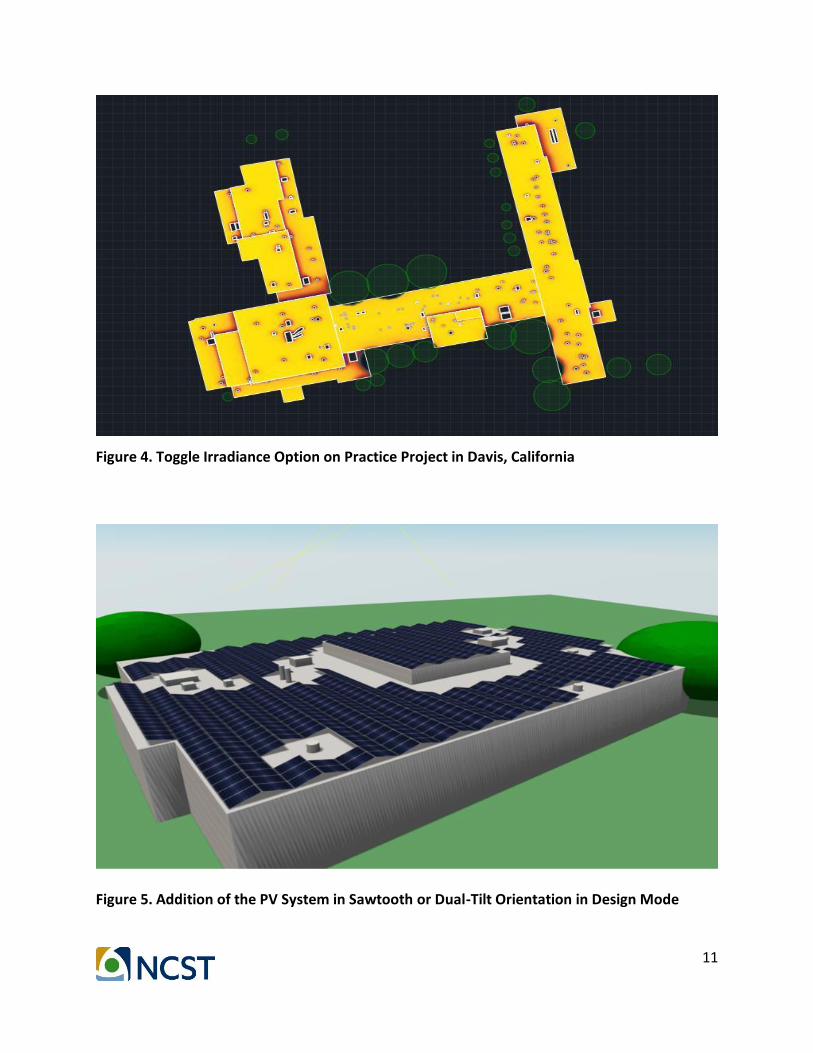
Figure 4. Toggle Irradiance Option on Practice Project in Davis, California
Figure 5. Addition of the PV System in Sawtooth or Dual-Tilt Orientation in Design Mode
12
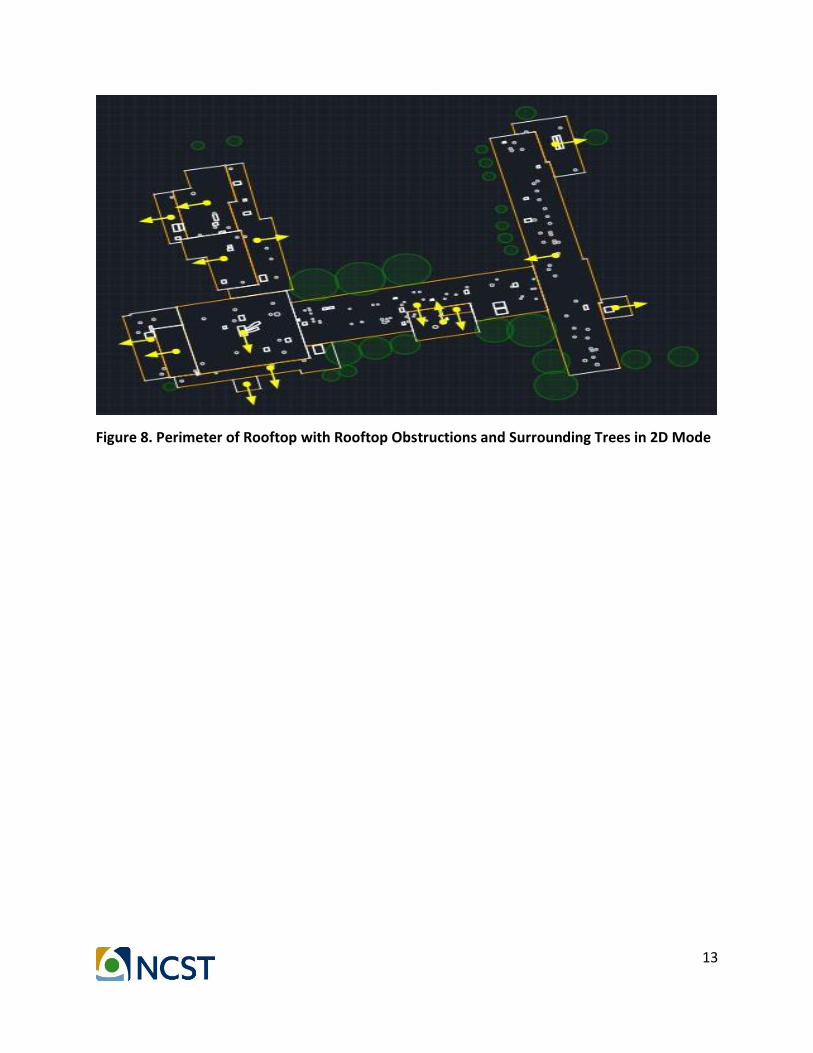
Figure 6. View of Shapes and Height of the Surrounding Trees in 3D Mode
Figure 7. Close-up View of the Drafted Rooftop Obstructions and Surrounding Trees in 3D Mode
13
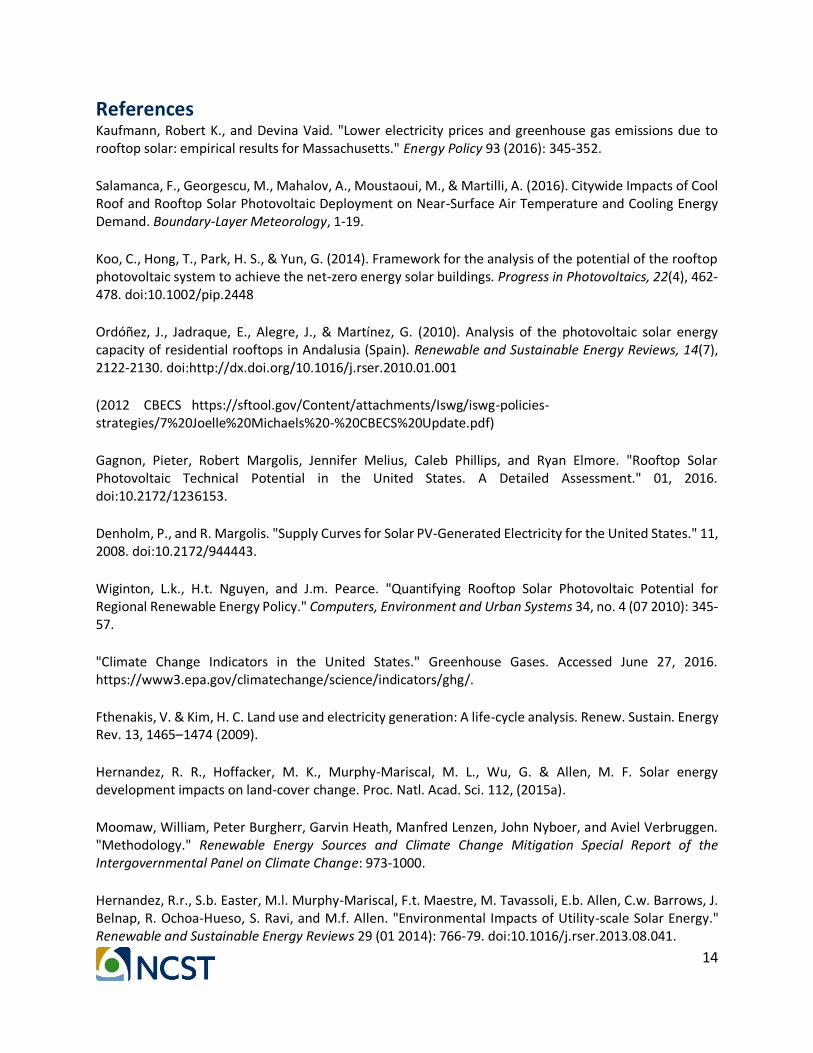
Figure 8. Perimeter of Rooftop with Rooftop Obstructions and Surrounding Trees in 2D Mode
14
References Kaufmann, Robert K., and Devina Vaid. "Lower electricity prices and greenhouse gas emissions due to rooftop solar: empirical results for Massachusetts." Energy Policy 93 (2016): 345-352. Salamanca, F., Georgescu, M., Mahalov, A., Moustaoui, M., & Martilli, A. (2016). Citywide Impacts of Cool Roof and Rooftop Solar Photovoltaic Deployment on Near-Surface Air Temperature and Cooling Energy Demand. Boundary-Layer Meteorology, 1-19. Koo, C., Hong, T., Park, H. S., & Yun, G. (2014). Framework for the analysis of the potential of the rooftop photovoltaic system to achieve the net-zero energy solar buildings. Progress in Photovoltaics, 22(4), 462-478. doi:10.1002/pip.2448
Ordóñez, J., Jadraque, E., Alegre, J., & Martínez, G. (2010). Analysis of the photovoltaic solar energy capacity of residential rooftops in Andalusia (Spain). Renewable and Sustainable Energy Reviews, 14(7), 2122-2130. doi:http://dx.doi.org/10.1016/j.rser.2010.01.001 (2012 CBECS https://sftool.gov/Content/attachments/Iswg/iswg-policies-strategies/7%20Joelle%20Michaels%20-%20CBECS%20Update.pdf) Gagnon, Pieter, Robert Margolis, Jennifer Melius, Caleb Phillips, and Ryan Elmore. "Rooftop Solar Photovoltaic Technical Potential in the United States. A Detailed Assessment." 01, 2016. doi:10.2172/1236153. Denholm, P., and R. Margolis. "Supply Curves for Solar PV-Generated Electricity for the United States." 11, 2008. doi:10.2172/944443. Wiginton, L.k., H.t. Nguyen, and J.m. Pearce. "Quantifying Rooftop Solar Photovoltaic Potential for Regional Renewable Energy Policy." Computers, Environment and Urban Systems 34, no. 4 (07 2010): 345-57. "Climate Change Indicators in the United States." Greenhouse Gases. Accessed June 27, 2016. https://www3.epa.gov/climatechange/science/indicators/ghg/. Fthenakis, V. & Kim, H. C. Land use and electricity generation: A life-cycle analysis. Renew. Sustain. Energy Rev. 13, 1465–1474 (2009). Hernandez, R. R., Hoffacker, M. K., Murphy-Mariscal, M. L., Wu, G. & Allen, M. F. Solar energy development impacts on land-cover change. Proc. Natl. Acad. Sci. 112, (2015a). Moomaw, William, Peter Burgherr, Garvin Heath, Manfred Lenzen, John Nyboer, and Aviel Verbruggen. "Methodology." Renewable Energy Sources and Climate Change Mitigation Special Report of the Intergovernmental Panel on Climate Change: 973-1000. Hernandez, R.r., S.b. Easter, M.l. Murphy-Mariscal, F.t. Maestre, M. Tavassoli, E.b. Allen, C.w. Barrows, J. Belnap, R. Ochoa-Hueso, S. Ravi, and M.f. Allen. "Environmental Impacts of Utility-scale Solar Energy." Renewable and Sustainable Energy Reviews 29 (01 2014): 766-79. doi:10.1016/j.rser.2013.08.041.
15
Hernandez, R. R., Hoffacker, M. K., & Field, C. B. (2015b). Efficient use of land to meet sustainable energy needs. Nature Climate Change, 5(4), 353-358. De Marco, A., Petrosillo, I., Semeraro, T., Pasimeni, M. R., Aretano, R., & Zurlini, G. (2014). The contribution of utility-scale solar energy to the global climate regulation and its effects on local ecosystem services. Global Ecology and Conservation, 2, 324-337. Taha H. 2013. The potential for air-temperature impact from large-scale deployment of solar photovoltaic
arrays in urban areas. Sol Energy 91: 358–67.
Masson V, Bonhomme M, Salagnac J-L, et al. 2014. Solar panels reduce both global warming and urban heat island. Front Environ Sci 2.
Dale, Virginia, Rebecca A. Efroymson and Keith L. Kline. 2011. The Land use-climate change-energy nexus.Landscape Ecol (2011) 26: 755. doi:10.1007/s10980-011-9606-2 Wesoff, Eric. "Solar Star, Largest PV Power Plant in the World, Now Operational." Green Technology. June 26, 2015. Accessed July 05, 2016. http://www.greentechmedia.com/articles/read/Solar-Star-Largest-PV-Power-Plant-in-the-World-Now-Operational. Lukač, Niko, Sebastijan Seme, Katarina Dežan, Borut Žalik, and Gorazd Štumberger. "Economic and Environmental Assessment of Rooftops regarding Suitability for Photovoltaic Systems Installation Based on Remote Sensing Data."Energy 107 (07 2016): 854-65. doi:10.1016/j.energy.2016.04.089