Embed Size (px)
Citation preview

Service Learning Project
Solar Energy vs. Pine Flatwoods: Comparing the carbon offsets and ecosystem services
BSC 4861L Sustainability: Socially & Economically Viable Environmental Protection
Obremski Tiffany Rivera-Díaz Angélica Ryan Shaun Selva Megan Seymour Ryelle
Introduction
The progressing awareness of humanity’s reliance on fossil fuels and the social,
environmental, and economic hardships that have ensued has motivated a shift to investigate
the feasibility of alternative sources of energy. Fossil fuels such as coal, oil, natural gas, and
hydrocarbons are currently the main reservoirs that supply the world’s energy. The process of
burning these fossil fuels creates carbon dioxide and other harmful greenhouse gases as
byproducts that collect in the atmosphere and contribute to global warming.
According to the U.S. Energy Information Administration, Florida ranks third highest in
energy consumption in the United States by 2010 studies. The United States, with less than 5%
of the global population, uses about a quarter of the world’s fossil fuel resources- burning up
nearly 25% of the coal, 26% of the oil, and 27% of the world’s natural gas (Worldwatch
Institute, 2012).
Mountain top removal and strip mining for coal, offshore drilling for oil, and oil
refineries have contributed to environmental degradation and have endangered organisms
through air and water pollution. Renewable energy sources such as hydroelectric, wind, solar,
and geothermal are currently more expensive to develop and implement than our traditional
manufacturing methods. However, world-wide recognition of the social, economic, and
environmental issues that have arisen out of our dependence on these finite sources has led
many to explore the viability of renewable energy as an alternative to fossil fuels and for a
sustainable future. The concept of sustainability in this study addresses the need for humans to
maintain a high quality of life currently and for future generations by being responsible
stewards of the earth to ensure environmental protection, economic development, and social
justice; commonly referred to as the triple bottom line.
Due to the humid subtropical climate in central Florida, the presumption that solar
energy would be a viable alternative to our current sources of energy is widely held. The
amount of solar energy received from the sun at every hour is equivalent to the total amount of
energy that is consumed by the entire world in one year (de Perthuis, 2011). We are currently
utilizing only a minimum amount of this energy, which is one reason why there is an incentive

to further develop solar energy technologies and implement them. Solar energy technologies
can be used at various terrestrial locations, even in temperate, high latitudes. Installation can
range from small to large scale projects; however, once they are in place solar installations have
high reliability, low maintenance costs and can range in durability from 20, 30 or more years
(Giddens, 2009). There are some disadvantages to solar energy such as the fact that it is an
intermittent energy and there could be issues with storage. Another important aspect to
consider is the disturbance that this solar installation will have on the area that is being
transformed.
UCF’s current source of energy is derived from 69% natural gas and 31% coal (Sumner,
2012). The university’s annual energy consumption by 2010 studies is 141, 437.5 Mwh
(Department of Sustainability & Energy Management, 2012). At the University of Central Florida
(UCF) the goal is to be carbon neutral by 2050. Steps taken to meet this goal have included the
implementation of photovoltaic solar arrays as well as thermal solar systems. UCF has decided
to replace 20 acres of forest in order to implement a solar array field that is estimated to have
an annual production of 1.36M kWh (Walters, 2012). However, these solar panels will be used
for performance, development, and operations research and will not actually be producing
energy for UCF during this research trial.
The solar array at UCF will be replacing a Pine Flatwoods forested area. Pine Flatwoods
comprise about 50% of terrestrial ecosystems in Florida (Powell et al, 2008). They are
characterized by an open-canopy of longleaf pine (Pinus palustris) and slash pine (Pinus elliottii),
and a more dense understory which is maintained through low-intensity fires every 3-7 years
(Powell et al., 2008). The forest provides many ecosystem services composed of complex
natural processes that benefit humans directly and indirectly. Some of the key functions of this
area include air filtration, biomass regeneration, wildlife habitat, soil retention, and carbon
storage. Although the services the forest provides are numerous, a detailed analysis is beyond
the scope of this paper; however, Groot, Wilson, and Boumans offer a conceptual framework
and typology for describing, classifying, and valuing ecosystem functions, goods and services in
a clear and consistent manner (Groot et al, 2002). The ecosystem services that were mainly

investigated in this research were the carbon sequestration and air filtration functions of this
unique Pine Flatwoods ecosystem in central Florida.
Carbon sequestration is the measurement of the rate in which carbon is removed from
the atmosphere over a certain amount of time and stored into a unit, such as a plant or soil.
Studies have shown that the amount of carbon sequestration is correlated to the
environmental conditions and interactions occurring in the area; these conditions vary with the
specific location of the forested area and the land management. Forested areas in the U.S. are
recognized as important Carbon (C) sinks (Powell et al., 2008).
Specifically, these forests remove carbon dioxide, hydrogen fluoride, silicon
tetrafluoride, ozone, methane, nitrous oxides, chlorofluorocarbons and other harmful
pollutants from the air (i-Tree, 2012). Not only does the forest remove these harmful chemicals,
it also produces a remarkable amount of oxygen for the world. One acre of forest can produce
enough oxygen for 18 people every day (Department of Natural Resources, 2012).
This research investigated the carbon pollution offsets the solar installation will have
compared to the rate of carbon sequestration of the Pine Flatwoods area. The calculations
provided in this study in regards to the amount of emissions produced in the production,
implementation, and maintenance of the solar panels are conservative due to lack of
information regarding the specific manufacturing processes. The goal of our research was to
quantify the amount of carbon sequestration and air pollution that the forest provides
compared to the amount of carbon that the solar panels offset to determine if replacing this
forested area with a solar array is more sustainable than the natural ecosystem. Our hypothesis
was that the solar panels would offset more carbon than the Pine Flatwoods ecosystem but
that the Pine Flatwoods provided a greater amount of ecosystem services.
Methods
I. Forest
The data for the Pine Flatwoods was gathered at the study area located southeast of the
University of Central Florida’s main campus (Figure 1). The total area of the study site was 20
acres from which 4 random sample plots were chosen. ArcGIS was used to randomly generate
the points. Each of these plots was 1/5 of an acre in area with a radius of 52.66 ft. A center

point was established for each plot from which it was divided into 4 quadrants. The procedure
that followed was obtained from the i-TreeEco Manual which was the program used to process
the data( i-Tree, 2012).
a. Tree Data
For an individual tree, the distance and the direction from the plot center were recorded. A
measuring tape was used to measure the distance and a compass for the direction. The species
was identified and the DBH for the tree was measuring from about 1.4 meters from the ground
using a DBH measuring tape. A single tree had forked stems on its trunk, the DBH was recorded
for each steam. Total height was measured using a laser rangefinder. The crown height was
measured from the base of the tree to lowest branch with live foliage. The crown width was
measured in two directions, North-South and East-West to the nearest meter. Based on the
crown height and width, the percent of crown missing was estimated as represented in Figure
2. The percent of dieback for a tree’s crown area was estimated from the visibly dead branches
or lack of foliage. Crown light exposure (CLE) was measured by the number of sides of the tree
that was receiving sunlight from above. The maximum value of CLE was 5.
b. Shrub Data
From the center point of each plot, we went 26 feet out into the middle of each quadrant.
From here, we measured the data within a 13ft radius. The average height of the shrubs was
measured and the percent of the area each individual species covered was estimated. The
percent dieback of the shrub species was also recorded based on the height and width.
After all the data was gathered it was input into the i-Tree ECO program and sent for
processing. The processed data was then used to obtain the condition of the trees by species,
the carbon sequestration rate and monthly pollutant removal rate of the Pine Flatwoods.
II. Solar
The annual energy usage for the University of Central Florida, for the Fiscal Year 2009-2010,
was obtained from the Annual Energy Project by the Department of Sustainability & Energy

Management (Department of Sustainability & Energy Management, 2012). The annual energy
production of the solar field in the study was obtained from contacting Florida Solar Energy
Center (Walters, 2012). The difference of this numbers gives the amount of energy that the
solar installation will be displacing from the current power grid. The amount of carbon
emissions per Megawatt hours of electricity was obtained through the Environmental
Department’s online reports. This amount of emissions was used to associate the amount of
energy, being displaced by the solar installation, in terms of carbon dioxide emissions.
The value obtained represented the carbon offset of the solar installation annually and was
then compared to the annual rate of carbon sequestration of the Pine Flatwoods.
III. Changes
For the forest data, the methods changed from our original proposal because we followed the
procedure in the i-Tree manual in order to obtain the specific information required for the data
processing through the program. We estimated around 60-70% of each total plot due to the
amount of shrubs that were not all individually measured. The methods for the solar changed
because of the lack of information and communication with the necessary sources of
information. The most recent energy data report for UCF that was found for the study was
from 2010. Only the amount of carbon emissions reduced from usage of the solar installation
was compared. The amount of emissions that go into extraction, production and transportation
of the solar installation’s materials was not used in the calculations. The amount that would be
released from the removal of the forest was also neglected. Other ecosystem services provided
by the forested area were recognized but were not compared to the solar panels because it was
not quantified due to lack of information.

Figure 1. The study area consisting of 20 acres of Pine Flatwoods.
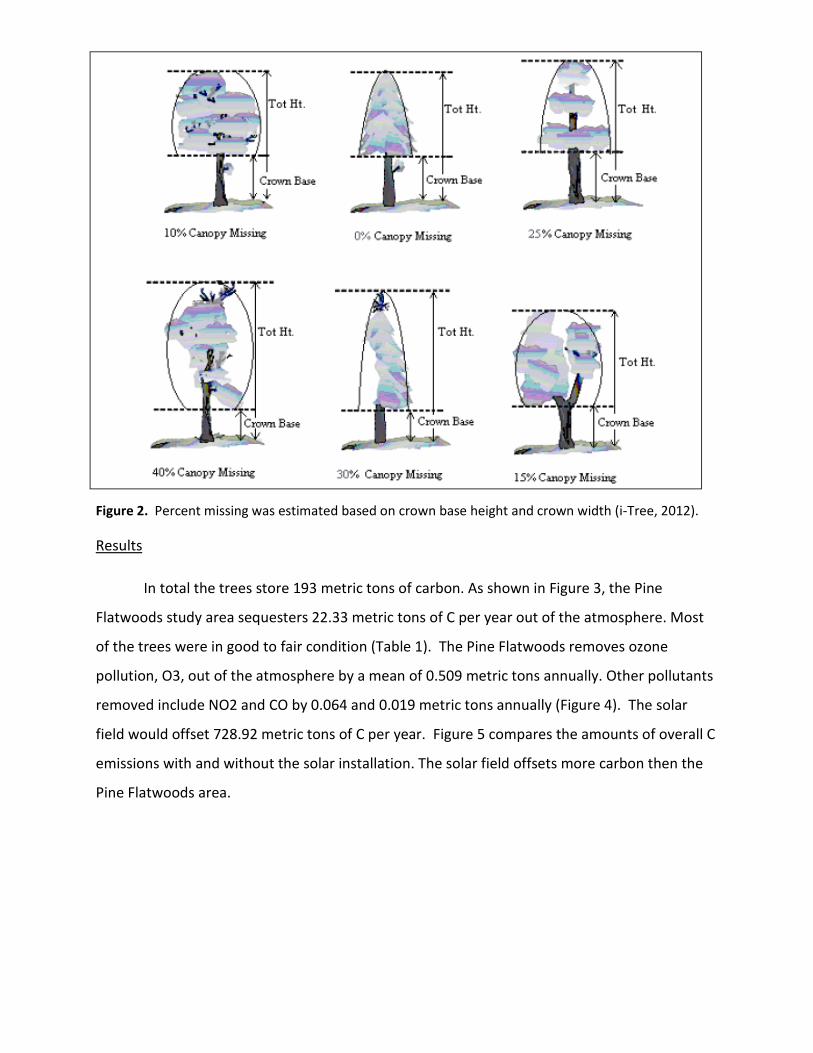
Figure 2. Percent missing was estimated based on crown base height and crown width (i-Tree, 2012).
Results
In total the trees store 193 metric tons of carbon. As shown in Figure 3, the Pine
Flatwoods study area sequesters 22.33 metric tons of C per year out of the atmosphere. Most
of the trees were in good to fair condition (Table 1). The Pine Flatwoods removes ozone
pollution, O3, out of the atmosphere by a mean of 0.509 metric tons annually. Other pollutants
removed include NO2 and CO by 0.064 and 0.019 metric tons annually (Figure 4). The solar
field would offset 728.92 metric tons of C per year. Figure 5 compares the amounts of overall C
emissions with and without the solar installation. The solar field offsets more carbon then the
Pine Flatwoods area.

Figure 3: Annual carbon sequestration of Pine Flatwoods in metric tons annually (i-Tree,2012).
Table 1: Percent of tree population and their conditions (i-Tree,2012).

Figure 4: Monthly value of pollutant removal in metric tons in the study area. Pollutants shown include:
CO (Carbon monoxide), NO2 (Nitrogen dioxide), O3 (Ozone), PM10 (Particulate matter Less than 10
microns), PM2.5 (Particulate matter less than 2.5 microns) and SO2 (Sulfur dioxide) (i-Tree,2012).
Figure 5: Comparison of annual carbon emission in metric tons of CO2.
74400
74600
74800
75000
75200
75400
75600
75800
76000
76200
With Solar Installation withouth Solar Installation
Annu
al C
arbo
n Em
issi
on (m
etric
tons
)
Comparison of Carbon emissions

Discussion
In our analysis of the proposed solar arrays and the Pine Flatwoods forest we
compared the carbon offsets of both. Our results indicated that the solar panels would by far
be the better choice if our primary goal is to offset carbon dioxide in the atmosphere. The
forest is beneficial to sequester C directly from the atmosphere, but quantifiably, the solar
panels remove more C from the atmosphere. The solar panels have the ability to lessen the
energy usage that UCF currently receives from the Florida power grid. Using the i-Tree program
we were able to estimate how much carbon dioxide the forest can sequester from the
atmosphere per year. The estimation was that the forest can sequester approximately 22.33
metric tons of carbon. The implementation of the solar panels can prevent 728.92 metric tons
of carbon dioxide from entering the atmosphere every year. This number was deducted by
assuming that the solar arrays can provide some of the energy usage UCF normally gets from
the FRCC power grid, diverting the amount that is typically derived from the grid because some
of it is being supplemented by the solar panels. Currently, the FRCC power grid supplies UCF
with all of its energy. After receiving an average amount of carbon dioxide released during
production of this energy, we calculated the amount of carbon dioxide that is released into the
atmosphere directly from UCF’s power needs. The production costs of the solar panels in terms
of CO2 released into the atmosphere during the production steps was not accounted for in the
estimation due to lack of specific information regarding the manufacturing methods.
The solar panels offset more carbon than the forest. However, the amount of carbon
emissions did not account for the amount that goes into extraction, production and
transportation of the materials for the solar installation. The Pine Flatwoods not only sequester
C and other air pollutants, it also produces 52 metric tons of oxygen per year and stores around
193 metric tons of C within its biomass (i-Tree, 2012). Regarding ecosystems services, the Pine
Flatwoods provides much more than just carbon sequestration. The area also serves as a
habitat for both plant and animal species. Possible human error and miscalculations could also
be taken into consideration. The project assumed the solar installation would be used to lower
energy needs of the UCF campus; however, the actual project that is planned to take place at
study area is for research and development purposes and not for production.

Why do we care?
This project was very important because there are economic, social, and environmental
considerations associated with the decision to replace a forested area with a solar array. The
most important thing that we learned from the study is that while the forest effetely absorbs
carbon and pollutants from the atmosphere, the solar panels are going to offset more carbon
dioxide over time. Regarding this project, the solar panels seem to be the right choice.
However, if ecosystem services that the forest provides were better quantified, perhaps the
forest would be the more sustainable option. This project was in no way designed to determine
which is better in general; it was designed to determine whether solar or the forest is more
effective at offsetting carbon from the atmosphere. Therefore, the study supported our initial
hypothesis that the solar panels will offset more carbon from atmosphere than the Pine
Flatwood forest. The project remains open to future modification and further study.
Works Cited
de Groot, R.S., et al., “A typology for the classification, description and valuation of ecosystem
functions, goods and services” Ecological Economics, 41, 393-408. 2002.
de Perthuis,C., “Economic Choices in a Warming World” <Cambridge University Press>.2011.
Department of Natural Resoruces. Maryland. www.dnr.state.md.us . November,2012.
Department of Sustainability & Energy Management. Annual Energy Projects Report Fiscal Year
2009-2010. Annual Energy Projects Summary Report. www.energy.ucf.edu. November,
2012.
Dobbs, C., “A framework for developing urban forest ecosystem services and good indicators”
Landscape and Urban Planning, 99, 196-206. 2011.
Giddens, A., “The Politics of Climate Change” <Polity Press> 2009.

Powell, T., et al., “Carbon exchange of a mature, naturally regenerated pine forest in north
Florida” Global Change Biology, 14, 2523-2538. 2008.
"The State of Consumption Today". Worldwatch Institute,
http://www.worldwatch.org/node/810. September 23, 2012.
Sumner, R. Personal Communication. Progress Energy. November 5, 2012.
"I-Tree Eco." I-Tree Eco. N.p., n.d. Web. 23 Sept. 2012.
<http://www.itreetools.org/eco/index.php>.
“Trees Reduce Air Pollution.” (October 2, 2012)
http://www.dnr.state.md.us/forests/publications/urban2.html
Walters, J. Personal Communication. Florida Solar Energy Center. September 27,2012.