Embed Size (px)
Citation preview
Solar Explosive EventsThroughout the Evolution of
the Solar System. II.Trends with Time
Rachel Osten@rachelosten
Space Telescope Science InstituteNASA Heliophysics Summer School
Outline
Synthesizing event-focussed results:
flare spectral energy distribution, energy partition
frequency distributions
Time Periods:
Stellar infancy: birth to Zero Age Main Sequence(ZAMS)
Stellar Teenage Years: ZAMS to 1 GY
Stellar Adulthood: 1-4.5 GY
Stellar Old Age: >4.5 GY
•
•
•
•
•
•
•
•
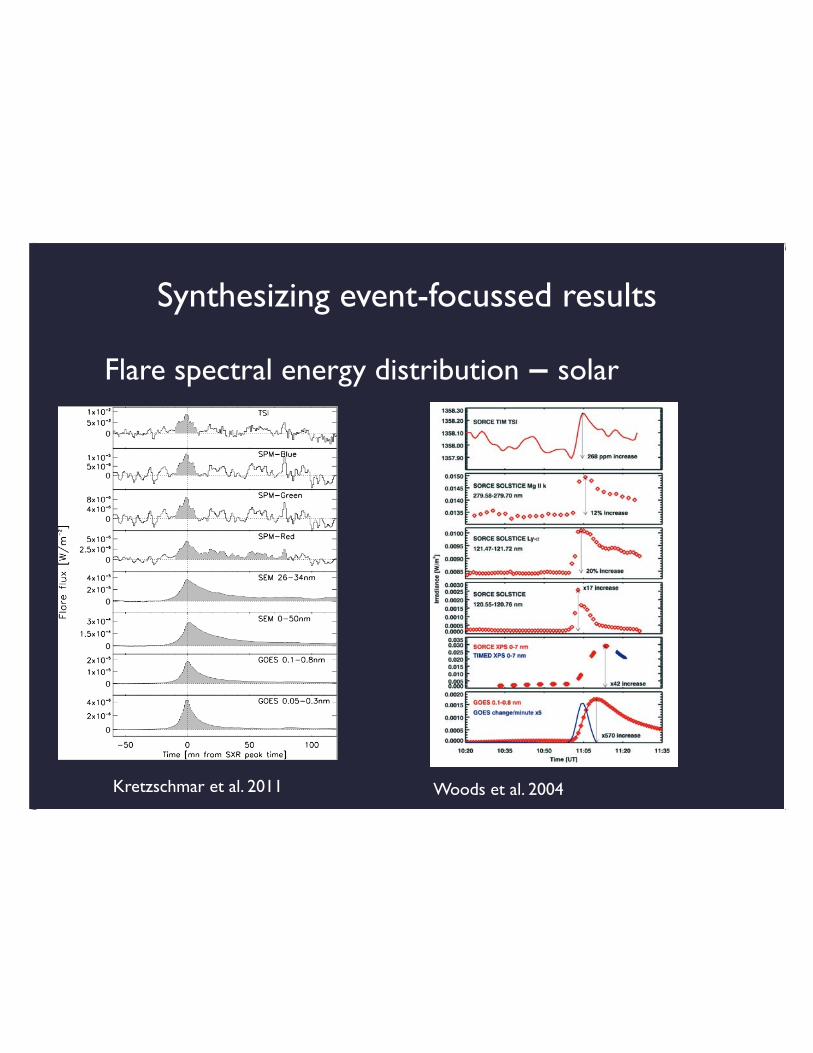
Synthesizing event-focussed results
Flare spectral energy distribution - solar
Kretzschmar et al. 2011 Woods et al. 2004
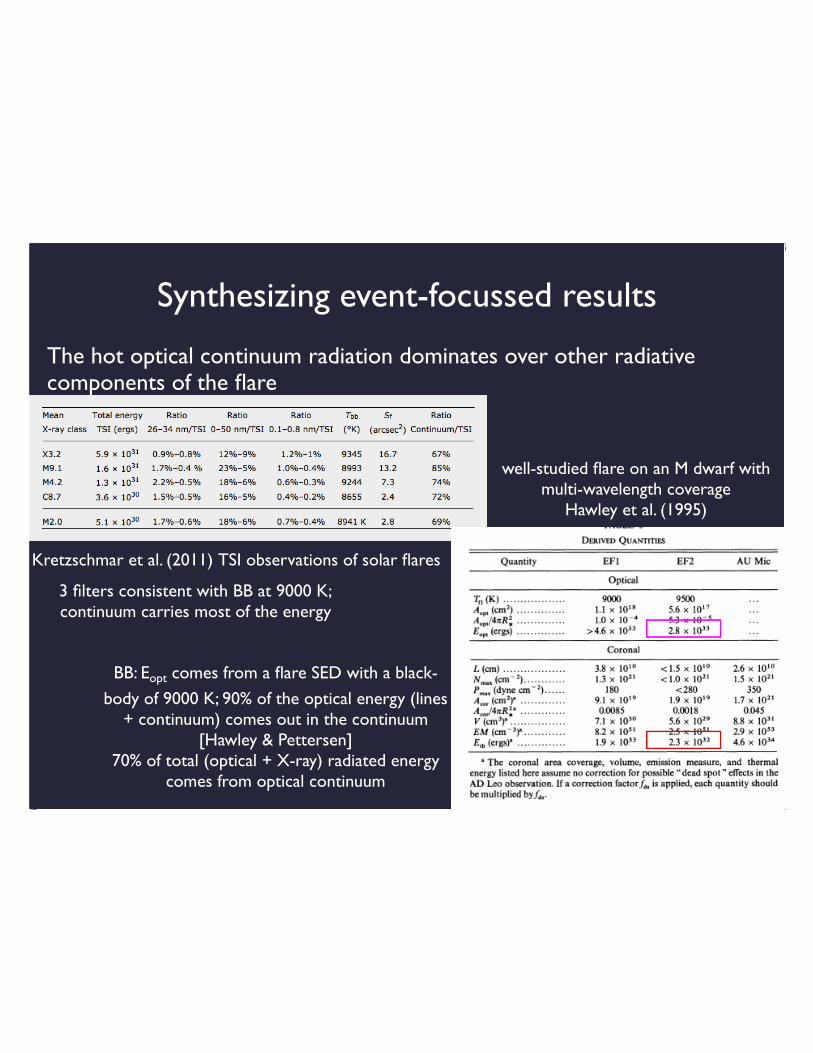
Synthesizing event-focussed results
The hot optical continuum radiation dominates over other radiativecomponents of the flare
Kretzschmar et al. (2011) TSI observations of solar flares
well-studied flare on an M dwarf withmulti-wavelength coverage
Hawley et al. (1995)
BB: Eopt comes from a flare SED with a black-
body of 9000 K; 90% of the optical energy (lines+ continuum) comes out in the continuum
[Hawley & Pettersen]70% of total (optical + X-ray) radiated energy
comes from optical continuum
3 filters consistent with BB at 9000 K;continuum carries most of the energy
AU Mic, Smith et al. 2005
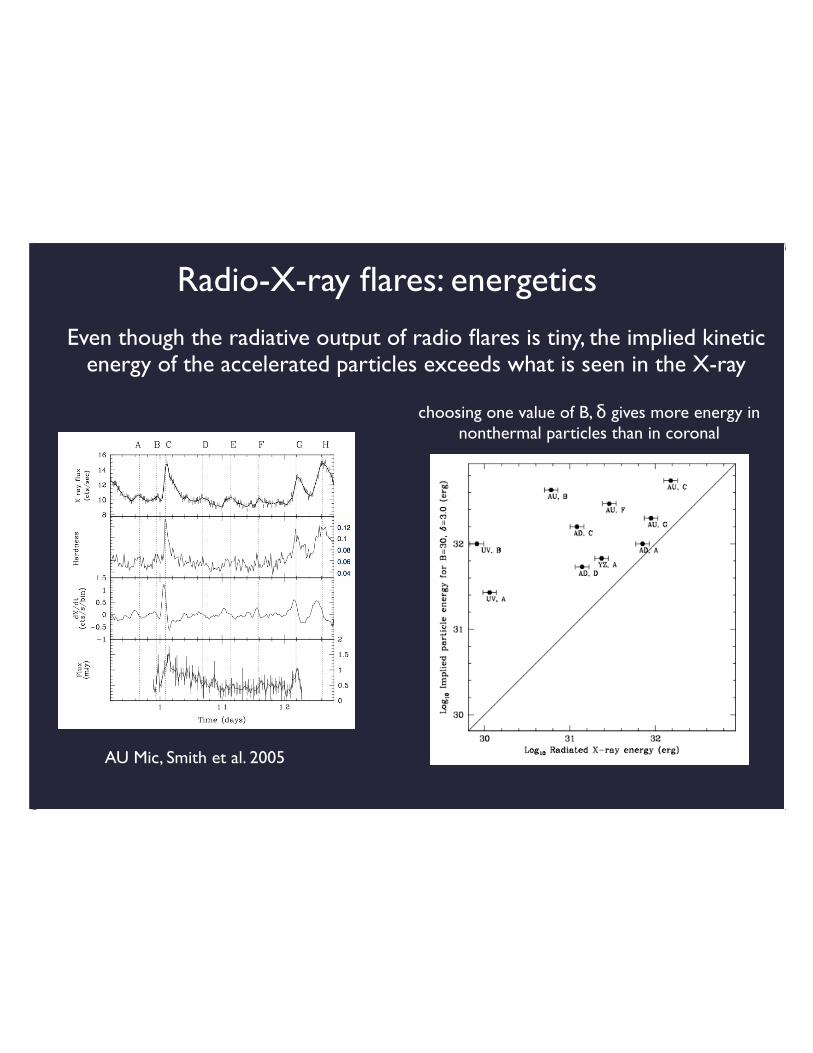
Radio-X-ray flares: energetics
choosing one value of B, δ gives more energy innonthermal particles than in coronal
Even though the radiative output of radio flares is tiny, the implied kineticenergy of the accelerated particles exceeds what is seen in the X-ray
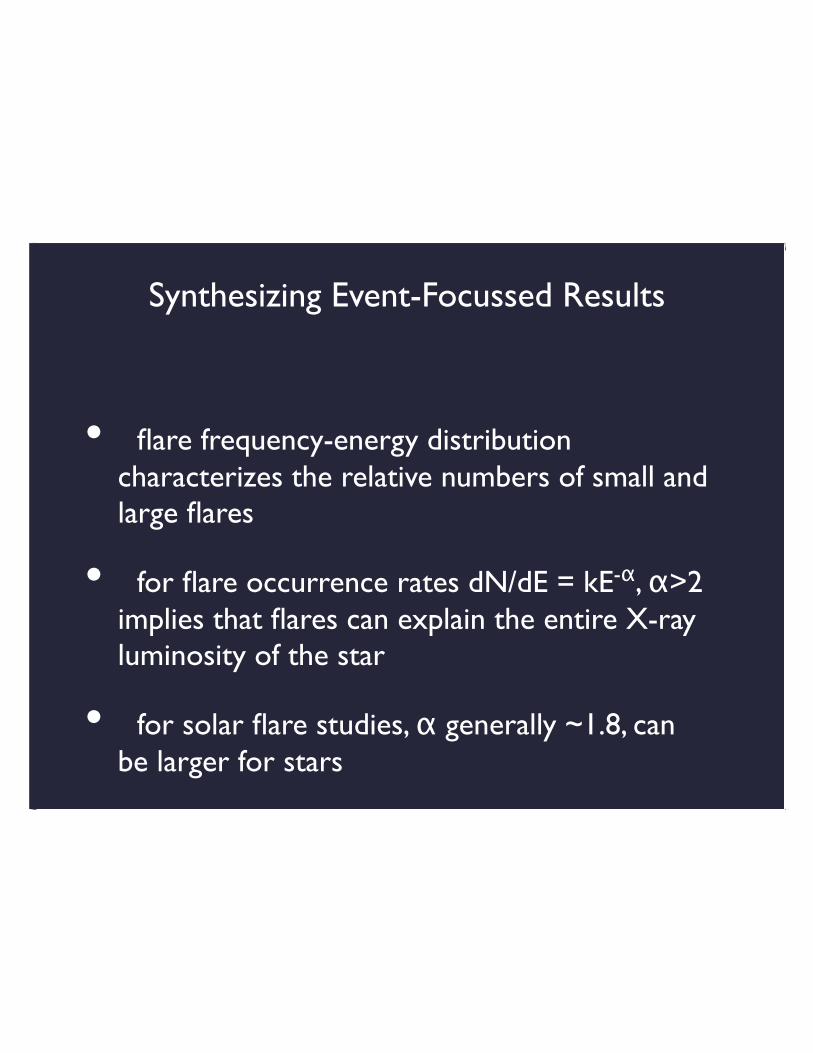
Synthesizing Event-Focussed Results
flare frequency-energy distributioncharacterizes the relative numbers of small andlarge flares
for flare occurrence rates dN/dE = kE-α, α>2implies that flares can explain the entire X-rayluminosity of the star
for solar flare studies, α generally ~1.8, canbe larger for stars
•
•
•
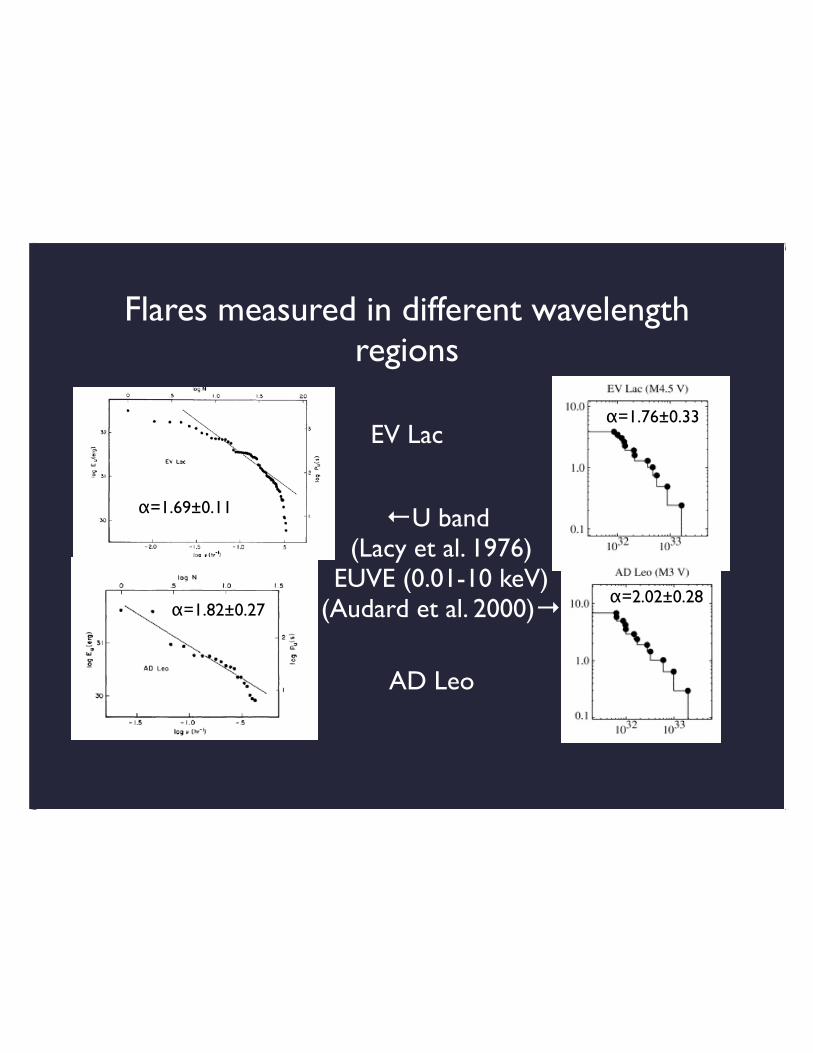
Flares measured in different wavelengthregions
←U band (Lacy et al. 1976)
EUVE (0.01-10 keV)(Audard et al. 2000)→
β=-0.69±0.11
β=-0.82±0.27α=2.02± 0.28
α=1.76±0.33EV Lac
AD Leo
α=1.69±0.11
α=1.82±0.27α=2.02±0.28
α=1.76±0.33
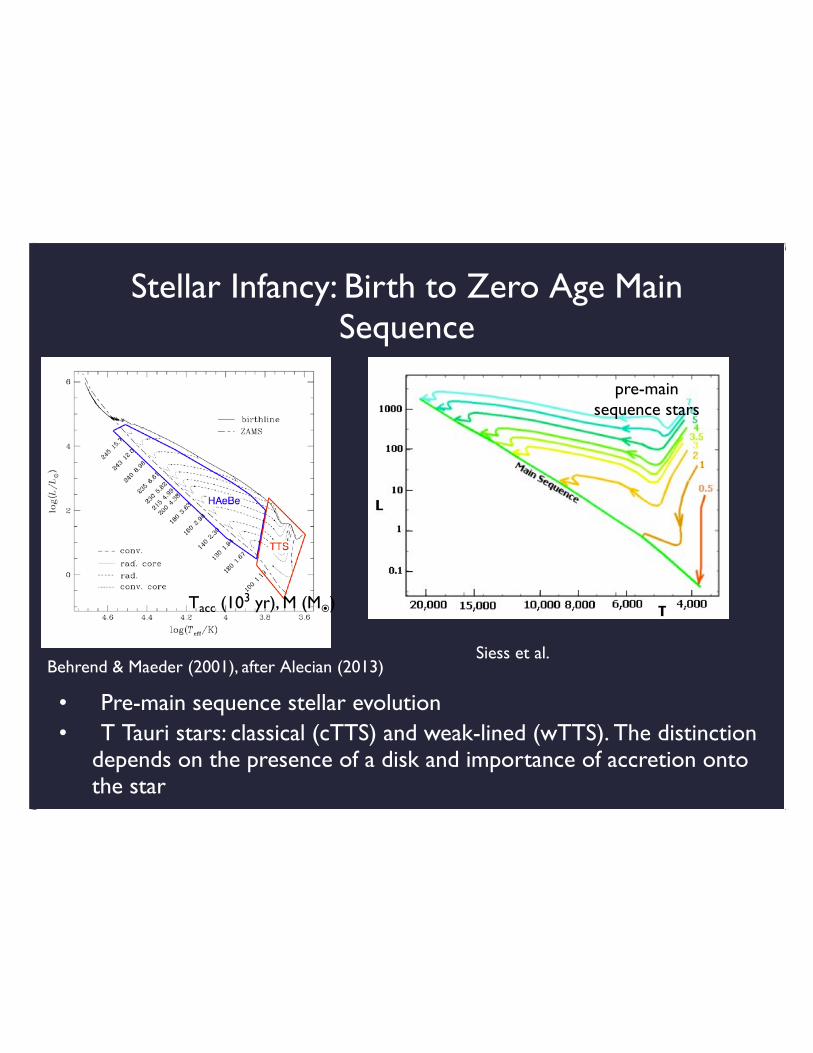
Stellar Infancy: Birth to Zero Age MainSequence
Pre-main sequence stellar evolutionT Tauri stars: classical (cTTS) and weak-lined (wTTS). The distinction
depends on the presence of a disk and importance of accretion ontothe star
••
pre-mainsequence stars
Tacc (103 yr), M (M⦿)
Behrend & Maeder (2001), after Alecian (2013)Siess et al.
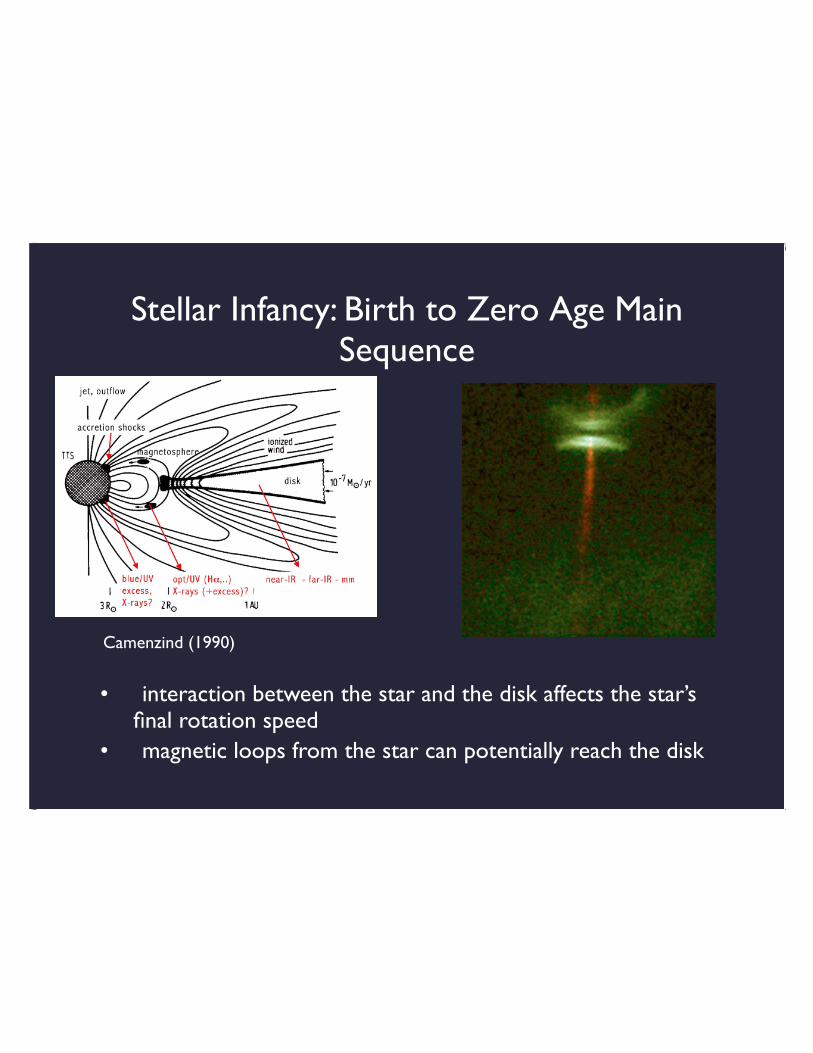
Stellar Infancy: Birth to Zero Age MainSequence
interaction between the star and the disk affects the star’sfinal rotation speedmagnetic loops from the star can potentially reach the disk
•
•
Camenzind (1990)
Stellar Infancy: Birth to Zero Age MainSequence
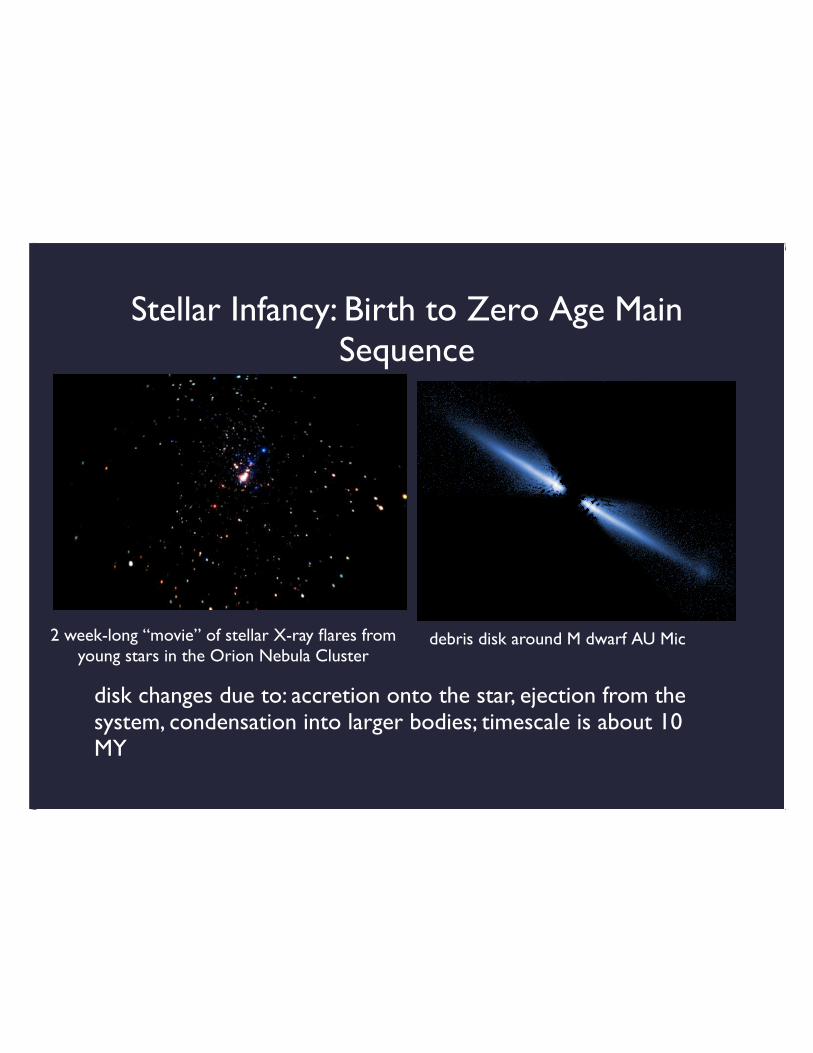
disk changes due to: accretion onto the star, ejection from thesystem, condensation into larger bodies; timescale is about 10MY
debris disk around M dwarf AU Mic2 week-long “movie” of stellar X-ray flares fromyoung stars in the Orion Nebula Cluster
Stellar Infancy: Birth to Zero Age MainSequence
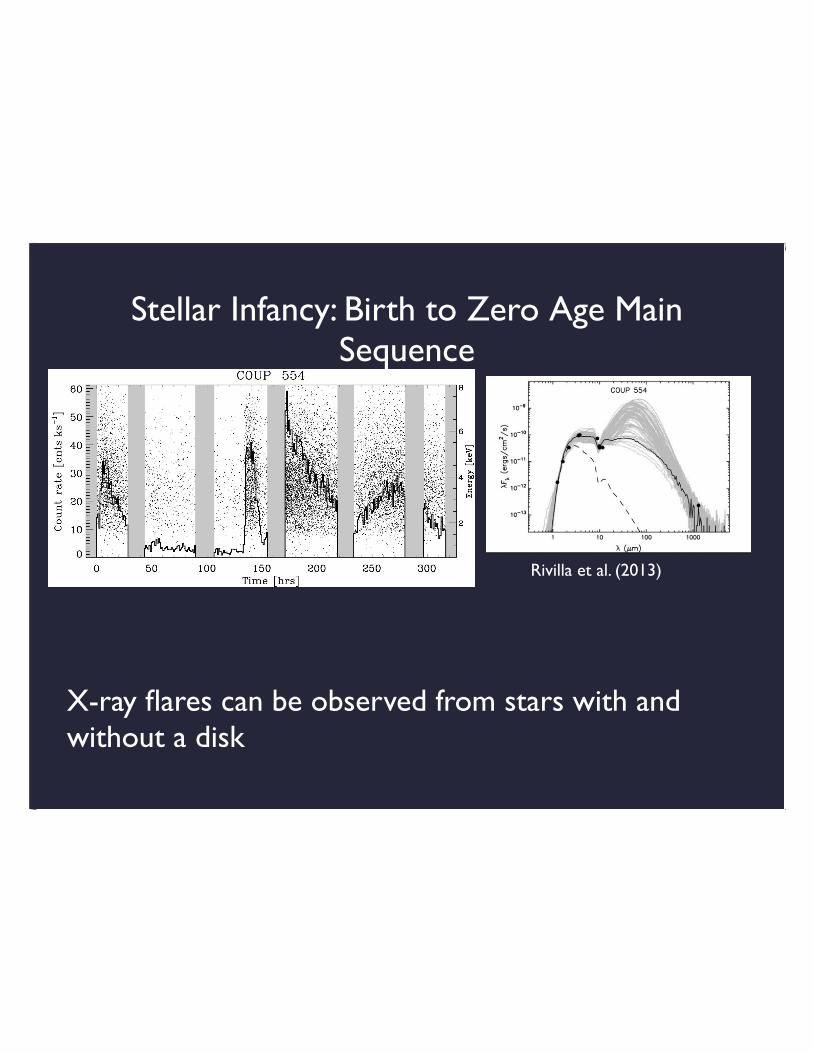
X-ray flares can be observed from stars with andwithout a disk
Rivilla et al. (2013)
Stellar Infancy: Birth to Zero Age MainSequence
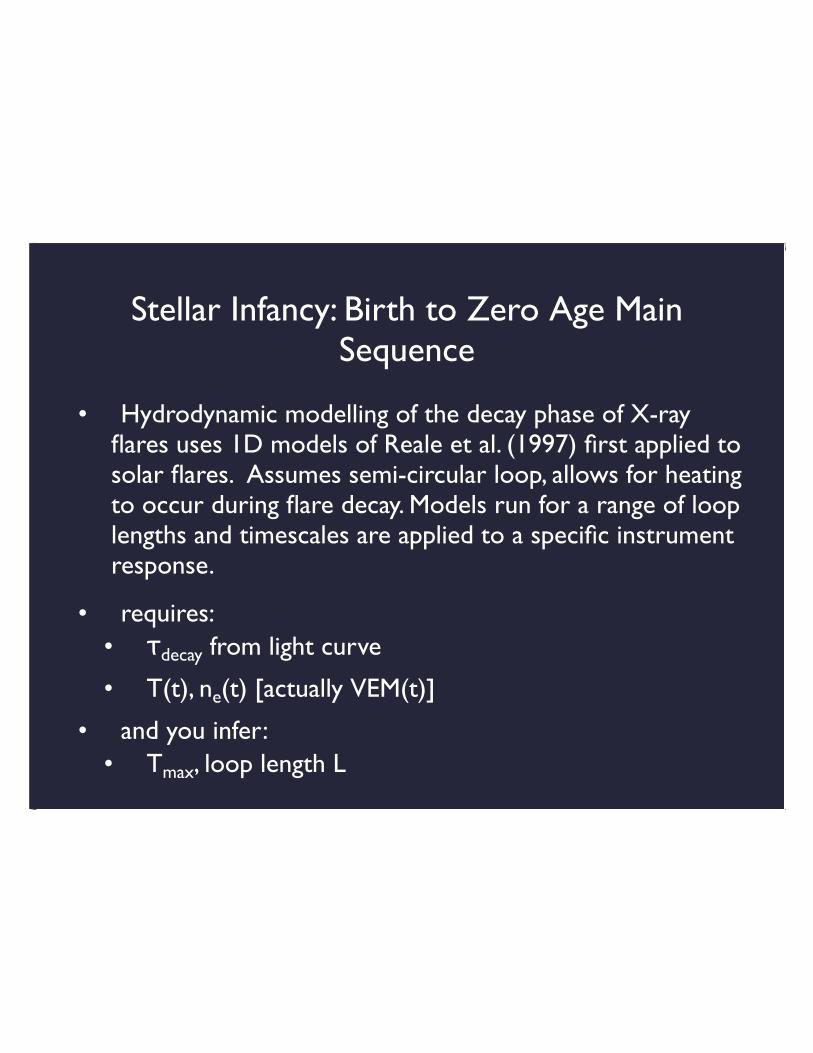
Hydrodynamic modelling of the decay phase of X-rayflares uses 1D models of Reale et al. (1997) first applied tosolar flares. Assumes semi-circular loop, allows for heatingto occur during flare decay. Models run for a range of looplengths and timescales are applied to a specific instrumentresponse.
requires:τdecay from light curve
T(t), ne(t) [actually VEM(t)]
and you infer:Tmax, loop length L
•
••
•
••
Stellar Infancy: Birth to Zero Age MainSequence
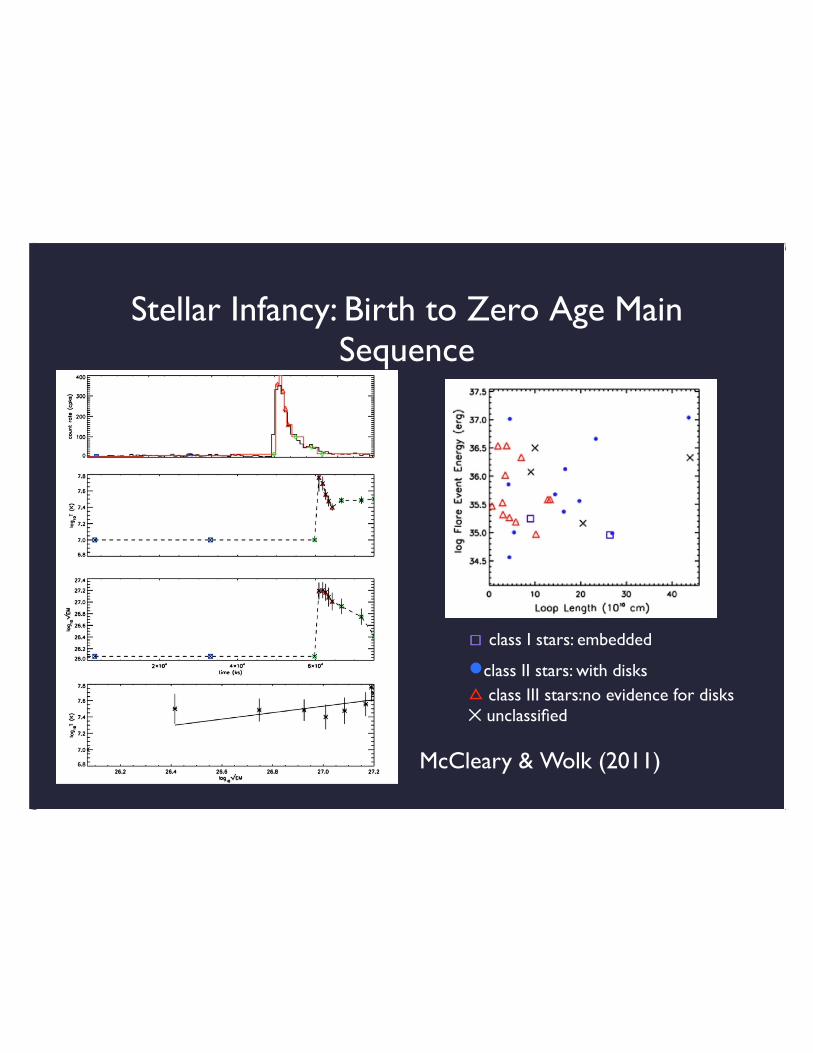
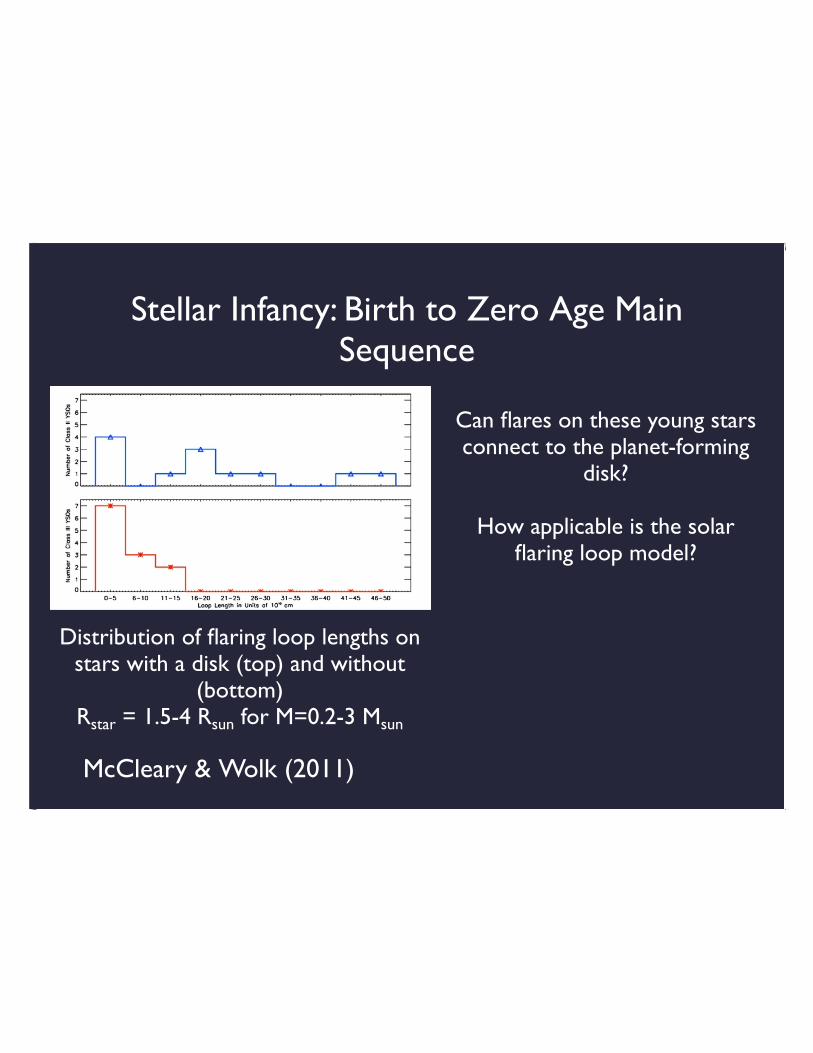
McCleary & Wolk (2011)
☐☐ class I stars: embedded
●class II stars: with disks△ class III stars:no evidence for disks✕ unclassified
Stellar Infancy: Birth to Zero Age MainSequence
McCleary & Wolk (2011)
Distribution of flaring loop lengths onstars with a disk (top) and without
(bottom)Rstar = 1.5-4 Rsun for M=0.2-3 Msun
Can flares on these young starsconnect to the planet-forming
disk?
How applicable is the solarflaring loop model?
Stellar Infancy: Birth to Zero Age MainSequence
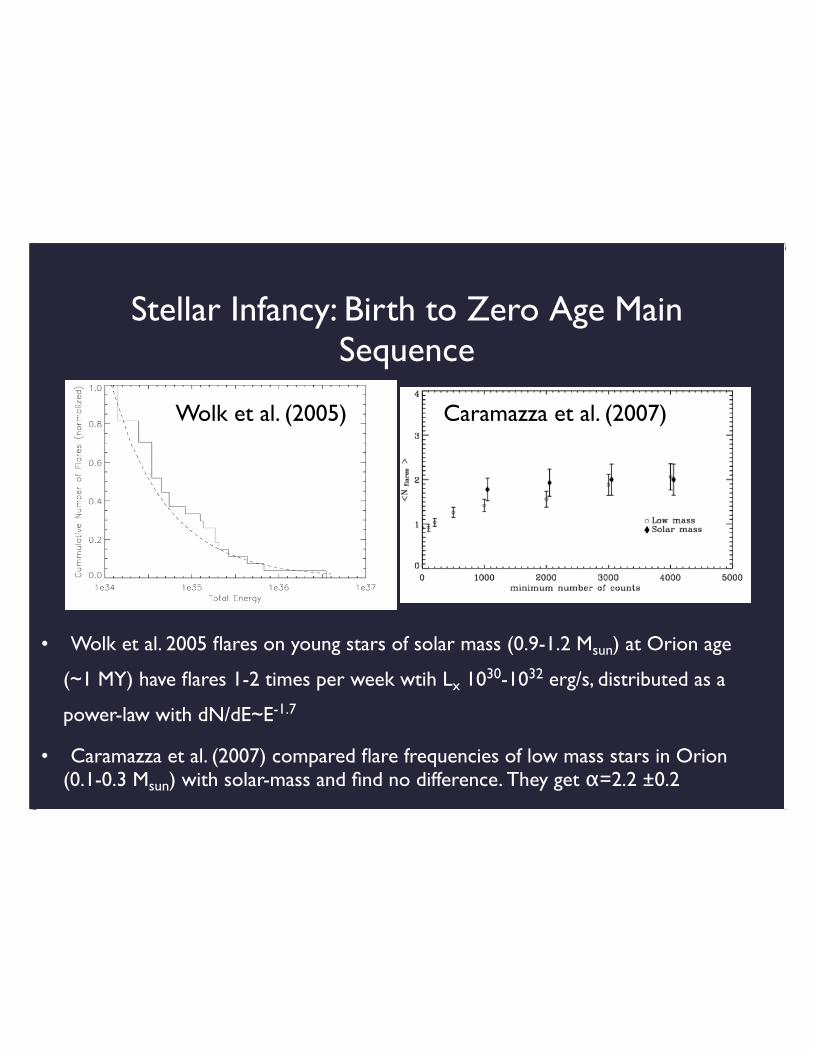
Wolk et al. 2005 flares on young stars of solar mass (0.9-1.2 Msun) at Orion age
(~1 MY) have flares 1-2 times per week wtih Lx 1030-1032 erg/s, distributed as a
power-law with dN/dE~E-1.7
Caramazza et al. (2007) compared flare frequencies of low mass stars in Orion(0.1-0.3 Msun) with solar-mass and find no difference. They get α=2.2 ±0.2
•
•
Wolk et al. (2005) Caramazza et al. (2007)
Stellar Infancy: Birth to ZeroAge Main Sequence
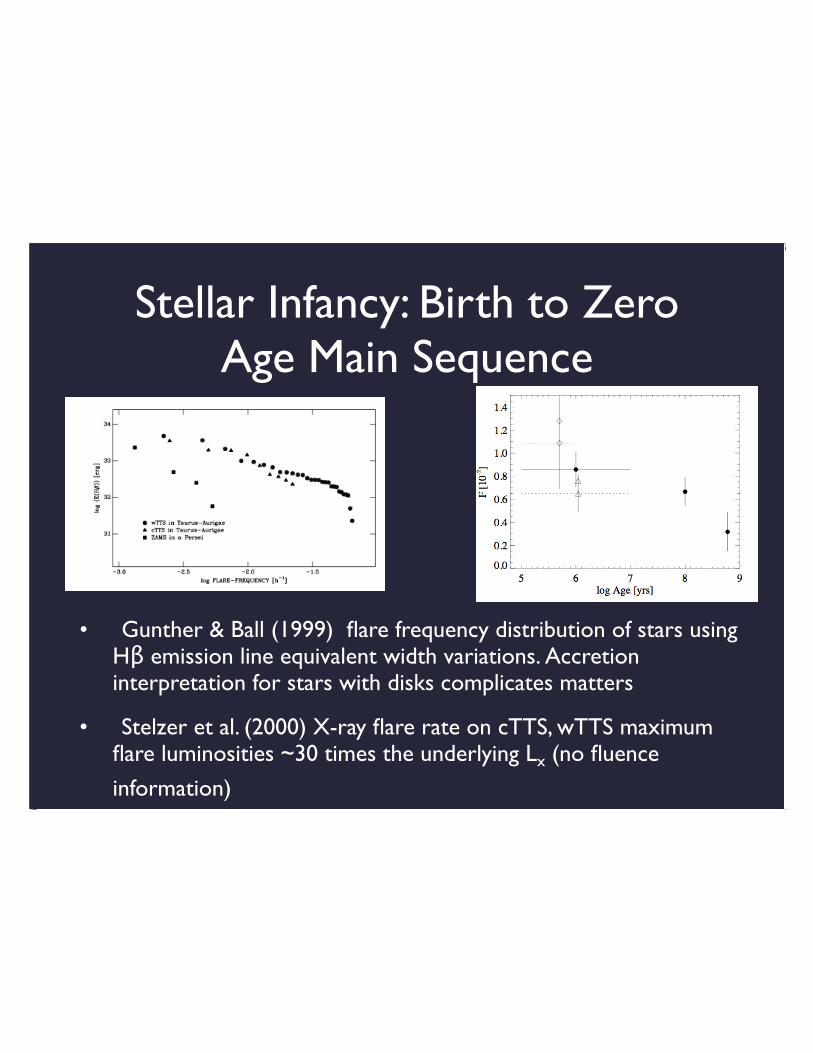
Gunther & Ball (1999) flare frequency distribution of stars usingHβ emission line equivalent width variations. Accretioninterpretation for stars with disks complicates matters
Stelzer et al. (2000) X-ray flare rate on cTTS, wTTS maximumflare luminosities ~30 times the underlying Lx (no fluence
information)
•
•
Stellar Infancy: Birth to ZeroAge Main Sequence
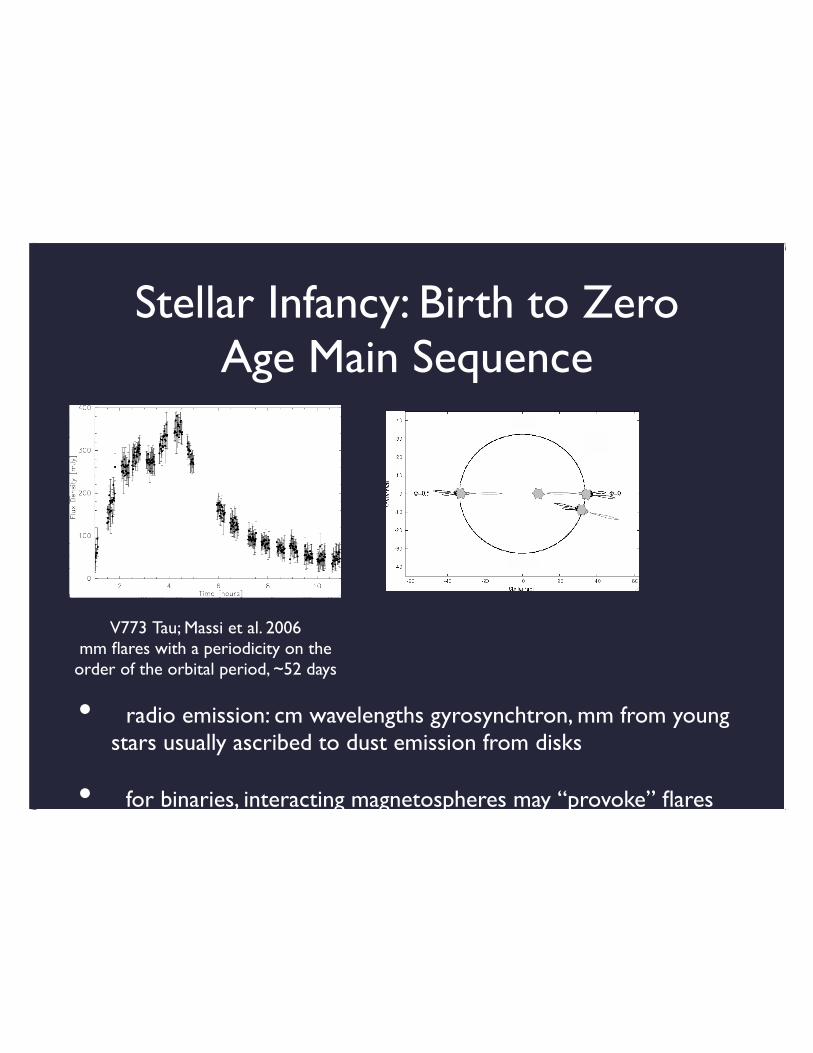
radio emission: cm wavelengths gyrosynchtron, mm from youngstars usually ascribed to dust emission from disks
for binaries, interacting magnetospheres may “provoke” flares
•
•
V773 Tau; Massi et al. 2006mm flares with a periodicity on the
order of the orbital period, ~52 days
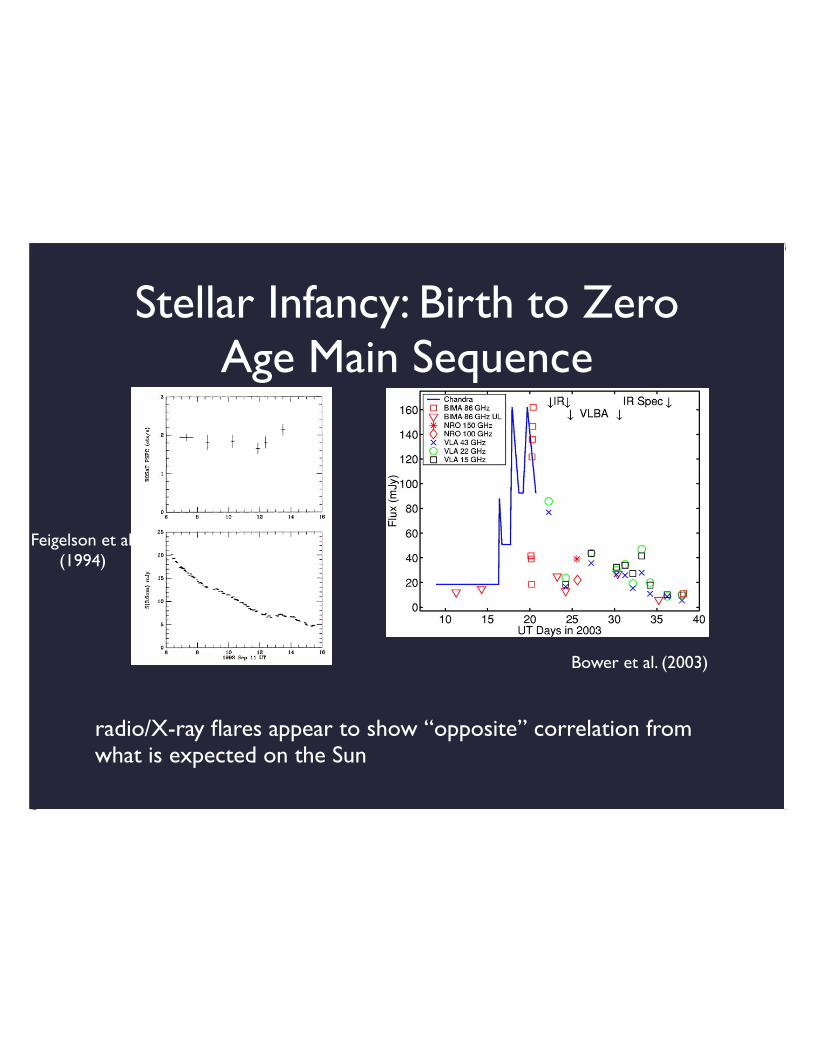
Stellar Infancy: Birth to ZeroAge Main Sequence
radio/X-ray flares appear to show “opposite” correlation fromwhat is expected on the Sun
Feigelson et al.(1994)
Bower et al. (2003)
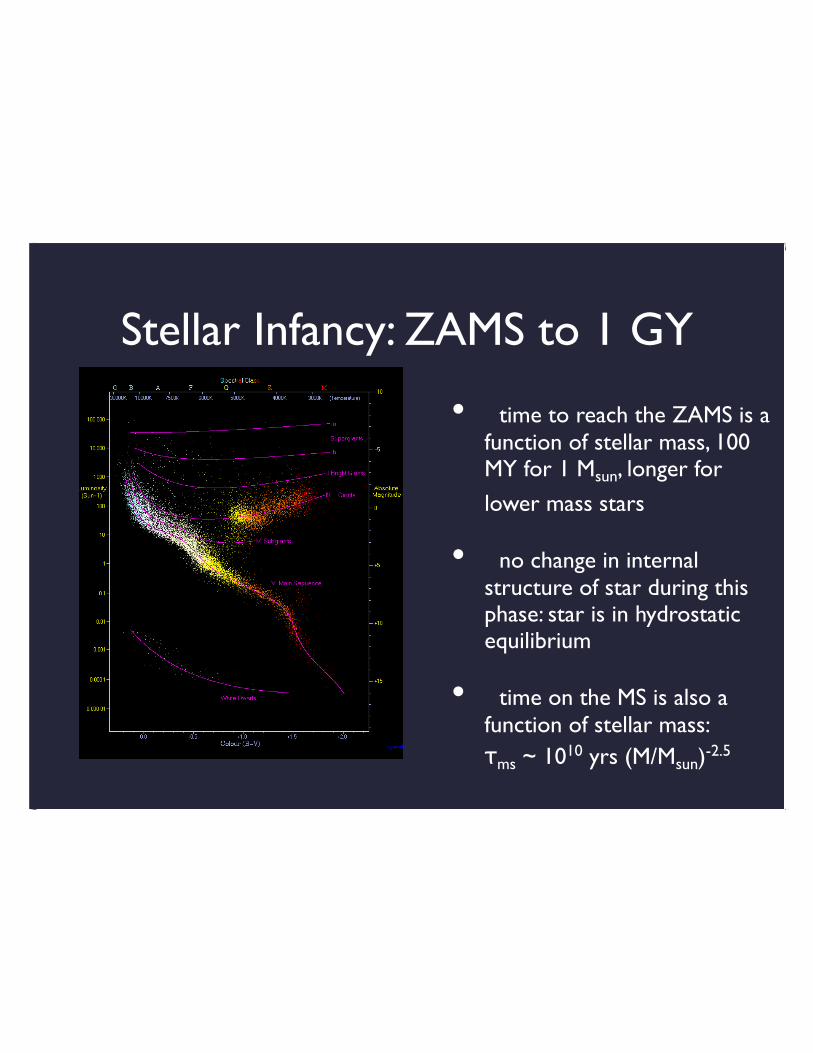
Stellar Infancy: ZAMS to 1 GY
time to reach the ZAMS is afunction of stellar mass, 100MY for 1 Msun, longer for
lower mass stars
no change in internalstructure of star during thisphase: star is in hydrostaticequilibrium
time on the MS is also afunction of stellar mass: τms ~ 1010 yrs (M/Msun)-2.5
•
•
•
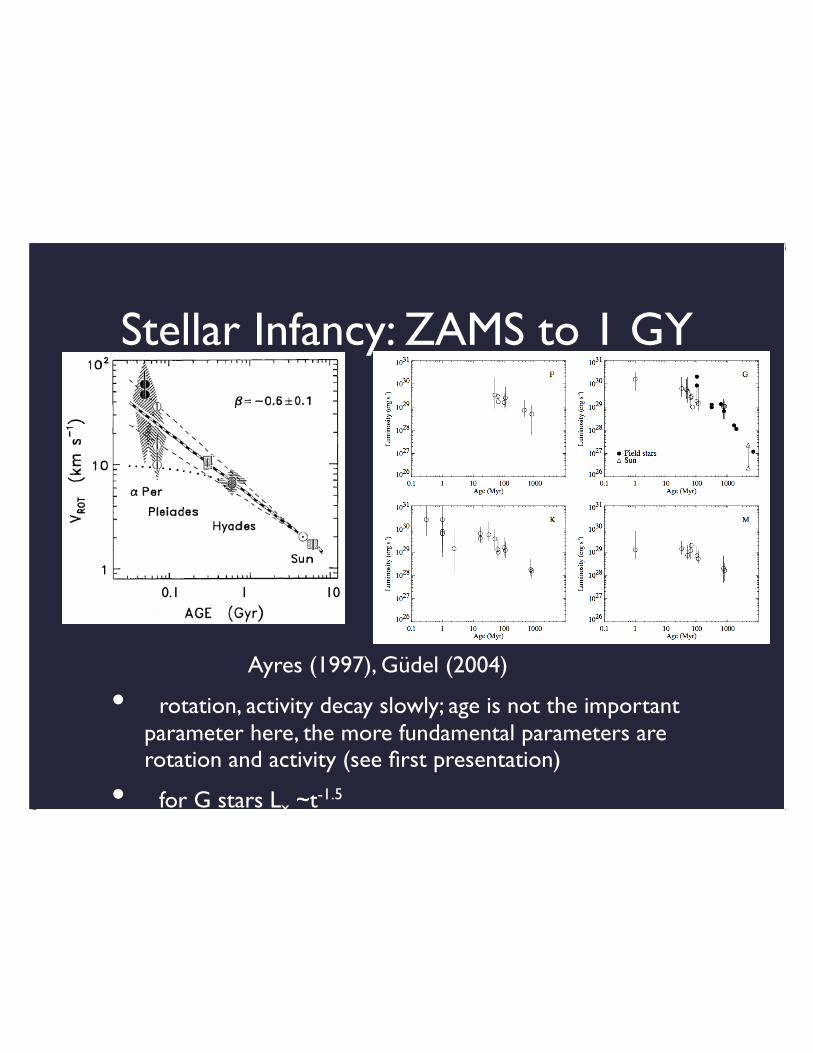
Stellar Infancy: ZAMS to 1 GY
rotation, activity decay slowly; age is not the importantparameter here, the more fundamental parameters arerotation and activity (see first presentation)
for G stars Lx ~t-1.5
•
•
1010.1
Ayres (1997), Güdel (2004)
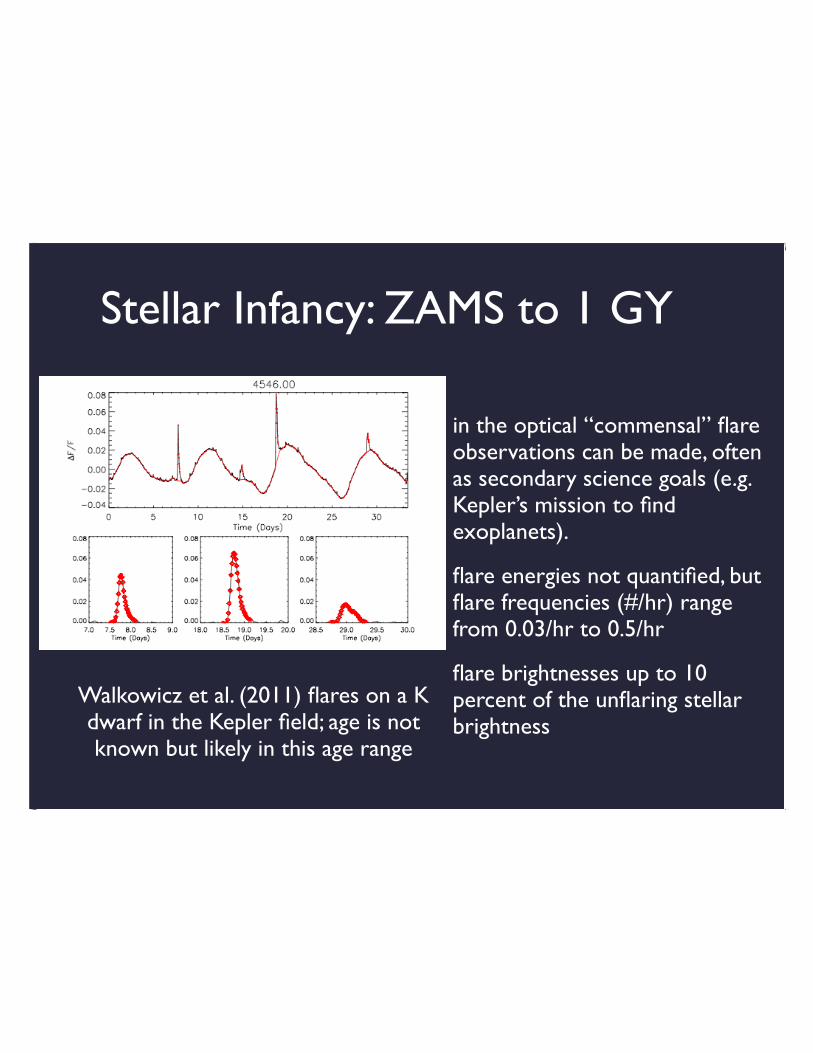
in the optical “commensal” flareobservations can be made, oftenas secondary science goals (e.g.Kepler’s mission to findexoplanets).
flare energies not quantified, butflare frequencies (#/hr) rangefrom 0.03/hr to 0.5/hr
flare brightnesses up to 10percent of the unflaring stellarbrightness
Walkowicz et al. (2011) flares on a Kdwarf in the Kepler field; age is notknown but likely in this age range
Stellar Infancy: ZAMS to 1 GY
Stellar Infancy: ZAMS to 1 GY
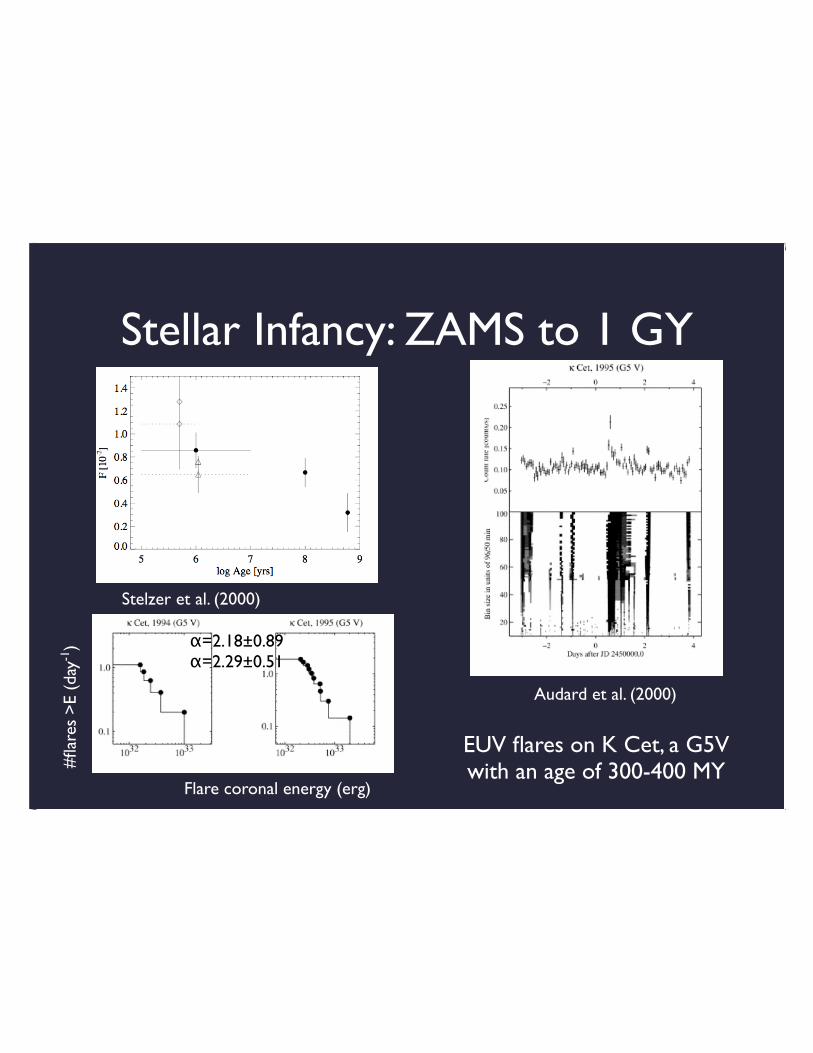
Stelzer et al. (2000)
EUV flares on K Cet, a G5Vwith an age of 300-400 MY
Audard et al. (2000)
α=2.18±0.89α=2.29±0.51
Flare coronal energy (erg)
#fla
res
>E
(day
-1)
Schrijver et al. 2012
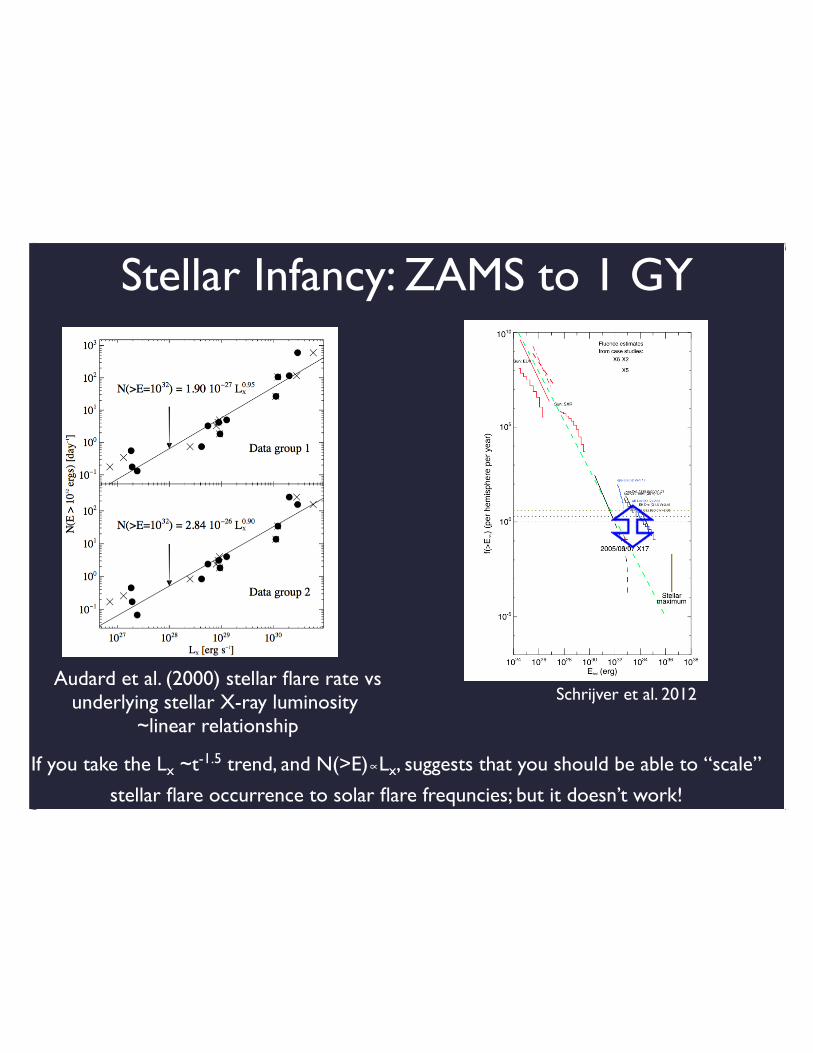
Stellar Infancy: ZAMS to 1 GY
Audard et al. (2000) stellar flare rate vsunderlying stellar X-ray luminosity
~linear relationship
If you take the Lx ~t-1.5 trend, and N(>E)∝Lx, suggests that you should be able to “scale”
stellar flare occurrence to solar flare frequncies; but it doesn’t work!
Stellar Infancy: ZAMS to 1 GY
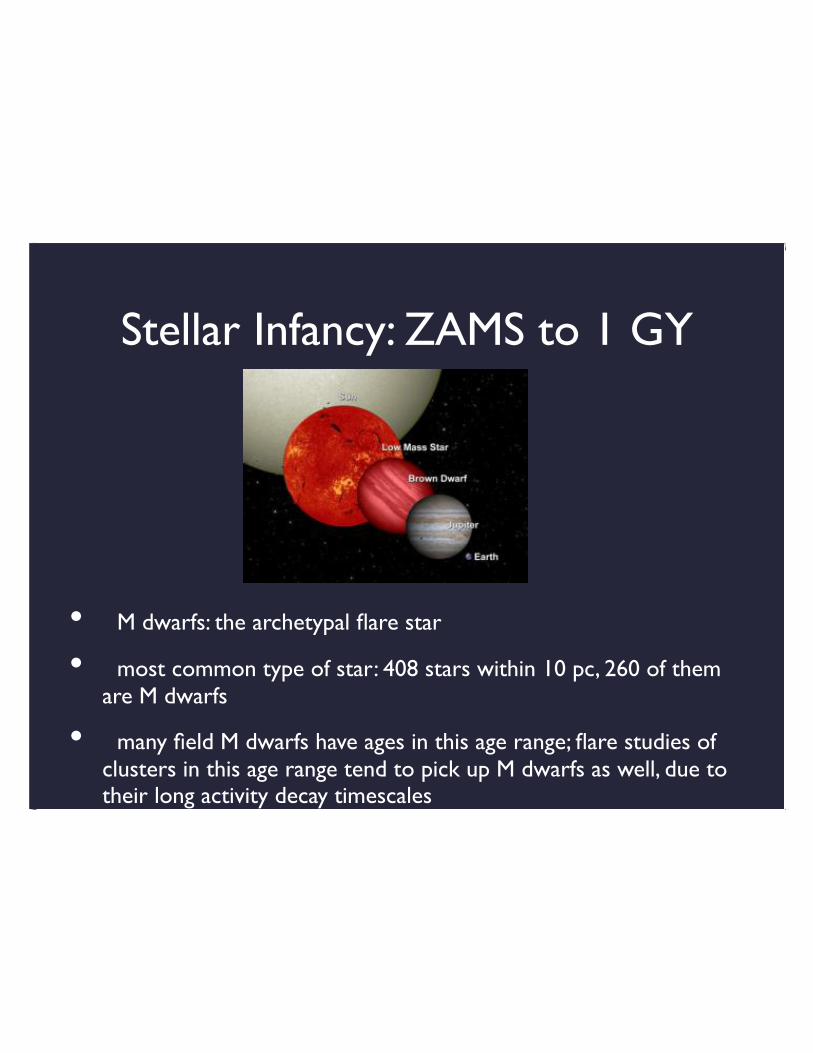
M dwarfs: the archetypal flare star
most common type of star: 408 stars within 10 pc, 260 of themare M dwarfs
many field M dwarfs have ages in this age range; flare studies ofclusters in this age range tend to pick up M dwarfs as well, due totheir long activity decay timescales
••
•
Stellar Infancy: ZAMS to 1 GY
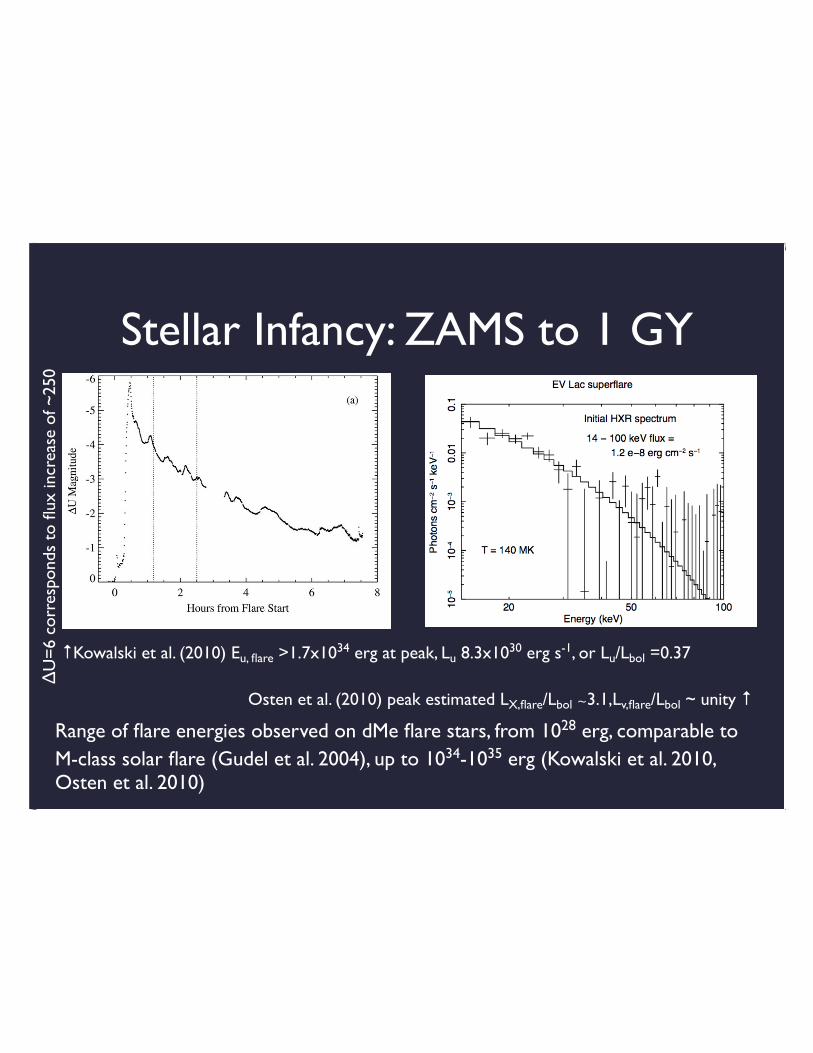
Range of flare energies observed on dMe flare stars, from 1028 erg, comparable toM-class solar flare (Gudel et al. 2004), up to 1034-1035 erg (Kowalski et al. 2010,Osten et al. 2010)
↑Kowalski et al. (2010) Eu, flare >1.7x1034 erg at peak, Lu 8.3x1030 erg s-1, or Lu/Lbol =0.37
Osten et al. (2010) peak estimated LX,flare/Lbol ∼3.1,Lv,flare/Lbol ~ unity ↑
ΔU=
6 co
rres
pond
s to
flux
incr
ease
of ~
250
Stellar Infancy: ZAMS to 1 GY
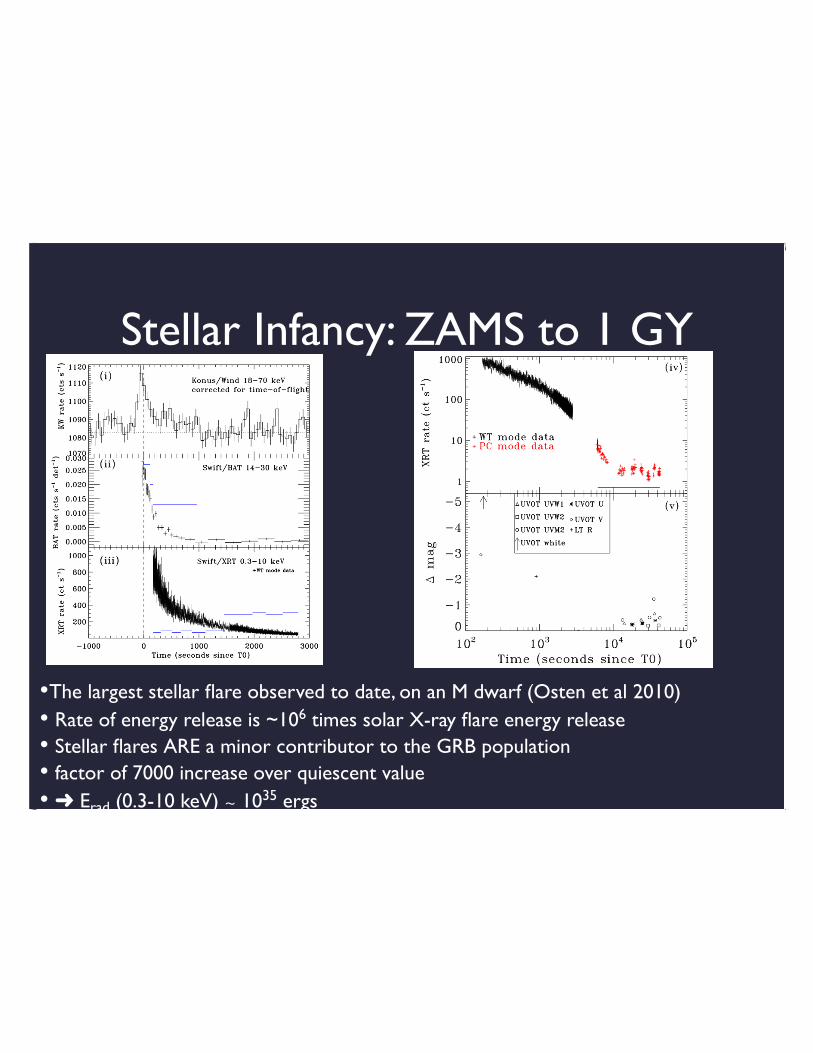
The largest stellar flare observed to date, on an M dwarf (Osten et al 2010) Rate of energy release is ~106 times solar X-ray flare energy release Stellar flares ARE a minor contributor to the GRB population factor of 7000 increase over quiescent value ➜ Erad (0.3-10 keV) ∼ 1035 ergs
•••••
Stellar Infancy: ZAMS to 1 GY
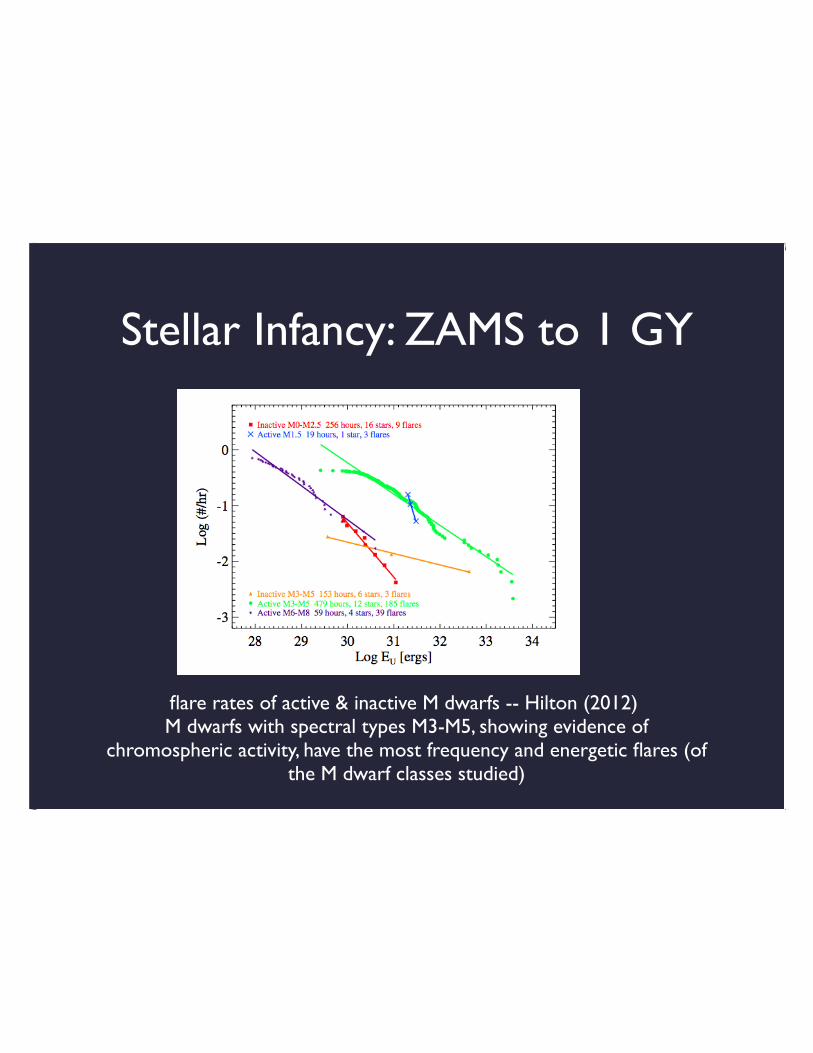
flare rates of active & inactive M dwarfs -- Hilton (2012) M dwarfs with spectral types M3-M5, showing evidence of
chromospheric activity, have the most frequency and energetic flares (ofthe M dwarf classes studied)
Stellar Adulthood: 1-4.5 GY
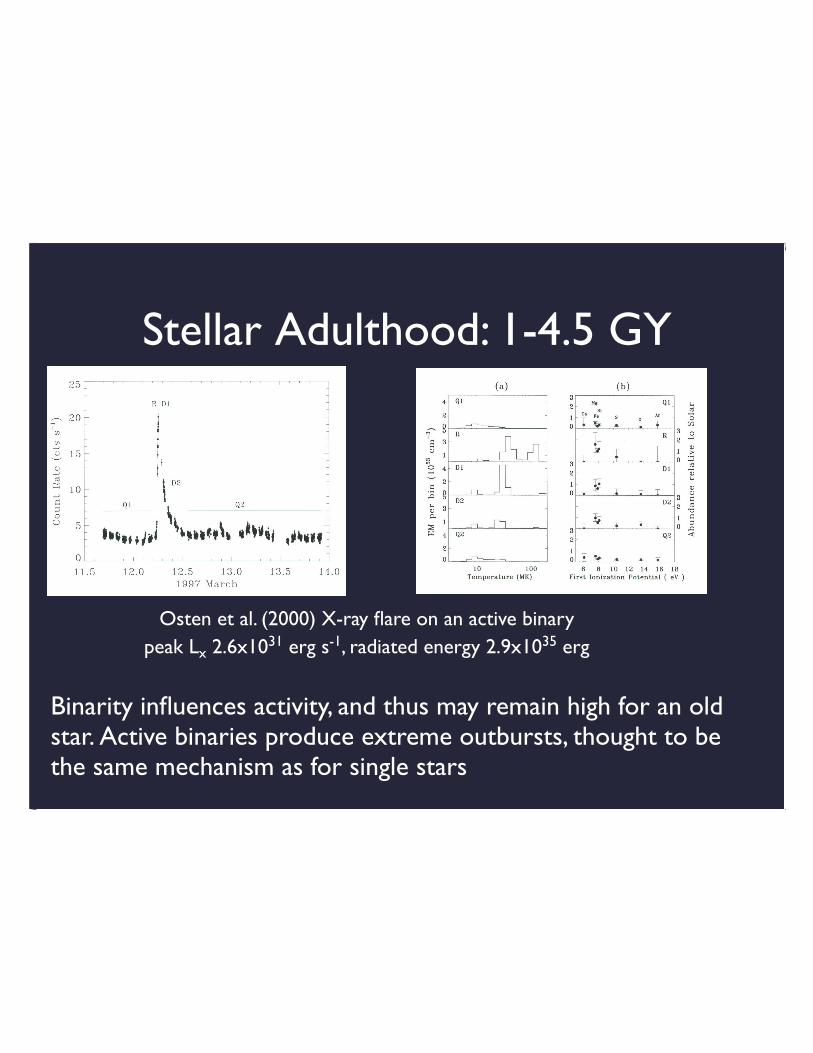
Binarity influences activity, and thus may remain high for an oldstar. Active binaries produce extreme outbursts, thought to bethe same mechanism as for single stars
Osten et al. (2000) X-ray flare on an active binarypeak Lx 2.6x1031 erg s-1, radiated energy 2.9x1035 erg
Stellar Adulthood: 1-4.5 GY
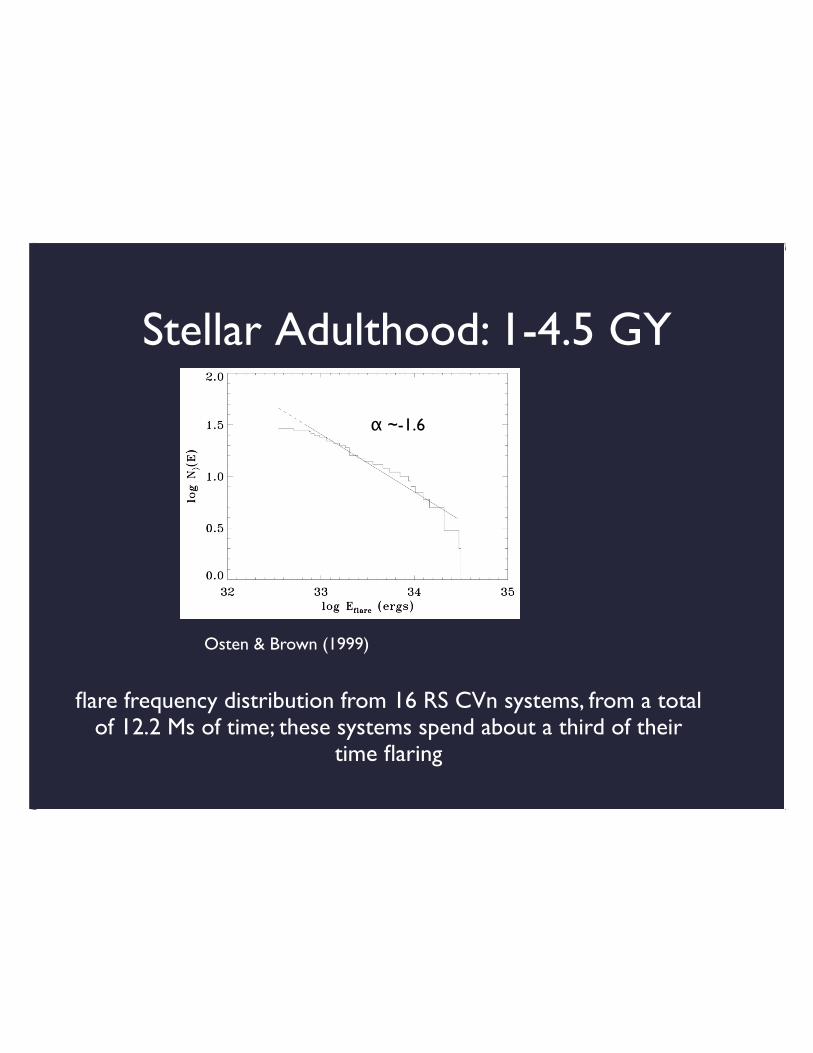
flare frequency distribution from 16 RS CVn systems, from a totalof 12.2 Ms of time; these systems spend about a third of their
time flaring
Osten & Brown (1999)
α ~-1.6
Stellar Adulthood: 1-4.5 GY
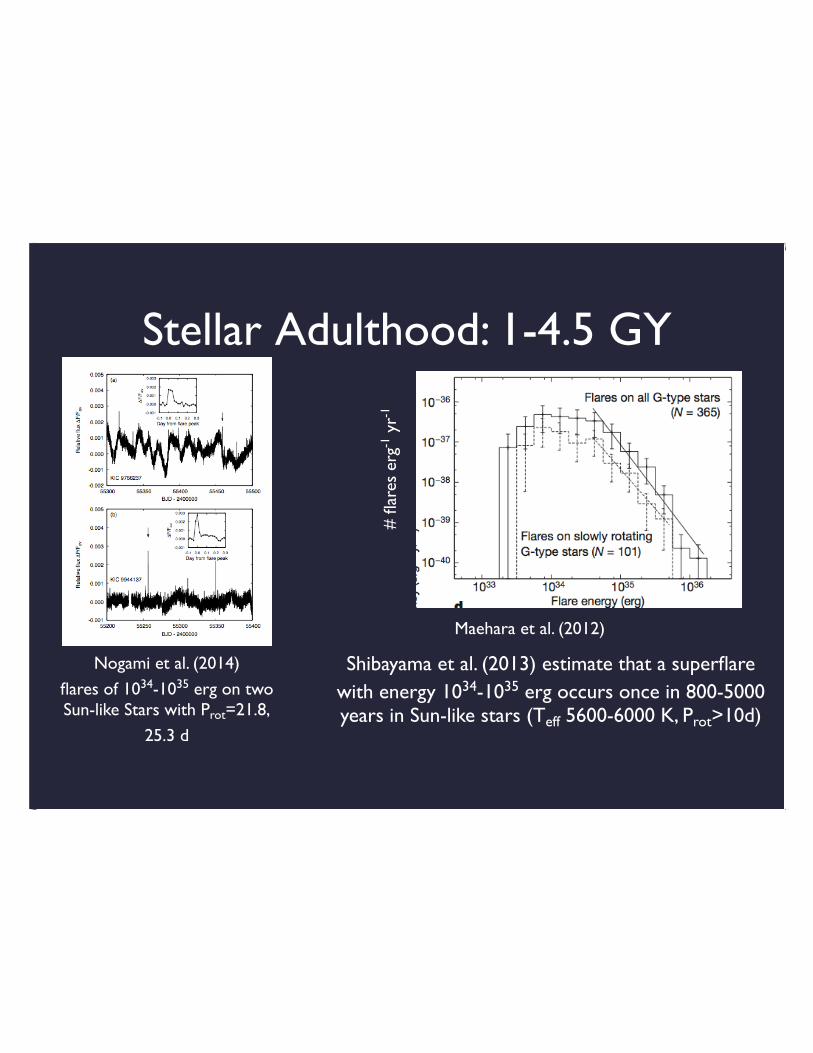
Shibayama et al. (2013) estimate that a superflarewith energy 1034-1035 erg occurs once in 800-5000years in Sun-like stars (Teff 5600-6000 K, Prot>10d)
Nogami et al. (2014)
flares of 1034-1035 erg on twoSun-like Stars with Prot=21.8,
25.3 d
# fl
ares
erg
-1 y
r-1
Maehara et al. (2012)
Stellar Old Age: >4.5 GY
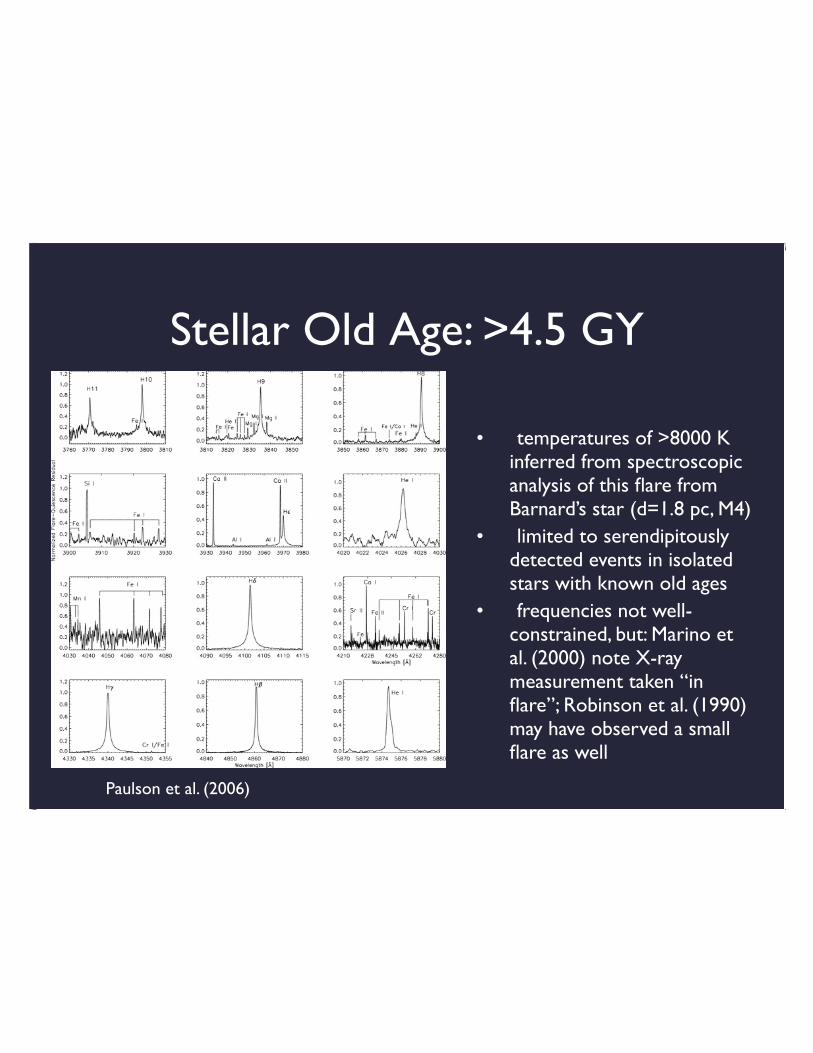
temperatures of >8000 Kinferred from spectroscopicanalysis of this flare fromBarnard’s star (d=1.8 pc, M4)limited to serendipitously
detected events in isolatedstars with known old agesfrequencies not well-
constrained, but: Marino etal. (2000) note X-raymeasurement taken “inflare”; Robinson et al. (1990)may have observed a smallflare as well
•
•
•
Paulson et al. (2006)
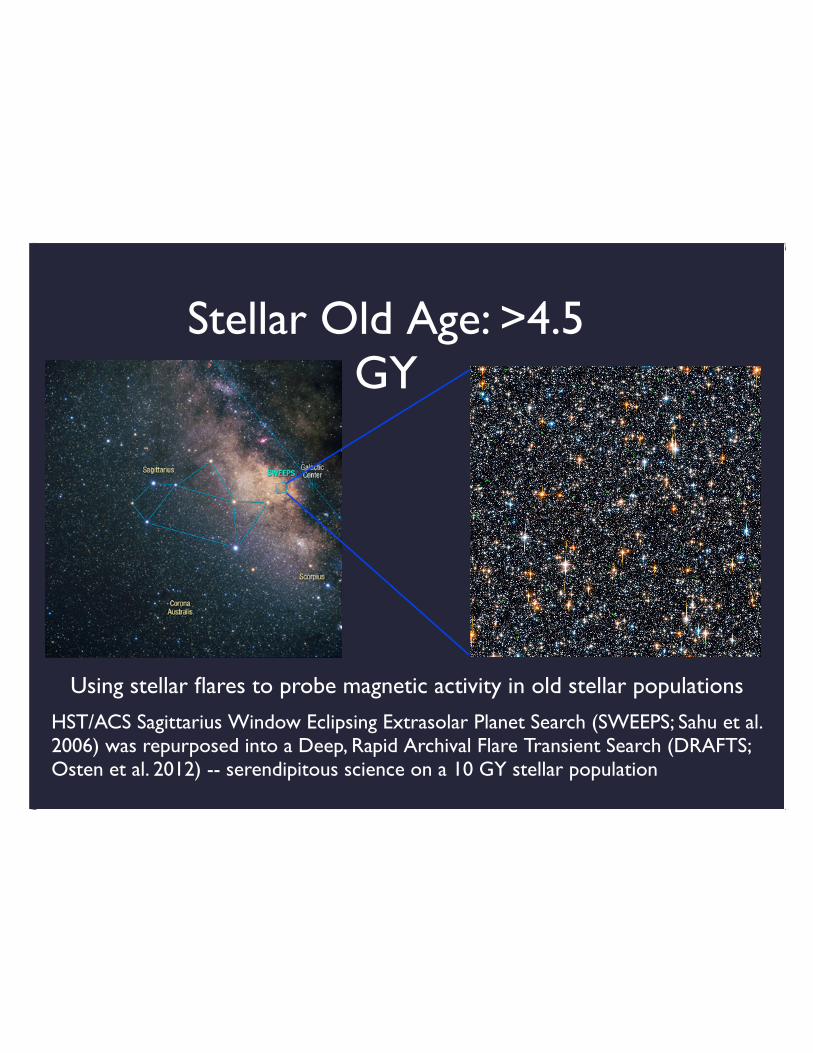
Using stellar flares to probe magnetic activity in old stellar populations
HST/ACS Sagittarius Window Eclipsing Extrasolar Planet Search (SWEEPS; Sahu et al.2006) was repurposed into a Deep, Rapid Archival Flare Transient Search (DRAFTS;Osten et al. 2012) -- serendipitous science on a 10 GY stellar population
Stellar Old Age: >4.5GY
Stellar Old Age: >4.5GY
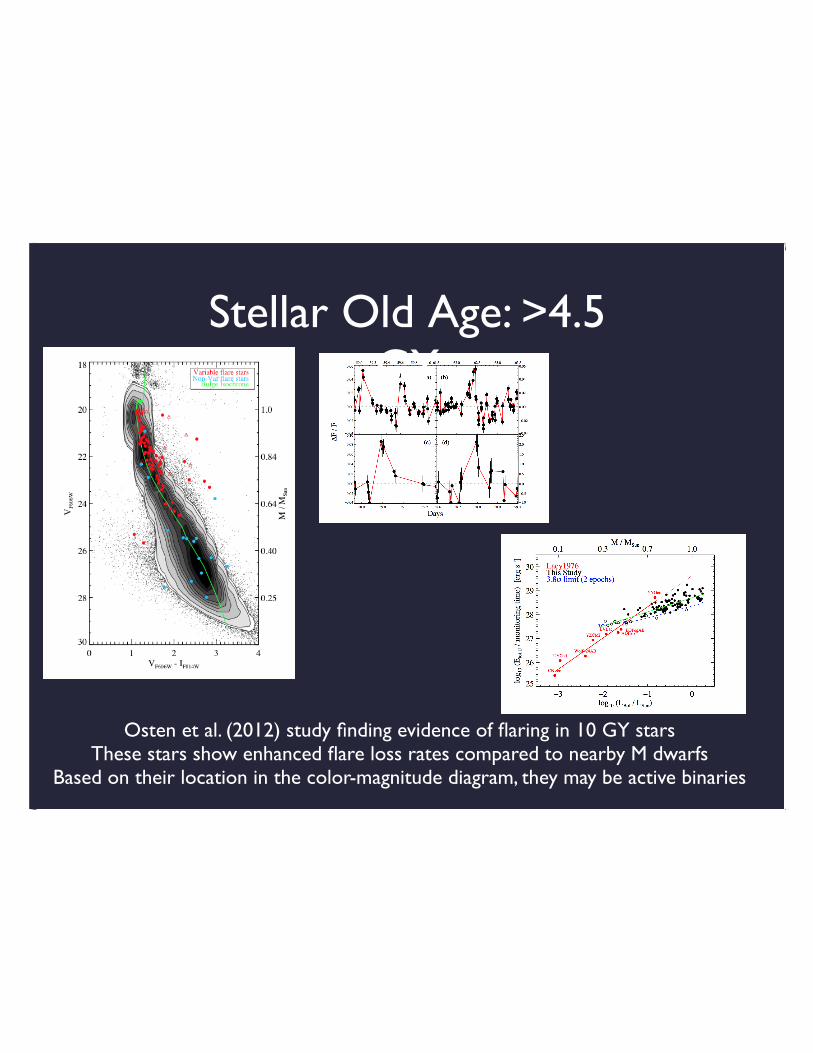
Osten et al. (2012) study finding evidence of flaring in 10 GY starsThese stars show enhanced flare loss rates compared to nearby M dwarfs
Based on their location in the color-magnitude diagram, they may be active binaries
Conclusions
There are gaps in our knowledge about the behavior ofstellar explosive events with time
Solar/Stellar Connections & Disconnections:
studies of individual stellar flares behave like solarflares (some of the time)
trouble trying to put stellar, solar flares on a commonscale — [T, VEM] plot of X-ray flares, [N(>E), E] —arewe missing something?
•
•
•
•