Embed Size (px)
Citation preview

Developed in partnership with:
Solar for Businesses in Sub-Saharan Africa January 24, 2019

© Bloomberg Finance L.P.2019
No portion of this document may be reproduced, scanned into an electronic system, distributed, publicly displayed or used as the basis of derivative works without the prior written consent of Bloomberg Finance L.P. For more information on terms of use, please contact [email protected]. Copyright and Disclaimer notice on page 63 applies throughout. 1
About this report responsAbility Investments AG is a Zurich-based asset manager in the field of development investments and offers professionally-managed investment solutions to private, institutional and public investors. The company’s investment solutions supply debt and equity financing predominantly to non-listed firms in emerging economies that help meet the basic needs of broad sections of the population and drive economic development.
responsAbility has financed the off-grid solar sector in Sub-Saharan Africa for years, focusing primarily on residential customers. The company expects solar to be deployed increasingly at commercial and industrial (C&I) sites in the continent, where they often complement diesel power generation.
responsAbility has commissioned BloombergNEF to assess the potential and target markets for C&I solar in Sub-Saharan Africa. BNEF undertook a desk-based regional study to identify three high priority markets that were later studied in more detail.
BNEF conducted interviews with 36 stakeholders in those markets. We would like to thank those partners for their time and thoughtful contributions.

© Bloomberg Finance L.P.2019
No portion of this document may be reproduced, scanned into an electronic system, distributed, publicly displayed or used as the basis of derivative works without the prior written consent of Bloomberg Finance L.P. For more information on terms of use, please contact [email protected]. Copyright and Disclaimer notice on page 63 applies throughout. 2
Executive summary
A combination of high energy costs and falling solar module prices is spurring sales of solar directly to commercial and industrial customers in Sub-Saharan Africa. There are only 74MW of installed capacity recorded, so the market is still small, but it has great potential. Projects in the pipeline suggest cumulative installed capacity could double in 2019.
• On-site solar is cheaper than the electricity tariffs paid by commercial or industrial (C&I) clients in seven out of 15 markets in Sub-Saharan Africa studied by BNEF. Solar electricity for those customers can be generated for $0.10-0.14/kWh in Kenya, Nigeria and Ghana, according to BNEF analysis. Local vendors have reported that they sell it for even less. At such rates, an industrial facility in Ghana operating seven days per week could buy on-site solar power for 29% less than electricity from the grid, while still relying on the grid during times when the sun does not shine.
• So far, the allure of cheap solar has been strongest for businesses in Nigeria, where there are at least 20MW of on-site solar projects. The country is plagued by daily, unpredictable power outages that can last 4-15 hours. Therefore, solar is often installed in tandem with batteries. Installers frequently offer flat fee deals that guarantee power supply with a mix of solar, battery storage and diesel generators.
• The C&I solar sector in Sub-Saharan Africa is growing not because of regulatory support, but because of economics. Net metering schemes, which have been proposed around the region, are rarely available. Instead, installations are designed so that all the electricity generated can be consumed directly by the host facility. This favours solar installations serving sites operating seven days per week.
• Outside of South Africa, the largest customer for on-site solar in the region is manufacturing sector. Out of the 110 projects we tracked, 20% are for manufacturers.
• The financial sector has broadly been absent from this market so far. The majority of projects to date have been sold for cash, without financing. Where a PPA or leasing deal has been signed, it has usually been financed with developer equity. Developers almost unanimously cite the lack of access to debt financing as the biggest hurdle to faster growth.
• Potential customers’ limited understanding of the benefits of on-site solar is another important hurdle, though it appears to be improving fast. Developers in Kenya told BNEF that the sales cycle is shortening notably. One developer said it offers initial financing for a short time period to ensure the customer that on-site solar is working before payment is due.
• Local installers are optimistic about the future and expect 2019 to be a record year for the C&I solar industry in Sub-Saharan Africa. In Kenya and Ghana, the pipelines of developers interviewed by BNEF total 26MW and 32MW, respectively. In Nigeria, developers reported a pipeline of 52MW.
• This report is broken down into three main chapters. In the first chapter we outline the fundamental value proposition of C&I solar. In the second, we assess the state of the market today and the extent to which it is capable of delivering on its basic premise. The third
74MW Commercial and industrial solar in Sub-Saharan Africa (excluding South Africa)
494MW Solar projects commissioned in Sub-Saharan Africa (excluding South Africa)
110 Known commercial and industrial solar projects larger than 30kW

© Bloomberg Finance L.P.2019
No portion of this document may be reproduced, scanned into an electronic system, distributed, publicly displayed or used as the basis of derivative works without the prior written consent of Bloomberg Finance L.P. For more information on terms of use, please contact [email protected]. Copyright and Disclaimer notice on page 63 applies throughout. 3
chapter discusses the outlook for the sector. More detailed information on particular countries is shown in following sections.
Figure 1: C&I solar customer types Figure 2: Economics of solar vs commercial grid electricity tariffs
Source: BloombergNEF. Note: The total installed capacity is 61MW. An additional 13MW are reported by developers without individual project data.
Source: BloombergNEF, Climatescope, World Bank. Note: Tariffs for Ghana are as of April 2018. The others are as of 2017. The range of C&I solar cost estimates for Kenya, Ghana and Nigeria, and assumes a project starts operation in 2019.
Research methodology
BloombergNEF researchers started this work by comparing the regulatory framework, the economic fundamentals and the market momentum for C&I solar in 15 economies in Sub-Saharan Africa. Those markets were then ranked in order to identify high priority markets for C&I solar. BNEF researchers then visited Kenya, Ghana and Nigeria for in-depth analysis on the prospects of those particular markets. As part of these visits the team conducted interviews with 36 developers, investors and large electricity buyers. The three selected markets account for 50% of the known C&I solar projects in Sub-Saharan Africa (excluding South Africa). The methodology is outlined in further detail in Appendix A.
20%
16%
15%9%
7%
6%
6%
5%5%
4%7%
ManufacturingPublic buildingsOfficesCommercialPetrol stationsHorticultureHotelsMiningCarportInfrastructureUnknown
110 projects0.00
0.05
0.10
0.15
0.20
0.25
0.30
Eth
iopi
a
Zam
bia
DR
C
Mal
awi
Sou
th A
frica
Tanz
ania
Bot
swan
a
Nig
eria
Cam
eroo
n
Moz
ambi
que
SSA
-ave
rage
Cot
e d'
Ivoi
re
Ken
ya
Uga
nda
Rw
anda
Sen
egal
Gha
na
$/kWh
Cost of C&I solar in Sub-Saharan Africa

© Bloomberg Finance L.P.2019
No portion of this document may be reproduced, scanned into an electronic system, distributed, publicly displayed or used as the basis of derivative works without the prior written consent of Bloomberg Finance L.P. For more information on terms of use, please contact [email protected]. Copyright and Disclaimer notice on page 63 applies throughout. 4
List of Abbreviations AFD Agence Française de Développement AMERI Africa Middle East Resources Investment Group BNEF BloombergNEF BOI Bank of Industry C&I Commercial and Industrial CBN Central Bank of Nigeria ECG Electricity Company of Ghana Limited EEI Energizing Economies Initiative EEP Energizing Education Program EIA Environmental impact assessment EPC Engineering, Procurement and Construction ERC Energy Regulatory Commission FCC Fuel Cost Charge FERFA Foreign Exchange Rate Fluctuation Adjustment FX Foreign Exchange IDEN Independent Electricity Distribution Networks IEA International Energy Agency IPP Independent Power Producer IFRS International Financial Reporting Standards IRR Internal Rate of Return JICA Japan International Cooperation Agency KES Kenyan Shilling MYTO Multi-year tariff order NBET Nigerian Bulk Electricity Trading NEDCo Northern Electricity Distribution Co NEMA National Environment Management Authority NERC Nigerian Electricity Regulatory Commission OPIC Overseas Private Investment Corporation PPA Power Purchase Agreement REA Rural Electrification Agency REP Rural Electrification Program SAIDI System Average Interruption Duration Index SAIFI System Average Interruption Frequency Index TCX The Currency Exchange Fund UPS Uninterruptible power supply VAT Value Added Tax WRMA Water Resource Management Authority

© Bloomberg Finance L.P.2019
No portion of this document may be reproduced, scanned into an electronic system, distributed, publicly displayed or used as the basis of derivative works without the prior written consent of Bloomberg Finance L.P. For more information on terms of use, please contact [email protected]. Copyright and Disclaimer notice on page 63 applies throughout. 5
Contents About this report 1 Executive summary 2 List of Abbreviations 4 Section 1. Market fundamentals 7
1.1. Utility-scale solar in Africa is concentrated in a few countries 7 1.2. C&I solar helps businesses save money and hedge energy costs 8 1.3. Power outages can make solar even more attractive 10 1.4. Projects are optimized for self-consumption of electricity 11 1.5. Regulations 12
Section 2. The C&I solar market in Sub-Saharan Africa 15 2.1. Sub-Saharan Africa’s C&I solar market is maturing 16 2.2. Market segmentation 16 2.3. Capital expenditure 18 2.4. Economics of C&I solar with mostly reliable electricity 19 2.5. Economics of C&I solar with unreliable grid electricity 20 2.6. Developers, installers and other vendors 20 2.7. Contract structures 21 2.8. Financing 21
Section 3. Outlook 24 3.1. The addressable market 24 3.2. The outlook for grid electricity prices and reliability 26 3.3. Accelerating the C&I solar market 27
Section 4. In-depth findings for Kenya 29 4.1. Summary 29 4.2. Market segmentation 29 4.3. Economics 30 4.4. Solar cost will drop by 53% in the next 12 years 30 4.5. Regulation 32 4.6. Finance 34 4.7. Outlook 34
Section 5. In-depth findings for Nigeria 36 5.1. Summary 36 5.2. The role of power outages in Nigeria 37 5.3. Market trends and segments 37 5.4. Economics 38 5.5. Regulation 40 5.6. Finance 41 5.7. Outlook 43 5.8. Barriers to C&I solar in Nigeria 45
Section 6. In-depth findings from Ghana 47 6.1. Summary 47 6.2. The role of power outages 47 6.3. Market trends and segmentation 48 6.4. Economics 49 6.5. Regulation 50 6.6. Finance 51 6.7. Outlook 53
Appendix A. Methodology 55 Appendix B. Market summary table 58 About us 61

© Bloomberg Finance L.P.2019
No portion of this document may be reproduced, scanned into an electronic system, distributed, publicly displayed or used as the basis of derivative works without the prior written consent of Bloomberg Finance L.P. For more information on terms of use, please contact [email protected]. Copyright and Disclaimer notice on page 63 applies throughout. 6
Table of figures
Figure 1: C&I solar customer types .......................................................................... 3 Figure 2: Economics of solar vs commercial grid electricity tariffs .......................... 3 Figure 3: Installed solar capacity in Sub-Saharan Africa (excluding South Africa) . 8 Figure 4: 2017 commercial grid tariffs ...................................................................... 9 Figure 5: 2017 industrial grid tariffs .......................................................................... 9 Figure 6: Electricity tariffs and cost of C&I solar ...................................................... 9 Figure 7: Electrical outages in a typical month ....................................................... 10 Figure 8: Average duration of a typical outage ...................................................... 10 Figure 9: Illustrative impact of load on solar project size ....................................... 11 Figure 10: Comparison of regulatory indicators ..................................................... 14 Figure 11: Countries with C&I solar projects in Sub-Saharan Africa ..................... 15 Figure 12: C&I solar installations in Sub-Saharan Africa (excluding South Africa) 16 Figure 13: C&I solar installations in Sub-Saharan Africa (excluding South Africa) 16 Figure 14: Installed C&I solar projects ................................................................... 17 Figure 15: Installed C&I solar capacity ................................................................... 17 Figure 16: Average project size .............................................................................. 17 Figure 17: Nigeria is the largest C&I solar market in Sub-Saharan Africa ............. 18 Figure 18: Cost of electricity for C&I customers ..................................................... 19 Figure 19: C&I solar vendor landscape in Sub-Saharan Africa ............................. 20 Figure 20: C&I solar contract structures in Sub-Saharan Africa* ........................... 21 Figure 21: C&I power demand ................................................................................ 24 Figure 22: C&I solar markets relative to C&I power demand ................................. 26 Figure 23: Regulatory reforms that C&I solar business players want .................... 28 Figure 24: Kenya C&I solar installed capacity ........................................................ 29 Figure 25: C&I solar cost forecast versus 2018 electricity tariffs ........................... 31 Figure 26: Kenya permit and generation licence application process ................... 33 Figure 27: Kenya Power electricity sales ............................................................... 35 Figure 28: Historical electricity prices for C&I customers ....................................... 35 Figure 29: Nigeria C&I solar installed capacity ...................................................... 36 Figure 30: Map of the REA’s EEP Projects ............................................................ 38 Figure 31: Nigeria cost of C&I solar forecast versus 2018 electricity tariffs........... 38 Figure 32: Average C&I solar with energy storage capex breakdown ................... 39 Figure 33: Nigerian naira exchange rate ................................................................ 43 Figure 34: Nigeria retail power prices ..................................................................... 44 Figure 35: Nigeria retail power price by state ......................................................... 44 Figure 36: Nigeria's 2030 target generation mix forecast ...................................... 45 Figure 37: Nigeria power demand .......................................................................... 45 Figure 38: Reform wishes by Nigerian C&I solar developers ................................ 46 Figure 39: SAIFI in Ghana’s metro areas ............................................................... 48 Figure 40: SAIDI in Ghana’s metro areas .............................................................. 48 Figure 41: Ghana C&I solar installed capacity ....................................................... 49 Figure 42: Cost of C&I solar forecast versus 2018 electricity tariffs ...................... 49 Figure 43: Ghana cedi exchange rate .................................................................... 52 Figure 44: Historical annual grid electricity consumption in Ghana ....................... 53 Figure 45: Grid electricity tariffs for C&I customers in Ghana ................................ 54 Figure 46: Country selection process ..................................................................... 55 Figure 47: Overview of Climatescope indicators used in this study ....................... 56 Figure 48: Indicators of 15 countries ...................................................................... 57

© Bloomberg Finance L.P.2019
No portion of this document may be reproduced, scanned into an electronic system, distributed, publicly displayed or used as the basis of derivative works without the prior written consent of Bloomberg Finance L.P. For more information on terms of use, please contact [email protected]. Copyright and Disclaimer notice on page 63 applies throughout. 7
Section 1. Market fundamentals With an immense energy deficit and crumbling infrastructure, Sub-Saharan Africa could be fertile ground for solar. However, the region’s utility-scale solar market struggled to grow. Administrative delays, unbankable power purchasing agreements (PPAs) and difficulties securing land are holding back project development. Therefore, developers hoping for fewer administrative delays and stronger off-take agreements have started to pitch to C&I customers directly. In 2018, solar developers built a record number1 of projects serving C&I customers directly, offering them cheaper power than the grid and a hedge against future price fluctuations. Where electricity outages are frequent, they offer solar with battery storage and diesel generators as an alternative source of power.
1.1. Utility-scale solar in Africa is concentrated in a few countries
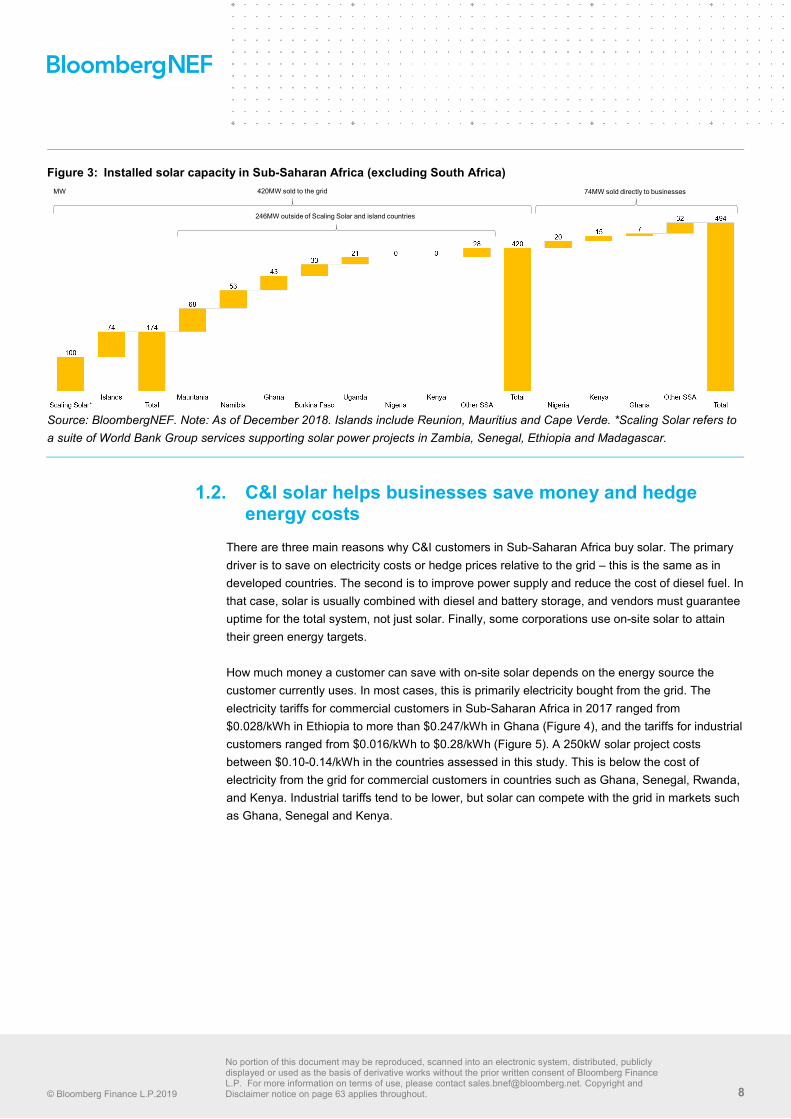
As of November 23, there was only 420MW of installed solar power capacity selling electricity to the grid in Sub-Saharan Africa (outside of South Africa, Figure 3). This number is small, equivalent to less than 0.5% of the global solar market in 2017. The region’s solar capacity has also been highly concentrated in just a few markets that are either very small, or enjoyed significant development support. Some 174MW were installed in nations that have benefited from the World Bank’s efforts to expand solar projects under the Scaling Solar program, along with the islands of La Réunion, Cape Verde and Mauritius. Of the remaining 246MW, some 121MW were built in Mauritania and Namibia, two countries with a combined population of less than 7 million people. Utility-scale developers often struggle with ambiguous political will, unclear regulations, PPA counterparties with questionable credit, as well as challenges securing transmission grid connections and land rights.
Selling solar directly to commercial or industrial electricity consumers can circumvent some of these challenges. At the same time, it can provide direct savings to those customers, because solar is often cheaper than their electricity tariffs. As a result, one in four megawatts of solar capacity outside of the Scaling Solar and island markets is selling power directly to an end-customer.
1 Outside South Africa.
© Bloomberg Finance L.P.2019
No portion of this document may be reproduced, scanned into an electronic system, distributed, publicly displayed or used as the basis of derivative works without the prior written consent of Bloomberg Finance L.P. For more information on terms of use, please contact [email protected]. Copyright and Disclaimer notice on page 63 applies throughout. 8
Figure 3: Installed solar capacity in Sub-Saharan Africa (excluding South Africa)
Source: BloombergNEF. Note: As of December 2018. Islands include Reunion, Mauritius and Cape Verde. *Scaling Solar refers to a suite of World Bank Group services supporting solar power projects in Zambia, Senegal, Ethiopia and Madagascar.
1.2. C&I solar helps businesses save money and hedge energy costs
There are three main reasons why C&I customers in Sub-Saharan Africa buy solar. The primary driver is to save on electricity costs or hedge prices relative to the grid – this is the same as in developed countries. The second is to improve power supply and reduce the cost of diesel fuel. In that case, solar is usually combined with diesel and battery storage, and vendors must guarantee uptime for the total system, not just solar. Finally, some corporations use on-site solar to attain their green energy targets. How much money a customer can save with on-site solar depends on the energy source the customer currently uses. In most cases, this is primarily electricity bought from the grid. The electricity tariffs for commercial customers in Sub-Saharan Africa in 2017 ranged from $0.028/kWh in Ethiopia to more than $0.247/kWh in Ghana (Figure 4), and the tariffs for industrial customers ranged from $0.016/kWh to $0.28/kWh (Figure 5). A 250kW solar project costs between $0.10-0.14/kWh in the countries assessed in this study. This is below the cost of electricity from the grid for commercial customers in countries such as Ghana, Senegal, Rwanda, and Kenya. Industrial tariffs tend to be lower, but solar can compete with the grid in markets such as Ghana, Senegal and Kenya.
246MW outside of Scaling Solar and island countries
420MW sold to the grid 74MW sold directly to businessesMW

© Bloomberg Finance L.P.2019
No portion of this document may be reproduced, scanned into an electronic system, distributed, publicly displayed or used as the basis of derivative works without the prior written consent of Bloomberg Finance L.P. For more information on terms of use, please contact [email protected]. Copyright and Disclaimer notice on page 63 applies throughout. 9
Figure 4: 2017 commercial grid tariffs Figure 5: 2017 industrial grid tariffs
Source: BloombergNEF, Climatescope. Note: Tariffs for Ghana are as of April 2018. The range of C&I solar cost estimates for Kenya, Ghana and Nigeria, and assumes a project starts operation in 2019.
Saving costs today is not the only advantage of on-site solar. Because it does not require any fuel, it allows customers to lock in a fixed or predictable tariff for years or decades. In contrast, the cost of electricity from the grid is continually adjusted and can rise or fall. BNEF projections based on expected manufacturing and installation expenses suggest that the cost of on-site solar will decline to about $0.05/kWh by 2030 (Figure 6). These declines are set to strengthen the local solar industry in the long run.
Figure 6: Electricity tariffs and cost of C&I solar
Source: BloombergNEF. Note: the range of C&I solar cost estimates for Kenya, Nigeria and Ghana.
India’s example shows that solar for business works also in developing countries
The notion that selling solar directly to businesses can work is not new in developing countries. In India, the rooftop segment became a 800MW-per-year market almost overnight. Despite net-metering being nominally available in many Indian states, it is rarely used and not the primary market driver. Business customers in India can benefit directly from cost reductions relative to buying power from the grid. As in Sub-Saharan Africa, most on-site solar installations are sized to maximize the amount of power consumed by the customer and minimize how much is sold to the grid or curtailed. See Accelerating India’s Clearn Energy Transition2.
2 BloombergNEF, “Accelerating India’s Clean Energy Transition”, November 28, 2017.
0.00
0.05
0.10
0.15
0.20
0.25
0.30
Eth
iopi
a
Zam
bia
DR
C
Mal
awi
Sou
th A
frica
Tanz
ania
Bot
swan
a
Nig
eria
Cam
eroo
n
Moz
ambi
que
SSA
-ave
rage
Cot
e d'
Ivoi
re
Ken
ya
Uga
nda
Rw
anda
Sen
egal
Gha
na
$/kWh
Cost of C&I solar in Sub-Saharan Africa
0.00
0.05
0.10
0.15
0.20
0.25
0.30
Eth
iopi
a
DR
C
Moz
ambi
que
Sou
th A
frica
Mal
awi
Tanz
ania
Zam
bia
Bot
swan
a
Cot
e d'
Ivoi
re
Rw
anda
Uga
nda
Nig
eria
SSA
-ave
rage
Cam
eroo
n
Ken
ya
Gha
na
Sen
egal
$/kWh
Cost of C&I solar in Sub-Saharan Africa
0.00
0.10
0.20
0.30
0.40
0.50
0.60
0.70
2012
2013
2014
2015
2016
2017
2018
2019
2020
2021
2022
2023
2024
2025
2026
2027
2028
2029
2030
$/kWh
Cost of C&I solar range Kenya tariff Nigeria tariff Ghana tariff
Commercial
0.00
0.10
0.20
0.30
0.40
0.50
0.60
0.70
2012
2013
2014
2015
2016
2017
2018
2019
2020
2021
2022
2023
2024
2025
2026
2027
2028
2029
2030
$/kWh
Cost of C&I solar range Kenya tariff Nigeria tariff Ghana tariff
Industrial

© Bloomberg Finance L.P.2019
No portion of this document may be reproduced, scanned into an electronic system, distributed, publicly displayed or used as the basis of derivative works without the prior written consent of Bloomberg Finance L.P. For more information on terms of use, please contact [email protected]. Copyright and Disclaimer notice on page 63 applies throughout. 10
1.3. Power outages can make solar even more attractive Electric power outages are commonplace across most of Sub-Saharan Africa, though their extent varies significantly. Even in South Africa, the region’s most developed economy, so-called load shedding has become common again in 2018.
Outages are most pronounced in Nigeria, where World Bank data show that businesses face more than one outage per day (Figure 7 and Figure 8). Solar and battery storage installers in Nigeria told BloombergNEF that outages are the main reason why customers turn to them. The frequency of outages cited by developers suggests that the grid is even less reliable than public data show, with cuts lasting anywhere from 4 to 15 hours per day on average across the country. The government estimates that about a half of available power currently comes from diesel generator sets.
When the grid is out, customers must either shoulder the high opportunity cost of lost sales or manufacturing output, or resort to much costlier backup power, usually from diesel generators.
Power quality is also an often overlooked consideration. In hotels, voltage fluctuations may mean flickering lights, but for industrials they can cause serious damage to sensitive equipment. Companies therefore often rely heavily on uninterrupted power supply (UPS) systems or run diesel generators even when grid power is available.
Figure 7: Electrical outages in a typical month Figure 8: Average duration of a typical outage
Source: World Bank, BloombergNEF. Note: Data refers to latest available for country.
0 5 10 15 20 25 30 35
South Africa
Mozambique
Sudan
Côte d'Ivoire
Rwanda
Mali
Zimbabwe
Angola
Zambia
Senegal
Kenya
Uganda
Madagascar
Malawi
Cameroon
Ethiopia
Ghana
Tanzania
Burkina Faso
DRC
Niger
Nigeria
Number of electrical outages in a typical month
0 2 4 6 8 10 12 14
Senegal
Madagascar
Sudan
Zambia
Burkina Faso
Malawi
Rwanda
Mozambique
South Africa
Mali
Niger
Zimbabwe
Côte d'Ivoire
DRC
Kenya
Ethiopia
Tanzania
Ghana
Cameroon
Uganda
Nigeria
Angola
Hours per outage

© Bloomberg Finance L.P.2019
No portion of this document may be reproduced, scanned into an electronic system, distributed, publicly displayed or used as the basis of derivative works without the prior written consent of Bloomberg Finance L.P. For more information on terms of use, please contact [email protected]. Copyright and Disclaimer notice on page 63 applies throughout. 11
The addition of solar to this mix of grid and diesel power sometimes requires installing an on-site microgrid system that can coordinate and optimize the use of electricity from the grid, diesel, solar, and sometimes battery storage. This is the standard type of C&I solar installation in Nigeria today. In countries such as Kenya and Ghana, where there are fewer power outages, solar installations are usually less complex.
1.4. Projects are optimized for self-consumption of electricity
Feed-in-tariffs or net metering regimes are not available in Sub-Saharan Africa outside of South Africa. This pushes developers to design projects in a way that all solar output is consumed by the project host. Unlike in many developed markets, rooftop owners cannot earn money simply by installing solar and selling power to the grid. Often, project size is capped by the size of the rooftop or of the land available near the installation.
But the absence of net-metering means that the load profile of the host also matters when sizing a solar plant. Because excess power cannot be sold, the solar array is designed to maximize self-consumption. As a result, facilities that have large day-time loads and operate seven days a week can integrate more solar than sites with more stable load profiles or low demand on weekends (Figure 9). The economically optimal solar plant installation may be designed to have a certain amount of curtailed generation on days with low electricity demand. Facilities that reduce their power consumption during certain days of the week can still install solar, but the optimal amount of solar installed will be smaller than if they operated all week.
Figure 9: Illustrative impact of load on solar project size
Source: BloombergNEF.
Weekday load
24hrs
kW
Solar
Weekend load
24hrs
kW
Grid
Solar
Unused Solar
Weekday Weekend

© Bloomberg Finance L.P.2019
No portion of this document may be reproduced, scanned into an electronic system, distributed, publicly displayed or used as the basis of derivative works without the prior written consent of Bloomberg Finance L.P. For more information on terms of use, please contact [email protected]. Copyright and Disclaimer notice on page 63 applies throughout. 12
1.5. Regulations
The C&I solar sector in Sub-Saharan Africa is growing, but primarily because of economics. Milder regulation helps too. Since projects are often hosted at the customer site and the electricity is consumed directly by the customer, the project development process is often relatively fast and requires little paperwork compared with a solar power plant selling energy to the grid operator. In many markets, small projects for self-consumption can be installed without a power generation permit. This relative ease makes C&I solar projects attractive for some developers.
While C&I solar projects for self-consumption generally face fewer regulatory barriers than plants that sell power to the grid, there are challenges.
The main bottlenecks that can cause delays or uncertainty lie in the acquisition of a power generation license, if required, as well as the right to sell electricity to third parties. Some of these bottlenecks appear to arise because the regulatory framework for solar energy in Sub-Saharan Africa was primarily designed for power plants selling their output to the grid. As a result, several aspects of C&I solar projects are somewhat uncharted regulatory territory. Despite such uncertainties, none of the developers interviewed by BNEF said that they had to abandon potential projects due to regulatory concerns. Rather, developers adapt contract structures and project size in order to comply with local regulations. Even in countries where regulatory approval can be lengthy, such as Ghana, developers expect the market to accelerate.
Operating a power asset
Generally, operating a power generation facility requires a licence. Many jurisdictions, however, have reduced licensing requirements for small-scale projects below certain thresholds (Table 1). In Nigeria and Kenya, among others, it is possible to install as much as one megawatt for self-consumption without obtaining a generation licence. Ghana, Tanzania and Ethiopia, among others, are more restrictive, requiring a generation licence for installations larger than 100kW.
In general, developers can install solar assets below these thresholds without any approval from either the regulator or the utility as long as technical precautions are taken that prevent solar power being fed into the grid. That does not mean the project is entirely unregulated – typically, it must be installed by a licensed technician and must secure construction permits and fire safety or environmental assessments. In Kenya, for instance, construction permits are administered on the county level, and requirements can differ between locations. Still, no developer there has flagged construction permits as a particular bottleneck.
Projects above the thresholds typically require a generation licence or permit. The complexities of obtaining these can differ hugely. In Kenya, the Energy Regulatory Commission (ERC) approval process can take less than two months, and is considered relatively predictable and straightforward. In Ghana, on the other hand, three separate licences must be acquired in sequence in order to both operate and sell electricity. Under the statutory limits, authorities would have a combined 180 days to respond, although one developer told us that the actual period exceeded the limit.
Selling electricity
Limitations on the ability to sell electricity, irrespective of whether it is produced on site or sold via the distribution grid, are another important consideration for C&I solar projects. They can become a hurdle if an asset is located at the customer site, but owned by a separate electricity service company billing for electricity. Such restrictions are in place in many countries in the region. Sales of solar electricity directly to end customers appear to be a uncharted regulatory territory in
Table 1: Project size threshold for licence exemptions
Country kW
Senegal No threshold
Mozam-bique
No regulation
Cote d’Ivoire
Case-by-case
Cameroon Case-by-case
Rwanda 50
DRC 50
Ghana 100*
Botswana 100
Ethiopia 100
Zimbabwe 100
Tanzania 100
Zambia 100
Kenya 1,000
Nigeria 1,000
Uganda 2,000
Source: BloombergNEF, Climatescope. Note: * See Appendix section for more details on licences in Ghana.

© Bloomberg Finance L.P.2019
No portion of this document may be reproduced, scanned into an electronic system, distributed, publicly displayed or used as the basis of derivative works without the prior written consent of Bloomberg Finance L.P. For more information on terms of use, please contact [email protected]. Copyright and Disclaimer notice on page 63 applies throughout. 13
some markets. Solar vendors are also using alternatives such as direct equipment sales, equipment leases or even flat fee services. In Kenya, for instance, PPAs for more than 1MW between a solar company and a private buyer require an approval from the ERC, as part of the review process for a power supply licence. But, Kenya Power remains the sole distributor and retailer of electricity, suggesting that C&I solar projects have either stayed below the relevant thresholds or have used alternative contract structures that are not considered a PPA.
Because the marginal cost of solar electricity is zero, structuring a contract as an equipment lease with a monthly fee equivalent to the expected solar power generation would not fundamentally affect the project economics and risk-sharing between developer and customer. BNEF has not been able to confirm whether an equipment lease with fixed or indexed payments for a solar project would be considered a PPA. Depending on the jurisdiction, there may also be separate rules on offering equipment leases.
Local content rules
In a few markets, local content rules can complicate market entry into the C&I solar business, and may end up stifling the market. Among the three countries studied in detail, only Ghana has implemented strict local content and participation rules governing the electricity supply industry, including the C&I solar sector. Since early 2018, non-Ghanaian companies holding a wholesale power supply licence are required to have at least 15% local ownership. This share will increase to 51% in 10 years. The regulation also requires a minimum of 60% of the engineering and procurement value of a power project to go to Ghanaian companies. The regulator offers a five-year exemption from such requirements to the foreign companies that already had a wholesale supply licence as of November 2017. These rules may prevent new entrants participating in the Ghanaian market. Given the lack of a local supply chain for solar modules and inverters, it may be hard to meet the procurement rules for capital-intensive and easily installed technologies like solar. It is possible for developers to receive ad-hoc exemptions given these challenges, but those make the development process riskier and less predictable.
© Bloomberg Finance L.P.2019
No portion of this document may be reproduced, scanned into an electronic system, distributed, publicly displayed or used as the basis of derivative works without the prior written consent of Bloomberg Finance L.P. For more information on terms of use, please contact [email protected]. Copyright and Disclaimer notice on page 63 applies throughout. 14
Other regulatory considerations
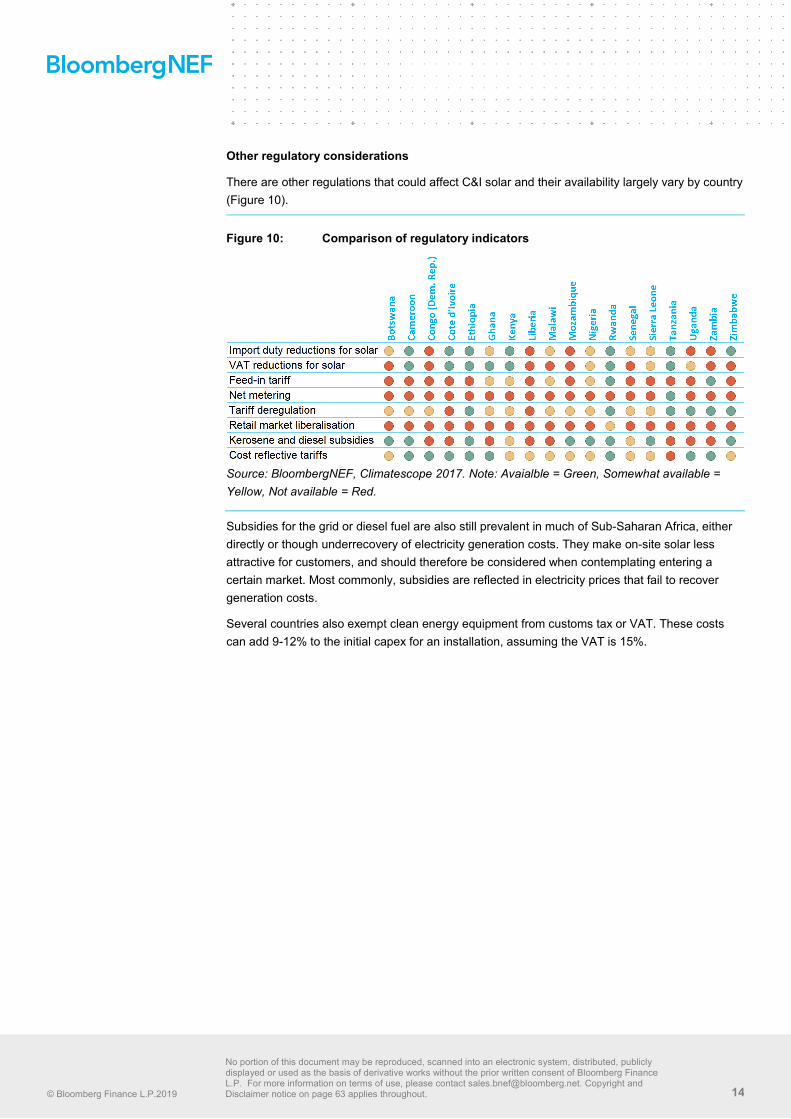
There are other regulations that could affect C&I solar and their availability largely vary by country (Figure 10).
Figure 10: Comparison of regulatory indicators
Source: BloombergNEF, Climatescope 2017. Note: Avaialble = Green, Somewhat available = Yellow, Not available = Red.
Subsidies for the grid or diesel fuel are also still prevalent in much of Sub-Saharan Africa, either directly or though underrecovery of electricity generation costs. They make on-site solar less attractive for customers, and should therefore be considered when contemplating entering a certain market. Most commonly, subsidies are reflected in electricity prices that fail to recover generation costs.
Several countries also exempt clean energy equipment from customs tax or VAT. These costs can add 9-12% to the initial capex for an installation, assuming the VAT is 15%.
© Bloomberg Finance L.P.2019
No portion of this document may be reproduced, scanned into an electronic system, distributed, publicly displayed or used as the basis of derivative works without the prior written consent of Bloomberg Finance L.P. For more information on terms of use, please contact [email protected]. Copyright and Disclaimer notice on page 63 applies throughout. 15
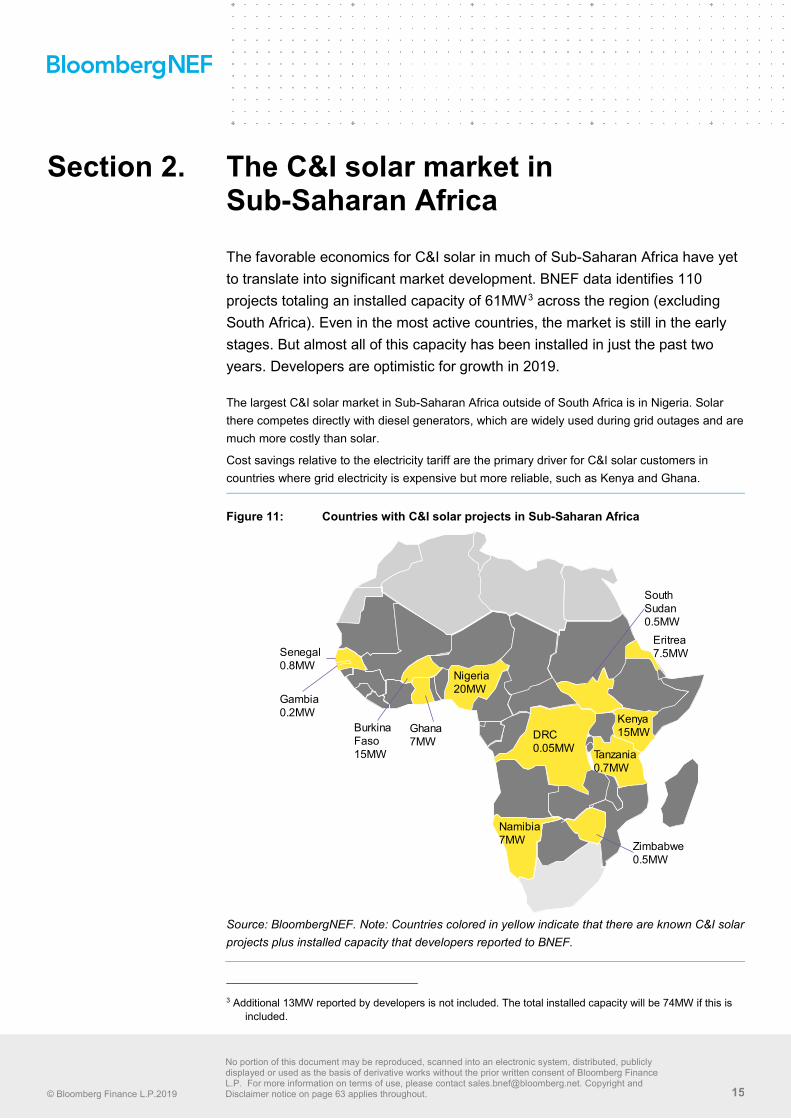
Section 2. The C&I solar market in Sub-Saharan Africa The favorable economics for C&I solar in much of Sub-Saharan Africa have yet to translate into significant market development. BNEF data identifies 110 projects totaling an installed capacity of 61MW3 across the region (excluding South Africa). Even in the most active countries, the market is still in the early stages. But almost all of this capacity has been installed in just the past two years. Developers are optimistic for growth in 2019.
The largest C&I solar market in Sub-Saharan Africa outside of South Africa is in Nigeria. Solar there competes directly with diesel generators, which are widely used during grid outages and are much more costly than solar.
Cost savings relative to the electricity tariff are the primary driver for C&I solar customers in countries where grid electricity is expensive but more reliable, such as Kenya and Ghana.
Figure 11: Countries with C&I solar projects in Sub-Saharan Africa
Source: BloombergNEF. Note: Countries colored in yellow indicate that there are known C&I solar projects plus installed capacity that developers reported to BNEF.
3 Additional 13MW reported by developers is not included. The total installed capacity will be 74MW if this is
included.
Kenya15MW
Tanzania0.7MW
Namibia7MW
DRC0.05MW
Nigeria20MW
Ghana7MW
Burkina Faso15MW
Senegal0.8MW
Eritrea7.5MW
Zimbabwe0.5MW
Gambia0.2MW
South Sudan0.5MW

© Bloomberg Finance L.P.2019
No portion of this document may be reproduced, scanned into an electronic system, distributed, publicly displayed or used as the basis of derivative works without the prior written consent of Bloomberg Finance L.P. For more information on terms of use, please contact [email protected]. Copyright and Disclaimer notice on page 63 applies throughout. 16
2.1. Sub-Saharan Africa’s C&I solar market is maturing There were 32 C&I solar installations commissioned in Sub-Saharan Africa outside of South Africa in 2017, and in 2018 there were 39. In 2015 and 2016 there were fewer than 10 comparable projects (Figure 12 and Figure 13). MW-scale projects in the mining sector have raised the average project size, which was about 1MW in 2018.
The growing market is helping to spread knowledge and awareness of the benefits of on-site solar among potential customers. This is important because many developers report that customers in Sub-Saharan Africa are skeptical about the reliability and economics of using a new technology such as solar. A few years ago, the sales cycle for convincing customers took anywhere from several months to more than a year. Now, developers report shorter sales cycles and more knowledgable customers.
Figure 12: C&I solar installations in Sub-Saharan Africa (excluding South Africa)
Figure 13: C&I solar installations in Sub-Saharan Africa (excluding South Africa)
Source: BloombergNEF. Note: The commissioning date for 24 projects with a capacity of 4MW was unknown and is not displayed.
2.2. Market segmentation Due to the large size of individual projects, the mining sector accounts for more than a third of all C&I solar capacity in the region. The sector totals some 31MW of solar capacity. The size of solar projects in the mining sector averaged 6MW, often bundled with a multiple of that in diesel generators (Figure 15). Solar installations in other sectors tend to be much smaller (Figure 16).
1 2 1 3
15
35
2013 2014 2015 2016 2017 2018
MW
1 3 38
3239
2013 2014 2015 2016 2017 2018
Number of projects

© Bloomberg Finance L.P.2019
No portion of this document may be reproduced, scanned into an electronic system, distributed, publicly displayed or used as the basis of derivative works without the prior written consent of Bloomberg Finance L.P. For more information on terms of use, please contact [email protected]. Copyright and Disclaimer notice on page 63 applies throughout. 17
Figure 14: Installed C&I solar projects Figure 15: Installed C&I solar capacity
Source: BloombergNEF. Note: An additional 13MW are reported by developers without individual project data. If this is included, the total installed capacity will be 74MW.
About a quarter of all C&I solar installations built to date in Sub-Saharan Africa outside of South Africa serve manufacturing facilities, followed by public buildings and offices. A host of smaller commercial operations such as petrol station networks, hotels or shopping mall infrastructure makes up most of the remaining customers for on-site solar (Figure 14).
BNEF estimates that about 85% of the installed capacity serves sites that operate seven days per week, mostly in mining, manufacturing and infrastructure such as petrol stations. The remainder serves commercial facilities or offices, where electricity demand is likely to be lower during weekends. This suggests solar is competitive despite the need to consume the power on-site.
The characteristics of each segment affect project size as well as the dominant business model.
• Mining sites offer opportunities for relatively large projects, particularly where off-grid mines currently use diesel. In the projects built in 2018, developers installed about 1MW of solar for every 3-4MW of diesel power. This ratio keeps the share of solar power relatively low even during peak solar output, ensures diesel generators can back up the solar power and makes their integration easier. Typically, solar will account for no more than about 20% of total electricity generation. As a result, those projects usually include very little battery storage.
• Manufacturing and large retail spaces are typically sites with a good connection to the grid, but with very high reliability requirements. Solar projects at such sites are usually between 100kW-2MW, with average project sizes of 455kW in manufacturing and 300-400kW for retail assets, hotels or carports (Figure 16). The electricity buyers are often multinationals or solid local businesses. In some cases, it may be possible to strike strategic deals with multinationals for several facilities adding up to MW-scale projects. BNEF is aware of 22 projects for manufacturing customers totaling 10MW, of which 15 projects and 6MW are located in Kenya.
• Public buildings and distributed infrastructure are, for instance, hospitals, schools, churches, administration offices. Often, they consist of a large number of small sites, such as bank branches, petrol stations or telecom towers. They might be financially bundled into a larger portfolio and can be contracted all at once, reducing overheads. Operating and
20%
16%
15%9%
7%
6%
6%
5%5%
4%7%
ManufacturingPublic buildingsOfficesCommercialPetrol stationsHorticultureHotelsMiningCarportInfrastructureUnknown
110 projects
17%
11%
4%5%1%1%
4%
50%
3%2%
2%ManufacturingPublic buildingsOfficesCommercialPetrol stationsHorticultureHotelsMiningCarportInfrastructureUnknown
61 Megawatt
Figure 16: Average project size
Source: BloombergNEF.
91
303
329
355
405
455
6,135
Horticulture
Commercial
Hotels
Infrastructure
Carport
Manufacturing
Mining
kW

© Bloomberg Finance L.P.2019
No portion of this document may be reproduced, scanned into an electronic system, distributed, publicly displayed or used as the basis of derivative works without the prior written consent of Bloomberg Finance L.P. For more information on terms of use, please contact [email protected]. Copyright and Disclaimer notice on page 63 applies throughout. 18
maintaining such a network is, however, a difficult task that might require local specialists. There are 46 projects amounting a total capacity of 10.8MW.
Figure 17: Nigeria is the largest C&I solar market in Sub-Saharan Africa (excluding South Africa)
Source: BloombergNEF. Note: Installed capacity refers to what the developers interviewed by BloombergNEF said they had commissioned as of November 2018.
2.3. Capital expenditure The capex for a solar installation (without battery storage) in Sub-Saharan Africa can vary widely between $0.6-1.6/W. In Kenya, the capex for a C&I solar installation today ranges from $0.70-1.40/W, according to local installers. In Nigeria, the range was higher, between $1.1-1.6/W. C&I solar installers often use tier 1 solar modules imported from China, which were available locally for as little as $0.28/W in November 2018, though some installers said they are paying as much as $0.50/W for their components.
BNEF expects that the cost of C&I solar will decline from today’s $0.10-0.14/kWh to $0.05-0.07/kWh in Kenya, Nigeria and Ghana by 2025. Prices of crystalline silicon (c-SI) solar modules fell dramatically in the past decades, from $79/W in the 1970s (in 2018 dollars) to $0.37/W in 2017. BNEF expects a further reduction of 37% in c-Si modules prices by 2025. This will be driven by the continuous improvement of cell efficiency, cheaper raw materials, lower spending on polysilicon and narrowing margins due to the intense competition in the industry. Solar modules are a global commodity and the prices observed in Sub-Saharan Africa reflect the global price plus transport costs and local taxes.
Ghana, 7MW
Nigeria, 20MW
Kenya, 15MWThe market is dominated by a handful of projects in the industrial and mining sectors. Ghana has Africa’s highest electricity tariffs for industry. Local banks have not been involved in C&I solar deals to date. Strict local content rules and interest rates around 30% for Cedi loans are posing major hurdles for accelerated growth.
Most C&I solar projects in Kenya today serve industrial sites, thanks to high electricity tariffs and a functioning tax incentive scheme. Local developers see growth opportunities in manufacturing, agricultural, and horticultural facilities. The regulatory framework for C&I solar in Kenya is relatively friendly, though proposed net metering and retail liberalization rules have been on hold. Several local banks have taken exposure to C&I solar and one of them told BNEF they consider expansion. C&I solar competes mainly with diesel generators, not the
electricity grid in Nigeria. Battery storage is installed by default due to the frequent and lengthy outages. Most systems include uptime commitments and coordinate solar, diesel, batteries and the grid. Customers are relatively comfortable with solar, and most of the installed capacity is used in projects of less than 30kW. Many projects to date have been sold as equipment sales, or financed through developer equity. The Bank of Industry is offering local financing though this fund has been untapped to date.

© Bloomberg Finance L.P.2019
No portion of this document may be reproduced, scanned into an electronic system, distributed, publicly displayed or used as the basis of derivative works without the prior written consent of Bloomberg Finance L.P. For more information on terms of use, please contact [email protected]. Copyright and Disclaimer notice on page 63 applies throughout. 19
2.4. Economics of C&I solar with mostly reliable electricity BNEF estimates that C&I solar can be delivered for between $0.06-0.21/kWh in Nigeria, Kenya and Ghana. Some installers told BNEF they can offer solar for less today. The levelized cost of C&I solar for sites with seven-day operations is between $0.01-0.05/kWh cheaper than the industrial electricity tariff in those three markets in BNEF’s central scenario. Installers interviewed by BNEF report equity IRRs of 15-22% (in local currency) in their projects. In the countries studied by BNEF, installers said they achieve capacity factors4 of 16% to 19%.
In Kenya, the benchmark cost of C&I solar is $0.14/kWh, slightly lower than the grid tariff. Depending on where it is installed and what kind of building it serves, on-site solar may also be eligible for investment deductions when filing taxes, which would further reduce the cost of solar. In Nigeria and Ghana, the benchmark costs are $0.10/kWh and $0.13/kWh, respectively, for facilities operating seven days per week assuming that they use all the electricity generated by the solar panels.
Ghana, where commercial customers pay as much as $0.25/kWh, is the only country among the three where solar is even firmly competitive if its output is curtailed for two days per week, for instance if a facility shuts down operations during the weekend. Elsewhere, it would be preferable to size a solar installation so that it does not exceed the power consumption on the days when the facility does not operate.
Figure 18: Cost of electricity for C&I customers
Source: BloombergNEF. Note: *assumes 4-15 hours of power outages per day, during which the site’s full electricity demand is met with diesel generators . Five-day operations assume that 2/7 of solar output is curtailed as it cannot be used by the host.
44 A measure of how much energy is produced by a plant compared with its theoretical maximum.
0.00 0.05 0.10 0.15 0.20 0.25 0.30 0.35
C&I tariff
Diesel
Mix of grid and diesel*
Solar - 7 day
Solar - 5 day
Solar + 2 hour battery
C&I tariff
Solar - 7 day
Solar - 5 day
C&I tariff
Solar - 7 day
Solar - 5 day
Nig
eria
Keny
aG
hana
$/kWh

© Bloomberg Finance L.P.2019
No portion of this document may be reproduced, scanned into an electronic system, distributed, publicly displayed or used as the basis of derivative works without the prior written consent of Bloomberg Finance L.P. For more information on terms of use, please contact [email protected]. Copyright and Disclaimer notice on page 63 applies throughout. 20
2.5. Economics of C&I solar with unreliable grid electricity When grid electricity is not available, many facilities will switch to diesel generators, usually at a cost of $0.28-0.32/kWh. The effective cost of electricity for end-customers in places like Nigeria therefore heavily depends on the duration and frequency of the outages, when they occur, and the load profile of the facility. For a simplified facility that consumes electricity at a constant rate and experiences a power outage of 9 hours per day, the effective cost of electricity would rise to about $0.19/kWh. With outages and diesel costs at the higher end of the range, this figure would rise to $0.25/kWh.
BNEF estimates the cost for solar and storage at C&I sites in Nigeria ranges from $0.12-0.20/kWh. This is currently greater than the electricity tariff from the grid, but it is cheaper than the average cost of electricity from the grid and a diesel generator for a typical outage profile. A combination of solar and storage can therefore competitively displace diesel for about two hours, which is the typical battery configuration used in Nigeria today. Most vendors will offer integrated packages that operate solar, battery storage and diesel in order to provide reliable electricity. As a result, in Nigeria, battery storage is effectively required in almost all on-site solar installations because solar is used to reduce the cost of bridging power outages.
2.6. Developers, installers and other vendors The market for C&I solar in Sub-Saharan Africa is still small, but the vendor space is already becoming relatively crowded. We counted at least 27 installers active in either Kenya, Nigeria and Ghana, splitting some 42MW of installed capacity between them. The largest of them have commissioned some 3MW of C&I solar.
Most of these companies offer basic installation services. Bundled offerings that provide both energy services and financing are much rarer. Some developers and EPC companies work closely with specialized financiers. For instance, CrossBoundary provides energy services sold via a PPA for corporations in Kenya and Ghana, including Unilever or Kasapreko. Redavia offers solar products on a rental basis to various market segments including the mining sector. Despite the crowded field, one large energy buyer told BNEF her company struggled to find a suitable vendor with a track record capable of serving multiple sites across different countries.
Figure 19: C&I solar vendor landscape in Sub-Saharan Africa
Source: BloombergNEF, company logos.
Country Financier Developer & EPC Offtaker
Kenya
Nigeria
Ghana

© Bloomberg Finance L.P.2019
No portion of this document may be reproduced, scanned into an electronic system, distributed, publicly displayed or used as the basis of derivative works without the prior written consent of Bloomberg Finance L.P. For more information on terms of use, please contact [email protected]. Copyright and Disclaimer notice on page 63 applies throughout. 21
2.7. Contract structures The financial structure of most C&I solar business in Sub-Saharan Africa to date has been simple. Most projects are sold in a direct equipment sale, typically with about 20% paid upfront, 50% midway through construction and the balance upon commissioning.
Direct sales have proven popular for different reasons. In Nigeria, most projects have been of less than 30kW, with many customers having insufficient credit to receive third party financing. Customers in Nigeria are also used to owning diesel generators, and often want to do the same for solar assets. In Kenya, direct equipment sales can sometimes be favored because a solar installation can benefit from investment tax credits.
In some cases, developers might provide some initital financing for a period of a few months to ensure the customer the system is working. This contract structure has helped accelerate project development as it reduces customer worries about quality. In effect, the financing functions as an implicit warranty on the solar installation. This function can be quite important to smaller buyers, particularly in markets where solar is relatively new and buyers are unfamiliar with it.
This direct purchase model, however, has clear limits. It has rarely been used in deals with multinationals or larger local organizations or for projects exceeding 1MW. Those projects have usually been built against PPAs. The offtakers in such deals tend to prefer a financed deal, because they do not want to capitalize energy expenditures, cannot pay upfront for the system, or because they want to spread payments to incentivize the vendor to build a long-lasting system. In Kenya and Ghana, some solar deals that were not direct purchases have been completed as PPAs, with fees quoted per kilowatt hour and a take-or-pay clause.
The rental or leasing model differs from the PPA model in that customers are not charged per unit of electricity consumed, but provide financing directly for the system components. It has proved popular in Nigeria, where most solar customers seek protection against the unpredictable impact and cost of power outages. Many vendors there are selling solar and storage packages with performance guarantees against a regular flat fee, rather than charging for each unit of electricity. Fees for equipment rental are usually charged as a fixed monthly rental or lease price with indexed payments for diesel fuel in cases where the vendor provides a diesel generator as well. In the leasing model, ownership could transfer to a customer depending on contract structure.
Some developers have also discussed using the rental model in instances where selling electricity requires a permit or a licence that is hard to get.
Figure 20: C&I solar contract structures in Sub-Saharan Africa*
Source: BloombergNEF. Note* excluding South Africa.
2.8. Financing In all the markets studied for this report, several companies are offering leasing or PPA options for C&I solar plants. Most developers expect these structures to become more important.
Direct purchase
Customers own solar equipment
Power purchase agreement (PPA)
Customers buy the power supplied by PV at a fixed price per kWh over a specific timeframe
Leasing or rental
Customers pay a smaller initial investment and a fixed fee monthly

© Bloomberg Finance L.P.2019
No portion of this document may be reproduced, scanned into an electronic system, distributed, publicly displayed or used as the basis of derivative works without the prior written consent of Bloomberg Finance L.P. For more information on terms of use, please contact [email protected]. Copyright and Disclaimer notice on page 63 applies throughout. 22
However, the financial sector has broadly been absent from this market to date. Most PPAs or leases have been financed through developer equity, or occasionally through small debt facilities from development finance institutions or other impact investors (ie. Sunref program. See 4.6). There were a small number of noteworthy deals from international investors in 2018 (see below), but several aspects of the financial structure are not resolved yet.
Foreign exchange The vast majority of capital expenditure for a developer occur in foreign currency, usually in U.S. dollars. Most external financing to date has also been raised in dollars. Revenue, however, can often be denominated in local currency. The C&I solar deals done to date were in both local and foreign currency. Smaller offtakers are usually local companies that report in local currency, and therefore prefer local currency pricing. This includes the local arms of multinationals whose revenue comes mostly from local markets. There are only few options to hedge this foreign exchange risk, and many stakeholders consider them expensive.
Those willing to agree on pricing in dollars have mostly been export-oriented companies, usually in the mining sector.
A related issue is the currency bills are actually paid. In Ghana, for instance, prices paid by offtaker can be quoted in U.S. dollars but are indexed and paid in cedi within a certain range that a developer and an offtaker agree. This would reduce the foreign exchange risk for offtakers, but can introduce exchange risk for the developer if cedi is depreciated beyond the range.
The role of local banks Local banks have so far played only a minor role in the nascent C&I solar market in Sub-Saharan Africa (outside of South Africa). Where local banks have lent to C&I solar projects, they have typically used funds from development finance institutions to do so. Many developers perceive the terms offered by local banks as too onerous. Developers said they were offered interest rates between 11% in Kenya and 30% in Ghana. These rates are nominal, and cannot be directly compared to the rates offered on dollars or euros. But developers also say that commercial banks offer tenors of just 2-3 years, far shorter than the typical lifetime of a solar asset. Non-recourse project financing is not on offer. In Nigeria, banks require physical collateral, most often real estate. Developers cannot borrow against the cashflow from a C&I PPA, or the equipment itself.
There are two notable exceptions from this rule:
• In Kenya, the Sustainable Use of Natural Resources and Energy Finance (Sunref) initiative developed by Agence Française de Développement (AFD) has provided local banks with funds to lend towards C&I solar projects. The facility is part of a $35 million credit line in Kenya, Tanzania and Uganda. The funds were deployed in euros at a rate of 4-6%. Such initiatives can serve as catalyzers if local banks later provide similar services with their own money. One bank has told BloombergNEF it is considering doing so.
• In Nigeria, the Bank of Industry (BOI) in 2018 launched a 6 billion naira ($16.5 million) fund dedicated to solar projects. It can lend up to $0.96 million per customer, at an advertised nominal interest rate of 9%, with tenors of up to five years. No funds had been disbursed as of December 2018 because the fund is still new and BOI wants to ensure that developers have collareral that meets its criteria.
© Bloomberg Finance L.P.2019
No portion of this document may be reproduced, scanned into an electronic system, distributed, publicly displayed or used as the basis of derivative works without the prior written consent of Bloomberg Finance L.P. For more information on terms of use, please contact [email protected]. Copyright and Disclaimer notice on page 63 applies throughout. 23
International financing In the absence of local lenders, there have been a few deals from international impact investors directly supporting project developers. Between June and November 2018, the Overseas Private Investment Corporation (OPIC), solar boutique lender SunFunder, and responsAbility Investments AG have announced financing facilities for a total of $11.2 million with Crossboundary, Questworks and Redavia, respectively. In February 2018, African Infrastrcuture Investment Manager and Helios Investment Partners announced a $30 million equity round for Starsight, a Nigeria-based C&I solar-diesel hybrid company. Crossboundary had previously raised $8 million in 2015.
Default rates Credit ratings are hard to receive across much of Africa. No company contacted by BNEF agreed to share default rates. In Ghana and Kenya, developers insisted that no customer has officially defaulted, although some late payments have been registered. Developers in Nigeria stated that customers may prioritize other payments as long as the power supply works, suggesting that at least for smaller customers the ability to remotely deactivate the system could provide an additional layer of security.
Lenders will likely require not just a credit review of the offtaker, but also some assurances that default rates and late payment in C&I solar contracts are predictable. The development of a more standardized definition of default and the measurement of key metrics will be critical to scale debt financing.
Project aggregation Aggregating customers is critical to finance a portfolio of projects in order to mitigate risk and raise capital to expand the C&I solar businesses. The vast majority of projects consist of installations smaller than 1MW. While larger sites for industrial clients may pose the most immediate opportunities, installations ranging from tens to hundreds of kilowatts will likely continue to make up a significant proportion of the market. Projects with single-digit megawatt capacity might be accommodated by specialist lenders, but smaller assets need intermediaries that can aggregate multiple sites into a portfolio. These can be specialist funds, though the more likely route that is already starting to be established is to offer debt facilities to individual developers.

© Bloomberg Finance L.P.2019
No portion of this document may be reproduced, scanned into an electronic system, distributed, publicly displayed or used as the basis of derivative works without the prior written consent of Bloomberg Finance L.P. For more information on terms of use, please contact [email protected]. Copyright and Disclaimer notice on page 63 applies throughout. 24
Section 3. Outlook Solar for businesses in Africa is economically viable and gaining steady traction. The 23 developers interviewed for this study are working on a total pipeline of 110MW for 2019 in Kenya, Ghana and Nigeria alone. That is almost twice as much as the capacity they have so far installed. Improving customer awareness, boosting financing options and a more transparent way of setting import and electricity tariffs are top of the agenda for the sector.
3.1. The addressable market C&I power consumption from the grid in the seven countries considered in this study where on-site solar is economically viable totalled some 31TWh in 2015 (Figure 21). Economically viable means our estimated solar cost range is lower than the grid tariff for both commercial and industrial customers (see Figure 4 and Figure 5). This level of electricity demand translates to an average load of about 3.5GW. Because on-site solar is designed for self-consumption, this load can be thought of as a proxy for the maximum addressable market. Nigeria, Ghana, and Kenya are the three largest markets where on-site solar is economically viable.
In reality, multiple constraints such as unsuitable rooftops, land constraints, insufficient credit and regulatory hurdles or uncertainty are likely to keep the market well below its theoretical potential.
Most immediately, in Kenya, Ghana and Nigeria, 23 developers and installers interviewed by BNEF for this study reported a pipeline of 110MW for execution in 2019 and early 2020. While it is unlikely that the entire pipeline will proceed to the final stages, BNEF expects that 2019 will be another record year for the C&I sector in Sub-Saharan Africa outside of South Africa.
Figure 21: C&I power demand
Source: IEA, BloombergNEF. Note: a market is considered economically viable for C&I solar if both commercial and industrial electricity tariffs exceed BNEF’s cost estimate for C&I solar.
334
1,806
1,934
2,253
2,489
2,543
3,629
3,957
4,538
4,723
5,029
5,382
6,210
7,576
10,713
Rwanda
Senegal
Uganda
Botswana
Mozambique
Tanzania
Zimbabwe
Cote d'Ivoire
Cameroon
DRC
Ethiopia
Kenya
Ghana
Zambia
Nigeria
GWh/year (2015)
Adding solar is economically viable Not economically viable
© Bloomberg Finance L.P.2019
No portion of this document may be reproduced, scanned into an electronic system, distributed, publicly displayed or used as the basis of derivative works without the prior written consent of Bloomberg Finance L.P. For more information on terms of use, please contact [email protected]. Copyright and Disclaimer notice on page 63 applies throughout. 25
Kenya
Kenya had an installed C&I solar capacity of some 15MW as of October 2018, according to data from five developers. Their pipelines suggest the market could add another 26MW by the end of 2019. Half of the existing capacity is installed in the manufacturing and horticulture segment, with the latter accounting for all projects above 1MW. It was also growth in these sectors that has helped Kenya Power boost electricity sales by 25% since 2012.
The investors and developers interviewed by BNEF see opportunities mostly with industrial customers operating manufacturing facilities but also with customers such as flower farms and cold storage facilities. These sites also operate 24 hours for six or seven days a week, which makes it possible to build a larger solar installation. There were a total of 3,700 large and industrial power consumers in the country in 2018, about 10% of which were in the most power intensive segment with a voltage of 132kV or higher. The average C&I load in Kenya totals about 650MW. That could mean that if the 2019 pipeline is fully built, solar could already account for some 6% of midday C&I power supply in 2020.
Nigeria
In November 2018, BNEF identified a C&I solar capacity of at least 20MW in Nigeria. The primary driver for solar in Nigeria are power outages and the associated costs of diesel fuel or lost business. As a result, the market is very distributed, with the majority of installations being smaller than 30kW. The 12 developers interviewed by BloombergNEF for this study in Nigeria have a pipeline of 49 to 55MW, against a commissioned capacity of 20MW. Most of this pipeline is located in industrial areas where land is relatively abundant.
Nigeria’s size and poor electricity supply suggest it is likely to remain one of the largest C&I solar markets in Sub-Saharan Africa (outside of South Africa). Some 77% of the nation’s electricity demand is already met through self-generation, usually in the form of diesel or petrol generators. Government estimates pegged the cumulative capacity of these gensets at some 12.5GW in 2016. They produce power at a cost of $0.28-0.32/kWh, far above the cost of C&I solar. An annual consumption of 11.6TWh by the C&I sector suggests that the average non-residential load on the grid is about 1,300MW. There are some 63,000 industrial tariff payers in Nigeria, consuming just under 2,000 GWh from the grid annually, according to data from the Nigerian Electricity Regulatory Commission (NERC). This figure pales relative to the 1.7 million commercial tariff customers.
Most C&I projects in Nigeria today come with lead-acid batteries. By 2020, lithium-ion batteries are likely to become the default battery choice, according to developers.
Ghana
Ghana’s C&I solar market consisted of just 7MW as of November 2018, but a strong and growing industrial sector combined with the highest electricity tariffs in Sub-Saharan Africa hint at significant growth potential. The local developers interviewed by BNEF are working on a pipeline of 32MW, with several MW-scale projects already in advanced stages. Today, most commissioned projects are centered around the business hubs of Tema and Accra, where multinational corporations with sustainable energy targets such as Cargil have operations.
Across the country, industrial power demand has increased by an average of 5.3% per year since 2008. The power consumption of industrial customers, which make up almost half of total power demand in the country, amounted to 4.7TWh in 2017. Together with the smaller commercial sector, their average load is about 690MW. There are a total of 47 companies with a power

© Bloomberg Finance L.P.2019
No portion of this document may be reproduced, scanned into an electronic system, distributed, publicly displayed or used as the basis of derivative works without the prior written consent of Bloomberg Finance L.P. For more information on terms of use, please contact [email protected]. Copyright and Disclaimer notice on page 63 applies throughout. 26
connection of 500kV or larger, which are likely to be prime targets for C&I solar developers given the significant savings they can generate. These include much of the nation’s mining sector, which produces mostly gold and consumes some 212MW of power – some 10% of the nation’s total. Some of these rely on off-grid diesel generators, which could make solar projects particularly favorable.
Figure 22: C&I solar markets relative to C&I power demand
Source: BloombergNEF. Note: Pipelines refer to project plans quoted by developers interviewed by BNEF. Ghana’s 32MW (purple) includes projects that have been awarded but are scheduled for construction in 2020. Addressable C&I load is the average grid electricity load for C&I customers.
3.2. The outlook for grid electricity prices and reliability A key concern for customers considering whether to install solar is not just whether it is competitive today, but also whether it will stay so in the coming years. That means they must compare a usually5 fixed tariff for solar today to the future electricity tariff for grid electricity. Where outages are a concern, customer must also implicitly take a position on whether they believe that electricity supply from the grid will improve (and therefore become cheaper compared with diesel generators). In South Africa, for instance, power outages were common in 2015, then mostly ceased until they became an issue again in 2018.
Kenya Kenya’s grid is considered relatively reliable by most commercial and industrial electricity buyers. Kenya’s electricity price has increased by 21% from 2016 to 2018 (in local currency, Figure 28).
Several factors could increase electricity tariffs in Kenya. The grid requires a significant amount of maintenance and investment, which is likely to be passed on to customers. Kenya’s power market, with its installed capacity of 2,323MW, is oversupplied relative to peak power demand of just 1,656MW in 2017. Ironically, this is likely to make power more expensive for customers.
5 Some developers adjust prices paid by customers in line with changes of grid electricity prices.
Kenya NigeriaGhana
Installed capacity 2018
20MW 52MW
~1,325MW
Developer pipeline for 2019 Addressable C&I load
15MW 26MW
~650MW
7MW 32MW
~690MW

© Bloomberg Finance L.P.2019
No portion of this document may be reproduced, scanned into an electronic system, distributed, publicly displayed or used as the basis of derivative works without the prior written consent of Bloomberg Finance L.P. For more information on terms of use, please contact [email protected]. Copyright and Disclaimer notice on page 63 applies throughout. 27
Since the 310MW Lake Turkana Wind Power project started operation, Kenya Power needs to pay for the excess power, a cost that is ultimately passed to consumers.
Nigeria Power outages are likely to remain a part of daily life in Nigeria for the foreseeable future. Even if new power generation capacity is added, the transmission and distribution networks are too weak to deliver more electricity, and network reforms are even further behind than efforts to boost generation capacity. Therefore, most people are aiming to be self-reliant with regards to their electricity supply.
Power prices have not been updated since 2014, despite formally being tied to an indexed formula. As a result, distribution utilities are not recovering their costs, reducing the probability that power prices will fall (see Figure 34 and Figure 35). Currently, the distribution companies are in financial distress and owing the bulk electricity trader (NBET) a considerable amount of money.
Ghana Solar is likely to remain a viable proposition even if Ghana continues to reduce its electricity tariffs. Power outages are no longer a daily concern in the country, and the emergency measures taken in 2015 mean installed power generation capacity in 2018 still exceeded peak demand by 887MW, or 27%. The grid will probably be sufficiently built out to meet most industrial power demand in the next few years, although sporadic and localized outages may still occur.
Ghana’s grid electricity tariffs are still high despite a 18-30% cut in March 2018 (Figure 45). There is popular demand for further tariff cuts, but these would require an even higher level of energy subsidies. A volatile local currency and the high cost of power generation capacity already installed means tariffs will need to be high for years to recover costs and honor the contracts with the IPPs.
3.3. Accelerating the C&I solar market The primary bottlenecks to accelerate the C&I solar market in Sub-Saharan Africa are debt financing, customer awareness and a clearer and more transparent regulatory framework.
Debt financing
Developers are unanimous that drawing debt capital to the sector will be crucial to faster market development. This will require more standardization of contract structures, financial performance metrics that allow bundling multiple projects into a larger financial structure, as well as the use of hedging tools for foreign exchange risks. The absence of local banks from the market offers an opportunity for foreign lenders and development finance institutions to either compete or partner with domestic lenders.
Customer awareness Solar installers say potential customers can be skeptical about their offering, which dramatically slows the sales cycle. Solar is considered a relatively new technology and is often associated with small off-grid solutions that provide intermittent power in a rural setting. Some customers, it seems, mistakenly believe they would be disconnected from the main grid if they installed solar.
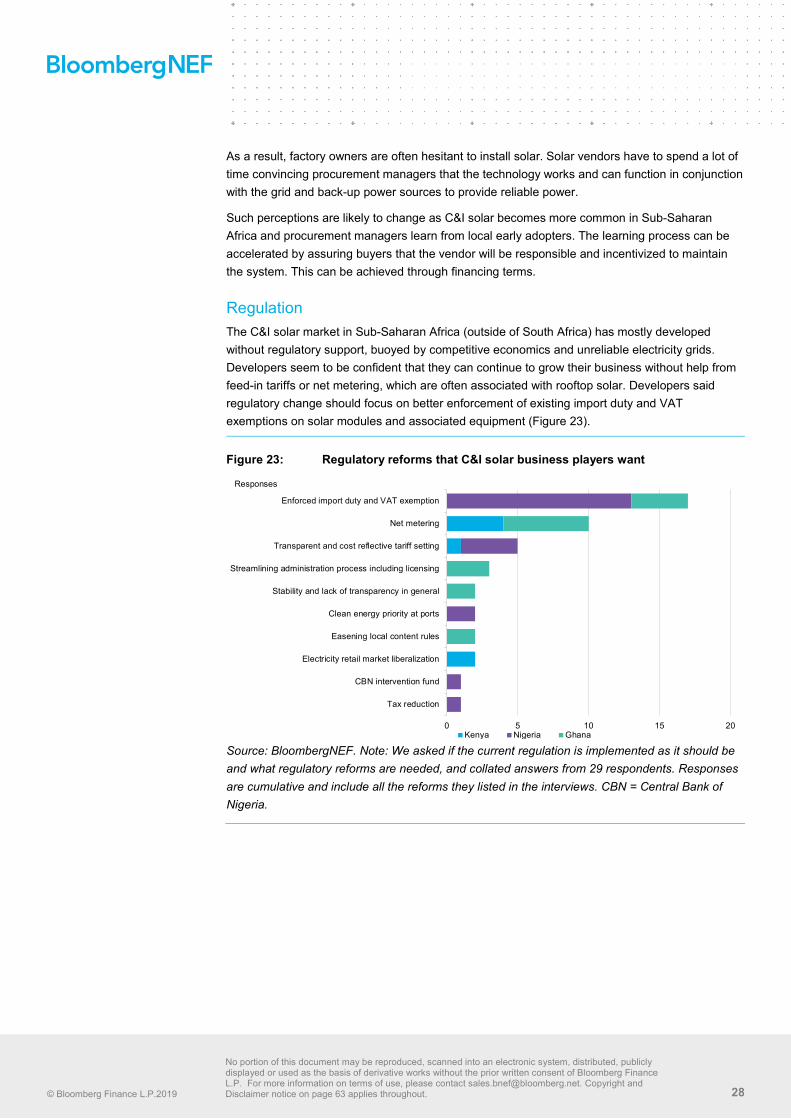
© Bloomberg Finance L.P.2019
No portion of this document may be reproduced, scanned into an electronic system, distributed, publicly displayed or used as the basis of derivative works without the prior written consent of Bloomberg Finance L.P. For more information on terms of use, please contact [email protected]. Copyright and Disclaimer notice on page 63 applies throughout. 28
As a result, factory owners are often hesitant to install solar. Solar vendors have to spend a lot of time convincing procurement managers that the technology works and can function in conjunction with the grid and back-up power sources to provide reliable power.
Such perceptions are likely to change as C&I solar becomes more common in Sub-Saharan Africa and procurement managers learn from local early adopters. The learning process can be accelerated by assuring buyers that the vendor will be responsible and incentivized to maintain the system. This can be achieved through financing terms.
Regulation The C&I solar market in Sub-Saharan Africa (outside of South Africa) has mostly developed without regulatory support, buoyed by competitive economics and unreliable electricity grids. Developers seem to be confident that they can continue to grow their business without help from feed-in tariffs or net metering, which are often associated with rooftop solar. Developers said regulatory change should focus on better enforcement of existing import duty and VAT exemptions on solar modules and associated equipment (Figure 23).
Figure 23: Regulatory reforms that C&I solar business players want
Source: BloombergNEF. Note: We asked if the current regulation is implemented as it should be and what regulatory reforms are needed, and collated answers from 29 respondents. Responses are cumulative and include all the reforms they listed in the interviews. CBN = Central Bank of Nigeria.
0 5 10 15 20
Tax reduction
CBN intervention fund
Electricity retail market liberalization
Easening local content rules
Clean energy priority at ports
Stability and lack of transparency in general
Streamlining administration process including licensing
Transparent and cost reflective tariff setting
Net metering
Enforced import duty and VAT exemption
Responses
Kenya Nigeria Ghana

© Bloomberg Finance L.P.2019
No portion of this document may be reproduced, scanned into an electronic system, distributed, publicly displayed or used as the basis of derivative works without the prior written consent of Bloomberg Finance L.P. For more information on terms of use, please contact [email protected]. Copyright and Disclaimer notice on page 63 applies throughout. 29
Section 4. In-depth findings for Kenya Kenya had an installed C&I solar capacity of some 15MW as of October 2018 according to data from five local developers collated by BloombergNEF. Their pipelines suggest the market could grow by 26MW by the end of 2019.
4.1. Summary The manufacturing and horticulture sectors lead the market in Kenya, with 15 and 7 installations respectively totaling 6.7MW. Most installations so far involved the direct purchase of the equipment. Most were built to realize cost savings, as the grid is considered reliable.
The cost of C&I solar stands at $0.14/kWh in 2018, some 18% lower than industrial grid tariffs and 13% lower commercial ones. BNEF projects that the cost will drop to $0.07/kWh by 2030.
The regulatory environment is relatively favorable for C&I solar. There are exemptions on import duties and VAT for solar modules and inverters. On-site solar installations smaller than 1,000kW do not require a power generation licence from the Energy Regulatory Commission. Despite an oversupplied power market, electricity tariffs are unlikely to fall much, as investments into the grid infrastructure will be passed on to rate payers.
Figure 24: Kenya C&I solar installed capacity
Source: BloombergNEF. Notes: Data as of the end of October 2018. The sky blue is cumulative installed capacity of projects larger than 30kW that BNEF identified. The dotted-line box is the gap between the tracked projects and installed capacity that developers reported, the commissioning year of which is unkwnon. The estimated total capacity in 2018 is 15MW.
4.2. Market segmentation Buyers of solar installations larger than 1MW in Kenya include Williamson Tea, Krystalline Salt, the International Centre of Insect Physiology and Ecology, and Two Rivers Development. C&I solar customers also include water suppliers and flower farms. Financiers, developers and EPC companies primarily see opportunities with manufacturing facilities, flower farms and cold storage sites. These operate 24 hours for six or seven days a week, making it viable to integrate more solar than if they had lower power demand at weekends.
0
2
4
6
8
10
12
14
16
2014 2015 2016 2017 2018
Cumulative installed capacity (MW)
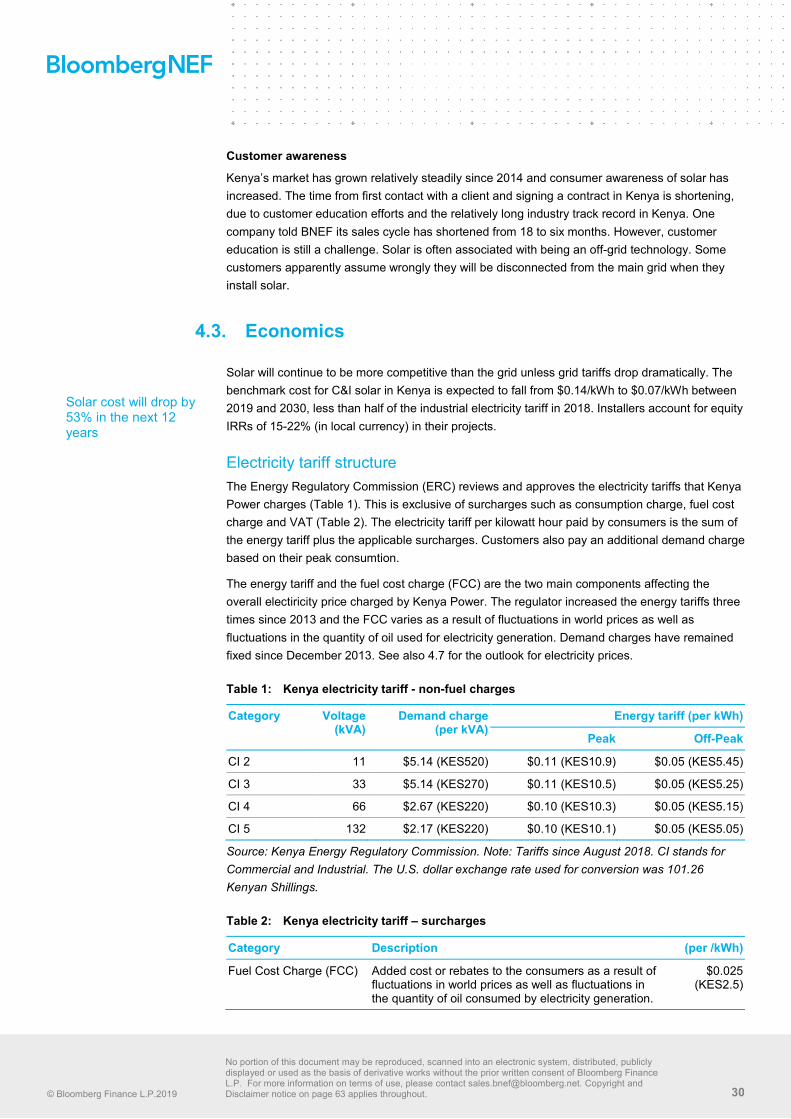
© Bloomberg Finance L.P.2019
No portion of this document may be reproduced, scanned into an electronic system, distributed, publicly displayed or used as the basis of derivative works without the prior written consent of Bloomberg Finance L.P. For more information on terms of use, please contact [email protected]. Copyright and Disclaimer notice on page 63 applies throughout. 30
Customer awareness Kenya’s market has grown relatively steadily since 2014 and consumer awareness of solar has increased. The time from first contact with a client and signing a contract in Kenya is shortening, due to customer education efforts and the relatively long industry track record in Kenya. One company told BNEF its sales cycle has shortened from 18 to six months. However, customer education is still a challenge. Solar is often associated with being an off-grid technology. Some customers apparently assume wrongly they will be disconnected from the main grid when they install solar.
4.3. Economics
Solar will continue to be more competitive than the grid unless grid tariffs drop dramatically. The benchmark cost for C&I solar in Kenya is expected to fall from $0.14/kWh to $0.07/kWh between 2019 and 2030, less than half of the industrial electricity tariff in 2018. Installers account for equity IRRs of 15-22% (in local currency) in their projects.
Electricity tariff structure The Energy Regulatory Commission (ERC) reviews and approves the electricity tariffs that Kenya Power charges (Table 1). This is exclusive of surcharges such as consumption charge, fuel cost charge and VAT (Table 2). The electricity tariff per kilowatt hour paid by consumers is the sum of the energy tariff plus the applicable surcharges. Customers also pay an additional demand charge based on their peak consumtion.
The energy tariff and the fuel cost charge (FCC) are the two main components affecting the overall electiricity price charged by Kenya Power. The regulator increased the energy tariffs three times since 2013 and the FCC varies as a result of fluctuations in world prices as well as fluctuations in the quantity of oil used for electricity generation. Demand charges have remained fixed since December 2013. See also 4.7 for the outlook for electricity prices.
Table 1: Kenya electricity tariff - non-fuel charges
Category Voltage (kVA)
Demand charge (per kVA)
Energy tariff (per kWh)
Peak Off-Peak
CI 2 11 $5.14 (KES520) $0.11 (KES10.9) $0.05 (KES5.45)
CI 3 33 $5.14 (KES270) $0.11 (KES10.5) $0.05 (KES5.25)
CI 4 66 $2.67 (KES220) $0.10 (KES10.3) $0.05 (KES5.15)
CI 5 132 $2.17 (KES220) $0.10 (KES10.1) $0.05 (KES5.05)
Source: Kenya Energy Regulatory Commission. Note: Tariffs since August 2018. CI stands for Commercial and Industrial. The U.S. dollar exchange rate used for conversion was 101.26 Kenyan Shillings.
Table 2: Kenya electricity tariff – surcharges
Category Description (per /kWh)
Fuel Cost Charge (FCC) Added cost or rebates to the consumers as a result of fluctuations in world prices as well as fluctuations in the quantity of oil consumed by electricity generation.
$0.025 (KES2.5)
Solar cost will drop by 53% in the next 12 years

© Bloomberg Finance L.P.2019
No portion of this document may be reproduced, scanned into an electronic system, distributed, publicly displayed or used as the basis of derivative works without the prior written consent of Bloomberg Finance L.P. For more information on terms of use, please contact [email protected]. Copyright and Disclaimer notice on page 63 applies throughout. 31
Category Description (per /kWh)
VAT 16% on everything except the WARMA, ERC and REP levies
$0.02 (KES2.02)
Foreign Exchange Rate Fluctuation Adjustment (FERFA)
Variable rate per kWh, published monthly by Kenya Power.
-$0.0008 (-KES0.08)
Inflation Adjustment (IA) Variable rate per kWh, published monthly by Kenya Power.
$0.001 (KES0.1)
WRMA For energy purchased from hydropower plants above $0.0002 (KES0.02)
ERC Levy 3% per kWh. This is the levy passed on to the Energy Regulatory Commssion.
$0.0003 (KES0.03)
REP Levy 5% levy on the cost of the units of power consumed by a customer.
$0.005 (KES0.5)
Source: Kenya Power, link. Note: The U.S. dollar exchange rate used for conversion was 101.26 Kenyan Shillings.
Capex The capex for a C&I solar installation today ranges from $0.70-1.40/W, according to local installers. C&I players generally use tier 1 solar modules imported from China, which were available for as little as $0.28/W in November 2018, though some installers mentioned paying as much as $0.50/W. The main components of solar systems arrive at the Mombasa port, and a lengthy custom and documentation process can add additional costs. The transport infrastructure in Kenya is fairly good, though projects in remote areas can raise the capex by $0.20-0.30/W.
Figure 25: C&I solar cost forecast versus 2018 electricity tariffs
Source: BloombergNEF Note: The analysis assumes seven days of operation per week. Demand charge per kWh is also included.
0.00
0.02
0.04
0.06
0.08
0.10
0.12
0.14
0.16
0.18
2019 2020 2021 2022 2023 2024 2025 2026 2027 2028 2029 2030
$/kWh
Cost of C&I solar 2018 commercial grid tariff 2018 industrial grid tariff

© Bloomberg Finance L.P.2019
No portion of this document may be reproduced, scanned into an electronic system, distributed, publicly displayed or used as the basis of derivative works without the prior written consent of Bloomberg Finance L.P. For more information on terms of use, please contact [email protected]. Copyright and Disclaimer notice on page 63 applies throughout. 32
Battery storage
In the absence of a net metering policy, energy storage is not economically viable for grid-connected customers in Kenya. Energy storage is still critical for off-grid facilities such as remote camps and lodges, where solar displaces electricity from diesel generators. There, storage with a two-hour battery roughly doubles the capex per watt for a typical project. However, this is not the main C&I solar market segment in Kenya. Most developers said they will consider battery storage in the future.
Tax
Depending on where it is installed and what kind of facility it serves, on-site solar may also be eligible for investment deductions when filing taxes in Kenya. The country offers a so-called investment deduction on the capital expenditure for buildings and machinery used in manufacturing and certain hotels. The investment in on-site solar systems is eligible for tax credits under this policy. The deduction is given only once during the year of first use of qualifying assets.
There is also a 150% deduction for the construction of an industrial building or the purchase and installation of machinery including a solar system costing 200 million shillings ($1.96 million) or more outside Nairobi, Mombasa and Kisumu. Investment deductions are applicable within Nairobi, Mombasa & Kisumu municipalities at a rate of 100%6. The deduction is only applicable for direct purchase, but not for cases when solar system is leased.
4.5. Regulation
Kenya’s regulatory environment is considered relatively friendly for C&I solar. A generation permit or a licence is required to develop projects larger than 1MW, but developers told BNEF that the Energy Regulatory Authority’s process is transparent, predictable and can take less than two months. This is one of reasons why both Kenyan and non-Kenyan developers often chose the country as the first entry point in Sub-Saharan Africa. The regulations in Kenya prevent developers from selling power via a PPA without acquiring a supply licence, which none of them has done. Instead, developers are using direct equipment sales or leases.
According to Kenya’s Energy Act, last revised in 2012, projects smaller than 1MW that do not sell power to the grid do not require a generation permit or licence from the Energy Regulatory Commission (ERC). This suggests that a facility owner or operator can install solar without informing either the utility or the energy regulator as long as technical equipment is put in place that ensures no electricity is sent to the grid, even if the same factory or building is connected to the grid. All projects, regardless of project size, must obtain a permit from the National Construction Authority (NCA), as well as a National Environment Management Authority (NEMA) licence and local county approval. The rules for county approval vary between different locations. Assets must be installed by a licensed technician and comply with the grid code. There are no local content rules in Kenya, and the relevant regulations have been relatively stable and predictable.
Projects with a capacity of 1-3MW require a generation permit from the ERC. Projects with more than 3MW require a generation licence from the ERC. The difference between a permit and a licence is only the capacity and the application fee, which is free for a permit and 10,000 Kenyan shillings for a licence. Both require the same application process, grant the same rights and come
6 Kenya Revenue Authority, Taxation for Companies and Partnerships. Accessed December 20, 2018.
Table 3: Requirements for constructing and operating on-site solar
Size threshold
Generation permit or licence requirements
<1,000kW None
1,000-3,000kW
Permit
3,000kW+ Licence
Source: BloombergNEF, Energy Regulatory Commission.

© Bloomberg Finance L.P.2019
No portion of this document may be reproduced, scanned into an electronic system, distributed, publicly displayed or used as the basis of derivative works without the prior written consent of Bloomberg Finance L.P. For more information on terms of use, please contact [email protected]. Copyright and Disclaimer notice on page 63 applies throughout. 33
with the same obligations. It takes up to 90 days for the entire application process, and generally less than two months, according to the ERC. Local installers said they found that the permitting or licensing process is relatively easy and transparent to navigate. BNEF has identified five C&I solar projects in Kenya with a capacity between 1-3MW already installed, and none larger than 3MW.
Figure 26: Kenya permit and generation licence application process
Source: Energy Regulatory Commission of Kenya (ERC), GIZ, BloombergNEF. Note: The sky blue boxes are the actions that an applicant is responsible and the purple boxes are those ERC is responsible.
Selling electricity
When power from an on-site power generation asset is sold to the host via a PPA, the project is not considered a self-generation project. The project owner would therefore have to acquire an electricity supply licence. This process includes a review of the PPA tariff by the ERC. Kenya Power has been the sole electricity distributor and retailer in the country so far, aside from a few microgrid developers focusing on rural electrification. This suggests that C&I solar developers have all opted for alternative contract structures that do not require a supply licence.
Other regulations
An import duty and VAT exemption is in place for solar modules and inverters. The exemption does not cover cables, racking, and switch gear. The rules for batteries are less clear, and importers said treatment can vary from one customs officer to the next.
A draft proposal to introduce net metering has been considered for four years. If implemented, the policy could drive growth of the C&I solar market. However, it is uncertain whether and when it will be implemented. Given the nation’s oversupplied power market, it is unlikely to become a priority soon.
The proposed Energy Bill 2017 envisions opening up the monopolized electricity retail market. Parliament is reviewing the bill, though it is not clear if and when it will be implemented. If enacted, a retail licence holder could sell electricity to a third party through the distribution grid.
Apply for a permit or a generation licence
Prepare documentation (engineering report, description of undertaking, audited accounts, certificate of incorporation)
National Environment Management Authority (NEMA) license
Public notification via at least two newspapers with wide circulation
Submit application documents to ERC
Review by ERC
Issuance of a permit or licence
© Bloomberg Finance L.P.2019
No portion of this document may be reproduced, scanned into an electronic system, distributed, publicly displayed or used as the basis of derivative works without the prior written consent of Bloomberg Finance L.P. For more information on terms of use, please contact [email protected]. Copyright and Disclaimer notice on page 63 applies throughout. 34
4.6. Finance Further market growth is most often hindered by a gap in debt financing, according to developers in Kenya.
To date, most C&I solar projects in Kenya are sold without any financing at all. Direct equipment purchases have been the main business model, exceeding leasing and PPAs. Many customers would prefer to use a financing offering. Developers have either offered this from their balance sheet or, in a few projects, with bank lending.
SunFunder set up a $1.2 million debt facility for Questworks, a Kenyan solar installer in June, 2018. Three out of 43 Kenyan commercial banks have financed C&I solar under the Sunref program, developed by Agence Française de Développement (AFD), allowing C&I clients to install on-site solar at an interest rate of 4-6% in euros. That compares with a typical market interest rate of 11-13% on Kenyan shillings. One bank that financed several projects told BNEF that it is also interested in financing this sector outside the Sunref program.
Sunref initiative
The Sustainable Use of Natural Resources and Energy Finance (Sunref) initiative was developed by Agence Française de Développement (AFD) to mobilize public and private banks to finance investment in the private sector that provide greater use of green technologies and sustainable energy. Sunref East Africa aims to facilitate access to sustainable energy in partnership with local banks in Kenya, Tanzania and Uganda. It has a credit line of more than $35 million to provide long-term financing for deployment of various renewable energy and energy-efficiency technologies.
Some C&I solar companies receive payment in local currency and others receive payments in U.S. dollars. The Kenyan shilling has been relatively stable over the last three years.
4.7. Outlook Power demand
Kenya's power demand has increased at an average rate of 6% per year since 2011. Growth was driven by manufacturing, agriculture and other sectors of the economy as well as a rapid rise in the number of residential customers. Kenya Power sold 7,701GWh from July 2016 to June 2017, or 25% more than in the same period in 2012-2013 (Figure 27).
Kenyan banks started lending to C&I solar with French government support

© Bloomberg Finance L.P.2019
No portion of this document may be reproduced, scanned into an electronic system, distributed, publicly displayed or used as the basis of derivative works without the prior written consent of Bloomberg Finance L.P. For more information on terms of use, please contact [email protected]. Copyright and Disclaimer notice on page 63 applies throughout. 35
Figure 27: Kenya Power electricity sales
Source: Source: Kenya Power, BloombergNEF. Note: Kenya’s fiscal year is from July to June, so 2016/2017 = July 2016 - June 2017.
Power prices
Kenya’s electricity price has risen 21% from 2016 to 2018 (Figure 28). Future tariffs are uncertain, but they are more likely to rise than fall due to investments in grid infrastructure.
Several factors could push up tariffs in Kenya. The grid requires a significant amount of maintenance and investment, which is likely to be passed on to customers. Kenya’s power market is oversupplied, with an installed capacity of 2,323MW relative to peak power demand of just 1,656MW in 2017. Ironically, this is likely to make power more expensive for customers. The 310MW Lake Turkana Wind Power project has started operation, for example, and Kenya Power will have to pay for the excess power - a cost that is ultimately passed on to consumers.
Figure 28: Historical electricity prices for C&I customers
Source: BloombergNEF, Kenya Power.
0
1,000
2,000
3,000
4,000
5,000
6,000
7,000
8,000
2012/13 2013/14 2014/15 2015/16 2016/17Commercial and Industrial Domestic Small CommercialOff-peak (Interruptible) Street lighting
(GWh)
02468
1012141618
2013 2014 2015 2016 2017 2018
(KES/kWh)
CI2 (commercial) CI5 (industrial)
0.000.020.040.060.080.100.120.140.160.180.20
2013 2014 2015 2016 2017 2018
($/kWh)
CI2 (commercial) CI5 (industrial)

© Bloomberg Finance L.P.2019
No portion of this document may be reproduced, scanned into an electronic system, distributed, publicly displayed or used as the basis of derivative works without the prior written consent of Bloomberg Finance L.P. For more information on terms of use, please contact [email protected]. Copyright and Disclaimer notice on page 63 applies throughout. 36
Section 5. In-depth findings for Nigeria Nigeria had an estimated installed C&I solar capacity of at least 20MW as of November 2018. The vast majority of installations, however, are very small. There are just 8.9MW of sites over 30kW. The 12 leading developers interviewed by BloombergNEF are working on a pipeline of 49 to 55MW for commissioning by year-end 2019. Factories are the largest segment, adding up to 3MW.
5.1. Summary Power outages are the primary driver for installing C&I solar in Nigeria. The typical system consists of solar, batteries, diesel gensets and grid power, and solar installers routinely guarantee the availability of power to customers. Batteries are therefore crucial. The cost for C&I solar with battery storage is $0.19/kWh today, some 67% higher than the industrial grid tariffs and 63% above the commercial rate, but lower than electricity from a diesel generator, which generally costs $0.28-0.32/kWh. BNEF projects that this cost will decline to $0.10/kWh by 2030.
The regulatory environment is relatively stable for C&I solar. Captive generation of less than 1MW does not require a generation licence. Nigeria also has a relatively supportive minigrid regulation relevant to C&I projects serving multiple customers in economic clusters. Import duties and VAT are 5% each on solar modules, and add up to 25% on batteries.
The only source of dedicated naira financing for solar is offered by the Bank of Industry (BOI), a development bank, who has a 6 billion naira (16.5 million U.S. dollars) C&I solar fund that offers loans of as much as 350 million naira (0.96 million U.S. dollars) per customer (and not per project), with an advertised annual cost of debt of 9%. Commercial banks are absent from the C&I solar sector, with developers telling BNEF banks have offered them loans at rates of 25% or more. According to developers, the lack of affordable financing is the largest obstacle for growth of the C&I solar market in Nigeria.
Figure 29: Nigeria C&I solar installed capacity
Source: BloombergNEF. Note: Data as of the end of October. The sky blue is cumulative installed capacity of projects larger than 30kW that BNEF identified. The dotted-lined box is the gap between the tracked projects and installed capacity that developers reported, of which commissioning year is unknown. The estimated total capacity in 2018 is 20MW.
0
5
10
15
20
25
2015 2016 2017 2018
Cummulative installed capacity (MW)
© Bloomberg Finance L.P.2019
No portion of this document may be reproduced, scanned into an electronic system, distributed, publicly displayed or used as the basis of derivative works without the prior written consent of Bloomberg Finance L.P. For more information on terms of use, please contact [email protected]. Copyright and Disclaimer notice on page 63 applies throughout. 37
5.2. The role of power outages in Nigeria Power outages are the primary and dominant enabler of the C&I solar business in Nigeria. The developers interviewed by BNEF agreed unanimously that they can only be in business today because of the poor state of the nation’s electricity grid. This is most pronounced in rural areas, but also in cities such as Lagos or Abuja. Outages in Nigeria are unpredictable and range from four to 15 hours on average per day, across the country.
Therefore, C&I customers expect developers and EPC companies to provide them with a guarantee on total system reliability. Since almost all developers use a combination of solar, batteries, grid and diesel generators, most of them guarantee their systems will provide power for 98% or more of the time over the year. Meeting this requirement requires battery storage. Today, most systems use lead-acid batteries, but developers want to move to using lithium-ion batteries in the relatively near future.
The government had some success in boosting generation capacity, but transmission and distribution remain a bottleneck. No developer interviewed by BNEF believes that the grid will improve in the next three years. Most developers believe it will get worse and potentially collapse, and conclude that the future of power in Nigeria consists of decentralized power systems.
5.3. Market trends and segments Market participants estimate there was at least 20MW of C&I solar installed in Nigeria as of November 2018. The majority of this capacity is made up of very small projects. Sites over 30kW are estimated to add up to just 8.9MW.
In the large and densely populated cities such as Lagos, rooftop space is scarce and usually not sufficient, while land for ground-mounted installations is often too expensive. Industrial off-takers are often preferred because they have plentiful land for on-site solar installations. However, almost everybody is considered a potential customer, from banks, petrol stations, hotels, to schools and hospitals. The only exception for some developers are educational institutions, amid concerns that subsidies from REA's 'Energizing Education' program could make this segment unattractive.
As of November 2018, the largest reported C&I solar project in Nigeria was the 2.35MW Tulip Cocoa Processing Plant developed by Alfen BV, designed by Solarcentury, and built by Solarmate. Next is the 1.2MW Usuma Dam Solar Power Plant built by Japan International Cooperation Agency (JICA) in Abuja, followed by the 1MW project built by Enerwhere for Bayero University in Kano state.
The 12 developers interviewed by BloombergNEF for this study reported working on a pipeline of 49 to 55MW. Most of this pipeline is located in industrial areas where land is abundant.

© Bloomberg Finance L.P.2019
No portion of this document may be reproduced, scanned into an electronic system, distributed, publicly displayed or used as the basis of derivative works without the prior written consent of Bloomberg Finance L.P. For more information on terms of use, please contact [email protected]. Copyright and Disclaimer notice on page 63 applies throughout. 38
Rural Electrification Agency initiatives
The Nigerian Rural Electrification Agency (REA) currently runs two programs supporting solar installations for public facilities or economic centers. Both programs are financed directly by the Federal Government of Nigeria.
(1) Energizing Education Program (EEP) – REA’s target is to provide 37 universities and seven hospitals with a total of 90MWp of solar. Phase one of the project consists of nine universities that will be using solar-battery-diesel-grid hybrid systems and have already been awarded. Metka will carry out the EPC for four universities and Sterling & Wilson will carry out the EPC for the remaining five.
(2) Energizing Economies Initiative (EEI) – The aim of the EEI is to increase energy access and economic growth by assisting private sector developers to provide clean, reliable and affordable power to economic clusters across Nigeria. These include markets, shopping complexes and agricultural or industrial clusters. All developers interested in the EEI must send the REA their business plan, financial model and energy audit.
5.4. Economics At about $0.10/kWh, C&I solar is already cheaper than grid electricity tariffs in Nigeria. Solar with a two-hour battery costs about $0.19/kWh. Vendors signing take-or-pay PPA's are charging between $0.12-0.20/kWh, which is cheaper than electricity from a diesel generator. Storage is critical to these operations, but also boosts the tariff they can charge.
Figure 31: Nigeria cost of C&I solar forecast versus 2018 electricity tariffs
Source: BloombergNEF
Flat-fee energy deals are common. About half of the developers interviewed for this study in Nigeria do not charge their customers on a per kWh basis, but rather a fixed fee per month. The fee varies significantly between projects, depending on the client’s needs and circumstances such
0.00
0.05
0.10
0.15
0.20
0.25
0.30
0.35
0.40
2019 2020 2021 2022 2023 2024 2025 2026 2027 2028 2029 2030
$/kWh
PV+storage PPA range Diesel cost range Cost of C&I solarCost of C&I solar+storage 2018 Commercial grid tariff 2018 Industrial grid tariff
Figure 30: Map of the REA’s EEP Projects
Source: REA.

© Bloomberg Finance L.P.2019
No portion of this document may be reproduced, scanned into an electronic system, distributed, publicly displayed or used as the basis of derivative works without the prior written consent of Bloomberg Finance L.P. For more information on terms of use, please contact [email protected]. Copyright and Disclaimer notice on page 63 applies throughout. 39
as the load profile. Vendors declined to disclose the cost per kWh. The installation and commercial offer is usually sized in a way that total energy costs are kept below the monthly electricity expense paid for the grid and diesel power prior to installing solar.
Most developers were reluctant to share information on IRRs achieved to date. Those that did said their numbers (which BNEF could not verify) ranged from 5% for their old projects to up to 20% for their newer projects, in naira terms.
Capex The capex range for C&I solar without storage in Nigeria typically falls between $1.10/W to $1.60/W.
The capex can reach up to $3.00/W when using the most reputable lithium-ion batteries. Storage is usually required in C&I solar projects in Nigeria, according to developers. It is impossible to guarantee minimum uptime and system performance without it, but these are the primary selling point for customers.
Most systems are built with a two-hour battery. Arnergy, a local developer, told BNEF that its 5kW solar hybrid system has a 10kWh lithium-ion battery, equivalent to about two hours of maximum power output. Similarly, Schneider Electric’s 700kW solar system in Lagos, built for 21 Century Technologies’ data centre, includes 1.4MWh of battery storage.
Because battery storage is included, the key components such as solar panels, inverters and batteries account for 85-90% of capex. For a typical solar installation, this figure is usually smaller. Solar modules are mostly sourced from China, from suppliers such as JinkoSolar for the higher quality Tier 1 panels. Lower quality Tier 2 panels also come from China, but developers have not disclosed the manufacturers of these panels.
Figure 32: Average C&I solar with energy storage capex breakdown
Source: BloombergNEF
20%
40%
15%
10%
15%
Capex breakdown (% of total capex)
PV modulesEnergy storageSmart invertersMounting structureEPC + balance of plant
Total$2.45/W

© Bloomberg Finance L.P.2019
No portion of this document may be reproduced, scanned into an electronic system, distributed, publicly displayed or used as the basis of derivative works without the prior written consent of Bloomberg Finance L.P. For more information on terms of use, please contact [email protected]. Copyright and Disclaimer notice on page 63 applies throughout. 40
5.5. Regulation Captive independent power producers in Nigeria with a generating capacity of over 1MW must hold a captive generation permit issued by the Nigerian Electricity Regulatory Commission (NERC). First-time offenders of this rule face a fine of 100,000 naira ($275) or as much as one year in prison. The permit is valid for five years with an application fee of 50,000 naira ($138), a permit fee of 200,000 naira ($550) for projects between 1-10MWp, and a fee of 50,000 naira for permit renewal. Renewal is guaranteed if the renewal fees are paid and all requirements are met, but the permit renewal application must be submitted at least three months before expiry. Captive generation for self-consumption of less than 1MW does not require a generation permit. If a PPA is involved between a developer and an offtaker, a generation licence is required, not a captive power permit.
If the C&I IPP plans to provide power to two or more neighboring businesses or residents, it needs to hold a mini-grid distribution licence, which supports mini-grids of between 100kW and 1MW. If the project exceeds 1MW of capacity and still wishes to provide power to neighbors, its operator needs to obtain an IEDN licence.
Table 4: Nigeria’s regulations related to C&I solar projects
Policy Description
Mini-Grid Regulation, 2016 100kW to 1MW
Isolated mini-grids need an agreement between the mini-grid operator and the community. If these projects have a mini-grid permit from NERC, then the distribution company is required to pay off the minigrid owner with 100% of the depreciated asset value (capex) plus one year of revenue, equalling the revenue the developer earned in the previous 12 months of operating the mini-grid. NERC has determined a depreciation schedule, but it has not yet been published. For mini-grids connected to the main grid, an agreement between the mini-grid operator, the community and the distribution company is required.
Independent Electricity Distribution Networks (IEDN) Regulation, 2012 1MW+
For any power project planning to distribute power above the 1MW threshold of the mini-grid regulation, the genco must hold an IEDN licence from NERC.
Permits for Captive Power Generation, 2008 1MW+
For any power project over 1MW in nameplate capacity, a captive generation permit is required from NERC. Developers consider the application process fairly straightforward, saying it takes approximately 4-6 months for the entire process. Key requirements include submitting audited financial statements, a completed environmental impact assessment with an approval from the Ministry of Environment (MoE), a building permit, a detailed business plan and payment of a licence fee of 250,000 Nigerian naira ($689) for projects between 1-10MW.
Application for Licences (Generation, Transmission, System Operations, Distribution & Trading), 2010 1MW+
For any power project over 1MW, to be able to transmit, distribute or generate power for sale (ie., a PPA is involved), the developer needs to apply for a generation license, which incurs a licence fee of $10,000 for projects between 1-10MW. The license and operating fees regulation details the fees involved in obtaining this generation licence. The application process timeline should not exceed six months according to NERC.
Eligible Customer Regulation, 2017 2MW+
Customers with energy demand of more than 2MWh/h per month can directly buy power from a grid-connected genco at a mutually agreed price.

© Bloomberg Finance L.P.2019
No portion of this document may be reproduced, scanned into an electronic system, distributed, publicly displayed or used as the basis of derivative works without the prior written consent of Bloomberg Finance L.P. For more information on terms of use, please contact [email protected]. Copyright and Disclaimer notice on page 63 applies throughout. 41
Source: NERC. Renewal is guaranteed if the renewal fees are paid and all requirements met (renewal form here: Application Form for Renewal of Permit for Captive Generation). Developers have informed us that once a licence is granted, renewal is pretty much guaranteed.
Import restrictions Solar modules with bypass diodes must pay a 5% import duty plus 5% VAT. There are also very high transaction costs for customs handling. Merchandise can often sit in the port for weeks, at a high cost to the importer. Developers also mentioned that there are often delays in evacuating merchandise from the port.
Batteries are taxed a total of 25%, broken up as 20% duty and 5% VAT. Some developers reported they also budget an additional 1-2% of the total value of goods as a “settlement fee” in order to clear the goods quickly.
The government’s efforts to encourage local solar module assembly are not working. The import duty on solar cells (without bypass diodes) is 0%, since the government is trying to encourage local assembly of solar modules. However, no developer BNEF spoke to has used locally assembled modules.
Table 5: Nigeria tariffs on solar and batteries
Code Official Description Interpretation Import Duty VAT Total
8419 - 191000
Solar water heaters Solar thermal (sunlight-to-heat).
5% 5%
8502 - 391000
Solar powered generator Solar module with a bypass diode.
5% 5%
8541 - 401000
Solar cells whether or not in modules or made up into panels
Solar module without a bypass diode.
0% 0%
8506 - 500000
Primary cells and primary batteries made of Lithium
Lithium-ion batteries. 20% 5% 25%
8507 - 100000
Lead acid, of a kind used for starting piston engines
Lead-acide batteries. 20% 5% 25%
Source: BloombergNEF, Nigeria Customs Service (NCS). Note: A bypass diode makes the solar module have a constant energy wavelength, without a diode, it does not have a constant energy wavelength and one cannot use it for power generation. But solar modules ship with bypass diodes included and therefore incur duty 8502.
5.6. Finance Commercial banks are largely absent from the C&I solar market, offering debt that developers consider too costly (eg., over 25%) and only for tenors up to two years. There is no project financing product available in Nigeria that lets vendors borrow against a cashflow stream. All local financing in Nigeria requires the developer to provide a physical asset as collateral. Lenders do not typically accept solar equipment as collateral and require borrowers to own real estate. As a result, developers are mostly financing projects through their own balance sheet, either in U.S. dollars, if they are a multinational corporation, or in naira in the case of local developers.

© Bloomberg Finance L.P.2019
No portion of this document may be reproduced, scanned into an electronic system, distributed, publicly displayed or used as the basis of derivative works without the prior written consent of Bloomberg Finance L.P. For more information on terms of use, please contact [email protected]. Copyright and Disclaimer notice on page 63 applies throughout. 42
The BOI C&I solar fund
The Bank of Industry operates a clean energy fund with some 6 billion naira ($6.5 million) where an end-user or developer can secure a loan of up to 350 million naira, equivalent to $960,000 per customer (and not per project). This is enough to build a 1MW solar power plant or a 400kW solar+storage installation.
As of year-end 2018, this is the only source of naira financing for C&I solar that is considered affordable by solar developers in Nigeria. BOI typically offers a maximum loan-to-value of 80% of capex to borrowers. BOI only dispersed funds for rural mini-grids and had not yet disbursed any money for C&I solar projects as of November 2018, although some projects had already been approved. This is because it has been challenging for developers to provide collateral that meets stringent lending criteria of BOI who follows International Financial Reporting Standards (IFRS).
The effective rate (with all fees) is estimated at about 10%, far cheaper than alternative sources of naira financing. The advertised rate for BOI financing from the N6 Billion Solar Energy Fund is 9%, one percentage point below the rate for standard BOI loans. The tenor is up to five years. There is an additional appraisal and commitment fee charged at a total of 2% of total loan value, and also a monitoring fee of 0.125% per quarter on the outstanding balance.
BOI representatives informed BloombergNEF that the fund will be replenished as it runs out.
Currency risks Developers in Nigeria rarely hedge currency risks. The available hedging instruments are considered too costly, making the business case for C&I solar unviable. This favors local players whose business is denominated in naira. Foreign EPCs told BNEF the strategy is to build and finish projects as quickly as possible to reduce political risk.
Between 2014 and 2018 the official naira exchange rate has depreciated by over 41% (Figure 33). In 2018, almost 90% of Nigeria’s exports earnings were from the sales of crude oil and processed oils, so given the economies heavy dependence on oil exports, the weaking of the naira was directly linked to the drop in global oil prices. Given this history, investors are extremely cautious, particularly when taking on U.S. dollar financing.
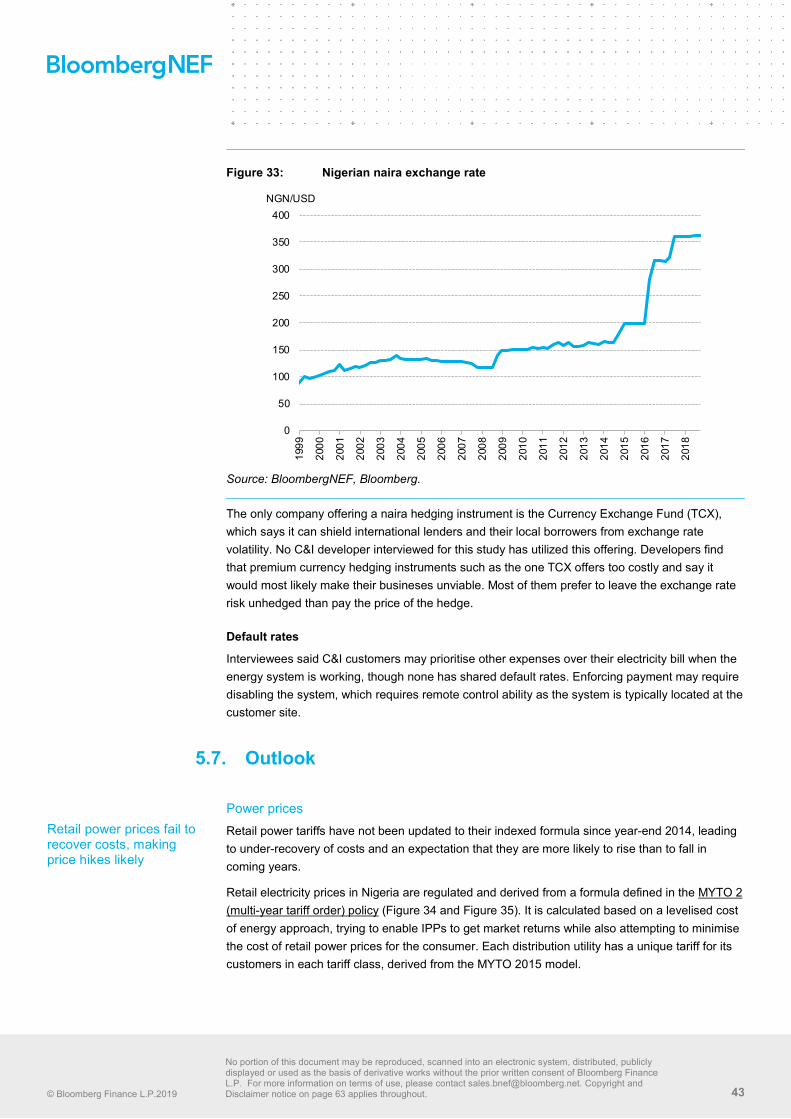
© Bloomberg Finance L.P.2019
No portion of this document may be reproduced, scanned into an electronic system, distributed, publicly displayed or used as the basis of derivative works without the prior written consent of Bloomberg Finance L.P. For more information on terms of use, please contact [email protected]. Copyright and Disclaimer notice on page 63 applies throughout. 43
Figure 33: Nigerian naira exchange rate
Source: BloombergNEF, Bloomberg.
The only company offering a naira hedging instrument is the Currency Exchange Fund (TCX), which says it can shield international lenders and their local borrowers from exchange rate volatility. No C&I developer interviewed for this study has utilized this offering. Developers find that premium currency hedging instruments such as the one TCX offers too costly and say it would most likely make their busineses unviable. Most of them prefer to leave the exchange rate risk unhedged than pay the price of the hedge.
Default rates
Interviewees said C&I customers may prioritise other expenses over their electricity bill when the energy system is working, though none has shared default rates. Enforcing payment may require disabling the system, which requires remote control ability as the system is typically located at the customer site.
5.7. Outlook
Power prices Retail power tariffs have not been updated to their indexed formula since year-end 2014, leading to under-recovery of costs and an expectation that they are more likely to rise than to fall in coming years.
Retail electricity prices in Nigeria are regulated and derived from a formula defined in the MYTO 2 (multi-year tariff order) policy (Figure 34 and Figure 35). It is calculated based on a levelised cost of energy approach, trying to enable IPPs to get market returns while also attempting to minimise the cost of retail power prices for the consumer. Each distribution utility has a unique tariff for its customers in each tariff class, derived from the MYTO 2015 model.
0
50
100
150
200
250
300
350
400
1999
2000
2001
2002
2003
2004
2005
2006
2007
2008
2009
2010
2011
2012
2013
2014
2015
2016
2017
2018
NGN/USD
Retail power prices fail to recover costs, making price hikes likely

© Bloomberg Finance L.P.2019
No portion of this document may be reproduced, scanned into an electronic system, distributed, publicly displayed or used as the basis of derivative works without the prior written consent of Bloomberg Finance L.P. For more information on terms of use, please contact [email protected]. Copyright and Disclaimer notice on page 63 applies throughout. 44
Figure 34: Nigeria retail power prices
Source: NERC, MYTO 2015 model. Note: The “special” category includes public services such as water boards, religious or educational facilities, government buildings and agriculture. The exchange rate is fixed beyond 2018.
Figure 35: Nigeria retail power price by state
Source: NERC, MYTO 2015 model.
Retail power prices are officially supposed to have a minor review every six months, with a major review every five years. However, the current tariffs have not been reviewed since year-end 2014 and therefore are outdated.
Nigerians have expressed discontent with the implementation of the MYTO 2 tariffs. Some commercial and residential consumers are groaning under huge estimated bills, never-ending power outages, lack of prepaid meters and ageing equipment, which have been associated with the distributors’ neglect of the electricity sector.
Hospitals, universities and other public institutions are subsidized and pay lower tariffs.
Power demand Some two thirds of electricity in Nigeria is currently provided by diesel and petrol generator sets, according to government data. Power demand as normally measured through utility electricity sales is therefore almost irrelevant, as most electricity is not bought from a utility. Nigeria targets a generating capacity of 30GW of power by 2030, of which 30% is expected to be renewable.
05,000
10,00015,00020,00025,00030,00035,00040,00045,000
2015 2016 2017 2018 2019 2020 2021 2022 2023 2024
Electricity price (NGN/MWh)
Commercial Industrial Special
0
20
40
60
80
100
120
140
160
2015 2016 2017 2018 2019 2020 2021 2022 2023 2024
Electricity price ($/MWh)
Commercial Industrial Special
0
10,000
20,000
30,000
40,000
50,000
60,000
2015 2016 2017 2018 2019 2020 2021 2022 2023 2024
Electricity price (NGN/MWh)
0
20
40
60
80
100
120
140
160
2015 2016 2017 2018 2019 2020 2021 2022 2023 2024
Electricity price ($/MWh) Abuja
Benin
Enugu
Ibadan
Jos
Kaduna
Kano
Ikeja
PortHarcourtEko
Yola

© Bloomberg Finance L.P.2019
No portion of this document may be reproduced, scanned into an electronic system, distributed, publicly displayed or used as the basis of derivative works without the prior written consent of Bloomberg Finance L.P. For more information on terms of use, please contact [email protected]. Copyright and Disclaimer notice on page 63 applies throughout. 45
Additionally, by 2030, Nigeria plans to have 5.3GW of mini-grids and 2.8GW of solar home systems, up from 1MW and 30MW in 2015, respectively.
Power outages are likely to remain a part of daily life across much of the region. More power generation capacity will not necessarily improve the power supply for businesses, because the transmission and distribution network is too weak to deliver more power and network reforms are even further behind than efforts to boost generation capacity.
There are some 32,600 commercial and 63,100 industrial tariff payers in Nigeria, consuming just over 5.5TWh and 2.1TWh per year, respectively, according to data from the Nigerian Electricity Regulatory Commission.
Figure 36: Nigeria's 2030 target generation mix forecast
Figure 37: Nigeria power demand
Source: Nigerian Federal Ministry of Power - Nigeria Vision 30:30:30 energy target. This is the annual average generation per hour (GWh/h) and not the installed capacity - a figure more widely used in Nigeria, given its installed capacity figure can be misleading.
Source: BloombergNEF. Note: Consumption estimated from NERC, World Bank and IEA data. Special refers to customers such as agriculture and agro-allied industries, water boards, religious houses, government and teaching hospitals, government research institutes and educational establishments.
5.8. Barriers to C&I solar in Nigeria Most of the major barriers to more C&I solar in Nigeria are financial, from debt availability to credit risk and foreign exchange hedges. Many developers in Nigeria told BNEF they wish that import tariffs would be reduced.
Currency convertibly risks
Revenue for C&I solar projects is always in naira7. International developers need to convert this to foreign currency. The CBN allocates U.S. dollars to local banks but applies restrictions on converting Nigerian naira into U.S. dollars. This is a huge risk, particularly if a company holds U.S. dollar debt.
7 Only PPAs for utility-scale solar projects signed with Nigerian Bulk Electricity Trading (NBET) are
denominated in the U.S. dollars, but the payments are still in naira.
0%
20%
40%
60%
80%
100%
Today 2030
Wind OnshoreSolar ThermalBiomass & WasteSmall HydroNuclearSolar PV (home/street)CoalLarge HydroDiesel/Petrol GensetsSolar PV (utility)Mini-gridsGas 0
2,000
4,000
6,000
8,000
10,000
12,000
14,000
2012 2013 2014 2015 2016 2017 2018
Power consumption (GWh/Year)
Commercial Industrial Special

© Bloomberg Finance L.P.2019
No portion of this document may be reproduced, scanned into an electronic system, distributed, publicly displayed or used as the basis of derivative works without the prior written consent of Bloomberg Finance L.P. For more information on terms of use, please contact [email protected]. Copyright and Disclaimer notice on page 63 applies throughout. 46
Battery replacements
Batteries must typically be replaced after 3-10 years of operation. These costs occur in U.S. dollars, whereas project revenue is in naira. If left unhedged, the battery replacement can significantly reduce project returns if the naira depreciates.
Credit risk
Developers reduce credit risk by installing advanced management systems to enable them to remotely cut off systems for non-paying customers.
Figure 38: Reform wishes by Nigerian C&I solar developers
Source: BloombergNEF
100%
33%
25%
17%
8%
8%
Remove duties at ports
Cost-reflective grid tariffs
Increase 1MW captive-genco license
Clean energy priority at ports
Tax reductions
CBN intervention fund
Most desired regulatory reform (% of particpants)

© Bloomberg Finance L.P.2019
No portion of this document may be reproduced, scanned into an electronic system, distributed, publicly displayed or used as the basis of derivative works without the prior written consent of Bloomberg Finance L.P. For more information on terms of use, please contact [email protected]. Copyright and Disclaimer notice on page 63 applies throughout. 47
Section 6. In-depth findings from Ghana With just 7MW of C&I solar capacity installed as of October 2018, Ghana is the smallest of the three markets studied in depth for this report. Its strong pipeline, high electricity prices and large mining sector mean it could become the fastest growing market. The six installers interviewed by BNEF in Ghana are working on a pipeline of 32MW of C&I solar capacity for delivery in the next two years, with several MW-scale projects in advanced stages.
6.1. Summary Electricity for both commercial and industrial facilities in Ghana costs more than anywhere else in Sub-Saharan Africa. The reasons for this is that the government solved a power reliability crisis by contracting expensive but rapidly available power plants. Electricity supply is now a lot more reliable, but at a steep cost.
Ghana has increased its thermal generation capacity rapidly since 2010, exceeding the pace of power demand growth. Electricity tariffs rose sharply before 2016, when power generation capacity was ramped up. In March 2018, the government made a political decision to cut tariffs by 18-30%.
Projects for commercial buyers dominate Ghana’s market, but the industrial sector holds more growth potential in the long run. Power demand in that segment is growing faster, and solar offers a better deal because industrial tariffs are higher than those for commercial facilities.The current benchmark C&I solar cost is $0.11/kWh, which is some 53% and 25% below today’s average commercial and industrial tariffs, respectively. Even if the government cuts the tariff by 30%, solar will still be competitive. BNEF expects that the cost of C&I solar will decline to $0.05/kWh by 2030.
6.2. The role of power outages Although power supply reliability issues still remain, C&I solar customers use solar primarily to save on their energy bills and, in the case of some multinationals, to comply with self-imposed sustainability targets, according to C&I solar installers and buyers interviewed by BNEF. Overall, electricity supply from the Ghanaian grid has improved significantly across the country in the last four years. Grid outages can still occasionally challenge factories, but they are not a dominant concern today. The distribution infrastructure is likely to improve as the U.S. government is currently supporting the Electricity Co. of Ghana (ECG) to identify outage locations and causes, and reduce outage frequency and duration.
The reported frequency of interruptions has increased across the country from 2015 to 2017, according to Energy Commission’s data (Figure 39). The average duration of interruptions declined from 2015 to 2017 in the southern part of Ghana, which is served by ECG. In the northern part of the country, where the Northern Electricity Distribution Co. (NEDCo) supplies electricity, an increase in power outages was recorded from 2016 to 2017 (Figure 40).

© Bloomberg Finance L.P.2019
No portion of this document may be reproduced, scanned into an electronic system, distributed, publicly displayed or used as the basis of derivative works without the prior written consent of Bloomberg Finance L.P. For more information on terms of use, please contact [email protected]. Copyright and Disclaimer notice on page 63 applies throughout. 48
Figure 39: SAIFI in Ghana’s metro areas Figure 40: SAIDI in Ghana’s metro areas
Source: BloombergNEF, Energy Commission. Note: System Average Interruption Frequency Index (SAIFI) is a measure of the number of times a customer is interrupted during an operational year. System Average Interruption Duration Index (SAIDI) is a measure of the average duration of interruptions recorded for the distribution system during an operational year.
Since the distribution companies rarely provide any warnings regarding when and where outages will occur, businesses need to prepare for sudden disruptions and secure diesel generators as backup. The quality of power is also a challenge, with manufacturers concerned that voltage fluctuations can harm their equipment.
6.3. Market trends and segmentation The 7MW of C&I solar projects commissioned by November 2018 were mostly installed in 2017 and 2018 (Figure 41). Most of this capacity is hosted by facilities with a well functioning grid connection, highlighting that cost savings are the primary market driver, not resilience. All of these projects were smaller than 1MW.
Customer awareness of solar as an option to reduce C&I energy costs is still very low, though local installers say it is rising. Most market activity to date focuses on small-scale commercial projects, but developers see the most promise in projects for industrial clients, which tend to be larger than 500kW.
Ghanaian developers and EPC companies target a wide variety of C&I clients, from office buildings, banks, schools, hotels, factories and cold storage facilities to mines. The majority of projects are on sites with a good connection to the grid. The installed base is concentrated in the business hubs of Accra and Tema. The largest project BNEF has tracked is the 565kW for Cargill’s cocoa factory in Tema. Ghana hosts regional hubs of several multinationals, some of whom seek to comply with self-imposed clean energy targets. For instance, Cargill targets 18% renewable energy in its power consumption by 2020. This has created additional demand for C&I solar in the country.
The market is likely to continue the steep growth trajectory from a small base in the coming years. Five leading developers interviewed by BNEF plan to build some 32MW in total in the coming years, with several multi-MW projects already in advanced development stages. One installer told BNEF three projects with a capacity of about 1MW each are already under construction.
As a result, the C&I solar vendors interviewed by BNEF in October 2018 were optimistic about growth prospects. The market is less competitive than in places with a larger C&I solar market such as Nigeria and Kenya. There are only a handful of experienced installers. Local content
020406080
100120140
2015 2016 2017
SAIFI
0
50
100
150
200
2015 2016 2017
SAIDI
ECG NEDCo
Economics and sustainability are the main drivers for solar in Ghana.

© Bloomberg Finance L.P.2019
No portion of this document may be reproduced, scanned into an electronic system, distributed, publicly displayed or used as the basis of derivative works without the prior written consent of Bloomberg Finance L.P. For more information on terms of use, please contact [email protected]. Copyright and Disclaimer notice on page 63 applies throughout. 49
rules and a lack of financing options for C&I solar could also provide an advantage to more established players.
Figure 41: Ghana C&I solar installed capacity
Source: BloombergNEF. Notes: Data as of the end of October. The sky blue is cumulative installed capacity of projects larger than 30kW that BNEF identified. The dotted box is the gap between the tracked projects and total installed capacity that developers reported, the commissioning year of which is unknown.
6.4. Economics Solar is already competitive with grid electricity tariffs, even after the major tariff reduction in March 2018. BNEF projects that the cost of C&I solar will decline from $0.11/kWh in 2019 to $0.05/kWh in 2030, due to an expected continuation of the fall in PV module and inverter manufacturing costs. That means solar can remain competitive even if grid tariffs fall further. Installers in Ghana target equity IRRs of 12% to 25% in their projects in local currency.
Figure 42: Cost of C&I solar forecast versus 2018 electricity tariffs
Source: BloombergNEF, Public Utilities Regulatory Commission. Note: The capacity factor for solar is assumed at 18.2%.
0
1
2
3
4
5
6
7
8
2013 2014 2015 2016 2017 2018
Installed Capacity (MW)
0.00
0.05
0.10
0.15
0.20
0.25
0.30
2019 2020 2021 2022 2023 2024 2025 2026 2027 2028 2029 2030
$/kWh
Cost of C&I solar 2018 commercial grid tariff 2018 industrial grid tariff

© Bloomberg Finance L.P.2019
No portion of this document may be reproduced, scanned into an electronic system, distributed, publicly displayed or used as the basis of derivative works without the prior written consent of Bloomberg Finance L.P. For more information on terms of use, please contact [email protected]. Copyright and Disclaimer notice on page 63 applies throughout. 50
Capex The capex for C&I solar installations in Ghana in November 2018 ranged from $0.75/W to $1.50/W according to local installers, with most projects paying about $1/W. This is lower than BNEF’s global benchmark capex for solar projects of less than 1MW. Developers and EPC companies generally use tier 1 solar modules, which they said were bought for $0.34-0.59/W in November 2018. Solar modules are eligible for exemptions on import duties and VAT. Other solar components are supposed to be exempt on paper, but developers told BNEF that they must arrive at customs together with solar modules to benefit from the tax incentive. Otherwise, a 5% import duty is applied to inverters. Additionally, importers need to pay 17.5% VAT. Developers told BNEF that tax officers sometimes apply different charges to the same equipment.
Transportation of equipment is not really an issue as Ghana has relatively good road infrastructure and most of the projects are in Accra anyway.
Battery storage Battery storage is generally not economically viable in Ghana’s C&I solar projects, nor is it usually necessary because grid electricity is generally available and reliable enough. BNEF identified just one grid-connected project for a hotel customer that included energy storage.
6.5. Regulation Ghana has import tax and VAT exemptions for solar modules, and diesel prices are cost reflective. These are positive factors for the economics of on-site solar. However, the country’s regulatory barriers may become a major concern for developers, especially foreign new entrants. The local content and participation rules make it challenging to join the market, and may even prevent solar projects being built given the lack of a local supply chain, which forces developers to rely on ad-hoc exemptions. The regulatory approval process also requires several permits to be submitted in sequence, allowing the authority up to 60 days to review each one. Developers told BNEF that approval has taken longer in reality.
Tax exemption
The import duty exemption for solar equipment is inconsistently applied, according to importers interviewed by BNEF.
Net metering
The Electricity Company of Ghana (ECG) piloted a net metering program in 2016 and estimated its impacts to revenue. As a result, the government put the net metering proposal on hold. The local solar industry continues to lobby for the law, but it is not clear whether and when it will be implemented. If implemented, the government may set a cap on how much solar can be fed into the the grid to protect the Electricity Company of Ghana (ECG).
Licence requirements
A wholesale supplier licence is required to sell electricity to a bulk customer through a PPA. Only ECG, NEDCo and Enclave are currently allowed to sell electricity without a PPA. Some 130 entities are registered as wholesale suppliers according to the Energy Commission, including several C&I solar companies. However, acquiring the licence is considered complicated, slow and unpredictable.

© Bloomberg Finance L.P.2019
No portion of this document may be reproduced, scanned into an electronic system, distributed, publicly displayed or used as the basis of derivative works without the prior written consent of Bloomberg Finance L.P. For more information on terms of use, please contact [email protected]. Copyright and Disclaimer notice on page 63 applies throughout. 51
To acquire a wholesale supplier licence, a developer is required to obtain three licences for each project – a provisional licence, construction permit, and authorization to operate – in sequence. Besides, acquiring a construction permit requires a fire certificate from the Ghana National Fire Service and a permit from the Environmental Protection Agency. The Energy Commission’s Board of Directors approves each of the licence applications separately.
Statutes foresee that the regulator replies to each licence request within 60 days, although one developer told BNEF that the authority exceeded that time period.
The Energy Commission says a captive generation licence is required to provide captive generation of more than 1MW. BNEF understands that such a licence could technically enable a licence holder to sell power to another entity, allowing one company to own the power asset and sell output to the host. However, C&I solar installers reported that it is difficult and time consuming to acquire the licence. The regulation does not set rules for installations smaller than 1MW.
Only three companies – ECG, NEDCo, and Enclave – have a distribution licence, and they can distribute electricity without discrimination to customers within their designated area. None of them has commissioned on-site solar projects to date.
Local content and participation
The government enacted the Local Content and Local Participation Regulations (LI 2354) for the electricity supply industry, including the renewable energy sector, in early 2018. The Energy Commission says “businesses operating, or planning to operate in Ghana’s electricity supply industry have to comply with designated percentages of utilization of Ghanaian human and material resources, services and businesses in monetary terms for the systematic development of national capacity and capability of indigenes”.
In the wholesale power supply sector, the regulation requires local ownership of at least 15% of any Ghanaian company. This share will be increased to 51% in 10 years. The rules allow companies that were active in Ghana’s electricity market prior to November 2017 to receive exemptions from the requirements. Foreign companies are therefore likely to require local partners in order to enter Ghana’s market.
The regulation also stipulates initial and target levels of local content by value-chain component. For instance, in engineering and procurement, it requires that a minimum of 60% of the value of the project must go to Ghanaian companies initially. This share will be increased to 100% within 10 years. Besides, electrical equipment and building materials must be sourced locally – 50% for solar panels, 50% for inverters and 100% for cables. It targets 80-100% of local content for all the equipment needed for an on-site solar project by 2025. Because the majority of the equipment for solar projects is not available from domestic production, it may not be feasible to build solar projects under this regulation. Ad-hoc exemptions from these rules could be available, but of course make the project approval process more complex and less predictable.
6.6. Finance In October 2018, responsAbility Investments AG announced a debt financing of $4 million for Redavia. But, overall, direct purchase of solar equipment has dominated Ghana’s C&I solar market to date. Local developers that BNEF interviewed said projects with a financing option are slowly gaining traction because the upfront cost is high for many potential customers. Customers are often skeptical about solar as a technology and local local banks have been absent from the

© Bloomberg Finance L.P.2019
No portion of this document may be reproduced, scanned into an electronic system, distributed, publicly displayed or used as the basis of derivative works without the prior written consent of Bloomberg Finance L.P. For more information on terms of use, please contact [email protected]. Copyright and Disclaimer notice on page 63 applies throughout. 52
C&I solar market so far. The Ghanaian cedi has declined in value relative to the U.S. dollar in recent years, suggesting that hedging foreign exchange risk is critical (Figure 43).
While local banks have been absent from the C&I solar market to date, developers suggested they could play a role even without offering long tenors. That is because shorter term financing options can accelerate the C&I solar business in an early-stage market by easing customers’ quality concerns. One local player structures deals so that customers pay just 50% of the upfront cost to see how the solar system performs in the first 90 days of operation. The remainder becomes payable only at this point.
Figure 43: Ghana cedi exchange rate
Source: BloombergNEF, Bloomberg
Local banks Ghana has 31 licensed banks, and none of them appear to be lending to C&I solar. According to the C&I solar developers interviewed, local banks do not offer long-term tenors, and the cost of debt is around 30% for cedi loans.
Foreign exchange Ghanaian law requires all invoices to be in quoted in cedi unless one is licensed by the Bank of Ghana to receive or pay in any foreign currency. However, many C&I solar customers in Ghana prefer to have prices indexed to U.S. dollars, particularly if their revenue is in foreign currency. The indexing structures are negotiatied differently, with some contracts apparently sharing the foreign exchange risk between solar developer and offtaker through rate caps and floors.
Default rates Local developers have not yet classified any customer as having defaulted on a contract, though some late payments have been registered. Developers did not share more detailed figures.
0
1
2
3
4
5
6
2014 2015 2016 2017 2018
GHS/USD

© Bloomberg Finance L.P.2019
No portion of this document may be reproduced, scanned into an electronic system, distributed, publicly displayed or used as the basis of derivative works without the prior written consent of Bloomberg Finance L.P. For more information on terms of use, please contact [email protected]. Copyright and Disclaimer notice on page 63 applies throughout. 53
6.7. Outlook
Developers expect that industrials will become the primary segment for C&I solar in Ghana, due to their large and growing power demand and the high grid electricity tariffs they are being charged. Ghana’s industrial load increased by 5.3% per year on average from 2008 to 2017 (Figure 44).
The heaviest power consumers in Ghana are the 47 companies registered as bulk customers (as of November 13, 2018). These entities have a peak demand of at least 500 KVA for a consecutive period of three months or a minimum annual energy consumption of 1GWh, likely making them attractive targets for multi-MW C&I solar projects.
Many of these are concentrated in the Tema Export Processing Zones, which is authorized by the government to promote industrial activities. Further growth could come from the government’s "One District, One Factory" initiative which aims at building 50-65 factories per year from 2017 to 2020, though this initiative is already behind schedule.
The extractive industry is likely to be another coveted target for C&I solar players. It is dominated by gold miners and accounts for about 10% of the total power demand in the country. Eleven gold mines in the country are grid-connected, of which six also use diesel generators, according to the World Bank Group. Newmont Mining Corp. in September 2018 announced it had deployed an unspecificed amount of solar modules at its Aykem mine in Eastern Ghana. It has used redeployable solar that can add flexibility and allow the parties to sign contracts with a shorter duration.
Figure 44: Historical annual grid electricity consumption in Ghana
Source: BloombergNEF, Energy Commission. Note: Data do not include transmission and distribution (commercial and technical) losses.
Power prices Ghana’s grid electricity tariffs are still high despite a 18-30% cut in Ghanaian cedi in March 2018 (Figure 45). The risk for the C&I solar sector is that the government could cut the tariffs again, eliminating the cost savings from solar. There is popular demand for further tariff cuts, but these would require an even higher level of energy subsidies. A volatile cedi and the high costs of the
0
2,000
4,000
6,000
8,000
10,000
12,000
2008 2009 2010 2011 2012 2013 2014 2015 2016 2017
Electricity sales (GWh)
Residential Commercial Industrial Street lighting

© Bloomberg Finance L.P.2019
No portion of this document may be reproduced, scanned into an electronic system, distributed, publicly displayed or used as the basis of derivative works without the prior written consent of Bloomberg Finance L.P. For more information on terms of use, please contact [email protected]. Copyright and Disclaimer notice on page 63 applies throughout. 54
rapidly installed power generation capacity will require keeping tariffs elevated for years in order to recover costs.
The cedi has steadily depreciated against the dollar in recent years, falling 9% from January to November 2018 alone. The weaker local currency translated into a direct cost increase for fuels used in power generation.
The average surplus generation capacity was 887MW in 2018. Rate payers need to pay for the idled power plants. Ghana’s thermal power capacity increased from 990MW in 2010 to 2,796MW in 2017, while peak demand only increased by 46% to 2,192MW during the same period. Paying for this excess capacity is costly. The former government signed deals with a Dubai-based energy company, Africa Middle East Resources Investment Group (Ameri), to buy electricity at a very high price when the country faced severe power shortages in 2015. The deal with Ameri totalled $510 million for a 250MW gas power plant.
Figure 45: Grid electricity tariffs for C&I customers in Ghana
Source: BloombergNEF, Climatescope.
0
200
400
600
800
1,000
1,200
1,400
1,600
1,800
2010 2011 2012 2013 2014 2015 2016 2017 2018
Electricity price (GHS/MWh)
Average commercial tariff Average industrial tariff
0
100
200
300
400
500
600
700
2010 2011 2012 2013 2014 2015 2016 2017 2018
Electricity price ($/MWh)
Average commercial tariff Average industrial tariff

© Bloomberg Finance L.P.2019
No portion of this document may be reproduced, scanned into an electronic system, distributed, publicly displayed or used as the basis of derivative works without the prior written consent of Bloomberg Finance L.P. For more information on terms of use, please contact [email protected]. Copyright and Disclaimer notice on page 63 applies throughout. 55
Appendix A. Methodology Using a list of 15 countries and dozens of indicators, BNEF ranked countries on three broad criteria. The first measured whether C&I solar is likely to be economically viable, the second assessed the suitability fo the regulatory environment, and the last considered market momentum by measuring activity in the markets for on-site solar. This ranking was then reviewed by BNEF analysts to confirm whether the country could be considered a viable market for C&I solar. BNEF researchers then visited Kenya, Ghana and Nigeria during October 2018 for the purpose of this study.
Figure 46: Country selection process
Source: BloombergNEF
A.1. Regulatory environment BNEF used data from the Climatescope index to assess the regulatory environment in each market. Climatescope assigns a ranking of “Yes/Somewhat/No” to regulatory and other qualitative indicators. BNEF included eight such indicators that are relevant to C&I solar, from taxation on solar equipment to the availability of net metering or feed-in tariffs. Based on this assessment, Tanzania, Nigeria and Zambia have the friendliest environment. Rwanda, Uganda, and Kenya also scored high. All the East African countries implement tax incentives for solar equipment.
EconomicsElectricity tariffs, electrical outages, diesel generator
market, cost of on-site solar
MomentumPV imports from China,
addressable market size, power consumption, players
and projects
RegulationsExistence of regulation for C&I solar, impacts of the
regulations, policy volatility
BNEF research and data Analyzing where the opportunities exist for C&I solar
Climatescopeproject
Desk research
Where on-site solar would be the cheaper option than the grid and/or diesel?
Which countries have C&I solar friendly regulations? Which countries have barriers for C&I solar?
Where are active markets for C&I solar?
Background of current status of the solar market in Sub-
Saharan Africa
+
+
Clean energy market trends in Sub-Saharan Africa
Shortlist for further
analysis
Kenya, Ghana and Nigeria were
shortlisted for in-depth research
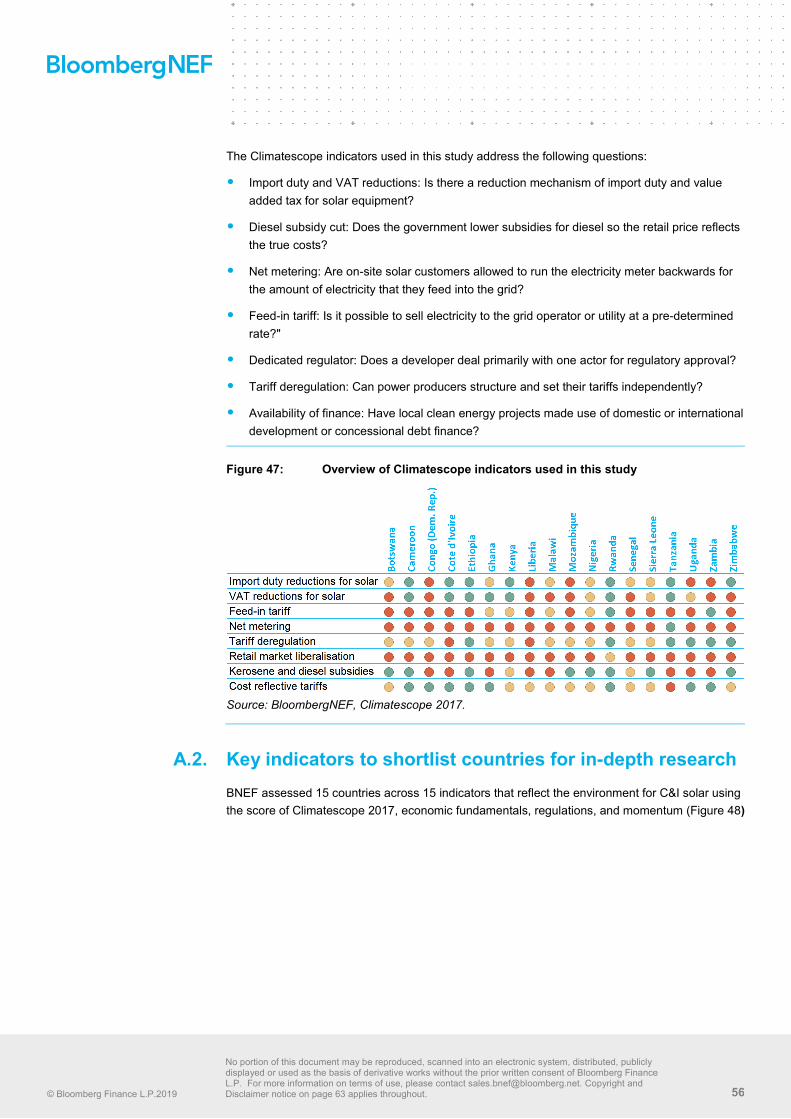
© Bloomberg Finance L.P.2019
No portion of this document may be reproduced, scanned into an electronic system, distributed, publicly displayed or used as the basis of derivative works without the prior written consent of Bloomberg Finance L.P. For more information on terms of use, please contact [email protected]. Copyright and Disclaimer notice on page 63 applies throughout. 56
The Climatescope indicators used in this study address the following questions: • Import duty and VAT reductions: Is there a reduction mechanism of import duty and value
added tax for solar equipment? • Diesel subsidy cut: Does the government lower subsidies for diesel so the retail price reflects
the true costs? • Net metering: Are on-site solar customers allowed to run the electricity meter backwards for
the amount of electricity that they feed into the grid? • Feed-in tariff: Is it possible to sell electricity to the grid operator or utility at a pre-determined
rate?" • Dedicated regulator: Does a developer deal primarily with one actor for regulatory approval? • Tariff deregulation: Can power producers structure and set their tariffs independently? • Availability of finance: Have local clean energy projects made use of domestic or international
development or concessional debt finance?
Figure 47: Overview of Climatescope indicators used in this study
Source: BloombergNEF, Climatescope 2017.
A.2. Key indicators to shortlist countries for in-depth research BNEF assessed 15 countries across 15 indicators that reflect the environment for C&I solar using the score of Climatescope 2017, economic fundamentals, regulations, and momentum (Figure 48)

© Bloomberg Finance L.P.2019
No portion of this document may be reproduced, scanned into an electronic system, distributed, publicly displayed or used as the basis of derivative works without the prior written consent of Bloomberg Finance L.P. For more information on terms of use, please contact [email protected]. Copyright and Disclaimer notice on page 63 applies throughout. 57
Figure 48: Indicators of 15 countries
Source: BloombergNEF, Climatescope 2017, World Bank, Sinoimex, PGS Consulting, IEA. Note: The Climatescope score ranged from 0.21 for Turkmenistan to 2.52 for China in 2017 (link).
Nig
eria
Keny
a
Rw
anda
Gha
na
Uga
nda
Sene
gal
Ethi
opia
Zam
bia
Zim
babw
e
Cot
e d'
Ivoi
re
Cam
eroo
n
DR
C
Tanz
ania
Moz
ambi
que
Bots
wan
a
Climatescope (2017 overall score)1.3 1.9 1.6 1.2 1.5 1.7 1.2 1.0 0.8 0.9 1.0 0.6 1.3 0.8 1.0
Is C&I solar economically viable?Yes Yes Yes Yes Yes Yes No No No No Yes No No No No
Industrial tariff ($/MWh, 2016)137 126 99 239 104 248 21 40 87 150 120 57 72 44 76
Commercial tariff ($/MWh, 2016)143 137 228 415 168 255 31 37 105 192 126 110 89 105 75
Power Generation (GWh, 2016 Historical) 30,018 9,900 654 12,919 3,793 3,580 11,915 11,346 5,968 8,202 7,117 9,260 6,789 18,045 2,653 Commercial and public buildings power demand (GWh, 2015) 6,548 1,153 - 2,066 - 867 2,227 716 1,105 2,092 1,340 - 1,181 702 791 Industrial power demand (GWh, 2015) 4,165 4,229 - 4,144 - 939 2,802 6,860 2,524 1,865 3,198 - 1,362 1,787 1,462 Sales loss due to electrical outages (%) 16% 7% 3% 16% 11% 3% 7% 8% 6% 5% 10% 8% 15% 2% N/AProject size threshold for licence exemptions (kW) 1,000 1,000 50 100 2,000 - 100 100 100 - - 50 100 - 100 PV shipment from China (MW estimated, 2015-1H 2018) 149 180 2 126 52 145 9 16 12 13 9 21 125 27 3 Diesel generator imports (MW estimated, 2017) 2,534 426 17 173 29 129 265 69 61 - 95 - - 60 6 Clean energy financing since 2010 ($m) 490 3,789 496 50 428 517 1,436 398 450 149 54 - 48 76 8
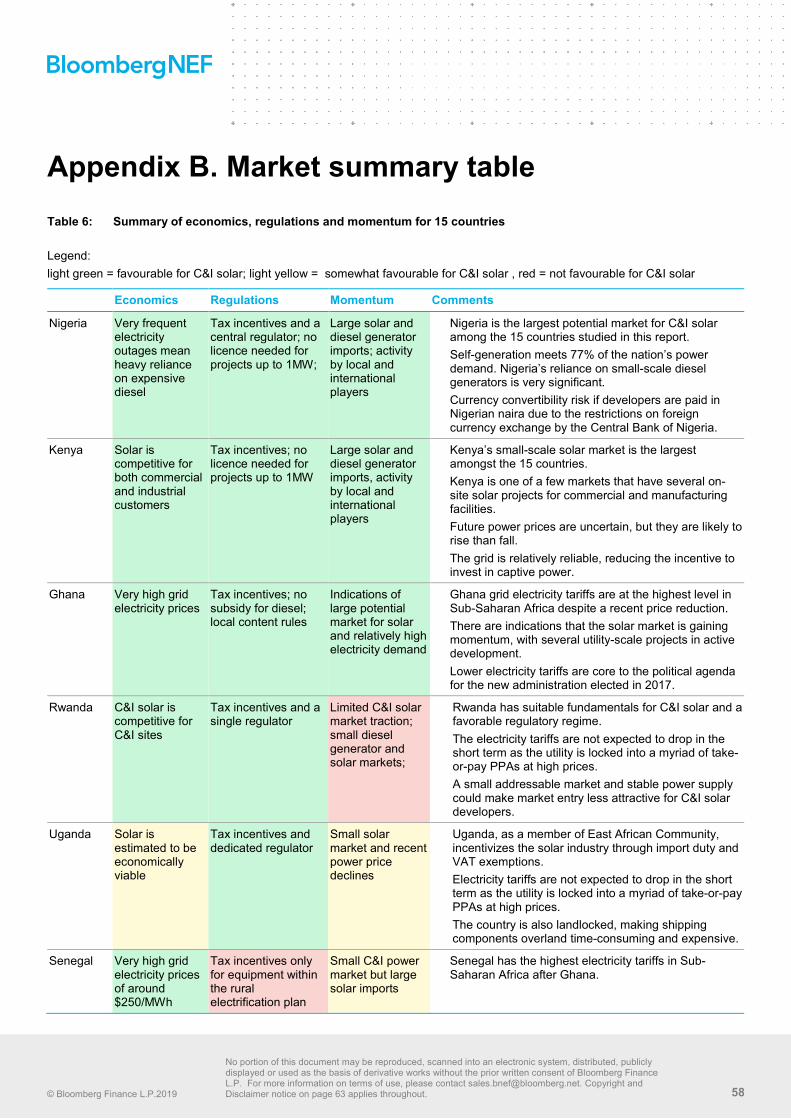
© Bloomberg Finance L.P.2019
No portion of this document may be reproduced, scanned into an electronic system, distributed, publicly displayed or used as the basis of derivative works without the prior written consent of Bloomberg Finance L.P. For more information on terms of use, please contact [email protected]. Copyright and Disclaimer notice on page 63 applies throughout. 58
Appendix B. Market summary table Table 6: Summary of economics, regulations and momentum for 15 countries
Legend: light green = favourable for C&I solar; light yellow = somewhat favourable for C&I solar , red = not favourable for C&I solar
Economics Regulations Momentum Comments
Nigeria Very frequent electricity outages mean heavy reliance on expensive diesel
Tax incentives and a central regulator; no licence needed for projects up to 1MW;
Large solar and diesel generator imports; activity by local and international players
Nigeria is the largest potential market for C&I solar among the 15 countries studied in this report. Self-generation meets 77% of the nation’s power demand. Nigeria’s reliance on small-scale diesel generators is very significant. Currency convertibility risk if developers are paid in Nigerian naira due to the restrictions on foreign currency exchange by the Central Bank of Nigeria.
Kenya Solar is competitive for both commercial and industrial customers
Tax incentives; no licence needed for projects up to 1MW
Large solar and diesel generator imports, activity by local and international players
Kenya’s small-scale solar market is the largest amongst the 15 countries. Kenya is one of a few markets that have several on-site solar projects for commercial and manufacturing facilities. Future power prices are uncertain, but they are likely to rise than fall. The grid is relatively reliable, reducing the incentive to invest in captive power.
Ghana Very high grid electricity prices
Tax incentives; no subsidy for diesel; local content rules
Indications of large potential market for solar and relatively high electricity demand
Ghana grid electricity tariffs are at the highest level in Sub-Saharan Africa despite a recent price reduction. There are indications that the solar market is gaining momentum, with several utility-scale projects in active development. Lower electricity tariffs are core to the political agenda for the new administration elected in 2017.
Rwanda C&I solar is competitive for C&I sites
Tax incentives and a single regulator
Limited C&I solar market traction; small diesel generator and solar markets;
Rwanda has suitable fundamentals for C&I solar and a favorable regulatory regime. The electricity tariffs are not expected to drop in the short term as the utility is locked into a myriad of take-or-pay PPAs at high prices. A small addressable market and stable power supply could make market entry less attractive for C&I solar developers.
Uganda Solar is estimated to be economically viable
Tax incentives and dedicated regulator
Small solar market and recent power price declines
Uganda, as a member of East African Community, incentivizes the solar industry through import duty and VAT exemptions. Electricity tariffs are not expected to drop in the short term as the utility is locked into a myriad of take-or-pay PPAs at high prices. The country is also landlocked, making shipping components overland time-consuming and expensive.
Senegal Very high grid electricity prices of around $250/MWh
Tax incentives only for equipment within the rural electrification plan
Small C&I power market but large solar imports
Senegal has the highest electricity tariffs in Sub-Saharan Africa after Ghana.

© Bloomberg Finance L.P.2019
No portion of this document may be reproduced, scanned into an electronic system, distributed, publicly displayed or used as the basis of derivative works without the prior written consent of Bloomberg Finance L.P. For more information on terms of use, please contact [email protected]. Copyright and Disclaimer notice on page 63 applies throughout. 59
Economics Regulations Momentum Comments One of the leaders in Sub-Saharan Africa’s solar market, driven by the World Bank’s Scaling Solar program. However, C&I power consumption is less than 2 TWh A relatively fast ramp-up of new generation capacity is already reducing prices and power outages.
Cameroon Power prices of $120/MWh allow solar to break even Enterprises estimate a 10% sales loss due to power outages
VAT exemption; reports of inconsistent implementation of import duty and licensing threshold for C&I projects
Some traction in the solar market with a few local EPC companies; large diesel generator imports; declining power prices
Relatively stable government and deregulated power market. Hydro shortages during the dry season have resulted in the government considering alternatives including some demand response in the capital, Douala .
Tanzania Subsidized power prices make solar less favorable
Tax incentives; net metering; and a single regulator
Large solar imports from China indicate active market, but few generator sales and declining power prices
Tanzania has a single regulator that clarifies rules for small-scale renewables. Developers report that some solar is charged import duties despite an official customs exemption for solar. The target of electrifying all public facilities by 2021 may bring potential opportunities for on-site solar.
Cote d’Ivoire
Relatively high electricity tariffs
Import duty exemption and 9% VAT on solar modules
Limited traction of the solar market
High electricity tariffs make solar viable on paper, but there are very few active vendors. The renewable energy industry is small. Most activity to date has been in off-grid solar for energy access. The country has seen fast, but politically fragile economic growth.
Zimbabwe 6% of average annual sales loss due to power outages; power supply shortage
A feed-in tariff for projects up to 10MW has been proposed
Local C&I solar players are active, but seem to have achieved limited traction
Zimbabwe has influential supporters of C&I solar, which led to a number of noteworthy projects and favorable regulation. There are two ambitious C&I solar projects in Zimbabwe in various stages at the moment, indicating some government support and an interest among local businesses. Mobile carrier Econet has been a solar pioneer and made ambitious announcements. A relatively simple licence application process for projects exceeding the threshold of 100kW as Zimbabwe Energy Regulatory Authority (ZERA) is supportive for small-scale projects. A tariff increase of 49% was requested by the network operator in 2015, and its approval is pending. Skepticism about addressing the power deficit with new technologies such as solar and the fear of losing local jobs may yet turn solar out of favour.
Zambia Low grid electricity prices and economic impact of power outages
Stable tax exemption policy, but developers complain that it is implemented inconsistently in practice.
Relatively high industrial power demand
Zambia has large industrial power demand, with 55% of electricity being consumed by mines. The government signed highly subsidized PPAs with miners, making solar a more difficult proposition. Zambia was the pioneering market for Scaling Solar, and is now developing a policy to contract 200MW of renewables from projects with a size of 20MW or more. Zambia has vowed to make electricity tariffs cost-reflective by 2019, though such measures are

© Bloomberg Finance L.P.2019
No portion of this document may be reproduced, scanned into an electronic system, distributed, publicly displayed or used as the basis of derivative works without the prior written consent of Bloomberg Finance L.P. For more information on terms of use, please contact [email protected]. Copyright and Disclaimer notice on page 63 applies throughout. 60
Economics Regulations Momentum Comments politically sensitive. The reliance on hydro leaves the country exposed to droughts. Solar equipment is imported overland through South Africa, increasing the cost.
DRC Relatively low electricity prices
Import duty exemptions for solar
Limited traction, small solar market
DRC faces frequent power outages. When power is available, however it is very cheap, making the business case for C&I solar difficult. Very limited regulatory transparency and access to financing.
Mozam-bique
Low industrial electricity price and relatively reliable power
No tax incentives and diesel is subsidized
Most C&I power demand comes from industry
Grid electricity is relatively reliable and cheap. Import duties and VAT on solar equipment are higher than in other Sub-Saharan countries. A feed-in tariff has been decreed in 2014, but is not yet approved and implemented. The nation’s power-heavy aluminum industry is supplied through an interconnection with South Africa. Recent discoveries of coal and gas resources may weigh on power prices in the future.
Botswana Low electricity prices and limited opportunity cost of power outages, according to World Bank data
An import duty exemption for solar products is available, but 12% VAT is charged. Diesel fuel is subsidised
Limited traction, small C&I power market, limited solar and diesel generator imports
Grid electricity is cheap for customers, but relies heavily on rented diesel plants. This underrecover of power generation costs is unlikely to be sustainable and may increase electricity tariffs in the future.
Ethiopia Very low grid electricity prices
A licence is required for solar projects above 100kW
Relatively large commercial and industrial power demand; limited solar equipment imports
Ethiopia has boosted power supply from less than 1GW in 2008 to 4GW now, mostly from large hydro. The government is the driving force in the energy sector, and opportunities for private players are limited. There are controls on foreign exchange, potentially making it hard to repatriate profits. Ethiopia’s commercial and industrial electricity tariffs are the lowest among the countries studied in this report due to its abundant resources for large hydro. Power outages are an issue, but are not frequent enough to have spurred business models for solar such as those seen in Nigeria.
Source: BloombergNEF.
© Bloomberg Finance L.P.2019
No portion of this document may be reproduced, scanned into an electronic system, distributed, publicly displayed or used as the basis of derivative works without the prior written consent of Bloomberg Finance L.P. For more information on terms of use, please contact [email protected]. Copyright and Disclaimer notice on page 63 applies throughout. 61
About us ABOUT RESPONSABILITY INVESTMENTS AG responsAbility is a leading asset manager in the field of impact investments in developing countries and manages USD 3 bn of assets and a variety of investment vehicles that provide private debt and private equity to some 540 companies with inclusive business models across 90 countries. Founded in 2003, the company is headquartered in Zurich, Switzerland, and has local offices in Bangkok, Geneva, Hong Kong, Lima, Luxembourg, Mumbai, Nairobi, Oslo and Paris. Find out more at www.responsAbility.com
ABOUT THE GLOBAL CLIMATE PARTNERSHIP FUND
The Global Climate Partnership Fund (GCPF) is an investment company under Luxembourg law managed by responsAbility Investments. It was established by the German Federal Ministry for the Environment, Nature Conservation, Building and Nuclear Safety and KfW Entwicklungsbank in 2009 as a public-private partnership and focuses on financing energy efficiency and renewable energy projects for SMEs and private households in emerging markets. Find out more at www.gcpf.lu
Contact details
responsAbility contact:
For business related enquiries, please contact us at the following address:
• Email: [email protected]
Client enquiries: • Bloomberg Terminal: press <Help> key twice • Email: [email protected]
Itamar Orlandi, CFA Head of Southeast Asia and Frontier Power Research, BloombergNEF
Takehiro Kawahara Lead Analyst, Frontier Power, BloombergNEF
Ulimmeh Ezekiel Senior Associate, Quantitative Modelling, BloombergNEF
Copyright © Bloomberg Finance L.P. 2019. This publication is the copyright of Bloomberg New Energy Finance. No portion of this document may be photocopied, reproduced, scanned into an electronic system or transmitted, forwarded or distributed in any way without prior consent of Bloomberg New Energy Finance.

© Bloomberg Finance L.P.2019
No portion of this document may be reproduced, scanned into an electronic system, distributed, publicly displayed or used as the basis of derivative works without the prior written consent of Bloomberg Finance L.P. For more information on terms of use, please contact [email protected]. Copyright and Disclaimer notice on page 63 applies throughout. 62
Disclaimer The Bloomberg NEF ("BNEF"), service/information is derived from selected public sources. Bloomberg Finance L.P. and its affiliates, in providing the service/information, believe that the information it uses comes from reliable sources, but do not guarantee the accuracy or completeness of this information, which is subject to change without notice, and nothing in this document shall be construed as such a guarantee. The statements in this service/document reflect the current judgment of the authors of the relevant articles or features, and do not necessarily reflect the opinion of Bloomberg Finance L.P., Bloomberg L.P. or any of their affiliates (“Bloomberg”). Bloomberg disclaims any liability arising from use of this document, its contents and/or this service. Nothing herein shall constitute or be construed as an offering of financial instruments or as investment advice or recommendations by Bloomberg of an investment or other strategy (e.g., whether or not to “buy”, “sell”, or “hold” an investment). The information available through this service is not based on consideration of a subscriber’s individual circumstances and should not be considered as information sufficient upon which to base an investment decision. You should determine on your own whether you agree with the content. This service should not be construed as tax or accounting advice or as a service designed to facilitate any subscriber’s compliance with its tax, accounting or other legal obligations. Employees involved in this service may hold positions in the companies mentioned in the services/information.
The data included in these materials are for illustrative purposes only. The BLOOMBERG TERMINAL service and Bloomberg data products (the “Services”) are owned and distributed by Bloomberg Finance L.P. (“BFLP”) except that Bloomberg L.P. and its subsidiaries (“BLP”) distribute these products in Argentina, Australia and certain jurisdictions in the Pacific islands, Bermuda, China, India, Japan, Korea and New Zealand. BLP provides BFLP with global marketing and operational support. Certain features, functions, products and services are available only to sophisticated investors and only where permitted. BFLP, BLP and their affiliates do not guarantee the accuracy of prices or other information in the Services. Nothing in the Services shall constitute or be construed as an offering of financial instruments by BFLP, BLP or their affiliates, or as investment advice or recommendations by BFLP, BLP or their affiliates of an investment strategy or whether or not to “buy”, “sell” or “hold” an investment. Information available via the Services should not be considered as information sufficient upon which to base an investment decision. The following are trademarks and service marks of BFLP, a Delaware limited partnership, or its subsidiaries: BLOOMBERG, BLOOMBERG ANYWHERE, BLOOMBERG MARKETS, BLOOMBERG NEWS, BLOOMBERG PROFESSIONAL, BLOOMBERG TERMINAL and BLOOMBERG.COM. Absence of any trademark or service mark from this list does not waive Bloomberg's intellectual property rights in that that name, mark or logo. All rights reserved. © 2018 Bloomberg.