Embed Size (px)
Citation preview
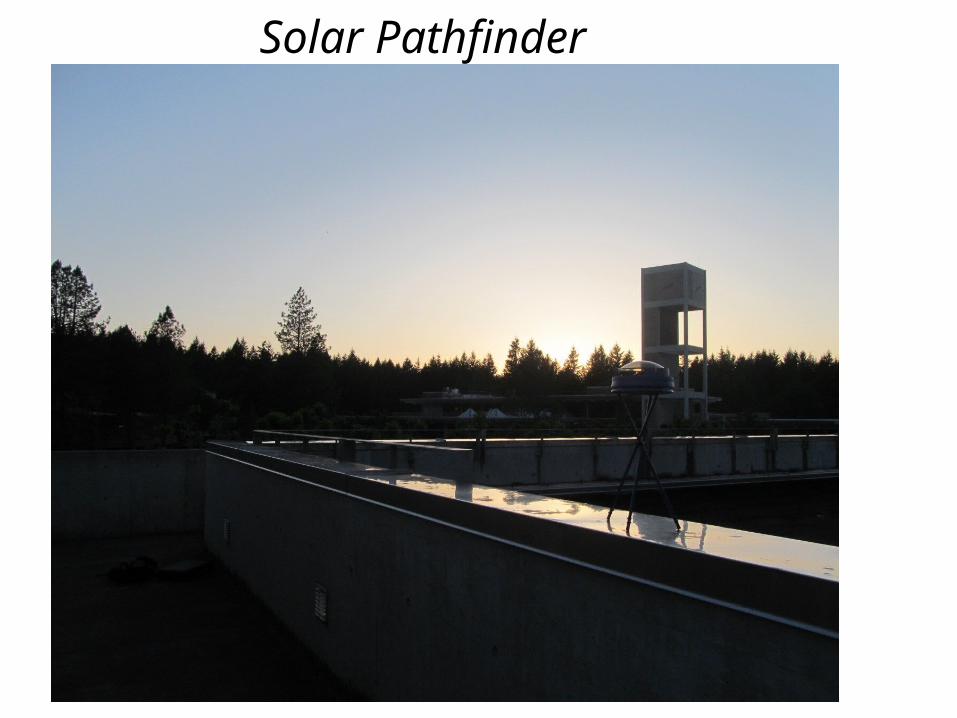
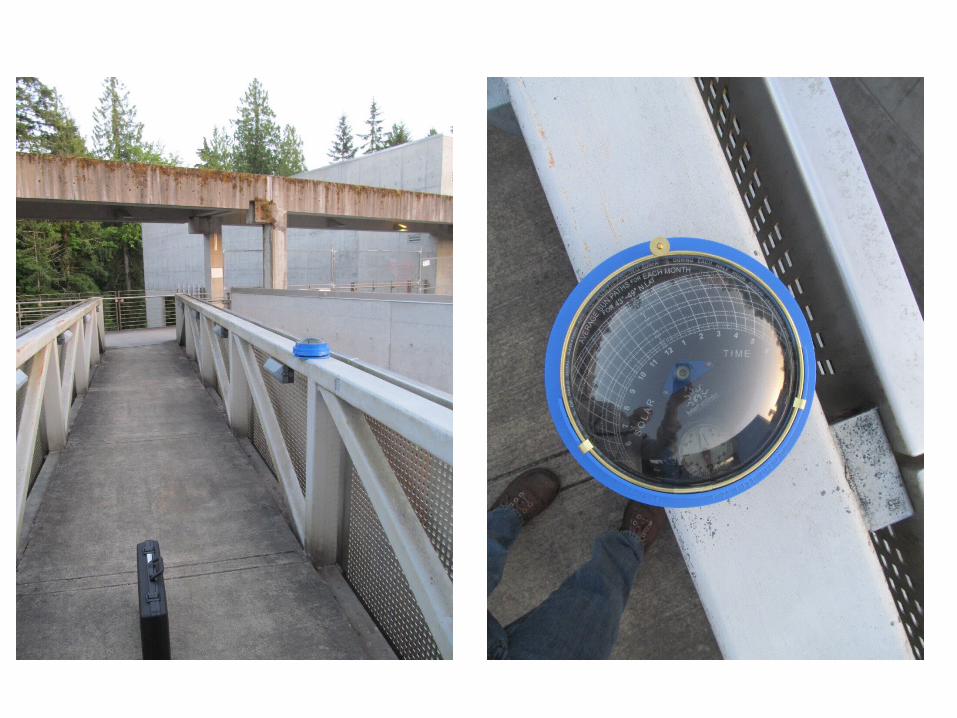
Solar Pathfinder
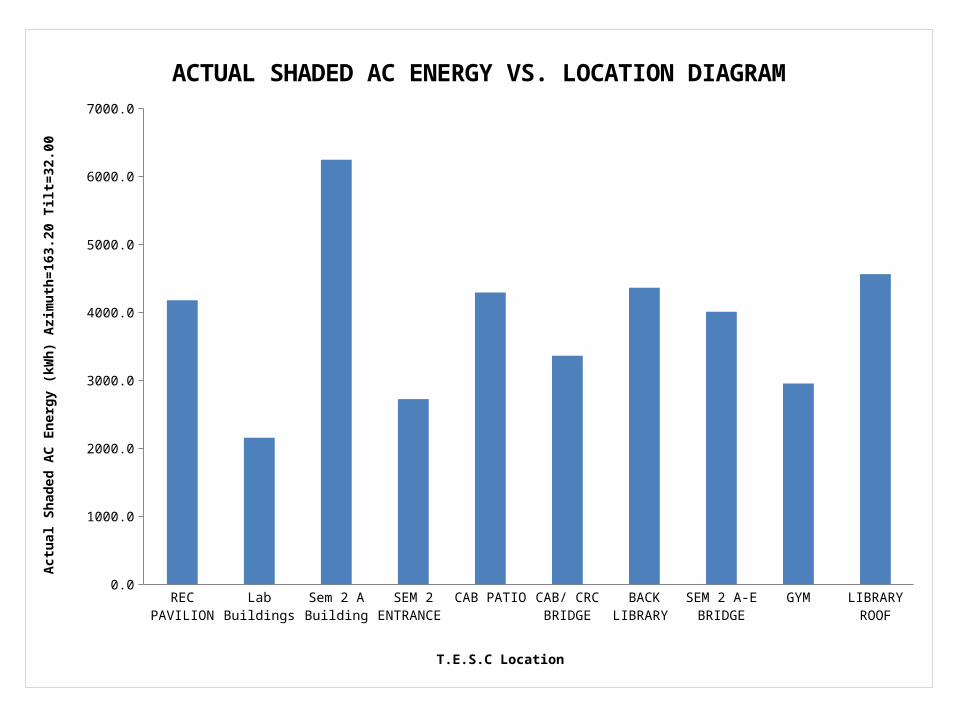
QuestionWhat locations on campus would be the best candidates for solar PV array installations?
HypothesisWe hypothesized that the C.r.c and the Rec Pavilion would offer us the most efficient sights for new photovoltaic systems.
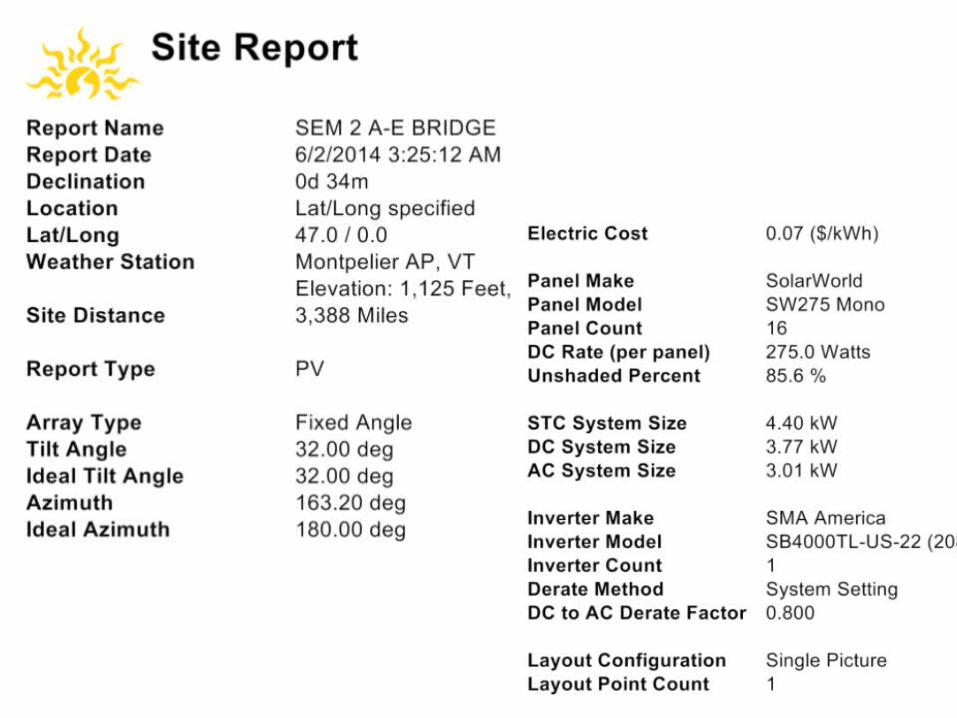
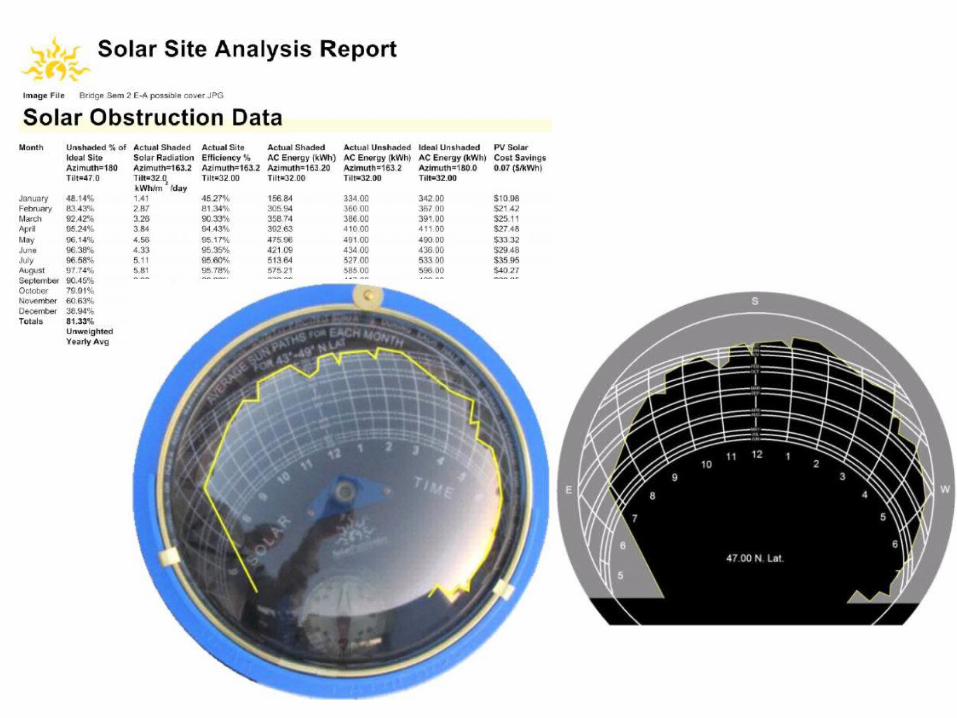
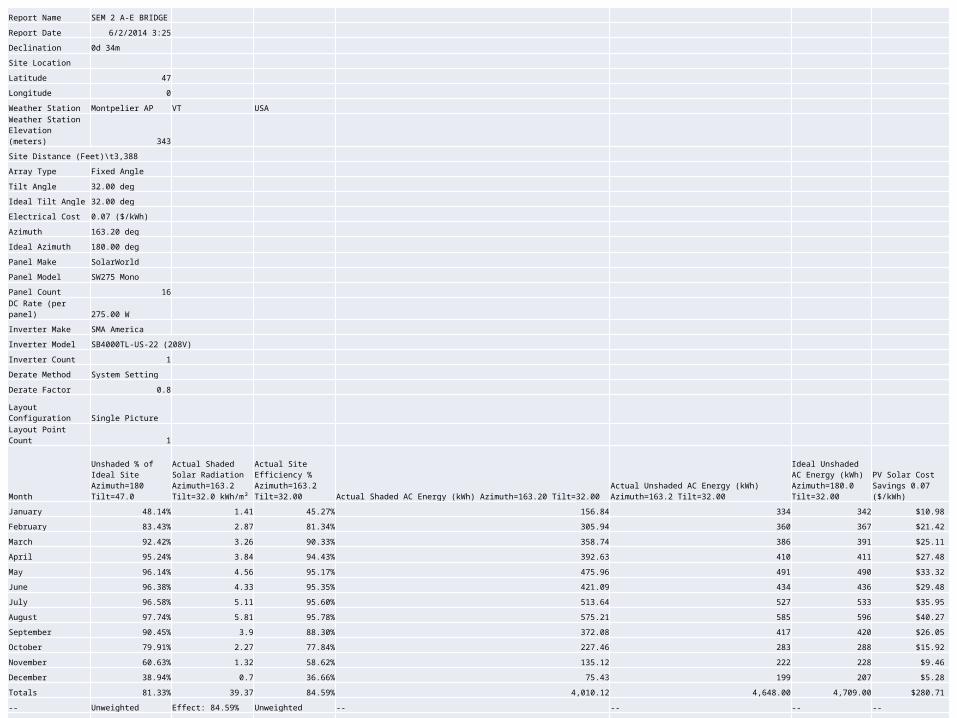
Report Name SEM 2 A-E BRIDGE
Report Date 6/2/2014 3:25
Declination 0d 34m
Site Location
Latitude 47
Longitude 0
Weather Station Montpelier AP VT USA
Weather Station Elevation (meters) 343
Site Distance (Feet)\t3,388
Array Type Fixed Angle
Tilt Angle 32.00 deg
Ideal Tilt Angle 32.00 deg
Electrical Cost 0.07 ($/kWh)
Azimuth 163.20 deg
Ideal Azimuth 180.00 deg
Panel Make SolarWorld
Panel Model SW275 Mono
Panel Count 16
DC Rate (per panel) 275.00 W
Inverter Make SMA America
Inverter Model SB4000TL-US-22 (208V)
Inverter Count 1
Derate Method System Setting
Derate Factor 0.8
Layout Configuration Single Picture
Layout Point Count 1
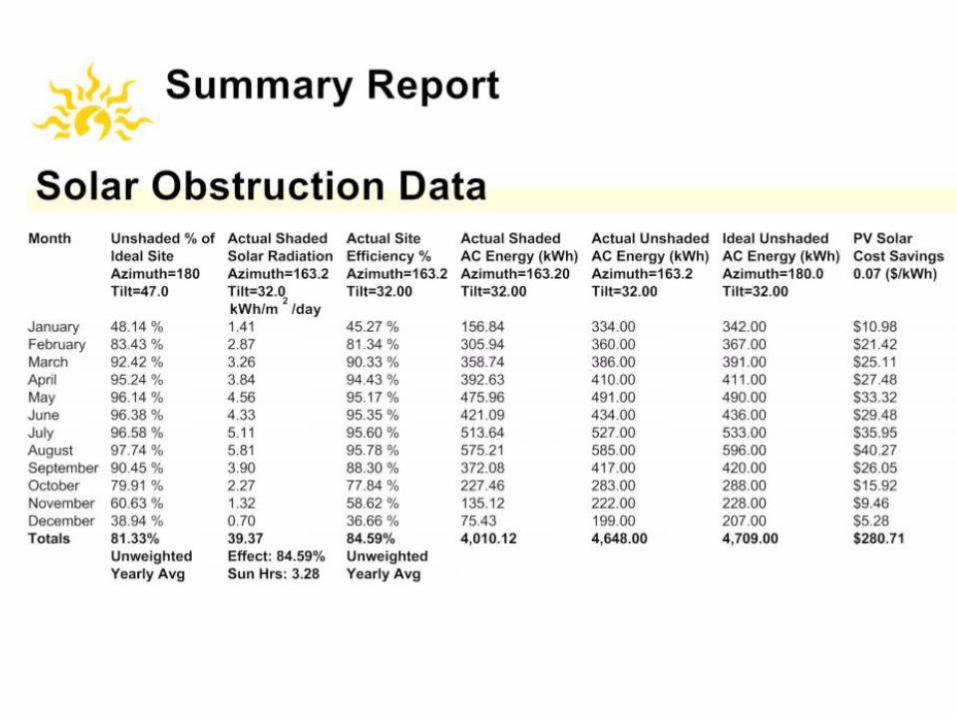
Month Unshaded % of Ideal Site Azimuth=180 Tilt=47.0
Actual Shaded Solar Radiation Azimuth=163.2 Tilt=32.0 kWh/m²
Actual Site Efficiency % Azimuth=163.2 Tilt=32.00 Actual Shaded AC Energy (kWh) Azimuth=163.20 Tilt=32.00
Actual Unshaded AC Energy (kWh) Azimuth=163.2 Tilt=32.00
Ideal Unshaded AC Energy (kWh) Azimuth=180.0 Tilt=32.00
PV Solar Cost Savings 0.07 ($/kWh)
January 48.14% 1.41 45.27% 156.84 334 342 $10.98
February 83.43% 2.87 81.34% 305.94 360 367 $21.42
March 92.42% 3.26 90.33% 358.74 386 391 $25.11
April 95.24% 3.84 94.43% 392.63 410 411 $27.48
May 96.14% 4.56 95.17% 475.96 491 490 $33.32
June 96.38% 4.33 95.35% 421.09 434 436 $29.48
July 96.58% 5.11 95.60% 513.64 527 533 $35.95
August 97.74% 5.81 95.78% 575.21 585 596 $40.27
September 90.45% 3.9 88.30% 372.08 417 420 $26.05
October 79.91% 2.27 77.84% 227.46 283 288 $15.92
November 60.63% 1.32 58.62% 135.12 222 228 $9.46
December 38.94% 0.7 36.66% 75.43 199 207 $5.28
Totals 81.33% 39.37 84.59% 4,010.12 4,648.00 4,709.00 $280.71
-- Unweighted Effect: 84.59% Unweighted -- -- -- --
-- Yearly Avg Sun Hrs: 3.28 Yearly Avg -- -- -- --
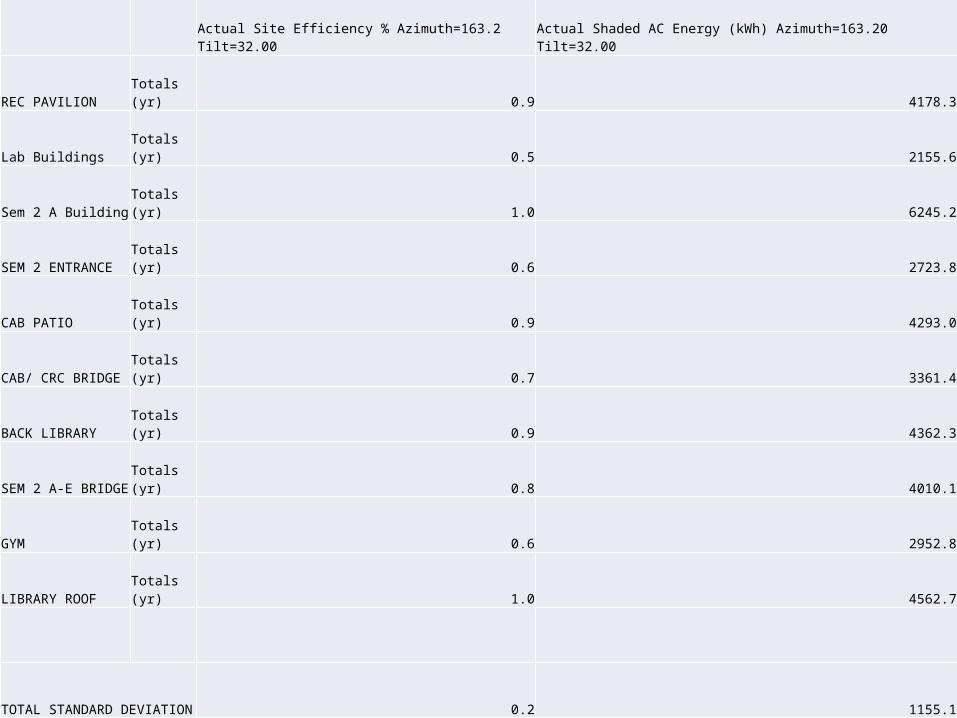
Actual Site Efficiency % Azimuth=163.2 Tilt=32.00 Actual Shaded AC Energy (kWh) Azimuth=163.20 Tilt=32.00
REC PAVILION Totals (yr) 0.9 4178.3
Lab Buildings Totals (yr) 0.5 2155.6
Sem 2 A Building Totals (yr) 1.0 6245.2
SEM 2 ENTRANCE Totals (yr) 0.6 2723.8
CAB PATIO Totals (yr) 0.9 4293.0
CAB/ CRC BRIDGE Totals (yr) 0.7 3361.4
BACK LIBRARY Totals (yr) 0.9 4362.3
SEM 2 A-E BRIDGE Totals (yr) 0.8 4010.1
GYM Totals (yr) 0.6 2952.8
LIBRARY ROOF Totals (yr) 1.0 4562.7
TOTAL STANDARD DEVIATION 0.2 1155.1
REC PAVILIO
N
Lab Build
ings
Sem 2 A Build
ing
SEM 2 EN
TRANCE
CAB PATIO
CAB/ CRC BRIDGE
BACK LIBRARY
SEM 2 A-E
BRIDGEGYM
LIBRARY R
OOF0.0
1000.0
2000.0
3000.0
4000.0
5000.0
6000.0
7000.0
ACTUAL SHADED AC ENERGY VS. LOCATION DIAGRAM
T.E.S.C Location
Actu
al S
hade
d AC
Ene
rgy
(kW
h) A
zimut
h=16
3.20
Tilt
=32.
00


![The Trove [multi]/1st... · PATHFINDER RPG CORE RULEBOOK , PATHFINDER RPG BESTI ARY , PATHFINDER RPG BESTIARY 2 , PATHFINDER RPG BESTIARY 3 , PATHFINDER RPG ADVANCED PLAYER S GUID](https://img.pdfslide.net/doc/110x75/60c7beb87d66ea6048574996/the-trove-multi1st-pathfinder-rpg-core-rulebook-pathfinder-rpg-besti-ary.jpg)


![PlAne-hoPPer s K Andboo - The Trove [multi]/1st Edition...Legends, Pathfinder Map Pack, Pathfinder Module, Pathfinder Pawns, Pathfinder Player Companion, Pathfinder Roleplaying Game,](https://img.pdfslide.net/doc/110x75/60c09751c0e51316cd1dc344/plane-hopper-s-k-andboo-the-trove-multi1st-edition-legends-pathfinder-map.jpg)