Embed Size (px)
Citation preview

Solar Powered Golf Cart Senior Design II
Group 9 May 1, 2015
Jake Bettis
Jacob Kreuger Matt Roland
Matt Tourtelot With support from Leidos
i
Table of Contents 1 Executive Summary ................................................................................................................. 1
1.1 Initial Proposal ................................................................................................................. 2
1.1.1 Project Description.................................................................................................... 2
1.1.2 Project specifications and requirements.................................................................... 2
1.1.3 Project Block Diagrams ............................................................................................ 3
1.2 Project Significance and Motivation ................................................................................ 6
1.3 Design Constraints and Standards .................................................................................... 7
1.3.1 Motor Controller ....................................................................................................... 7
1.3.2 Standards ................................................................................................................... 7
2 Research ................................................................................................................................... 8
2.1 Touchscreen Display ........................................................................................................ 8
2.1.1 Navigation ................................................................................................................. 8
2.1.2 Golf Cart Status....................................................................................................... 12
2.1.3 Mode Selection ....................................................................................................... 13
2.1.4 Touch Screen .......................................................................................................... 14
2.1.5 Microcontroller ....................................................................................................... 16
2.1.6 Android Application ............................................................................................... 19
2.2 Motor Controller ............................................................................................................ 22
2.2.1 Throttle Sensor ........................................................................................................ 22
2.2.2 Software Control ..................................................................................................... 26
2.2.3 Circuit Design ......................................................................................................... 28
2.2.4 Direction Control .................................................................................................... 34
2.2.5 Quadrature Encoder Interface (QEI) ....................................................................... 38
2.3 Charge Controller ........................................................................................................... 38
2.3.1 Maximum Power Point Tracking (MPPT) .............................................................. 39
2.3.2 Sensors .................................................................................................................... 44
2.3.3 Charging Techniques .............................................................................................. 46
2.3.4 Solar Panels ............................................................................................................. 48
2.4 PCB Design .................................................................................................................... 51
2.4.1 PCB Composition ................................................................................................... 52
2.4.2 PCB Software.......................................................................................................... 53

ii
2.4.3 PCB Manufacturer .................................................................................................. 53
2.5 Batteries .......................................................................................................................... 54
2.5.1 Options .................................................................................................................... 54
2.6 Automated Driving Features .......................................................................................... 59
2.6.1 Sensors .................................................................................................................... 59
2.6.2 Range Finder ........................................................................................................... 64
2.6.3 Cruise Control ......................................................................................................... 65
2.6.4 Software .................................................................................................................. 67
3 Design .................................................................................................................................... 67
3.1 Touchscreen Display ...................................................................................................... 67
3.1.1 Android Application Development ......................................................................... 67
3.1.2 Touchscreen Display Hardware .............................................................................. 73
3.2 Motor Controller ............................................................................................................ 80
3.2.1 Power Board............................................................................................................ 80
3.2.2 Logic Board ............................................................................................................ 83
3.3 Charge Controller ........................................................................................................... 88
3.3.1 Power Stage ............................................................................................................ 89
3.3.2 Logic Control Stage ................................................................................................ 90
3.3.3 Bias Supply Stage ................................................................................................... 92
3.3.4 Programming........................................................................................................... 95
3.3.5 Bill of Materials ...................................................................................................... 98
3.3.6 Materials ................................................................................................................. 99
4 Prototype ................................................................................................................................ 99
4.1 Touchscreen Display ...................................................................................................... 99
4.1.1 First Prototype ......................................................................................................... 99
4.1.2 Second Prototype .................................................................................................. 100
4.1.3 Third Prototype ..................................................................................................... 102
4.2 Motor Controller .......................................................................................................... 104
4.2.1 Phase 1 .................................................................................................................. 104
4.2.2 Phase 2 .................................................................................................................. 105
4.2.3 Phase 3 .................................................................................................................. 106
4.2.4 Phase 4 .................................................................................................................. 107
iii
4.3 Autonomous Features ................................................................................................... 108
4.3.1 Phase 1 .................................................................................................................. 108
4.3.2 Phase 2 .................................................................................................................. 108
4.3.3 Phase 3 .................................................................................................................. 109
4.3.4 Phase 4 .................................................................................................................. 109
4.4 Charge Controller ......................................................................................................... 110
4.4.1 Phase 1 .................................................................................................................. 110
4.4.2 Phase 2 .................................................................................................................. 110
4.4.3 Phase 3 .................................................................................................................. 110
5 Testing ................................................................................................................................. 111
5.1 Touchscreen Display .................................................................................................... 111
5.1.1 Android Application Testing ................................................................................ 112
5.1.2 BeagleBone Black and MTK MT3339 GPS Module PCB Testing ...................... 116
5.2 Motor Controller .......................................................................................................... 119
5.2.1 Power Board.......................................................................................................... 119
5.2.2 Motor..................................................................................................................... 119
5.2.3 MCU ..................................................................................................................... 119
5.2.4 Test Procedure ...................................................................................................... 121
5.3 Autonomous Features ................................................................................................... 121
5.3.1 Golf Cart Speed and Braking ................................................................................ 121
5.3.2 Rangefinder Sensors ............................................................................................. 122
5.3.3 Threshold Distances and Velocities ...................................................................... 122
5.3.4 Cruise Control ....................................................................................................... 123
5.3.5 Driver Notification ................................................................................................ 123
5.4 Charge Controller ......................................................................................................... 123
5.4.1 Computer Simulation ............................................................................................ 123
5.4.2 Lab Tests ............................................................................................................... 124
6 Appendix ............................................................................................................................. 125
6.1 Software ....................................................................................................................... 125
6.1.1 Motor Controller Software .................................................................................... 125
6.2 Reprint Permission Emails ........................................................................................... 126
6.2.1 Technicians Manual .............................................................................................. 126
iv
6.2.2 Open Revolt .......................................................................................................... 127
6.2.3 Google Maps API License .................................................................................... 127
6.2.4 Test Motor ............................................................................................................. 127
6.2.5 GNU Free Documentation License ....................................................................... 128
6.2.6 AutoSales inc. ....................................................................................................... 128
6.2.7 All Electronics Inc. ............................................................................................... 128
6.2.8 Sensor .................................................................................................................... 129
6.2.9 Laser diagram........................................................................................................ 130
6.2.10 Battery Configurations .......................................................................................... 130
6.2.11 Battery Charts and Specs ...................................................................................... 131
6.2.12 Texas Instruments Charts, Tables, and Figures .................................................... 131
6.2.13 Grape Solar PV Diagrams ..................................................................................... 131
6.2.14 Solar Wiring Diagram ........................................................................................... 131
6.2.15 Panasonic .............................................................................................................. 132
6.3 Software ....................................................................................................................... 132
6.4 Parts List ....................................................................................................................... 132
6.4.1 Touchscreen Display ............................................................................................. 132
6.4.2 Motor Controller ................................................................................................... 132
Table of Figures
Figure 1 System Control Overview ............................................................................................ 3
Figure 2 Power Systems Overview ........................................................................................... 4
Figure 3 Software Overview ....................................................................................................... 5
Figure 4 Navigation Map ............................................................................................................. 9
Figure 5 Google API License ................................................................................................... 10
Figure 6 Golf Cart Status Screen............................................................................................. 12
Figure 7 Modes of Operation Buttons ..................................................................................... 13
Figure 8 Android Application Main Screen ............................................................................. 19
Figure 9 List of Installed SDK Packages ................................................................................ 20
Figure 10 Android Application SDK Version and Application Permissions ....................... 22
Figure 11 EZ-GO Inductive Throttle Diagram ........................................................................ 23
Figure 12 Ford Five Hundred Pedal ........................................................................................ 24
Figure 13 Hall Effect Throttle Box ............................................................................................ 25
Figure 14 PWM Average Power Control ................................................................................ 26
Figure 15 Typical IGBT Performance ..................................................................................... 31
Figure 16 MOSFET Motor Control Circuit .............................................................................. 32
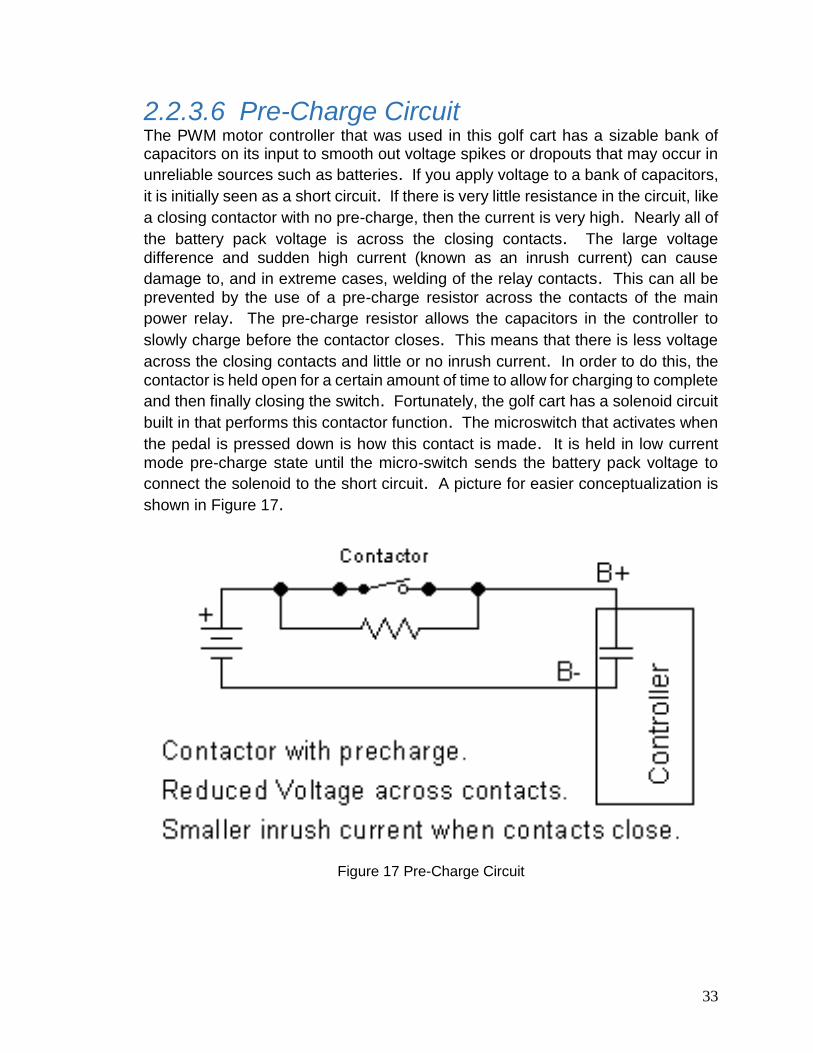
Figure 17 Pre-Charge Circuit ................................................................................................... 33
Figure 18 Free-Wheeling Diode Graphic ................................................................................ 34
v
Figure 19 H-Bridge Functional Model (reprinted with permission of GNU Free
Documentation License) ........................................................................................................... 35
Figure 20 Relay H-Bridge ......................................................................................................... 36
Figure 21 Semiconductor H-Bridge ......................................................................................... 36
Figure 22 EZGO Contactor Direction Selector ...................................................................... 37
Figure 23 QEI Direction Sense Timing Diagram ................................................................... 38
Figure 24 MPPT for a 24 V system ......................................................................................... 40
Figure 25 Test Data for Efficiency in a 24V System ............................................................. 41
Figure 26 MPP Acquisition ....................................................................................................... 42
Figure 27 Lead-Acid Charging Profile ..................................................................................... 43
Figure 28 Constant Voltage Battery Characteristics ............................................................ 47
Figure 29 Constant Current vs. Constant Voltage ................................................................ 47
Figure 30 Expected Life Cycles vs. DOD ............................................................................... 57
Figure 31 Discharge Time vs. Current .................................................................................... 57
Figure 32 US 2200 XC2 Specifications .................................................................................. 58
Figure 33 Triangulation Uses the Angle of Reflection to Determine Distance ................. 60
Figure 34 Lasor Range Finder System ................................................................................... 62
Figure 35 Laser Rangefinder with Rotating Mirror ................................................................ 63
Figure 36 Threshold distances and Velocities ....................................................................... 64
Figure 37 Threshold distance and velocity flow chart .......................................................... 66
Figure 38 Android Application Class Diagram with Included Methods .............................. 68
Figure 39 UserNav.java Detailed Data Flow Diagram ......................................................... 70
Figure 40 CartStatus.java Communication and Status Update State Diagram ............... 71
Figure 41 CartStatus.java Display Value Function Data Flow Diagram ............................ 71
Figure 42 GPS MTK MT3339 Chipset Pinout ........................................................................ 73
Figure 43 GPS schematic with Beaglebone .......................................................................... 75
Figure 44 Laser Cut Acrylic GPS Module PCB Enclosure Sides and Securing Bar ....... 76
Figure 45 Laser Cut Acrylic Case Schematic in Inkscape ................................................... 77
Figure 46 3D Printed Touchscreen Display Enclosure Sides ............................................. 78
Figure 47 Touchscreen Display Front Enclosure Model ...................................................... 79
Figure 48 Touchscreen Display Back Enclosure Model ...................................................... 80
Figure 49 Original Schematic of Open Revolt Power Board ............................................... 81
Figure 50 Power Board PCB .................................................................................................... 81
Figure 51 Custom MSP430 Schematic .................................................................................. 83
Figure 52 Motor Controller Logic Board Layout .................................................................... 84
Figure 53 Transient Response of LP2950 ............................................................................. 84
Figure 54 Gate Driver Timing Diagram ................................................................................... 85
Figure 55 Ford 500 Pedal Mounted in Golf Cart ................................................................... 87
Figure 56 Reference Design Block Diagram ......................................................................... 88
Figure 57 Solar Charge Controller Schematic: Power Stage .............................................. 89
Figure 58 Solar Charge Controller Schematic: Controller and Bias Supply ..................... 91
Figure 59 Typical Application of LM5019 Buck Regulator ................................................... 92
Figure 60 Typical Application of TLV70433 ........................................................................... 93
vi
Figure 61 Typical Application of INA271 ................................................................................ 94
Figure 62 GUI for Charge Controller ....................................................................................... 95
Figure 63 Sample Plots from GUI ............................................................................................ 96
Figure 64 Charge Controller Board Layout ............................................................................ 98
Figure 65 SCH-I545 Prototype Main Menu with UCF EzNAV Launcher Icon ................ 100
Figure 66 Second Prototype Physical Configuration .......................................................... 101
Figure 67 Touchscreen Display and Touch Driver Enclosure Mounted on Cart Dash . 102
Figure 68 Mounted Electronics on Power Board ................................................................ 103
Figure 69 Phase 1 Motor Controller Prototype .................................................................... 104
Figure 70 Logic Board Testing ............................................................................................... 105
Figure 71 Full Scale Motor Controller Test .......................................................................... 106
Figure 72 Finalized Electronics underneath the seat ......................................................... 107
Figure 73 Rangefinder prototype ........................................................................................... 108
Figure 74 Rangefinder prototype, phase 2 .......................................................................... 108
Figure 75 Cruise control prototype ........................................................................................ 109
Figure 76 Autonomous prototype .......................................................................................... 109
Figure 77 Wiring Diagram for Solar Array ............................................................................ 111
Figure 78 Testing Elements for Second Task of Navigational Testing ............................ 113
Figure 79 Testing Elements of Second Cart Status Report Test ..................................... 115
Figure 80 Switching Node Waveform of 12V system ......................................................... 124
1
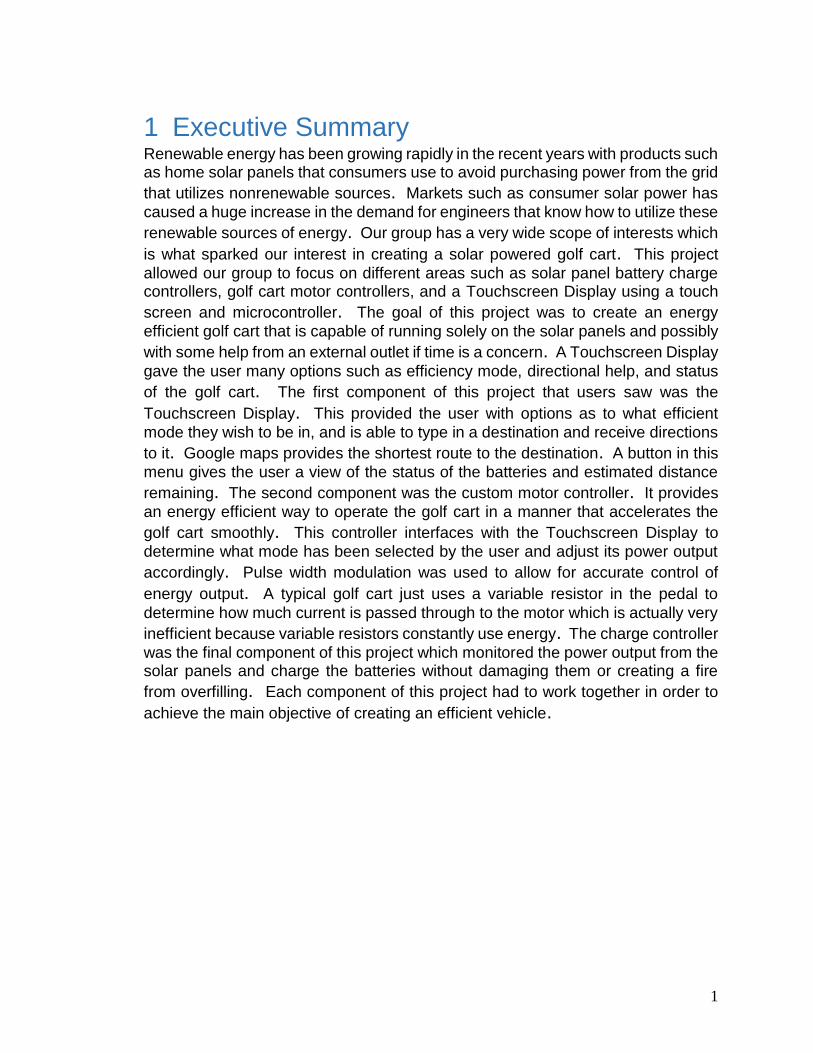
1 Executive Summary Renewable energy has been growing rapidly in the recent years with products such as home solar panels that consumers use to avoid purchasing power from the grid
that utilizes nonrenewable sources. Markets such as consumer solar power has
caused a huge increase in the demand for engineers that know how to utilize these
renewable sources of energy. Our group has a very wide scope of interests which
is what sparked our interest in creating a solar powered golf cart. This project
allowed our group to focus on different areas such as solar panel battery charge controllers, golf cart motor controllers, and a Touchscreen Display using a touch
screen and microcontroller. The goal of this project was to create an energy
efficient golf cart that is capable of running solely on the solar panels and possibly
with some help from an external outlet if time is a concern. A Touchscreen Display
gave the user many options such as efficiency mode, directional help, and status
of the golf cart. The first component of this project that users saw was the
Touchscreen Display. This provided the user with options as to what efficient
mode they wish to be in, and is able to type in a destination and receive directions
to it. Google maps provides the shortest route to the destination. A button in this
menu gives the user a view of the status of the batteries and estimated distance
remaining. The second component was the custom motor controller. It provides
an energy efficient way to operate the golf cart in a manner that accelerates the
golf cart smoothly. This controller interfaces with the Touchscreen Display to
determine what mode has been selected by the user and adjust its power output
accordingly. Pulse width modulation was used to allow for accurate control of
energy output. A typical golf cart just uses a variable resistor in the pedal to
determine how much current is passed through to the motor which is actually very
inefficient because variable resistors constantly use energy. The charge controller
was the final component of this project which monitored the power output from the solar panels and charge the batteries without damaging them or creating a fire
from overfilling. Each component of this project had to work together in order to
achieve the main objective of creating an efficient vehicle.
2
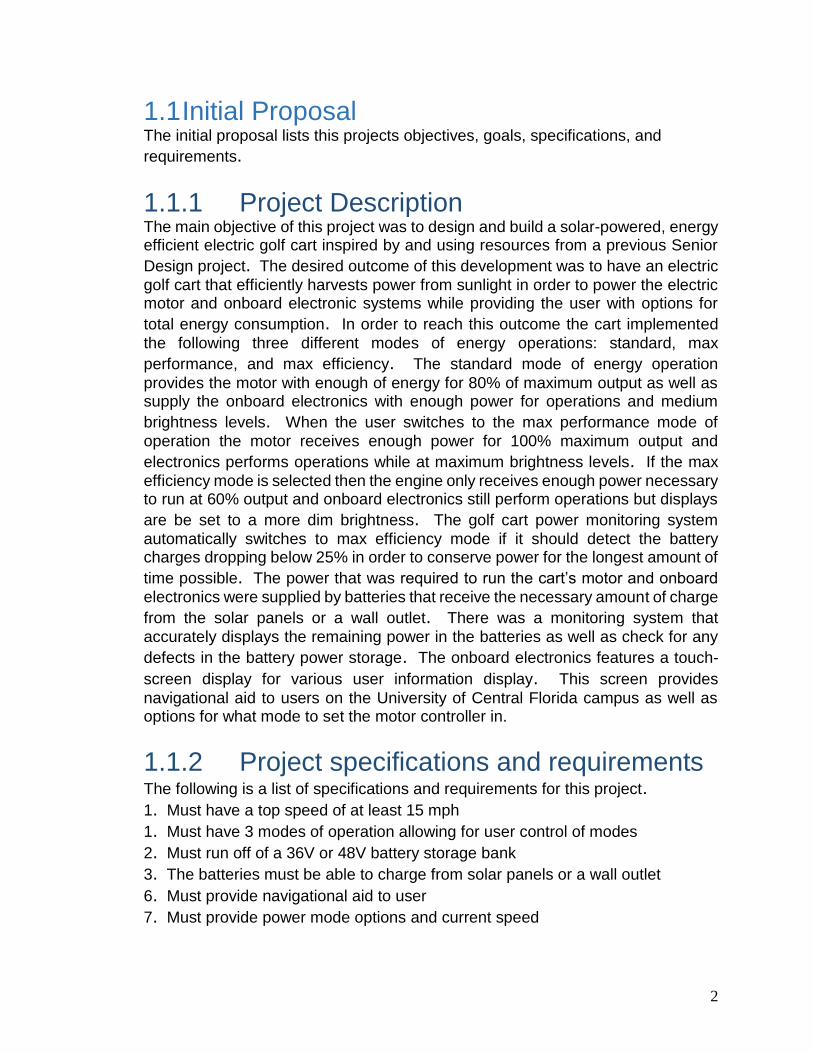
1.1 Initial Proposal The initial proposal lists this projects objectives, goals, specifications, and
requirements.
1.1.1 Project Description The main objective of this project was to design and build a solar-powered, energy efficient electric golf cart inspired by and using resources from a previous Senior
Design project. The desired outcome of this development was to have an electric
golf cart that efficiently harvests power from sunlight in order to power the electric motor and onboard electronic systems while providing the user with options for
total energy consumption. In order to reach this outcome the cart implemented
the following three different modes of energy operations: standard, max
performance, and max efficiency. The standard mode of energy operation
provides the motor with enough of energy for 80% of maximum output as well as supply the onboard electronics with enough power for operations and medium
brightness levels. When the user switches to the max performance mode of
operation the motor receives enough power for 100% maximum output and
electronics performs operations while at maximum brightness levels. If the max
efficiency mode is selected then the engine only receives enough power necessary to run at 60% output and onboard electronics still perform operations but displays
are be set to a more dim brightness. The golf cart power monitoring system
automatically switches to max efficiency mode if it should detect the battery charges dropping below 25% in order to conserve power for the longest amount of
time possible. The power that was required to run the cart’s motor and onboard
electronics were supplied by batteries that receive the necessary amount of charge
from the solar panels or a wall outlet. There was a monitoring system that
accurately displays the remaining power in the batteries as well as check for any
defects in the battery power storage. The onboard electronics features a touch-
screen display for various user information display. This screen provides
navigational aid to users on the University of Central Florida campus as well as options for what mode to set the motor controller in.
1.1.2 Project specifications and requirements The following is a list of specifications and requirements for this project. 1. Must have a top speed of at least 15 mph
1. Must have 3 modes of operation allowing for user control of modes
2. Must run off of a 36V or 48V battery storage bank
3. The batteries must be able to charge from solar panels or a wall outlet
6. Must provide navigational aid to user
7. Must provide power mode options and current speed
3
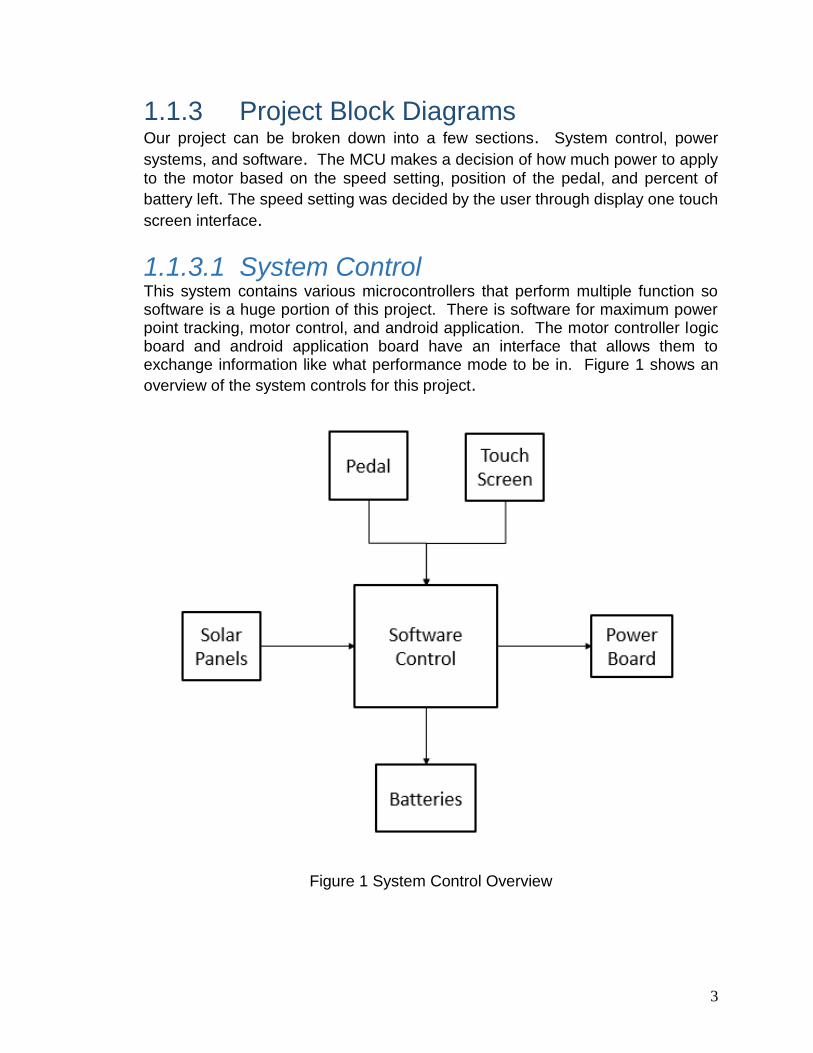
1.1.3 Project Block Diagrams Our project can be broken down into a few sections. System control, power
systems, and software. The MCU makes a decision of how much power to apply
to the motor based on the speed setting, position of the pedal, and percent of
battery left. The speed setting was decided by the user through display one touch
screen interface.
1.1.3.1 System Control This system contains various microcontrollers that perform multiple function so software is a huge portion of this project. There is software for maximum power point tracking, motor control, and android application. The motor controller logic board and android application board have an interface that allows them to exchange information like what performance mode to be in. Figure 1 shows an
overview of the system controls for this project.
Figure 1 System Control Overview
4
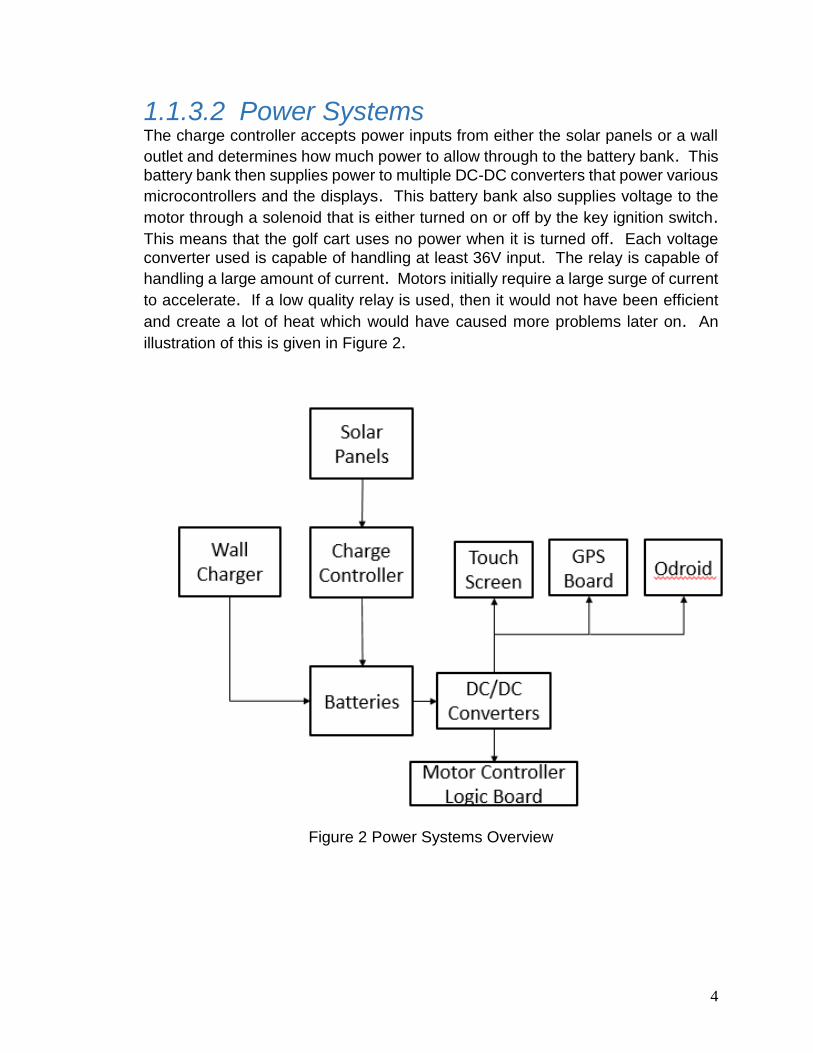
1.1.3.2 Power Systems The charge controller accepts power inputs from either the solar panels or a wall
outlet and determines how much power to allow through to the battery bank. This
battery bank then supplies power to multiple DC-DC converters that power various
microcontrollers and the displays. This battery bank also supplies voltage to the
motor through a solenoid that is either turned on or off by the key ignition switch. This means that the golf cart uses no power when it is turned off. Each voltage
converter used is capable of handling at least 36V input. The relay is capable of
handling a large amount of current. Motors initially require a large surge of current
to accelerate. If a low quality relay is used, then it would not have been efficient
and create a lot of heat which would have caused more problems later on. An
illustration of this is given in Figure 2.
Figure 2 Power Systems Overview
5
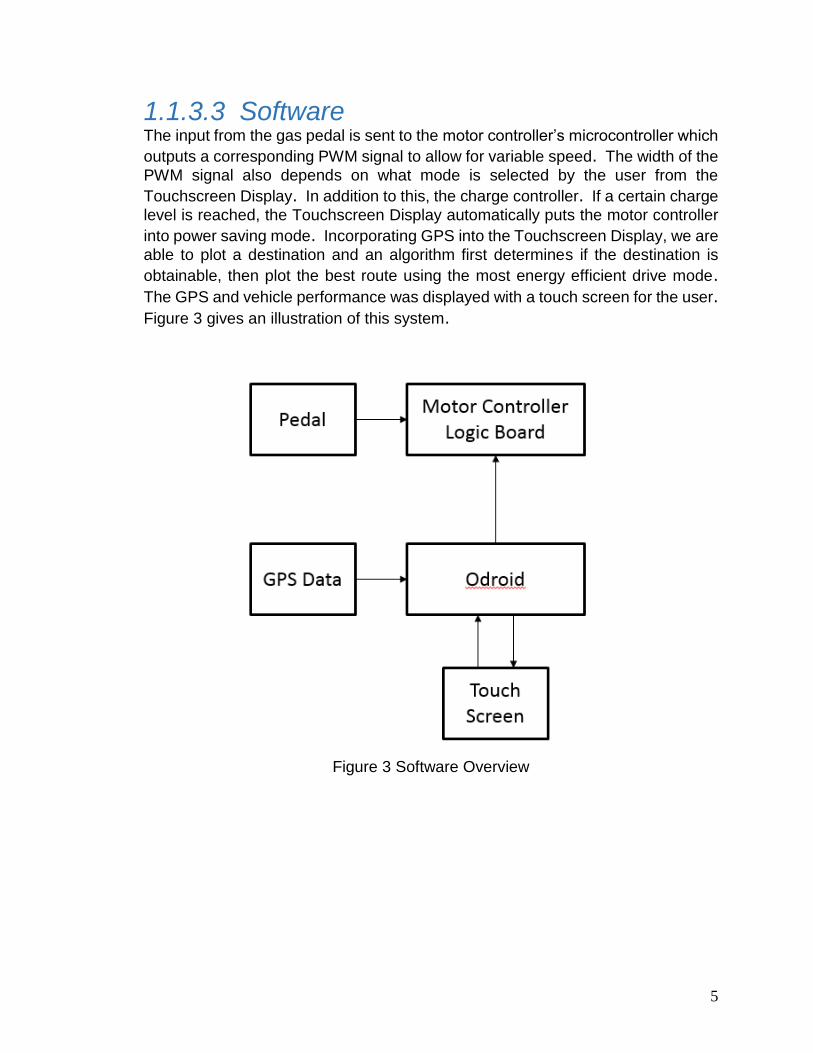
1.1.3.3 Software The input from the gas pedal is sent to the motor controller’s microcontroller which
outputs a corresponding PWM signal to allow for variable speed. The width of the
PWM signal also depends on what mode is selected by the user from the
Touchscreen Display. In addition to this, the charge controller. If a certain charge
level is reached, the Touchscreen Display automatically puts the motor controller
into power saving mode. Incorporating GPS into the Touchscreen Display, we are
able to plot a destination and an algorithm first determines if the destination is
obtainable, then plot the best route using the most energy efficient drive mode. The GPS and vehicle performance was displayed with a touch screen for the user. Figure 3 gives an illustration of this system.
Figure 3 Software Overview
6
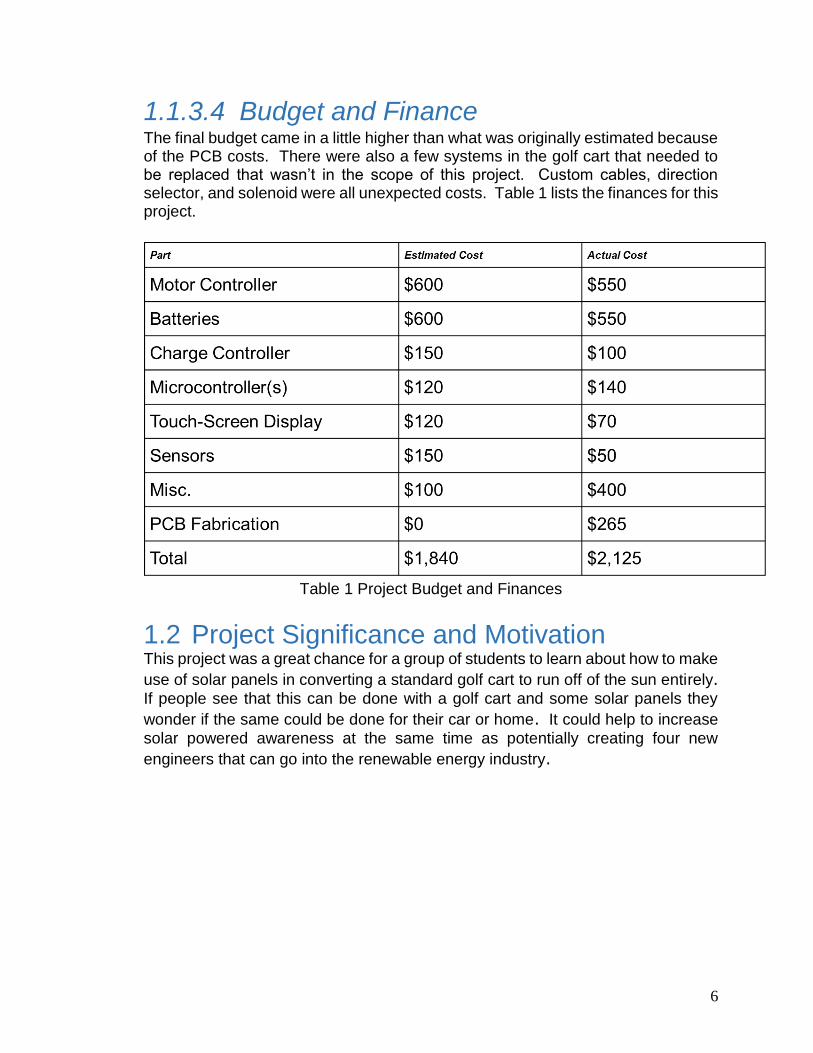
1.1.3.4 Budget and Finance The final budget came in a little higher than what was originally estimated because of the PCB costs. There were also a few systems in the golf cart that needed to be replaced that wasn’t in the scope of this project. Custom cables, direction selector, and solenoid were all unexpected costs. Table 1 lists the finances for this project.
Table 1 Project Budget and Finances
1.2 Project Significance and Motivation This project was a great chance for a group of students to learn about how to make
use of solar panels in converting a standard golf cart to run off of the sun entirely. If people see that this can be done with a golf cart and some solar panels they
wonder if the same could be done for their car or home. It could help to increase
solar powered awareness at the same time as potentially creating four new
engineers that can go into the renewable energy industry.
7
1.3 Design Constraints and Standards This section contains the design constraints that held back this project from meeting all of the planned design requirements.
1.3.1 Motor Controller The motor controller was under a lot of manufacturing and thermal limitations. There were also safety constraints that limited the capabilities of this portion. A ramping acceleration had to be used in order to prevent the user from being startled with the acceleration and injuring themselves. Heat also reduces the current flow through MOSFET’s which means that the speed was limited by thermal conditions on the power board. The aluminum bar used was unable to make electrical contact with the MOSFET’s either which made it more difficult to solder the board on with a heat sink that pulled away heat from the soldered part.
1.3.2 Standards A few standards were necessary in this project to make it work. These include standards for the digital IO and UART used. Standard voltage levels were also used to power the microcomputer and motor controller.
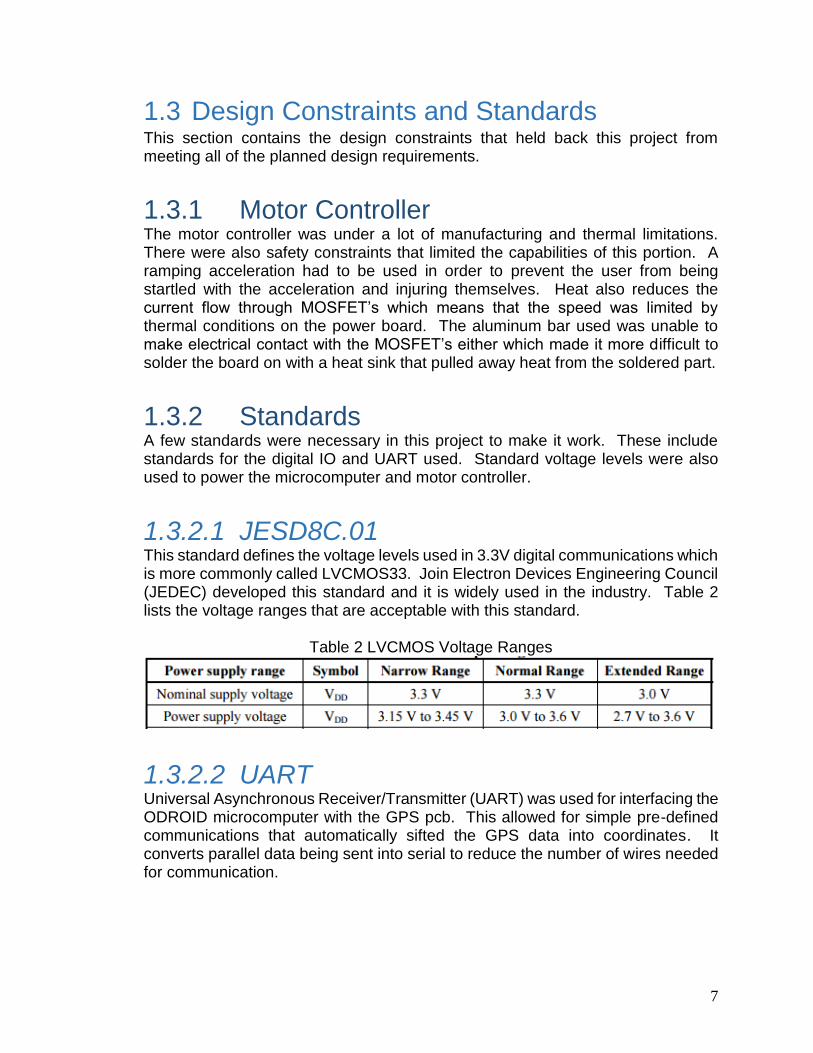
1.3.2.1 JESD8C.01 This standard defines the voltage levels used in 3.3V digital communications which is more commonly called LVCMOS33. Join Electron Devices Engineering Council (JEDEC) developed this standard and it is widely used in the industry. Table 2 lists the voltage ranges that are acceptable with this standard.
Table 2 LVCMOS Voltage Ranges
1.3.2.2 UART Universal Asynchronous Receiver/Transmitter (UART) was used for interfacing the ODROID microcomputer with the GPS pcb. This allowed for simple pre-defined communications that automatically sifted the GPS data into coordinates. It converts parallel data being sent into serial to reduce the number of wires needed for communication.
8
1.3.2.3 USB 2.0 Universal Serial Bus (USB) is how the touchscreen display sent data back and forth from the ODROID C1. It is a standard serial communication similar to UART, but at different voltage levels. Some of the features in USB 2.0 include 480Mbps data-rate, source-synchronous data transfer, no power consumption except for during data transfer, and 1.2V standard LVCMOS signals.
2 Research This section contains all of the research involved in making this solar powered golf cart come to life. It details all of the parts that were considered and any options that were not implemented, but were stretch goals.
2.1 Touchscreen Display The solar powered golf cart includes a touchscreen display which is to be powered
by the cart’s onboard power system. This display receives input from an ODROID
C1 microcontroller that is running the Android Mobile Operating System that has a
navigation application pre-loaded. This Android Application contains a modified
google maps API to work specifically on the UCF campus as well as features to
report cart status to the user. By using this application via the touchscreen display
any user should be able to simultaneously navigate the UCF campus area and
check the cart’s current status with ease.
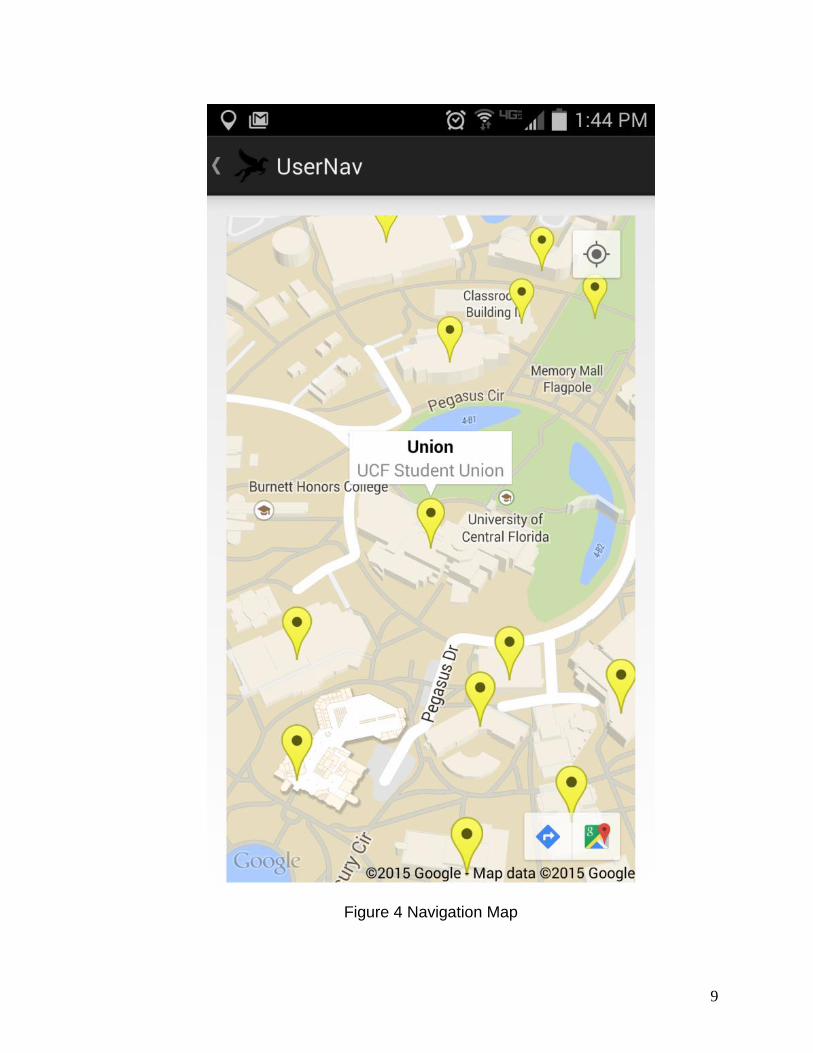
2.1.1 Navigation The first selection option in the display application's launch menu is the navigate
button. When the user presses this button the application switches to a new activity
screen where a map was generated using the Google Maps API. From this screen
the user is able to track their position, see UCF building waypoints, interact with
waypoints to gain building information, and return to the application's main menu. Figure 4 shows what the user sees upon clicking the "Navigate" button, notice the
map plugin and associated features.
9
Figure 4 Navigation Map
10
The application supplies the user with feedback regarding position throughout
standard operations and locomotion of the golf cart. This operation is
accomplished through interfacing of the Adafruit Ultimate GPS Breakout microcontroller position data with the ODROID C1 microcontroller's Android
Application. Upon receiving this data from the UART connection between the GPS
module and the ODROID C1 the Android Application calculates user position by
passing the user's current GPS position to the Google Maps API function. All API
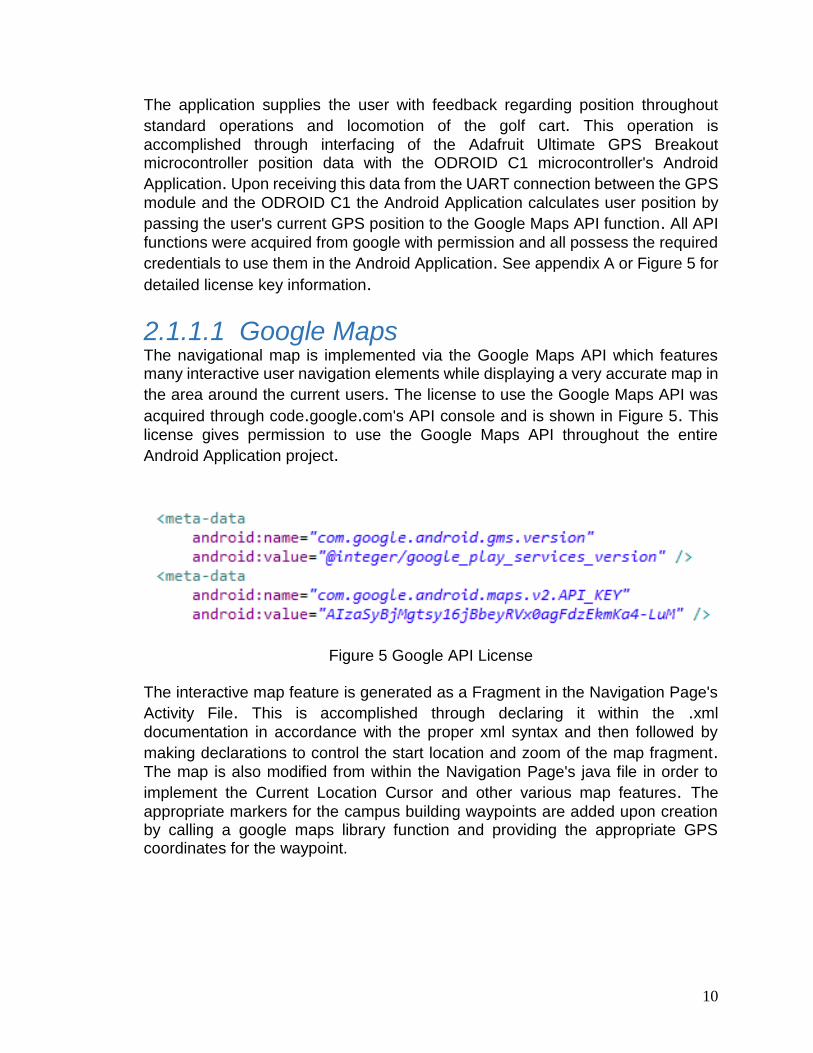
functions were acquired from google with permission and all possess the required
credentials to use them in the Android Application. See appendix A or Figure 5 for
detailed license key information.
2.1.1.1 Google Maps The navigational map is implemented via the Google Maps API which features many interactive user navigation elements while displaying a very accurate map in
the area around the current users. The license to use the Google Maps API was
acquired through code.google.com's API console and is shown in Figure 5. This
license gives permission to use the Google Maps API throughout the entire
Android Application project.
Figure 5 Google API License
The interactive map feature is generated as a Fragment in the Navigation Page's
Activity File. This is accomplished through declaring it within the .xml
documentation in accordance with the proper xml syntax and then followed by
making declarations to control the start location and zoom of the map fragment. The map is also modified from within the Navigation Page's java file in order to
implement the Current Location Cursor and other various map features. The
appropriate markers for the campus building waypoints are added upon creation by calling a google maps library function and providing the appropriate GPS coordinates for the waypoint.
11
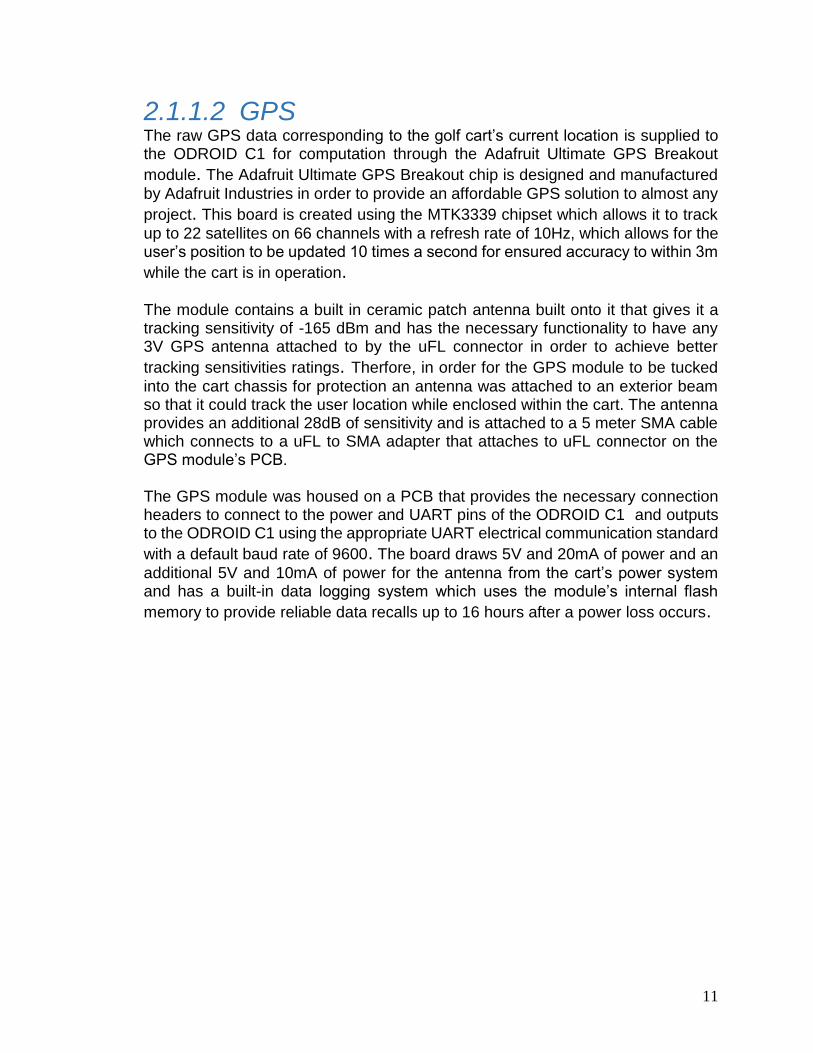
2.1.1.2 GPS The raw GPS data corresponding to the golf cart’s current location is supplied to the ODROID C1 for computation through the Adafruit Ultimate GPS Breakout
module. The Adafruit Ultimate GPS Breakout chip is designed and manufactured
by Adafruit Industries in order to provide an affordable GPS solution to almost any
project. This board is created using the MTK3339 chipset which allows it to track
up to 22 satellites on 66 channels with a refresh rate of 10Hz, which allows for the user’s position to be updated 10 times a second for ensured accuracy to within 3m
while the cart is in operation. The module contains a built in ceramic patch antenna built onto it that gives it a tracking sensitivity of -165 dBm and has the necessary functionality to have any 3V GPS antenna attached to by the uFL connector in order to achieve better
tracking sensitivities ratings. Therfore, in order for the GPS module to be tucked
into the cart chassis for protection an antenna was attached to an exterior beam so that it could track the user location while enclosed within the cart. The antenna provides an additional 28dB of sensitivity and is attached to a 5 meter SMA cable which connects to a uFL to SMA adapter that attaches to uFL connector on the GPS module’s PCB. The GPS module was housed on a PCB that provides the necessary connection headers to connect to the power and UART pins of the ODROID C1 and outputs to the ODROID C1 using the appropriate UART electrical communication standard
with a default baud rate of 9600. The board draws 5V and 20mA of power and an
additional 5V and 10mA of power for the antenna from the cart’s power system and has a built-in data logging system which uses the module’s internal flash
memory to provide reliable data recalls up to 16 hours after a power loss occurs.
12
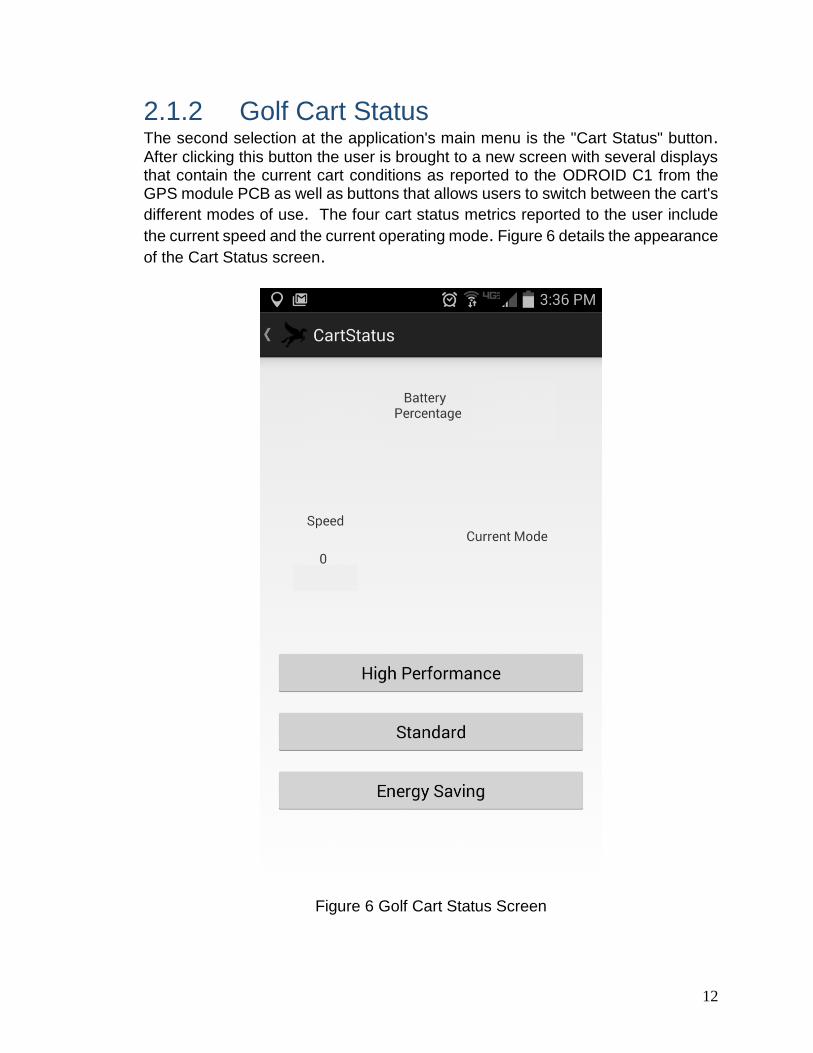
2.1.2 Golf Cart Status The second selection at the application's main menu is the "Cart Status" button. After clicking this button the user is brought to a new screen with several displays that contain the current cart conditions as reported to the ODROID C1 from the GPS module PCB as well as buttons that allows users to switch between the cart's
different modes of use. The four cart status metrics reported to the user include
the current speed and the current operating mode. Figure 6 details the appearance
of the Cart Status screen.
Figure 6 Golf Cart Status Screen
13
2.1.2.1 Speed Display The first entry on the second row of status fields is the current cart speed. This
value is displayed in units of miles per hour and is calculated by the Android Application using data supplied by the GPS coordinate tracking instrument to
calculate an estimate of the cart's current speed. The data supplied by the GPS
coordinate tracking instrument is stored by the Android Application to compare the current GPS coordinate position to the saved values of the previous GPS coordinate positions to get an approximate velocity of the cart by comparing
coordinate distance value differences. The calculations involved in computing the
cart velocity provides a result that can be used by the “Cart Status” screen to
provide a displayed value of the current speed in units of miles per hour. This value
is updated ten times a second in parallel with the GPS module’s location updates.
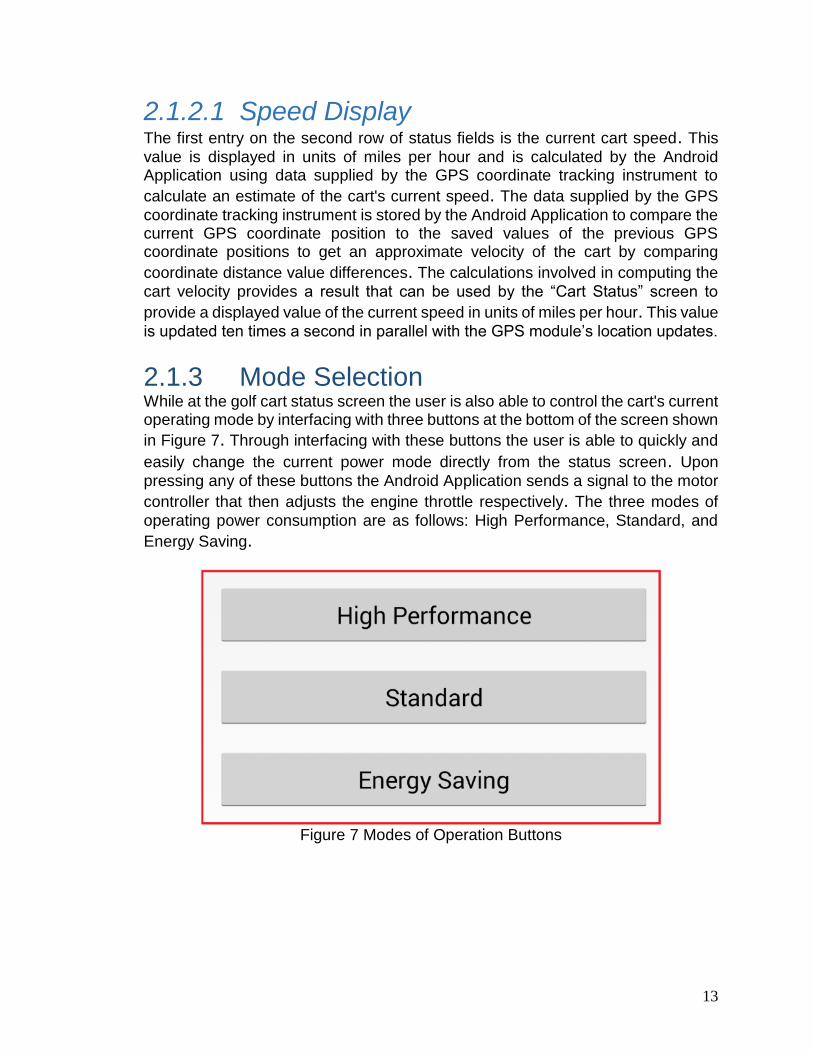
2.1.3 Mode Selection While at the golf cart status screen the user is also able to control the cart's current operating mode by interfacing with three buttons at the bottom of the screen shown
in Figure 7. Through interfacing with these buttons the user is able to quickly and
easily change the current power mode directly from the status screen. Upon
pressing any of these buttons the Android Application sends a signal to the motor
controller that then adjusts the engine throttle respectively. The three modes of
operating power consumption are as follows: High Performance, Standard, and
Energy Saving.
Figure 7 Modes of Operation Buttons
14
2.1.3.1 High Performance Upon user selection of the High Performance mode of operation the Android Application sends a signal to the motor controller to set the ramp acceleration factor to the maximum value on the golf cart's engine which allows top speeds to
be reached quickly. This mode of operation is not intended for sustainable use as
it drains the cart's battery bank quickly over time and leave the user unable to
perform any other functions until charge has been restored. The user can switch
to another operational setting by clicking on either of the other two buttons located
on the Cart Status screen.
2.1.3.2 Standard When the Standard mode of operation is selected at the Golf Cart Status screen the Android Application informs the motor controller to set the ramp acceleration factor to 67% of the maximum value so that top speed is reached within a moderate amount of time. This mode is best suited to short-medium range travel distances
and is best implemented on a route with plenty of direct sunlight. The user may
switch out of the Standard mode of operation by clicking on either of the other two
buttons located on the Cart Status screen.
2.1.3.3 Energy Saving The most efficient mode of operation for extended periods of use is the energy
saving mode. In this mode the Android Application sends a signal for the motor
controller to set the ramp acceleration factor to 33% of the maximum value so that
top speed is reached slower compared to the other two operating modes. This
mode should be used when the user wants the highest range possible. If there is
sufficient battery charge the user can change modes from the Energy Saving mode of operation by clicking on either of the other two buttons located on the Cart Status
screen.
2.1.4 Touch Screen The pivotal piece of equipment in the Touchscreen display system is the touchscreen display, which outputs the video signal of the ODROID C1 for the
user’s display and interaction with the Android Application. The display absolutely
must be touchscreen in order to facilitate proper interface with the Android Application and should also be very power conservative so that the cart can
maintain battery charge for other cart operations. The ODROID C1 only outputs
video signal via HDMI so any touch screen display used must have an HDMI input. As a result of our power and space confinements the ideal display chosen had to
be within the range of 5” to 10” in size.
15
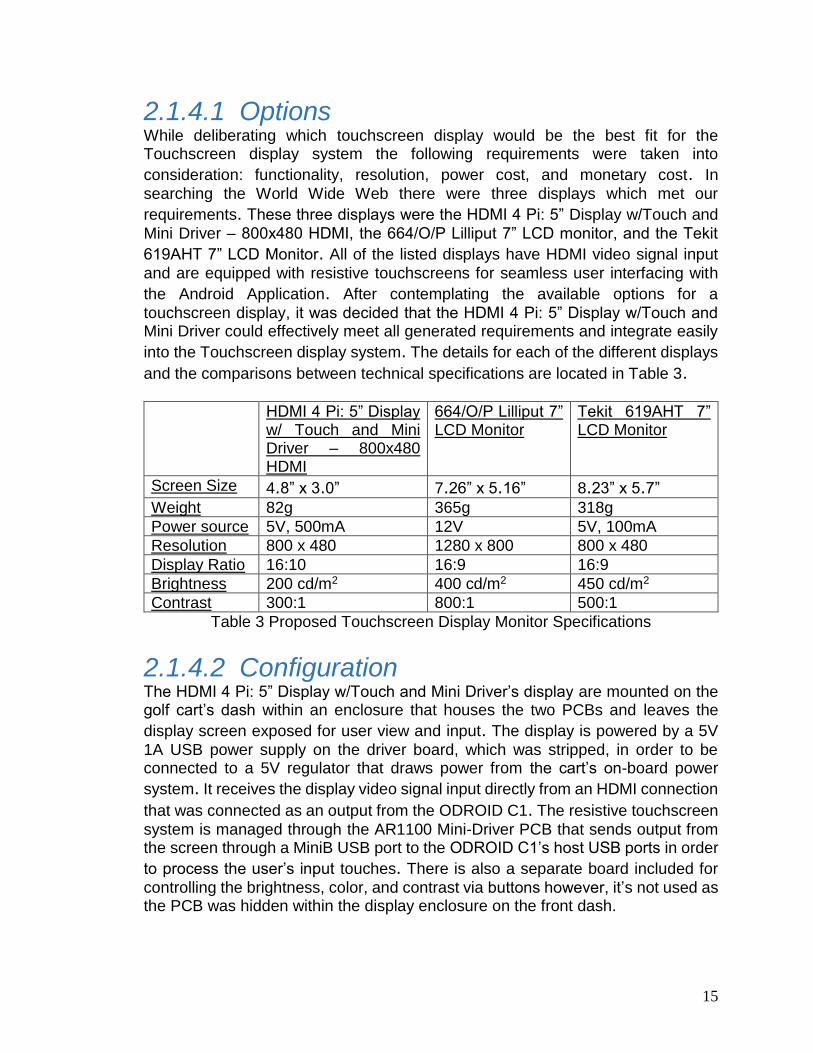
2.1.4.1 Options While deliberating which touchscreen display would be the best fit for the Touchscreen display system the following requirements were taken into
consideration: functionality, resolution, power cost, and monetary cost. In
searching the World Wide Web there were three displays which met our
requirements. These three displays were the HDMI 4 Pi: 5” Display w/Touch and
Mini Driver – 800x480 HDMI, the 664/O/P Lilliput 7” LCD monitor, and the Tekit
619AHT 7” LCD Monitor. All of the listed displays have HDMI video signal input
and are equipped with resistive touchscreens for seamless user interfacing with
the Android Application. After contemplating the available options for a
touchscreen display, it was decided that the HDMI 4 Pi: 5” Display w/Touch and Mini Driver could effectively meet all generated requirements and integrate easily
into the Touchscreen display system. The details for each of the different displays
and the comparisons between technical specifications are located in Table 3.
HDMI 4 Pi: 5” Display w/ Touch and Mini Driver – 800x480 HDMI
664/O/P Lilliput 7” LCD Monitor
Tekit 619AHT 7” LCD Monitor
Screen Size 4.8” x 3.0” 7.26” x 5.16” 8.23” x 5.7”
Weight 82g 365g 318g
Power source 5V, 500mA 12V 5V, 100mA
Resolution 800 x 480 1280 x 800 800 x 480
Display Ratio 16:10 16:9 16:9
Brightness 200 cd/m2 400 cd/m2 450 cd/m2
Contrast 300:1 800:1 500:1
Table 3 Proposed Touchscreen Display Monitor Specifications
2.1.4.2 Configuration The HDMI 4 Pi: 5” Display w/Touch and Mini Driver’s display are mounted on the golf cart’s dash within an enclosure that houses the two PCBs and leaves the
display screen exposed for user view and input. The display is powered by a 5V
1A USB power supply on the driver board, which was stripped, in order to be connected to a 5V regulator that draws power from the cart’s on-board power
system. It receives the display video signal input directly from an HDMI connection
that was connected as an output from the ODROID C1. The resistive touchscreen
system is managed through the AR1100 Mini-Driver PCB that sends output from the screen through a MiniB USB port to the ODROID C1’s host USB ports in order
to process the user’s input touches. There is also a separate board included for
controlling the brightness, color, and contrast via buttons however, it’s not used as the PCB was hidden within the display enclosure on the front dash.
16
2.1.5 Microcontroller The microcontroller chosen to provide an OS, handle GPS data input, and generate video output signal to the display is the ODROID C1 open-source
microcontroller. It outputs video signal to the Touchscreen display’s monitor and
also send signals to the cart’s Motor Controller board with essential operating functions through connections made with the 40 pins on the ODROID C1’s pin
array. The Android 4.4 KitKat mobile environment along with the accompanying
Android Application is imaged onto an eMMC module card and inserted into the ODROID C1’s eMMC memory card slot which provides the entire module with various resources to send signals to other components in the cart’s system and run an array of transmission and value calculation functions using an Android Application created with specifications to accomplish the planned software
functionality. The ODROID C1 is an open-source development board designed by
Hardkernel Co, Ltd. which uses an Amlogic S805, 4x Cortex-A5 @ 1.5 GHz and
has 1GB DDR3 SDRAM.
2.1.5.1 Options When considering which microcontroller to use for the Touchscreen display system there were several factors to take into account, which included the following:
functionality, performance, power cost, and monetary cost. Our preliminary list of
possible boards that could possibly meet these requirements included the
Raspberry Pi, BeagleBone Black, and ODROID C1. Each one of these boards
are open-source and has USB interfaces as well as various forms of output in order
to communicate with the Touchscreen display along with other boards on the cart. After much deliberation it was deemed that the ODROID C1 met all of the compiled
requirements and would be the easiest choice to integrate into our design. The
details for each board and comparisons between the three of them are located in
Table 4.
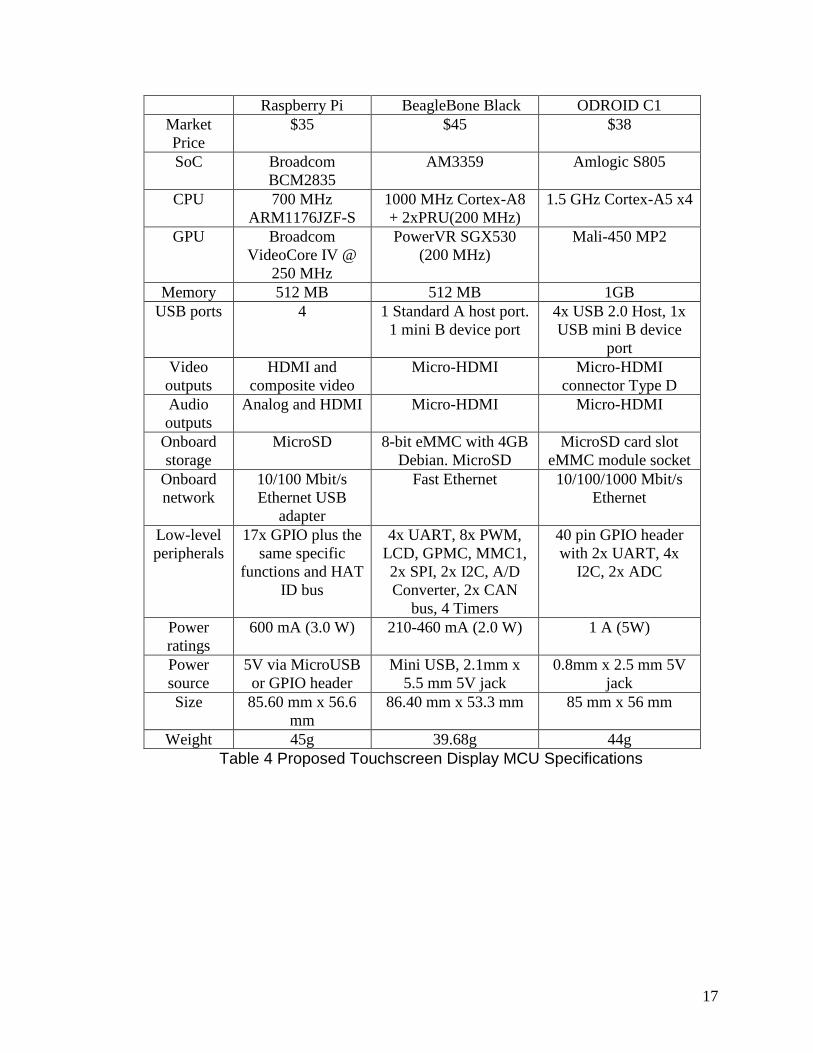
17
Raspberry Pi BeagleBone Black ODROID C1
Market
Price
$35 $45 $38
SoC Broadcom
BCM2835
AM3359 Amlogic S805
CPU 700 MHz
ARM1176JZF-S
1000 MHz Cortex-A8
+ 2xPRU(200 MHz)
1.5 GHz Cortex-A5 x4
GPU Broadcom
VideoCore IV @
250 MHz
PowerVR SGX530
(200 MHz)
Mali-450 MP2
Memory 512 MB 512 MB 1GB
USB ports 4 1 Standard A host port.
1 mini B device port
4x USB 2.0 Host, 1x
USB mini B device
port
Video
outputs
HDMI and
composite video
Micro-HDMI Micro-HDMI
connector Type D
Audio
outputs
Analog and HDMI Micro-HDMI Micro-HDMI
Onboard
storage
MicroSD 8-bit eMMC with 4GB
Debian. MicroSD
MicroSD card slot
eMMC module socket
Onboard
network
10/100 Mbit/s
Ethernet USB
adapter
Fast Ethernet 10/100/1000 Mbit/s
Ethernet
Low-level
peripherals
17x GPIO plus the
same specific
functions and HAT
ID bus
4x UART, 8x PWM,
LCD, GPMC, MMC1,
2x SPI, 2x I2C, A/D
Converter, 2x CAN
bus, 4 Timers
40 pin GPIO header
with 2x UART, 4x
I2C, 2x ADC
Power
ratings
600 mA (3.0 W) 210-460 mA (2.0 W) 1 A (5W)
Power
source
5V via MicroUSB
or GPIO header
Mini USB, 2.1mm x
5.5 mm 5V jack
0.8mm x 2.5 mm 5V
jack
Size 85.60 mm x 56.6
mm
86.40 mm x 53.3 mm 85 mm x 56 mm
Weight 45g 39.68g 44g
Table 4 Proposed Touchscreen Display MCU Specifications

18
2.1.5.2 Performance The biggest factors in choosing an appropriate microcontroller for the Touchscreen
display were the board’s functionality and its data processing performance. The
required functionality of the board chosen needed to include a video output to the Touchscreen display monitor and the ability to run navigational and signal output
software. Through consideration of these requirements the group factored out the
Raspberry Pi from their choices since it does not have the necessary resources to
provide an adequate Android OS and to run navigational software with a GUI. The
next topic of consideration in our choice of microcontroller is the data processing
performance of the board. The microcontroller would need to possess the
computing power to run software that would be able to provide an interactive map and navigation options to the user as well as the ability to move to another menu in order to change the cart’s mode of operation and see various metrics concerning
cart operations. With these requirements in mind the design team came to the
conclusion that an Android Application should be used to easily create an application that was able to meet the functional requirements and multi-task all
application functions as well. While the ODROID C1 and BeagleBone Black can
both run Android distributions, the ODROID C1 has the necessary graphics hardware and libraries to generate the map fragment while the BeagleBone Black lacks the necessary hardware and built-in libraries to run OpenGL ES 2.0 graphics
acceleration.
2.1.5.3 Cost The next factors that were taken into consideration while deciding which one of the microcontrollers to use were the power cost and monetary cost of the chosen
board. The ODROID C1 draws 5W of power, while the BeagleBone Black and
Raspberry Pi would draw 2W and 3W of power, respectively. Since the
Beaglebone Black did not pass the functionality requirements for the project the
next best choice was the ODROID C1 at 5W of power. The monetary costs for all of the boards in consideration are as follows: Raspberry
Pi - $35, BeagleBone Black - $45, and ODROID C1 - $38. The BeagleBone Black
has the highest monetary cost of all the boards and since it did not meet the
functional requirements for the microcomputer it was factored out. The ODROID
C1 is cheaper than the BeagleBone Black and has more processing power yet draws more power than the Raspberry Pi and BeagleBone Black. Therefore the choice was made clear to the design team that the ODROID C1 would be the board
most suited to the highest priority requirements of the project.
19
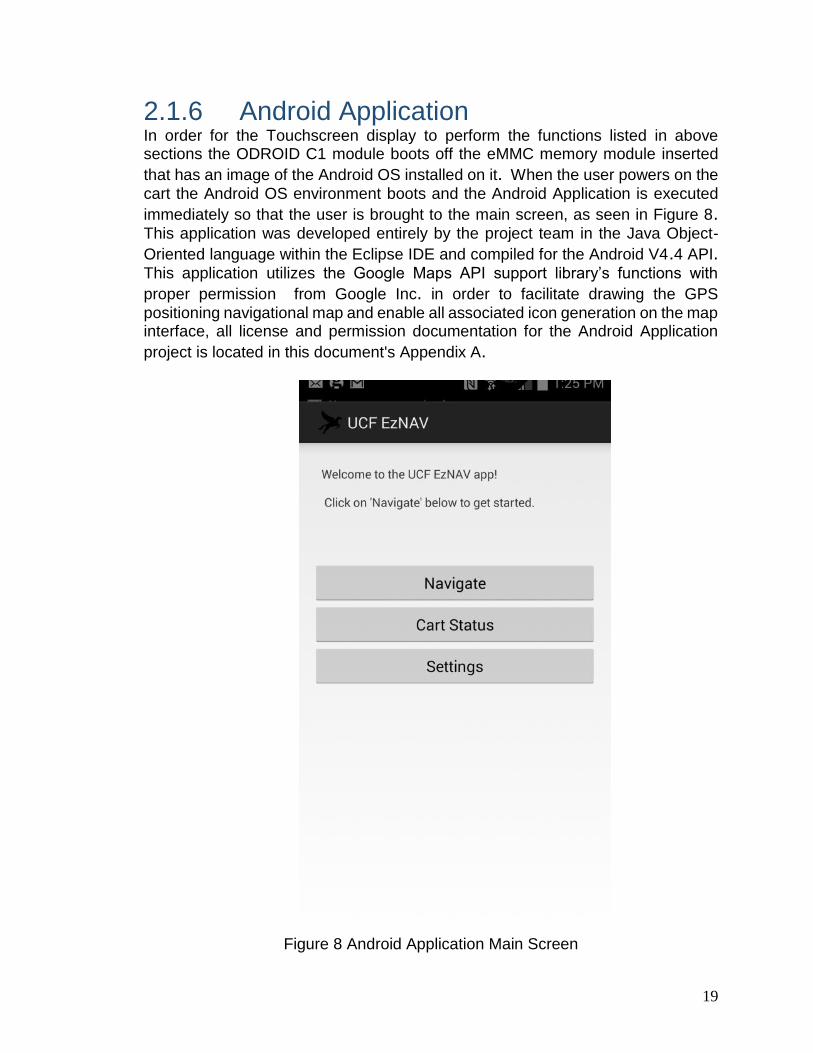
2.1.6 Android Application In order for the Touchscreen display to perform the functions listed in above sections the ODROID C1 module boots off the eMMC memory module inserted
that has an image of the Android OS installed on it. When the user powers on the
cart the Android OS environment boots and the Android Application is executed
immediately so that the user is brought to the main screen, as seen in Figure 8. This application was developed entirely by the project team in the Java Object-
Oriented language within the Eclipse IDE and compiled for the Android V4.4 API. This application utilizes the Google Maps API support library’s functions with
proper permission from Google Inc. in order to facilitate drawing the GPS
positioning navigational map and enable all associated icon generation on the map interface, all license and permission documentation for the Android Application
project is located in this document's Appendix A.
Figure 8 Android Application Main Screen
20
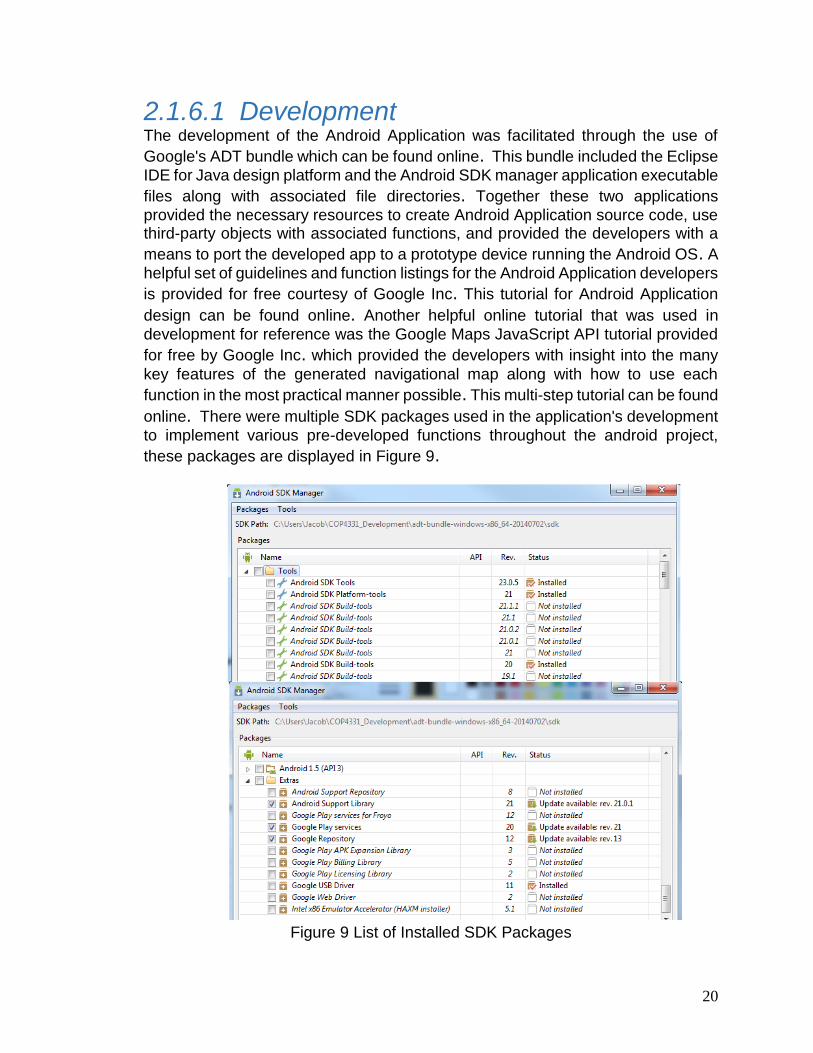
2.1.6.1 Development The development of the Android Application was facilitated through the use of
Google's ADT bundle which can be found online. This bundle included the Eclipse
IDE for Java design platform and the Android SDK manager application executable
files along with associated file directories. Together these two applications
provided the necessary resources to create Android Application source code, use third-party objects with associated functions, and provided the developers with a
means to port the developed app to a prototype device running the Android OS. A
helpful set of guidelines and function listings for the Android Application developers
is provided for free courtesy of Google Inc. This tutorial for Android Application
design can be found online. Another helpful online tutorial that was used in
development for reference was the Google Maps JavaScript API tutorial provided
for free by Google Inc. which provided the developers with insight into the many
key features of the generated navigational map along with how to use each
function in the most practical manner possible. This multi-step tutorial can be found
online. There were multiple SDK packages used in the application's development
to implement various pre-developed functions throughout the android project,
these packages are displayed in Figure 9.
Figure 9 List of Installed SDK Packages
21
2.1.6.2 Integration The developed Android Application was integrated into the working golf cart system by being loaded onto the eMMC memory card that is inserted into
the ODROID C1 microcomputer’s respective slot. The ODROID C1 module has
inputs and outputs connected through the pin array located on the module that are associated with the inputs and outputs of the other different modules throughout
the golf cart's electronic control system. The ODROID C1 module is connected to
the designed PCB with the MTK MT3339 GPS module and is able to communicate with the GPS module along with the Motor Controller Logic Board. It uses the connection with GPS module PCB to be able to send and receive data concerning the speed in the “Cart Status” screen’s fields as well as the user location in the
“Navigational” screen. This electrical signal data from the other module’s in the
cart’s design are sent and received directly from the Android Application via the
ODROID C1’s connected pins.
2.1.6.3 Runtime Environment The Android Application runs on the Android 4.4 KitKat mobile environment that is
imaged onto eMMC memory card located in the ODROID C1 board’s eMMC card
slot. The video signal output of the application is wired to the touchscreen display
through an HDMI video signal connection and provides user's with an interaction
similar to any other touchscreen device running the Android OS. The user’s
touchscreen input gestures are sent to the Android OS environment on the
ODROID C1 through a USB connection between the two modules. This
transmitted gesture data sent through the USB connection is directed to the Android OS environment for processing of the data, which then performs the
matching action associated with the user-input gesture. Both ODROID C1 board
and the touchscreen display receives 5V of power in the correct power connections that are provided to both modules through a 5V voltage regulator receiving 12V of
input from the cart's on-board power system.
The minimum Android SDK version that the application can be run on is version
8.0 and the target Android SDK version for this application is version 21.0. Since
this application uses navigation and location information through user GPS position as well as requiring information to be written to the device’s external storage, there must be permission declarations to allow such functions within the
application.
22
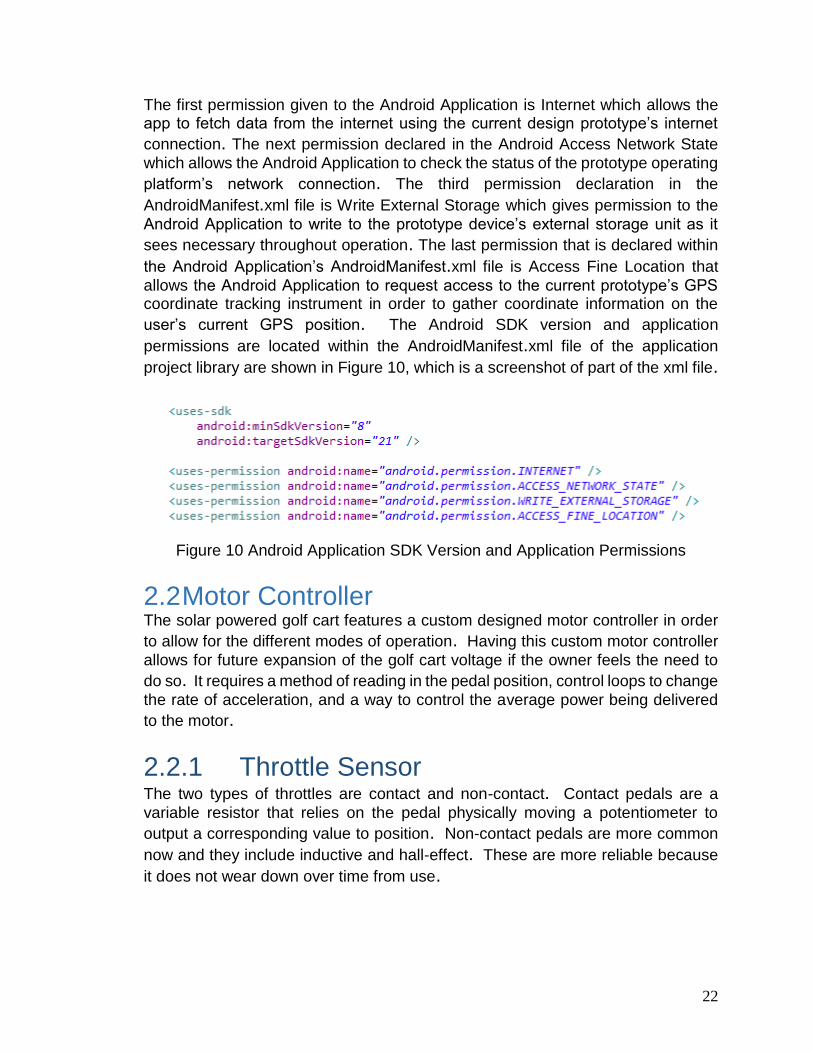
The first permission given to the Android Application is Internet which allows the app to fetch data from the internet using the current design prototype’s internet
connection. The next permission declared in the Android Access Network State
which allows the Android Application to check the status of the prototype operating
platform’s network connection. The third permission declaration in the
AndroidManifest.xml file is Write External Storage which gives permission to the
Android Application to write to the prototype device’s external storage unit as it
sees necessary throughout operation. The last permission that is declared within
the Android Application’s AndroidManifest.xml file is Access Fine Location that
allows the Android Application to request access to the current prototype’s GPS coordinate tracking instrument in order to gather coordinate information on the
user’s current GPS position. The Android SDK version and application
permissions are located within the AndroidManifest.xml file of the application
project library are shown in Figure 10, which is a screenshot of part of the xml file.
Figure 10 Android Application SDK Version and Application Permissions
2.2 Motor Controller The solar powered golf cart features a custom designed motor controller in order
to allow for the different modes of operation. Having this custom motor controller
allows for future expansion of the golf cart voltage if the owner feels the need to
do so. It requires a method of reading in the pedal position, control loops to change
the rate of acceleration, and a way to control the average power being delivered
to the motor.
2.2.1 Throttle Sensor The two types of throttles are contact and non-contact. Contact pedals are a
variable resistor that relies on the pedal physically moving a potentiometer to
output a corresponding value to position. Non-contact pedals are more common
now and they include inductive and hall-effect. These are more reliable because
it does not wear down over time from use.
23
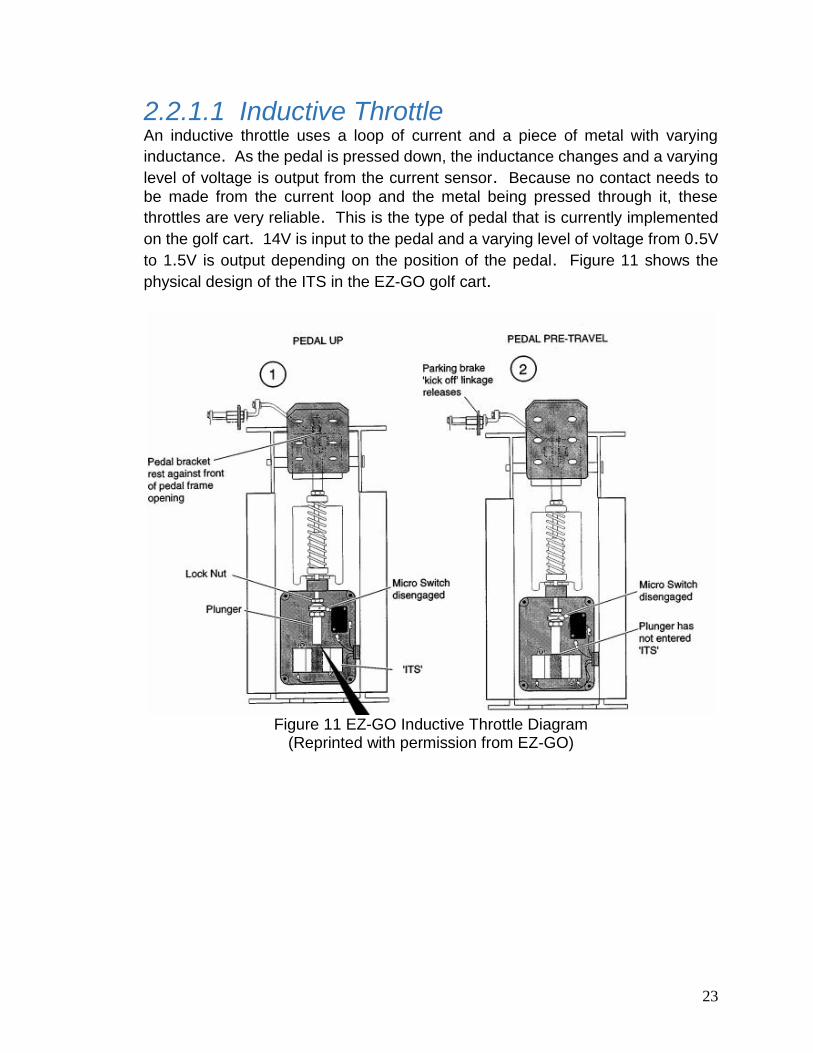
2.2.1.1 Inductive Throttle An inductive throttle uses a loop of current and a piece of metal with varying
inductance. As the pedal is pressed down, the inductance changes and a varying
level of voltage is output from the current sensor. Because no contact needs to
be made from the current loop and the metal being pressed through it, these
throttles are very reliable. This is the type of pedal that is currently implemented
on the golf cart. 14V is input to the pedal and a varying level of voltage from 0.5V
to 1.5V is output depending on the position of the pedal. Figure 11 shows the
physical design of the ITS in the EZ-GO golf cart.
Figure 11 EZ-GO Inductive Throttle Diagram
(Reprinted with permission from EZ-GO)
24
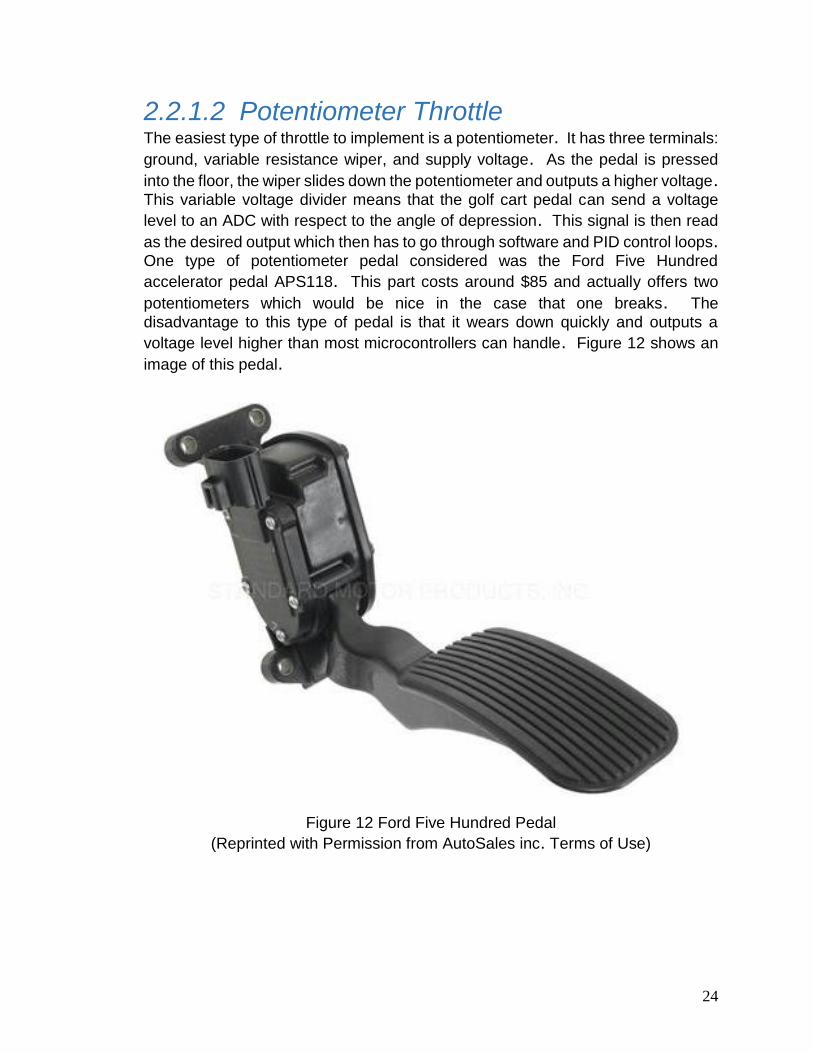
2.2.1.2 Potentiometer Throttle The easiest type of throttle to implement is a potentiometer. It has three terminals:
ground, variable resistance wiper, and supply voltage. As the pedal is pressed
into the floor, the wiper slides down the potentiometer and outputs a higher voltage. This variable voltage divider means that the golf cart pedal can send a voltage
level to an ADC with respect to the angle of depression. This signal is then read
as the desired output which then has to go through software and PID control loops. One type of potentiometer pedal considered was the Ford Five Hundred
accelerator pedal APS118. This part costs around $85 and actually offers two
potentiometers which would be nice in the case that one breaks. The
disadvantage to this type of pedal is that it wears down quickly and outputs a
voltage level higher than most microcontrollers can handle. Figure 12 shows an
image of this pedal.
Figure 12 Ford Five Hundred Pedal
(Reprinted with Permission from AutoSales inc. Terms of Use)
25
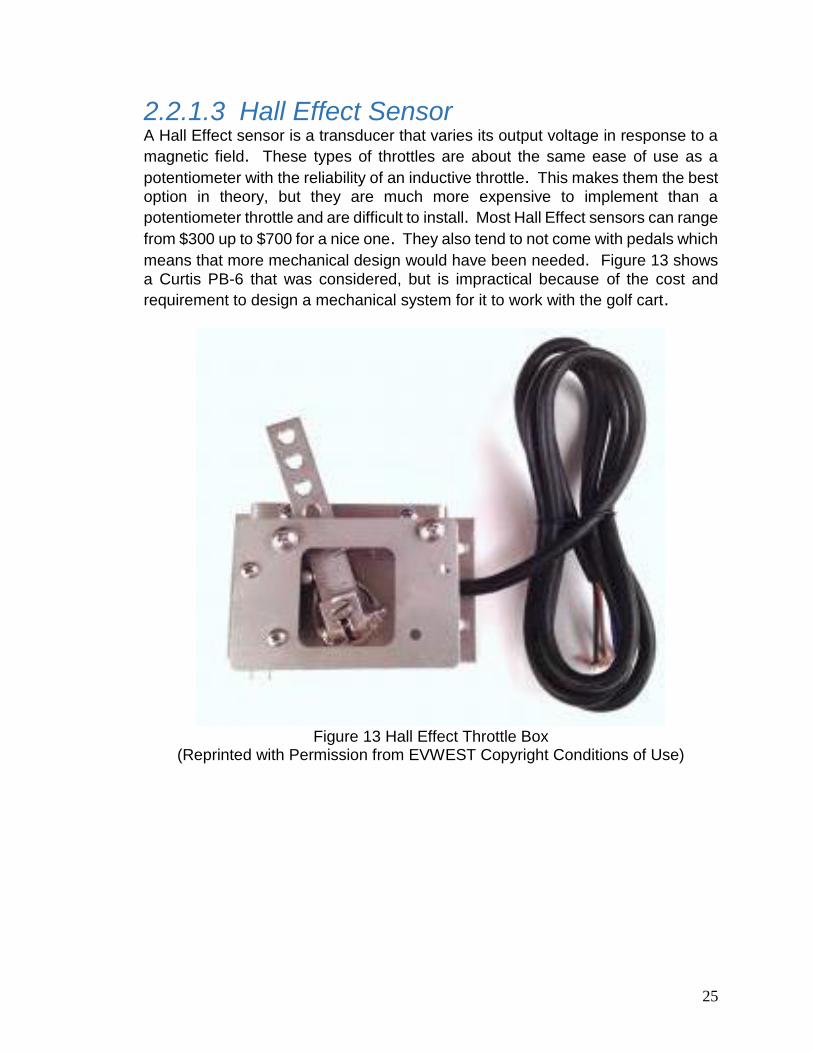
2.2.1.3 Hall Effect Sensor A Hall Effect sensor is a transducer that varies its output voltage in response to a
magnetic field. These types of throttles are about the same ease of use as a
potentiometer with the reliability of an inductive throttle. This makes them the best
option in theory, but they are much more expensive to implement than a
potentiometer throttle and are difficult to install. Most Hall Effect sensors can range
from $300 up to $700 for a nice one. They also tend to not come with pedals which
means that more mechanical design would have been needed. Figure 13 shows
a Curtis PB-6 that was considered, but is impractical because of the cost and
requirement to design a mechanical system for it to work with the golf cart.
Figure 13 Hall Effect Throttle Box
(Reprinted with Permission from EVWEST Copyright Conditions of Use)
26
2.2.2 Software Control The motor controller software is able to monitor various statuses at the same time
and be able to output PWM signals. All parts chosen were based on 3.3V input so
that it would be compatible with the status monitoring functions.
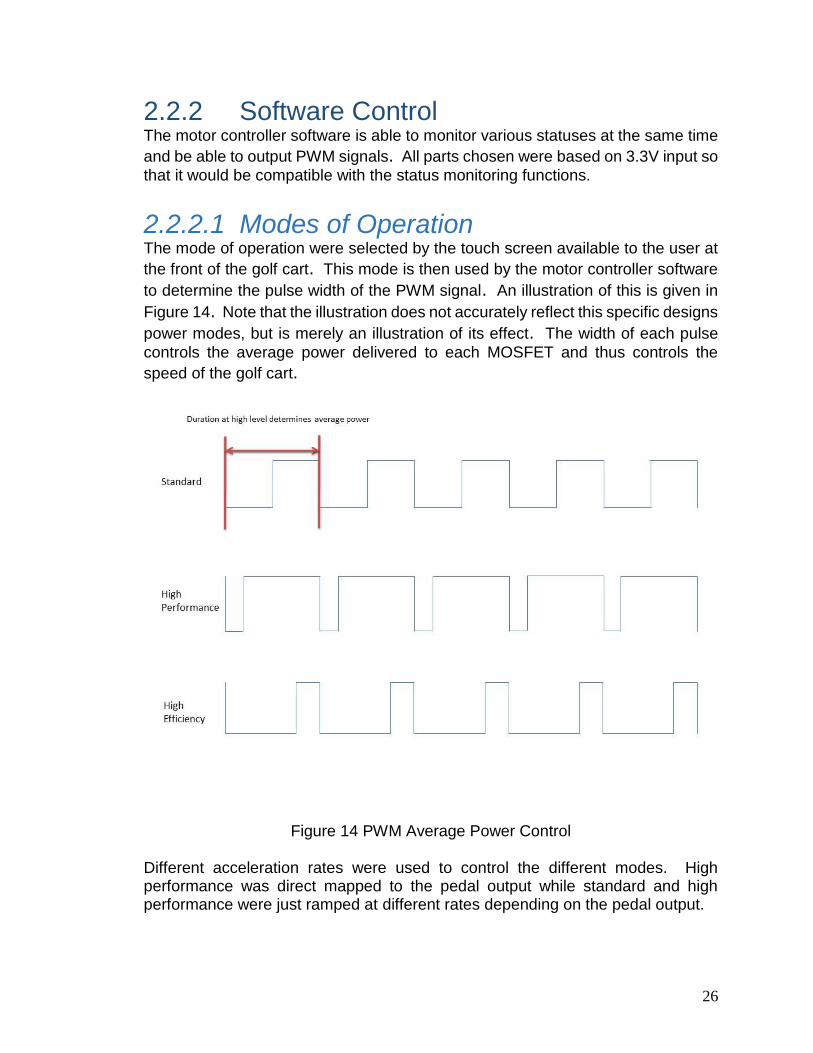
2.2.2.1 Modes of Operation The mode of operation were selected by the touch screen available to the user at
the front of the golf cart. This mode is then used by the motor controller software
to determine the pulse width of the PWM signal. An illustration of this is given in
Figure 14. Note that the illustration does not accurately reflect this specific designs
power modes, but is merely an illustration of its effect. The width of each pulse
controls the average power delivered to each MOSFET and thus controls the
speed of the golf cart.
Figure 14 PWM Average Power Control
Different acceleration rates were used to control the different modes. High performance was direct mapped to the pedal output while standard and high performance were just ramped at different rates depending on the pedal output.
27
2.2.2.2 PID Control Loops A proportional-integral-derivative controller (PID controller) is a control loop feedback tool that is used in controlling the rate at which values reach a desired
set point. In this case, speed is the desired value to be controlled. If the golf cart
accelerates too fast or too slow it would have felt weird. A PID controller calculates
an error value as the difference between a measured process variable (PWM
width) and a desired set point (pedal position). The controller attempts to minimize
the error by adjusting the process through use of a three variables: the
proportional, the integral and derivative values, denoted Kp, Ki, and Kd. Kp
depends on the present error, Ki on the accumulation of past errors, and Kd is a
prediction of future errors based on current rate of change. For the motor
controller, the throttle is going to be the desired set point of the algorithm and the
current being passed through the motor is going to be the current value. The
difference between these two were the error that calculation is done on.
2.2.2.3 Mode Communication A few methods of communication considered between the motor controller and the
Touchscreen Display includes SPI, I2C, UART, and direct GPIO connection. The
design considerations that were accounted for is speed of the connection, number
of lines, and robustness of the signal. Robustness is the main priority for this
project because there was not much data passing through to the Touchscreen
Display other than what mode to operate in. This means that unless some kind of
programmability through the Touchscreen Display is added later, there is no need for high speed communication lines as long as the connection is consistent and
reliable.
2.2.2.3.1 SPI Serial Peripheral Interface (SPI) is an interface bus commonly used to send data between microcontrollers and small peripherals such as off-chip memory and
sensors. It has a clock pin, data out, data in, and chip select wire. This kind of
communication would allow for the motor controller and Touchscreen Display to
be talking at the same time. For a high speed communication line this would be
great, but because the two MCU’s were most likely only transmitting what mode it
is in, this may not be the best option.
28
2.2.2.3.2 I2C Inter-Integrated Circuit (I2C) is a multi-master, multi-slave communication line that
is used to communicate at low speeds with two wires. A clock line and Data line
can be controlled by any of the devices along the chain, but only one can be talking
at a time. This type of communication would allow for fewer wires between the
motor controller and Touchscreen Display, but would limit them from talking back
and forth.
2.2.2.3.3 UART Universal Asynchronous Receiver/Transmitter (UART) uses two wires, transmit
and receive, to communicate between two devices. The line is held high until there
is data going across in one direction and at that point, the other device would read
in each bit in serial. This type of communication line also requires two wires, but
would be much easier to implement than the I2C line. Data could also go in both
directions at the same time.
2.2.2.3.4 Direct GPIO Direct GPIO wire to wire connection would be a very simple solution to
communicate what power setting the golf cart is in. An easy digital read function
would tell the motor controller what mode it should be in.
2.2.2.4 Speed Sensors Newer EZGO golf carts have a built-in speed sensor that the model we are using
does not have. Therefor it is not feasible to have the motor controller calculate
speed from the motor. The speed was determined from the Touchscreen Display
microcontroller.
2.2.3 Circuit Design Initial research into open source motor controllers showed that the main concerns for circuit design include the logic portion, direction control, reliable shutdown, and
heat distribution. The logic contains a microcontroller that senses current and
voltage and outputs a corresponding PWM signal, reliable shutdown involves hard overcurrent shutdown that removed power in the event that too much current is slowing, and heat distribution of the MOSFETs so that they do not just overheat
and kill themselves. If chosen carefully, the motor controller should work flawlessly
and be easier to maintain than an OEM motor controller.
29
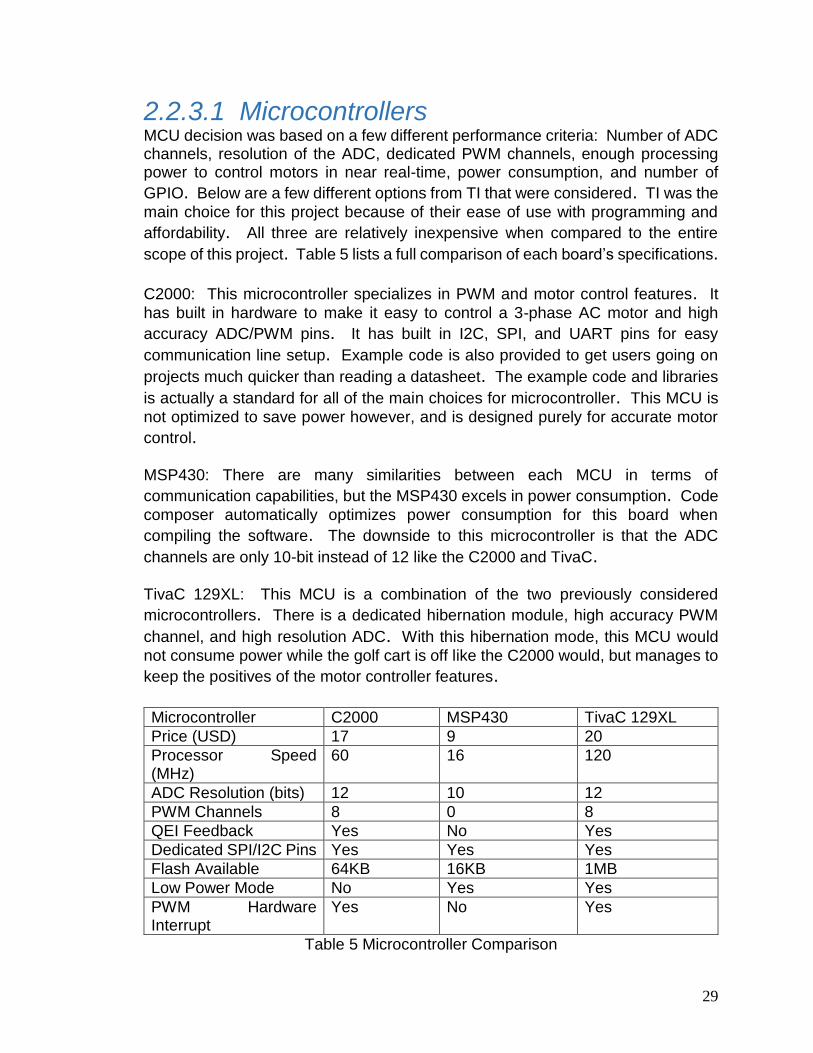
2.2.3.1 Microcontrollers MCU decision was based on a few different performance criteria: Number of ADC channels, resolution of the ADC, dedicated PWM channels, enough processing power to control motors in near real-time, power consumption, and number of
GPIO. Below are a few different options from TI that were considered. TI was the
main choice for this project because of their ease of use with programming and
affordability. All three are relatively inexpensive when compared to the entire
scope of this project. Table 5 lists a full comparison of each board’s specifications.
C2000: This microcontroller specializes in PWM and motor control features. It has built in hardware to make it easy to control a 3-phase AC motor and high
accuracy ADC/PWM pins. It has built in I2C, SPI, and UART pins for easy
communication line setup. Example code is also provided to get users going on
projects much quicker than reading a datasheet. The example code and libraries
is actually a standard for all of the main choices for microcontroller. This MCU is
not optimized to save power however, and is designed purely for accurate motor
control. MSP430: There are many similarities between each MCU in terms of
communication capabilities, but the MSP430 excels in power consumption. Code
composer automatically optimizes power consumption for this board when
compiling the software. The downside to this microcontroller is that the ADC
channels are only 10-bit instead of 12 like the C2000 and TivaC. TivaC 129XL: This MCU is a combination of the two previously considered
microcontrollers. There is a dedicated hibernation module, high accuracy PWM
channel, and high resolution ADC. With this hibernation mode, this MCU would
not consume power while the golf cart is off like the C2000 would, but manages to
keep the positives of the motor controller features. Microcontroller C2000 MSP430 TivaC 129XL
Price (USD) 17 9 20
Processor Speed (MHz)
60 16 120
ADC Resolution (bits) 12 10 12
PWM Channels 8 0 8
QEI Feedback Yes No Yes
Dedicated SPI/I2C Pins Yes Yes Yes
Flash Available 64KB 16KB 1MB
Low Power Mode No Yes Yes
PWM Hardware Interrupt
Yes No Yes
Table 5 Microcontroller Comparison

30
The final decision was to go with the MSP430G2553 because of the design simplicity. A custom board was designed based on this reference and can be programmed through the Launchpad using Energia. The MSP430 comes in DIP packages which are much easier to solder into place than the SOT packages of the C2000 and TIVAC microcontrollers. For an inexperienced circuit builder, this saves a lot of time in not having to use solder paste and getting a fine-tip soldering iron. The power consumption from the MSP430 was also a huge factor because the focus for this project was power efficiency and this chip meets that requirement to consume as little power as possible.
2.2.3.2 Programming Software was a key component in this motor controller for safety precautions and
PID control to smooth out the motor acceleration. Without reliable software, the
golf cart would have accelerate jumpy and may even get stuck in an accelerating
mode. The software environment used depended largely on what microcontroller
is chosen. For TI microcontrollers, the two software options are Code Composer
and Energia. Atmel microcontrollers have the infamous Arduino software
environment which is actually very similar to Energia. Many of these different
vendors actually run off of the same architecture so some of them are capable of interchanging environments as long as it is setup correctly with the corresponding
drivers and include files.
2.2.3.2.1 Code Composer Studio Code Composer Studio (CCS) is a very powerful programming tool provided by Texas Instruments (TI) that gives direct access to much of the microcontroller, but
sacrifices ease of use to do so. Code is written in C or C++ which makes it easy
for embedded programmers to pick up with a language that is familiar to them. It has utilities such as memory viewer and API’s for many different Launchpad
developer boards. After seeing how much time and lines of code it took just to get
an LED blinking, Energia definitely seems like the way to go.
31
2.2.3.2.2 Energia Energia is also provided by TI, but is different in many ways. This applications
sacrifices in-depth tools for ease of use. They have predefined functions for PWM
output, ADC reads, and much easier syntax compared to C or C++. Due to the
simple nature of the programming involved with this project, this was the preferred
option. Control over ADC, PWM, Sleep Mode, and GPIO are the most important
functions to this project and Energia is much easier to use than code composer for
each one. Energia programs have two main portions: Setup and Loop. Setup is
done in the beginning where you define your pins and their purpose: input/output
and analog/digital. Loop is where the actual code is executed endlessly until the
user decides to cancel it. This negates the possibility of using a watch dog timer
to avoid crashes which is fine because in a worst case scenario for the driver, the key is able to kill power and the brakes are mechanical so this is not a safety
concern.
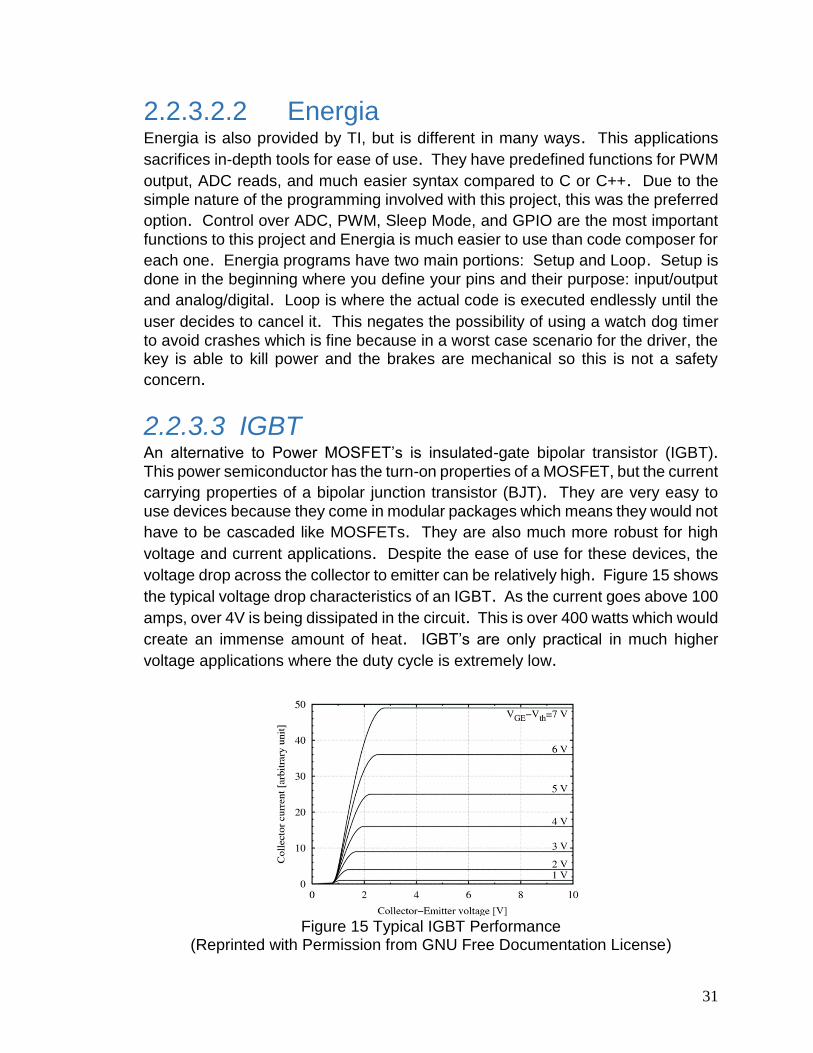
2.2.3.3 IGBT An alternative to Power MOSFET’s is insulated-gate bipolar transistor (IGBT). This power semiconductor has the turn-on properties of a MOSFET, but the current
carrying properties of a bipolar junction transistor (BJT). They are very easy to
use devices because they come in modular packages which means they would not
have to be cascaded like MOSFETs. They are also much more robust for high
voltage and current applications. Despite the ease of use for these devices, the
voltage drop across the collector to emitter can be relatively high. Figure 15 shows
the typical voltage drop characteristics of an IGBT. As the current goes above 100
amps, over 4V is being dissipated in the circuit. This is over 400 watts which would
create an immense amount of heat. IGBT’s are only practical in much higher
voltage applications where the duty cycle is extremely low.
Figure 15 Typical IGBT Performance
(Reprinted with Permission from GNU Free Documentation License)
32
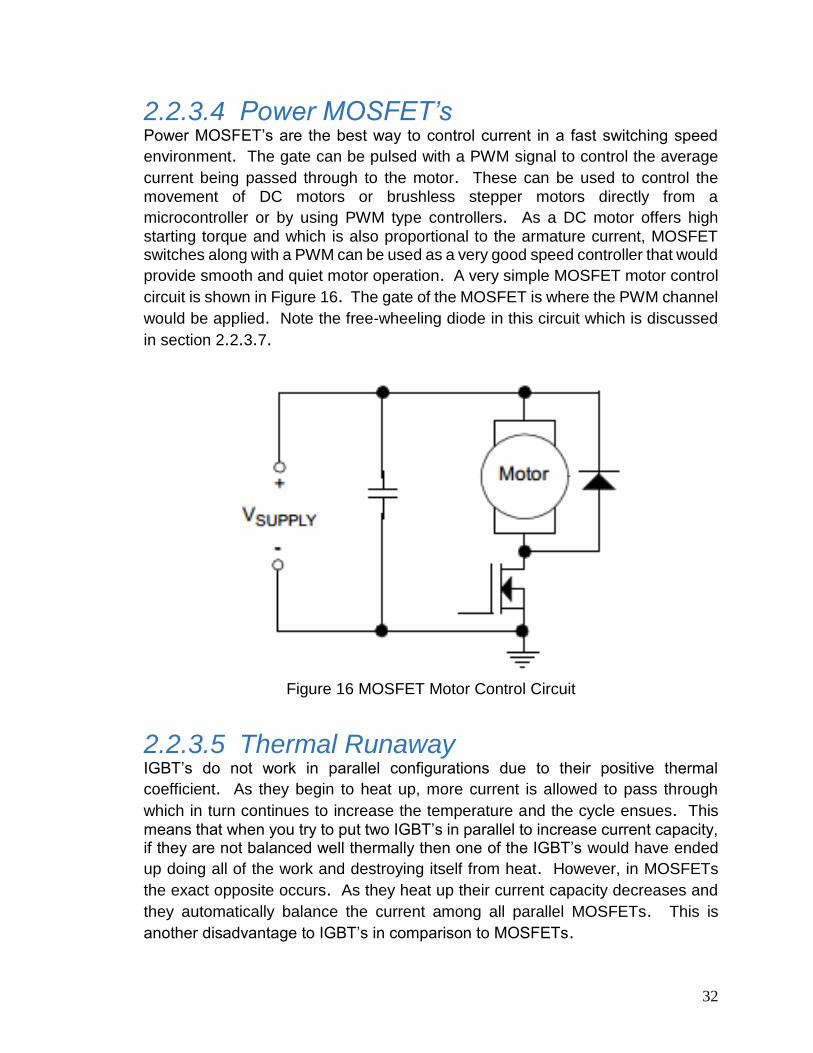
2.2.3.4 Power MOSFET’s Power MOSFET’s are the best way to control current in a fast switching speed
environment. The gate can be pulsed with a PWM signal to control the average
current being passed through to the motor. These can be used to control the
movement of DC motors or brushless stepper motors directly from a
microcontroller or by using PWM type controllers. As a DC motor offers high
starting torque and which is also proportional to the armature current, MOSFET switches along with a PWM can be used as a very good speed controller that would
provide smooth and quiet motor operation. A very simple MOSFET motor control
circuit is shown in Figure 16. The gate of the MOSFET is where the PWM channel
would be applied. Note the free-wheeling diode in this circuit which is discussed
in section 2.2.3.7.
Figure 16 MOSFET Motor Control Circuit
2.2.3.5 Thermal Runaway IGBT’s do not work in parallel configurations due to their positive thermal
coefficient. As they begin to heat up, more current is allowed to pass through
which in turn continues to increase the temperature and the cycle ensues. This
means that when you try to put two IGBT’s in parallel to increase current capacity, if they are not balanced well thermally then one of the IGBT’s would have ended
up doing all of the work and destroying itself from heat. However, in MOSFETs
the exact opposite occurs. As they heat up their current capacity decreases and
they automatically balance the current among all parallel MOSFETs. This is
another disadvantage to IGBT’s in comparison to MOSFETs.
33
2.2.3.6 Pre-Charge Circuit The PWM motor controller that was used in this golf cart has a sizable bank of capacitors on its input to smooth out voltage spikes or dropouts that may occur in
unreliable sources such as batteries. If you apply voltage to a bank of capacitors,
it is initially seen as a short circuit. If there is very little resistance in the circuit, like
a closing contactor with no pre-charge, then the current is very high. Nearly all of
the battery pack voltage is across the closing contacts. The large voltage
difference and sudden high current (known as an inrush current) can cause
damage to, and in extreme cases, welding of the relay contacts. This can all be
prevented by the use of a pre-charge resistor across the contacts of the main
power relay. The pre-charge resistor allows the capacitors in the controller to
slowly charge before the contactor closes. This means that there is less voltage
across the closing contacts and little or no inrush current. In order to do this, the
contactor is held open for a certain amount of time to allow for charging to complete
and then finally closing the switch. Fortunately, the golf cart has a solenoid circuit
built in that performs this contactor function. The microswitch that activates when
the pedal is pressed down is how this contact is made. It is held in low current
mode pre-charge state until the micro-switch sends the battery pack voltage to
connect the solenoid to the short circuit. A picture for easier conceptualization is
shown in Figure 17.
Figure 17 Pre-Charge Circuit
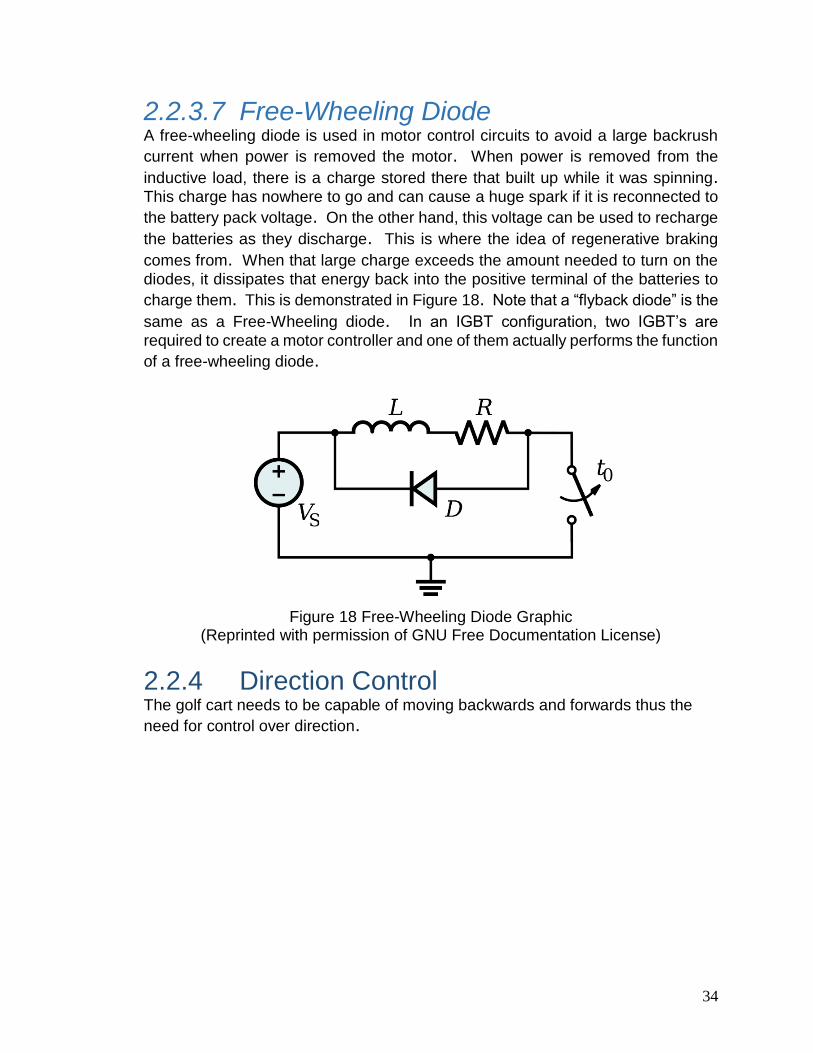
34
2.2.3.7 Free-Wheeling Diode A free-wheeling diode is used in motor control circuits to avoid a large backrush
current when power is removed the motor. When power is removed from the
inductive load, there is a charge stored there that built up while it was spinning. This charge has nowhere to go and can cause a huge spark if it is reconnected to
the battery pack voltage. On the other hand, this voltage can be used to recharge
the batteries as they discharge. This is where the idea of regenerative braking
comes from. When that large charge exceeds the amount needed to turn on the
diodes, it dissipates that energy back into the positive terminal of the batteries to
charge them. This is demonstrated in Figure 18. Note that a “flyback diode” is the
same as a Free-Wheeling diode. In an IGBT configuration, two IGBT’s are
required to create a motor controller and one of them actually performs the function
of a free-wheeling diode.
Figure 18 Free-Wheeling Diode Graphic
(Reprinted with permission of GNU Free Documentation License)
2.2.4 Direction Control The golf cart needs to be capable of moving backwards and forwards thus the
need for control over direction.
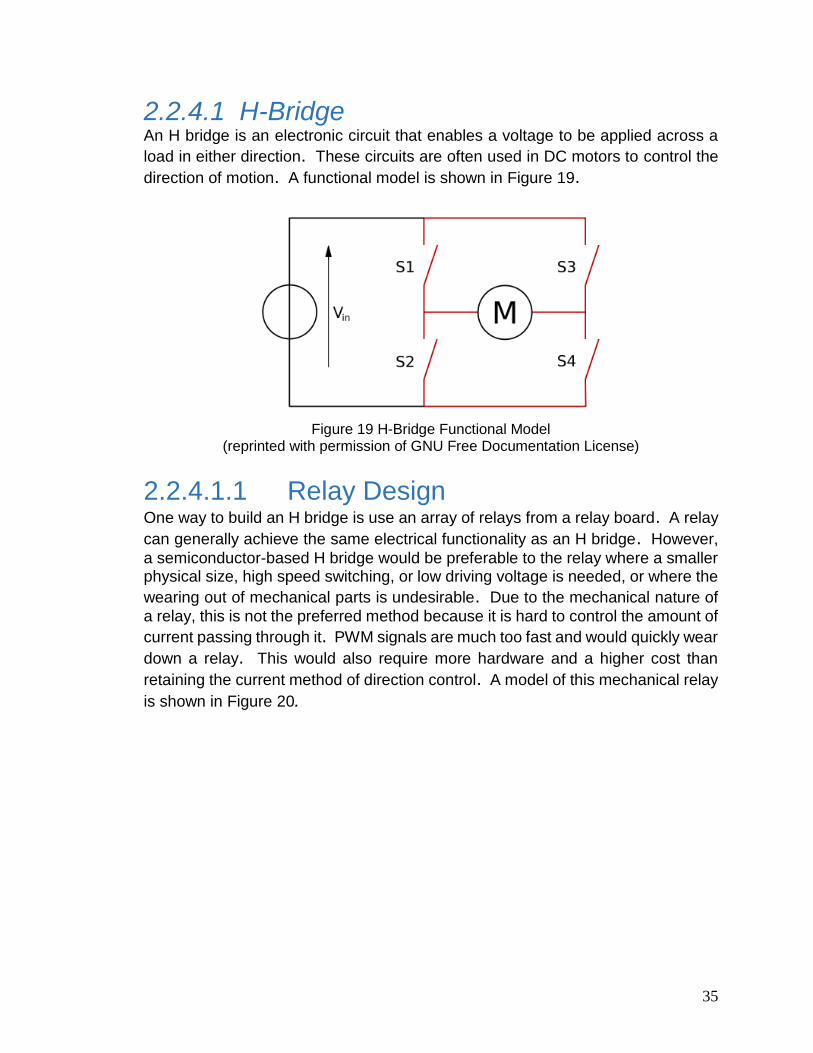
35
2.2.4.1 H-Bridge An H bridge is an electronic circuit that enables a voltage to be applied across a
load in either direction. These circuits are often used in DC motors to control the
direction of motion. A functional model is shown in Figure 19.
Figure 19 H-Bridge Functional Model
(reprinted with permission of GNU Free Documentation License)
2.2.4.1.1 Relay Design One way to build an H bridge is use an array of relays from a relay board. A relay
can generally achieve the same electrical functionality as an H bridge. However,
a semiconductor-based H bridge would be preferable to the relay where a smaller physical size, high speed switching, or low driving voltage is needed, or where the
wearing out of mechanical parts is undesirable. Due to the mechanical nature of
a relay, this is not the preferred method because it is hard to control the amount of
current passing through it. PWM signals are much too fast and would quickly wear
down a relay. This would also require more hardware and a higher cost than
retaining the current method of direction control. A model of this mechanical relay
is shown in Figure 20.
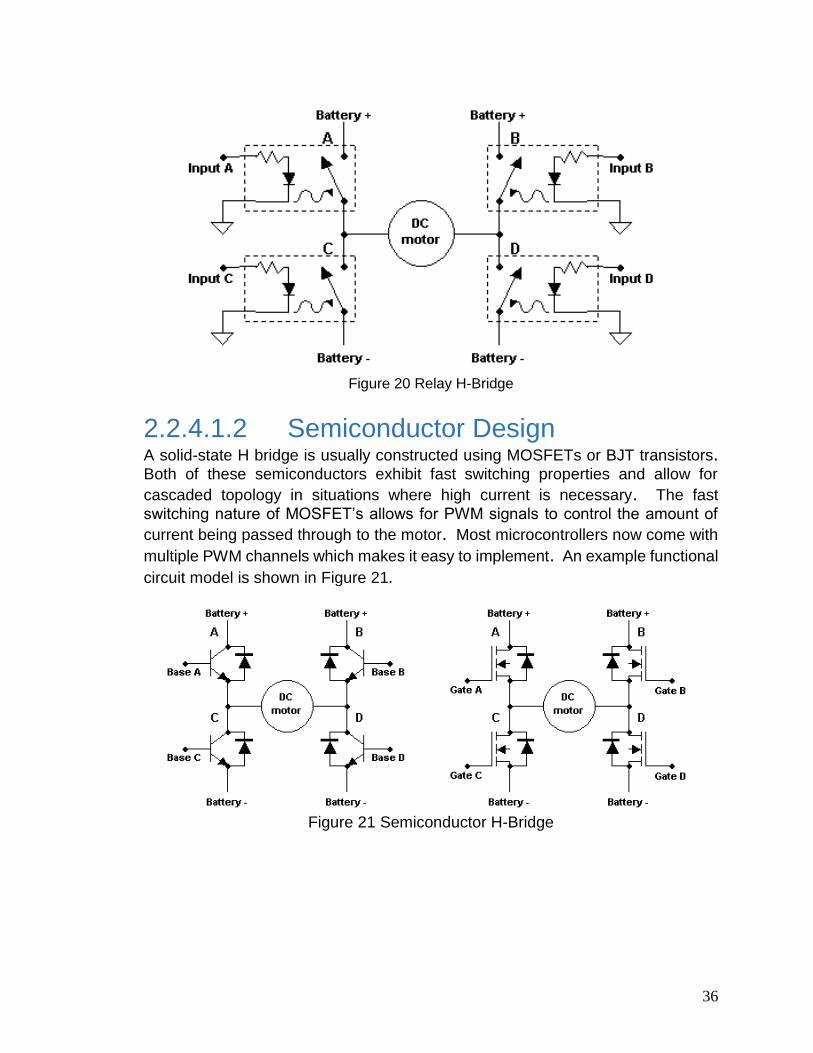
36
Figure 20 Relay H-Bridge
2.2.4.1.2 Semiconductor Design A solid-state H bridge is usually constructed using MOSFETs or BJT transistors. Both of these semiconductors exhibit fast switching properties and allow for
cascaded topology in situations where high current is necessary. The fast
switching nature of MOSFET’s allows for PWM signals to control the amount of
current being passed through to the motor. Most microcontrollers now come with
multiple PWM channels which makes it easy to implement. An example functional
circuit model is shown in Figure 21.
Figure 21 Semiconductor H-Bridge
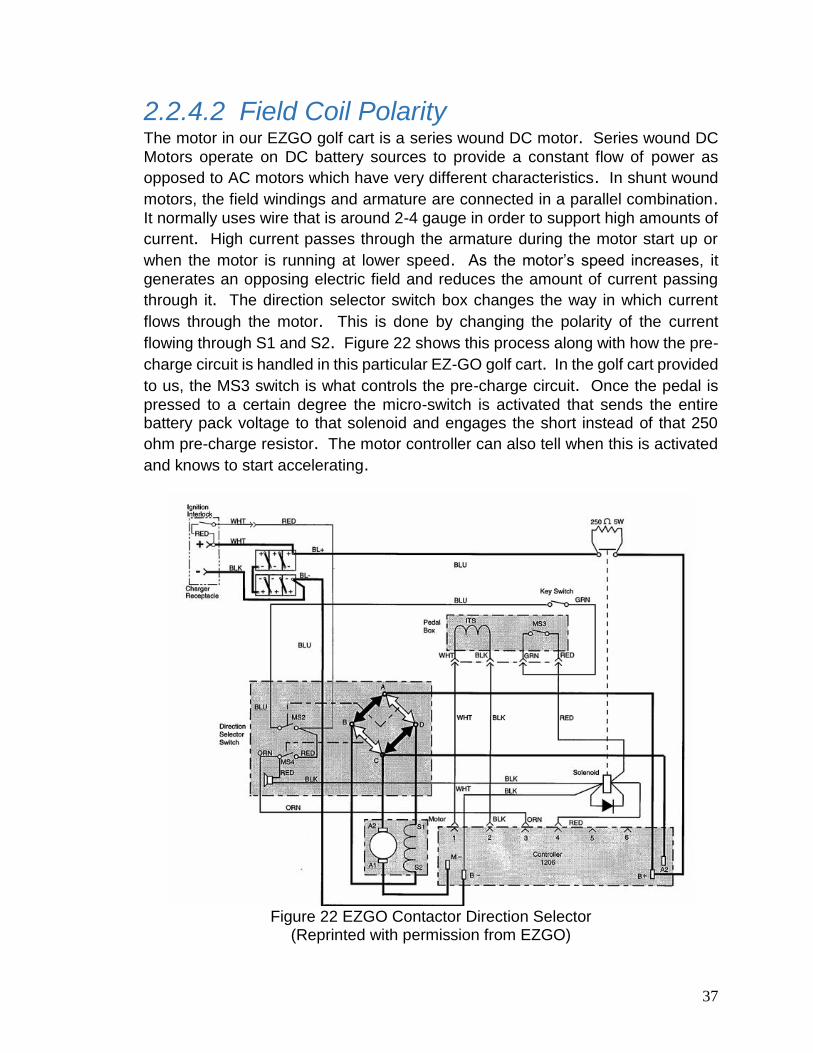
37
2.2.4.2 Field Coil Polarity The motor in our EZGO golf cart is a series wound DC motor. Series wound DC
Motors operate on DC battery sources to provide a constant flow of power as
opposed to AC motors which have very different characteristics. In shunt wound
motors, the field windings and armature are connected in a parallel combination. It normally uses wire that is around 2-4 gauge in order to support high amounts of
current. High current passes through the armature during the motor start up or
when the motor is running at lower speed. As the motor’s speed increases, it
generates an opposing electric field and reduces the amount of current passing
through it. The direction selector switch box changes the way in which current
flows through the motor. This is done by changing the polarity of the current
flowing through S1 and S2. Figure 22 shows this process along with how the pre-
charge circuit is handled in this particular EZ-GO golf cart. In the golf cart provided
to us, the MS3 switch is what controls the pre-charge circuit. Once the pedal is
pressed to a certain degree the micro-switch is activated that sends the entire battery pack voltage to that solenoid and engages the short instead of that 250
ohm pre-charge resistor. The motor controller can also tell when this is activated
and knows to start accelerating.
Figure 22 EZGO Contactor Direction Selector
(Reprinted with permission from EZGO)
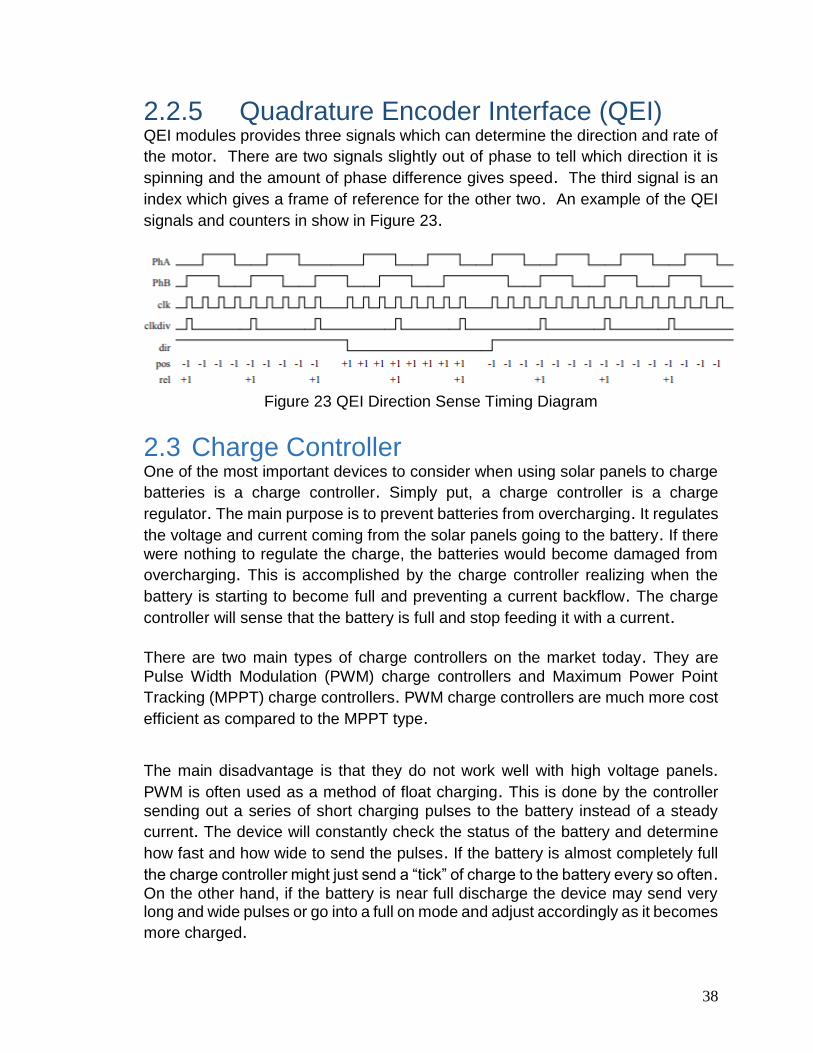
38
2.2.5 Quadrature Encoder Interface (QEI) QEI modules provides three signals which can determine the direction and rate of
the motor. There are two signals slightly out of phase to tell which direction it is
spinning and the amount of phase difference gives speed. The third signal is an
index which gives a frame of reference for the other two. An example of the QEI
signals and counters in show in Figure 23.
Figure 23 QEI Direction Sense Timing Diagram
2.3 Charge Controller One of the most important devices to consider when using solar panels to charge
batteries is a charge controller. Simply put, a charge controller is a charge
regulator. The main purpose is to prevent batteries from overcharging. It regulates
the voltage and current coming from the solar panels going to the battery. If there
were nothing to regulate the charge, the batteries would become damaged from
overcharging. This is accomplished by the charge controller realizing when the
battery is starting to become full and preventing a current backflow. The charge
controller will sense that the battery is full and stop feeding it with a current.
There are two main types of charge controllers on the market today. They are
Pulse Width Modulation (PWM) charge controllers and Maximum Power Point
Tracking (MPPT) charge controllers. PWM charge controllers are much more cost
efficient as compared to the MPPT type.
The main disadvantage is that they do not work well with high voltage panels. PWM is often used as a method of float charging. This is done by the controller
sending out a series of short charging pulses to the battery instead of a steady
current. The device will constantly check the status of the battery and determine
how fast and how wide to send the pulses. If the battery is almost completely full
the charge controller might just send a “tick” of charge to the battery every so often. On the other hand, if the battery is near full discharge the device may send very long and wide pulses or go into a full on mode and adjust accordingly as it becomes
more charged.

39
The panels we used provide us with a nominal ~60 volts. Compare that with
respect to the 36 volts the batteries will provide, the PWM charge controller would not work well because the input voltage from our panels is nearly double that of
the battery bank. So while the panels should be able to output 60 volts, the
batteries are going to receive their 36 volts for full charge but we will be losing the
other 20 volts or so. This was why the MPPT charge controller was the better
option in our case. The MPPT charge controller tracks the maximum power from
the panels as sunlight or weather conditions vary. This can easily be seen from a graph of a current versus voltage curve.
2.3.1 Maximum Power Point Tracking (MPPT) Before we could begin discussing types of charge controllers or design ideas we needed to have an understanding of how maximum power point tracking (MPPT)
works. A MPPT charge controller is a DC to DC converter that finds the best match
between the solar panels and the battery bank. More simply, it converts a higher
voltage DC output from the solar panels to a lower voltage needed to charge the
batteries. Therefore, the charge controller looks at the output of the panels and
compares it to the battery voltage. It then figures out the most efficient power point
and then converts this to the best voltage to get maximum amps into the battery. It essentially takes a high DC voltage, converts it to a high frequency AC and then
back to match the best DC voltage for the battery. Considering the graph in Figure
24 we can see how MPPT drastically provides a 24 V battery with the maximum
charge. Nowadays this is usually done digitally and are controlled by
microprocessors. Sometimes these are called Smart Power Trackers. These
microprocessors also help to adjust the maximum power point when temperature
and light conditions vary throughout a typical day.
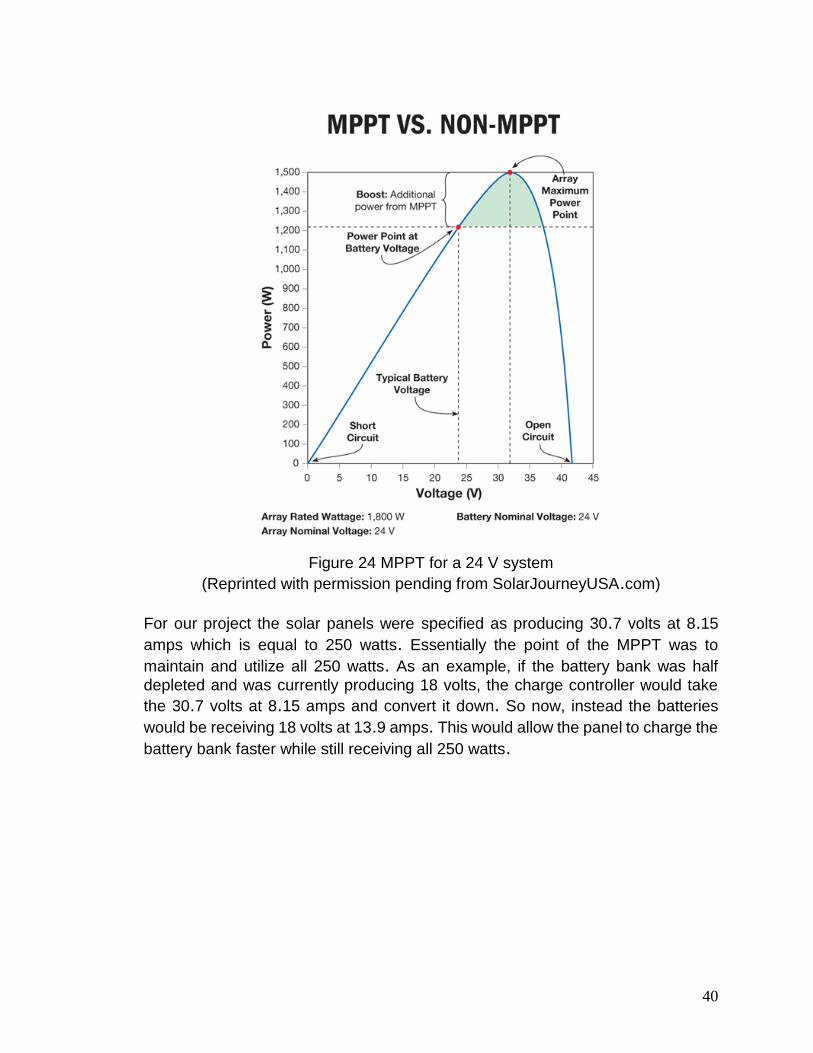
40
Figure 24 MPPT for a 24 V system
(Reprinted with permission pending from SolarJourneyUSA.com)
For our project the solar panels were specified as producing 30.7 volts at 8.15
amps which is equal to 250 watts. Essentially the point of the MPPT was to
maintain and utilize all 250 watts. As an example, if the battery bank was half
depleted and was currently producing 18 volts, the charge controller would take
the 30.7 volts at 8.15 amps and convert it down. So now, instead the batteries
would be receiving 18 volts at 13.9 amps. This would allow the panel to charge the
battery bank faster while still receiving all 250 watts.
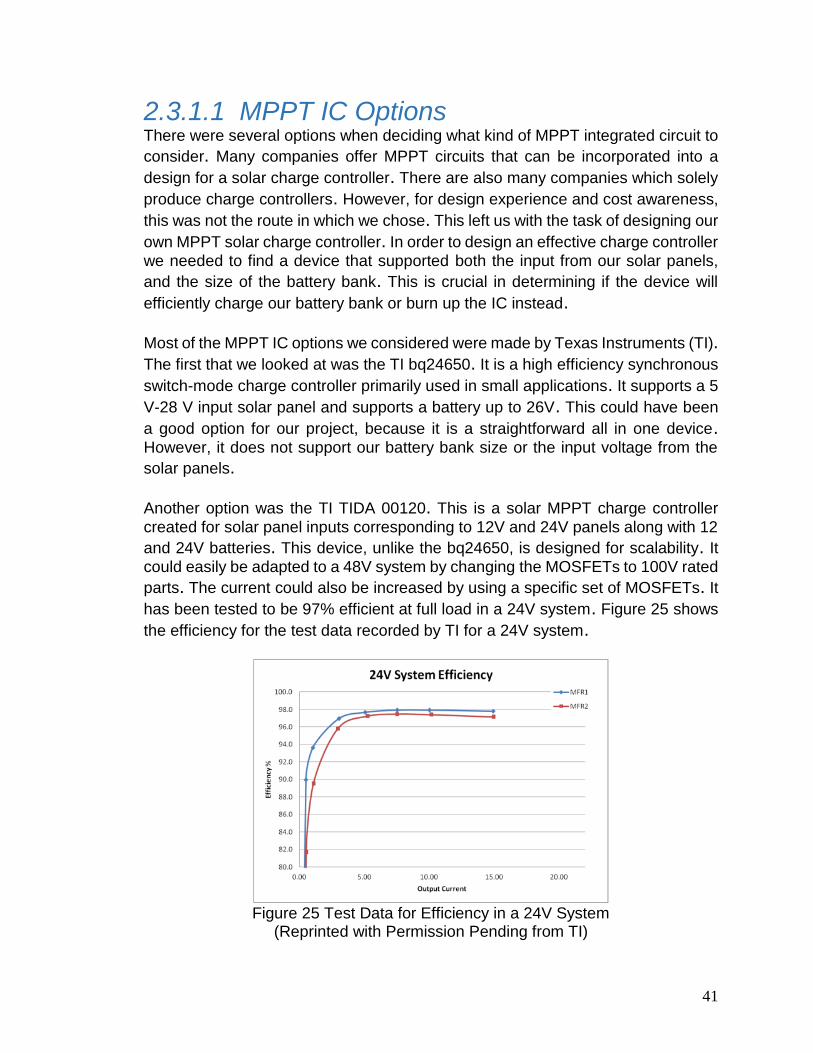
41
2.3.1.1 MPPT IC Options There were several options when deciding what kind of MPPT integrated circuit to
consider. Many companies offer MPPT circuits that can be incorporated into a
design for a solar charge controller. There are also many companies which solely
produce charge controllers. However, for design experience and cost awareness,
this was not the route in which we chose. This left us with the task of designing our
own MPPT solar charge controller. In order to design an effective charge controller
we needed to find a device that supported both the input from our solar panels,
and the size of the battery bank. This is crucial in determining if the device will
efficiently charge our battery bank or burn up the IC instead.
Most of the MPPT IC options we considered were made by Texas Instruments (TI). The first that we looked at was the TI bq24650. It is a high efficiency synchronous
switch-mode charge controller primarily used in small applications. It supports a 5
V-28 V input solar panel and supports a battery up to 26V. This could have been
a good option for our project, because it is a straightforward all in one device. However, it does not support our battery bank size or the input voltage from the
solar panels.
Another option was the TI TIDA 00120. This is a solar MPPT charge controller
created for solar panel inputs corresponding to 12V and 24V panels along with 12
and 24V batteries. This device, unlike the bq24650, is designed for scalability. It could easily be adapted to a 48V system by changing the MOSFETs to 100V rated
parts. The current could also be increased by using a specific set of MOSFETs. It has been tested to be 97% efficient at full load in a 24V system. Figure 25 shows
the efficiency for the test data recorded by TI for a 24V system.
Figure 25 Test Data for Efficiency in a 24V System
(Reprinted with Permission Pending from TI)
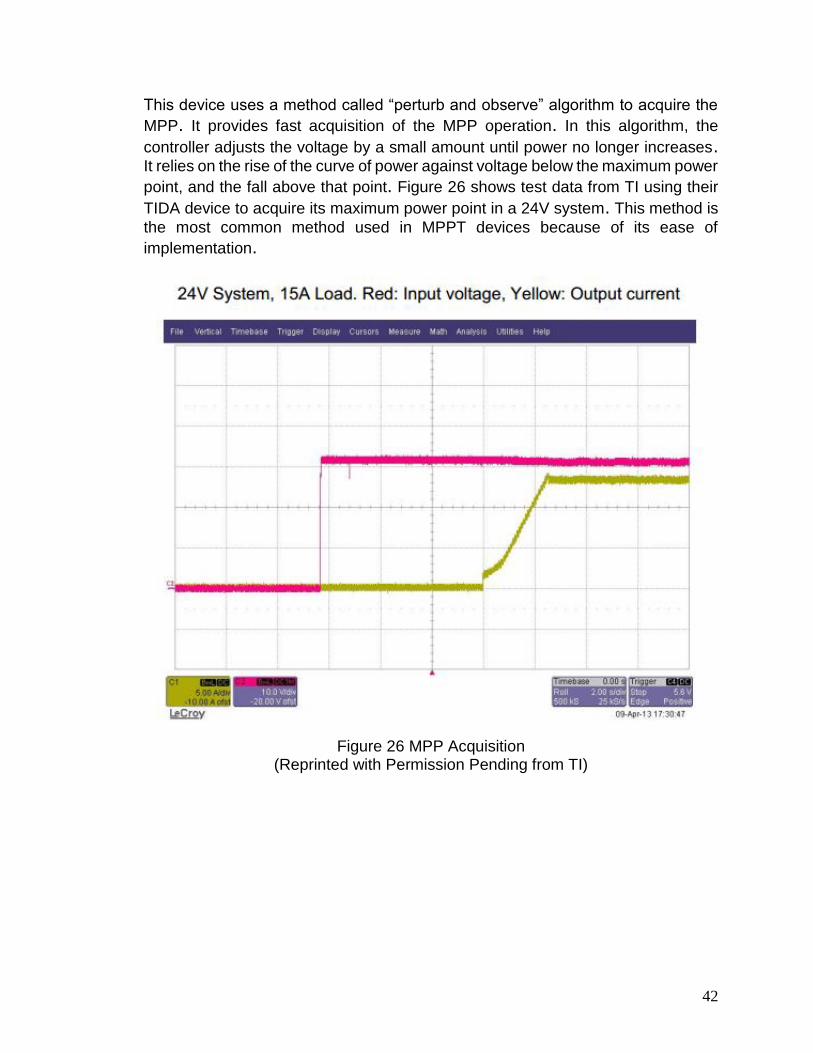
42
This device uses a method called “perturb and observe” algorithm to acquire the
MPP. It provides fast acquisition of the MPP operation. In this algorithm, the
controller adjusts the voltage by a small amount until power no longer increases. It relies on the rise of the curve of power against voltage below the maximum power
point, and the fall above that point. Figure 26 shows test data from TI using their
TIDA device to acquire its maximum power point in a 24V system. This method is
the most common method used in MPPT devices because of its ease of
implementation.
Figure 26 MPP Acquisition
(Reprinted with Permission Pending from TI)
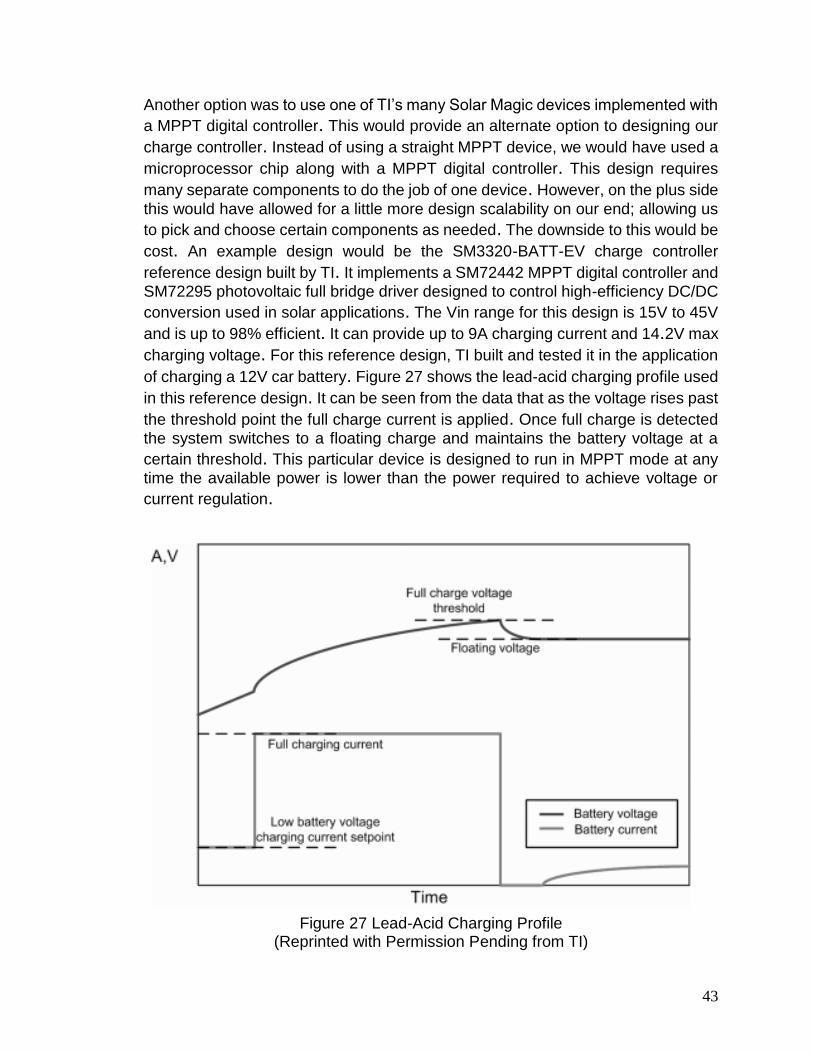
43
Another option was to use one of TI’s many Solar Magic devices implemented with
a MPPT digital controller. This would provide an alternate option to designing our
charge controller. Instead of using a straight MPPT device, we would have used a
microprocessor chip along with a MPPT digital controller. This design requires
many separate components to do the job of one device. However, on the plus side
this would have allowed for a little more design scalability on our end; allowing us
to pick and choose certain components as needed. The downside to this would be
cost. An example design would be the SM3320-BATT-EV charge controller
reference design built by TI. It implements a SM72442 MPPT digital controller and
SM72295 photovoltaic full bridge driver designed to control high-efficiency DC/DC
conversion used in solar applications. The Vin range for this design is 15V to 45V
and is up to 98% efficient. It can provide up to 9A charging current and 14.2V max
charging voltage. For this reference design, TI built and tested it in the application
of charging a 12V car battery. Figure 27 shows the lead-acid charging profile used
in this reference design. It can be seen from the data that as the voltage rises past
the threshold point the full charge current is applied. Once full charge is detected
the system switches to a floating charge and maintains the battery voltage at a
certain threshold. This particular device is designed to run in MPPT mode at any
time the available power is lower than the power required to achieve voltage or
current regulation.
Figure 27 Lead-Acid Charging Profile
(Reprinted with Permission Pending from TI)
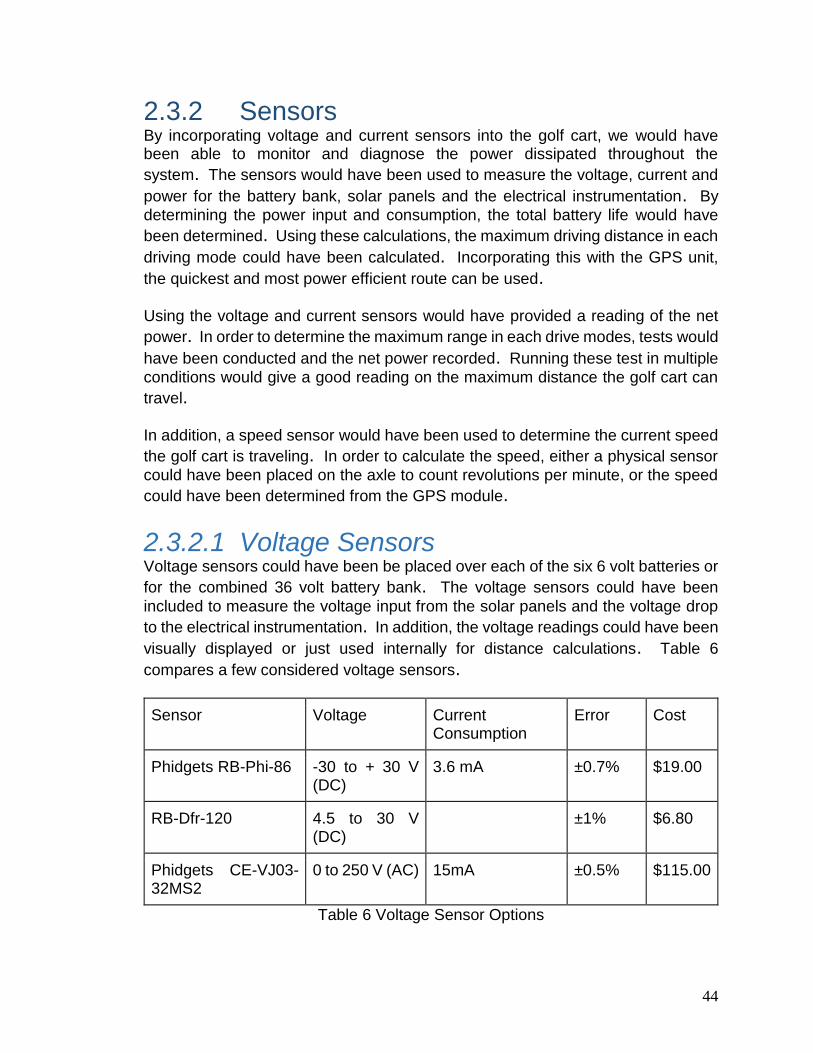
44
2.3.2 Sensors By incorporating voltage and current sensors into the golf cart, we would have been able to monitor and diagnose the power dissipated throughout the
system. The sensors would have been used to measure the voltage, current and
power for the battery bank, solar panels and the electrical instrumentation. By
determining the power input and consumption, the total battery life would have
been determined. Using these calculations, the maximum driving distance in each
driving mode could have been calculated. Incorporating this with the GPS unit,
the quickest and most power efficient route can be used. Using the voltage and current sensors would have provided a reading of the net
power. In order to determine the maximum range in each drive modes, tests would
have been conducted and the net power recorded. Running these test in multiple
conditions would give a good reading on the maximum distance the golf cart can
travel. In addition, a speed sensor would have been used to determine the current speed
the golf cart is traveling. In order to calculate the speed, either a physical sensor
could have been placed on the axle to count revolutions per minute, or the speed
could have been determined from the GPS module.
2.3.2.1 Voltage Sensors Voltage sensors could have been be placed over each of the six 6 volt batteries or
for the combined 36 volt battery bank. The voltage sensors could have been
included to measure the voltage input from the solar panels and the voltage drop
to the electrical instrumentation. In addition, the voltage readings could have been
visually displayed or just used internally for distance calculations. Table 6
compares a few considered voltage sensors.
Sensor Voltage Current Consumption
Error Cost
Phidgets RB-Phi-86 -30 to + 30 V (DC)
3.6 mA ±0.7% $19.00
RB-Dfr-120 4.5 to 30 V (DC)
±1% $6.80
Phidgets CE-VJ03-32MS2
0 to 250 V (AC) 15mA ±0.5% $115.00
Table 6 Voltage Sensor Options
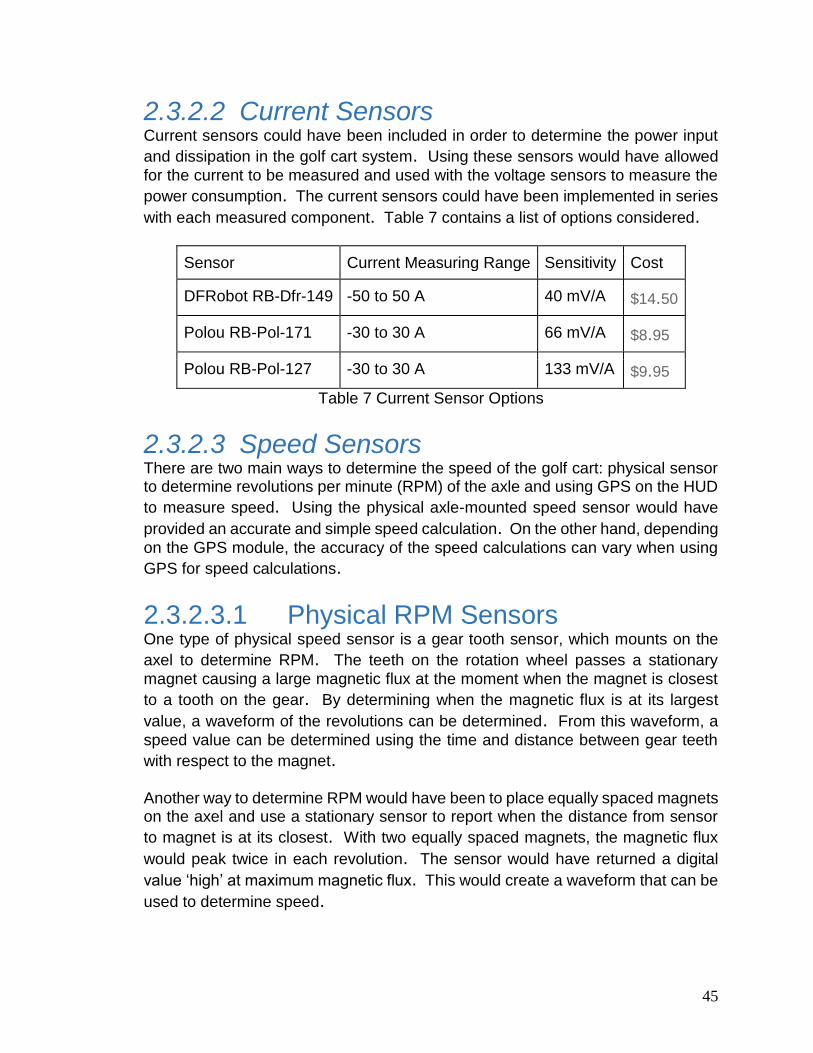
45
2.3.2.2 Current Sensors Current sensors could have been included in order to determine the power input
and dissipation in the golf cart system. Using these sensors would have allowed
for the current to be measured and used with the voltage sensors to measure the
power consumption. The current sensors could have been implemented in series
with each measured component. Table 7 contains a list of options considered.
Sensor Current Measuring Range Sensitivity Cost
DFRobot RB-Dfr-149 -50 to 50 A 40 mV/A $14.50
Polou RB-Pol-171 -30 to 30 A 66 mV/A $8.95
Polou RB-Pol-127 -30 to 30 A 133 mV/A $9.95
Table 7 Current Sensor Options
2.3.2.3 Speed Sensors There are two main ways to determine the speed of the golf cart: physical sensor to determine revolutions per minute (RPM) of the axle and using GPS on the HUD
to measure speed. Using the physical axle-mounted speed sensor would have
provided an accurate and simple speed calculation. On the other hand, depending
on the GPS module, the accuracy of the speed calculations can vary when using
GPS for speed calculations.
2.3.2.3.1 Physical RPM Sensors One type of physical speed sensor is a gear tooth sensor, which mounts on the
axel to determine RPM. The teeth on the rotation wheel passes a stationary
magnet causing a large magnetic flux at the moment when the magnet is closest
to a tooth on the gear. By determining when the magnetic flux is at its largest
value, a waveform of the revolutions can be determined. From this waveform, a
speed value can be determined using the time and distance between gear teeth
with respect to the magnet. Another way to determine RPM would have been to place equally spaced magnets on the axel and use a stationary sensor to report when the distance from sensor
to magnet is at its closest. With two equally spaced magnets, the magnetic flux
would peak twice in each revolution. The sensor would have returned a digital
value ‘high’ at maximum magnetic flux. This would create a waveform that can be
used to determine speed.
46
2.3.2.3.2 GPS Speed Sensors The speed of the golf cart could also be determined using the GPS module. From
the GPS signal, the velocity can be determined and used accordingly.
2.3.2.4 Distance Calculations Using the power accumulation and consumption details determined by the voltage and current sensors, the maximum travel distance of the golf cart could have been
determined. For each drive mode, the maximum travel distance could have been
dynamically calculated. The sensors could have determined the power
accumulated from the solar panels and the amount of useable power in the battery
bank. In addition, the power dissipated could have been calculated from the power
used to run the motor, HUD, and all of the electrical components. Once the power
accumulated and the power consumption is determined, a function for the net
power could have been calculated. These functions could have allowed for the
system to accurately predict the maximum distance the golf cart is able to travel
on the current charge with help from the solar panels.
2.3.3 Charging Techniques There were several charging techniques considered for this project. Charging lead
acid batteries can be a long process. Typically the batteries receive a full charge
overnight from the wall outlet, but for this design part of the purpose is
sustainability. The goal is for the solar panels to charge the batteries in addition
to the wall outlet. This poses a problem, as there is only so much daylight, and the
panels provide only so much charging power. It is important that we do not partially
charge or over charge the batteries as this can cause damage. The charge time
from the wall outlet may only take 5 hours to charge the whole battery bank, but
from the solar panels it could take up to 5 times that. In order to avoid overcharging the batteries, it is important to supply each cell with
the correct voltage and current. A 6V battery typically has 3 cells. It is important
that the voltage per cell is not too low, as this results in no charge to the battery. The typical charging voltage for a lead acid battery is around 2.2 volts per cell. The
charging voltages vary with temperature and however much charge the battery
currently has. The charging voltage for a fully depleted cell could be much higher
than that of a full cell. For these reasons it is important to know the best charging
technique.

47
2.3.3.1 Constant Voltage A constant voltage charging source acts mainly as a DC power supply to each
terminal of the battery. Typical lithium ion battery chargers use this method
because it is easy to avoid overcharging the battery. The constant voltage means
that once the maximum voltage for the battery is reached it automatically stops
charging. Figure 28 shows the battery current and voltage after a long duration of
time charging with this method. The charging current automatically starts to
decrease as the voltage approaches the same voltage as the power source.
Figure 28 Constant Voltage Battery Characteristics
(Reprinted with Permission from Panasonic)
2.3.3.2 Constant Current Constant current charging is a technique that varies the voltage depending on the
charge of the battery. As the name implies, the charging source tries to maintain
a constant level of current while changing the voltage. This method allows the
separate battery cells to rebalance which can restore the performance back to its
original factory distributed state. The circuitry required to design a constant current
charger is much more complex than constant voltage because it has to monitor the voltage being output from the battery so that it stops supplying current once it
becomes full. Figure 29 shows the difference in characteristics between constant
voltage and constant current.
Figure 29 Constant Current vs. Constant Voltage
48
2.3.3.3 IUI Charging IU is a combination of constant current and constant voltage charging techniques. It first charges with constant current to balance out the difference in cell levels and then switches to the constant voltage method to charge quicker and stop charging
in a safer manner. It is also safer for the initial charge because the current pulled
through constant voltage initially is very high. The first part of the charging cycle
is called the bulk charge phase in which constant current is used until a preset
voltage value is reached. Then constant voltage is used to quickly charge the
batteries to the point at which the current drops to a preset value. The last phase
is when the source switches back to constant voltage at a slowly diminishing rate.
2.3.3.4 Pulsed Charge Pulsed Charging is a method of using signals similar to PWM that pulses at
different widths to vary the power being applied. There is a small discharge pulse
in between each charge pulse which helps to break up crystal growth and
passivation. Less harmful chemical reactions occur at the surface of the electrode. This is also great for digital chargers that need to sample the voltage in between
each charge pulse to see when the voltage is getting close to its maximum.
2.3.4 Solar Panels Solar Panels are a cheap and effective way to harness energy from the sun and
help power the gold cart along with the charge from a wall outlet. The cart we
obtained for this project is already equipped with two Grape Solar© High Efficiency
Mono-Crystalline Photovoltaic panels. Unfortunately, these two panels alone were
not be strong enough to completely charge the battery bank, but the idea is that
they at least help prolong the discharge time of the batteries. Realistically, this
should considerably help with the power consumption from all of our onboard
electronic subsystems as well. The two roof-mounted solar panels were used to convert the energy from the sun
into usable electricity. These panels were used to charge the batteries in order to
provide power to the golf cart. In order to harness as much energy as possible
from these solar panels, the wiring configuration to the motor and subsystems is
critical. Wiring these panels in series yields the most voltage to charge the
batteries. Another option would be to wire these panels in parallel to produce a
higher current, however; this could cause power loss due to one of the panels
receiving less sunlight. The two panels used are both 1640mm x 990mm x 40mm (L x W x T), with sixty
156mm x 156mm cells. The panels are rated as having a maximum power of Pmax
of 250 W. However, this is a nominal value tested and rated in perfect conditions.
49
In reality it was not this high due to weather, movement, and other factors. The
voltage at maximum power point is ~30.7 V and the current at maximum power
point is ~8.15 A.
2.3.4.1 Watts Needed Since the project specifies that the cart not only be charged with the solar panels, but with a wall outlet as well, we did not have to worry about having all of our power
coming from the solar panels. In order to at least have an idea of the watts we
would have received from our panels, we had to understand the total wattage the
cart require.
As can be expected, the batteries provided power for everything on the cart. Since
batteries are rated in amp hours, we can use basic math to give them a watt hours
rating. Since 𝑃(𝑊ℎ) = 𝐴ℎ × 𝑉, with Wh equal to watt-hours and Ah equal to amp-
hours, we can use the standard amp-hour rating from the batteries to solve for
watt-hours. Typically, batteries are rated at a 20 hour rate. We assumed the same
for watts. This means each battery provides 1,392 Wh. Again, there are six
batteries total all connected in series, so that number was multiplied by six to give
a total of 8,352 Wh. Since that is for a 20 hour rate, that implies that the battery
bank provided ~417.6 watts at a nominal 36 volts for 20 hours. Therefore,
hypothetically we received at least enough watts to assist in how long this steady
power lasts. Ideally the nominal 500 watts we received from the solar panels were
sufficient. As previously stated, the panels are by no means able to charge the
battery bank itself.
2.3.4.2 Solar Cells Solar cells, also call photovoltaic cells, are simply an electrical device that converts
the energy of light into usable electricity. The process in which solar cells convert
sunlight into electricity is called the photoelectric effect. This is defined as the ability
of matter to emit electrons when light is shone on it. Solar panels achieve this
effect by using semi-conductors, mainly silicon within the cells to create spare electrons and harness these spare electrons into a steady current which can be
used as power.
The two panels we used were made up of sixty cells each. They are high efficiency
solar cells with quality silicon material for high module conversion efficiency and
long term output stability and reliability. It is important to take into effect the
operating temperature of the panels. Operating outside of these temperatures can
result in a loss of power production.

50
The operating temperature for the panels being used is -40° C to +85° C (-40° F
to +185° F). Although the chances of going outside of this range is very slim, we
did have to consider the effects of low and high temperatures that were
experienced. The cart was operated in Florida and the temperatures here can be
pretty intense sometimes. Solar cells tend to decrease in power production once
they reach a certain temperature. The drop off in efficiency tends to be around 87
to 91° F, which is not that uncommon in Florida. Solar cells are most efficient in
lower temperatures. Preferably in a climate that has cool temperatures and plenty
of sunlight. Unfortunately this is not the case here. For that reason we considered
having to cool the panels down if they begin to overheat.
2.3.4.2.1 Mono-Crystalline Silicon Solar Cells Monocrystalline silicon cells are made from a single silicon crystal, which provides
the highest efficiency of around 15-20% among the commercial market. These
cells would have provided the best power input, but are generally more expensive. The Grape Solar panels we used are rated at 15.4% efficiency. Monocrystalline
solar panels are also space efficient. Since they yield the highest power output
compared with other types of solar cells, they require the least amount of space. Monocrystalline solar cells also tend to produce more electricity in low light
conditions. This is always an advantage because weather can be very
unpredictable. Another advantage with using monocrystalline solar panels is that
they work well in warm environments. Typically temperature effects, primarily
overheating or not a concern when using these types of cells.
2.3.4.2.2 Polycrystalline Silicon Solar Cells Polycrystalline silicon is the most common commercial solar cell material
used. Unlike monocrystalline silicon, polycrystalline silicon is composed of many
smaller crystals. This leads to a reduced efficiency, as well as, reduced cost. Polycrystalline solar cells tend to have less heat tolerance than monocrystalline,
which means that they usually perform worse in higher temperatures. However,
usually it is negligible enough that it is not very important. The efficiency rating of
polycrystalline solar cells is around 13-16%. Because of the lower silicon purity,
they are not as efficient as monocrystalline solar cells. It is easy to distinguish
polycrystalline cells from monocrystalline by their more of a blue tint. This is due
to the other crystal elements that these cells are made up of. This would not be
our first choice due to the lower efficiency that polycrystalline cells have.
51
2.3.4.2.3 Thin Film Solar Cells Thin film solar cells are basically made by depositing thin layers of photovoltaic
material onto a substrate. There are different types of thin film solar cells, each
depending on what kind of material is deposited onto the substrate. A few are,
Amorphous Silicon, Cadmium telluride, copper indium gallium selenide, and
organic photovoltaic cells. Depending on which type is being used, efficiencies can
range between 7-13%. They are very cheap to mass produce which makes them
much more cost effective than crystalline cells, but with a much lower efficiency. There are some other advantages, such that they can be made flexible and high
temperatures and shading have less of an effect on energy production. Since thin
film solar cells have such low efficiencies they require a large amount and space
of them to compensate for energy production. This alone makes them not feasible
for our project.
2.3.4.2.4 Amorphous Silicon Solar Cells Amorphous Silicon (a-Si) solar cells are a sub category of thin film solar cells as
mentioned above. These types of cells are made of single or multiple thin layers
stacked on top of each other on a substrate. One of the advantages is that it can
be stacked onto many different types of substrate. Whether it be glass, metal, or
plastic. They can also be cut into different shapes, unlike crystalline cells. The
efficiency of a-Si solar cells is typically around 7%, with a considerable decrease
in its first few hours being in the sun. Although it is a very cost effective option,
these types of cells would not be efficient in providing us with a substantial amount
of power production.
2.4 PCB Design In order for errors to be reduced in this system, printed circuit boards (PCB) were
used to permanently configure the electric circuits. PCB’s offer a much more
secure and dependable connection between circuit elements then
breadboards. Breadboard allow for easy manipulations and very cost efficient
analysis of a circuit, but do not offer a permanent solution for use with the golf
cart. Vibrations and movements encountered in this project can affect the
connections between the circuit elements. For this reason, a breadboard was
used first to test and debug the circuits, then a PCB was designed and
purchased. Once the circuit is properly designed and debugged, the circuit was
drawn up using a schematic software. From this schematic, a PCB can be ordered
and constructed.
52
2.4.1 PCB Composition There are two main ways to implement a circuit design: with the use of
breadboards or printed circuit boards (PCB’s). Breadboards allow for easy circuit
alterations, but are not a trusted permanent design. Printed circuit boards are
extremely consistent and accurate, but do not allow for simple changes to the
circuit. PCB’s are circuit boards that use conductive tracks as wires between
components. PCB’s allow for the circuit characteristics to be constant. Using a
PCB also reduces the chance of wiring errors and loose connections. Once a
circuit schematic is designed and debugged, a PCB can be ordered. PCB’s are
often machine-made, which allows for a permanent design and reduces errors.
PCB’s are made up of two parts: a substrate and the copper wiring. The substrate
is the main part of the board that provides a solid backing for the various circuit
elements. Substrates materials are insulators, meaning they do not conduct
electric currents. The substrates are split up into three main types: FR-2, FR-4,
and RF. FCB substrates can also be either rigid or flexible depending on the
application. FR-2 is generally the cheapest substrate option, composed of a synthetic resin
bonded paper to make the board flame resistant. The use of a FR-2 board in a
moving condition is generally not recommended, because the constant vibration
on the board can cause cracks in the FCB.
FR-4 is a fiberglass-reinforced laminate sheet used as a substrate for PCB’s. FR-
4 is more expensive option then FR-2, but FR-4 substrates offer better technical
characteristics. FR-4 is flame retardant and has good water-resistant
properties. This allows for the FR-4 to be used in humid conditions without
diminishing any mechanical and electrical properties. Because of the flame
resistance, minimal water absorption, and ability to be used in a vibrating setting, the FR-4 substrate would be a good option for use on the golf cart in the humid
conditions encountered in Florida. RF substrates are designed to perform favorably in high power radio
frequencies. RF substrates offer great electrical performance properties, but lack
with mechanical aspects. These substrates are composed of low dielectric plastics
which allow for them to be used with high frequencies.
PCB’s are mostly designed to be rigid. Rigid PCB’s are cheaper and easier to
make, and provide good mechanical properties. In addition to the more common
rigid PCB’s, some are specially designed to be flexible. These flex substrates are
generally more difficult to manufacture, which in turn increases the price.
53
2.4.2 PCB Software For the design of the printed circuit boards in this project, Eagle CAD software can
be used to design and construct a suitable circuit design. Eagle CAD provides an
easy to use interface along with a broad spectrum of resources. Using the
schematic editor and layout editor, a circuit design was designed and sent to a
manufacturer to construct. The schematic file was used as a guide to create a
PCB for use in this project. Eagle CAD uses a universal Gerber file for use with
multiple manufacturing vendors. Another easy to use software for PCB design is
ExpressPCB. ExpressPCB’s software provides users with simple and efficient
interface. ExpressPCB is functional enough for a professional, while still providing
a favorably learning curve. ExpressPCB software is very limited, with use only
with the ExpressPCB manufacturers. The limited compatibility can be an issue
when ordering a PCB. Also, PCB Layout Software is another free PCB design
software. This software is efficient and useful for PCB design. PCB Layout
Software is a compatible program with use with 4PCB manufacturing.
2.4.3 PCB Manufacturer PCB Pool is a manufacturing company that uses Eagle CAD software for
developing PCB’s. PCB Pool offers a large variety of board substrate options and
broad selection of compatible software. PCB Pool allows for single and double-
sided circuit boards. Due to the low production costs, PCB Pool is a good option
for designing circuit boards for use with this project.
Another suitable PCB Manufacturing company is OSH Park. Osh Park accepts
Eagle CAD circuit design files for the manufacturing of PCB’s. OSH Park offers
very competitive pricing with three copies of a two layer board for $5 per square
inch. They also boast a quick shipping time at only 12 days after ordering. In
addition, OSH Park also offers three copies of four layer boards for $10 with a two
week shipping time. OSH Park is a good option due to the cheap production cost
and free shipping worldwide.
ExpressPCB is another option with free compatible PCB design software. PCB
circuit designs can be implemented quickly and efficiently. The ExpressPCB
service sells three copies of two and four layer PCB’s for $51. Shipping is also
very quick and cost efficient. ExpressPCB guarantees two day delivery for
PCB’s. ExpressPCB’s free software and efficient shipping combination provides
a well-rounded option.
54
In addition, 4PCB is another suitable PCB manufacturing company. 4PCB
provides printed boards for a competitive price. Using a student discount, a two
layer PCB can be purchased for $33. Also, 4PCB also sells a four layer PCB for
$66. 4PCB works with a free “PCB Layout Software” for seamless design and
manufacturing. 4PCB also include a free PCB file check to ensure the design is
correct and complete.
2.5 Batteries One of the most important parts of an electric golf cart whether it is solar powered
or not, is the batteries. The batteries power every aspect of the cart, from the
electric motor to all of the onboard electronic systems. More importantly, for most
solar electric systems there is a battery bank that is used to store the energy captured by the PV panels to be used when the system is off the grid or is not in
prime conditions. For our case the batteries were getting energy from both the PV
panels and the wall charger and then being converted and used to power the cart
and its subsystems.
Golf carts along with many small solar electric systems use deep cycle batteries. Deep cycle batteries are designed so that they can be discharged down as much
as 80% time after time, and not suffer internal damage. One of the reasons deep
cycle batteries can be discharged to such a degree is because they have thicker
plates. Plate thickness in a typical golf cart battery is around .07 to .11” thick. In
small solar electric systems golf cart batteries are widely used for power storage. Because golf cart batteries are typically deep cycle batteries, they have the
capacity for continuous service with many charge/discharge cycles for many years. This is a key component in solar power systems because the PV panels were
constantly charging the batteries, while the batteries are also being depleted.
2.5.1 Options There are three main types of golf cart batteries on the market today. There is the
gel cell, AGM, and flooded-lead. The most practical and cost efficient is the
flooded-lead. This is also the type that comes standard on the specific golf cart we
are using, the E-Z-Go TXT. However, for sake of research and design
specifications all three types were considered for our design. Standard golf cart
batteries are typically either 6 V or 8 V deep cycle flooded-lead batteries. Some 12
V options can be found, but are not as practical. The E-Z-Go TXT can be setup
using either a 36 V or 48 V battery power systems. This can be obtained by using
a series of 6, 8, or 12 V batteries. Therefore, in order to determine the best battery
selection, all of the above mentioned battery types were researched and analyzed.
55
2.5.1.1 Gel Cell Gel cell batteries, or “gelled” batteries, are one of the 3 main types of deep cycle
batteries in the market for both golf carts and solar electric systems. Gel cell
batteries are usually completely sealed on the top so that the acid cannot spill or
leak out. Since there are no vents or caps on the battery, they do not release gas
when being charged. Gel Cell batteries contain acid that has been slightly mixed
with Silica gel, giving it the name “Gel Cell”, which turns the acid into a solid gooey
mass. This results in the cells having much less fluid in them as compared to the
typical flooded or wet battery. There are a few advantages and disadvantages to analyze in determining if Gel
Cell batteries are the correct choice for our project. The main advantage is that
they cannot spill or leak, nor do they release gas when being charged. This allows
for use indoors, but this is not an advantage necessarily applicable to our project. However, there are several disadvantages. They must be charged at a slower rate
to prevent excess gas from damaging the cells. When using a charge controller or
inverter, gel cell batteries would have to be charged at a lower charging current. Since there were two power sources for our batteries, this is not efficient. We
needed a high charging current to provide a quick charge for our specifications.
2.5.1.2 AGM AGM, or Absorbed Glass Mat, batteries are another typical type of battery found
in solar bank applications. The name comes from their design, which has a woven
glass mat between the plates to hold the electrolytes. They are similar to the Gel
Cell batteries in that they are spill and leak proof, and that they also do not release
any gases while charging. They have all the advantages of the Gel Cell batteries,
but can withstand the abuse of higher discharges.
AGM batteries have many advantages to consider in our decision process. Besides being completely sealed and immune to leakage or spilling, the charging
voltages are the same for any standard battery. Theses batteries do not require
any special adjustments for charging as does the Gel Cell. Another advantage is
that AGM batteries have a very low self-discharge. This allows for a much longer
period of rest without the need to charge them. This battery would definitely meet
our criteria in the aspect of performance. However, there is one main disadvantage
that defers us from choosing the AGM battery. That disadvantage is the price. The
typical AGM battery is anywhere from one and a half to two times as much as the
typical deep cycle battery.
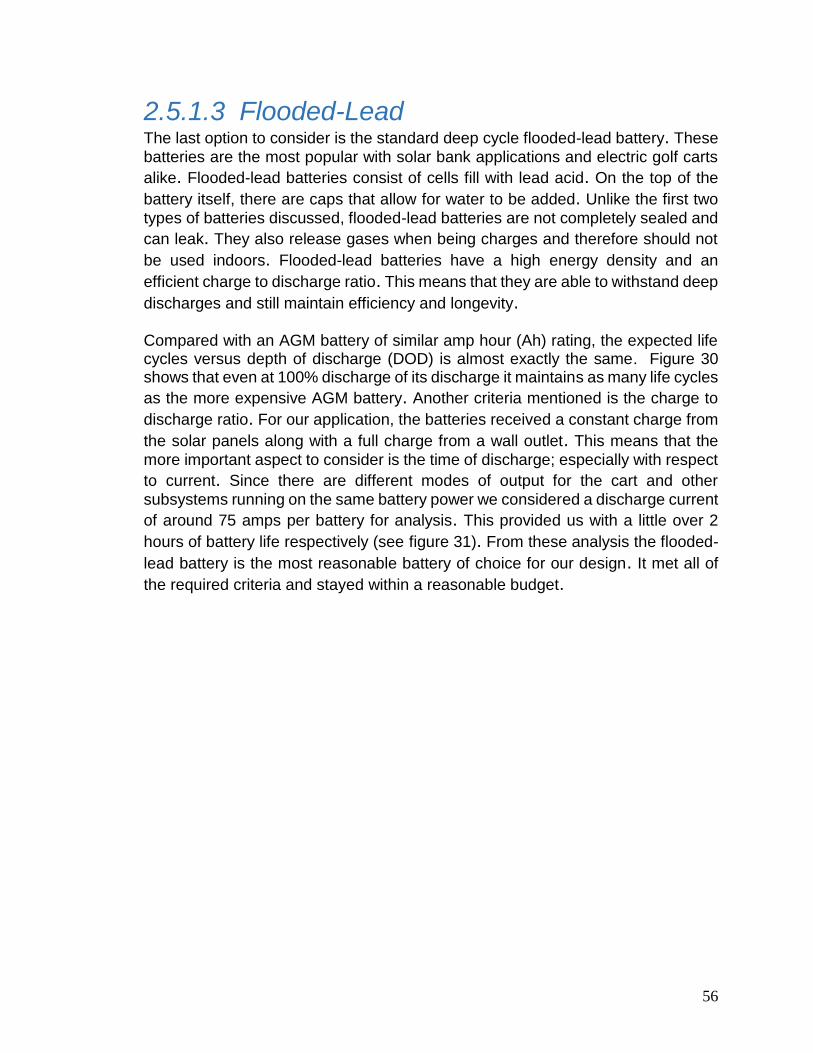
56
2.5.1.3 Flooded-Lead The last option to consider is the standard deep cycle flooded-lead battery. These
batteries are the most popular with solar bank applications and electric golf carts
alike. Flooded-lead batteries consist of cells fill with lead acid. On the top of the
battery itself, there are caps that allow for water to be added. Unlike the first two
types of batteries discussed, flooded-lead batteries are not completely sealed and
can leak. They also release gases when being charges and therefore should not
be used indoors. Flooded-lead batteries have a high energy density and an
efficient charge to discharge ratio. This means that they are able to withstand deep
discharges and still maintain efficiency and longevity. Compared with an AGM battery of similar amp hour (Ah) rating, the expected life cycles versus depth of discharge (DOD) is almost exactly the same. Figure 30 shows that even at 100% discharge of its discharge it maintains as many life cycles
as the more expensive AGM battery. Another criteria mentioned is the charge to
discharge ratio. For our application, the batteries received a constant charge from
the solar panels along with a full charge from a wall outlet. This means that the
more important aspect to consider is the time of discharge; especially with respect
to current. Since there are different modes of output for the cart and other
subsystems running on the same battery power we considered a discharge current
of around 75 amps per battery for analysis. This provided us with a little over 2
hours of battery life respectively (see figure 31). From these analysis the flooded-
lead battery is the most reasonable battery of choice for our design. It met all of
the required criteria and stayed within a reasonable budget.
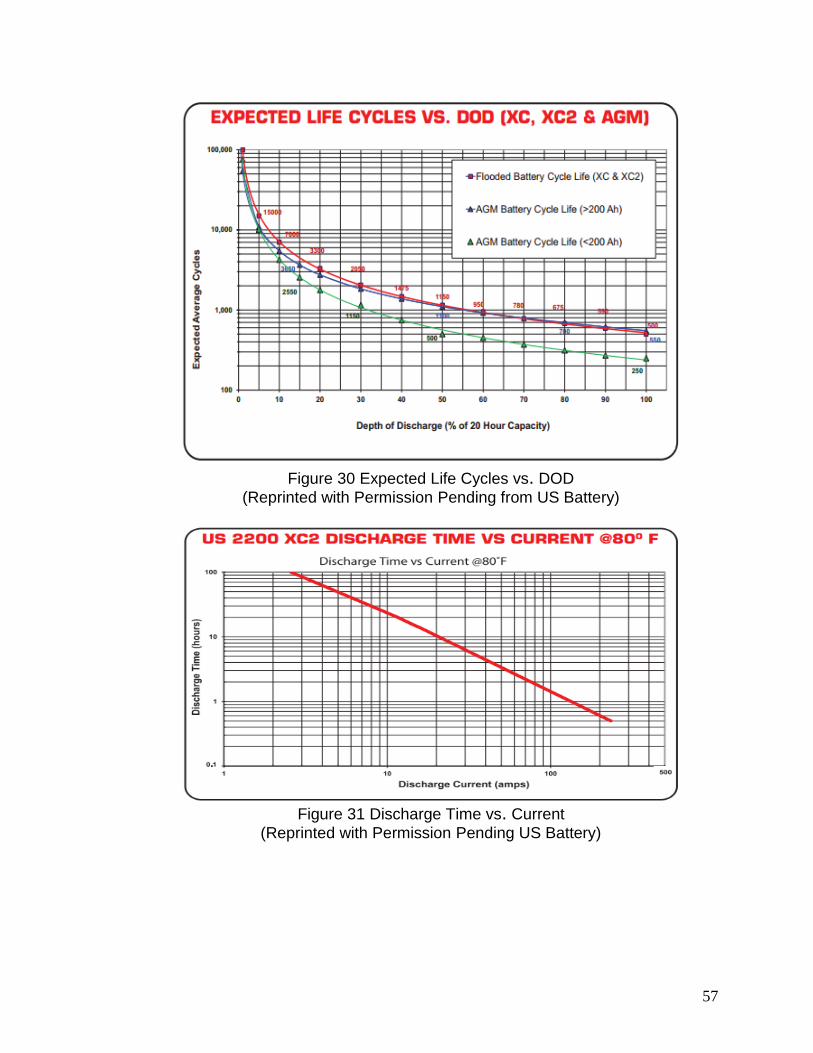
57
Figure 30 Expected Life Cycles vs. DOD
(Reprinted with Permission Pending from US Battery)
Figure 31 Discharge Time vs. Current
(Reprinted with Permission Pending US Battery)
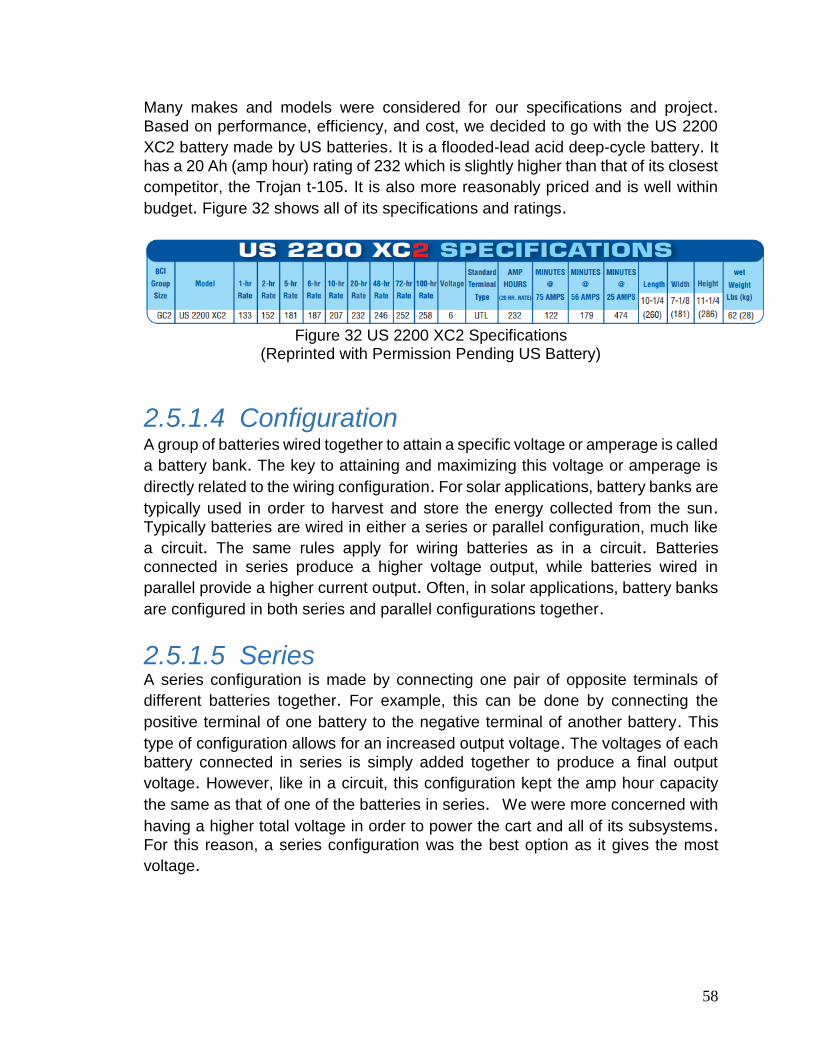
58
Many makes and models were considered for our specifications and project. Based on performance, efficiency, and cost, we decided to go with the US 2200
XC2 battery made by US batteries. It is a flooded-lead acid deep-cycle battery. It has a 20 Ah (amp hour) rating of 232 which is slightly higher than that of its closest
competitor, the Trojan t-105. It is also more reasonably priced and is well within
budget. Figure 32 shows all of its specifications and ratings.
Figure 32 US 2200 XC2 Specifications
(Reprinted with Permission Pending US Battery)
2.5.1.4 Configuration A group of batteries wired together to attain a specific voltage or amperage is called
a battery bank. The key to attaining and maximizing this voltage or amperage is
directly related to the wiring configuration. For solar applications, battery banks are
typically used in order to harvest and store the energy collected from the sun. Typically batteries are wired in either a series or parallel configuration, much like
a circuit. The same rules apply for wiring batteries as in a circuit. Batteries
connected in series produce a higher voltage output, while batteries wired in
parallel provide a higher current output. Often, in solar applications, battery banks
are configured in both series and parallel configurations together.
2.5.1.5 Series A series configuration is made by connecting one pair of opposite terminals of
different batteries together. For example, this can be done by connecting the
positive terminal of one battery to the negative terminal of another battery. This
type of configuration allows for an increased output voltage. The voltages of each
battery connected in series is simply added together to produce a final output
voltage. However, like in a circuit, this configuration kept the amp hour capacity
the same as that of one of the batteries in series. We were more concerned with
having a higher total voltage in order to power the cart and all of its subsystems. For this reason, a series configuration was the best option as it gives the most
voltage.
59
2.5.1.6 Parallel The second type of configuration to consider is parallel configuration. A parallel
connection is made by connecting like terminals of two or more batteries together. This can be accomplished by connecting two positive terminals together and two
negative terminals together. This type of configuration increases the amp hour
capacity while maintaining the voltage the same as one of the batteries connected
in parallel. Because our project is more heavily voltage dependent, this is not the
most efficient configuration to use. Often battery banks, especially in solar applications, are connected in both series
and parallel. This is done by connecting two sets of batteries, which are composed
of batteries connected in series, in parallel with each other. For example, four 6
volt batteries connected in series from positive terminal to negative terminal are
connected in parallel with another four 6 volt batteries connected in series. A
possible configuration of this can be seen in Figure 41. The advantage to using
this configuration is to meet a specific voltage and amperage, depending on its use
or application. However, again this is not a good option for our project, because
we do not have the space to give us the necessary voltage rating.
2.6 Automated Driving Features Autonomous vehicles are going to be everywhere in the future. Incorporating
automated driving features to this golf cart with allow for a safer vehicle. Using the
power generated by the solar panels, a microcontroller and sensor(s) could have
been configured to automatically brake and control speed. The range finder
sensor(s) could have been used to dynamically determine the distance to the nearest object in the path of the golf cart and send a signal to the motor controller
to reduce speed or break in order to avoid a collision.
2.6.1 Sensors For this system, the sensor needed to be cost efficient, highly accurate and
perform in a desired range. First, the correct distance range had to be
determined. The sensor must detect objects far enough away to give the vehicle
enough time to stop before collision. The optimal sensor needed for this project
must be used to return the distance from the object, not just if the object is in a
certain threshold distance. There are three main types of distance sensors to
choose from: infrared, ultrasonic, and laser.
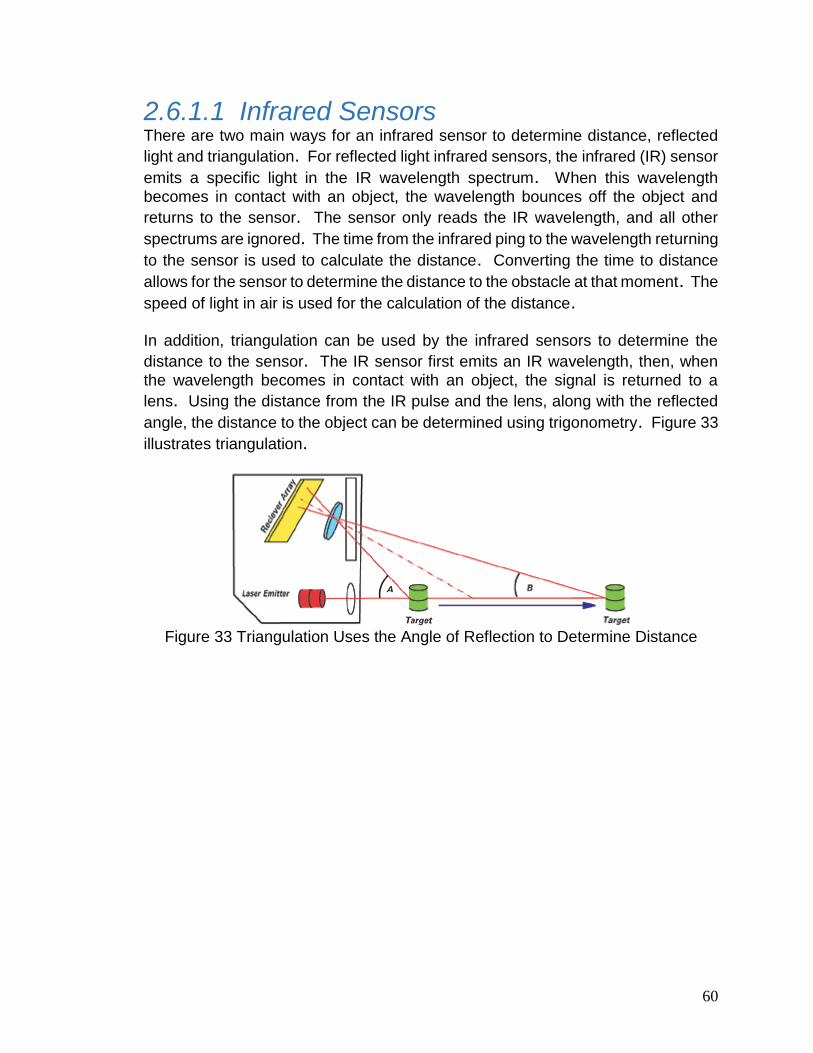
60
2.6.1.1 Infrared Sensors There are two main ways for an infrared sensor to determine distance, reflected
light and triangulation. For reflected light infrared sensors, the infrared (IR) sensor
emits a specific light in the IR wavelength spectrum. When this wavelength
becomes in contact with an object, the wavelength bounces off the object and
returns to the sensor. The sensor only reads the IR wavelength, and all other
spectrums are ignored. The time from the infrared ping to the wavelength returning
to the sensor is used to calculate the distance. Converting the time to distance
allows for the sensor to determine the distance to the obstacle at that moment. The
speed of light in air is used for the calculation of the distance. In addition, triangulation can be used by the infrared sensors to determine the
distance to the sensor. The IR sensor first emits an IR wavelength, then, when
the wavelength becomes in contact with an object, the signal is returned to a
lens. Using the distance from the IR pulse and the lens, along with the reflected
angle, the distance to the object can be determined using trigonometry. Figure 33
illustrates triangulation.
Figure 33 Triangulation Uses the Angle of Reflection to Determine Distance
61
Also, infrared sensors can provide either a binary or analog output. IR sensors
with binary outputs would have only be able to determine when an object is in a
threshold distance. For example, by setting the threshold distance to 5 feet, the
binary IR sensor would just return a binary ‘1’ when the object is within this
distance. On the other hand, the sensors with analog outputs can return the actual
distance to the object from the sensor. For this system, the golf cart must reduce
speed when an object is in the current path. There must be multiple threshold
distances so that the golf cart can slow down safely and efficiently. For this project,
multiple binary sensors could be used with different distances, or an analog sensor
could be used to work with multiple threshold distances. With that in mind, the IR
sensors with binary output would not be the best choice for this system, despite
the lower cost. Table 8 lists a few considered infrared sensors.
Sensor Supply Voltage
Operating Supply Current
Output Terminal Voltage
Detection Range
Output
Sharp IR GP2Y0A710YK
4.5V to
5.5V
33mA to 50mA
-0.3V to
5.3V
100cm to 550cm
Analog
XL-MaxSonar – EZ0
3.3V to
5V
NA NA 10cm to 765cm
Analog
Sharp IR GP270AYK0F
4.5V to
5.5V
33mA to 50mA
-0.3V to
5.3V
20cm to 150cm
Analog
Table 8 Infrared Sensor Options
The main problem with using infrared sensors is the lack of accuracy when
exposed to sunlight. For use on the golf cart in an outside setting, the wavelengths
from the sunlight can interfere with the IR sensor. Also, the maximum distance for
these IR sensors do not extend far enough for to work properly with this system.
2.6.1.2 Ultrasonic Sensors Ultrasonic sensors work similarly to infrared sensors, except ultrasonic sensors emit a sound wavelength instead of the light wavelength used from the IR
sensors. Ultrasonic sensors use sonar to detect objects. The sensor first emits a
chirp of inaudible sound. When this sound wave encounters an obstacle, the
wavelength reflects off the object. The sensor detects the returned wavelength
and records the time between the chirp and return echo. Using this time and the
speed of sound in air, the microcontroller can be used to determine the distance
to the object.

62
Using sound waves instead of infrared waves allows for the sensor to be used
outside in direct sunlight. Despite the higher cost for ultrasonic sensors, it is the
best choice for this project. Possible problems with ultrasonic sensors include
sound interference, absorbent objects, and ghost echoes. Sound interference can
come from vehicles, buildings and electric machinery. Sound waves from these
outside elements can create a false positive for the sensors. Also, certain
materials may absorb the sound waves instead of reflecting them, which would
cause the object to be virtually invisible to the sensors. Another possible issue is
ghost echoes, which occurs when the sound wave reflects off multiple objects to
return a false positive. Due to a limited accurate range, the use of an ultrasonic sensor as a rangefinder
for this project was not included. Ultrasonic sensors provide a better accurate
reading in direct sunlight then IR sensors, but do not have the required range to
detect an object in time to slow down the golf cart to rest.
2.6.1.3 Laser Sensors Laser rangefinder sensors use an extremely concentrated beam of light to
determine the distance to objects. Laser signals are often very narrow, but provide
great accuracy. Similar to the infrared sensors, laser sensors emit a focused beam
of light and measure the time it takes for the light to return to the sensor. Figure
34 shows the components in a laser range finder.
Figure 34 Lasor Range Finder System
Laser rangefinders emit a beam of light and the reflected light is returned to the
sensor. The distance is then determined using the reflected angle using a concept
called triangulation. Triangulation provides a very accurate reading; however, the
error percent for the distance increases as the distance reaches the maximum
range for the sensor.
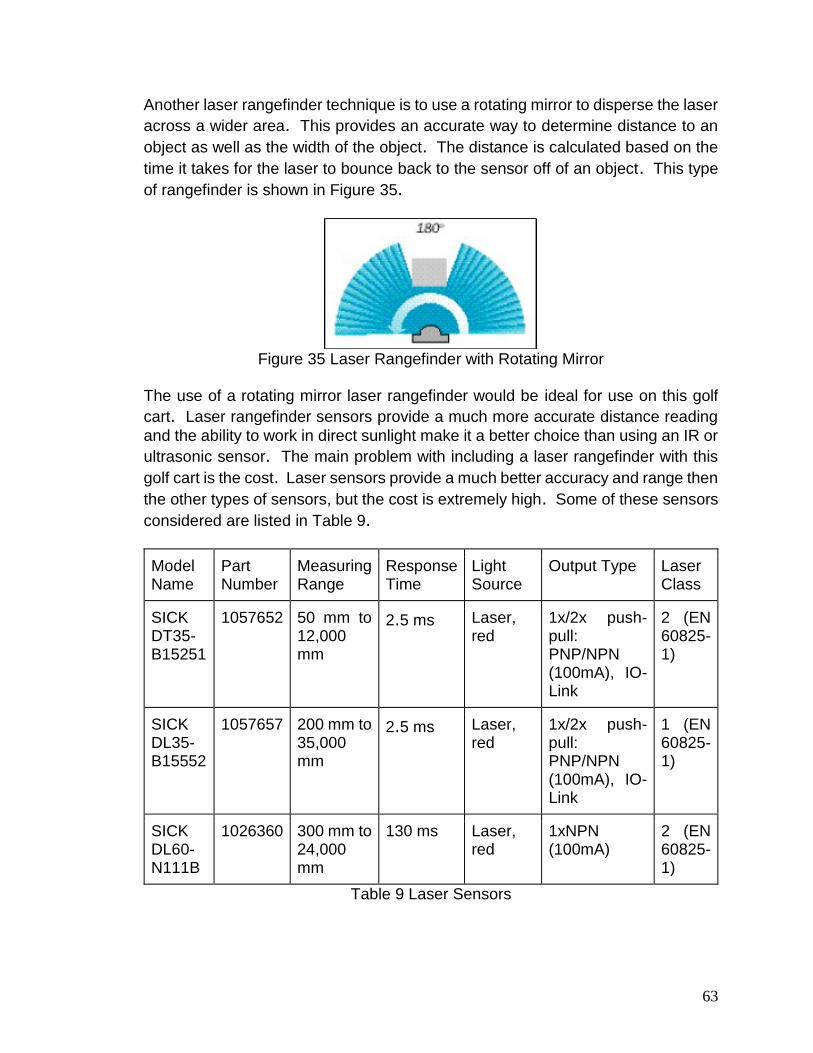
63
Another laser rangefinder technique is to use a rotating mirror to disperse the laser
across a wider area. This provides an accurate way to determine distance to an
object as well as the width of the object. The distance is calculated based on the
time it takes for the laser to bounce back to the sensor off of an object. This type
of rangefinder is shown in Figure 35.
Figure 35 Laser Rangefinder with Rotating Mirror
The use of a rotating mirror laser rangefinder would be ideal for use on this golf
cart. Laser rangefinder sensors provide a much more accurate distance reading
and the ability to work in direct sunlight make it a better choice than using an IR or
ultrasonic sensor. The main problem with including a laser rangefinder with this
golf cart is the cost. Laser sensors provide a much better accuracy and range then
the other types of sensors, but the cost is extremely high. Some of these sensors
considered are listed in Table 9.
Model Name
Part Number
Measuring Range
Response Time
Light Source
Output Type Laser Class
SICK DT35-B15251
1057652 50 mm to 12,000 mm
2.5 ms Laser, red
1x/2x push-pull: PNP/NPN (100mA), IO-Link
2 (EN 60825-1)
SICK DL35-B15552
1057657 200 mm to 35,000 mm
2.5 ms Laser, red
1x/2x push-pull: PNP/NPN (100mA), IO-Link
1 (EN 60825-1)
SICK DL60-N111B
1026360 300 mm to 24,000 mm
130 ms Laser, red
1xNPN (100mA)
2 (EN 60825-1)
Table 9 Laser Sensors
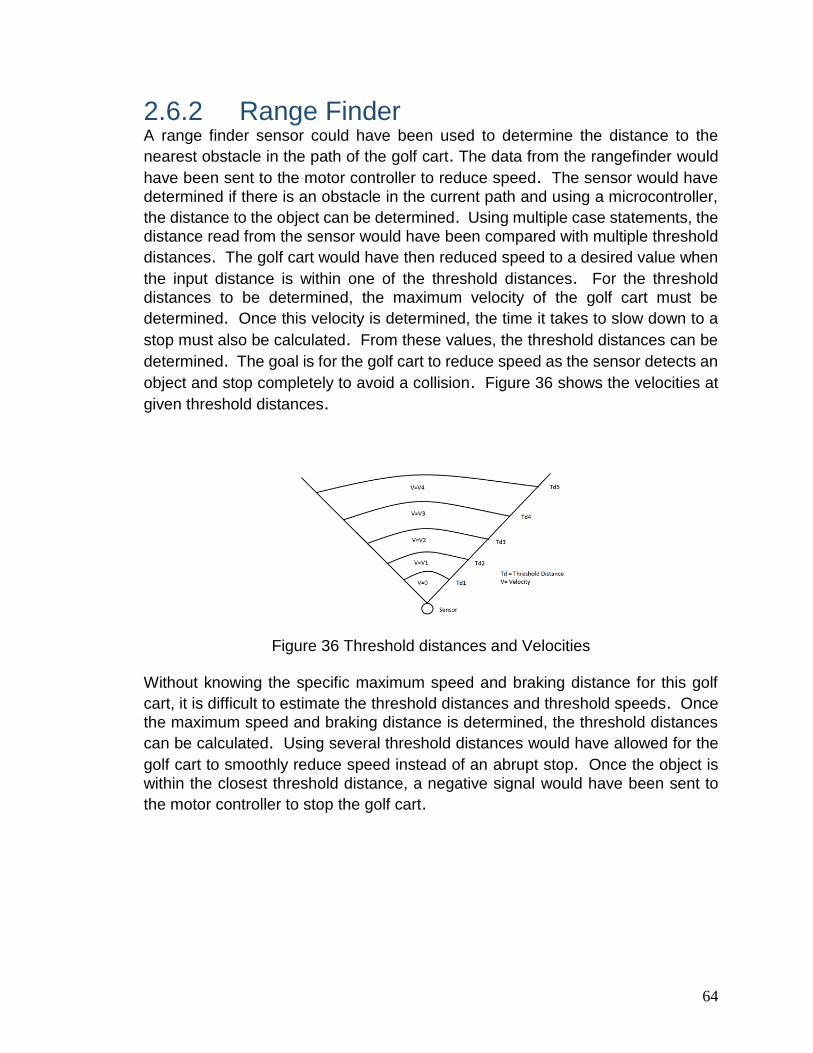
64
2.6.2 Range Finder A range finder sensor could have been used to determine the distance to the
nearest obstacle in the path of the golf cart. The data from the rangefinder would
have been sent to the motor controller to reduce speed. The sensor would have
determined if there is an obstacle in the current path and using a microcontroller,
the distance to the object can be determined. Using multiple case statements, the
distance read from the sensor would have been compared with multiple threshold
distances. The golf cart would have then reduced speed to a desired value when
the input distance is within one of the threshold distances. For the threshold
distances to be determined, the maximum velocity of the golf cart must be
determined. Once this velocity is determined, the time it takes to slow down to a
stop must also be calculated. From these values, the threshold distances can be
determined. The goal is for the golf cart to reduce speed as the sensor detects an
object and stop completely to avoid a collision. Figure 36 shows the velocities at
given threshold distances.
Figure 36 Threshold distances and Velocities
Without knowing the specific maximum speed and braking distance for this golf
cart, it is difficult to estimate the threshold distances and threshold speeds. Once
the maximum speed and braking distance is determined, the threshold distances
can be calculated. Using several threshold distances would have allowed for the
golf cart to smoothly reduce speed instead of an abrupt stop. Once the object is
within the closest threshold distance, a negative signal would have been sent to
the motor controller to stop the golf cart.
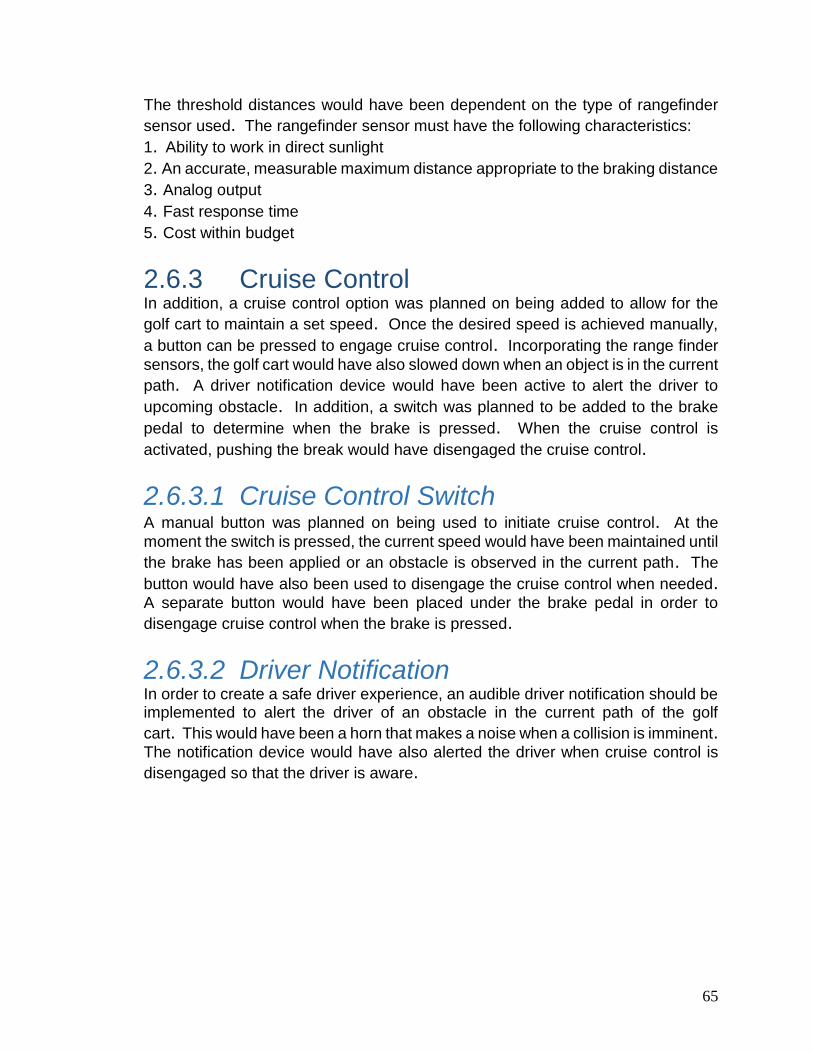
65
The threshold distances would have been dependent on the type of rangefinder
sensor used. The rangefinder sensor must have the following characteristics:
1. Ability to work in direct sunlight
2. An accurate, measurable maximum distance appropriate to the braking distance
3. Analog output
4. Fast response time
5. Cost within budget
2.6.3 Cruise Control In addition, a cruise control option was planned on being added to allow for the
golf cart to maintain a set speed. Once the desired speed is achieved manually,
a button can be pressed to engage cruise control. Incorporating the range finder
sensors, the golf cart would have also slowed down when an object is in the current
path. A driver notification device would have been active to alert the driver to
upcoming obstacle. In addition, a switch was planned to be added to the brake
pedal to determine when the brake is pressed. When the cruise control is
activated, pushing the break would have disengaged the cruise control.
2.6.3.1 Cruise Control Switch A manual button was planned on being used to initiate cruise control. At the
moment the switch is pressed, the current speed would have been maintained until
the brake has been applied or an obstacle is observed in the current path. The
button would have also been used to disengage the cruise control when needed. A separate button would have been placed under the brake pedal in order to
disengage cruise control when the brake is pressed.
2.6.3.2 Driver Notification In order to create a safe driver experience, an audible driver notification should be implemented to alert the driver of an obstacle in the current path of the golf
cart. This would have been a horn that makes a noise when a collision is imminent. The notification device would have also alerted the driver when cruise control is
disengaged so that the driver is aware.
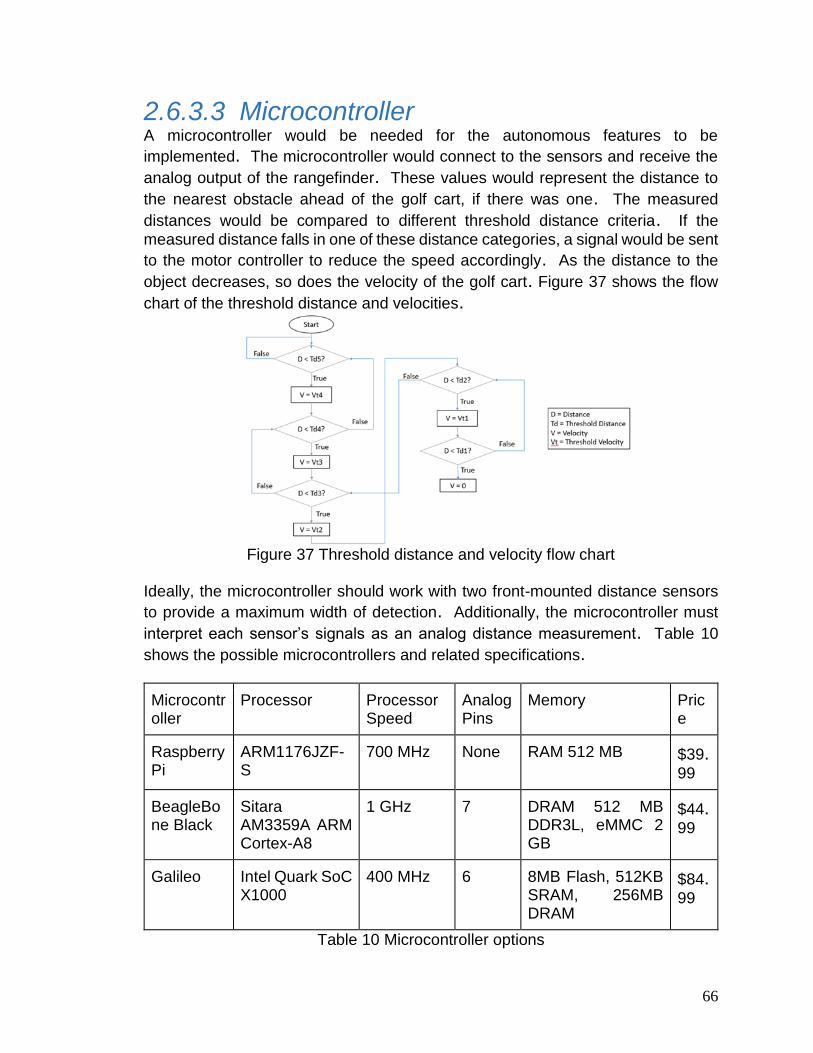
66
2.6.3.3 Microcontroller A microcontroller would be needed for the autonomous features to be
implemented. The microcontroller would connect to the sensors and receive the
analog output of the rangefinder. These values would represent the distance to
the nearest obstacle ahead of the golf cart, if there was one. The measured
distances would be compared to different threshold distance criteria. If the
measured distance falls in one of these distance categories, a signal would be sent
to the motor controller to reduce the speed accordingly. As the distance to the
object decreases, so does the velocity of the golf cart. Figure 37 shows the flow
chart of the threshold distance and velocities.
Figure 37 Threshold distance and velocity flow chart
Ideally, the microcontroller should work with two front-mounted distance sensors
to provide a maximum width of detection. Additionally, the microcontroller must
interpret each sensor’s signals as an analog distance measurement. Table 10
shows the possible microcontrollers and related specifications.
Microcontroller
Processor Processor Speed
Analog Pins
Memory Price
Raspberry Pi
ARM1176JZF-S
700 MHz None RAM 512 MB $39.99
BeagleBone Black
Sitara AM3359A ARM Cortex-A8
1 GHz 7 DRAM 512 MB DDR3L, eMMC 2 GB
$44.99
Galileo Intel Quark SoC X1000
400 MHz 6 8MB Flash, 512KB SRAM, 256MB DRAM
$84.99
Table 10 Microcontroller options
67
2.6.4 Software The software used for this microcontroller depended on the choice of
microcontroller. A simple case statement can be used to compare the current
distance to the threshold distances and change the velocity accordingly. The
output would have sent a signal to the motor controller to reduce the speed if
necessary. The microcontroller would have received the inputs from the
rangefinder sensors and provide an output to the motor controller.
3 Design This section describes in detail the steps taken to design the solar powered golf cart.
3.1 Touchscreen Display The cart’s Touchscreen display system was designed using multiple software solutions as a result of the system containing both software design and PCB circuit
design. The final outcome from the collaboration of the two areas of design
resulted in a testable Touchscreen display prototype. The following sections
elaborate on each step of the Touchscreen display system’s development process.
3.1.1 Android Application Development The software for the Touchscreen display system was loaded on the ODROID C1
microcomputer in the form of an Android Application running on the Android 4.4
KitKat mobile environment. This application consists of four classes to accomplish
every requirement established in the research phase, these classes are the
following: MainActivity.java, CartStatus.java, UserNav.java, and Settings.java. The user is brought to the MainActivity.java class upon application execution and
this class handles requests from the user to navigate to the various functions
throughout the application. Once the user clicks the “Navigate” button on the
MainActivity.java class menu the Android Application starts a new activity to invoke
the UserNav.java class. The UserNav.java class invokes the Support Map
Fragment method to generate an interactive Google Map object using the Google Maps API and also generates waypoints on the Google Map to help guide users
around the UCF campus.
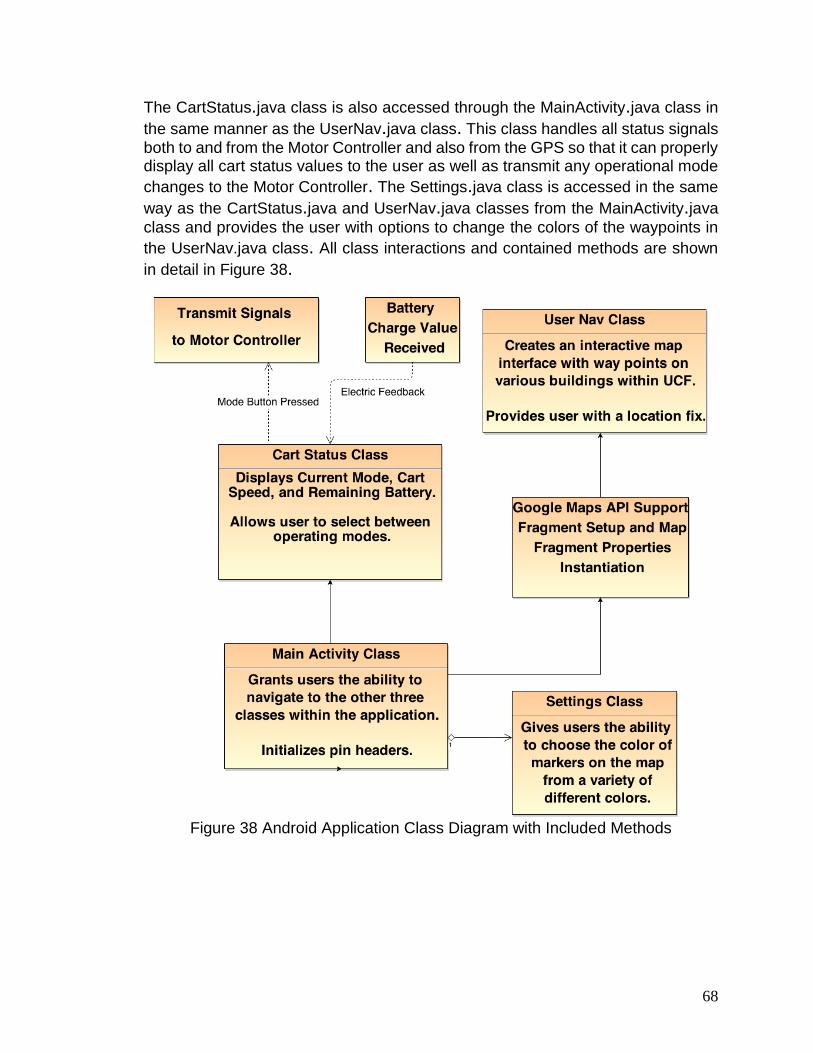
68
The CartStatus.java class is also accessed through the MainActivity.java class in
the same manner as the UserNav.java class. This class handles all status signals
both to and from the Motor Controller and also from the GPS so that it can properly display all cart status values to the user as well as transmit any operational mode
changes to the Motor Controller. The Settings.java class is accessed in the same
way as the CartStatus.java and UserNav.java classes from the MainActivity.java
class and provides the user with options to change the colors of the waypoints in
the UserNav.java class. All class interactions and contained methods are shown
in detail in Figure 38.
Figure 38 Android Application Class Diagram with Included Methods
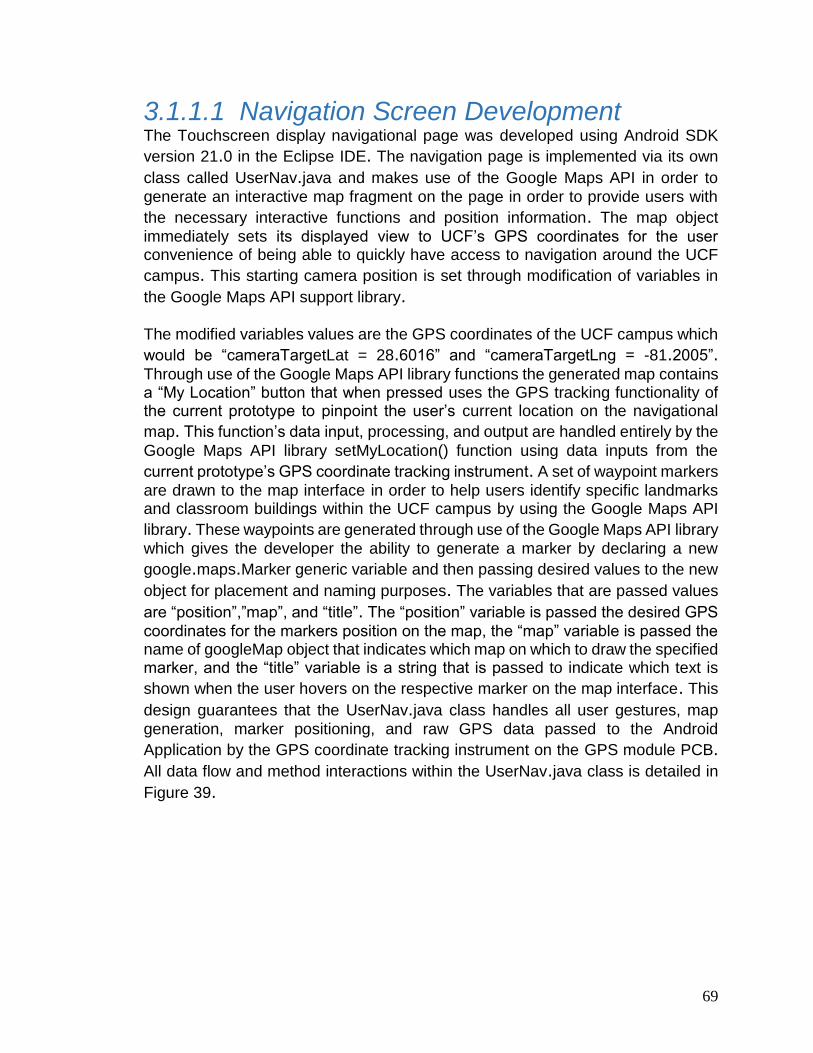
69
3.1.1.1 Navigation Screen Development The Touchscreen display navigational page was developed using Android SDK
version 21.0 in the Eclipse IDE. The navigation page is implemented via its own
class called UserNav.java and makes use of the Google Maps API in order to
generate an interactive map fragment on the page in order to provide users with
the necessary interactive functions and position information. The map object
immediately sets its displayed view to UCF’s GPS coordinates for the user convenience of being able to quickly have access to navigation around the UCF
campus. This starting camera position is set through modification of variables in
the Google Maps API support library. The modified variables values are the GPS coordinates of the UCF campus which
would be “cameraTargetLat = 28.6016” and “cameraTargetLng = -81.2005”. Through use of the Google Maps API library functions the generated map contains a “My Location” button that when pressed uses the GPS tracking functionality of the current prototype to pinpoint the user’s current location on the navigational
map. This function’s data input, processing, and output are handled entirely by the
Google Maps API library setMyLocation() function using data inputs from the
current prototype’s GPS coordinate tracking instrument. A set of waypoint markers
are drawn to the map interface in order to help users identify specific landmarks and classroom buildings within the UCF campus by using the Google Maps API
library. These waypoints are generated through use of the Google Maps API library
which gives the developer the ability to generate a marker by declaring a new
google.maps.Marker generic variable and then passing desired values to the new
object for placement and naming purposes. The variables that are passed values
are “position”,”map”, and “title”. The “position” variable is passed the desired GPS
coordinates for the markers position on the map, the “map” variable is passed the name of googleMap object that indicates which map on which to draw the specified marker, and the “title” variable is a string that is passed to indicate which text is
shown when the user hovers on the respective marker on the map interface. This
design guarantees that the UserNav.java class handles all user gestures, map
generation, marker positioning, and raw GPS data passed to the Android
Application by the GPS coordinate tracking instrument on the GPS module PCB. All data flow and method interactions within the UserNav.java class is detailed in
Figure 39.
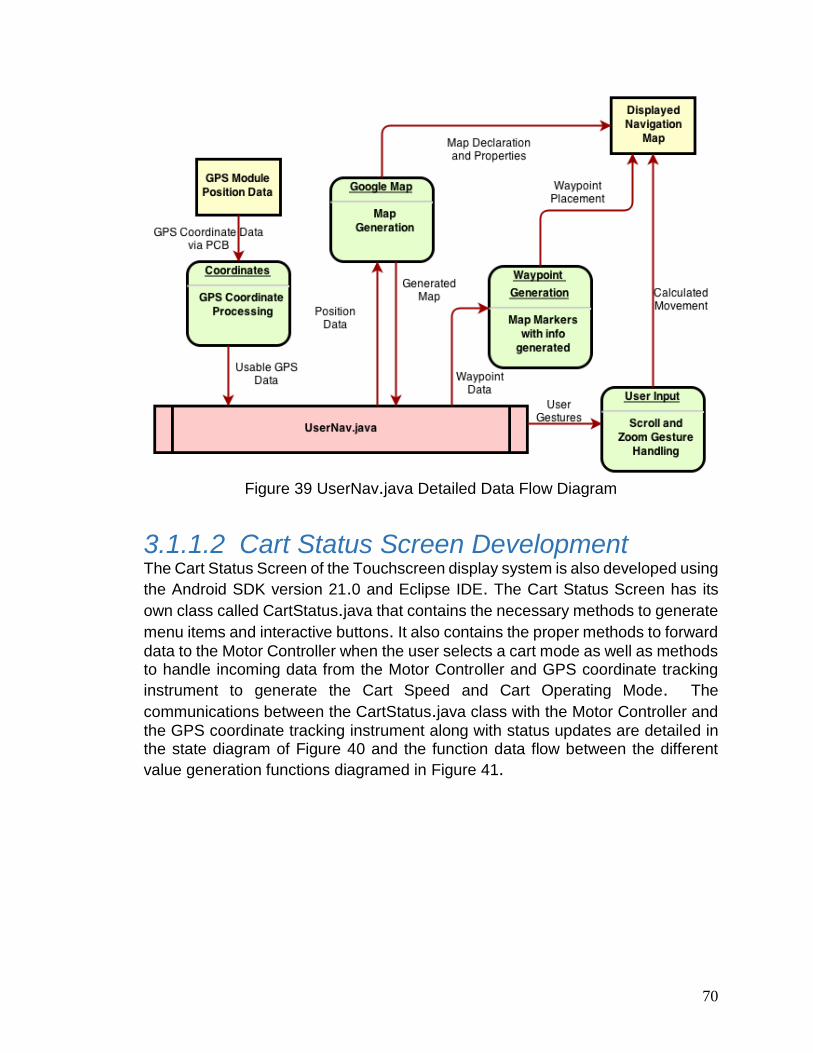
70
Figure 39 UserNav.java Detailed Data Flow Diagram
3.1.1.2 Cart Status Screen Development The Cart Status Screen of the Touchscreen display system is also developed using
the Android SDK version 21.0 and Eclipse IDE. The Cart Status Screen has its
own class called CartStatus.java that contains the necessary methods to generate
menu items and interactive buttons. It also contains the proper methods to forward
data to the Motor Controller when the user selects a cart mode as well as methods to handle incoming data from the Motor Controller and GPS coordinate tracking
instrument to generate the Cart Speed and Cart Operating Mode. The
communications between the CartStatus.java class with the Motor Controller and
the GPS coordinate tracking instrument along with status updates are detailed in the state diagram of Figure 40 and the function data flow between the different
value generation functions diagramed in Figure 41.
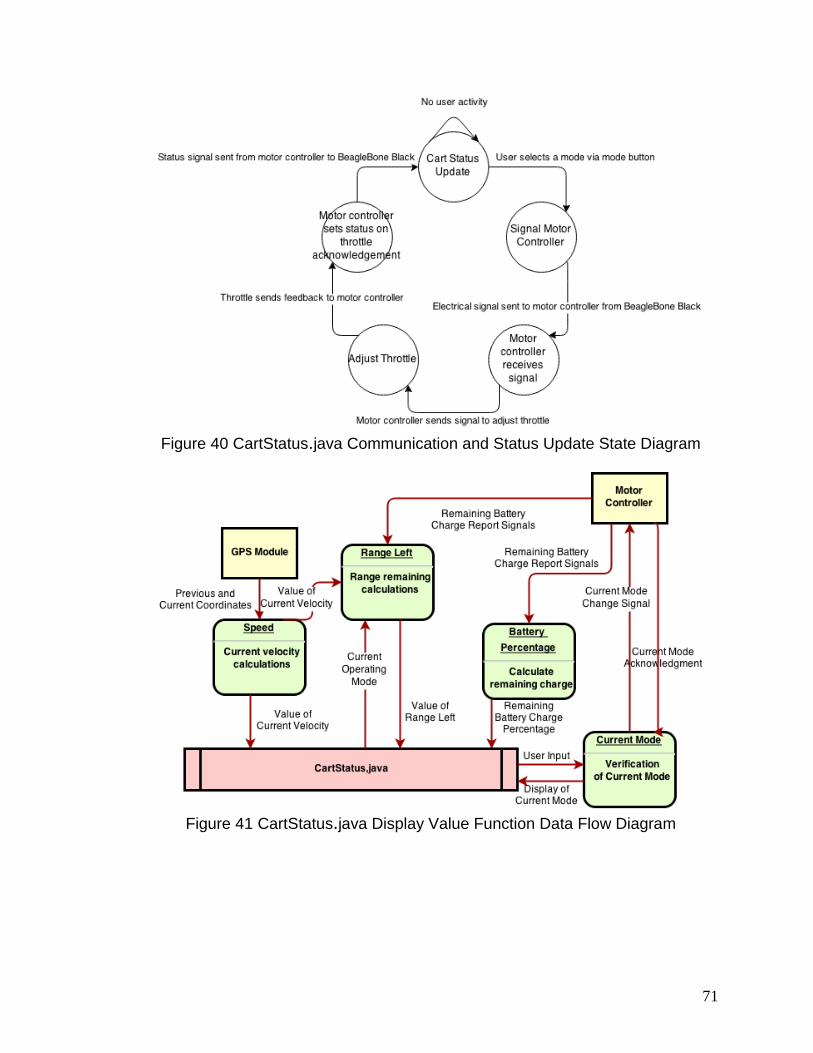
71
Figure 40 CartStatus.java Communication and Status Update State Diagram
Figure 41 CartStatus.java Display Value Function Data Flow Diagram
72
3.1.1.2.1 Cart Speed and Current Mode The Current Speed function is responsible for handling the received data input from the GPS coordinate tracking instrument and for returning a displayable
velocity value to the CartStatus.java class. Its function input values are values
regarding the data for the user’s current and previous GPS coordinate positions
that were measured by the GPS coordinate tracking instrument. Using this data
the function measures the distance between the cart’s most recent position and
previous positions to generate an estimated velocity of the cart. The velocity
variable value is then displayed in meters per second; calling a function from a
java library in the project does this operation. This calculated value is then returned
back to CartStatus.java in the form of an integer to be displayed through functions
calls into the proper field on the “Cart Status” screen interface. This process
continues to loop without interruption in order to provide users with an up-to-date
value at all times. The Current Mode function does not only take input from the
user’s touchscreen input data but also from the Motor Controller module’s mode
acknowledgement signals. As well as being the middleman between the user and
the Motor Controller module, it also verifies that the cart is in the correct user-selected mode and then displays the current mode as a string for display in the
Current Mode field of the CartStatus.java class. Its function input from the user is
a variable indicating which mode the user selected on the “Cart Status” screen using the mode buttons, if the user has not yet selected a mode since power-on
the default operating mode is “Standard”. Once this value has been passed to the
function it makes a function call to the ODROID C1’s GPIO interface to send a signal informing the Motor Controller to change the cart’s operating mode to the
respective sent value. After transmission the Android Application waits until the
Motor Controller reports back through the ODROID C1’s GPIO pin connections and then fetches the transmitted signal values to be used in a conditional
operation. The aforementioned conditional operation checks to make sure the
acknowledgement signals from the Motor Controller match the new operating mode value, if they do match then the Current Mode function returns the value of
the current mode in the form of a string for display on the “Cart Status” screen. If a mismatch occurs then the cart repeats the requested mode change in a retransmission to the Motor Controller and afterwards goes through the same
conditional operation again until the values finally match. For testing purposes in
the early prototypes the Current Mode function provided dummy signal values from the Motor Controller module since the Motor Controller won’t be providing signals
to the ODROID C1 module system until later prototypes.
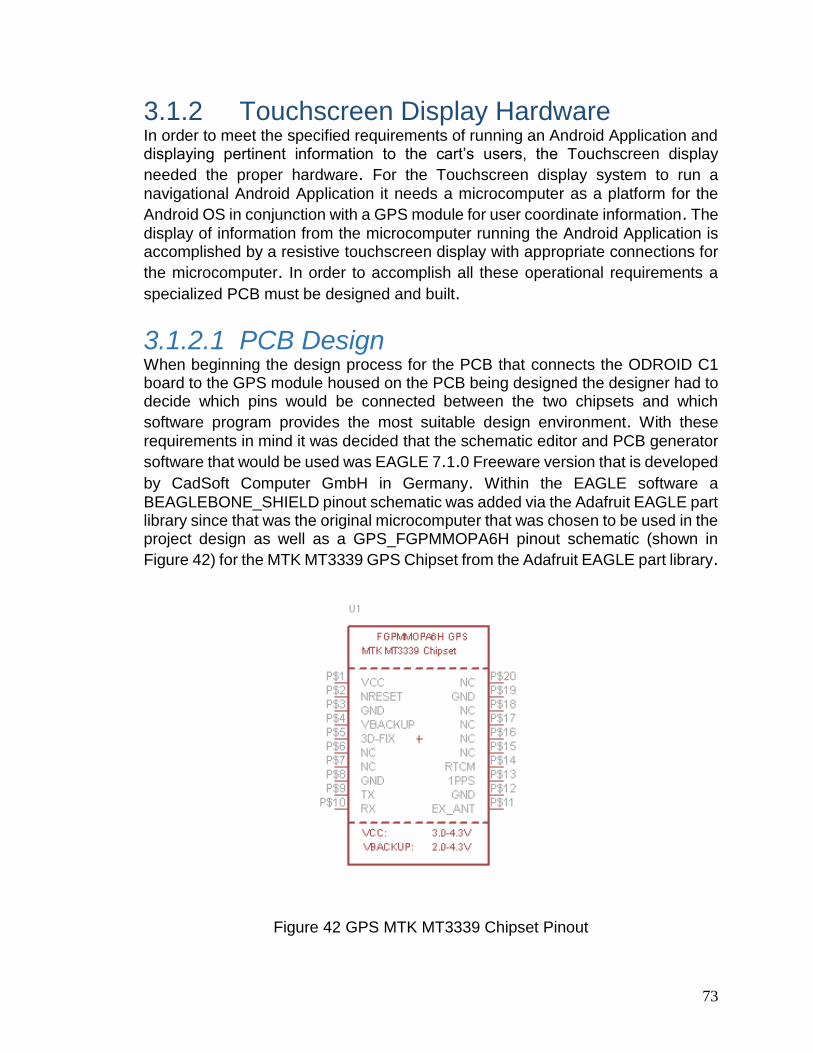
73
3.1.2 Touchscreen Display Hardware In order to meet the specified requirements of running an Android Application and displaying pertinent information to the cart’s users, the Touchscreen display
needed the proper hardware. For the Touchscreen display system to run a
navigational Android Application it needs a microcomputer as a platform for the
Android OS in conjunction with a GPS module for user coordinate information. The
display of information from the microcomputer running the Android Application is accomplished by a resistive touchscreen display with appropriate connections for
the microcomputer. In order to accomplish all these operational requirements a
specialized PCB must be designed and built.
3.1.2.1 PCB Design When beginning the design process for the PCB that connects the ODROID C1 board to the GPS module housed on the PCB being designed the designer had to decide which pins would be connected between the two chipsets and which
software program provides the most suitable design environment. With these
requirements in mind it was decided that the schematic editor and PCB generator
software that would be used was EAGLE 7.1.0 Freeware version that is developed
by CadSoft Computer GmbH in Germany. Within the EAGLE software a
BEAGLEBONE_SHIELD pinout schematic was added via the Adafruit EAGLE part library since that was the original microcomputer that was chosen to be used in the project design as well as a GPS_FGPMMOPA6H pinout schematic (shown in
Figure 42) for the MTK MT3339 GPS Chipset from the Adafruit EAGLE part library.
Figure 42 GPS MTK MT3339 Chipset Pinout
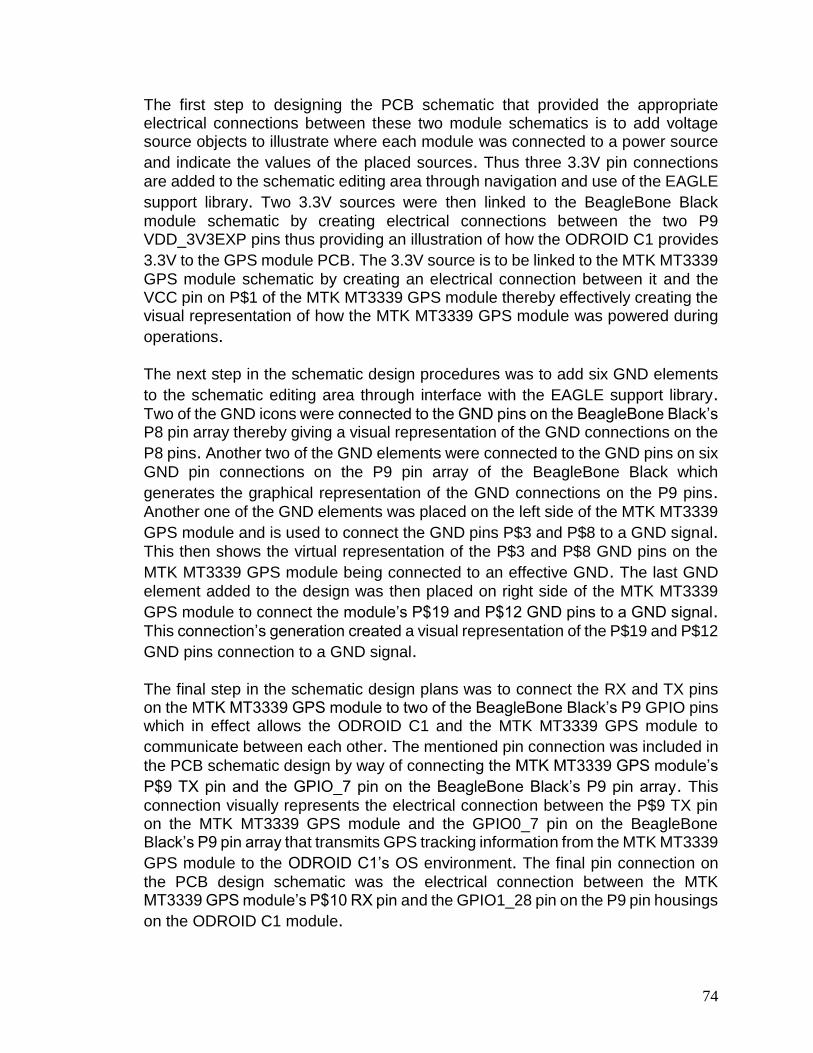
74
The first step to designing the PCB schematic that provided the appropriate electrical connections between these two module schematics is to add voltage source objects to illustrate where each module was connected to a power source
and indicate the values of the placed sources. Thus three 3.3V pin connections
are added to the schematic editing area through navigation and use of the EAGLE
support library. Two 3.3V sources were then linked to the BeagleBone Black
module schematic by creating electrical connections between the two P9 VDD_3V3EXP pins thus providing an illustration of how the ODROID C1 provides
3.3V to the GPS module PCB. The 3.3V source is to be linked to the MTK MT3339
GPS module schematic by creating an electrical connection between it and the VCC pin on P$1 of the MTK MT3339 GPS module thereby effectively creating the visual representation of how the MTK MT3339 GPS module was powered during
operations. The next step in the schematic design procedures was to add six GND elements
to the schematic editing area through interface with the EAGLE support library. Two of the GND icons were connected to the GND pins on the BeagleBone Black’s P8 pin array thereby giving a visual representation of the GND connections on the
P8 pins. Another two of the GND elements were connected to the GND pins on six
GND pin connections on the P9 pin array of the BeagleBone Black which
generates the graphical representation of the GND connections on the P9 pins. Another one of the GND elements was placed on the left side of the MTK MT3339
GPS module and is used to connect the GND pins P$3 and P$8 to a GND signal. This then shows the virtual representation of the P$3 and P$8 GND pins on the
MTK MT3339 GPS module being connected to an effective GND. The last GND
element added to the design was then placed on right side of the MTK MT3339
GPS module to connect the module’s P$19 and P$12 GND pins to a GND signal. This connection’s generation created a visual representation of the P$19 and P$12
GND pins connection to a GND signal. The final step in the schematic design plans was to connect the RX and TX pins on the MTK MT3339 GPS module to two of the BeagleBone Black’s P9 GPIO pins which in effect allows the ODROID C1 and the MTK MT3339 GPS module to
communicate between each other. The mentioned pin connection was included in
the PCB schematic design by way of connecting the MTK MT3339 GPS module’s
P$9 TX pin and the GPIO_7 pin on the BeagleBone Black’s P9 pin array. This
connection visually represents the electrical connection between the P$9 TX pin on the MTK MT3339 GPS module and the GPIO0_7 pin on the BeagleBone Black’s P9 pin array that transmits GPS tracking information from the MTK MT3339
GPS module to the ODROID C1’s OS environment. The final pin connection on
the PCB design schematic was the electrical connection between the MTK MT3339 GPS module’s P$10 RX pin and the GPIO1_28 pin on the P9 pin housings
on the ODROID C1 module.
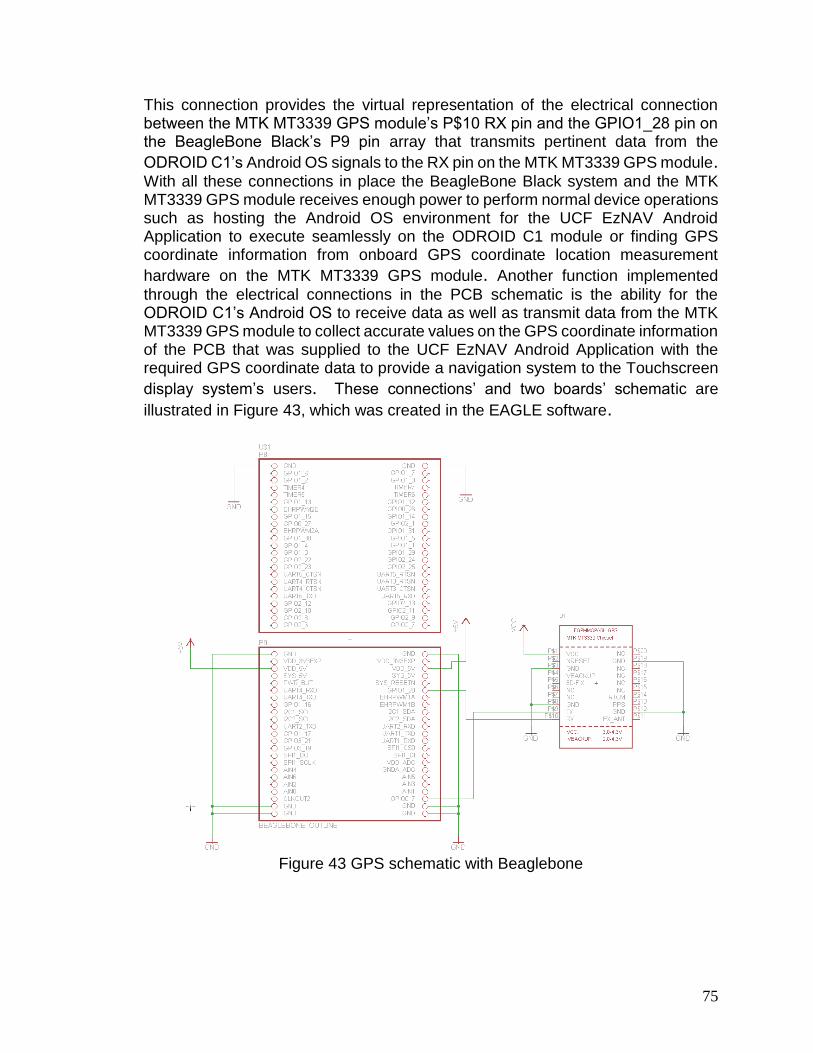
75
This connection provides the virtual representation of the electrical connection between the MTK MT3339 GPS module’s P$10 RX pin and the GPIO1_28 pin on the BeagleBone Black’s P9 pin array that transmits pertinent data from the
ODROID C1’s Android OS signals to the RX pin on the MTK MT3339 GPS module. With all these connections in place the BeagleBone Black system and the MTK MT3339 GPS module receives enough power to perform normal device operations such as hosting the Android OS environment for the UCF EzNAV Android Application to execute seamlessly on the ODROID C1 module or finding GPS coordinate information from onboard GPS coordinate location measurement
hardware on the MTK MT3339 GPS module. Another function implemented
through the electrical connections in the PCB schematic is the ability for the ODROID C1’s Android OS to receive data as well as transmit data from the MTK MT3339 GPS module to collect accurate values on the GPS coordinate information of the PCB that was supplied to the UCF EzNAV Android Application with the required GPS coordinate data to provide a navigation system to the Touchscreen
display system’s users. These connections’ and two boards’ schematic are
illustrated in Figure 43, which was created in the EAGLE software.
Figure 43 GPS schematic with Beaglebone
76
3.1.2.1.1 Enclosure Design The original design plan was to have the GPS Module PCB’s headers connected
directly into the female headers on the BeagleBone Black microcomputer, however
when the design decision to use the ODROID C1 came about there was no
possibility of having it mounted on top of the microcomputer board. Therefore the
necessity to create an enclosure for the PCB arose in order to protect and insulate
the PCB while giving it the ability to be mounted within the cart. The original design
plan to accomplish this was to 3D print a box with an open top to allow the antenna
and header connections to be made as well as including holes for a bar to secure
the PCB within the box since there are no holes on it. Upon taking the design to
UCF’s TI Innovation Lab the assistants made a suggestion to instead use the laser-
cuter to cut acrylic into sides of a box and a bar as it would be a much faster and
easier design process than 3D printing. The laser cutting schematic was drawn up
early during an afternoon and was then laser-cut in less than twenty minutes on
the same day using leftover acrylic in the TI Innovation Lab. The finished sides of
the box and securing bar are shown in Figure 44.
Figure 44 Laser Cut Acrylic GPS Module PCB Enclosure Sides and Securing Bar
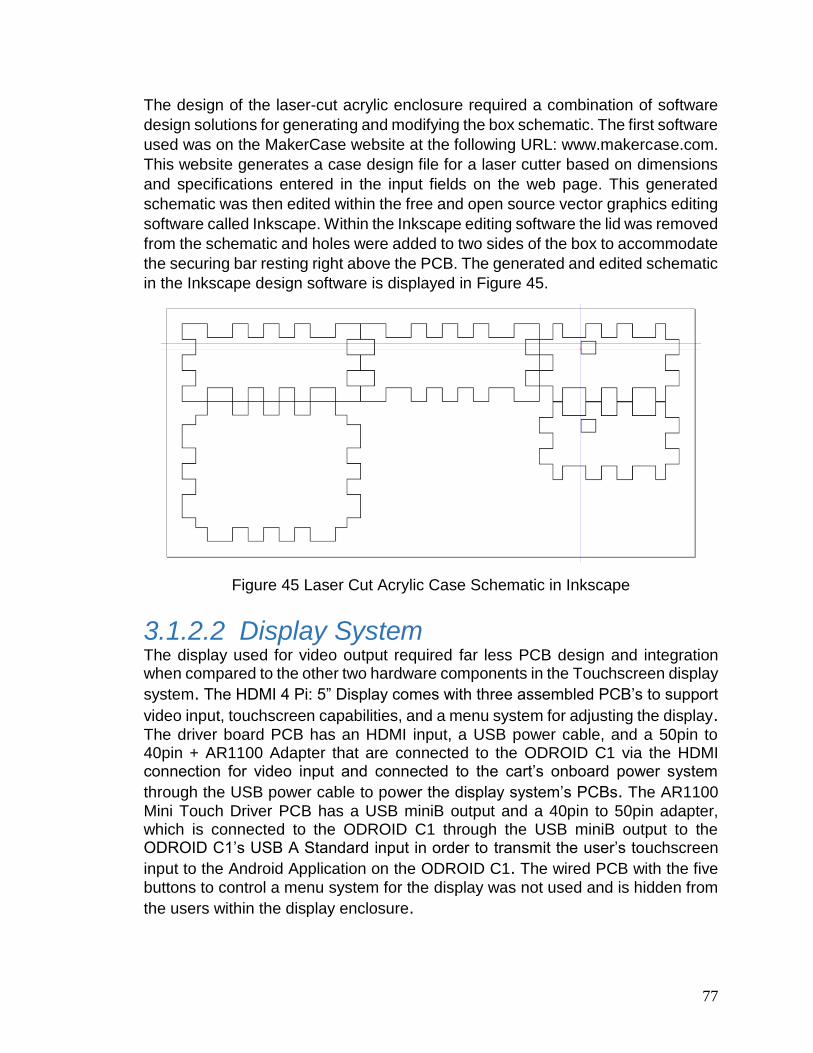
77
The design of the laser-cut acrylic enclosure required a combination of software
design solutions for generating and modifying the box schematic. The first software
used was on the MakerCase website at the following URL: www.makercase.com.
This website generates a case design file for a laser cutter based on dimensions
and specifications entered in the input fields on the web page. This generated
schematic was then edited within the free and open source vector graphics editing
software called Inkscape. Within the Inkscape editing software the lid was removed
from the schematic and holes were added to two sides of the box to accommodate
the securing bar resting right above the PCB. The generated and edited schematic
in the Inkscape design software is displayed in Figure 45.
Figure 45 Laser Cut Acrylic Case Schematic in Inkscape
3.1.2.2 Display System The display used for video output required far less PCB design and integration when compared to the other two hardware components in the Touchscreen display
system. The HDMI 4 Pi: 5” Display comes with three assembled PCB’s to support
video input, touchscreen capabilities, and a menu system for adjusting the display. The driver board PCB has an HDMI input, a USB power cable, and a 50pin to 40pin + AR1100 Adapter that are connected to the ODROID C1 via the HDMI connection for video input and connected to the cart’s onboard power system
through the USB power cable to power the display system’s PCBs. The AR1100
Mini Touch Driver PCB has a USB miniB output and a 40pin to 50pin adapter, which is connected to the ODROID C1 through the USB miniB output to the ODROID C1’s USB A Standard input in order to transmit the user’s touchscreen
input to the Android Application on the ODROID C1. The wired PCB with the five
buttons to control a menu system for the display was not used and is hidden from
the users within the display enclosure.
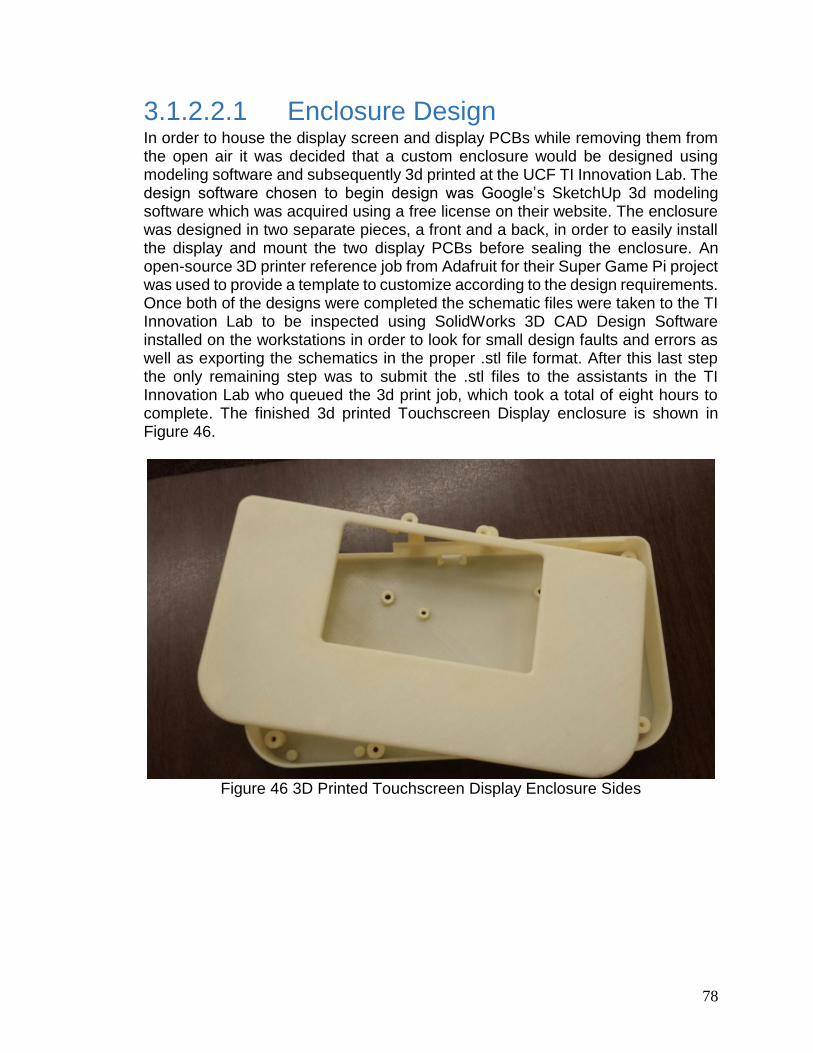
78
3.1.2.2.1 Enclosure Design In order to house the display screen and display PCBs while removing them from the open air it was decided that a custom enclosure would be designed using modeling software and subsequently 3d printed at the UCF TI Innovation Lab. The design software chosen to begin design was Google’s SketchUp 3d modeling software which was acquired using a free license on their website. The enclosure was designed in two separate pieces, a front and a back, in order to easily install the display and mount the two display PCBs before sealing the enclosure. An open-source 3D printer reference job from Adafruit for their Super Game Pi project was used to provide a template to customize according to the design requirements. Once both of the designs were completed the schematic files were taken to the TI Innovation Lab to be inspected using SolidWorks 3D CAD Design Software installed on the workstations in order to look for small design faults and errors as well as exporting the schematics in the proper .stl file format. After this last step the only remaining step was to submit the .stl files to the assistants in the TI Innovation Lab who queued the 3d print job, which took a total of eight hours to complete. The finished 3d printed Touchscreen Display enclosure is shown in Figure 46.
Figure 46 3D Printed Touchscreen Display Enclosure Sides
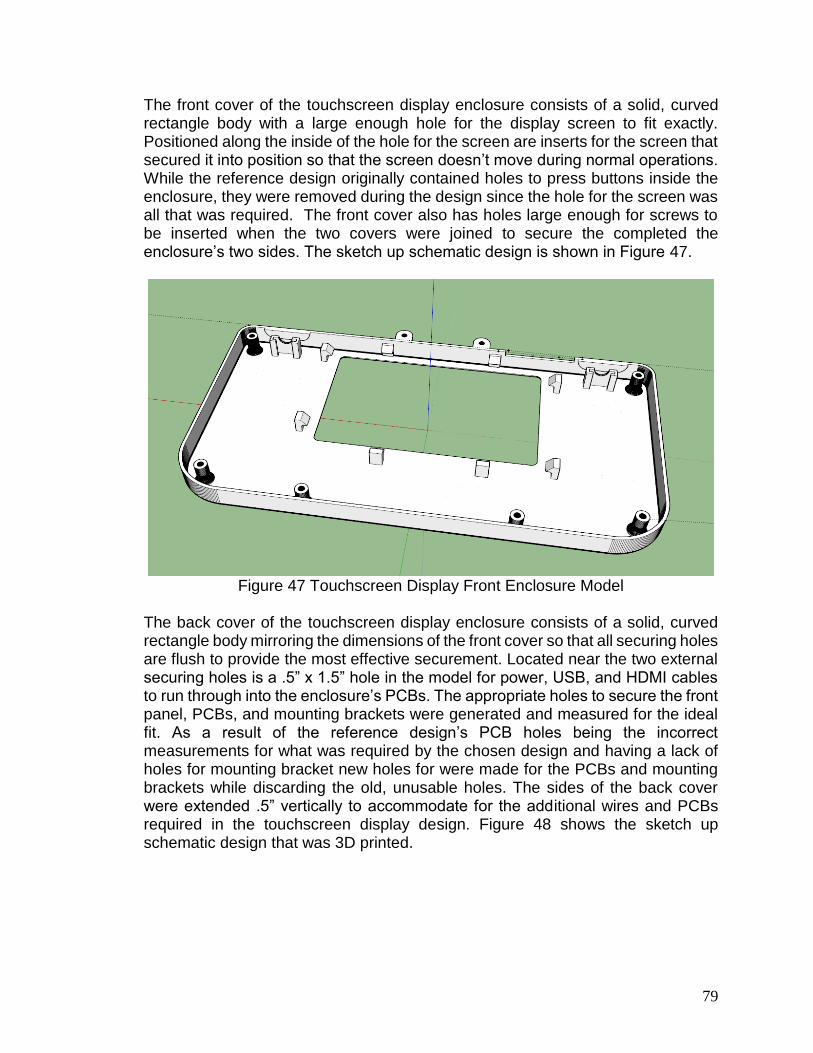
79
The front cover of the touchscreen display enclosure consists of a solid, curved rectangle body with a large enough hole for the display screen to fit exactly. Positioned along the inside of the hole for the screen are inserts for the screen that secured it into position so that the screen doesn’t move during normal operations. While the reference design originally contained holes to press buttons inside the enclosure, they were removed during the design since the hole for the screen was all that was required. The front cover also has holes large enough for screws to be inserted when the two covers were joined to secure the completed the enclosure’s two sides. The sketch up schematic design is shown in Figure 47.
Figure 47 Touchscreen Display Front Enclosure Model
The back cover of the touchscreen display enclosure consists of a solid, curved rectangle body mirroring the dimensions of the front cover so that all securing holes are flush to provide the most effective securement. Located near the two external securing holes is a .5” x 1.5” hole in the model for power, USB, and HDMI cables to run through into the enclosure’s PCBs. The appropriate holes to secure the front panel, PCBs, and mounting brackets were generated and measured for the ideal fit. As a result of the reference design’s PCB holes being the incorrect measurements for what was required by the chosen design and having a lack of holes for mounting bracket new holes for were made for the PCBs and mounting brackets while discarding the old, unusable holes. The sides of the back cover were extended .5” vertically to accommodate for the additional wires and PCBs required in the touchscreen display design. Figure 48 shows the sketch up schematic design that was 3D printed.
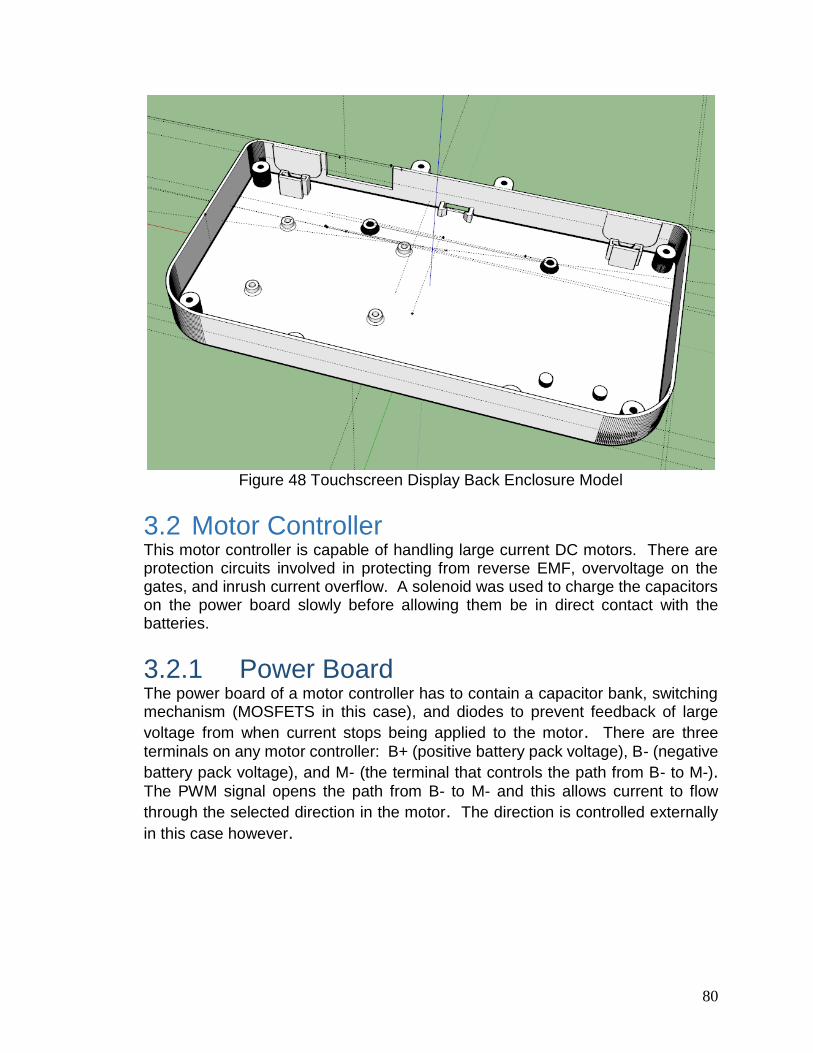
80
Figure 48 Touchscreen Display Back Enclosure Model
3.2 Motor Controller This motor controller is capable of handling large current DC motors. There are protection circuits involved in protecting from reverse EMF, overvoltage on the gates, and inrush current overflow. A solenoid was used to charge the capacitors on the power board slowly before allowing them be in direct contact with the batteries.
3.2.1 Power Board The power board of a motor controller has to contain a capacitor bank, switching mechanism (MOSFETS in this case), and diodes to prevent feedback of large
voltage from when current stops being applied to the motor. There are three
terminals on any motor controller: B+ (positive battery pack voltage), B- (negative
battery pack voltage), and M- (the terminal that controls the path from B- to M-). The PWM signal opens the path from B- to M- and this allows current to flow
through the selected direction in the motor. The direction is controlled externally
in this case however.
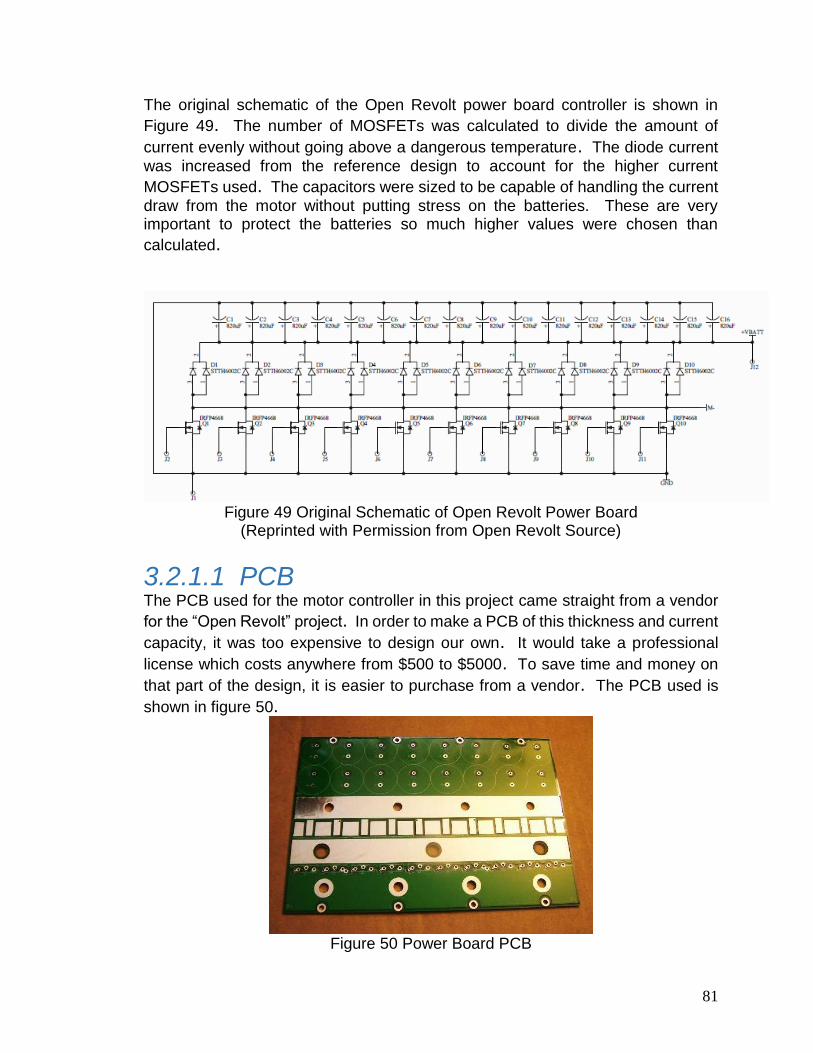
81
The original schematic of the Open Revolt power board controller is shown in
Figure 49. The number of MOSFETs was calculated to divide the amount of
current evenly without going above a dangerous temperature. The diode current
was increased from the reference design to account for the higher current
MOSFETs used. The capacitors were sized to be capable of handling the current
draw from the motor without putting stress on the batteries. These are very important to protect the batteries so much higher values were chosen than
calculated.
Figure 49 Original Schematic of Open Revolt Power Board
(Reprinted with Permission from Open Revolt Source)
3.2.1.1 PCB The PCB used for the motor controller in this project came straight from a vendor
for the “Open Revolt” project. In order to make a PCB of this thickness and current
capacity, it was too expensive to design our own. It would take a professional
license which costs anywhere from $500 to $5000. To save time and money on
that part of the design, it is easier to purchase from a vendor. The PCB used is
shown in figure 50.
Figure 50 Power Board PCB

82
3.2.1.2 Diode The diodes used in the open source power board were chosen because the power
board was designed around 144V supply. The golf cart uses significantly lower
voltage. Lower voltage diodes tend to come with higher current carrying capability
and better recovery properties. STPS80150CW is the part number that was
decided on because it can handle higher current, does not have as excessively
high voltage requirements, and has better recovery time.
3.2.1.3 MOSFET The power MOSFET’s chosen in this were also different than the ones used in
Open Revolt’s original design. Higher voltage MOSFET’s typically come with
higher on resistance and lower current carrying capabilities. This is why
IRFP7718PbF was chosen instead of the open source standard. It has a much
more appropriate voltage range for the golf cart and much lower on resistance. This means that less heat was generated at equivalent driving current. The
amount of current capable of flowing through these MOSFET’s is much higher than
it needs to be, but this allows for a lower duty cycle to create equivalent power. Lower duty cycles mean less heat which is good for the circuit.
3.2.1.4 Capacitor A replacement capacitor had to be chosen because of the discontinuation of
P11622-ND. 381LR821M200J042 is also an equivalent value capacitor that has
the same dimensions. The same dimensions had to be retained due to the PCB
being milled specifically for this part. A quantity of 14 capacitors at 1000uF is more
than enough to support the batteries to supply an initial current draw of 1000A.
3.2.1.5 Power Board BOM Table 13 contains a list of the cost and parts for this board.
Part Number Description Quantity Cost Total
IRFP7718PbF Power MOSFET 10 6.38 63.80
381LR821M200J042 1000 uF capacitor 14 3.60 57.60
STPS80150CW Diode 10 5.88 94.08
N/A Power Board 1 55.00 55.00
Total 270.48
Table 11 Power Board BOM
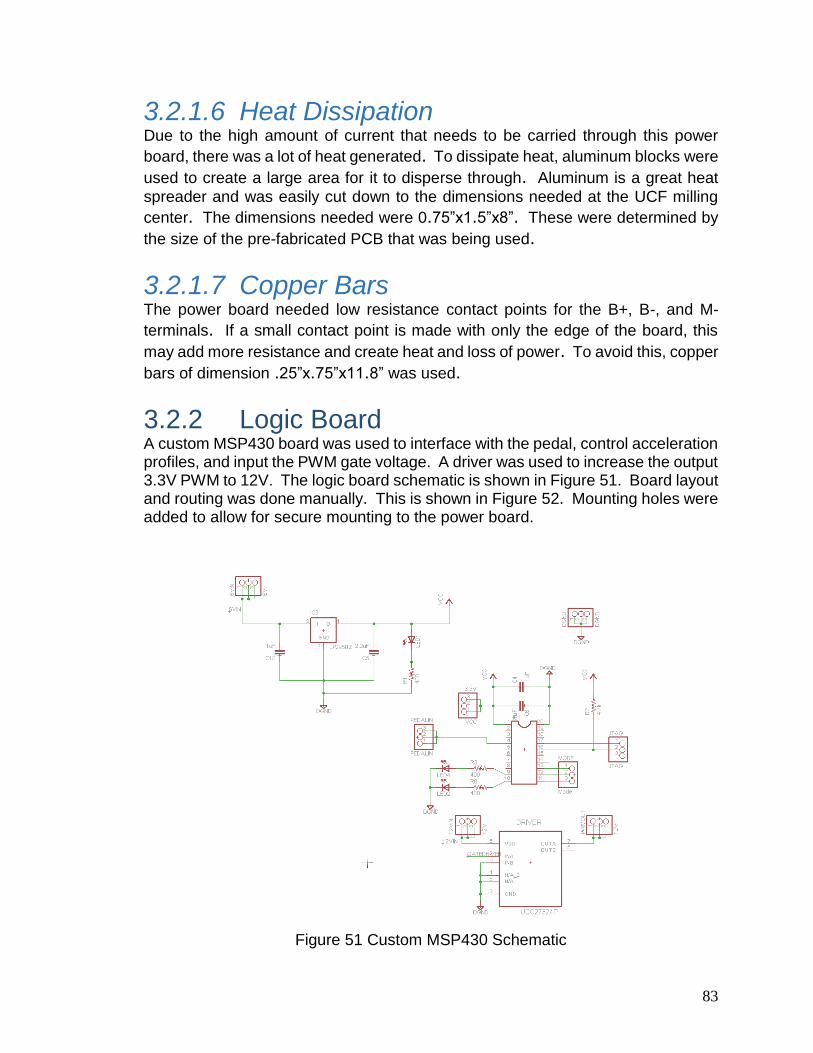
83
3.2.1.6 Heat Dissipation Due to the high amount of current that needs to be carried through this power
board, there was a lot of heat generated. To dissipate heat, aluminum blocks were
used to create a large area for it to disperse through. Aluminum is a great heat
spreader and was easily cut down to the dimensions needed at the UCF milling
center. The dimensions needed were 0.75”x1.5”x8”. These were determined by
the size of the pre-fabricated PCB that was being used.
3.2.1.7 Copper Bars The power board needed low resistance contact points for the B+, B-, and M-
terminals. If a small contact point is made with only the edge of the board, this
may add more resistance and create heat and loss of power. To avoid this, copper
bars of dimension .25”x.75”x11.8” was used.
3.2.2 Logic Board A custom MSP430 board was used to interface with the pedal, control acceleration profiles, and input the PWM gate voltage. A driver was used to increase the output 3.3V PWM to 12V. The logic board schematic is shown in Figure 51. Board layout and routing was done manually. This is shown in Figure 52. Mounting holes were added to allow for secure mounting to the power board.
Figure 51 Custom MSP430 Schematic
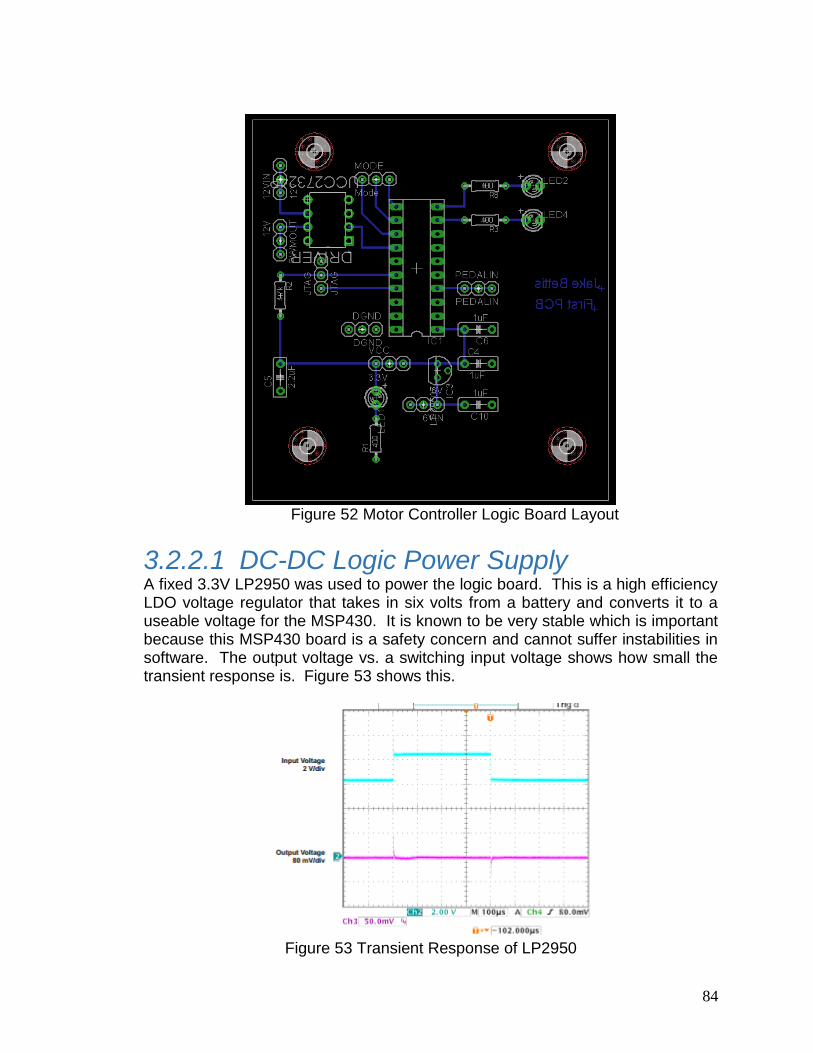
84
Figure 52 Motor Controller Logic Board Layout
3.2.2.1 DC-DC Logic Power Supply A fixed 3.3V LP2950 was used to power the logic board. This is a high efficiency LDO voltage regulator that takes in six volts from a battery and converts it to a useable voltage for the MSP430. It is known to be very stable which is important because this MSP430 board is a safety concern and cannot suffer instabilities in software. The output voltage vs. a switching input voltage shows how small the transient response is. Figure 53 shows this.
Figure 53 Transient Response of LP2950
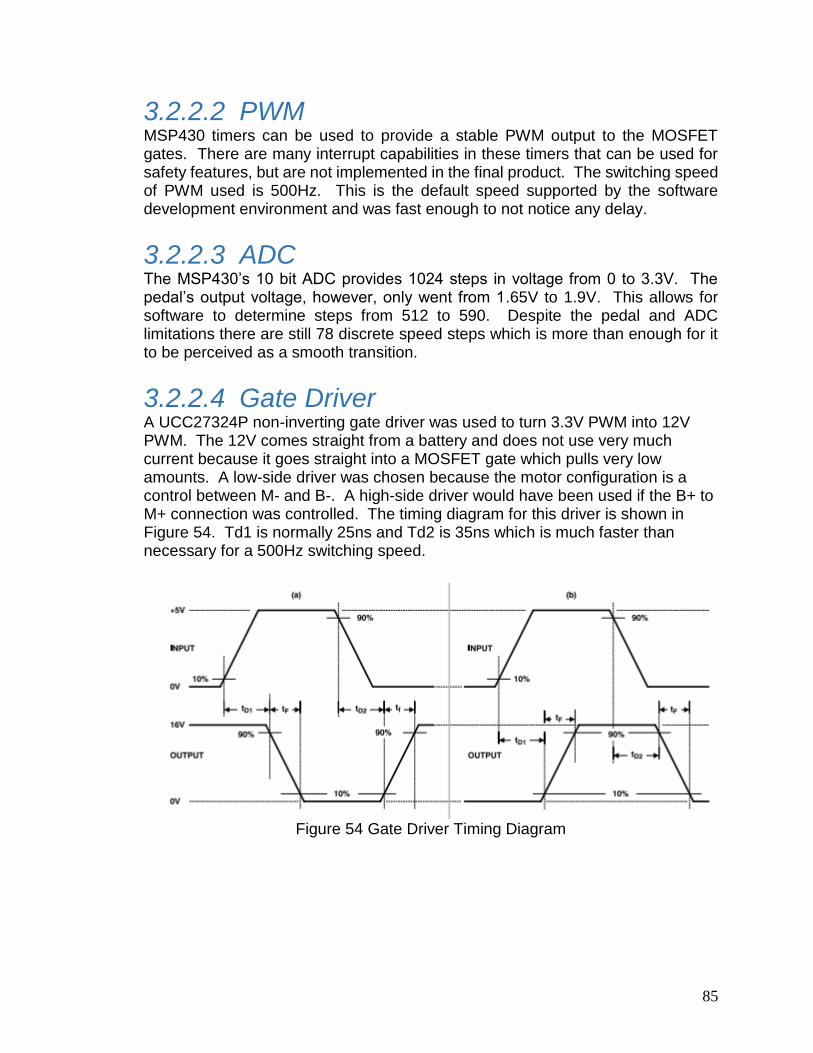
85
3.2.2.2 PWM MSP430 timers can be used to provide a stable PWM output to the MOSFET gates. There are many interrupt capabilities in these timers that can be used for safety features, but are not implemented in the final product. The switching speed of PWM used is 500Hz. This is the default speed supported by the software development environment and was fast enough to not notice any delay.
3.2.2.3 ADC
The MSP430’s 10 bit ADC provides 1024 steps in voltage from 0 to 3.3V. The pedal’s output voltage, however, only went from 1.65V to 1.9V. This allows for software to determine steps from 512 to 590. Despite the pedal and ADC limitations there are still 78 discrete speed steps which is more than enough for it to be perceived as a smooth transition.
3.2.2.4 Gate Driver
A UCC27324P non-inverting gate driver was used to turn 3.3V PWM into 12V PWM. The 12V comes straight from a battery and does not use very much current because it goes straight into a MOSFET gate which pulls very low amounts. A low-side driver was chosen because the motor configuration is a control between M- and B-. A high-side driver would have been used if the B+ to M+ connection was controlled. The timing diagram for this driver is shown in Figure 54. Td1 is normally 25ns and Td2 is 35ns which is much faster than necessary for a 500Hz switching speed.
Figure 54 Gate Driver Timing Diagram
86
3.2.2.5 Energia Energia provides an easy way to implement software for an MSP430 board through pre-defined functions for a reference design. Pins were chosen to be compatible with a reference design so these predefined functions could be used with my custom board.
3.2.2.5.1 analogRead analogREAD() is the function that energia uses to access the ADC library from this
MSP430 board. It maps the 0-3.3V signal to a range of digital values from 0-1024. This number comes from the MSP430 having a 10-bit ADC that has a maximum
of 3.3V and is 5V tolerant. This means that the software can read 1024 for
anything above 3.3V, but no damage occurs as long as it stays below 5V.
3.2.2.5.2 analogWrite analogWrite() function uses the pre-existing libraries to create a PWM signal. This
PWM signal switches on and off at 3.3V digital logic and gives an average between
3.3V and 0V depending on the duty cycle. This is what was used to control the
gate voltage going into the MOSFETs depending on the pedal’s position.
3.2.2.5.3 digitalRead This function provided simple communication between the touchscreen
microcomputer and the TIVAC to determine the modes of operation. It simply
senses a one or zero on the input of a GPIO pin and returns it to a variable.

87
3.2.2.6 Pedal The pedal connects from 3.3V to ground and then provides a varied level between 1.65 and 1.7V. These connections come straight from headers on the logic board and are hidden underneath the golf cart. An analog potentiometer pedal out of a Ford 500 was used. The pedal used is shown in Figure 55.
Figure 55 Ford 500 Pedal Mounted in Golf Cart
3.2.2.7 Non-Volatile Memory The MSP430 Flash memory was programmed with the motor controller software through Spi-by-wire. This is a two-wire method that uses a proprietary programmer from TI through a Launchpad. Every time the MSP430 starts up, this software is what starts to run.
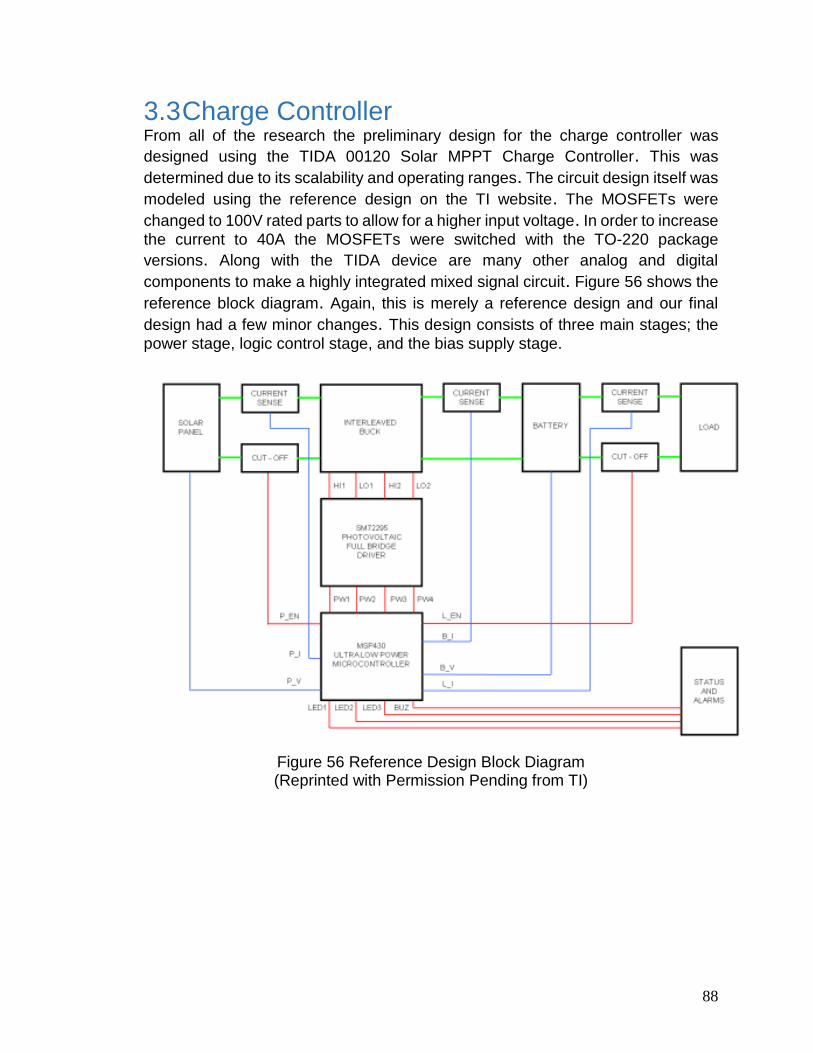
88
3.3 Charge Controller From all of the research the preliminary design for the charge controller was
designed using the TIDA 00120 Solar MPPT Charge Controller. This was
determined due to its scalability and operating ranges. The circuit design itself was
modeled using the reference design on the TI website. The MOSFETs were
changed to 100V rated parts to allow for a higher input voltage. In order to increase
the current to 40A the MOSFETs were switched with the TO-220 package
versions. Along with the TIDA device are many other analog and digital
components to make a highly integrated mixed signal circuit. Figure 56 shows the
reference block diagram. Again, this is merely a reference design and our final
design had a few minor changes. This design consists of three main stages; the
power stage, logic control stage, and the bias supply stage.
Figure 56 Reference Design Block Diagram (Reprinted with Permission Pending from TI)

89
3.3.1 Power Stage The power stage of the design uses a SM72295 photovoltaic full bridge driver which is responsible for driving DC/DC conversion. It is designed to drive 4 discrete N type MOSFET’s in a full bridge configuration. The drivers provide 3 A of peak current for fast efficient switching. Current sensing is provided by 2 trans-conductance amplifiers with externally programmable gain and filtering to remove ripple current to provide average current information to the control circuit. The current sense amplifiers have buffered outputs that provide a low impedance interface to an A/D converter. Under voltage lockout is enabled using a PGOOD indicator which prevents the drivers from operating if VCC is too low. The switching MOSFETs will be changed to 100V rated parts to allow for a higher input voltage. In order to increase the max current rating to 40A the MOSFETs will be switched from a SOP package used in the reference design to a TO-220 package version. Figure 57 below shows the power stage of the schematic that was designed using Altium Designer. The power stage is most of the top half of the circuit including the input blocks and component U1 (SM72295). The MOSFETS that replaced the ones used in the reference design are TI’s CSD19536KCS. These are 100V N-channel NexFET power MOSFETS. These MOSFET’s were chosen because they are designed to minimize losses in power conversion applications. In addition to changing the MOSFET’s, all of the capacitors were chosen to withstand 100V max.
Figure 57 Solar Charge Controller Schematic: Power Stage
90
3.3.1.1 SM72295 Photovoltaic Driver The SM72295 will be responsible for driving the full bridge DC/DC conversion. The
SM72295 is designed to drive 4 discrete N type MOSFET’s in a full bridge
configuration. The drivers provide 3A of peak current for fast efficient switching and
integrated high speed bootstrap diodes. Current sensing is provided by 2
transconductance amplifiers with externally programmable gain and filtering to
remove ripple current to provide average current information to the control circuit.
The current sense amplifiers have buffered outputs available to provide a low
impedance interface to an A/D converter if needed. An externally programmable
input over voltage comparator is also included to shut down all outputs. Under
voltage lockout with a PGOOD indicator prevents the drivers from operating if VCC
is too low.
3.3.2 Logic Control Stage The logic portion is designed using a MSP430F5132 microcontroller. This is an
ultra-low power mixed signal microcontroller and acts as the brains for the charge
controller. It will be performing the majority of the algorithms and precision
functions. The MSP430F5132 was chosen because of its low power consumption
and wide application range. The device features a powerful 16-bit reduced
instruction set computing (RISC) CPU, 16-bit registers, and constant generators
that contribute to maximum code efficiency. The digitally controlled oscillator
(DCO) allows the devices to wake up from low-power modes to active mode in less
than 5 µs. The MSP430F5132 has two 16-bit high-resolution timers, two universal
serial communication interfaces, a 32-bit hardware multiplier, a high-performance
10-bit analog-to-digital converter (ADC) and an on-chip comparator. The MPPT
algorithm was programmed using code composer studio (CCS) and a MSP430
launch pad that is used to make a connection with the microcontroller. The
reference design provided a GUI interface that allows for easy application use and
to set certain parameters. Figure 58 shows the circuit schematic for the controller
and bias supply stage. The main block on this portion of the schematic comprises
the logic portion of the device. The lower half is part of the bias supply stage.

91
Figure 58 Solar Charge Controller Schematic: Controller and Bias Supply
3.3.2.1 MSP430F5132 Microcontroller The device that performs the majority of the algorithms and precision functions is
the microcontroller. From the TIDA-00120 design we used a MSP430F5132 from
TI. The Texas Instruments MSP430 family of ultra-low-power microcontrollers
consists of several devices featuring different sets of peripherals targeted for
various applications. The architecture, combined with five low-power modes, is
optimized to achieve extended battery life in portable measurement applications.
The device features a powerful 16-bit RISC CPU, 16-bit registers, and constant
generators that contribute to maximum code efficiency. The digitally controlled
oscillator (DCO) allows the devices to wake up from low-power modes to active
mode in less than 5 µs. The MSP430F5132 series is a microcontroller
configurations with two 16-bit high-resolution timers, two universal serial
communication interfaces (USCI_A0 and USCI_B0), a 32-bit hardware multiplier,
a high-performance 10-bit analog-to-digital converter (ADC), an on-chip
comparator, a three-channel DMA, 5-V tolerant I/Os, and up to 29 I/O pins. This
device helps the control strategy of the design.

92
3.3.3 Bias Supply Stage The next stage is the bias supply stage. This stage consists of a LM5019MR which
is a 100V, 100mA constant on-time synchronous buck regulator. It has integrated
high and low side MOSFETs and the constant on-time control scheme requires no
loop compensation. This regulator is great because it has a peak current limit
circuit which protects against overload conditions. This stage also has a
TLV70433DBV which is a 150mA, ultra-low IQ, high Vin low dropout regulator
(LDO). The last digital device in this stage is the INA271 which acts as a voltage
output, current-sense amplifier. This device is able to sense drops across shunt
resistors at common mode voltages. Combined in an output format, these three
devices provide the bias supply which can be connected to a load. These devices
and the respective circuitry can all be seen in Figure 61 and 62. INA271 is the
small block on the left in Figure 61, and the two blocks on the bottom are in Figure
62 are the LM5019 and TLV70433DBV.
3.3.3.1 LM5019MR Buck Regulator The LM5019MR is a 100V, 100mA synchronous step-down regulator with
integrated high side and low side MOSFETs. The constant-on-time (COT) control
scheme employed in the LM5019 requires no loop compensation, provides
excellent transient response, and enable very low step-down ratios. The on-time
varies inversely with the input voltage resulting in nearly constant frequency over
the input voltage range. A High voltage startup regulator provides bias power for
internal operation of the IC and for integrated gate drivers. A peak current limit
circuit protects against overload conditions. The under voltage lockout (UVLO)
circuit allows the input under voltage threshold and hysteresis to be independently
programmed. Other protection features include thermal shutdown and bias supply
under voltage lockout. Figure 59 shows the typical application of this particular
Buck regulator.
Figure 59 Typical Application of LM5019 Buck Regulator
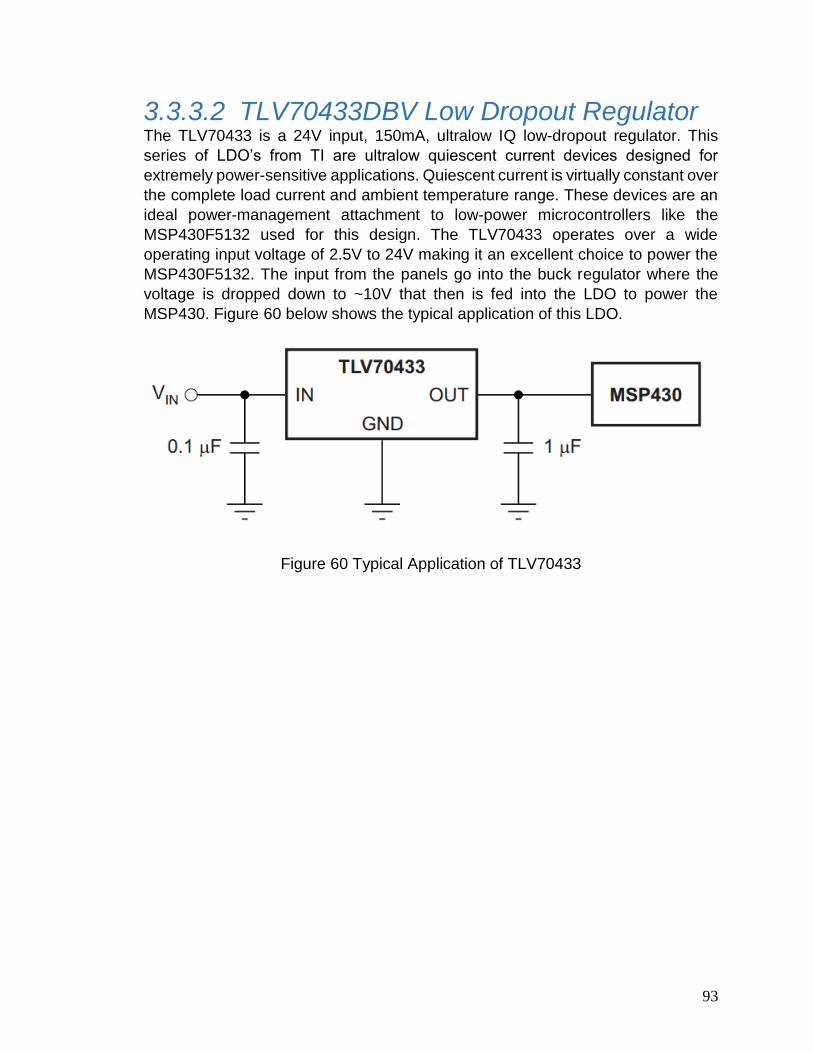
93
3.3.3.2 TLV70433DBV Low Dropout Regulator The TLV70433 is a 24V input, 150mA, ultralow IQ low-dropout regulator. This
series of LDO’s from TI are ultralow quiescent current devices designed for
extremely power-sensitive applications. Quiescent current is virtually constant over
the complete load current and ambient temperature range. These devices are an
ideal power-management attachment to low-power microcontrollers like the
MSP430F5132 used for this design. The TLV70433 operates over a wide
operating input voltage of 2.5V to 24V making it an excellent choice to power the
MSP430F5132. The input from the panels go into the buck regulator where the
voltage is dropped down to ~10V that then is fed into the LDO to power the
MSP430. Figure 60 below shows the typical application of this LDO.
Figure 60 Typical Application of TLV70433
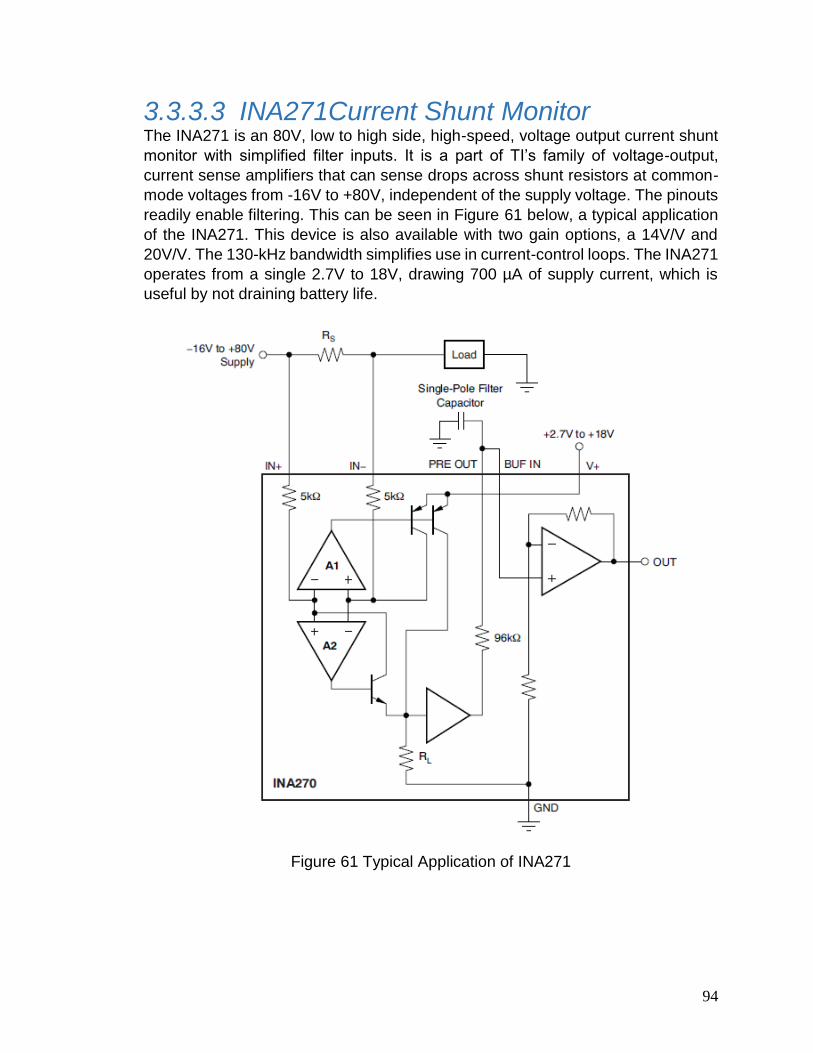
94
3.3.3.3 INA271Current Shunt Monitor The INA271 is an 80V, low to high side, high-speed, voltage output current shunt
monitor with simplified filter inputs. It is a part of TI’s family of voltage-output,
current sense amplifiers that can sense drops across shunt resistors at common-
mode voltages from -16V to +80V, independent of the supply voltage. The pinouts
readily enable filtering. This can be seen in Figure 61 below, a typical application
of the INA271. This device is also available with two gain options, a 14V/V and
20V/V. The 130-kHz bandwidth simplifies use in current-control loops. The INA271
operates from a single 2.7V to 18V, drawing 700 µA of supply current, which is
useful by not draining battery life.
Figure 61 Typical Application of INA271
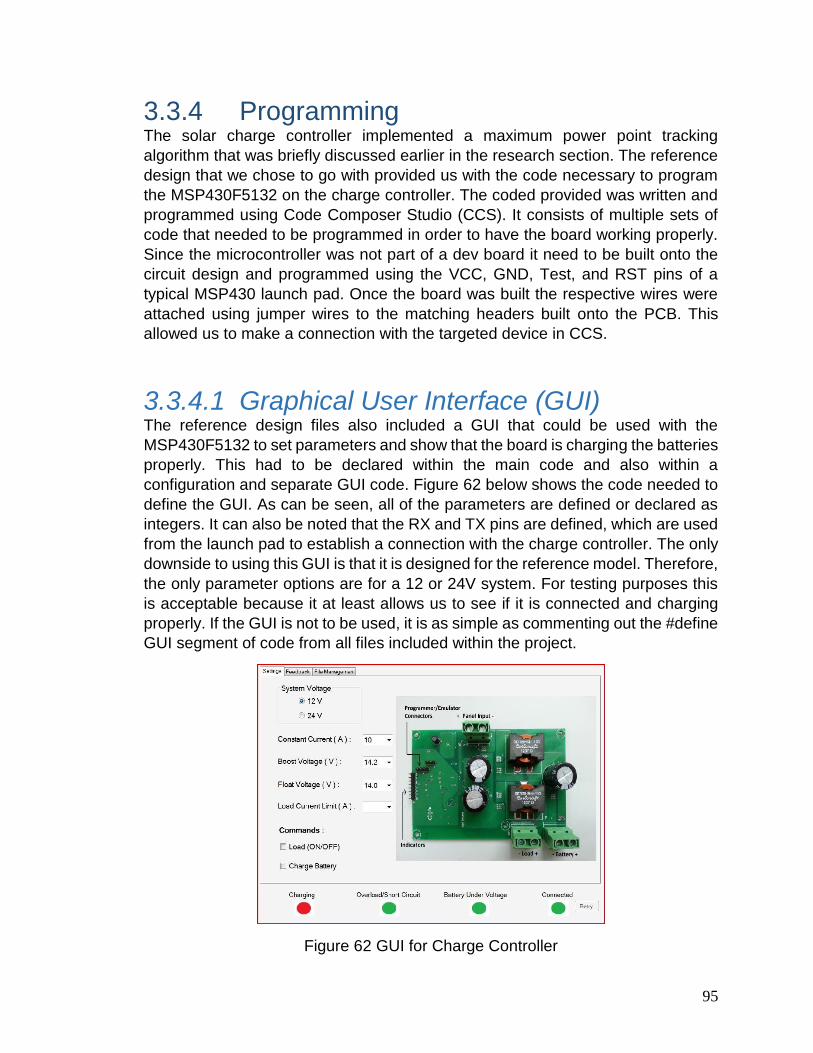
95
3.3.4 Programming The solar charge controller implemented a maximum power point tracking
algorithm that was briefly discussed earlier in the research section. The reference
design that we chose to go with provided us with the code necessary to program
the MSP430F5132 on the charge controller. The coded provided was written and
programmed using Code Composer Studio (CCS). It consists of multiple sets of
code that needed to be programmed in order to have the board working properly.
Since the microcontroller was not part of a dev board it need to be built onto the
circuit design and programmed using the VCC, GND, Test, and RST pins of a
typical MSP430 launch pad. Once the board was built the respective wires were
attached using jumper wires to the matching headers built onto the PCB. This
allowed us to make a connection with the targeted device in CCS.
3.3.4.1 Graphical User Interface (GUI) The reference design files also included a GUI that could be used with the
MSP430F5132 to set parameters and show that the board is charging the batteries
properly. This had to be declared within the main code and also within a
configuration and separate GUI code. Figure 62 below shows the code needed to
define the GUI. As can be seen, all of the parameters are defined or declared as
integers. It can also be noted that the RX and TX pins are defined, which are used
from the launch pad to establish a connection with the charge controller. The only
downside to using this GUI is that it is designed for the reference model. Therefore,
the only parameter options are for a 12 or 24V system. For testing purposes this
is acceptable because it at least allows us to see if it is connected and charging
properly. If the GUI is not to be used, it is as simple as commenting out the #define
GUI segment of code from all files included within the project.
Figure 62 GUI for Charge Controller
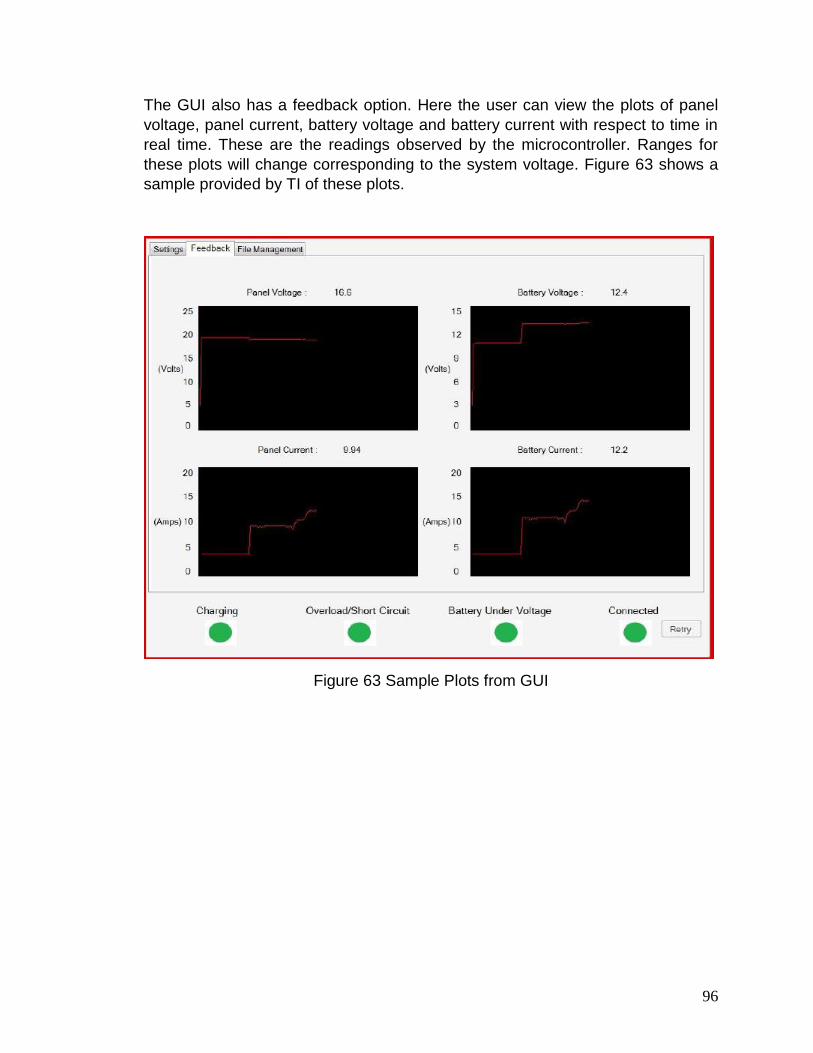
96
The GUI also has a feedback option. Here the user can view the plots of panel
voltage, panel current, battery voltage and battery current with respect to time in
real time. These are the readings observed by the microcontroller. Ranges for
these plots will change corresponding to the system voltage. Figure 63 shows a
sample provided by TI of these plots.
Figure 63 Sample Plots from GUI
97
3.3.4.2 MPPT code The main and most important portion of code is the maximum power point tracking
portion. This is what actually makes the charge controller capable of harnessing
the energy from the sun, maintaining a constant maximum power output, and
charge the batteries respectively. A typical Perturb and Observe (PO) method was
implemented for this function. The basic logic behind this code is that every time
the panel power is measured it is then compared with the previous value. This is
done every constantly while the controller is connected to the panels and batteries.
If there is in increase in panel power then the tracking is continued in this same
direction. If there is a decrease in panel power then the tracking direction is
reversed. At low panel current, the change in panel power is negligible and
therefore not changed. The battery current is monitored to determine the tracking
direction. The code also has a cutoff point. When it realizes that the batteries are
full it will stop feeding the batteries with power.
3.3.4.3 PCB The PCB for the solar charge controller was recreated with changes from a
rudimentary schematic provided by the TIDA 00120 reference design. It was
designed using Altium Desinger 14. Altium Designer was chosen due to personal
experience and familiarity with the software. Altium is a good PCB design
software because of the levels of precision and detail that can be used in design.
The charge controller circuit consists of 127 components. Altium’s design vault
contained almost all of the needed components and footprints. Those
components that were not provided were easily designed using the Altium
component wizard.
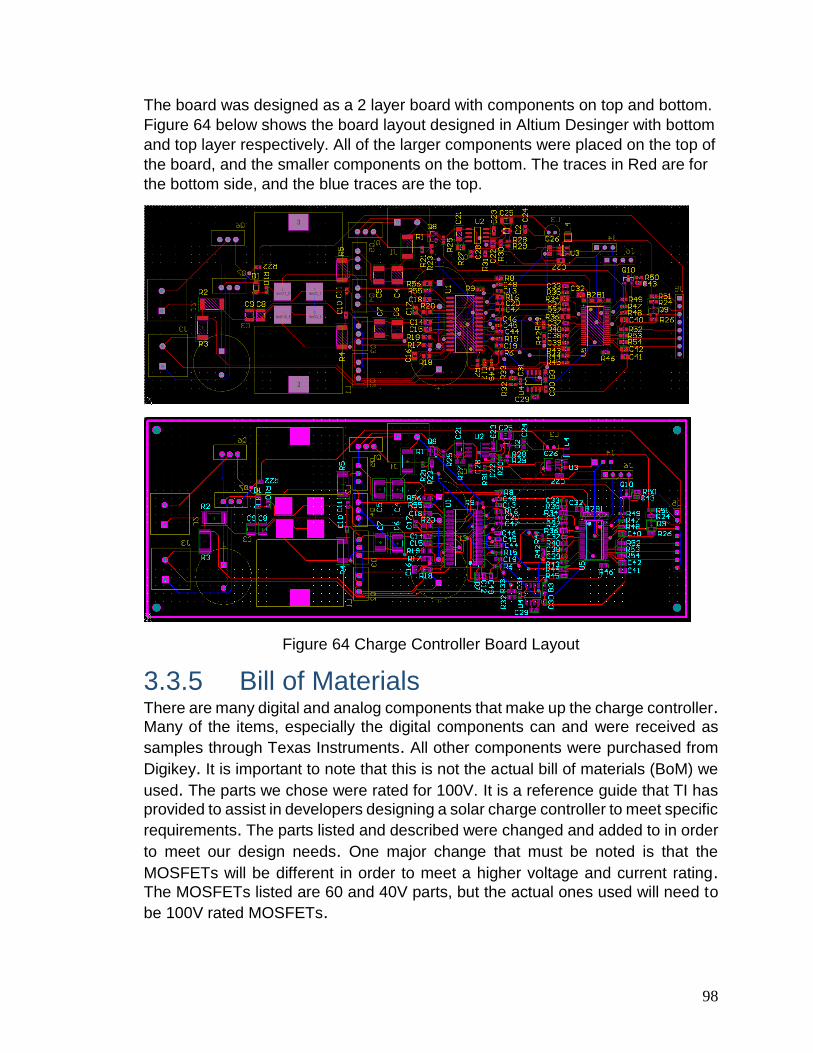
98
The board was designed as a 2 layer board with components on top and bottom.
Figure 64 below shows the board layout designed in Altium Desinger with bottom
and top layer respectively. All of the larger components were placed on the top of
the board, and the smaller components on the bottom. The traces in Red are for
the bottom side, and the blue traces are the top.
Figure 64 Charge Controller Board Layout
3.3.5 Bill of Materials There are many digital and analog components that make up the charge controller. Many of the items, especially the digital components can and were received as
samples through Texas Instruments. All other components were purchased from
Digikey. It is important to note that this is not the actual bill of materials (BoM) we
used. The parts we chose were rated for 100V. It is a reference guide that TI has
provided to assist in developers designing a solar charge controller to meet specific
requirements. The parts listed and described were changed and added to in order
to meet our design needs. One major change that must be noted is that the
MOSFETs will be different in order to meet a higher voltage and current rating. The MOSFETs listed are 60 and 40V parts, but the actual ones used will need to
be 100V rated MOSFETs.

99
3.3.6 Materials The final design will be implemented onto a PCB. As of now, it is undetermined
which PCB we will be using and whether or not it will be double sided or two PCB’s
stacked. There are many digital and analog components that make up the charge
controller. Many of the items, especially the digital components can and will be
purchased through Texas Instruments. All other components will be purchased
from another source, i.e. Digikey. It is important to note that this is not the actual
design or bill of materials (BoM) we will be using. It is a reference guide that TI has
provided to assist in developers designing a solar charge controller to meet specific
requirements. The parts listed and described may be changed and or added to in
order to meet our design needs. One major change that must be noted is that the
MOSFETs will be different in order to meet a higher voltage and current rating. The MOSFETs listed are 60 and 40V parts, but the actual ones used will need to
be 100V rated MOSFETs.
4 Prototype This section describes the phases of development for the hardware created in this project.
4.1 Touchscreen Display After the project’s Touchscreen Display design phase was completed the construction of the first prototype began and two more prototypes followed once
more parts had been ordered and integrated into the overall design. Every one of
the prototype iterations of the design prototype underwent thorough testing, with the early prototypes being tested on a few key features whereas the later prototypes were subjected to thorough testing and evaluation of all system
features.
4.1.1 First Prototype The first design prototype for the Touchscreen Display system was the Samsung
SCH-I545’s Android OS environment. This first prototype provided the Android OS
and additional functions that are necessary to execute the UCF EzNav Android
Application designed for this project. This prototype was able to provide the
required resources necessary to execute UCF EzNav Android Application, wirelessly connect to the internet, and gather GPS information all from the onboard
hardware and software components of the SCH-I545. The SCH-I545 prototype
environment was not able to connect to the Motor Controller interface in any way as a result of not having any GPIO pins included in its design; therefore the only working component of the UCF EzNav Android Application was the “Navigate”
screen and its accompanying functions. Figure 65 shows the SCH-I545 prototype’s
main menu with the UCF EzNav Android Application launch button.
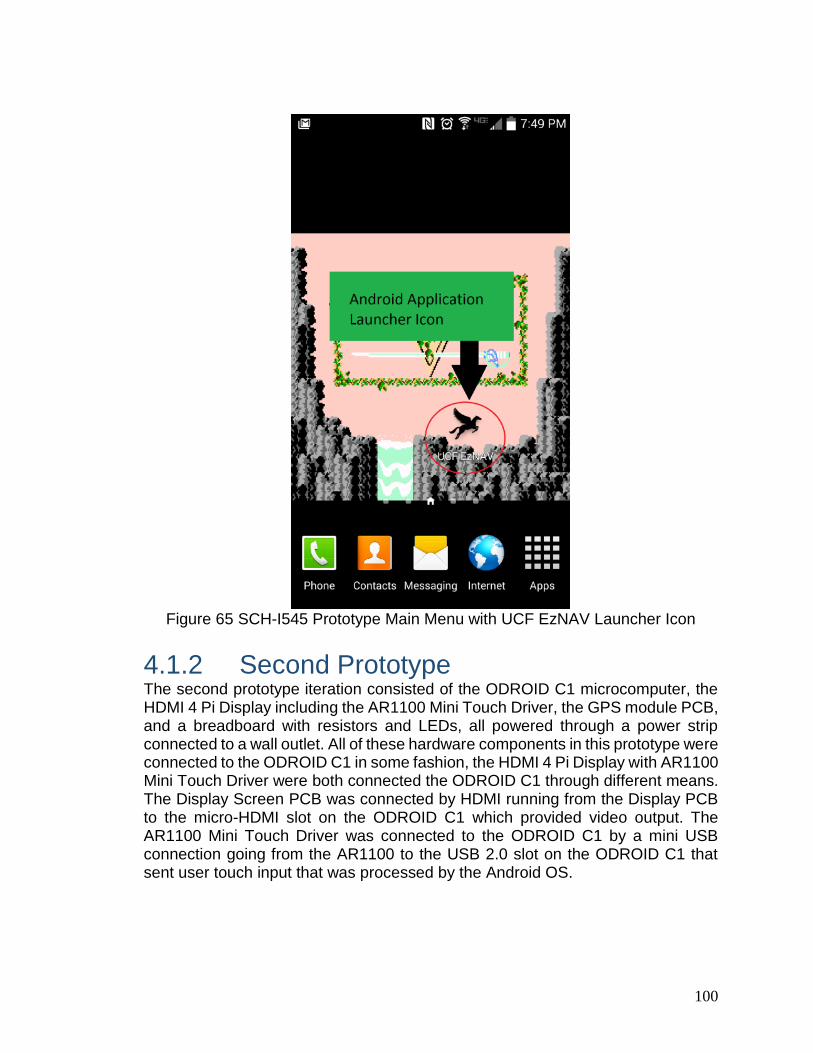
100
Figure 65 SCH-I545 Prototype Main Menu with UCF EzNAV Launcher Icon
4.1.2 Second Prototype The second prototype iteration consisted of the ODROID C1 microcomputer, the HDMI 4 Pi Display including the AR1100 Mini Touch Driver, the GPS module PCB, and a breadboard with resistors and LEDs, all powered through a power strip connected to a wall outlet. All of these hardware components in this prototype were connected to the ODROID C1 in some fashion, the HDMI 4 Pi Display with AR1100 Mini Touch Driver were both connected the ODROID C1 through different means. The Display Screen PCB was connected by HDMI running from the Display PCB to the micro-HDMI slot on the ODROID C1 which provided video output. The AR1100 Mini Touch Driver was connected to the ODROID C1 by a mini USB connection going from the AR1100 to the USB 2.0 slot on the ODROID C1 that sent user touch input that was processed by the Android OS.
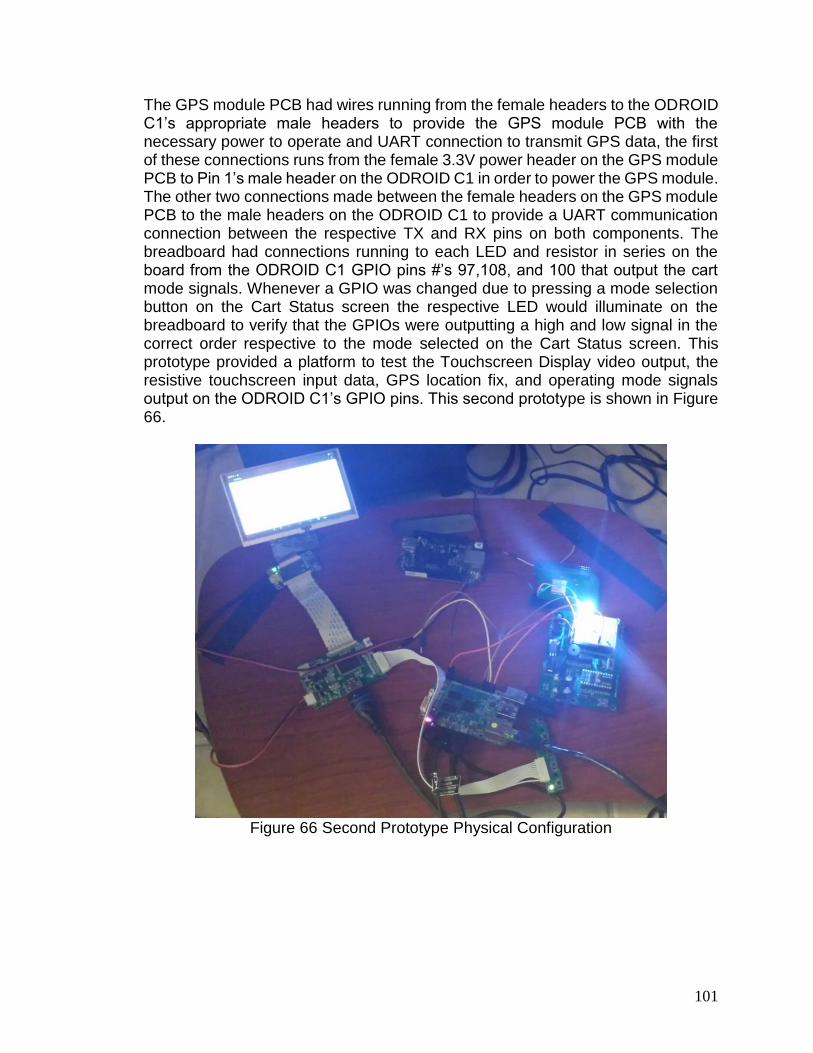
101
The GPS module PCB had wires running from the female headers to the ODROID C1’s appropriate male headers to provide the GPS module PCB with the necessary power to operate and UART connection to transmit GPS data, the first of these connections runs from the female 3.3V power header on the GPS module PCB to Pin 1’s male header on the ODROID C1 in order to power the GPS module. The other two connections made between the female headers on the GPS module PCB to the male headers on the ODROID C1 to provide a UART communication connection between the respective TX and RX pins on both components. The breadboard had connections running to each LED and resistor in series on the board from the ODROID C1 GPIO pins #’s 97,108, and 100 that output the cart mode signals. Whenever a GPIO was changed due to pressing a mode selection button on the Cart Status screen the respective LED would illuminate on the breadboard to verify that the GPIOs were outputting a high and low signal in the correct order respective to the mode selected on the Cart Status screen. This prototype provided a platform to test the Touchscreen Display video output, the resistive touchscreen input data, GPS location fix, and operating mode signals output on the ODROID C1’s GPIO pins. This second prototype is shown in Figure 66.
Figure 66 Second Prototype Physical Configuration
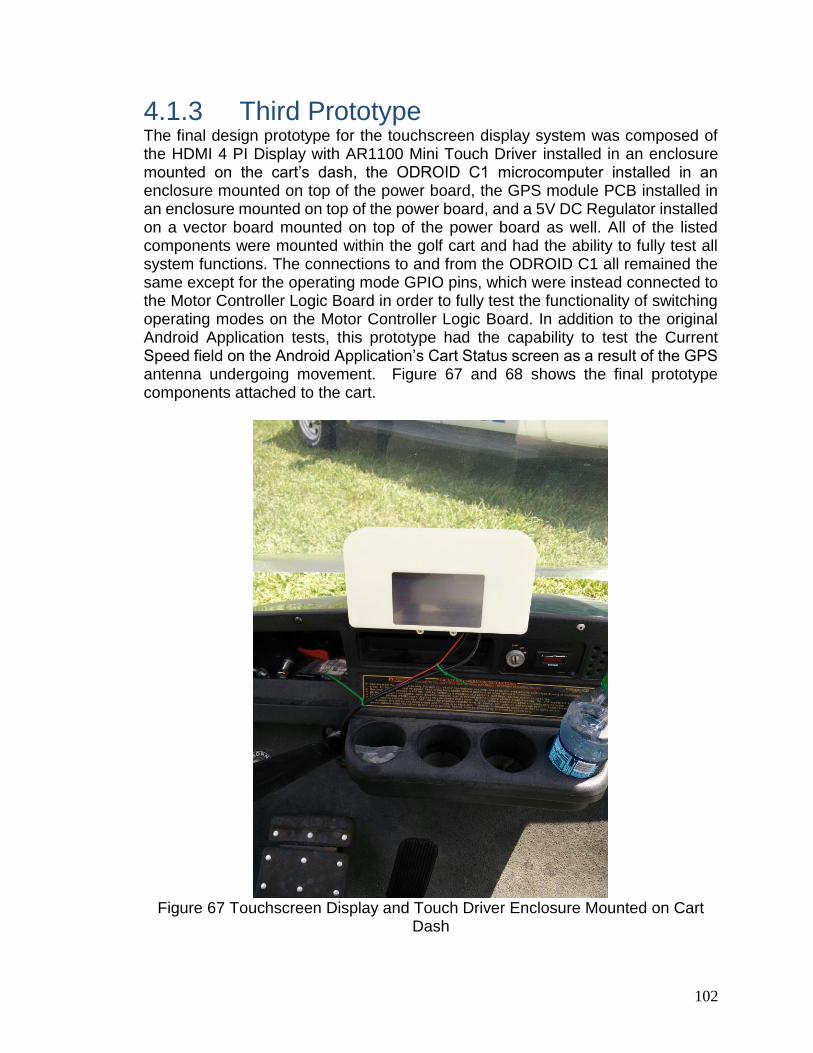
102
4.1.3 Third Prototype The final design prototype for the touchscreen display system was composed of the HDMI 4 PI Display with AR1100 Mini Touch Driver installed in an enclosure mounted on the cart’s dash, the ODROID C1 microcomputer installed in an enclosure mounted on top of the power board, the GPS module PCB installed in an enclosure mounted on top of the power board, and a 5V DC Regulator installed on a vector board mounted on top of the power board as well. All of the listed components were mounted within the golf cart and had the ability to fully test all system functions. The connections to and from the ODROID C1 all remained the same except for the operating mode GPIO pins, which were instead connected to the Motor Controller Logic Board in order to fully test the functionality of switching operating modes on the Motor Controller Logic Board. In addition to the original Android Application tests, this prototype had the capability to test the Current Speed field on the Android Application’s Cart Status screen as a result of the GPS antenna undergoing movement. Figure 67 and 68 shows the final prototype components attached to the cart.
Figure 67 Touchscreen Display and Touch Driver Enclosure Mounted on Cart
Dash

103
Figure 68 Mounted Electronics on Power Board
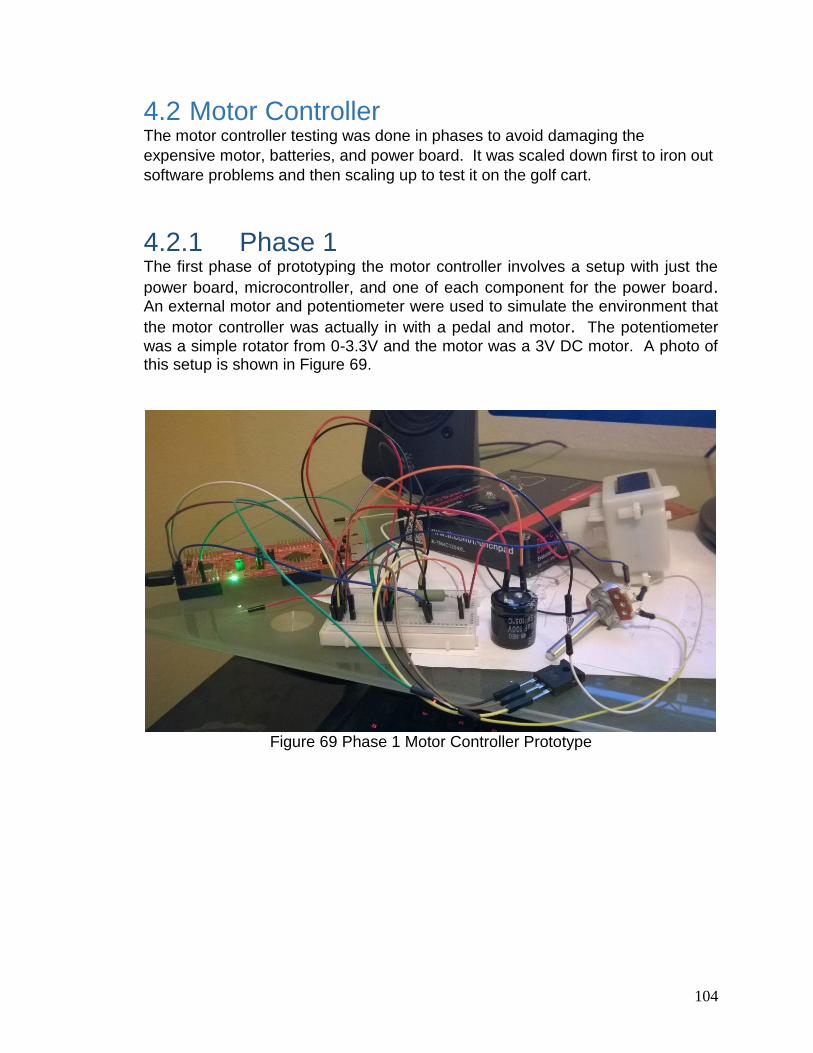
104
4.2 Motor Controller The motor controller testing was done in phases to avoid damaging the
expensive motor, batteries, and power board. It was scaled down first to iron out
software problems and then scaling up to test it on the golf cart.
4.2.1 Phase 1 The first phase of prototyping the motor controller involves a setup with just the
power board, microcontroller, and one of each component for the power board. An external motor and potentiometer were used to simulate the environment that
the motor controller was actually in with a pedal and motor. The potentiometer
was a simple rotator from 0-3.3V and the motor was a 3V DC motor. A photo of this setup is shown in Figure 69.
Figure 69 Phase 1 Motor Controller Prototype
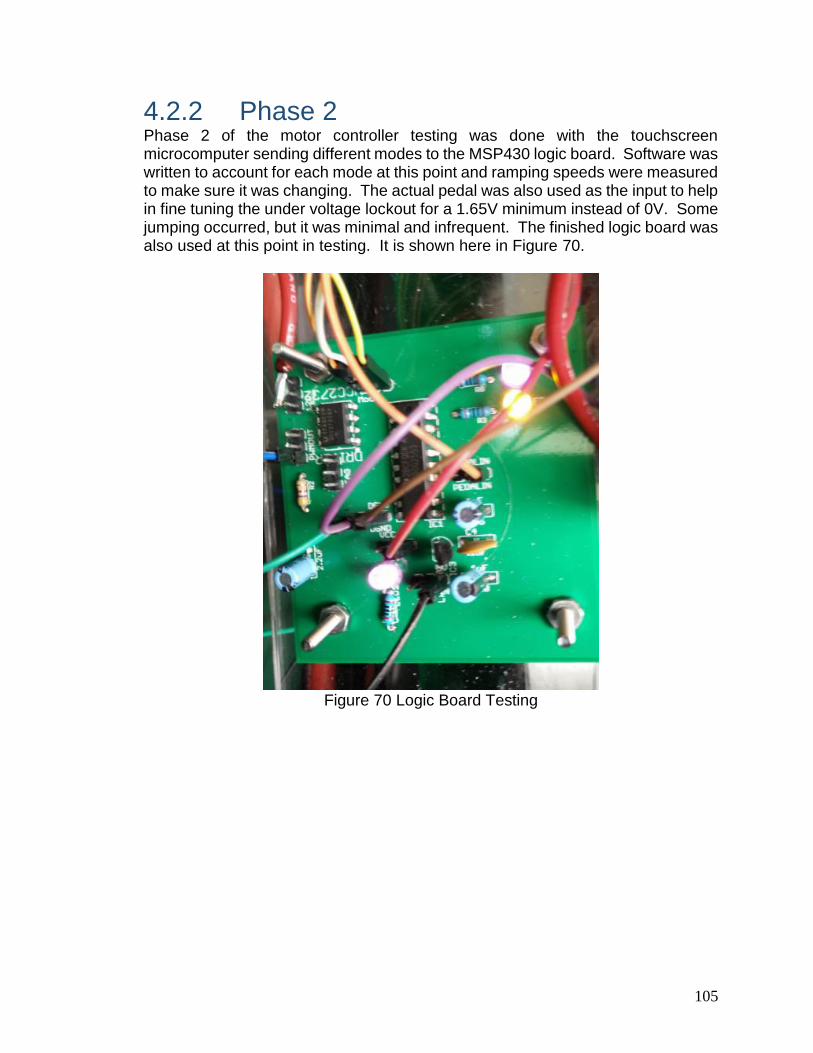
105
4.2.2 Phase 2 Phase 2 of the motor controller testing was done with the touchscreen microcomputer sending different modes to the MSP430 logic board. Software was written to account for each mode at this point and ramping speeds were measured to make sure it was changing. The actual pedal was also used as the input to help in fine tuning the under voltage lockout for a 1.65V minimum instead of 0V. Some jumping occurred, but it was minimal and infrequent. The finished logic board was also used at this point in testing. It is shown here in Figure 70.
Figure 70 Logic Board Testing
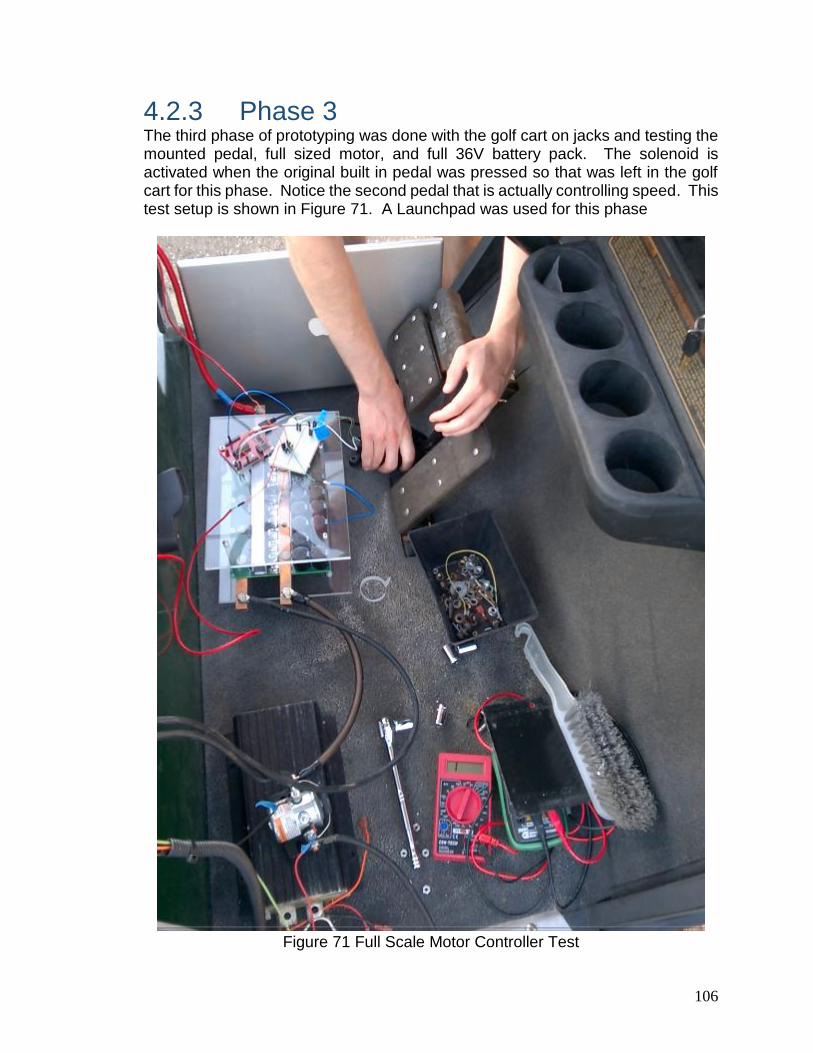
106
4.2.3 Phase 3 The third phase of prototyping was done with the golf cart on jacks and testing the mounted pedal, full sized motor, and full 36V battery pack. The solenoid is activated when the original built in pedal was pressed so that was left in the golf cart for this phase. Notice the second pedal that is actually controlling speed. This test setup is shown in Figure 71. A Launchpad was used for this phase
Figure 71 Full Scale Motor Controller Test
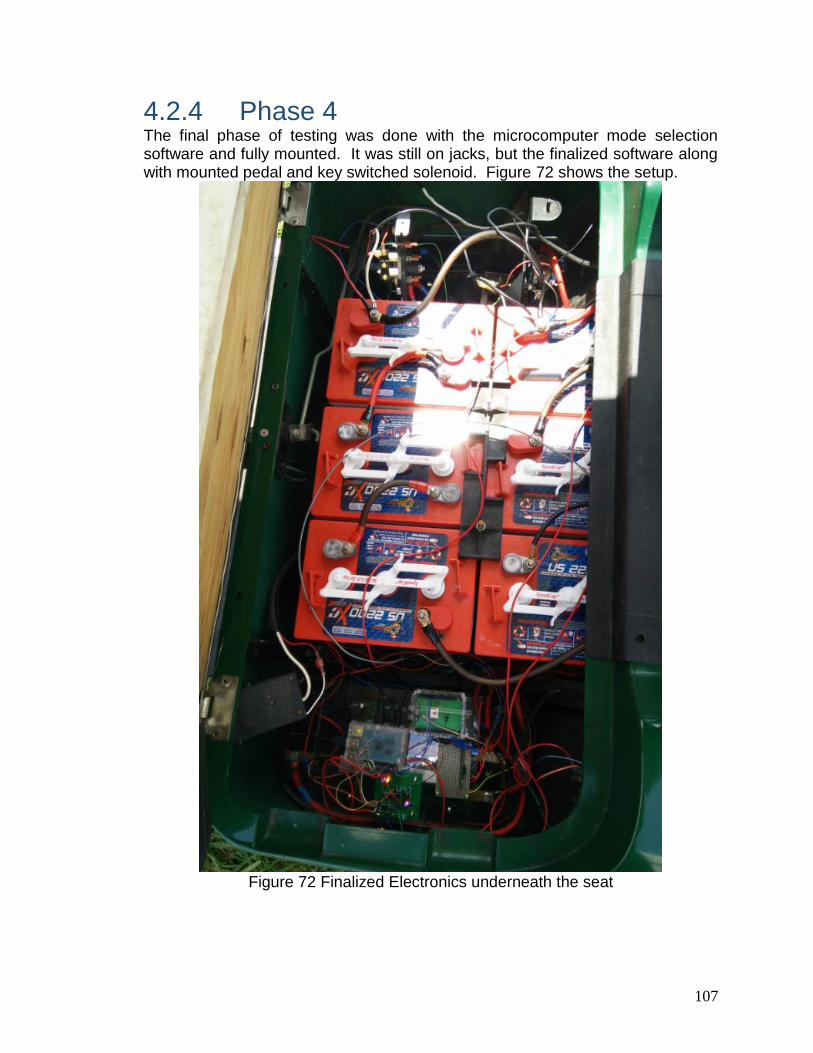
107
4.2.4 Phase 4 The final phase of testing was done with the microcomputer mode selection software and fully mounted. It was still on jacks, but the finalized software along with mounted pedal and key switched solenoid. Figure 72 shows the setup.
Figure 72 Finalized Electronics underneath the seat
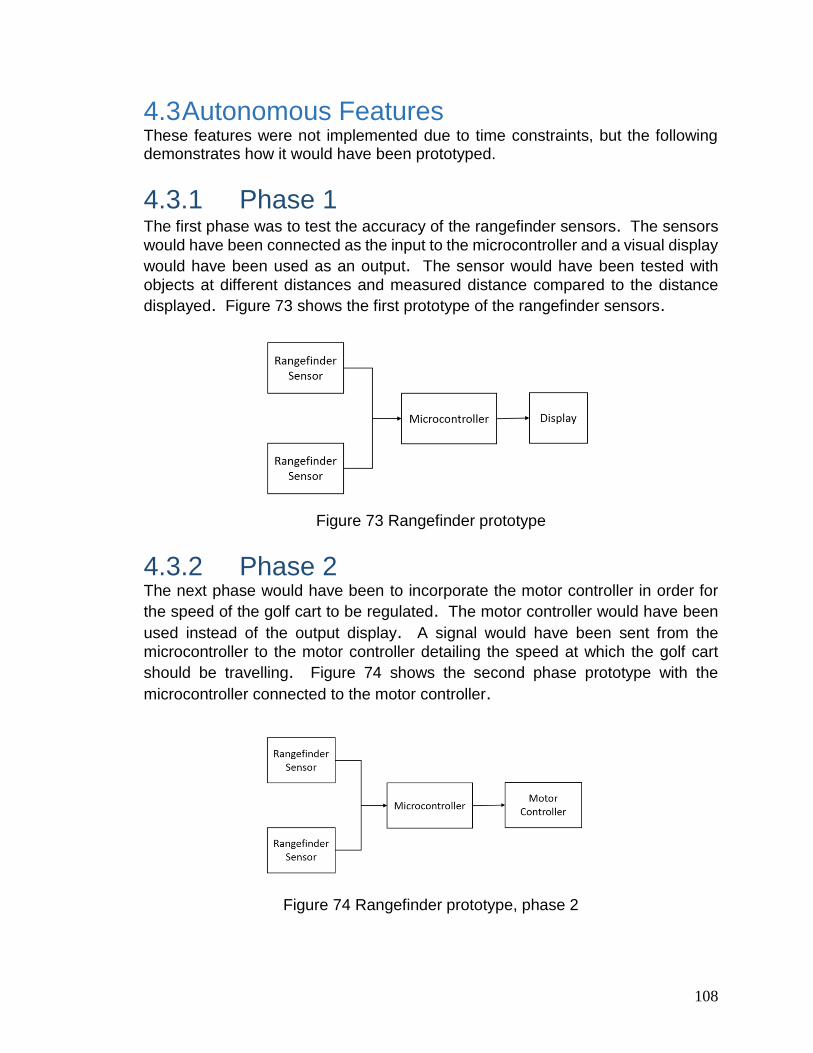
108
4.3 Autonomous Features These features were not implemented due to time constraints, but the following demonstrates how it would have been prototyped.
4.3.1 Phase 1 The first phase was to test the accuracy of the rangefinder sensors. The sensors
would have been connected as the input to the microcontroller and a visual display
would have been used as an output. The sensor would have been tested with
objects at different distances and measured distance compared to the distance
displayed. Figure 73 shows the first prototype of the rangefinder sensors.
Figure 73 Rangefinder prototype
4.3.2 Phase 2 The next phase would have been to incorporate the motor controller in order for
the speed of the golf cart to be regulated. The motor controller would have been
used instead of the output display. A signal would have been sent from the
microcontroller to the motor controller detailing the speed at which the golf cart
should be travelling. Figure 74 shows the second phase prototype with the
microcontroller connected to the motor controller.
Figure 74 Rangefinder prototype, phase 2
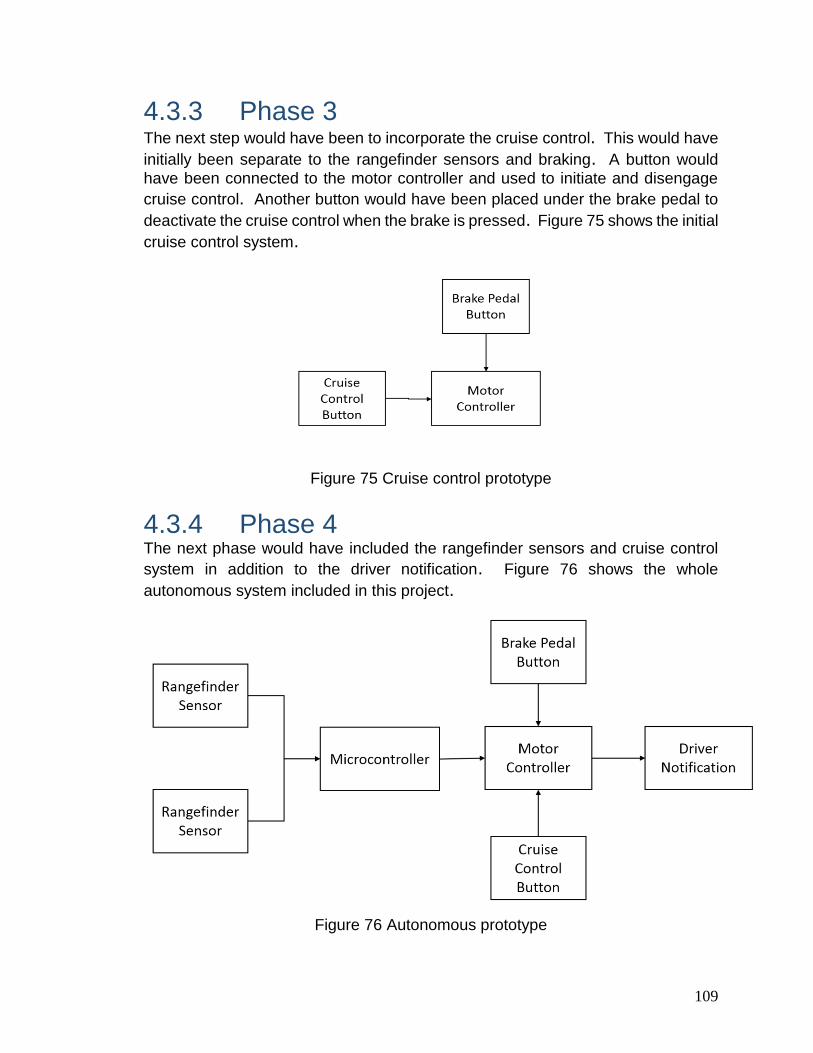
109
4.3.3 Phase 3 The next step would have been to incorporate the cruise control. This would have
initially been separate to the rangefinder sensors and braking. A button would
have been connected to the motor controller and used to initiate and disengage
cruise control. Another button would have been placed under the brake pedal to
deactivate the cruise control when the brake is pressed. Figure 75 shows the initial
cruise control system.
Figure 75 Cruise control prototype
4.3.4 Phase 4 The next phase would have included the rangefinder sensors and cruise control
system in addition to the driver notification. Figure 76 shows the whole
autonomous system included in this project.
Figure 76 Autonomous prototype
110
4.4 Charge Controller This section details the phases of prototyping for the charge controller.
4.4.1 Phase 1 The charge controller had to go through a prototyping phase once it has been
designed. This would be, but may not be limited to certain tests or criteria the
initial design had to undergo in order to determine if it is functioning properly. The
first initial phase the design went through is a computer simulation to make that
the circuit is at least wired and grounded properly. If it isn’t we run into the risk of
permanently damaging some of the components. Once it has received a thumbs
up on the design it needed to be simulated using some sort of circuit analysis
and design software. This was done in Multisim. Multisim provides us an easy to
use software to simulate different aspects of the circuit.
4.4.2 Phase 2 The next phase of prototyping came after all simulations and once the prototype
PCB controller is built. This allowed us to physically take the board into a lab and
test it using an oscilloscope and other devices. From these tests we were able to
determine whether or not we needed to adjust anything on the board or correct
anything before moving onto the next phase. Again, it is important to note that
the board used in this phase may not be the actual PCB being used. It could in
reality be a handmade circuit built in the lab on a bread board.
4.4.3 Phase 3 The final phase of prototyping for the charge controller requires the final design. This was not determined until after the second phase is complete and any
changes or corrections have been made. This involved the charge controller
being connected to the solar panels and the battery bank and tested for
efficiency and completeness. If the charge controller is able to properly and
effectively harness the energy from the solar panels and convert it to a steady
charge we knew it was on the right track.
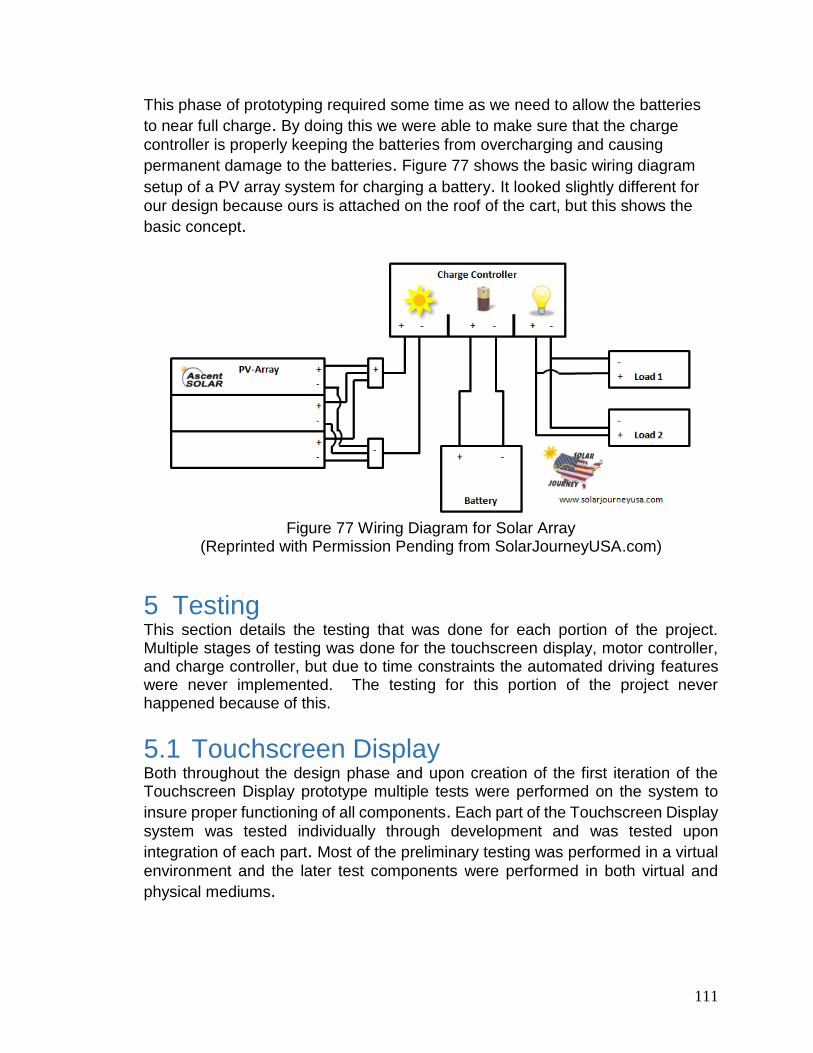
111
This phase of prototyping required some time as we need to allow the batteries
to near full charge. By doing this we were able to make sure that the charge
controller is properly keeping the batteries from overcharging and causing
permanent damage to the batteries. Figure 77 shows the basic wiring diagram
setup of a PV array system for charging a battery. It looked slightly different for
our design because ours is attached on the roof of the cart, but this shows the
basic concept.
Figure 77 Wiring Diagram for Solar Array
(Reprinted with Permission Pending from SolarJourneyUSA.com)
5 Testing This section details the testing that was done for each portion of the project. Multiple stages of testing was done for the touchscreen display, motor controller, and charge controller, but due to time constraints the automated driving features were never implemented. The testing for this portion of the project never happened because of this.
5.1 Touchscreen Display Both throughout the design phase and upon creation of the first iteration of the Touchscreen Display prototype multiple tests were performed on the system to
insure proper functioning of all components. Each part of the Touchscreen Display
system was tested individually through development and was tested upon
integration of each part. Most of the preliminary testing was performed in a virtual
environment and the later test components were performed in both virtual and
physical mediums.
112
5.1.1 Android Application Testing The Android Application testing was split into three different components which
was be tested throughout the various stages of design integration. The different
testing components were always be tested within the Android OS environment
regardless of the current stage of design integration. The three individual
components encompass the following subjects: Navigational Testing, Cart Status
Report Testing, and Settings Modification Testing.
5.1.1.1 Navigational Testing The Navigational Testing portion of the Android Application Testing procedures was run within the Android Application developed for the Touchscreen Display
system. The first Android platform that the Navigational Testing takes place on is
the Samsung SCH-I545 running Android version 4.4.2 KitKat. The Android
Application is sent to this device through the Eclipse IDE and is automatically
installed and ready to execute. The SCH-I545’s Android OS has full access to Fine
and Coarse GPS Coordinate information as well as full internet access. The
second Android platform that performed the Navigational Testing is the BeagleBone Black board with adjoining MTK MT3339 GPS module which was
running Android version 4.4.2 KitKat. The Android Application is installed on this
environment via the Android OS image on the microSD memory card inserted in
the BeagleBone Black microcomputer. While the BeagleBone Black’s Android OS
does not have access to the internet it was receiving Fine and Coarse GPS location data from the MTK MT3339 GPS module in order to appropriately identify the
user’s current position. The actual test portion of the Navigational Testing consisted of three tasks to
complete on the “Navigate” application page. The first task performed on the
“Navigate” page was a visual check that the Google Map Support Fragment correctly loads to the UCF GPS coordinates, evaluating this task ensured that the
map displays the UCF campus to the user upon starting navigational tasks. The
second testing task involves clicking on the “My Location” button within the map interface and ensuring that it correctly approximates the user’s current GPS position, by testing this functionality it was guaranteed that the map interface is
correctly processing the received GPS coordinates. For a more detailed, visual
explanation of this task please refer to Figure 78. The final task of the Navigational
Testing is to click on the generated waypoints on the map interface to certify that
they are in the correct positions and display the correct respective information. This final task is a crucial passing point since it was a main component of providing
any user’s accurate navigation around the UCF campus.

113
Figure 78 Testing Elements for Second Task of Navigational Testing
114
5.1.1.2 Cart Status Report Testing The Cart Status Report Testing component of the Android Application Testing procedures was also run within the Android Application developed for the
Touchscreen Display system. Instead of running on only two testing platforms, the
Cart Status Report Testing required three testing platforms in order to properly
gauge the effectiveness of the “Cart Status” screen through testing. The first
Android testing platform is again the Samsung SCH-I545 running Android version
4.4.2 KitKat with all the previous data access permissions but this platform was
not able to provide the signals needed to gather the necessary cart status
information for testing. The second Android platform for testing is once more the BeagleBone Black board
with the MTK MT3339 GPS module running Android version 4.4.2 KitKat. This
Android platform was able to supply some of the actual signals for the value fields of current speed and Mode of Operation but was unable to supply the necessary
data for the values of battery percent and range left for the purpose of testing. The
last testing platform for this series of tests was the BeagleBone Black and MTK
MT3339 modules with the proper connections to the motor controller system. With
these connections in place within the test environment all the data values on the “Cart Status” screen was available to be tested since the Android Application was
receiving and transmitting all required signals to generate and test the value fields. The interactive testing portion of the Cart Status Report Testing was comprised of
four tasks, some of which can only be completed on the later testing platforms. The first evaluation task is to be completed on all testing platforms, it entails checking that the “Cart Status” screen generated correctly and that users can
easily navigate back to previous menus. The next evaluation task for the Cart
Status Report Testing can only be done on the second and third test platforms, in this task the evaluator checks the values of the data in the “Speed” and “Current
Mode” fields and ensures that they accurately match observed values. This test
confirmed that the Android Application is correctly receiving data from the GPS module and generating the values correctly within the Android Application methods
for accurate display to the users. The third task can also be completed on both the
second and third test platforms, this task involves the evaluator clicking on one of
the interface buttons and then checking the “Current Mode” field. This test
procedure denotes that the Android Application is correctly setting the Mode of
Operation variable. For a more visually detailed representation of this task please
refer to Figure 79. The last task for this series of test instructions can only be
completed on the final testing platform when the BeagleBone Black has been fully
connected to the Motor Controller.
115
Figure 79 Testing Elements of Second Cart Status Report Test
116
5.1.1.3 Settings Modification Testing The Settings Modification Testing section of the Android Application Testing was
run using the designed Android Application on the Touchscreen Display system. This group of tests was administered on all the Android Application testing
environments much like the first grouping of Navigational Testing. With the first
test platform being the Samsung SCH-I545 and the last two platforms being the BeagleBone Black with the MTK MT3339 GPS module and the BeagleBone
Black/GPS PCB connected to the Motor Controller via wire wrap. Among all the
platforms, the tasks completed were entirely from the “Settings” screen. The hands-on evaluation of the “Settings” screen had three tasks to assess the
overall functionality of the “Settings” screen’s elements. The first task that the
evaluator completed on the “Settings” screen is to touch and drag the selection bar
next to “Brightness” to differing degrees of display brightness. This test examined
the “Brightness” selection bar’s functionality and determined if the Android
Application is adjusting the screen’s brightness factor respectively. The second of
the three evaluation tasks had the evaluator adjust the “Contrast” selection bar
slider to different positions on the bar area. By performing this task the evaluator
can ascertain the functionality of the “Contrast” selection bar and if the Android
Application is adjusting the screen’s contrast correctly to valid input. The last task
with the Settings Modification Testing component has the tester drag the “Color” selection bar to various points on the bar’s area to generate the different values of
displayed color on the monitor. This task’s purpose is to check the “Color” selection
bar’s functionality along with verifying that the Android Application is processing the change in the display’s color values correctly with respect to the user’s
changes.
5.1.2 BeagleBone Black and MTK MT3339 GPS Module PCB Testing
The BeagleBone Black and MTK MT3339 GPS Module chipset provides the Touchscreen Display system with the necessary computing power, Android OS environment, user interface, and video output to generate the entirety of the
Touchscreen Display system. Therefore it’s only natural that this PCB chipset be
thoroughly tested for quality assurance and information accuracy. The testing
modules consisted of both software testing and electric signal measurements to
guarantee that all features of the PCB chipset are working as intended.

117
5.1.2.1 Android OS Environment Testing The testing on the Android OS Environment took place in two of the designed Touchscreen Display prototypes using the HDMI 4 PI: 5” display to perform visual
accuracy checks. The first platform that was used for the Android OS Environment
Testing is the BeagleBone Black and MTK MT3339 GPS PCB, which was able to
perform most testing procedures listed in this section. The other platform that was
used in later function testing is the BeagleBone Black and MTK MT3339 GPS PCB
with Motor Controller connections. The first Android OS Environment Testing item had the test analyst power on the current prototype being tested and observe if the system boots into the Android
OS without any errors. This test is appraising the prototype environment’s ability
to house a stable Android OS for the navigation and cart status software to run
properly. The next task on the Android OS Environment Testing list required the
test arbiter to navigate to the UCF EzNav Android Application using the
BeagleBone Black’s output display and then execute it. From within the application
the tester clicked on the “Navigate” button on the main menu and then interact with the navigational map interface to examine whether it correctly tracks the
prototype’s current position. This test ensured that the Android environment’s UCF
EzNav Android Application is able to receive GPS data through the BeagleBone
Black from the MTK MT3339 GPS chipset on the PCB. The last test in the Android
OS Environment Testing section can only be performed on the last prototype when the BeagleBone Black is able to send and receive information to and from the
Motor Controller chipset. This test again directs the user to the UCF EzNav Android
Application loaded on the Android OS environment just like in the previous test procedure except this time the user clicked on the “Cart Status” button at the
application’s main menu. At the “Cart Status” screen the evaluator observed that
all data values are being displayed and are within a specified accuracy. This test’s
results confirmed whether or not the Android OS is correctly receiving operating values from the Motor Controller as well as providing error-free hand-off of
received data values to the UCF EzNav Android Application.
5.1.2.2 PCB Electrical Connection Testing The PCB Electrical Connection Testing operations was performed on two of the Touchscreen Display design prototypes using a voltage measurement instrument
to perform voltage checks on system’s electrical connections. The first test
platform to be used in the PCB Electrical Connection Testing is the BeagleBone Black and MTK MT3339 GPS PCB, the other being the BeagleBone Black and
MTK MT3339 GPS PCB with Motor Controller connections.
118
The first evaluative task for the PCB Electrical Connection Testing can be performed on either prototype platform and had the test operations inspector place the voltage measurement instrument individually on the two VDD_5V electrical connections on the BeagleBone Black as well as on the VCC connection on the
MTK MT3339 GPS module. Once in place the examiner recorded the received
voltage on each connection when the PCB elements are receiving power from a
power source. These recorded results from the test provide the data necessary to
determine if the BeagleBone Black and the MTK MT3339 GPS chipsets are
receiving the required operational power on the PCB. The next task in the PCB
Electrical Connection Testing series can also be completed on either prototype platform and again requires the test operations inspector to use a voltage
measurement instrument. This time the test had the inspector individually measure
the voltage across the TX connection as well as the RX connection from the MTK
MT3339 GPS chipset and then record the values for each connection. The results
of this test procedure verified that the MTK MT3339 GPS chipset is transmitting
GPS data signals to the BeagleBone Black module. The final PCB Electrical
Connection Testing component is to be performed only on the BeagleBone Black and MTK MT3339 GPS PCB with Motor Controller prototype and once more
involves using a voltage measurement instrument. In this task the test’s analyst
measured the voltage across the individual wire wrap connections between the BeagleBone Black module and the Motor Controller chipset, and then record each
result for reporting purposes. These results concluded whether or not the
BeagleBone Black and Motor Controller modules are correctly sending electrical
signals both to and from each other through the wired connections.
5.1.2.3 Output Display Testing The Output Display Testing was completed using two of the Touchscreen Display
prototype designs with the addition of the HDMI 4 PI: 5” output display. The first
test prototype platform to be used in the Output Display Testing was the BeagleBone Black and MTK MT3339 GPS PCB connected to the HDMI 4 PI: 5”
display. The second prototype platform to be used was the BeagleBone Black and
MTK MT3339 GPS PCB with Motor Controller connections outputting video data
to the HDMI 4 PI: 5” display.
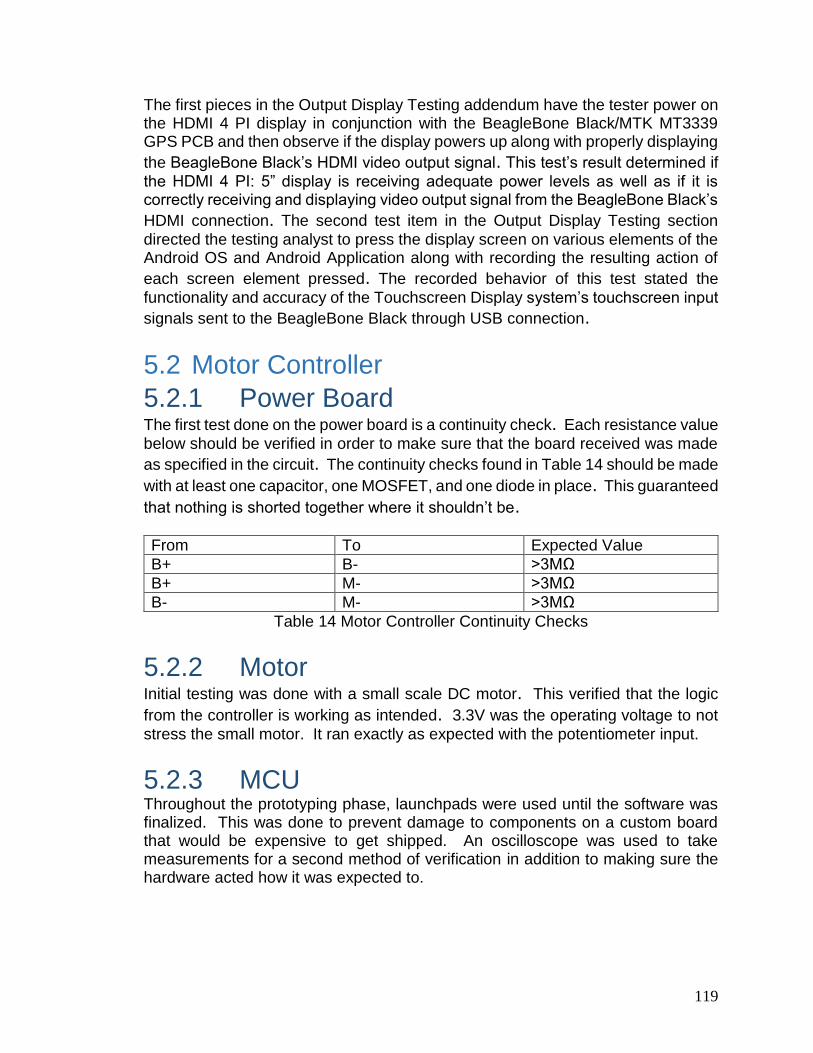
119
The first pieces in the Output Display Testing addendum have the tester power on the HDMI 4 PI display in conjunction with the BeagleBone Black/MTK MT3339 GPS PCB and then observe if the display powers up along with properly displaying
the BeagleBone Black’s HDMI video output signal. This test’s result determined if
the HDMI 4 PI: 5” display is receiving adequate power levels as well as if it is correctly receiving and displaying video output signal from the BeagleBone Black’s
HDMI connection. The second test item in the Output Display Testing section
directed the testing analyst to press the display screen on various elements of the Android OS and Android Application along with recording the resulting action of
each screen element pressed. The recorded behavior of this test stated the
functionality and accuracy of the Touchscreen Display system’s touchscreen input
signals sent to the BeagleBone Black through USB connection.
5.2 Motor Controller
5.2.1 Power Board The first test done on the power board is a continuity check. Each resistance value
below should be verified in order to make sure that the board received was made
as specified in the circuit. The continuity checks found in Table 14 should be made
with at least one capacitor, one MOSFET, and one diode in place. This guaranteed
that nothing is shorted together where it shouldn’t be.
From To Expected Value
B+ B- >3MΩ
B+ M- >3MΩ
B- M- >3MΩ
Table 14 Motor Controller Continuity Checks
5.2.2 Motor Initial testing was done with a small scale DC motor. This verified that the logic
from the controller is working as intended. 3.3V was the operating voltage to not
stress the small motor. It ran exactly as expected with the potentiometer input.
5.2.3 MCU Throughout the prototyping phase, launchpads were used until the software was finalized. This was done to prevent damage to components on a custom board that would be expensive to get shipped. An oscilloscope was used to take measurements for a second method of verification in addition to making sure the hardware acted how it was expected to.
120
5.2.3.1 ADC Serial communications were used to test the ADC values read in from the
potentiometer. Energia supports built in UART communications within the
environment that can be used to read in values output through the USB debug
UART. As the voltage coming from the potentiometer varies from 0-3.3V the
values output to the UART varied from 0-1024. A Digital Multimeter (DMM) was
used to measure the output from the potentiometer to make sure that the serial
values output correspond accurately to the physical analog value.
5.2.3.2 PWM PWM output from pin 14 of the MSP430 was checked with an oscilloscope to make sure that the output ramped up at the correct speed for each software setting. It was measured again once the pedal came in to make sure the ADC ranges did not negatively impact the output.
5.2.3.3 Hibernation Testing the hibernation required an external power supply and a method to control
the hibernation state through the UART. The power was measured before and
after being put into hibernate mode: It dropped in power consumption by an order of 1000.
5.2.3.4 Potentiometer The potentiometer was turned by hand and had external prongs that make it easy to read with an oscilloscope so that the output from the potentiometer can easily
be compared to the PWM output from the microcontroller.
5.2.3.5 Scope A Tektronix DPO4034B was used in order to read the outputs from both the
potentiometer and the microcontroller. It has four channels which is two more than
necessary and a 350MHz bandwidth. A maximum frequency of 16MHz would
need to be measured so this is fine. This is the oscilloscope that is available in
the senior design lab and other electrical engineering labs on campus. It has
proven to be very reliable and can be trusted that the output shown on this scope
matches the physical output from the hardware.
121
5.2.4 Test Procedure The following list of instructions describes in detail how to test the motor controller
without actually connecting it to the golf cart motor.
1. Connect one MOSFET, one capacitor, and one diode to the power board PCB. 2. Connect one power terminal of the potentiometer to a 3.3V power supply and
the other to ground. 3. Connect the signal pin to the ADC channel being used on the logic board. 4. Connect the PWM pin of the logic board to the gate of the MOSFET. 5. Connect one channel of the scope to read the output of the potentiometer and
another to read the PWM signal. 6. Vary the potentiometer from 0 to 3.3V and check the output of the PWM signal
on the scope. 7. Verify that as the voltage increases the PWM signal increases as well, but not
instantly. The increase in PWM should be gradual not instant. 8. Verify that the motor’s speed varies corresponding to the PWM signal.
This test is a combination of verification of the hardware and software. When the
motor’s speed gradually changes with the PWM output, this verifies that the
hardware is working and nothing is shorted where it shouldn’t be. The oscilloscope
verification of the PWM vs. the voltage verifies that the software in the logic board
is working.
5.3 Autonomous Features Autonomous driving features were not implemented in the final product, but the test procedure is left here in case it is implemented in the future.
5.3.1 Golf Cart Speed and Braking First, in order to determine the correct rangefinder sensors to use for this project,
the golf cart’s maximum speed and braking distance must be determined. By using
a speed sensor, we can determine the maximum speed of the golf cart. Implementing a geartooth RPM sensor on the axel measured the RPM and from
there, the velocity can be determined. Next, the braking distance would have been needed in order to determine
threshold distances and velocities. From top speed, the golf cart’s brakes were
applied to bring it to a rest. Using the geartooth RPM sensor, the time from full
speed to zero velocity can be recorded. With this value and the axle revolutions,
the stopping distance can be recorded.
122
5.3.2 Rangefinder Sensors The rangefinder distance sensors used were first tested to make sure the accuracy
of the output. Connecting a simple display to the microcontroller as an output
allowed for the distances to be displayed. By configuring the correct formula to
convert the signal to a measureable distance, the most accurate configuration can
be set.
Next, the sensors can be mounted on the vehicle. Tests can be run with the
vehicle stationary to ensure the sensors are correctly detecting objects. The next
step would be to repeat this step with the vehicle in motion. By varying speeds,
the sensors can be tested in multiple conditions. Once this is fine-tuned, the
microcontroller can be connected to the motor controller to send signals to control
the speed of the golf cart. This can then be tested with a simple code that slows
the golf cart when there is an object within an arbitrary distance. The golf cart
should reduce speed when an object is within the given distance. Next the
threshold distances and velocities can be calculated.
5.3.3 Threshold Distances and Velocities Using the stopping distance as the maximum threshold distance allowed for the
golf cart to come to a stop without colliding with an object. First, this threshold
distance was set and when the object is within this range, the golf cart’s speed was
reduced to a stop. Once this is confirmed, multiple threshold distances can be
used in order for the golf cart to reduce speed at a constant rate instead of an
abrupt stop. For example, for the furthest threshold distance, the golf cart’s
velocity may be reduced to 80% of the current speed. Once the object reaches
the next threshold distance, the velocity can be reduced by an additional 80%, and
so on. This allowed for a smooth driving experience and avoid collisions.
Multiple tests were implemented using trial and error. Starting at a low velocity,
the golf cart drove toward an object. Once the object is detected in the threshold
distances, the velocity of the golf cart should be reduced accordingly. These tests
were repeated for various speeds and object sizes.
123
5.3.4 Cruise Control Once the cruise control is set up, it can be tested by running it at different speeds. Once the desired speed is achieved, the button was pressed and cruise control
should engage. At the moment the cruise control button is pressed, the current
velocity was maintained. While cruise control is engaged, the button was pressed
to disengage cruise control. Also, the brake pedal was fitted with a button, so that
when the brake is pressed while cruise control is activated, the cruise control
disengaged.
5.3.5 Driver Notification The auditory driver notification was used with the cruise control and object avoidance to alert the driver if there is an object in the current path and when cruise
control is switched off. This can be tested by activating cruise control and then
pressing the brake. The brake pedal was shut off the cruise control and
simultaneously alert the driver. Also, by driving toward an object, the auditory
driver notification device can be tested. Once an object is within the threshold
distance, a sound should emit from the device to alert the driver.
5.4 Charge Controller The testing for the charge control followed the same phases as the prototyping. The phase were as follows. Phase one dealt with tests implemented once the
preliminary circuit design was done. Phase two required a test or prototype board
to go through certain lab tests. The last phase is testing done once the charge
controller is finished and completely connected to the solar panels and battery
bank.
5.4.1 Computer Simulation Once the circuit design is close to completion it can be designed into a computer
software like Multisim. In Multisim we are able to run a few different tests. The first
test was to connect a virtual oscilloscope to the circuit and test the input and output
waveforms of the circuit. By running this test we are able to determine if our design
is running in an efficient manner. This data was recorded in order to compare with
lab tests done in the second phase of testing. Another test we ran was an AC
analysis of the circuit. From this simulation we were able to see the magnitude and
phase plots. This is important to analyze in order to make sure the filters are
function properly.
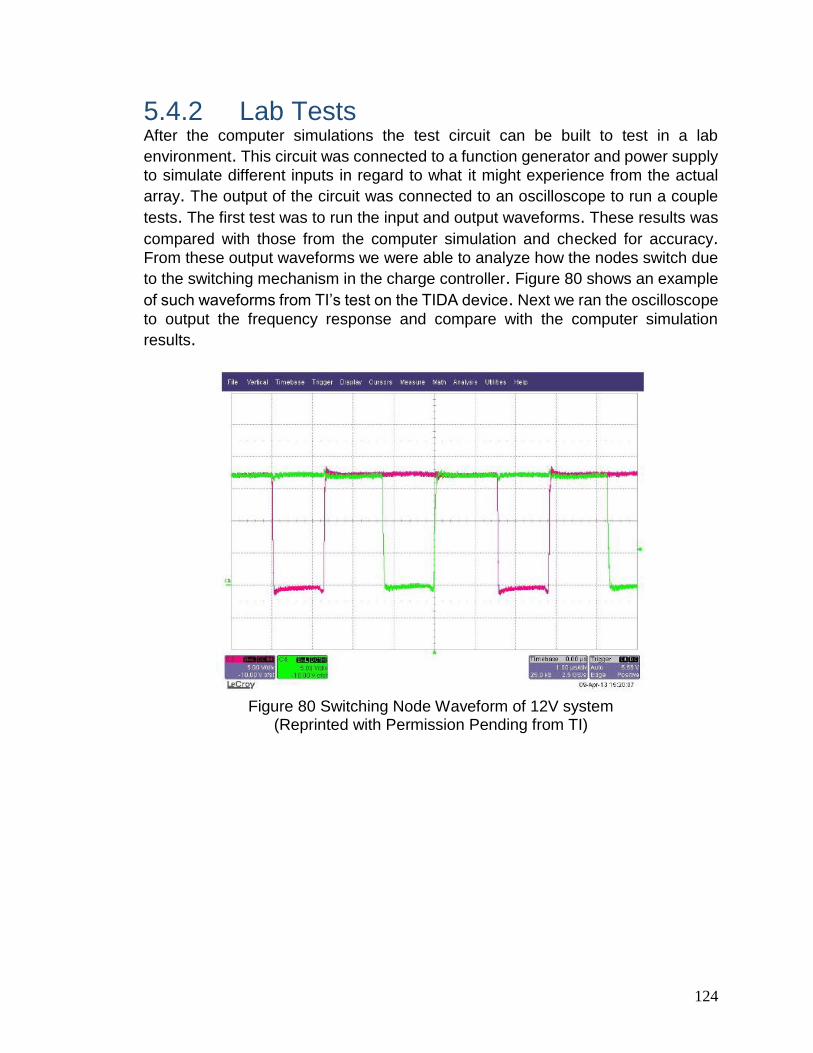
124
5.4.2 Lab Tests After the computer simulations the test circuit can be built to test in a lab
environment. This circuit was connected to a function generator and power supply
to simulate different inputs in regard to what it might experience from the actual
array. The output of the circuit was connected to an oscilloscope to run a couple
tests. The first test was to run the input and output waveforms. These results was
compared with those from the computer simulation and checked for accuracy. From these output waveforms we were able to analyze how the nodes switch due
to the switching mechanism in the charge controller. Figure 80 shows an example
of such waveforms from TI’s test on the TIDA device. Next we ran the oscilloscope
to output the frequency response and compare with the computer simulation
results.
Figure 80 Switching Node Waveform of 12V system
(Reprinted with Permission Pending from TI)
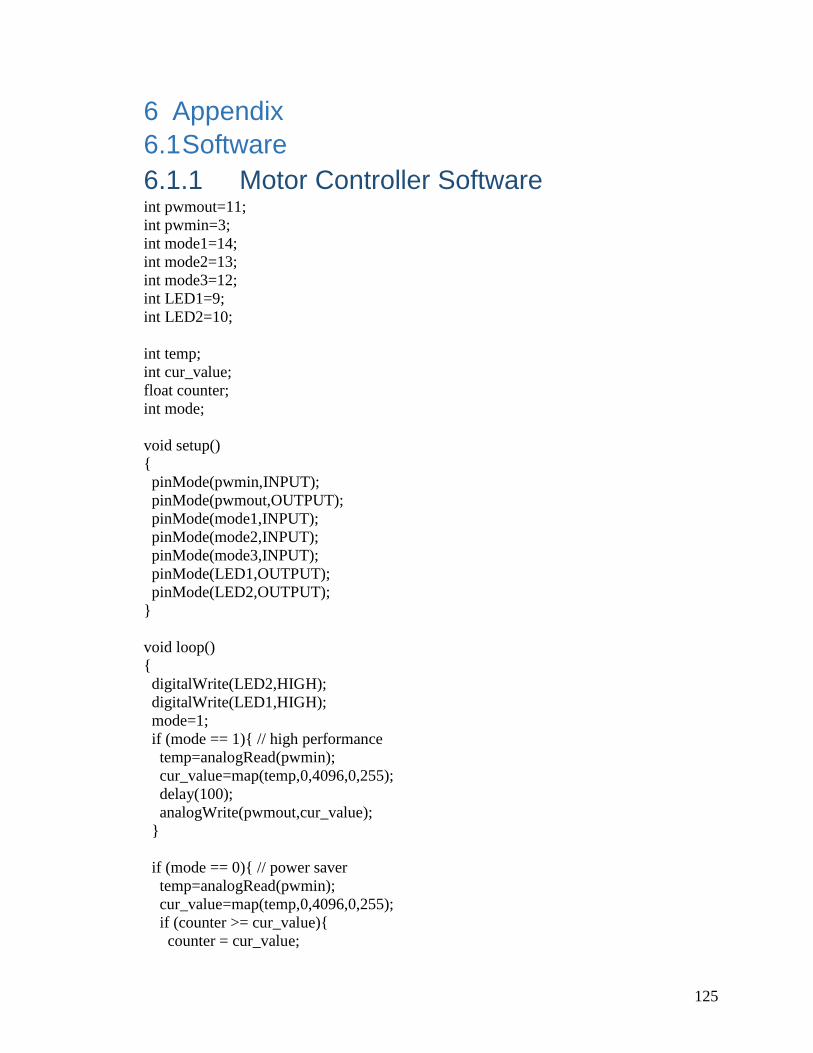
125
6 Appendix
6.1 Software
6.1.1 Motor Controller Software int pwmout=11;
int pwmin=3;
int mode1=14;
int mode2=13;
int mode3=12;
int LED1=9;
int LED2=10;
int temp;
int cur_value;
float counter;
int mode;
void setup()
pinMode(pwmin,INPUT);
pinMode(pwmout,OUTPUT);
pinMode(mode1,INPUT);
pinMode(mode2,INPUT);
pinMode(mode3,INPUT);
pinMode(LED1,OUTPUT);
pinMode(LED2,OUTPUT);
void loop()
digitalWrite(LED2,HIGH);
digitalWrite(LED1,HIGH);
mode=1;
if (mode == 1) // high performance
temp=analogRead(pwmin);
cur_value=map(temp,0,4096,0,255);
delay(100);
analogWrite(pwmout,cur_value);
if (mode == 0) // power saver
temp=analogRead(pwmin);
cur_value=map(temp,0,4096,0,255);
if (counter >= cur_value)
counter = cur_value;
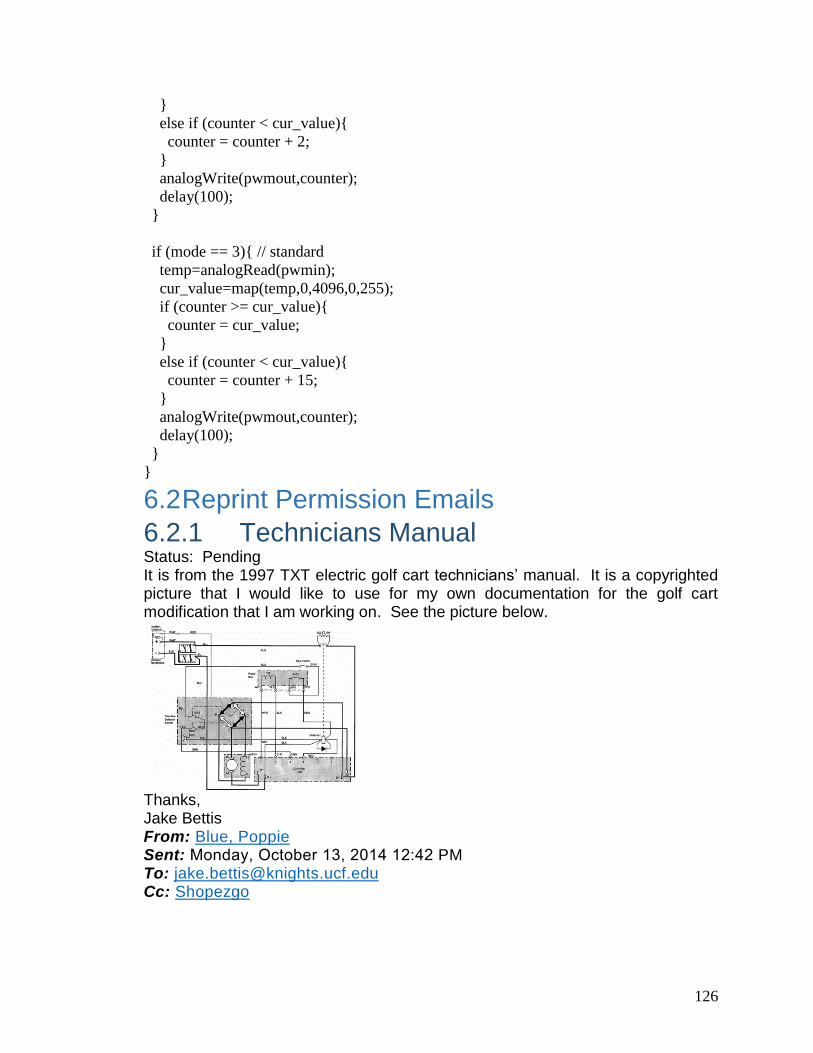
126
else if (counter < cur_value)
counter = counter + 2;
analogWrite(pwmout,counter);
delay(100);
if (mode == 3) // standard
temp=analogRead(pwmin);
cur_value=map(temp,0,4096,0,255);
if (counter >= cur_value)
counter = cur_value;
else if (counter < cur_value)
counter = counter + 15;
analogWrite(pwmout,counter);
delay(100);
6.2 Reprint Permission Emails
6.2.1 Technicians Manual Status: Pending It is from the 1997 TXT electric golf cart technicians’ manual. It is a copyrighted picture that I would like to use for my own documentation for the golf cart modification that I am working on. See the picture below.
Thanks, Jake Bettis From: Blue, Poppie Sent: Monday, October 13, 2014 12:42 PM To: [email protected] Cc: Shopezgo
127
Mr. Bettis, can you tell me exactly what you are wanting to use? Is it something that’s on
our website? Please let me know so I can understand what exactly you are wanting to
do. Thank you!
6.2.2 Open Revolt Status: Approved
6.2.3 Google Maps API License Status: Approved
6.2.4 Test Motor Hello, I am documenting my test procedure for a school project and plan to use a few of your products. We are required to obtain rights to use images from copyrighted websites. May I use the image from your website in the document? One of the parts that I plan to use is :
Poppie Blue Ecommerce Manager, P&A
1451 Marvin Griffin Road Augusta, GA 30906 (p) 706.771.4617

128
http://www.allelectronics.com/make-a-store/item/dcm-406/1.5-6-vdc-motor/1.html Thanks, Jake Bettis
6.2.5 GNU Free Documentation License Material licensed under the current version of the license can be used for any purpose, as
long as the use meets certain conditions.
All previous authors of the work must be attributed. All changes to the work must be logged. All derivative works must be licensed under the same license. The full text of the license, unmodified invariant sections as defined by the author if any,
and any other added warranty disclaimers (such as a general disclaimer alerting readers that the document may not be accurate for example) and copyright notices from previous
versions must be maintained. Technical measures such as DRM may not be used to control or obstruct distribution or
editing of the document.
6.2.6 AutoSales inc. You are hereby authorized to view, copy, print, and distribute these materials subject to the following conditions: 1. The materials may be used for internal informational purposes only; 2. Any copy of these materials or any portion thereof must include the above copyright notice; and 3. Autosales, Incorporated may revoke or modify any of the foregoing rights at any time.
6.2.7 All Electronics Inc. Hello Jake Yes you may use images from our web site for you school project. Please consider this email as your permission. Best of luck Woolf Kanter All Electronics Corp. www.allelectronics.com 800-826-5432 - fax 818-781-6847
From: jake bettis [mailto:[email protected]] Sent: Monday, December 01, 2014 7:04 PM To: Mail User Subject: Access to images from website Hello,

129
I am documenting my test procedure for a school project and plan to use a few of your products. We are required to obtain rights to use images from copyrighted websites. May I use the image from your website in the document? One of the parts that I plan to use is : http://www.allelectronics.com/make-a-store/item/dcm-406/1.5-6-vdc-motor/1.html Thanks, Jake Bettis
6.2.8 Sensor From: Mathew A. Dirjish [mailto:[email protected]]
Sent: Tuesday, December 2, 2014 4:51 PM
To: Matt Tourtelot
Subject: RE: Permission to use picture
No problem. I would suggest that you note that it came from the article: Motion/Velocity/Displacement Advances in Analog Distance Sensing By: Brian Duval September 1, 2004 Sensors Mag: http://www.sensorsmag.com/sensors/motion-velocity-displacement/advances-analog-distance-sensing-816 Thanks,
Mat Dirjish Executive Editor – Sensors Magazine
718-793-5501 | [email protected] | http://www.sensorsmag.com
Subject: Permission to use picture
Hello, I was wondering if I could include the image in Figure 6 from the article, http://www.sensorsmag.com/sensors/motion-velocity-displacement/advances-analog-distance-sensing-816 in my Senior Design Project for my University. Thank you, Matt Tourtelot

130
6.2.9 Laser diagram From: Philo [mailto:[email protected]] Sent: Wednesday, December 3, 2014 2:41 AM To: Matt Tourtelot Subject: Re: Permission to use image Hi Matt, Sure, you're welcome to do so ;) Philo Matt Tourtelot a écrit : > Hello, > > I was wondering if I could include the laser diagram from the page, > http://www.philohome.com/sensors/lasersensor.htm, for use in my Senior > Design Project at my University. > > Thank you, > > Matt Tourtelot >
6.2.10 Battery Configurations Status: Approved Matthew Roland <[email protected]> 8:47 AM (9 hours ago) Hello, My name is Matt Roland and I am a senior Electrical Engineering student at the University of Central Florida. I am a part of a project for my senior design class that is building a solar powered golf cart. I used some of the photos from your website to describe battery configurations for our battery bank. I would like to request official permission to use these photos. Thank you for your time and response. Regards, Matt Roland Ray Walters <[email protected]> 10:34 AM (8 hours ago) You have official permission to use our info, as long as it is for educational purposes only. Also, we hid this site, but here is info on our solar EVs we've built: www.electromoto.com

131
R.Ray Walters CTO, Solarray, Inc Nabcep Certified PV Installer, Licensed Master Electrician Solar Design Engineer 303 505-8760
6.2.11 Battery Charts and Specs Status: Pending Matthew Roland <[email protected]> 8:53 AM (9 hours ago) Hello, My name is Matt Roland. I am a senior at the University of Central Florida, studying Electrical Engineering. I am doing a senior design project which is to design and build a solar powered golf cart. We have not purchased yet, but plan on using some deep cycle batteries from your company. The batteries are the US 2200 XC2. I have used some of the graphs and specs as technical photos in our documentation and would like to request official use of these photos. Thank you for your time and response. Regards, Matt Roland
6.2.12 Texas Instruments Charts, Tables, and Figures
There is no email address for the general public to use in order to get in contact with TI. All requests must be submitted through their website in a request form. A form was sent on 12/2/2014, but there has been no response. We will assume permission is pending.
6.2.13 Grape Solar PV Diagrams There is no direct email address for the general public to use in order to get in contact with Grape Solar. All requests must be submitted through their website in a request form. A form was sent on 12/2/2014, but there has been no response. We will assume permission is pending.
6.2.14 Solar Wiring Diagram Status: Pending Matthew Roland <[email protected]> 6:58 PM (0 minutes ago) to [email protected]
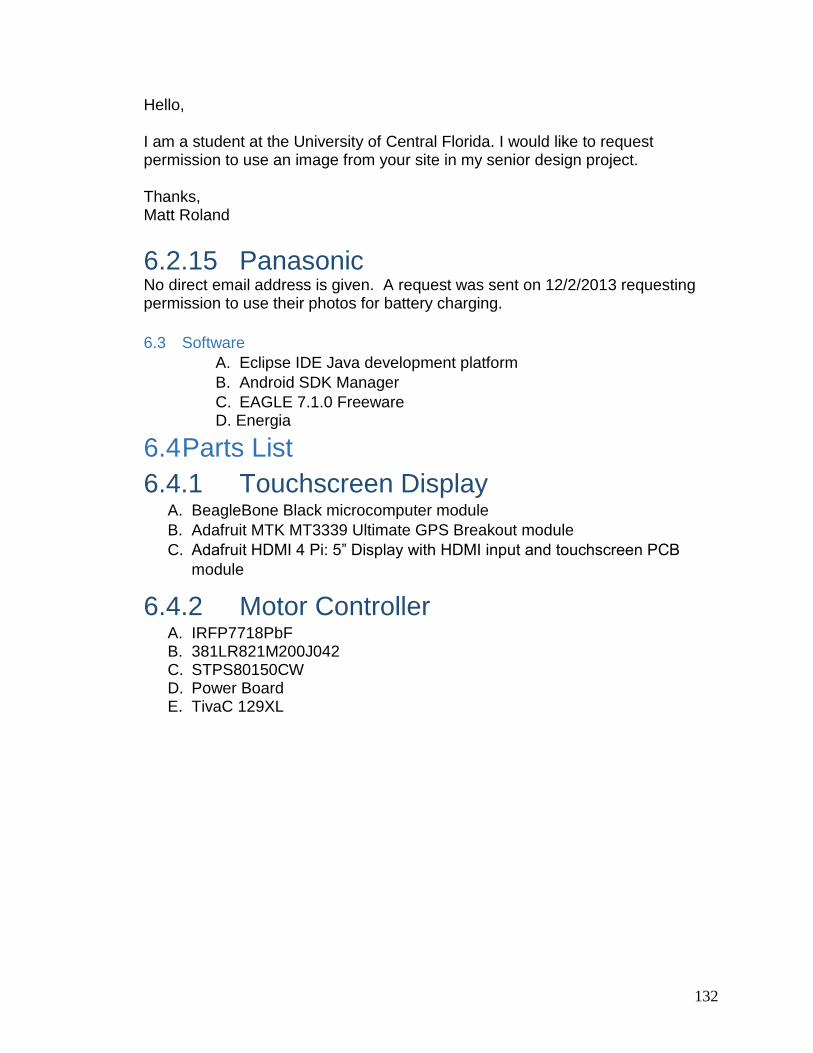
132
Hello, I am a student at the University of Central Florida. I would like to request permission to use an image from your site in my senior design project. Thanks, Matt Roland
6.2.15 Panasonic No direct email address is given. A request was sent on 12/2/2013 requesting permission to use their photos for battery charging.
6.3 Software
A. Eclipse IDE Java development platform
B. Android SDK Manager
C. EAGLE 7.1.0 Freeware D. Energia
6.4 Parts List
6.4.1 Touchscreen Display A. BeagleBone Black microcomputer module
B. Adafruit MTK MT3339 Ultimate GPS Breakout module
C. Adafruit HDMI 4 Pi: 5” Display with HDMI input and touchscreen PCB
module
6.4.2 Motor Controller A. IRFP7718PbF B. 381LR821M200J042 C. STPS80150CW D. Power Board E. TivaC 129XL