Embed Size (px)
Citation preview

Solar PV Site Suitability: Using GIS Analytics to Evaluate
Utility-Scale Solar Power Potential in the
U.S. South West Region
Justin Robert Brewer
Project report submitted to the faculty of Brigham Young University
in partial fulfillment of the requirements for the degree of
Master of Science
Daniel P. Ames, Chair E. James Nelson Gus P. Williams
Department of Civil and Environmental Engineering
Brigham Young University
August 2014
Copyright © 2014 Justin Robert Brewer
All Rights Reserved


ABSTRACT
Solar PV Site Suitability: Using GIS Analytics to Evaluate Utility-Scale Solar Power Potential in the
U.S. South West Region
Justin Robert Brewer Department of Civil and Environmental Engineering, BYU
Master of Science
Determining socially acceptable and economically viable locations for utility-scale solar projects is a costly process that depends on many technical, economic, environmental and social factors. This paper presents preliminary results from a GIS-based spatial multi-criteria solar siting assessment study done in the South Western United States. Proximity raster layers were derived from features such as roads, power lines, and rivers then overlaid with 10x10m raster terrain datasets including slope and potential irradiance to produce a high resolution map showing solar energy potential from “Poor” to “Excellent” for high potential counties across the South Western United States. A second identical map was also produced adding social acceptance data collected from a series of surveys taken by the PVMapper/Sunshot Initiative project shows the potential public resistance that can be expected in areas of “Excellent” solar energy suitability. The maps produced can significantly reduce time, money, and resources currently allocated toward finding and assessing areas of high solar power suitability.
Keywords: Justin Robert Brewer, photovoltaic, suitability, public attitudes


v
TABLE OF CONTENTS
LIST OF FIGURES .............................................................................................................. viii
1 Introduction and Background ..........................................................................................1
2 Methods..............................................................................................................................5
2.1 Preliminary Boolean Map ............................................................................................6
2.1.1 Limiting Factors.......................................................................................................6
2.1.2 Description of Data and Sources ..............................................................................7
2.1.3 Data Preparation ......................................................................................................9
2.1.4 Zonal Statistics ...................................................................................................... 11
2.2 Solar PV Site Suitability Analysis .............................................................................. 13
2.2.1 Model .................................................................................................................... 13
2.3 Public Acceptance Model .......................................................................................... 19
2.3.1 PVMapper Survey.................................................................................................. 19
2.3.2 Model Details ........................................................................................................ 21
3 Results and Discussion .................................................................................................... 23
3.1 PV Suitability Results ................................................................................................ 23
3.2 Social Acceptance Model Results .............................................................................. 25
3.3 Resulting County Overlay .......................................................................................... 27
4 Conclusion ....................................................................................................................... 29
REFERENCES ........................................................................................................................ 31

vi
LIST OF TABLES
Table 1: Selected 85th Percentile Values for Data Extracted from PVMapper ................... 7
Table 2: Results of the Zonal Statistical Analysis Showing Percent and Total Suitable Area .............................................................................................................................. 12
Table 3: Table Showing Weighted Values Used to Determine Suitability .......................... 17
Table 4: Suitability Status Ranges ..................................................................................... 18

vii

viii
LIST OF FIGURES
Figure 1: Maps Showing Feature Data Used to Produce Boolean Map .............................. 9
Figure 2: Map Showing Acceptable Areas for PV Development ........................................ 10
Figure 3: ModelBuilder Workflow Showing Feature Data Processing ............................... 15
Figure 4: ModelBuilder Workflow Showing Slopes and Solar Irradiance Reclassification . 16
Figure 5: ModelBuilder Model Showing Final Stages of Suitability Workflow ................. 18
Figure 6: Survey Results for Support Distances between Solar Facility and Land Uses ..... 20
Figure 7: Workflow for Social Acceptance Model ............................................................. 22
Figure 8: County Site Suitability for Arizona and California ............................................. 24
Figure 9: Social Acceptance Model ................................................................................... 26
Figure 10: Suitability Including Social Factors .................................................................. 28

1
1 INTRODUCTION AND BACKGROUND
Energy demand is determined primarily by population growth rates, industry and geographic
distribution, whereas the amount of people that can be supported at an acceptable quality of life
relies heavily on the availability, costs, and efficiency to which energy is produced (Holdren,
1991). Extensive, overuse of fossil fuels has been argued to be responsible for excessive levels of
carbon dioxide and resulting ecologic, social, and, economic impacts (Coyle, 2014). This
recognition drives much active research in renewable energy.
The expanded use of renewable energy is expected to increase global energy production at
levels that would forego use of the world’s finite resources and reduce the human impact on the
environment. Photovoltaic (PV) energy has received much attention as a potential
alternative/renewable energy source in the past decade with clear advantages for regions where
grid connected power is inconvenient or expensive. PV energy production has also shown to
produce enough power to compete in large scale markets. Though, in spite of recent efforts to
expand solar energy production, solar power presently contributes only a small percentage of
total U.S. energy supply.
In recent years, advanced solar panel manufacturing practices have led to a dramatic drop
in costs and solar energy production has been shown to compete in price with conventional
sources in some U.S. markets. (Drury, Brinkman, Denholm, Margolis, & Mowers, 2012). As the
PV market grows, manufacturers will continue to standardize designs and system installation and

2
share efficient practices to further reduce costs associated with PV energy production (Goodrich,
James, & Woodhouse, 2012). Paired with the falling cost of PV hardware and technology, the
viability of PV utility-scale power production has the potential to take a large share of the energy
market.
Today only 3% of the global energy market is produced by PV, however countries that
have made renewable energy a priority demonstrate meeting more than 30% of electricity
demand with wind and solar (Nichols, 2014). Historically, major concerns regarding the long
term sustainable use of solar power were the costs related to variable energy integration into the
grid and the cost-to-efficiency ratio regarding the variability of solar irradiance. Today these
concerns have considerably decreased due to advances in panel-to-grid integration technology.
Advancements in almost every aspect of PV technology have led to solar energy cost
competiveness. As physical technology prices continue to fall, a greater share of the cost of PV
deployment is associated with preliminary site selection and other so called, “soft costs.” A
survey conducted by the National Renewable Energy Laboratory (NREL) found that non-
hardware balance-of-system soft costs account for an increasing portion of PV systems by an
average of 50% to 64% of total installed price (Ardani et al., 2012).
The Department of Energy’s SunShot Initiative, seeks to make solar energy cost-
competitive with other forms of electricity by the end of the decade – including through the
reduction of soft costs. The stated goal of the SunShot Initiative is to reduce the total installed
cost of solar energy systems to $.06 per kilowatt-hour (kWh) by 2020. According to the
energy.gov web site:

3
“SunShot has achieved 60% of its goal, only three years into the program's ten year
timeline. Since SunShot's launch in 2011, the average price per kWh of a utility-scale
photovoltaic (PV) project has dropped from about $0.21 to $0.11.” (Energy.gov, 2013)
Many of these goals are carried out through public and freely accessible web-based mapping
applications to aid in analyzing solar energy project siting decisions. Examples of such web
mapping applications include:
• PVMapper (http://pvmapper.org) is an open-source geographic information system
(GIS)-based web application, currently under development, that will provide utility-scale
solar developers with tools and data for site selection and screening of potential PV solar
energy plants.
• The Eastern Interconnection States Planning Commission (EISPC) Energy Zones
Mapping Tool (https://eispctools.anl.gov) facilitates planning for clean energy zones and
provides and extensive library of energy resources and other siting factors as mapping
layers, models to map the suitability for solar energy and other technologies, and region-
specific reports.
• Solar Energy Environmental Mapper (http://solarmapper.anl.gov) concentrates on the
southwestern United States and was developed to share information relevant to siting
utility-scale solar projects in the six southwestern states included in the scope of the Solar
Energy Development Programmatic Environmental Impact Statement.
Another application that proves to be valuable in suitability analysis is Landscape Modeler, a
web mapping application by ESRI. Though this product is not freely available to the public, it
reduces the time and technical knowledge needed to conduct an in depth suitability analysis. This
application specifies the environmental and cultural factors considered important to decision

4
making, selects the appropriate data layers, weights them and uses geoprocessing tools to filter
the criteria and identify the best locations. Applications such as this allow for the use of raster
services to visualize information such as critical habitats, development risk, fire potential, and
solar power potential across the U.S.
With soft costs quickly becoming the limiting factor behind solar energy production, location
siting is one of the most important factors to address. Finding a suitable location for solar energy
development affects purchase price, solar power efficiency, environmental impacts, and public
opinion (Kuiper, Ames, Koehler, Lee, & Quinby, 2013). The factors contributing to the success
of solar development siting include physical characteristics such as slope, road and water
proximity, land ownership and use, potential environmental impacts, and grid connectivity.
Much of the data related to these factors are feely available.
This paper presents an approach to develop large-scale high resolution site suitability maps
of potential utility-scale PV installation locations to help further reduce PV soft costs. By
modeling public sentiments toward potential solar PV development locations we hope to reduce
the potential economical pit falls associated with social resistance. While our overarching goal is
to build and make freely available such maps for the entire United States, this paper presents
initial methods and results for the South West Region of the United States.

5
2 METHODS
Solar energy resource analysis for utility-scale development is affected by factors that can
be divided into four categories: technical, economic, environmental and social. Technical,
economic and environmental factors depend on the physical terrain, existing infrastructure
proximity, geographic location, and land use restrictions. The fourth category, “social”, is
variable over time based on popular or cultural beliefs and perceived aesthetics regarding
environmental issues. To develop a site suitability map that adequately addresses the four main
categories, we assessed and processed available datasets using ArcGIS software. We chose the
southwestern region of the U.S. due to the substantial growth of commercial PV in the region,
the availability of potential lands with “excellent” suitability, and the ability to test results
against many existing PV sites.
The technical, economic and environmental limiting factors for preliminary PV solar
siting and this study were derived from discussions and decisions made by the PVMapper
steering committee. Preliminary terrain and proximity siting requires the consideration of
existing infrastructure that affect the direct cost of utility-scale PV solar power development and
potential solar irradiance that directly impacts the efficiency of an operating site. Vehicle access
to a developing site is essential for constructability and maintenance. Due to the high cost of road
construction, proximity to existing roads is essential during preliminary siting. Proximity to
national grid transmission lines affects construction and development costs while proximity to a
stable water source is needed for suitable maintenance. Flat terrain is essential for both solar
exposure and constructability while a high daily annual solar irradiance is needed for plant

6
efficiency and stability. Given these factors the siting parameters we chose for this study are:
distances to roads, river, and power lines along with low maximum slopes combined with high
average daily annual solar irradiance values.
2.1 Preliminary Boolean Map
2.1.1 Limiting Factors
The commencement of this project required data for currently operating PV projects
within the study area. SEIA (Solar Energy Industries Association) provided their national
database of all ground-mounted solar projects, 1 MW capacity and above, that are either
operating, under construction or under development. This data was collected by SEIA from
public announcements of solar projects in the form of company press releases, news releases, and
in some cases conversations with individual developers. Data were edited to show only PV sites
in operating status within the south west region of the U.S. The top 100 capacity sites in the
region were selected to determine optimum proximity to specific features as well as slope and
solar irradiance values for currently operating PV power plants. To extract this data, we
determined PVMapper to be the best tool for geospatial location analysis.
Each selected site was processed by PVMapper to analyze the maximum slope, minimum
irradiance value, and distance to nearest river, road, and major grid power line. The PVMapper
score card tool uses GIS layers to give an overview of the site terrain slope, soil, solar irradiance
potential and land cover as well the distance to such features as the nearest transmission lines,
rivers, and roads. Data provided by PVMapper are presented in a report for each site. Site data
extracted from PVMapper reports were added to a spreadsheet giving each site a row with columns
representing distance to feature values, maximum slope and minimum irradiance values for a flat

7
plate tilted solar collector. The values for each column were analyzed and the 85th percentile value
was selected to represent limiting values for the Boolean map to be built. Limiting values extracted
are shown below in Table 1.
Table 1: Selected 85th Percentile Values for Data Extracted from PVMapper
85th Percentile Distance (km)
85th Percentile Irradiance
(Kwh/m2/day)
85th Percentile Max Slope (Degree)
Road Proximity .56 - - River Proximity 17.3 - -
Power Line Proximity 32.7 - - Irradiance (Tilted Flat
Plate) - 6.53 -
Slope - - 3.07
2.1.2 Description of Data and Sources
Terrain data are used to model the potential solar exposure loss due to the poor slope and
aspect characteristics of the land. Also a high-resolution digital terrain model can predict
constructability issues associated with steep slopes. Digital Elevation Model (DEM) data, or a
digital representation of a terrain’s surface, were extracted from the “National Map Viewer”
managed by the USGS National Geospatial program (NGP). Data were extracted in ten-meter by
ten-meter cell size (10 m) raster format and converted to slope raster data, shown in Figure 1.
Infrastructure proximity layers used for this analysis were derived from OpenSteetMap
(OSM); a collaborative editable map of the world where data is imported from digitization of
aerial photography and other user-contributed sources. We chose roads and major electrical grid
towers to represent the necessity for nearby grid connections and/or substation conversion

8
potential and site accessibility. We extracted these polyline and point shapefiles from the study
area extent and edited to dismiss outlier data and produce accurate results during analysis, shown
in Figure 1.
Solar irradiance data were derived from solar maps provided by the NREL online data
repository. Data values represent, “the solar energy resource available to a flat plate collector,
such as a photovoltaic panel, oriented due south at an angle from horizontal to equal the latitude
of the collector location” (http://www.nrel.gov/gis/solar.html). According to NREL, “this is a
typical practice for PV system installation, although other orientations are also used.” The data
provide, “monthly average daily total solar resource information on grid cells of approximately
40 km by 40 km in size.” (NREL, 2013) This map was developed from the Climatological Solar
Radiation (CSR) Model. The CSR model was derived using three parameters including cloud
cover, horizontal surfaces, and trace gasses together with water vapor. Eight years of data were
used to define cloud cover as monthly average percent cover per 40 km grid cell (Maxwell,
1998). The 40 km data format was extracted as a polygon feature class containing the annual
daily average irradiance values in kwh/m2/day, shown in Figure 1.

9
Figure 1: Maps Showing Feature Data Used to Produce Boolean Map
2.1.3 Data Preparation
The goal of a Boolean map is to demonstrate geospatial areas that fit within given
limitations of various GIS layers. The resulting map is presented in the form of a single shapefile
representing the area that overlaps every layer’s acceptability parameters. The area of study for
this project required the infrastructure proximity layers be edited to contain the southwestern
region of the U.S. We processed the road polyline data for the area of study to create a shapefile
layer representing the acceptable area for PV development according to the 85th percentile values
shown in Table 1. This was done using the buffer function in ArcMap that produced a polygon

10
layer representing all area within .56 kilometers of an existing road. We used a similar process to
produce polygon layers representing the acceptable areas for development near existing rivers
and power lines.
The process to prepare the slope and solar irradiance rasters required the conversion of
rasters to polygons. We then selected the polygons containing acceptable values using a simple
SQL expression to query the area containing the acceptable values shown in table 1. The road,
river, power line, slope, and solar irradiance layers were then intersected. The intersect tool, a
part of ArcMap’s analysis toolbox licensing, computes a geometric intersection of the input
features which overlap in all layers. The output produces a shapefile representing the areas that
fit within the limitations of each parameter, shown in Figure 2.
Figure 2: Map Showing Acceptable Areas for PV Development

11
2.1.4 Zonal Statistics
The Boolean map shown in Figure 2 is a representation of suitable land for the development
of utility-scale PV solar power. The five suitability factors used were determined by the PVMapper
steering committee. We derived the parameters for each factor from the analysis done on the 100
highest capacity currently operating PV sites in the study area. We used the 85th percentile values
as limiting values for each factor to produce. The Boolean map we created was used for visual
suitability analysis and to assess the highest concentration of area suitable for PV development.
Using ArcGIS and this map, we calculated the zonal for each county in the southwestern U.S. The
results of this analysis are shown below in Table 2.

12
Table 2: Results of the Zonal Statistical Analysis Showing Percent and Total Suitable Area
STATE County Total Area
(Km2)
Suitable Area (Km2)
Percent Suitable Area
Arizona Apache 43123 21010 49% Arizona Navajo 38463 16146 42% Arizona Maricopa 34074 15411 45% Arizona Pinal 19609 9352 48% Arizona Cochise 22466 9223 41%
California Modoc 19422 8309 43% California Lassen 21057 12424 59% California Merced 7954 5618 71% California Butte 7251 4041 56% California Stanislaus 6348 3356 53% California Nevada 4214 2875 68% Colorado Kit Carson 9359 7436 79% Colorado Elbert 7866 6160 78% Colorado Arapahoe 3481 2827 81% Colorado Alamosa 2892 2180 75% Colorado Denver 683 675 99% Nevada Pershing 26836 10898 41% Nevada Eureka 18313 7818 43% Nevada Lyon 8762 4082 47% Nevada Storey 1136 579 51% Nevada Carson City 695 358 51%
New Mexico San Juan 22203 12936 58% New Mexico Chaves 22647 11213 50% New Mexico Guadalupe 11606 5874 51% New Mexico Valencia 4218 2877 68% New Mexico Bernalillo 4476 2438 54%
Utah Uintah 19982 9104 46% Utah Duchesne 14451 6510 45% Utah Sanpete 6784 3137 46% Utah Carbon 6722 2987 44% Utah Rich 4750 2240 47%
Table 2 shows 5 counties in each state with the highest concentration of suitable area in
order of most total suitable area as defined by the Boolean map and the zonal analysis we

13
prepared using ArcMap. This preliminary breakdown returned the counties in the southwestern
region of the U.S. that are most suitable for further analysis. We selected the top two counties in
each state with highest total suitable area for high density suitability analysis including social
factors.
2.2 Solar PV Site Suitability Analysis
A GIS suitability analysis is a process used to determine the appropriateness of a given
area for particular use based on a calculated raster values. The basic principle behind a suitability
analysis for the purposes of this project is to determine the degree to which each area is suitable
for solar PV development on a utility-scale. Suitability is determined through a multi-factor
analysis of the different aspects of existing terrain. The factors we chosen to assess suitability
were derived from the original parameters provided by the PVMapper steering committee. These
factors are, as mentioned earlier in this paper, proximity to exiting features such as roads, rivers,
and power lines along with slope and solar irradiance values. Suitability status is displayed as
one of three categories labeled “Poor”, “Good”, and “Excellent”. Categorical status was
calculated using a simple weighted sum equation based on weighted importance in suitability for
this project.
2.2.1 Model
Preparation of data layers required a high level of computing power to produce high
density10m raster layers for each suitability parameter. Proximity to feature layers were converted
from the vector format provided by OSM to 10m raster data layers using ArcGIS. Each 10m raster
layer created was built to snap directly to the 10m slope layer for ease in layer calculations
performed at a later stage.

14
PV site suitability analysis, using raster layer parameters, can be conducted using “map
algebra” (Tomlin, 1990). For the purposes of this paper, map algebra procedures were simplified
using local class operations. Cell to cell math was performed using the data layers presented above
to produce a map showing areas of high suitability while also eliminating areas that would be
detrimental to the constructability, cost effectiveness, and efficiency of a solar power plant. We
built and organized these operations using a visual programming application called ModelBuilder
included in Esri’s ArcGIS software package. ModelBuilder allows processes to be organized
together in sequences of geoprocessing tools, linking the output of one tool into another tool as
input as shown in figure 3.
In order to evaluate each area according to its distance to a specific infrastructure feature,
we derived a euclidean distance raster was derived from each road, river, and power line raster
using the Euclidean Distance tool in ArcMap to evaluate proximity. The output of this process is
then used as the input for a reclassify function that groups distance values into 9 blocks and gives
each block an integer ranging from 1 to 9. For example the Euclidean distance values
representing distance from existing roads between 0 and 250 meters is reclassified or replaced
with a 9. In this way a new output raster is created containing only integer values from 1 to 9,
each representing a step scale of distances to existing roads. We defined the distribution of
categories for each parameter based on common maximum distances for each infrastructure
feature. For roads, the 9 categories were reclassified from a range of 0 km to 6 km, rivers ranged
from 0 km to 45 km, and power line distances ranged from 0 km to 85 km. The ModelBuilder
model interface showing this process for the proximity to feature parameters is shown below in
figure 3.

15
Figure 3: ModelBuilder Workflow Showing Feature Data Processing
When classifying distances to features it is important to expand the processing extent to
include features just beyond the county borders. Figure 3 shows the county mask feature
buffered by 1 km to include nearby features just outside county boundaries. The buffered shape
was then used as the extent to which processing occurred. To restore the raster extent to the area
of study, a mask of the original county shape was applied during map algebra calculations.
Slope and solar irradiance data were also reclassified to create 10m raster layers
containing integers ranging from 1 to 9. Solar irradiance values were redefined by 9 evenly
distributed categories from 3 to 8 kwh/m2/day. We also assigned reclassified values to slope
characteristics into 9 evenly distributed categories ranging from 0 to 90 degrees. Cells with a
value of 9 represent area of flat terrain or high irradiance value. Cells with a value of 1 represent
terrain containing steep slopes and areas of low solar exposure. Figure 4 below shows the

16
processes used in ModelBuilder to prepare and reclassify these layers. The input county shape
serves as the processing extent for both layers.
Figure 4: ModelBuilder Workflow Showing Slopes and Solar Irradiance Reclassification
At this point in the model each parameter of the suitability analysis is represented with a
raster layer containing integer values ranging from 1 to 9 representing the suitability inside each
layer. The next process run allows each parameter to be weighted based on the value each
parameter brings to PV development and operational costs. This study required a cost analysis
comparison to determine weighted values. Using the 85th percentile values shown in Table 1, we
compared the cost to construct .56 km of road was to the cost to install 17.3 km of water line and
32.7 km of power line. A comparison shows that the needed power line and water line
construction cost are similar and about 80 percent of the cost of building the needed road length.
The cost associated with the constructability issues that arise from steep slopes is largely
unknown and hard to weight the value of flat terrain for development, so we chose the weighted
value for this parameter to be equal to that of building a .56 km stretch of road. The value of
17
solar irradiance is also hard to determine due to future advancements in technology, but because
solar exposure affects plant efficiency for the entire design life of the facility, we chose to weight
it 10 percent higher than road construction. These weighted values are shown below in Table 2.
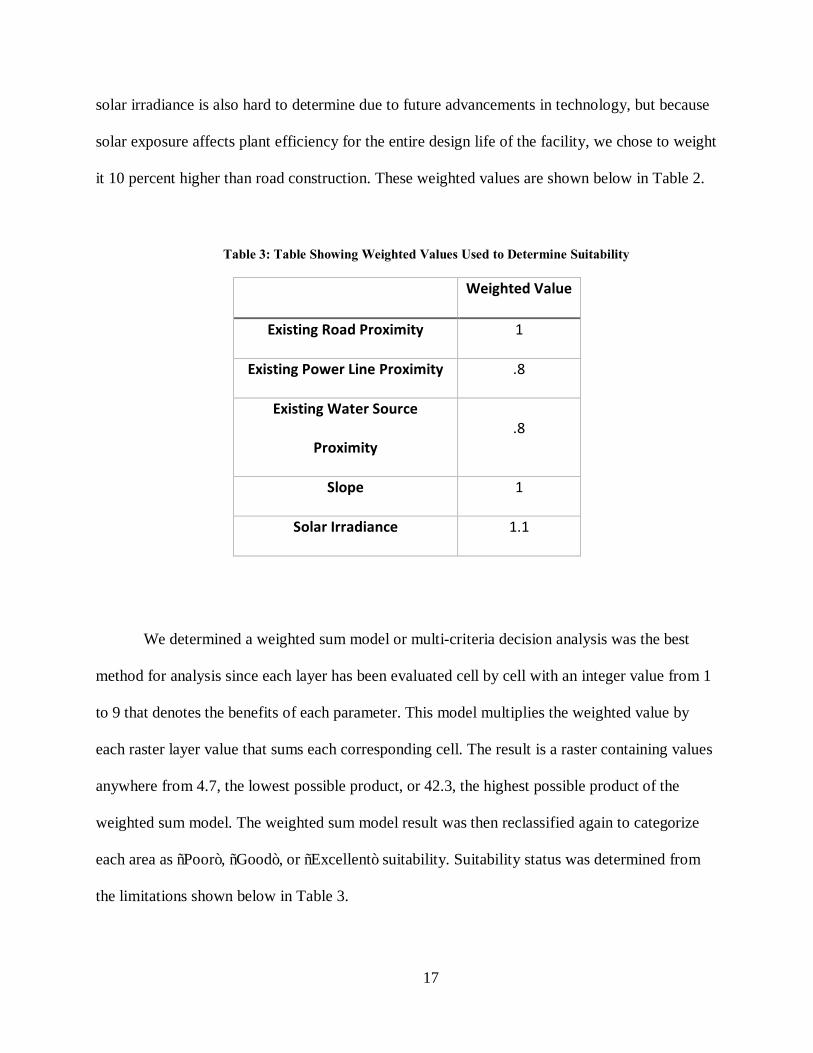
Table 3: Table Showing Weighted Values Used to Determine Suitability
Weighted Value
Existing Road Proximity 1
Existing Power Line Proximity .8
Existing Water Source
Proximity .8
Slope 1
Solar Irradiance 1.1
We determined a weighted sum model or multi-criteria decision analysis was the best
method for analysis since each layer has been evaluated cell by cell with an integer value from 1
to 9 that denotes the benefits of each parameter. This model multiplies the weighted value by
each raster layer value that sums each corresponding cell. The result is a raster containing values
anywhere from 4.7, the lowest possible product, or 42.3, the highest possible product of the
weighted sum model. The weighted sum model result was then reclassified again to categorize
each area as “Poor”, “Good”, or “Excellent” suitability. Suitability status was determined from
the limitations shown below in Table 3.

18
Table 4: Suitability Status Ranges
Weighted Sum Values Reclassified Values
4.7 – 26 Poor
26 – 32 Good
32 – 42.3 Excellent
The ModelBuilder workflow linking the weighted sum analysis to the reclassify tool is
shown below in Figure 5. The weighted sum tool was restricted to process only within the
confines of the original county boundary. This ensures that final map results show only suitable
area inside the area of study, but still include the distance to features outside the extent.
Figure 5: ModelBuilder Model Showing Final Stages of Suitability Workflow

19
2.3 Public Acceptance Model
2.3.1 PVMapper Survey
Included in the scope of the PVMapper project is the formal integration of socio-political
attitudes and economical solar site suitability designed from data retrieved from a specially
designed public opinion survey. Part of the public opinion survey was designed to gage the
public’s preferred distances or buffers, between solar facility and a variety of land features
including residential areas, agricultural lands, cultural resources, wildlife breeding grounds,
recreation areas, and existing solar facilities. The survey questions defined 4 categories of
distances for response: less than a mile, 1-5 miles, 6-10 miles, and more than 10 miles. These
categories define the minimum acceptable distance between the land feature and a potential solar
facility. For example, if a respondent chooses less than a mile, the minimum acceptable distance
between the feature and the solar generation facility can be less than a mile, and any distance
greater is also acceptable.
Figure 6 shows the results representing minimal acceptable distances from each feature to
solar power plant construction. For residential areas, a solar power plant built more than 6 miles
away is supported by 72% of those surveyed. For breeding or nesting sites, a large majority of
respondents believe that only 10 or more miles away is suitable for PV development and about
49% of those surveyed believe a solar development location needs to be at least 6 miles away
from recreational areas. Sixty-five percent of the public believe solar power development within
5 miles of agricultural land is acceptable.

20
Figure 6: Survey Results for Support Distances between Solar Facility and Land Uses
The PVMapper survey allows for site suitability based on technical, economical, and
environmental factors to be analyzed according to the potential social acceptance as a function of
feature proximity. The method used to locate areas of high suitability with high percentage of
public acceptance was to build a public acceptability layer. The goal of a public acceptance
model is to build a raster that contains the lowest percentage of potential social acceptance in
each cell according to the proximity of the five features of study outlined by the PVMapper
survey. This model was designed to produce a high density result that matches the suitability
raster already created. This was done specifically to overlay the suitability layer and social
acceptance layer to demonstrate areas of high suitability and high social acceptance contrast to
areas of high suitability and potential public resistance.
0%10%20%30%40%50%60%70%80%90%
100%
Residential Areas Agricultural Lands Cultural or HistoricAreas
Breeding or NestingSites
Recreation Areas
Level of Support for Distances between a Solar Facility and Land Uses
Any Distance >1 Mile >6 Miles >10 Miles

21
2.3.2 Model Details
Data used to define locations of residential area and agricultural area were derived from
land use raster data retrieved from the U.S. Department of Agriculture’s National Agricultural
Statistics Service. We extracted cells containing values that represent residential areas and
agricultural areas to create a residential data layer and an agricultural data layer. Breeding and
Nesting location data was defined by the U.S. Fish and Wildlife Services’ Geospatial Services
and was extracted as polygon shape files. Recreational Boundaries were defined by the U.S.
Department of the Interior Bureau of Land Management. The National Register of Historic
Places containing geographical locations of registered historic sites was downloaded from the
U.S. National Park Service.
We built the social acceptance model using ModelBuilder within the area of study
defined for this project as the Southwestern U.S. We used each feature layer collected to create 5
euclidean distance rasters with 10m cell size and snapped to site suitability raster. The distance
rasters were reclassified to represent the categorical public acceptance percentages for each cell.
For example, we reclassified the distance from residential areas such that all cells within 1 mile
of a residential area were replace to a value of .21 to represent 21% of respondents that feel areas
of 1 mile or less to be acceptable for solar site development. Similarly, all areas between 1 and 5
miles of residential areas are represented with a .57 to show that 57% of people believe 5 miles
or less to be acceptable area for solar power development, this was continued for the other
values.
After reclassification there were five raster datasets that represent the public acceptance
percentage according to proximity to each respective feature. We then combined these datasets
into one layer using the minimum value of acceptance for each location as the output. This

22
means that for any location in the area of study there is a value representing the least accepted
area for all five input factors. Figure 6 shows the flow of processing we built using
ModelBuilder.
Figure 7: Workflow for Social Acceptance Model
The completed Social acceptance model represents the minimum percentage of public
acceptance for each area according to the proximity to certain features such as endangered
species habitat and nesting sites, historical landmarks, residential area, agricultural area and
recreational area. This model is useful in combination with the suitability model developed. The
goal is to analyze the social acceptance of areas with high geographical and economical
suitability for solar PV plant development. This goal was satisfied by using simple map algebra
to multiply the weighted sum value data produced by the suitability workflow by the social
acceptance percentage before categorizing suitability according to Table 4. For example, if an
area suitability value was calculated to be 42, a high suitability value, it was then multiplied by

23
its social acceptance percentage value of .4 or 40% to be equal to 16.8. In this way an area of
high suitability with low percentage of acceptability becomes an area of low suitability. The
resulting map produced can help developers find suitable areas while avoiding areas that could
produce public push back or general social disapproval.

24

23
3 RESULTS AND DISCUSSION
3.1 PV Suitability Results
The PV site suitability model and map product defines the areas of the South West U.S.
region that satisfy the technical, economical, and environmental goals of this study. The weighted
values of potential irradiance, slope considerations, and necessary existing infrastructure show
areas with high potential output potential as they relate to constructability and cost efficiency.
Weighted values produced based on this model were further broken down into three categories to
facilitate a visual representation of the results. Because a cell size of 10mx10m was used for all
processing, the resulting maps allow for a high definition visual map shown in Figure 8. Users can
examine map products from this model at a zoomed in scale that more accurately represents the
boundaries of suitable area. Without such a high density dataset, values and boundaries can
become fuzzy and less representative of current terrain causing potential constructability issues.
The maps in Figure 8 do not include social acceptance factors.

24
Figure 8: County Site Suitability for Arizona and California

25
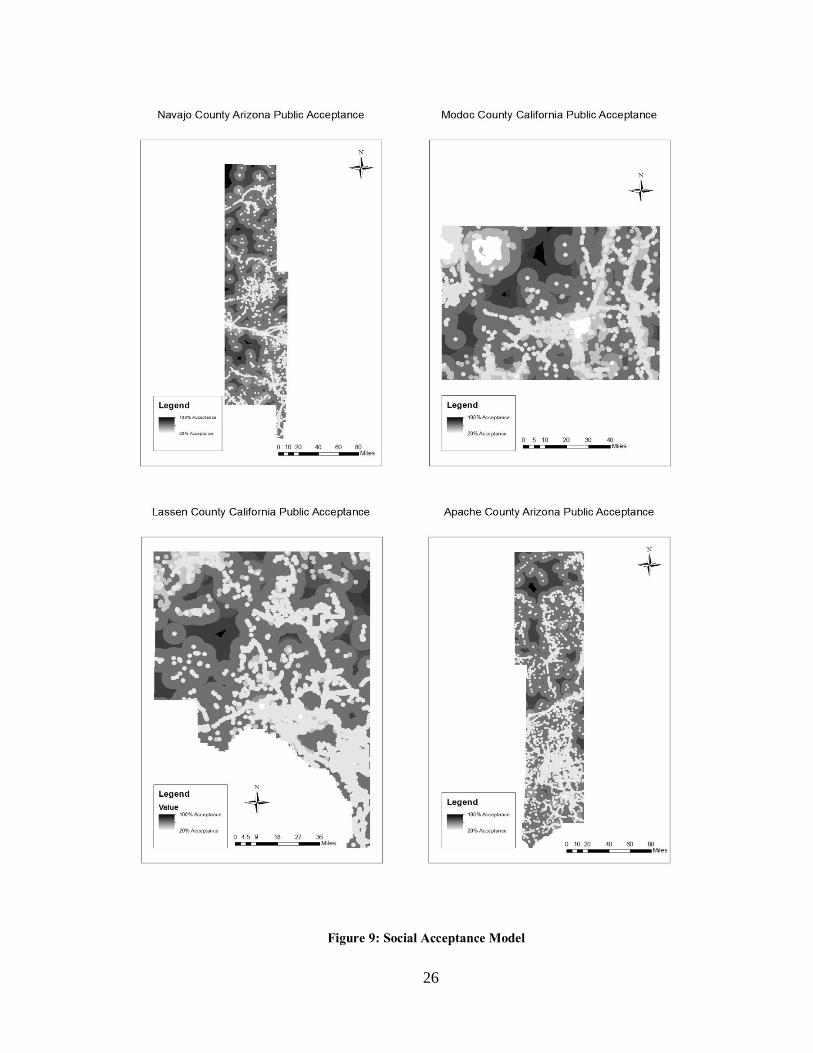
3.2 Social Acceptance Model Results
The lasting implications of this study reside in the dynamic of predicting public acceptance
or, more accurately, potential resistance. The social acceptance model described in section 2.3 of
this report is believed to have accurately attached values representing the absence of public
resistance to visually definable geographical coordinates. The PVMapper survey used as the
underlying source for this model was designed to capture American sentiments toward solar
development in general, however, this study was directed specifically at the proximity of suitable
land to areas of high environmental controversy. The value of this model is in the identification of
the seemingly excellent potential in any siting model that may intrude on areas that can spark
public resistance. Public attitudes toward solar development are essential to cost efficiency of PV
production and to gain momentum in the continuing battle for energy market share. The map
shown below in Figure 9 shows the gradient of expected public resistance values.
26
Figure 9: Social Acceptance Model

27
3.3 Resulting County Overlay
The table in Section 2.1.4 of this report provides counties with high suitability density and
total area. These counties were the subject of further analysis for this project. For each selected
county, the suitability data were extracted and multiplied by the public acceptance factor as defined
in section 2.3 of this paper. The result of this operation reports the potentially suitable area for
solar PV development that has the least risk of producing public resistance. The distinction
between high economic, environmental, and technical potential and that same potential
demonstrated with limited negative public attitudes is essential to the financial success of solar
power production. The maps below show the high percentage of economically suitable area that
should be avoided to appease public opinion. The social acceptance factor is believed to be very
conservative as to avoid the unpredictable culture of public opinion. In this way the models
outlined in this paper lead to defining areas carrying all the criteria stated with a high degree of
confidence.

28
Figure 10: Suitability Including Social Factors

29
4 CONCLUSION
This goals of this study included determining acceptable and economically viable locations
for utility-scale solar projects. In depth preliminary siting analysis allows for the avoidance of solar
development from areas that can cause constructability and public issues. These issues hamper the
solar PV industry with both added cost and decreased efficiency. This paper presented the method
and results from a GIS-=based spatial multi-criteria solar siting assessment study done for the
southwest U.S. region. Suitability was assessed through economic, technical, environmental, and
social factors to determine areas of the study region that contain both excellent terrain with
proximity to features that reduce the cost of construction and are in harmony with the
environmental sentiments of the public. Using this model developers will understand the
limitations associated with current social opinion regarding environmental issues. Avoiding
unforeseen public resistance will overall reduce the soft costs associated with solar development.

30

31
REFERENCES
Ardani, K, Barbose, G, Margolis, R, Wiser, R, Feldman, D, & Ong, S. (2012). Benchmarking Non-Hardware Balance-of-System (Soft) Costs for US Photovoltaic Systems Using a Bottom-Up Approach and Installer Survey: Golden, CO: National Renewable Energy Laboratory. Berkeley, CA: Lawrence Berkeley National Laboratory.
Coyle, Eugene D. and Simmons, Richard A. (2014). Understanding the Global Energy Crisis G.
P. R. Institute (Ed.) Drury, Easan, Brinkman, Greg, Denholm, Paul, Margolis, Robert, & Mowers, Matthew. (2012).
Exploring large-scale solar deployment in DOE's SunShot Vision Study. Paper presented at the Photovoltaic Specialists Conference (PVSC), 2012 38th IEEE.
Energy.gov. (2013). Retrieved March 17, 2014, from http://energy.gov/eere/sunshot/mission Goodrich, Alan, James, Ted, & Woodhouse, Michael. (2012). Residential, commercial, and
utilityscale photovoltaic (PV) system prices in the United States: current drivers and cost-reduction opportunities. Contract, 303, 275-3000.
Holdren, JohnP. (1991). Population and the energy problem. Population and Environment, 12(3),
231-255. doi: 10.1007/BF01357916 Kuiper, James, Ames, Daniel P, Koehler, Dave, Lee, Randy, & Quinby, Ted. (2013). Web-Based
Mapping Applications for Solar Energy Project Planning. Maxwell, E, R. George, and S. Wilcox. (1998). A Climatological Solar Radiation Model. Paper
presented at the American Solar Energy Society, Alburquerque NM. Nichols, Will. (2014). IEA: Expanding wind and solar power does not mean additional costs.
Retrieved March 19, 2014, from http://www.businessgreen.com/bg/analysis/2331389/iea-expanding-wind-and-solar-power-does-not-mean-additional-costs
NREL. (2013). Solar Maps. Retrieved November 7, 2013, from
http://www.nrel.gov/gis/solar.html Tomlin, Dana C. (1990). Geographic information systems and cartographic modeling.