Embed Size (px)
Citation preview
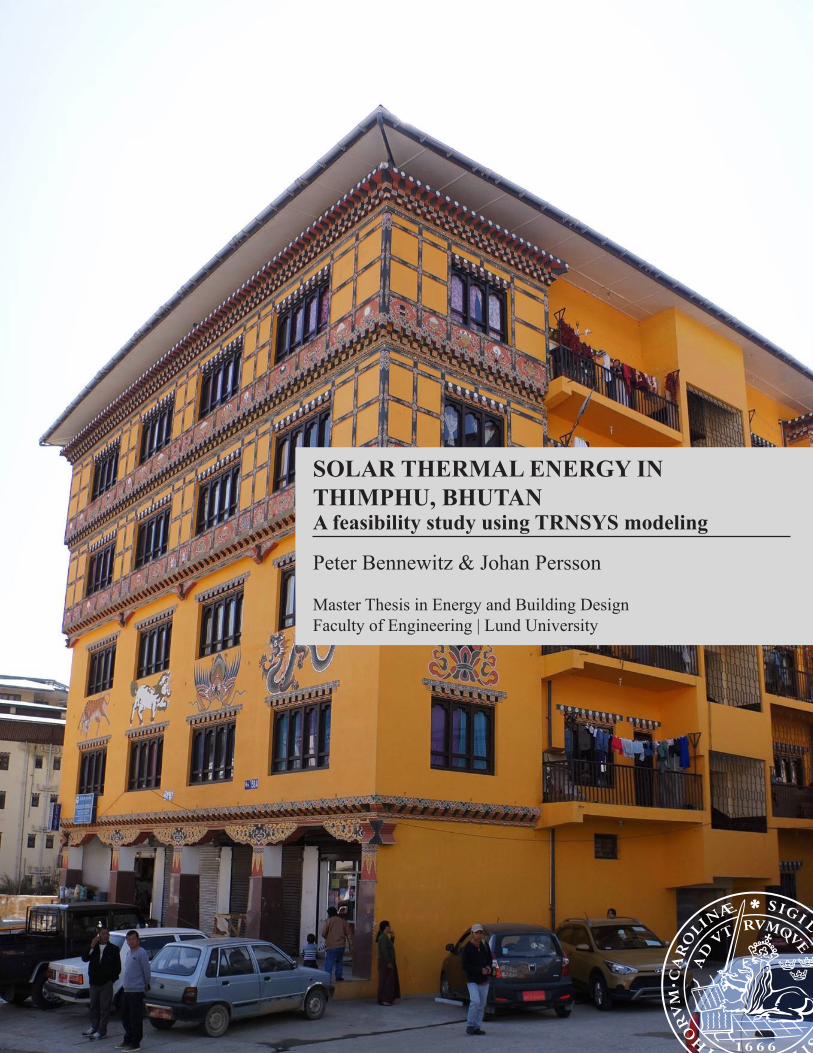
SOLAR THERMAL ENERGY IN THIMPHU, BHUTANA feasibility study using TRNSYS modeling
Peter Bennewitz & Johan Persson
Master Thesis in Energy and Building DesignFaculty of Engineering | Lund University
2
Abstract
Bhutan is one of the highest per capita users of firewood in the world. Firewood and electricity
are the most common methods for heating in Bhutan and both methods suffer from drawbacks.
Bhutan’s capitol, Thimphu, lies some 2500 meters above sea level and has cold winters with
clear skies. These facts are the base for this report’s investigation of the potential to use solar
thermal energy to mitigate the use of firewood and electricity for heating.
Fieldwork and interviews were carried out in areas in and around Thimphu. Two models were
made; one for a typical rural house, heated with firewood, and one for a typical urban apartment
complex, heated with electricity.
The rural house was modeled as a two story building with one family living on each floor. The
urban apartment complex was modeled as a four story building with four apartments on each
floor for a total of 16 families living in the building.
These models were input into the simulation program TRNSYS. A solar thermal system was
optimized for each house based on performance while trying to keep the system as small as
possible. The effects of this system on the comfort and energy consumption in the rural and
urban model were noted.
In the rural case a solar thermal system with a solar collector area of 15 m2 and a tank volume of
0.65 m3 decreased the firewood usage over a year with 50 % while increasing the comfort level.
In the urban case a solar thermal system with a solar collector area of 20 m2 and 0.8 m3 per floor,
i.e. 5 m2 and 0.2 m3 per apartment, decreased the use of the electric heater with 44 % while
increasing the comfort.
Several variations to the system and mode of heating were tested and are detailed in the report.
It was found that a solar thermal system has a high potential of heating houses in the Thimphu
area. The main obstacle for implementing a solar thermal system is its cost.
Keywords: Solar thermal energy, solar thermal system, TRNSYS, Bhutan, Thimphu, domestic
heating.

3
Acknowledgement
We would like to thank our supervisors Henrik Davidsson and Tshewang Lhendup. Both were
beyond helpful and made it possible, not only for us to go to Bhutan, but for this report to come
to fruition. We had a great time working together with you both even if Henrik sometimes did
more chatting than supervising.
A special thanks to all the students at the College of Science and Technology in Phuntsholing for
being good hosts and making us feel welcome in your strange chili-filled land.
Social aspects are complicated to investigate which is why we had an extra supervisor who is an
expert in this field, namely Pia Otte at the Center for Rural Research in Trondheim. Otte was
available to answer any questions that arose concerning social aspects for which we are grateful.
4
Table of Contents Abstract ......................................................................................................................................................... 2
Acknowledgement ........................................................................................................................................ 3
1. Background ............................................................................................................................................... 6
1.1 Overall goals and Research questions .......................................................................................... 7
1.2 Structure ............................................................................................................................................. 8
1.3 Limitations ........................................................................................................................................... 8
1.4 Literature Study .................................................................................................................................. 8
2. Theory ..................................................................................................................................................... 11
2.2 Climate .............................................................................................................................................. 11
2.3 Building Standard .............................................................................................................................. 11
2.4 Solar thermal systems ....................................................................................................................... 12
2.5 Social aspects .................................................................................................................................... 13
2.6 Interviews .......................................................................................................................................... 13
2.7 TRNSYS .............................................................................................................................................. 15
3. Method ................................................................................................................................................... 16
3.2 Fieldwork ........................................................................................................................................... 16
3.3 Weather file ...................................................................................................................................... 17
3.4 TRNSYS .............................................................................................................................................. 18
3.5 Internal heat gains ............................................................................................................................ 22
3.6 Models .............................................................................................................................................. 23
3.6.1 Rural house ................................................................................................................................ 23
3.6.2 Urban house ............................................................................................................................... 27
3.7 Infrared imaging ................................................................................................................................ 31
3.9 Parameter study ................................................................................................................................ 32
3.9.1 Setpoints .................................................................................................................................... 35
3.9.2 Table columns ............................................................................................................................ 35
3.9.3 Heating ....................................................................................................................................... 36
3.9.4. Rural house heating control ...................................................................................................... 36
4 Results .................................................................................................................................................. 38
4.1 Rural house parameter study ........................................................................................................... 38
4.2 Urban house parameter study .......................................................................................................... 58
5
4.3 Payback ............................................................................................................................................. 70
5. Discussion ............................................................................................................................................... 73
5.1 Fault sources in models and simulations .......................................................................................... 74
5.2 Different systems .......................................................................................................................... 75
5.2.1 Limitations .................................................................................................................................. 75
5.2.2 Rural ........................................................................................................................................... 75
5.2.4 Domestic hot water use ............................................................................................................. 77
5.2.5 Insulation ................................................................................................................................... 77
5.2.7 Rural variation of auxiliary heater ............................................................................................. 79
5.2.8 Urban variation of auxiliary heater ............................................................................................ 79
6. Conclusion ............................................................................................................................................... 80
7 Suggestions for future work ..................................................................................................................... 82
8. References .............................................................................................................................................. 83
6
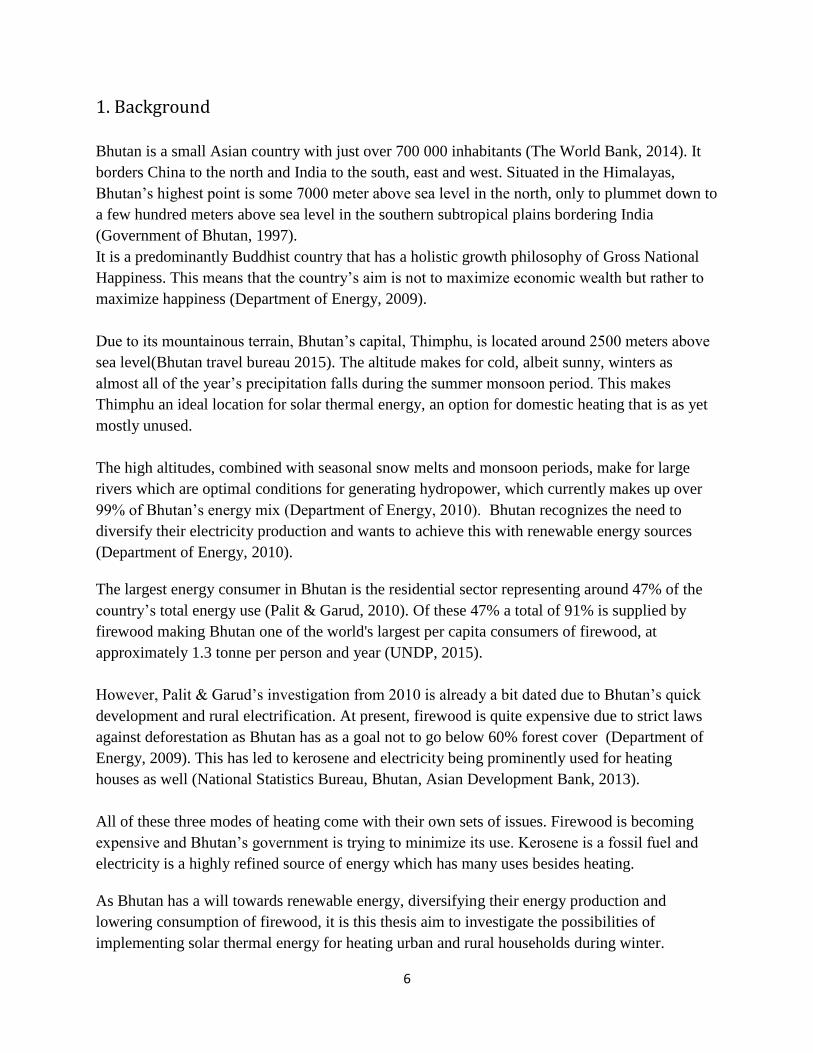
1. Background
Bhutan is a small Asian country with just over 700 000 inhabitants (The World Bank, 2014). It
borders China to the north and India to the south, east and west. Situated in the Himalayas,
Bhutan’s highest point is some 7000 meter above sea level in the north, only to plummet down to
a few hundred meters above sea level in the southern subtropical plains bordering India
(Government of Bhutan, 1997).
It is a predominantly Buddhist country that has a holistic growth philosophy of Gross National
Happiness. This means that the country’s aim is not to maximize economic wealth but rather to
maximize happiness (Department of Energy, 2009).
Due to its mountainous terrain, Bhutan’s capital, Thimphu, is located around 2500 meters above
sea level(Bhutan travel bureau 2015). The altitude makes for cold, albeit sunny, winters as
almost all of the year’s precipitation falls during the summer monsoon period. This makes
Thimphu an ideal location for solar thermal energy, an option for domestic heating that is as yet
mostly unused.
The high altitudes, combined with seasonal snow melts and monsoon periods, make for large
rivers which are optimal conditions for generating hydropower, which currently makes up over
99% of Bhutan’s energy mix (Department of Energy, 2010). Bhutan recognizes the need to
diversify their electricity production and wants to achieve this with renewable energy sources
(Department of Energy, 2010).
The largest energy consumer in Bhutan is the residential sector representing around 47% of the
country’s total energy use (Palit & Garud, 2010). Of these 47% a total of 91% is supplied by
firewood making Bhutan one of the world's largest per capita consumers of firewood, at
approximately 1.3 tonne per person and year (UNDP, 2015).
However, Palit & Garud’s investigation from 2010 is already a bit dated due to Bhutan’s quick
development and rural electrification. At present, firewood is quite expensive due to strict laws
against deforestation as Bhutan has as a goal not to go below 60% forest cover (Department of
Energy, 2009). This has led to kerosene and electricity being prominently used for heating
houses as well (National Statistics Bureau, Bhutan, Asian Development Bank, 2013).
All of these three modes of heating come with their own sets of issues. Firewood is becoming
expensive and Bhutan’s government is trying to minimize its use. Kerosene is a fossil fuel and
electricity is a highly refined source of energy which has many uses besides heating.
As Bhutan has a will towards renewable energy, diversifying their energy production and
lowering consumption of firewood, it is this thesis aim to investigate the possibilities of
implementing solar thermal energy for heating urban and rural households during winter.
7
1.1 Overall goals and Research questions This master thesis’ aim is to make a feasibility study of using solar thermal energy for heating in
Bhutan, specifically, in and around the capital Thimphu. To this end, the modeling program
TRNSYS will be used. In this program a model for a typical urban apartment complex and a
model for a typical rural house, will be constructed. These models will then be used for a
parameter study.
To acquire the input for modeling these buildings, fieldwork will be carried out in and around the
capital, Thimphu. This fieldwork will consist of visiting both rural and urban houses. In the
method further below is a detailed description of what information was gathered from each visit.
The overall research questions for this thesis were as follows:
How much of the supplied fuel used for residential heating could be replaced or mitigated
with a solar thermal system of varying sizes?
Which parameters make for an optimal solar thermal system in this specific case?
Optimal here meaning most heat for the lowest cost.
In and around Thimphu, how much heating would such a solar thermal system provide
for a residential building during a year?
If a solar thermal system was in place, how would it impact the comfort level of the
residents?
8
1.2 Structure This report is structured in a way that might be perceived as unusual. The method describes how
the fieldwork and interviews were carried out and this is then the basis for the results. In the
results a model is made from the observations made in the method, as well as being based on
literature. This model is then used to make the parameter studies and simulations that answer the
questions posed in section 1.1 above.
The reason for this is because there was no ready model to be used and little to no data to base it
on. The data collection, the analysis of that data and the models based on it are made from
scratch which can give a fractured appearance.
1.3 Limitations Because a limited amount of time was spent in Bhutan, only a few interviews and field studies
were conducted. In total seven interviews were made and seven different households were
measured.
The climate data for Thimphu used in this report is only for a single year.
The economic calculations in this report are limited. This is both due to lack of time and lack of
information available on pricing of solar thermal systems in Bhutan. Furthermore there were no
estimations made on the electricity use of the pumps in the solar thermal system.
1.4 Literature Study
When introducing technological solutions in developing countries it is important to keep social
issues in mind. Solving problems of a technical nature all too often closes other avenues of
thinking. A technical solution might theoretically be able to solve a problem but might not be
viable for social reasons which have nothing to do with said technology. As such, this literature
study aimed to investigate what issues other similar project have had in the past so that their
pitfalls could be avoided.
In Bhutan, the government tried to implement smokeless stoves in an attempt to both lower
firewood consumption and to better the indoor environment among those who used a traditional
stove (Palit, Garud, 2010). The smokeless stove still used firewood but at a higher efficiency and
with a chimney to safely disperse the smoke.
The project was unsuccessful for numerous reasons. The smokeless stove was given away for
free meaning that the families had no sense of ownership. The chimney of the stove was

9
dismantled to be able to dry foodstuffs in the smoke. The firebox was altered in size and so were
the potholes until the smokeless stove more or less resembled the traditional stove it was
supposed to replace (Palit, Garud, 2010).
In Nepal, a study found that the when an abundance of firewood is available the will to use a
more efficient stove, to reduce firewood usage, was low (Pokharel, 2003). If firewood is
available in abundance, as is the case in Bhutan, a costly switch to solar thermal energy for
heating might not be well received.
The same study found that even though Nepal has had clear goals as to its targets regarding
renewable energy, it has not reached those goals. Mainly, this has been due to a lack of
commitment of funds. The issue is further complicated by the 20 organizations involved in
renewable energy promotion. The government itself has 10 agencies handling renewable energy.
These organisations and agencies have overlapping mandates and little coordination and
monitoring (Pokharel, 2003).
In the specific cases of solar water heating and solar electricity, both were, when Pokharel
published his report in 2003, too expensive to be implemented. Of these two systems, solar water
heating was the most promising in terms of mitigating fuel use such as firewood and kerosene etc
(Pokharel, 2003).
Both solar systems suffered from a lack of knowledge and support when it came to maintenance.
This made the solar water heating systems lose efficiency over time. The photovoltaic systems
also lost efficiency, furthermore, some users suffered from acid burns when handling the
batteries due to a lack of knowledge (Pokharel, 2003).
Efficient stoves have been introduced but a few complications have been found in their use. The
firewood used in the efficient stoves have to be dry and the pieces have to be small making it
harder to collect, store and prepare firewood properly. It was also found that, when the smoke
from the efficient stove was diverted through a chimney, the wooden houses in Nepal suffered
from an increased frequency of termite problems (Pokharel, 2003).
In a report about the potential of solar water heating in India, four main benefits with solar water
heating was pointed out. First, the system is easy to construct and install. Second, it has small
maintenance costs. Third, the system can be retrofitted to existing houses without needing
additional space. Fourth and finally, the system doesn’t generate any local pollution. (Purohit,
Michaelowa, 2008).
Despite these benefits, the amount of solar water heating installed in India at the time the article
was written had not met the expected goals the government had predicted. The article states that
this is due to high upfront costs combined with a lack of knowledge as to the eventual
economical benefits of solar water heating over the system’s lifetime. Other than these factors,
the article states that banks were unwilling to provide financing (Purohit, Michaelowa, 2008).

10
A study was made on the social acceptance and use of solar heating in Mexico City. In Mexico
City solar heating is mainly used for heating swimming pools as well as heating water to higher
temperatures for use in hospitals, industrial processes etc (Mallet, 2007).
The study found that there was limited awareness about solar heating among people who might
benefit from using it in Mexico City. Furthermore there were many examples of people who
were unwilling to use solar heating technology due to the fact that they did not understand how it
worked or trust that it did. Some potential users pointed out the fact that there were no trial
periods where they could try out solar technology for a while without making a big investment as
a reason for being reluctant towards solar technology. Another factor that affected the views on
solar heating technology was that there were no major solar heating distributors in Mexico City.
Instead a large number of smaller companies distributed the solar heating technology and these
distributors therefore had less resources to put into raising awareness about solar heating
technology than a single or a few larger solar heating companies would have (Mallet, 2007).
The literature study showed that solar thermal systems have the potential to be profitable.
However it also showed that when firewood is abundant a switch from firewood to a more
expensive system can be difficult. There are also many obstacles to consider, such as people
being reluctant to make the change due to lack of knowledge of the system which in turn leads to
a lack of trust that it will work.
Much of this will not be of relevant for this study since nothing will be physically implemented.
That being said, keeping social issues in mind while doing theoretical work makes that work
more relevant for future use.
11
2. Theory
2.2 Climate Though Bhutan is geographically a small country, it consist of several different climate zones. In
the capital and largest city, Thimphu, winters are cold with temperatures that can reach below
freezing, making domestic heating a necessity. Contrary to Thimphu the average day
temperatures in the country’s second largest city Phuentsholing usually stay above 12 °C even
during winter and the city's annual average temperature is around 19 °C (NASA, 2016). The
reason for the great variation in climate is the altitude differences within Bhutan. Thimphu lies
2500 meters above sea level whereas Phuntsholing is just 300 meters above sea level (Bhutan
travel bureau, 2015).
As this report aims to look at solar thermal energy as a source of domestic heating, Thimphu was
chosen. Solar thermal energy could be viable in other parts of Bhutan as well but in the southern
regions it would more likely be used for domestic hot water.
2.3 Building Standard
Although temperatures vary greatly within Bhutan, the houses tend to be similar from region to
region. The exhaustive report “Bhutan Living Standards Survey”, a joint publication by National
Statistics Bureau, Bhutan and Asian Development Bank, indicates that this is so.
The average amount of rooms in a Bhutanese household is 3, excluding bathrooms and kitchens.
The average number of residents per household is 4,5.
Dwellings in urban areas are most often constructed with cement-bonded bricks whereas the
most common material in rural houses is mud-bonded bricks. Both types of houses, regardless of
geographical location within Bhutan, lack insulation.
Throughout Bhutan, both urban and rural areas, nine out of ten households have metal-sheet
roofs. Floors in rural areas are most often built from wooden planks while in urban areas,
concrete floors are more common.
92% of households throughout Bhutan have access to electricity, electrification being almost
100% in urban areas. Electricity is the main energy source for both lighting and cooking in both
urban and rural areas. However, in rural households, 49% still use wood for cooking.
In urban areas electric heaters is the most common method of heating whereas the bukhari,
which is a small metal stove fed with firewood, is most often used in rural areas. Other methods
of heating include kerosene. Both kerosene and firewood might be used in combination with an
electric heater (National Statistics Bureau, Bhutan, Asian Development Bank, 2013).
From the Bhutan Living Standards Survey the conclusion can be drawn that even though
Thimphu has a need for heating during the cold winter months, the houses there are not
constructed differently from warmer regions, something that was observed during the fieldwork.
12
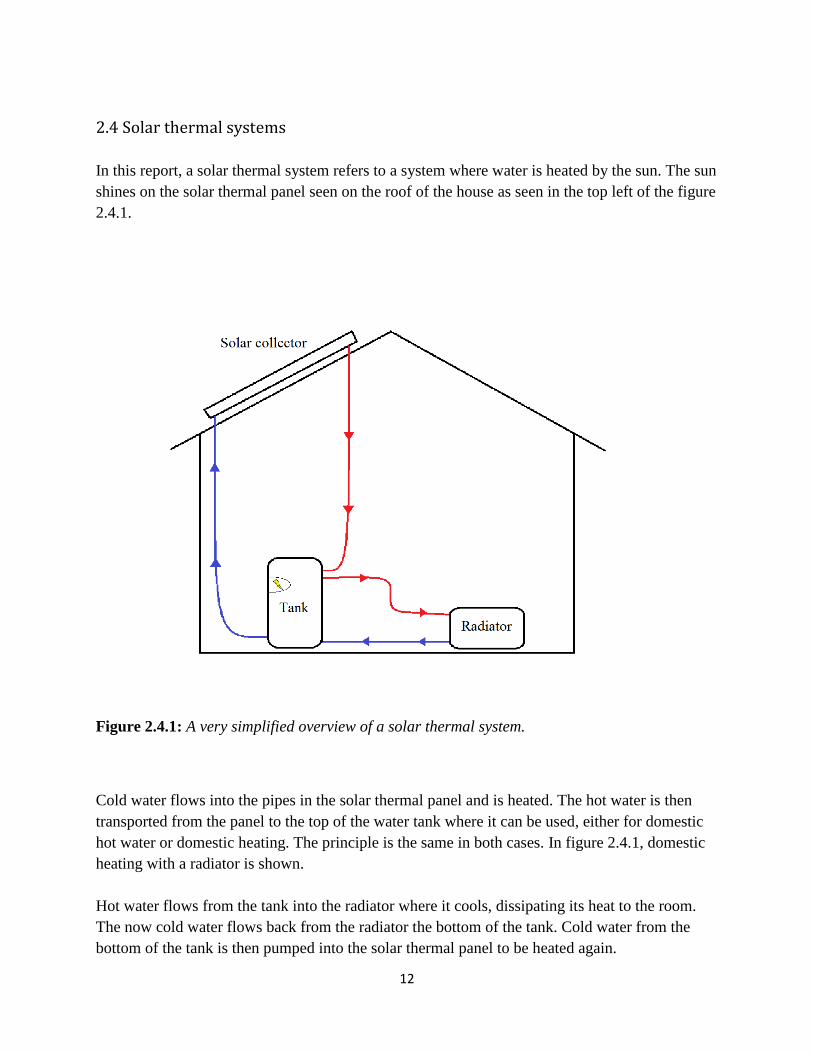
2.4 Solar thermal systems
In this report, a solar thermal system refers to a system where water is heated by the sun. The sun
shines on the solar thermal panel seen on the roof of the house as seen in the top left of the figure
2.4.1.
Figure 2.4.1: A very simplified overview of a solar thermal system.
Cold water flows into the pipes in the solar thermal panel and is heated. The hot water is then
transported from the panel to the top of the water tank where it can be used, either for domestic
hot water or domestic heating. The principle is the same in both cases. In figure 2.4.1, domestic
heating with a radiator is shown.
Hot water flows from the tank into the radiator where it cools, dissipating its heat to the room.
The now cold water flows back from the radiator the bottom of the tank. Cold water from the
bottom of the tank is then pumped into the solar thermal panel to be heated again.
13
The colder the water that flows into the panel, the higher the efficiency of that panel. That is why
it’s important that the tank is stratified, i.e. hot water at the top and cold at the bottom.
Often the tank is equipped with an auxiliary heater. The auxiliary heater is located somewhere
near the top of the tank and is an electric heater. It is marked with a yellow lightning in the top
left of the tank in figure 2.4.1. When the tank does not receive enough heat from the solar
thermal panel to maintain the temperature it is set to keep, its setpoint, the auxiliary heater starts
up (Andrén 2015).
2.5 Social aspects As the aim of this report is to make a feasibility study that is as complete as possible of a solar
thermal system in Thimphu, social aspects have to be taken into account. In the context of this
report social aspects refer to issues not inherent to the technology behind a solar thermal system
but that might still influence its implementation.
One such social aspect is at what time during the day firewood, kerosene or electricity sees most
use, what the fuels are used for at those times and how intensely. If for example firewood is used
for cooking then no matter how much heat a solar thermal system is able to provide, it won’t
mitigate that firewood use. The same is true for kerosene which might be used for cooking as
well. This could limit the reduction in these fuels after a solar thermal system has been installed.
Another aspect that could affect the heating is which parts of the house that are heated and when.
If just one room is heated or if all rooms are heated that will impact how heat is spread through
the building which will have to be taken into account in the model.
Perceived aesthetics can also play a role. Perhaps solar thermal panels on the roof is seen as ugly,
then again, the reverse might also be true as the panels are expensive and might be seen as a
status symbol.
To try and get answers to the concerns mentioned above, aside from doing a literature study,
interviews were conducted with the residents of each household that was visited during the field
studies.
2.6 Interviews
When interviewing someone there are a number of things to take into consideration. Interviews
are done to gather information but that information will be colored by the interviewee’s opinion.
Even when asking questions for straight facts, such as the amount of firewood used in winter, it
might be hard for the interviewee to give a response that the interviewer can quantify as the
answer will not be in kJ/h. The interviewer's own judgement will have to be used when sifting
through the information received and this too will color the data. It is therefore important to be as
objective as possible while still treating the interviewee with all due respect.
14
In this report a semi-qualitative interview approach was chosen. A qualitative interview is one
where the interviewer tries to find out what kind of relation the interviewee has to the subject in
question rather than trying to get them to give specific statistical answers (Kvale & Brinkmann,
2009). In this case, the qualitative part refers to us wanting to know how heating is used in
winter, not just how much. Which parts of the house or apartment is heated and at what times?
How does the interviewee feel about solar thermal energy?
Questions such as these, although not always of immediate use to the model, make all the
difference as they will let us assess the actual real world implications in regards to how easy or
difficult it would be to implement solar thermal energy in Bhutan.
On the other hand certain specifics such as how much firewood, kerosene and electricity is used
in winter, have to be known. Therefore the method of interviewing will be semi-qualitative as
both types of information are relevant.
Furthermore it was always made clear that this was a master project thesis so that there was no
risk of people mistaking us for representatives of an NGO or a company. Greeting phrases in the
local language Dzongkha were learned to show respect and politeness to the interviewees.
When conducting the interviews the basic ethical guidelines regarding interviewing such as
informed consent, confidentiality and protection from any harm, were followed. The names of
the interviewees will not be found anywhere in this report, neither will the transcriptions of the
interviews themselves. This is to make certain that there will be no consequences for the
interviewees for their participation, however unlikely in this case.
No monetary payment was offered to the interviewees as this might have jeopardized the
trustworthiness of the interviews. The interviewees might then have felt pressed to give answers
they thought the interviewer wanted to hear (Seidman, 2013).
To prepare for the interviews the seven steps of interview inquiry detailed in Kvale and
Brinkmann’s 2009 book “Interviews: Learning the Craft of Qualitative Research Interviewing”
was used. The steps are: 1. Thematizing 2. Designing 3. Interviewing 4. Transcribing 5.
Analyzing
6. Verifying 7. Reporting. For a more detailed account of these steps refer to the book.
The interviews were based on the following questions but follow-up questions and other avenues
of inquiry were pursued as the interviews progressed.
15
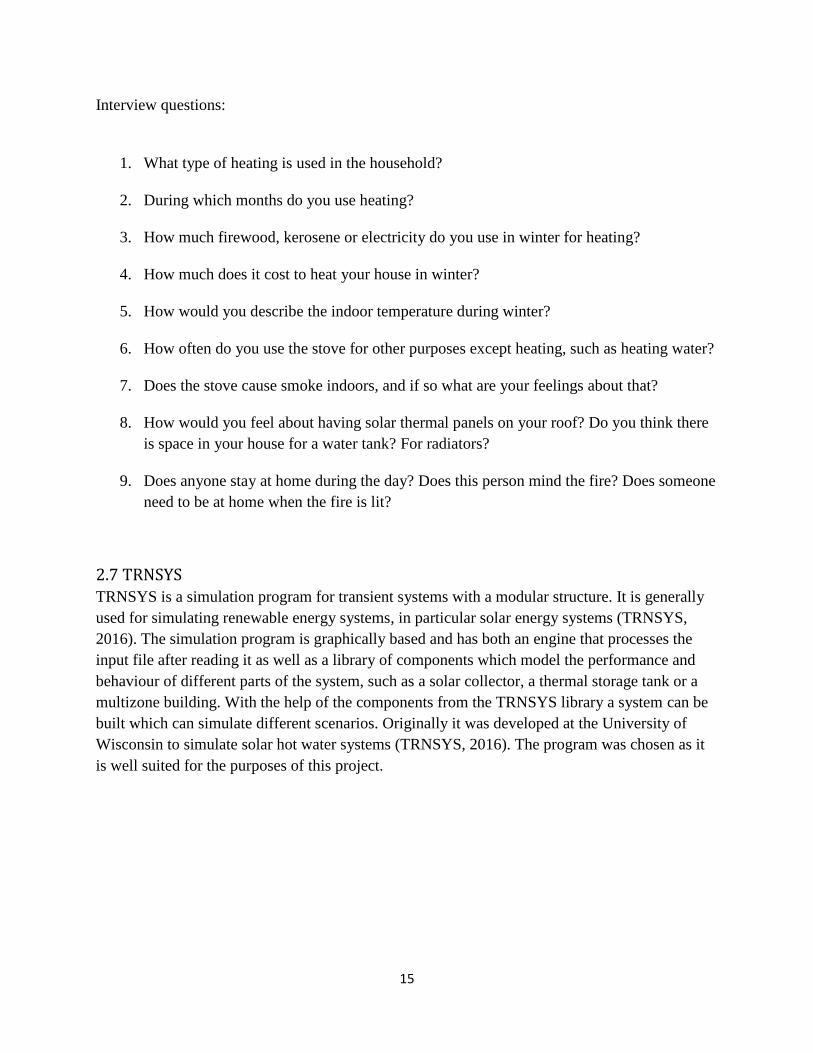
Interview questions:
1. What type of heating is used in the household?
2. During which months do you use heating?
3. How much firewood, kerosene or electricity do you use in winter for heating?
4. How much does it cost to heat your house in winter?
5. How would you describe the indoor temperature during winter?
6. How often do you use the stove for other purposes except heating, such as heating water?
7. Does the stove cause smoke indoors, and if so what are your feelings about that?
8. How would you feel about having solar thermal panels on your roof? Do you think there
is space in your house for a water tank? For radiators?
9. Does anyone stay at home during the day? Does this person mind the fire? Does someone
need to be at home when the fire is lit?
2.7 TRNSYS TRNSYS is a simulation program for transient systems with a modular structure. It is generally
used for simulating renewable energy systems, in particular solar energy systems (TRNSYS,
2016). The simulation program is graphically based and has both an engine that processes the
input file after reading it as well as a library of components which model the performance and
behaviour of different parts of the system, such as a solar collector, a thermal storage tank or a
multizone building. With the help of the components from the TRNSYS library a system can be
built which can simulate different scenarios. Originally it was developed at the University of
Wisconsin to simulate solar hot water systems (TRNSYS, 2016). The program was chosen as it
is well suited for the purposes of this project.
16
3. Method
3.1 Overview
The project started with a literature study and with preparing the TRNSYS model used to
simulate the solar thermal system. This was done before arriving in Bhutan.
Upon arrival in Bhutan, the fieldwork started. The buildings that were investigated during the
fieldwork were typical residential houses both in rural areas outside Thimphu and typical urban
apartment buildings inside Thimphu.
When this information had been gathered, two models, one for an urban house and one for a
rural house, were made and input into TRNSYS. With the help of TRNSYS, the solar thermal
energy system was optimized by adjusting the dimensions of the solar collector, the thermal
storage tank and the water flow from the solar collector to the thermal storage tank.
3.2 Fieldwork
During the fieldwork the following equipment was used: measuring tape for measuring walls,
windows and doors, a compass for measuring the direction of the windows, a camera, an IR
camera for taking heat flow pictures of doors, window frames and walls, a hygrometer for
measuring the temperature and relative humidity inside and outside and a dictaphone for
recording the interviews conducted with the residents of the house.
Seven houses were investigated, two urban houses in Thimphu which also had blueprints
available, four rural houses in the outskirts of Thimphu and one house which could be seen as a
combination of a rural and an urban house.
The four rural houses differed in some ways but there were many similarities and general
conclusions that could be drawn from examining them.
During the fieldwork of the rural houses both inner and outer walls as well as windows and doors
were measured. The material composition of each structural component was noted. The inner
walls were measured. The doors, windows and outer walls were measured so that the U-value of
the walls, including windows and doors, could be input into the model. The direction of the
windows was noted to see how much heat gain there was from solar radiation through the
windows. It was also noted that all windows were single paned.
Pictures were taken with the regular camera both inside and outside so that one could get a
general idea and overview of the house. Pictures were also taken with the IR camera to get
qualitative information regarding the infiltration and heat loss through doors, walls and window
frames.
The number of residents living in each house was noted as well as the electrical appliances to try
to quantify the sensible heat gain.
17
The interviews with the residents of the different houses were recorded to assure that none of
the information they gave was forgotten or lost. The use of heating during winter, type of fuel
and amount of heat, was the main purpose of these interviews.
The urban houses included one four-story apartment complex housing 16 families and a smaller
three-story building housing three families. The fieldwork done on the urban houses differed in
some ways from that done on the rural houses. The urban houses had blueprints so no measuring
of the walls or direction of the windows were needed. Instead photocopies were taken of the
blueprints for later use. This was followed by an interview of the residents recorded with the
dictaphone where questions regarding the heating of the house were asked, similar to the
interviews done with the residents of the rural houses.
3.3 Weather file
The TRNSYS library for weather files, Meteonorm, has weather data for many regions of the
world. Unfortunately weather data was not available for Thimphu, Bhutan. Since a weather file
is essential for making any kind of simulation, one had to be created for this study.
Weather data for the area around the capital of Bhutan, Thimphu, was acquired from the
Meteorology Section, HMSD in Thimphu. The data acquired gave hourly values for the solar
radiation, maximum, minimum and average ambient temperature for that hour, relative humidity,
wind speed, both from the year 2009 and 2010. Furthermore data of the daily maximum and
minimum ambient temperature in Thimphu from the year 1996 to the year 2012 was also from
Meteorology Section, HMSD in Thimphu.
The hourly values from the year 2009 and 2010 were unfortunately not complete. Of the two, the
file from 2009 was the most complete and as such was used as the basis for making a complete
file containing the weather data for a whole year in Thimphu.
Some hourly values were missing, typically the values during the night from 23 pm in the
evening to 6 pm in the morning. This meant that the weather files was more or less complete in
terms of the values for solar radiation since the daytime hours, when the sun was up, almost
always had values. Relative humidity does not have a great impact on the amount of heating
needed so for hours missing values for relative humidity, the relative humidity was assumed to
be the same as the last known value. The same was done for the wind speed even though it has a
bigger impact on heating.
The missing values of the ambient temperature were estimated by interpolating between the
value of the ambient temperature at 23 pm to the minimum temperature the next day around 4-5
am from the file with daily maximum and minimum values to the known value of the ambient
temperature at 6 am. In some rare instances values were missing at other hours than during the
18
night, in those cases the solar radiation was estimated by interpolating between known values of
solar radiation as well as by looking at known values of the solar radiation at days similar to the
one looked at in terms of date, rainfall and relative humidity. The month of December in the
2009 file was missing a lot of values whereas it was almost complete in the 2010 file, therefore
instead of trying to interpolate the values of the ambient temperature and the solar radiation with
the help of only a few measuring points in the 2009 file, the weather data from 2010 for
December was used when creating the weather file for Thimphu. Furthermore the month of May
had such few values in both the 2009 and 2010 file that two different standard days in May were
made as there was one day that was almost complete in the 2009 file and one in the 2010 file.
The values for the month of May are thus not completely satisfactory. Approximately 30-35% of
the ambient temperature values were estimated and around 5% of the solar radiation values.
3.4 TRNSYS
Below follows a brief description of how the TRNSYS deck was constructed. A model in
TRNSYS is called a deck.
The mathematical components in the TRNSYS library are called types and are identified by their
unique alpha numeric tag. The types are preprogrammed packages representing things like solar
thermal collectors, water tanks and pumps. These have different parameters as well as inputs and
outputs. A parameter is a value of something, for a water tank for example the volume in m3 is a
parameter that can be changed to fit the situation. An input for a tank could be how much water
flows into the tank but also what temperature that water has. An output would be the opposite i.e.
flow and temperature of water flowing out from the tank. A parameter remains constant when the
simulation is running whereas both inputs and outputs vary.
For instance, the output of a solar thermal collector type, size of water flow and its temperature,
can be connected to a water tank type to heat the tank’s contents. Below is a table briefly
describing the most important types that were used as well as their defining parameters, inputs
and outputs.
Table 3.4.1 shows in its left column the type and how it looks in TRNSYS. The middle column
describes the types function and the right column describes how the type was used in this reports
system and what parameter was important in that system.
19
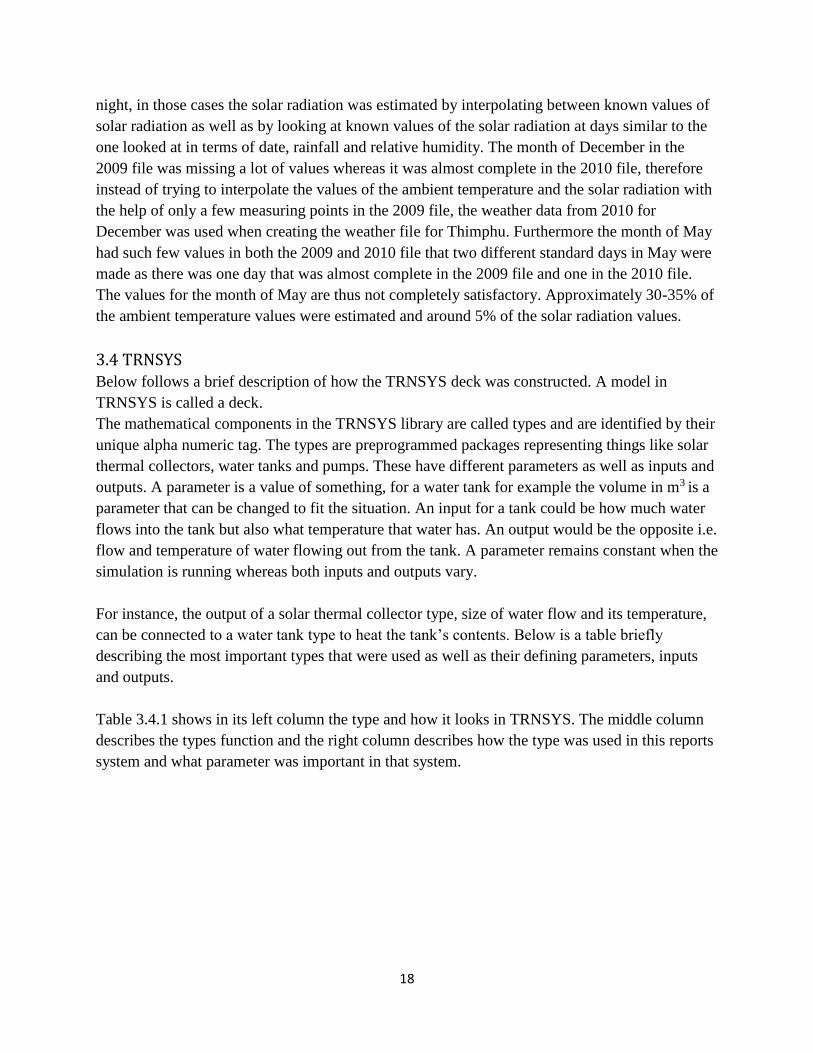
Table 3.4.1: The left column shows the type. The middle column describes how the type works.
The right column describes how the type was used in this report’s TRNSYS deck.
Type Function In this reports model
This type represents a solar thermal
collector. It takes as its inputs solar
radiation and flow and temperature
of water. The type calculates the
heat change in the water and then
outputs the same flow but at a
different temperature.
The water that flows out from the
solar panel flows into the water
tank which in turn directs it to the
heat exchanger which heats the
house.
The most important parameter for
this type is its area. As such, the
area was part of the parameter
study and several different sizes
were tested.
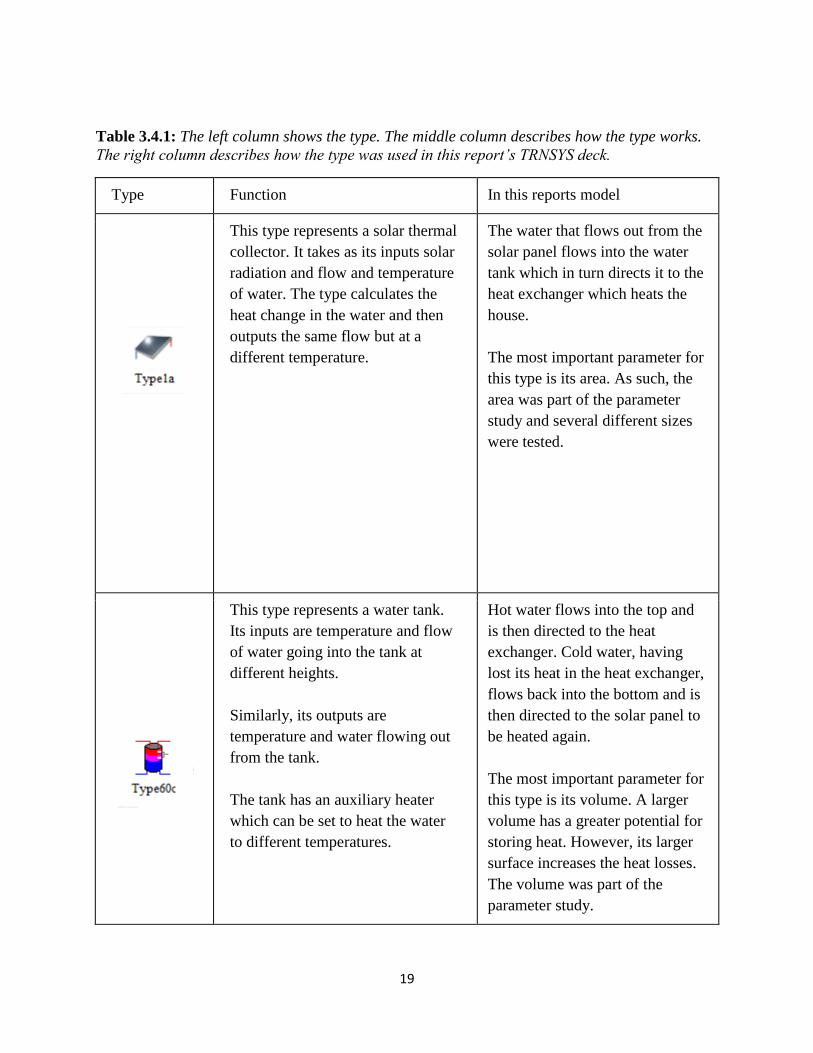
This type represents a water tank.
Its inputs are temperature and flow
of water going into the tank at
different heights.
Similarly, its outputs are
temperature and water flowing out
from the tank.
The tank has an auxiliary heater
which can be set to heat the water
to different temperatures.
Hot water flows into the top and
is then directed to the heat
exchanger. Cold water, having
lost its heat in the heat exchanger,
flows back into the bottom and is
then directed to the solar panel to
be heated again.
The most important parameter for
this type is its volume. A larger
volume has a greater potential for
storing heat. However, its larger
surface increases the heat losses.
The volume was part of the
parameter study.
20
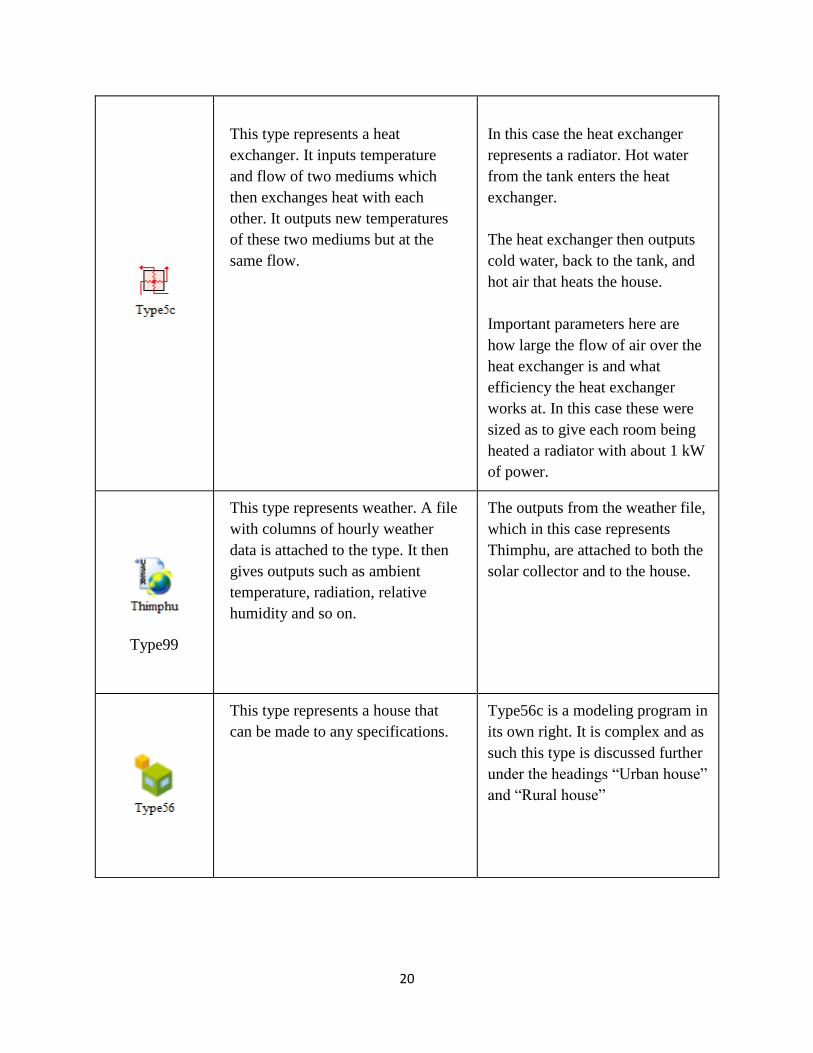
This type represents a heat
exchanger. It inputs temperature
and flow of two mediums which
then exchanges heat with each
other. It outputs new temperatures
of these two mediums but at the
same flow.
In this case the heat exchanger
represents a radiator. Hot water
from the tank enters the heat
exchanger.
The heat exchanger then outputs
cold water, back to the tank, and
hot air that heats the house.
Important parameters here are
how large the flow of air over the
heat exchanger is and what
efficiency the heat exchanger
works at. In this case these were
sized as to give each room being
heated a radiator with about 1 kW
of power.
Type99
This type represents weather. A file
with columns of hourly weather
data is attached to the type. It then
gives outputs such as ambient
temperature, radiation, relative
humidity and so on.
The outputs from the weather file,
which in this case represents
Thimphu, are attached to both the
solar collector and to the house.
This type represents a house that
can be made to any specifications.
Type56c is a modeling program in
its own right. It is complex and as
such this type is discussed further
under the headings “Urban house”
and “Rural house”
21
There are types used that are not included in table 3.4.1. These types represent pumps that are
used to control flows and types that output control signals to turn flows on or off when certain
criteria are fulfilled. These types, while crucial, are not important for a general understanding of
the system.
Connecting a combination of the types described above, three different decks were created in
TRNSYS. These simulated heating of the sitting rooms in a rural Bhutanese house, heating of all
the rooms in a rural Bhutanese house and heating the sitting rooms in an urban Bhutanese
house.
To be able to dimension the solar thermal systems in a reasonable way in the three different
cases a parameter study was conducted where three different parameters were tested. These
parameters were; the flow of water from the solar collector to the thermal storage water tank, the
area of the solar collector and the size of the thermal storage water tank.
To determine which dimensions would be the most suitable four different variables were looked
at during the study: The amount of energy used by the auxiliary heater, the amount of energy
used by the heating systems previously in place, electrical heating in the urban case and heating
by firewood in the rural case, the comfort level reached in the house and lastly how big the actual
system was in terms of solar collector area and tank size.
The size of the systems is proportional to the cost of the system therefore it is preferable to keep
the system as small as possible. Furthermore simulations on further enhancements and changes
on the system were made, these simulations and the results of them are described in greater detail
in the result section of the report.
22
3.5 Internal heat gains
Internal heat gains refer to heat gained from lights and other electrical appliances as well as from
people living in the building.
From the field studies and interviews it was concluded that different households in Bhutan use,
as expected, different amounts of electrical appliances. There are some general things that can be
said about the usage of electrical appliances though. Generally every room in a Bhutanese
household uses a 40W tubelight and a 32W fluorescent light for illumination (Fieldwork, 2015).
Each family usually has a TV in the sitting room. In the kitchen a family commonly has one
water boiler, one rice cooker, one curry cooker and a refrigerator. For large quantities of hot
water, such as for showering or doing dishes, each family has one Geyser. The Geyser is a large
water heater.
In the urban houses some families might also have a laptop or a stationary computer although
this is not universal. In the house models the standard value of heat gains from appliances from
the European Union of 5W/m2 was used (EN 832, 1998). This was chosen after concluding that
residential houses in Bhutan generally have fewer electrical appliances but more people living in
a smaller space compared to Sweden with an average across Bhutan of 1.5 persons/room
(Fieldwork, 2015)(National Statistics Bureau, Bhutan, Asian Development Bank, 2013).
23
3.6 Models
Below are in depth descriptions of how the rural and urban house models were arrived at.
3.6.1 Rural house
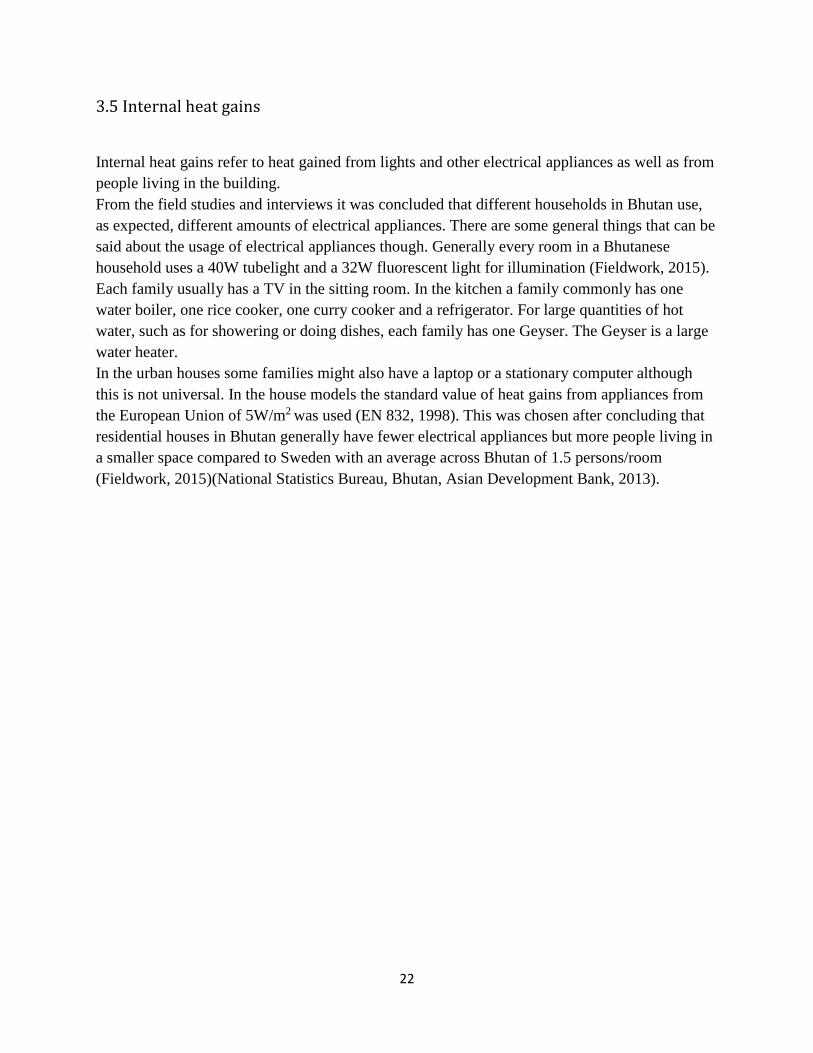
Figure 3.6.1.1: A picture of a rural house taken during the field studies.
In and around Thimphu rural houses are mainly heated with firewood (Fieldwork, 2015)
(National Statistics Bureau, Bhutan, Asian Development Bank, 2013). Often, during winter, only
one room is heated at a time. The room heated is usually the sitting room where people eat and
socialize. Bedrooms are usually not heated since people only spend time there sleeping.
During peak winter the indoor temperature generally does not reach what normally would be
considered a comfortable indoor temperature. The temperature usually only goes up to around 15
°C in the sitting room which usually is the only room heated.
For the simulation of the rural house both heating just the sitting room and heating the whole
house were modeled. The setpoint for the firewood stove, the temperature the stove is set to
keep, was put at 15 °C (Interviews, 2015)(Fieldwork, 2015).
24
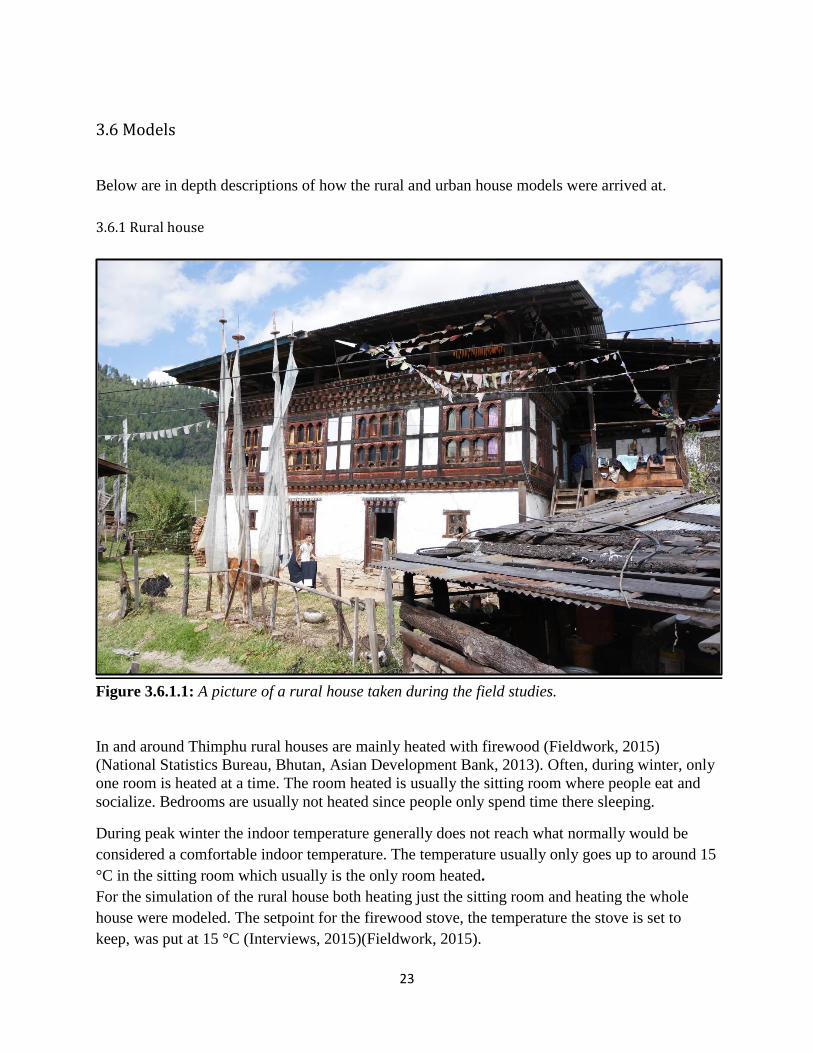
The rural houses usually have two floors, and typically one family would live on each floor
(Fieldwork 2015). Sometimes there would be only one floor where people live and then animals
would live on the ground floor of the house (Fieldwork 2015)(Lhendup 2015). Mud bricks are
made by mud which is then left to dry in the sun.
Houses in Bhutan generally have a small construction built on top of the roof called a Jamthog,
seen in figure 3.6.1.2, used mainly for religious purposes. The Jamthog on the rural houses were
usually made by thin plywood.
Figure 3.6.1.2: The wooden construction on top of this rural house is the Jamthog.
25
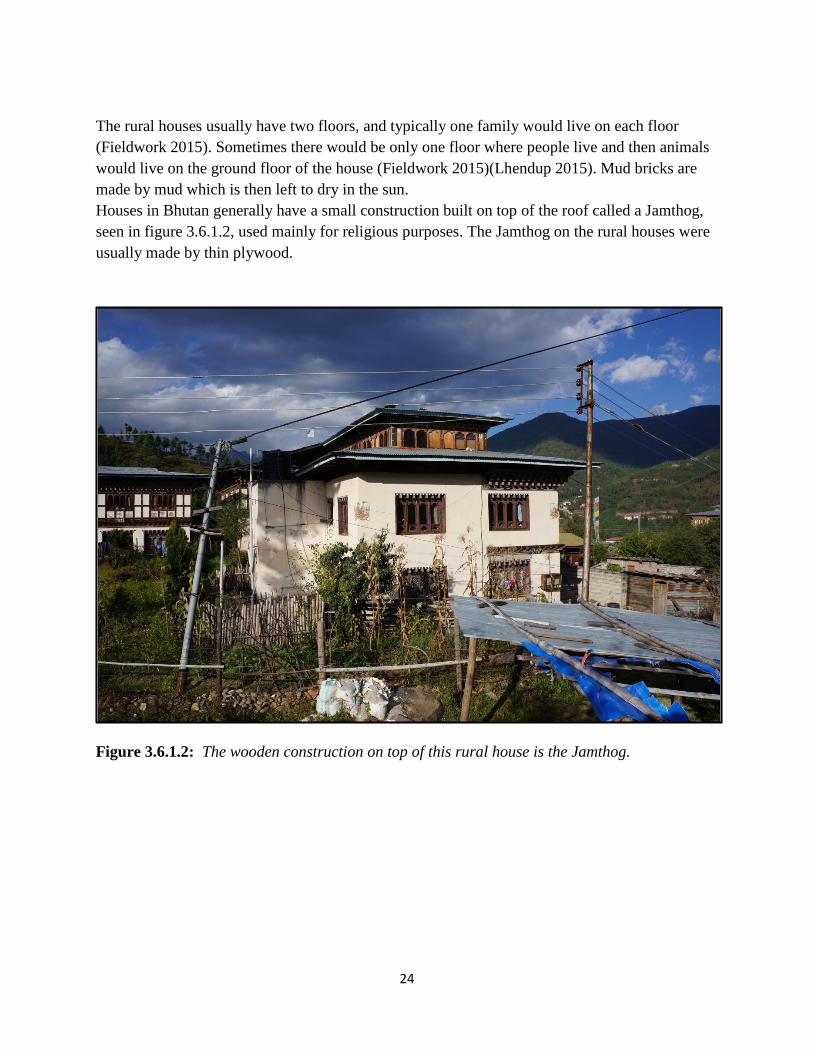
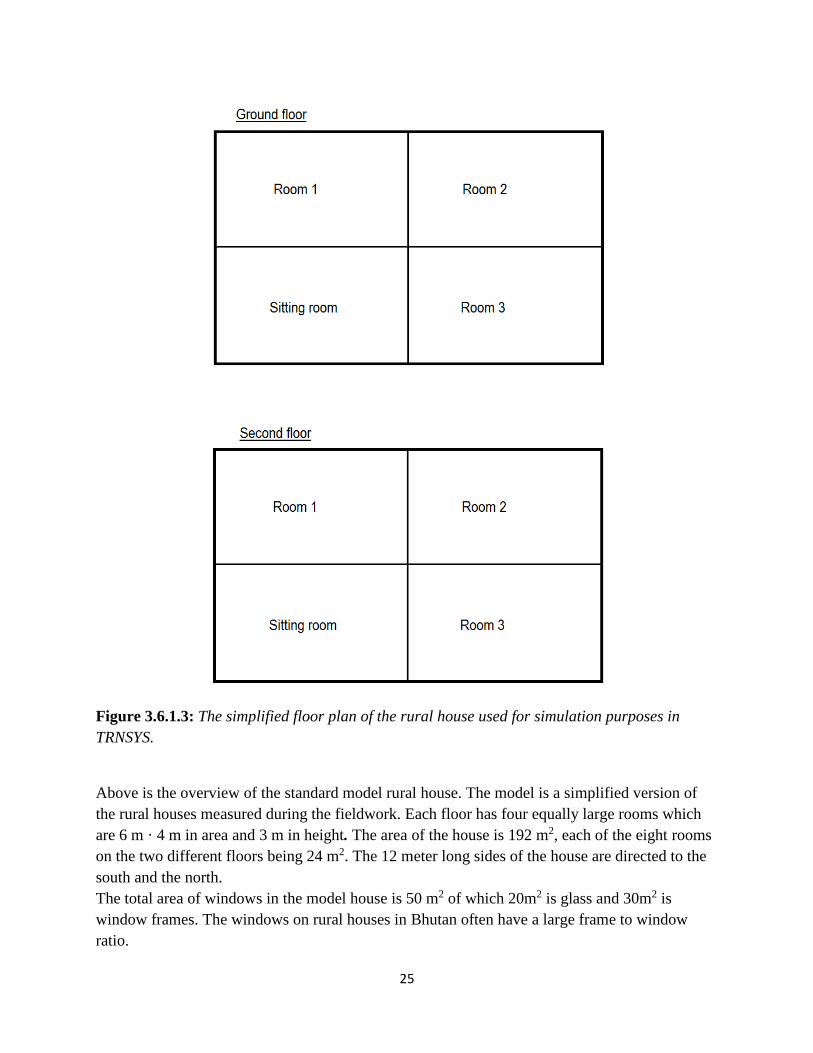
Figure 3.6.1.3: The simplified floor plan of the rural house used for simulation purposes in
TRNSYS.
Above is the overview of the standard model rural house. The model is a simplified version of
the rural houses measured during the fieldwork. Each floor has four equally large rooms which
are 6 m · 4 m in area and 3 m in height. The area of the house is 192 m2, each of the eight rooms
on the two different floors being 24 m2. The 12 meter long sides of the house are directed to the
south and the north.
The total area of windows in the model house is 50 m2 of which 20m2 is glass and 30m2 is
window frames. The windows on rural houses in Bhutan often have a large frame to window
ratio.
26
The windows on the standard model rural house are distributed so that 6.2 m2 of windows are on
each short side on each of the floors and 6.3 m2 of windows are on each of the long sides on each
of the floors. Furthermore the U-values are 0.743 W/m2·K for the outer walls, 2.42 W/m2·K for
the inner walls, 1.737 W/m2·K for the floor, 4.225 W/m2·K for the roof and 5.68 W/m2·K for
the windows. The standard house is modelled so that each floor has internal heat gains
corresponding to 5 W/m2.
5 W/m2 is a European standard for gains in houses, houses in Bhutan generally have less
appliances than houses in the EU but also generally more people living in a smaller space. Thus
5 W/m2 is estimated to be good value for the gains in the rural houses of Bhutan. The doors of
the house were not modelled in the house since their contribution to the heat loss is quite small
and can thus be neglected.
The Jamthog is not included geometrically in the model, but the amount of air infiltration into
the house is modified to represent the fact the Jamthog would be there.
Furthermore for the rural house, the heating of hot water for domestic use was also simulated. In
the situations where hot water is used, 44 kg of 55 °C water is used per day for both floors of the
house. Consequently, 44 kg of 55 °C water is extracted from the tank per day if nothing else is
specified in section 4.1. In cases when the use of the auxiliary heater in the thermal storage tank
is decreased or removed the extraction of water from the tank for domestic hot water use will not
be made since growth of bacteria might occur if there is no possibility to increase the
temperature in the tank with the auxiliary heater.
27
3.6.2 Urban house
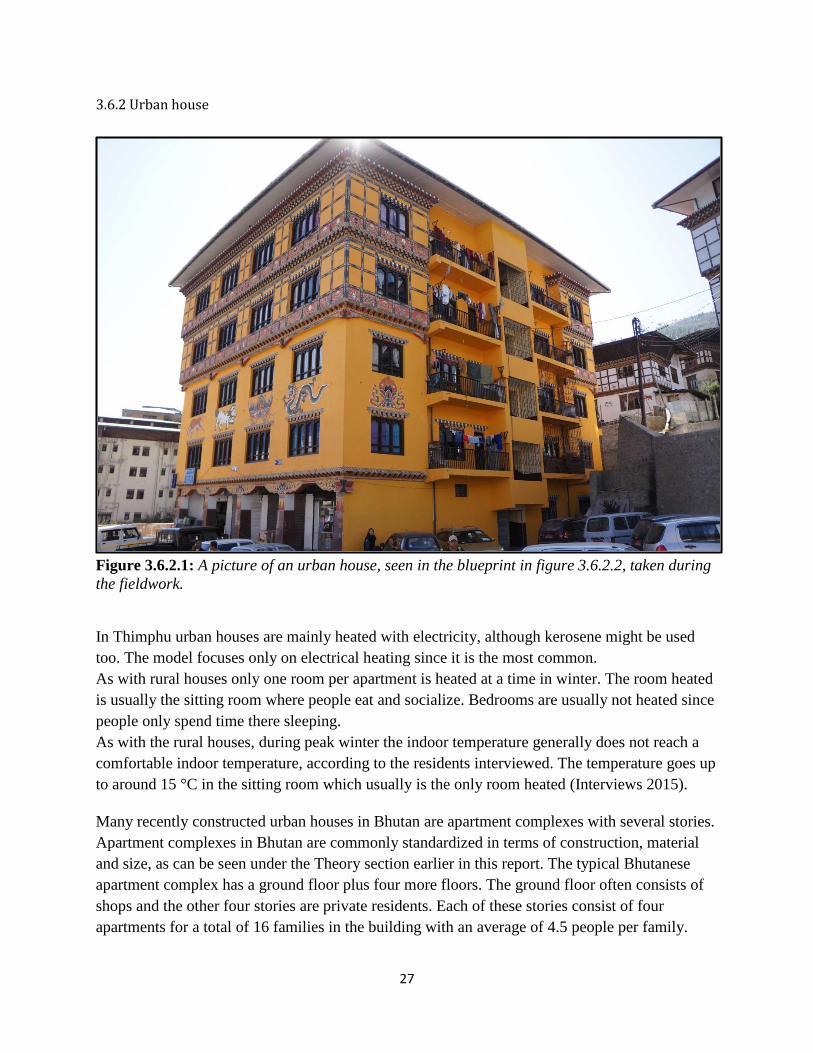
Figure 3.6.2.1: A picture of an urban house, seen in the blueprint in figure 3.6.2.2, taken during
the fieldwork.
In Thimphu urban houses are mainly heated with electricity, although kerosene might be used
too. The model focuses only on electrical heating since it is the most common.
As with rural houses only one room per apartment is heated at a time in winter. The room heated
is usually the sitting room where people eat and socialize. Bedrooms are usually not heated since
people only spend time there sleeping.
As with the rural houses, during peak winter the indoor temperature generally does not reach a
comfortable indoor temperature, according to the residents interviewed. The temperature goes up
to around 15 °C in the sitting room which usually is the only room heated (Interviews 2015).
Many recently constructed urban houses in Bhutan are apartment complexes with several stories.
Apartment complexes in Bhutan are commonly standardized in terms of construction, material
and size, as can be seen under the Theory section earlier in this report. The typical Bhutanese
apartment complex has a ground floor plus four more floors. The ground floor often consists of
shops and the other four stories are private residents. Each of these stories consist of four
apartments for a total of 16 families in the building with an average of 4.5 people per family.
28
As with most houses in Bhutan the newly constructed urban apartment complexes usually have a
Jamthog which is a smaller construction on the roof of the house which people traditionally use
for religious purposes. The Jamthog on urban buildings are most often used to store the buildings
water supply. The water is pumped to the roof to then be used by the residents. Since the
Jamthog in the case of most urban buildings is a separate construction not being heated, it was
not modelled.
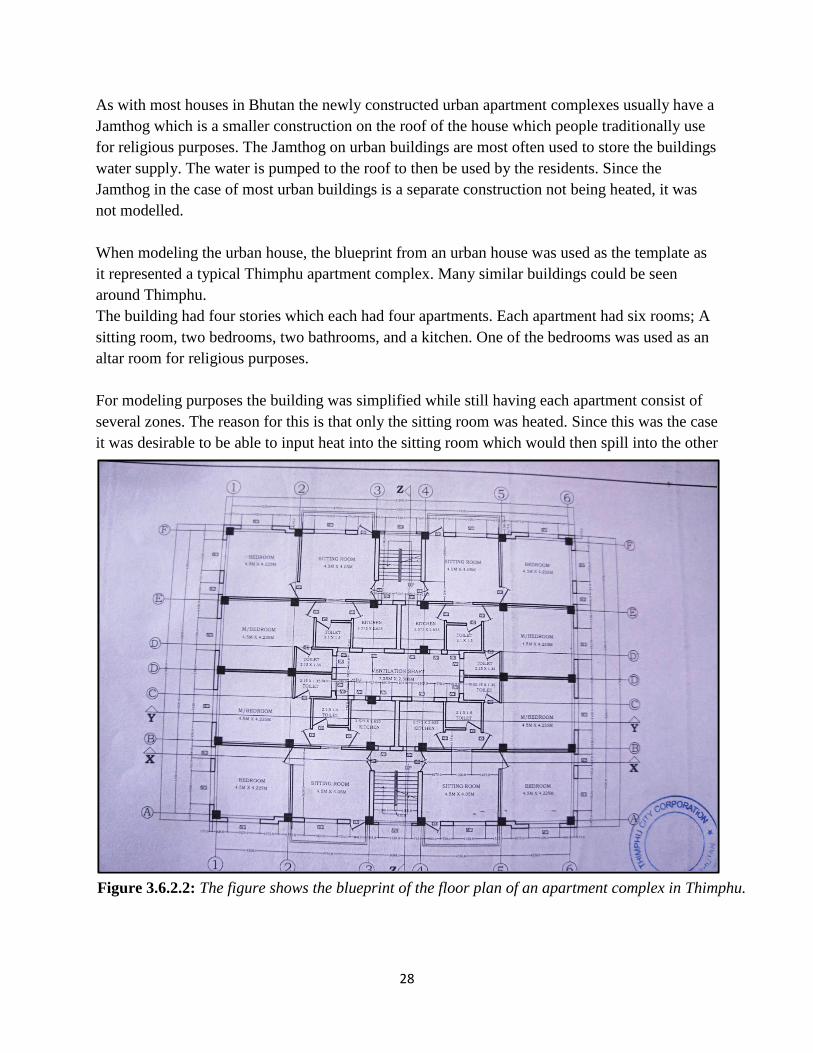
When modeling the urban house, the blueprint from an urban house was used as the template as
it represented a typical Thimphu apartment complex. Many similar buildings could be seen
around Thimphu.
The building had four stories which each had four apartments. Each apartment had six rooms; A
sitting room, two bedrooms, two bathrooms, and a kitchen. One of the bedrooms was used as an
altar room for religious purposes.
For modeling purposes the building was simplified while still having each apartment consist of
several zones. The reason for this is that only the sitting room was heated. Since this was the case
it was desirable to be able to input heat into the sitting room which would then spill into the other
Figure 3.6.2.2: The figure shows the blueprint of the floor plan of an apartment complex in Thimphu.
29
zones.
Unlike the rural case, only one case was tested with the urban house, namely heating only the
sitting room. This was done because the urban house consists of so many zones, 64 in total, that
the time it would take to model both cases was prohibitive.
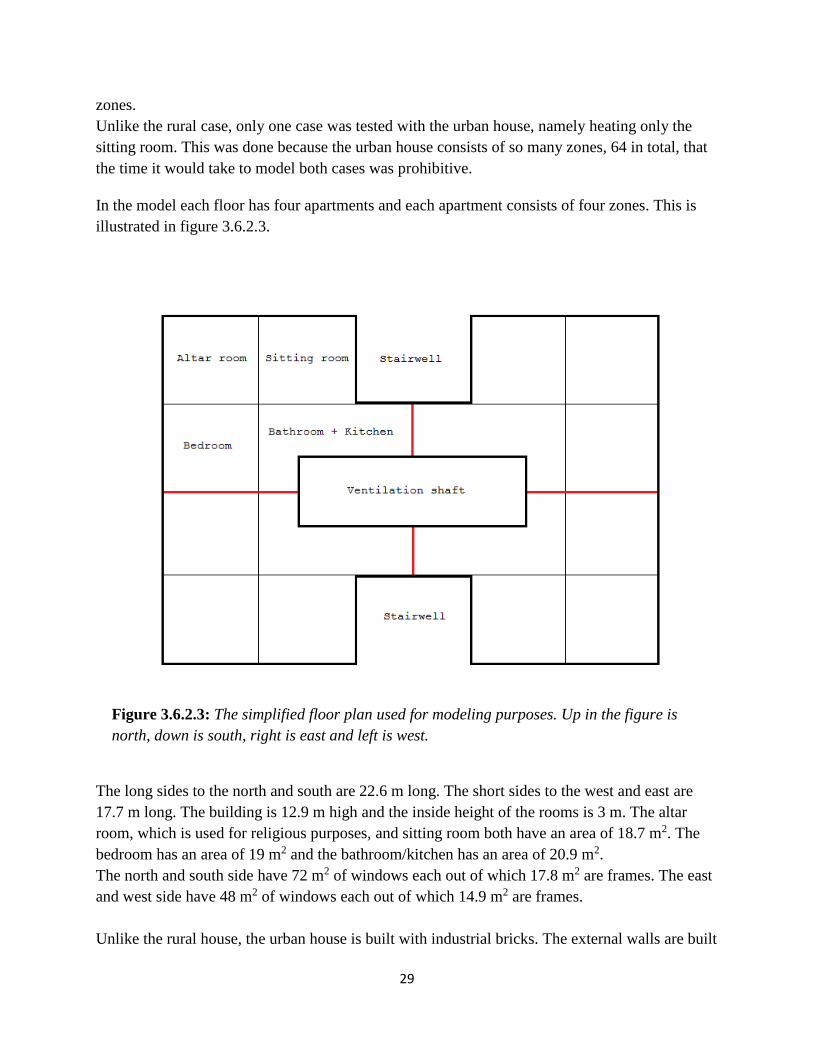
In the model each floor has four apartments and each apartment consists of four zones. This is
illustrated in figure 3.6.2.3.
Figure 3.6.2.3: The simplified floor plan used for modeling purposes. Up in the figure is
north, down is south, right is east and left is west.
The long sides to the north and south are 22.6 m long. The short sides to the west and east are
17.7 m long. The building is 12.9 m high and the inside height of the rooms is 3 m. The altar
room, which is used for religious purposes, and sitting room both have an area of 18.7 m2. The
bedroom has an area of 19 m2 and the bathroom/kitchen has an area of 20.9 m2.
The north and south side have 72 m2 of windows each out of which 17.8 m2 are frames. The east
and west side have 48 m2 of windows each out of which 14.9 m2 are frames.
Unlike the rural house, the urban house is built with industrial bricks. The external walls are built
30
from whole bricks covered with plaster on each side making the wall 30 cm thick. The internal
walls are built much the same but with half bricks making the walls 15 cm thick.
The inside floors are made from 15 cm of cement covered in 2.5 cm of wooden planks. The
ground floor is made from the same material but with a further 40 cm layer of rock beneath it.
The ceiling of the top floor is adjacent to the attic which more or less keeps ambient temperature.
The ceiling is made from 1 cm of plywood. All windows on all sides are single paned.
The U-values of the surfaces are as follows: Windows =5.68 W/m2·K, External walls =0.88
W/m2·K, Internal walls =1.73 W/m2·K, Ceiling = 4.23 W/m2·K, Ground floor =0.91 W/m2·K,
Inside floor =2.13 W/m2·K.
The top left corner of figure 3.6.2.3 shows how the zones were divided. The red lines divide the
floor into four apartments. The three unlabeled apartments have the same layout as the top left
one.
Two of the apartment building’s sides had stairwells. Each of these stairwells had large openings
to the outside which were only covered by grates. Thus the stairwells were simulated as being
outside, although providing shade for the side of the sitting room and the bathroom + kitchen that
would otherwise have been exposed.
The same is true for the large ventilation shaft in the center of the building. This shaft was also
modeled as being outside, although without any sunlight penetrating the zone. That is to say,
both stairwells and the ventilation shaft will be the same temperature as the ambient temperature
on any given day.
The thicker black lines represent the outside wall while the thinner lines represent inside walls.
The red lines, as mentioned above, are partitions between the four apartments. These walls are
also inside walls.
The urban apartment complexes usually have slanted roofs made from corrugated steel at a 15
degree angle with an overhang of about 2 meters.

31
3.7 Infrared imaging
An infrared camera, or IR camera, is sensitive to radiation from the infrared part of the spectrum.
The picture it produces is a false color image. The colors do not represent the world as viewed in
the infrared spectrum but rather each color represents a certain temperature. These color change
in relation to their surroundings. The hottest temperature in the picture will always be white no
matter its actual temperature (Titman, 2001).
The temperatures shown are not absolute values either. The temperature the IR camera displays
depends on the emissivity of the material. Glass for example are entirely opaque to an IR camera.
These emissivity incongruities make IR images hard to read if you’re not an experience
practioner (Titman, 2001). That being said, even an amateur can look at an IR image and see the
difference between the hot and cold parts of the image. It is for this purpose that the IR images
seen below are used in this report, i.e. to give qualitative information of where heat leaks can be
found in houses in and around Thimphu, Bhutan.
The IR camera takes two images in one. The original is shown to the left and the IR image to the
right.
Figure 3.7.1: The picture shows the ceiling of the sixth house from the inside.
The ceilings of the top floor of each house visited in Bhutan were made from sheets of plywood.
As can be seen in the image above, the plywood is significantly warmer than the walls. The
picture was taken on a warm day which means that the plywood ceiling, having a high U-value,
let’s heat enter the house with little resistance. During a cold day the plywood ceiling would let
the heat from the room out instead. The temperature outside was 22 °C and the temperature
inside was 21°C.
32
3.8 Firewood use in rural house
From the interviews it was learned that usually only the sitting rooms are heated in the rural
houses in Bhutan during winter. How they are heated varies somewhat but usually they are
heated with firewood. The amount of firewood used during one year also varies but from the
interviews it was learned that rural houses with two floors with one family on each floor, such as
the one simulated, the amount of firewood needed is 2 truckloads. The unit “truckload” was used
by the locals during the interviews. A truckload is equal to 8m3 or 5.8 tons (Lhendup 2015).
Using a standard net calorific value of air dried wood 4.1 kWh/kg (Biomass Energy Centre 2015
) converts this number to 2 ∙ 5800 ∙ 4.1 = 47560𝑘𝑊ℎ ≈ 48000 𝑘𝑊ℎ .
When simulating heating the sitting rooms approximately 13000 kWh of heat is needed to keep
the temperature of the sitting rooms above 15 °C during the day in the colder months of the year.
An indoor temperature of 15°C was estimated from the interviews done with private residents in
Bhutan during the project.
This results in a COP for the wood stove that equals 13000
48000≈ 0.27 this is of course hard if not
impossible to verify but it is a reasonable value of the COP given that an open indoor fireplace
has a COP=0.05 when it comes to heat and a modern wood stove sold in Sweden typically has a
COP=0.8 (Gson Engqvist 2007 ). In the tables 2-8 the COP=0.27 for the wood burning stove has
been used to get the values of the amount of firewood used in kWh. To get the result of the direct
energy need, 13000 kWh with no solar heating, generated from TRNSYS one should multiply
the value of the amount of firewood used with 0.27.
3.9 Parameter study Both parameter studies below, both for the rural and the urban house have their figures plotted
during the month of January. It is a cold month that requires heating and is a good example for
showing the effectiveness of the different systems. Figure 3.9.1 shows the ambient temperature
for January. The values presented in tables 4.1.2-4.1.8 and 4.2.2-4.2.4 on the other hand are for a
whole year.

33
Figure 3.9.1: Ambient temperature for the month of January.
Table 3.9.1 shows the five basic cases that were studied in section 4.1 and section 4.2. In table
3.9.1 the cases Rural 1-3 show a minimized version of figure 3.6.1.3 and the cases Urban 1 and 2
show a minimized version of figure 3.6.2.3. In table 3.9.1 the fire represents firewood, the yellow
lightning electricity and the red lines solar thermal power. Further variations on these five cases
were also studied. Both the firewood heating and the electric heating were shut off in certain
instances to see which effect this would have. When this is done it is clearly stated in the sections
below.
-8
0
8
16
0 48 96 144 192 240 288 336 384 432 480 528 576 624 672 720 768
Tem
per
ature
/°C
Time/h
Ambient temp

34
Table 3.9.1: Descriptions of the different cases studied in section 4.1 and 4.2.
Different heating situations studied in
section 4.1 and 4.2
Floorplans with heating for the rural and urban houses.
The fire represents firewood, the yellow lightning
electricity and the red lines solar thermal power.
Rural 1: Heating just the sitting rooms of
the rural house with firewood. This is the
current situation in many rural houses in
Bhutan.
Rural 2: Heating just the sitting rooms of
the rural house with a solar thermal
system.
The firewood heating is still in place. This
was done to see how much, in %, the
firewood use can be mitigated.
Rural 3: Heating the whole rural house
with a solar thermal system.
The firewood heating is still in place. This
was done to see how much, in %, the
firewood use can be mitigated.
Urban 1: Heating just the sitting rooms of
the urban house with electricity. This is
the current situation in many urban houses
in Bhutan. (The picture shows 1 out of 4
identical floors)
Urban 2: Heating just the sitting rooms of
the urban house with a solar thermal
system.
The electric heating is still in place. This
was done to see how much, in %, the
electricity use can be mitigated. (The
picture shows 1 out of 4 identical floors)

35
3.9.1 Setpoints
In the tables 4.1.2-4.1.8 and 4.2.2-4.2.4 and graphs 4.1.1-4.1.12 and 4.2.1-4.2.5 the term setpoint
is used. When it is said that the solar thermal system has a certain heating setpoint it means that
the solar thermal system will strive to heat the rooms it is heating to this setpoint. In the
parameter studies described in the systems below the solar heating setpoint is either 18 °C or 23
°C and is shortened to Solar SP when mentioned in the graphs and tables, and the auxiliary
heating setpoint is either 0 °C, 35 °C or 55 °C and is shortened to AuxSP in the graphs and
tables.
3.9.2 Table columns
In the tables 4.1.2-4.1.8 and 4.2.2-4.2.4 there are six different columns used to describe the
system and its performance. The first column is called “System specifications” and is used to
describe the system simulated in question, in this column variations of the solar heating setpoint
will be described, furthermore the auxiliary heating setpoint, the size of the radiators or the use
or nonuse of wood or electricity for heating the house will be described. If nothing else is said
the auxiliary heating setpoint is 55 °C, the size of the radiators is 1000 W per room and wood is
used for heating in the sitting rooms of the rural house and electricity is used for heating the
sitting rooms in the urban house.
The second column is called “Auxiliary heater/kWh” and describes the amount of energy used
by the Auxiliary heater in kWh. The third column is called “Energy from solar thermal system
(kWh)” and describes the total amount of energy added to the house from the solar thermal
system in kWh. The fourth column is called “Effective solar collector gains (kWh)” and
describes the amount of energy extracted from the solar collector subtracted by the system losses
i.e. the amount of energy extracted from the solar thermal system discounting the auxiliary
heater. The fifth and sixth column differs in the tables in section 4.1 and 4.2, in 4.1 they are
called “wood usage (kWh)” and “Percentage of original wood use (%)” and describe the amount
of wood used in kWh to heat the house and how many percent of the original wood use that is
used compared to the amount of wood used when there is no solar heating. The amount of wood
used in kWh is not equivalent to the amount of energy added to the rooms, due to the fact that
the wood heater has a COP of 0.27. In section 4.2 the fifth and sixth columns in the tables are
called “Electric heater (kWh)” and “Percentage of original electric heater use (%)” and describe
the amount of electricity used in kWh to heat the house and how many percent of the original
electricity use that is used compared to the amount of electricity used when there is no solar
heating. The electricity heater has a COP of 1 so the amount of electricity used for heating the
house is equivalent to the amount of energy added to the rooms.
36
3.9.3 Heating
From the interviews it was learned that currently rural houses in Bhutan are heated when
residents in the house are awake due to the fact that someone has to mind the fire. Therefore the
use of the wood heater is simulated so that it is only used between 06:00 to 23:00. When
simulating the use of the solar thermal system however it is simulated so that it adds energy to
the house 24 hours a day. This is because the solar thermal system does not need to be minded by
the residents in the house.
In the urban house, the electric heating is done by a 1200 W radiator in each apartment’s sitting
room. There are 16 sitting rooms in total, four per floor. The radiator is set to keep the sitting
room temperature above 15 °C, when needed, and to be on between 06:00 and 23:00. These
times were chosen as the residents, when interviewed, said that the electric heater was only on
during the day.
3.9.4. Rural house heating control
The heating of the rural house with firewood and the heating with solar thermal energy is not
controlled in the same way. The wood heating of the two sitting rooms is controlled by
monitoring the temperatures in each room individually and then using the setpoint 15°C for these
rooms. Furthermore the wood heater can only be used between 6:00 and 23:00 due to the fact
that wood heating is only used when people are awake. Thus, when the temperature in any of the
sitting rooms falls below 15°C between 6:00 and 23:00, heating of that room will begin.
The solar thermal heating is however controlled in a somewhat different way. The solar thermal
heating is controlled by monitoring the average temperature of all the rooms that are currently
heated with solar thermal energy in the house. It can thus be the average temperature of the two
sitting rooms if only they are heated or the average of all the rooms in the rural house if the
whole house is heated. The control was made in such a way because it would take too long to
make a control for each room individually, thus a simplification of the control was made in
TRNSYS.
3.9.5 Urban house heating control
Similar to the situation in the rural house, the heating of the urban house with the electrical
heater and the heating with solar thermal energy is not controlled in the same way. The electrical
heating of the 16 sitting rooms, four sitting rooms on each of the four floors, is controlled by
monitoring the coldest sitting room on each floor and using the wood heating setpoint 15°C.
Furthermore the electrical heater can only be used between 6:00 and 23:00 because electric
heating is only used when people are awake. The coldest room on each floor is the northwestern
sitting room. When the temperature in the coldest room on a floor falls below 15°C between 6:00
and 23:00 the electric heating of all the rooms on that floor begins.

37
The solar thermal heating is however controlled in a different way. It is controlled by monitoring
the average temperature of all the four sitting rooms on each floor. Thus when the average
temperature of the four sitting rooms on one floor falls below 15°C the solar thermal heating of
all the four sitting rooms on that floor begins. The control was made in such a way because it
would take too long to make a control for each room individually, thus a simplification of the
control was made in TRNSYS.
38
4 Results
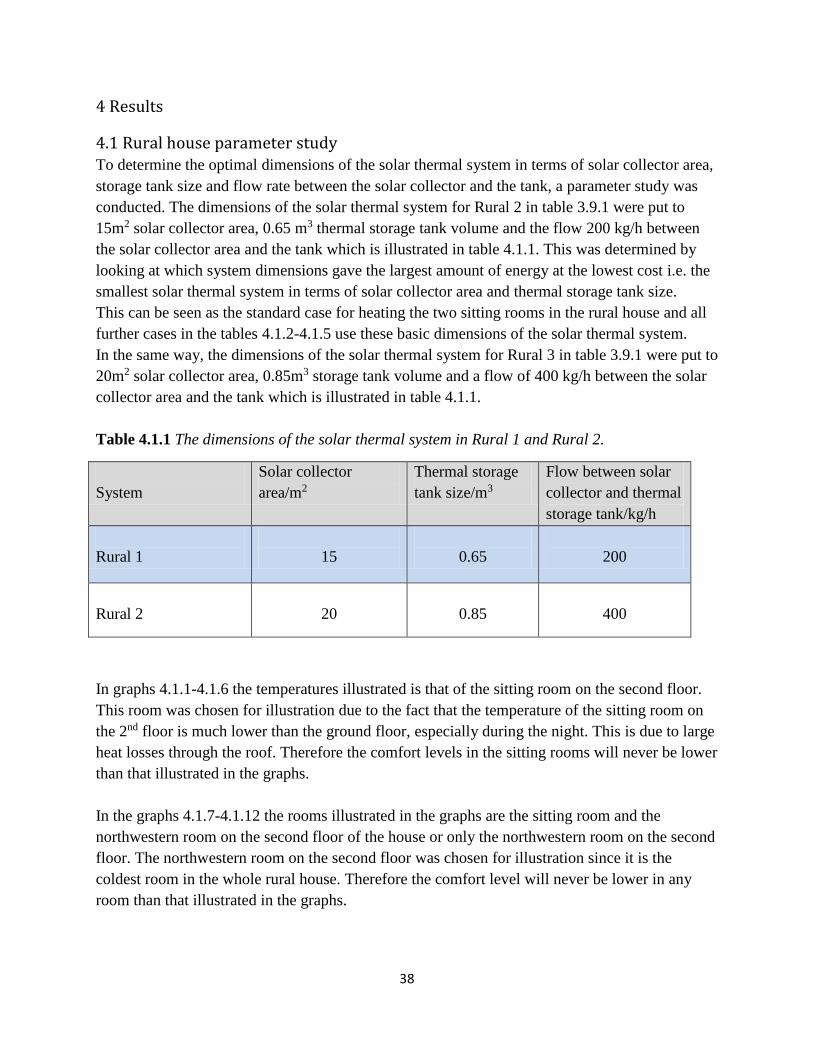
4.1 Rural house parameter study To determine the optimal dimensions of the solar thermal system in terms of solar collector area,
storage tank size and flow rate between the solar collector and the tank, a parameter study was
conducted. The dimensions of the solar thermal system for Rural 2 in table 3.9.1 were put to
15m2 solar collector area, 0.65 m3 thermal storage tank volume and the flow 200 kg/h between
the solar collector area and the tank which is illustrated in table 4.1.1. This was determined by
looking at which system dimensions gave the largest amount of energy at the lowest cost i.e. the
smallest solar thermal system in terms of solar collector area and thermal storage tank size.
This can be seen as the standard case for heating the two sitting rooms in the rural house and all
further cases in the tables 4.1.2-4.1.5 use these basic dimensions of the solar thermal system.
In the same way, the dimensions of the solar thermal system for Rural 3 in table 3.9.1 were put to
20m2 solar collector area, 0.85m3 storage tank volume and a flow of 400 kg/h between the solar
collector area and the tank which is illustrated in table 4.1.1.
Table 4.1.1 The dimensions of the solar thermal system in Rural 1 and Rural 2.
System
Solar collector
area/m2
Thermal storage
tank size/m3
Flow between solar
collector and thermal
storage tank/kg/h
Rural 1
15
0.65
200
Rural 2
20
0.85
400
In graphs 4.1.1-4.1.6 the temperatures illustrated is that of the sitting room on the second floor.
This room was chosen for illustration due to the fact that the temperature of the sitting room on
the 2nd floor is much lower than the ground floor, especially during the night. This is due to large
heat losses through the roof. Therefore the comfort levels in the sitting rooms will never be lower
than that illustrated in the graphs.
In the graphs 4.1.7-4.1.12 the rooms illustrated in the graphs are the sitting room and the
northwestern room on the second floor of the house or only the northwestern room on the second
floor. The northwestern room on the second floor was chosen for illustration since it is the
coldest room in the whole rural house. Therefore the comfort level will never be lower in any
room than that illustrated in the graphs.

39
Table 4.1.2 illustrates how the performance of the system varies with and without the use of
firewood and with varied heating setpoints for the solar thermal system. These setpoints dictate
how much solar thermal energy is to be pushed into the sitting rooms. A higher setpoint means
that the system tries to keep the temperature in the sitting room at a higher temperature.
The solar thermal system is the same as in Rural 2 in table 3.9.1. The only parameters being
changed are the heating setpoints for the solar thermal system. Rural 1 in in table 3.9.1 is also
displayed as a reference case.
40
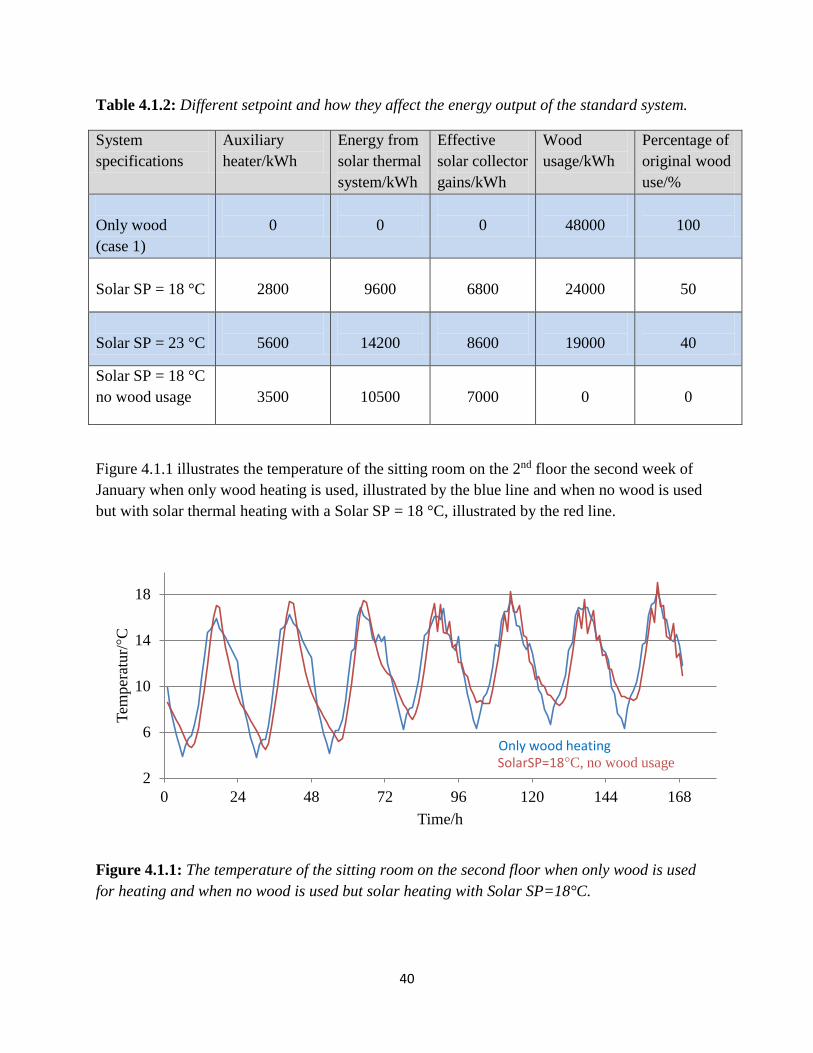
Table 4.1.2: Different setpoint and how they affect the energy output of the standard system.
System
specifications
Auxiliary
heater/kWh
Energy from
solar thermal
system/kWh
Effective
solar collector
gains/kWh
Wood
usage/kWh
Percentage of
original wood
use/%
Only wood
(case 1)
0
0
0
48000
100
Solar SP = 18 °C
2800
9600
6800
24000
50
Solar SP = 23 °C
5600
14200
8600
19000
40
Solar SP = 18 °C
no wood usage
3500
10500
7000
0
0
Figure 4.1.1 illustrates the temperature of the sitting room on the 2nd floor the second week of
January when only wood heating is used, illustrated by the blue line and when no wood is used
but with solar thermal heating with a Solar SP = 18 °C, illustrated by the red line.
Figure 4.1.1: The temperature of the sitting room on the second floor when only wood is used
for heating and when no wood is used but solar heating with Solar SP=18°C.
2
6
10
14
18
0 24 48 72 96 120 144 168
Tem
per
atur/
°C
Time/h
Only wood heatingSolarSP=18°C, no wood usage

41
Figure 4.1.2 illustrates the temperature of the sitting room on the 2nd floor the second week of
January when only wood heating is used, illustrated by the blue line and when wood as well as
solar thermal heating with the Solar SP = 18 °C is used, illustrated by the red line.
Figure 4.1.2: The temperature of the sitting room on the second floor when only wood is used
for heating and when wood heating as well as solar heating with Solar SP = 18 °C is used.
Figure 4.1.2 shows that when using both wood and solar thermal heating with the Solar SP = 18
°C the comfort level is increased compared to when using only wood heating. The total amount
of energy added to the sitting rooms is also noticeably higher when wood heating as well as solar
thermal heating with Solar SP = 18 °C is used compared to when only wood heating is used,
(24000 ∙ 0.27) + 9600 = 16080 kWh compared to when only wood heating is used.
As mentioned before there might be some occasions with exceptionally low solar radiation and
then the comfort difference between the two systems described in figure 4.1.2 might be lower.
The comfort level will however never be lower when using wood heating as well as solar thermal
heating with Solar SP = 18 °C than when only wood heating.
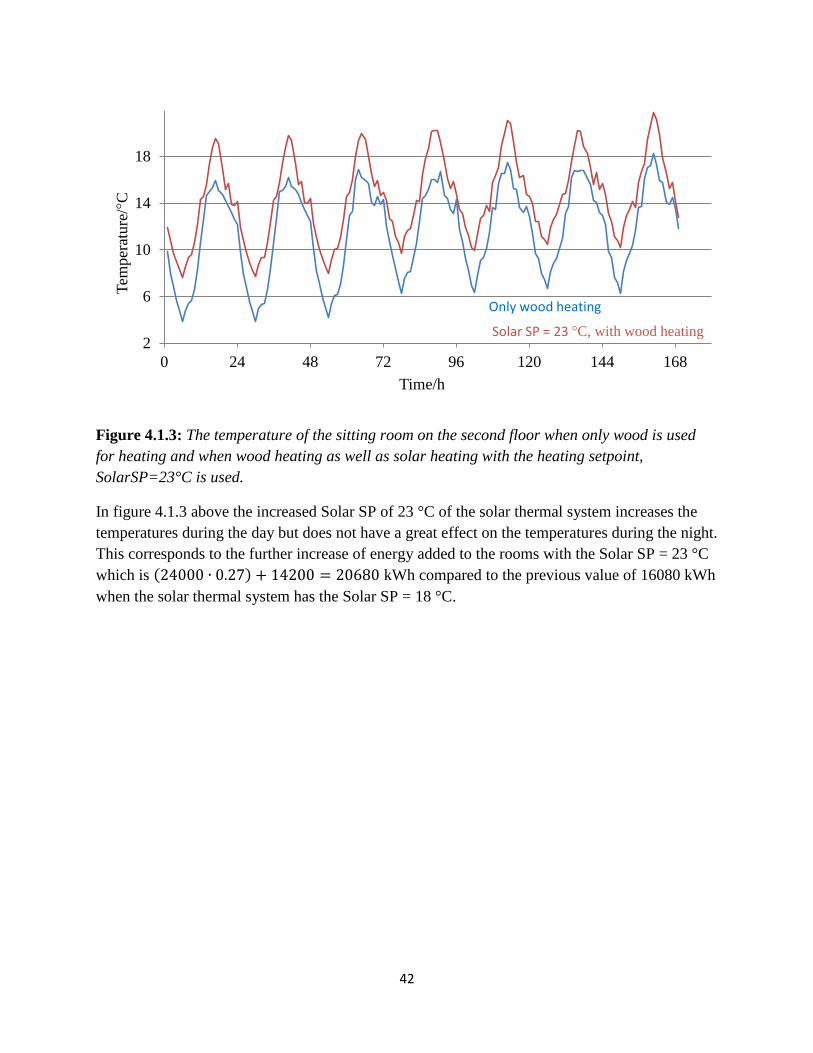
Figure 4.1.3 illustrates the temperature of the sitting room on the 2nd floor the second week of
January when only wood heating is used, illustrated by the blue line and when wood as well as
solar thermal heating with the Solar SP = 23 °C is used, illustrated by the red line.
2
6
10
14
18
0 24 48 72 96 120 144 168
Tem
per
atu
re/°
C
Time/h
Only wood heating
SolarSP=18°C, with wood heating
42
Figure 4.1.3: The temperature of the sitting room on the second floor when only wood is used
for heating and when wood heating as well as solar heating with the heating setpoint,
SolarSP=23°C is used.
In figure 4.1.3 above the increased Solar SP of 23 °C of the solar thermal system increases the
temperatures during the day but does not have a great effect on the temperatures during the night.
This corresponds to the further increase of energy added to the rooms with the Solar SP = 23 °C
which is (24000 ∙ 0.27) + 14200 = 20680 kWh compared to the previous value of 16080 kWh
when the solar thermal system has the Solar SP = 18 °C.
2
6
10
14
18
0 24 48 72 96 120 144 168
Tem
per
ature
/°C
Time/h
Solar SP = 23 °C, with wood heating
Only wood heating
43
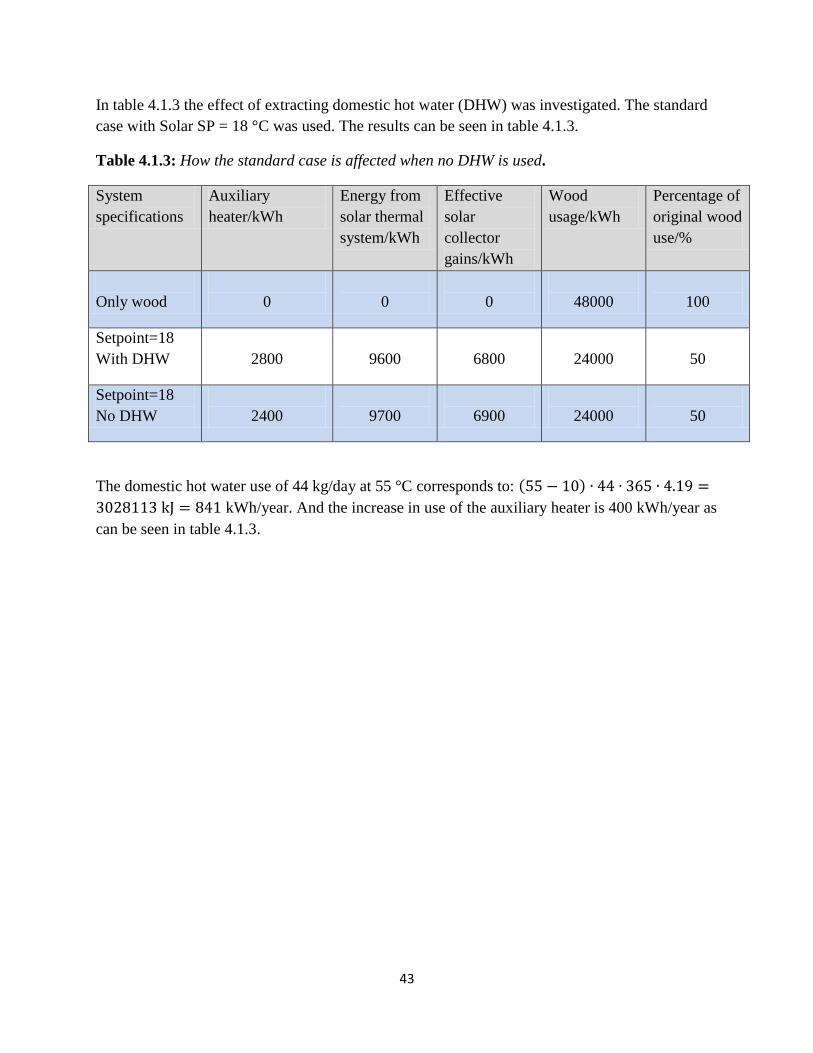
In table 4.1.3 the effect of extracting domestic hot water (DHW) was investigated. The standard
case with Solar SP = 18 °C was used. The results can be seen in table 4.1.3.
Table 4.1.3: How the standard case is affected when no DHW is used.
System
specifications
Auxiliary
heater/kWh
Energy from
solar thermal
system/kWh
Effective
solar
collector
gains/kWh
Wood
usage/kWh
Percentage of
original wood
use/%
Only wood
0
0
0
48000
100
Setpoint=18
With DHW
2800
9600
6800
24000
50
Setpoint=18
No DHW
2400
9700
6900
24000
50
The domestic hot water use of 44 kg/day at 55 °C corresponds to: (55 − 10) ∙ 44 ∙ 365 ∙ 4.19 =
3028113 kJ = 841 kWh/year. And the increase in use of the auxiliary heater is 400 kWh/year as
can be seen in table 4.1.3.
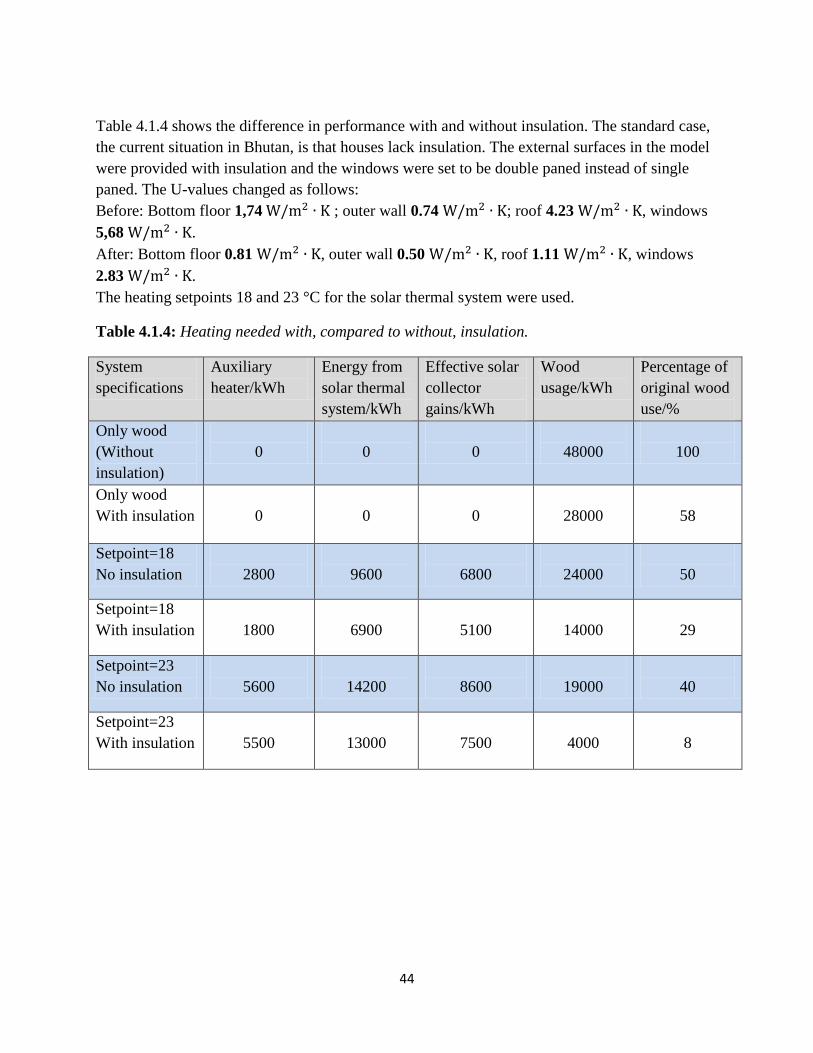
44
Table 4.1.4 shows the difference in performance with and without insulation. The standard case,
the current situation in Bhutan, is that houses lack insulation. The external surfaces in the model
were provided with insulation and the windows were set to be double paned instead of single
paned. The U-values changed as follows:
Before: Bottom floor 1,74 W/m2 ∙ K ; outer wall 0.74 W/m2 ∙ K; roof 4.23 W/m2 ∙ K, windows
5,68 W/m2 ∙ K.
After: Bottom floor 0.81 W/m2 ∙ K, outer wall 0.50 W/m2 ∙ K, roof 1.11 W/m2 ∙ K, windows
2.83 W/m2 ∙ K.
The heating setpoints 18 and 23 °C for the solar thermal system were used.
Table 4.1.4: Heating needed with, compared to without, insulation.
System
specifications
Auxiliary
heater/kWh
Energy from
solar thermal
system/kWh
Effective solar
collector
gains/kWh
Wood
usage/kWh
Percentage of
original wood
use/%
Only wood
(Without
insulation)
0
0
0
48000
100
Only wood
With insulation
0
0
0
28000
58
Setpoint=18
No insulation
2800
9600
6800
24000
50
Setpoint=18
With insulation
1800
6900
5100
14000
29
Setpoint=23
No insulation
5600
14200
8600
19000
40
Setpoint=23
With insulation
5500
13000
7500
4000
8
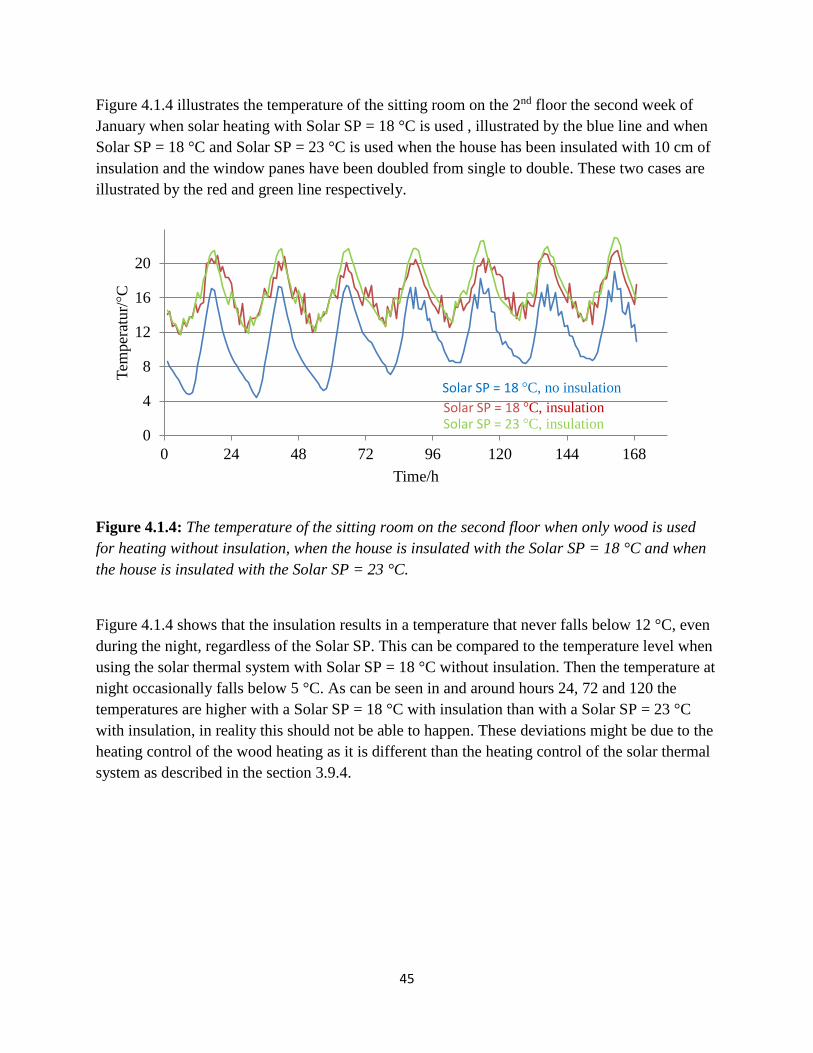
45
Figure 4.1.4 illustrates the temperature of the sitting room on the 2nd floor the second week of
January when solar heating with Solar SP = 18 °C is used , illustrated by the blue line and when
Solar SP = 18 °C and Solar SP = 23 °C is used when the house has been insulated with 10 cm of
insulation and the window panes have been doubled from single to double. These two cases are
illustrated by the red and green line respectively.
Figure 4.1.4: The temperature of the sitting room on the second floor when only wood is used
for heating without insulation, when the house is insulated with the Solar SP = 18 °C and when
the house is insulated with the Solar SP = 23 °C.
Figure 4.1.4 shows that the insulation results in a temperature that never falls below 12 °C, even
during the night, regardless of the Solar SP. This can be compared to the temperature level when
using the solar thermal system with Solar SP = 18 °C without insulation. Then the temperature at
night occasionally falls below 5 °C. As can be seen in and around hours 24, 72 and 120 the
temperatures are higher with a Solar SP = 18 °C with insulation than with a Solar SP = 23 °C
with insulation, in reality this should not be able to happen. These deviations might be due to the
heating control of the wood heating as it is different than the heating control of the solar thermal
system as described in the section 3.9.4.
0
4
8
12
16
20
0 24 48 72 96 120 144 168
Tem
per
atur/
°C
Time/h
Solar SP = 18 °C, no insulation
Solar SP = 18 °C, insulationSolar SP = 23 °C, insulation
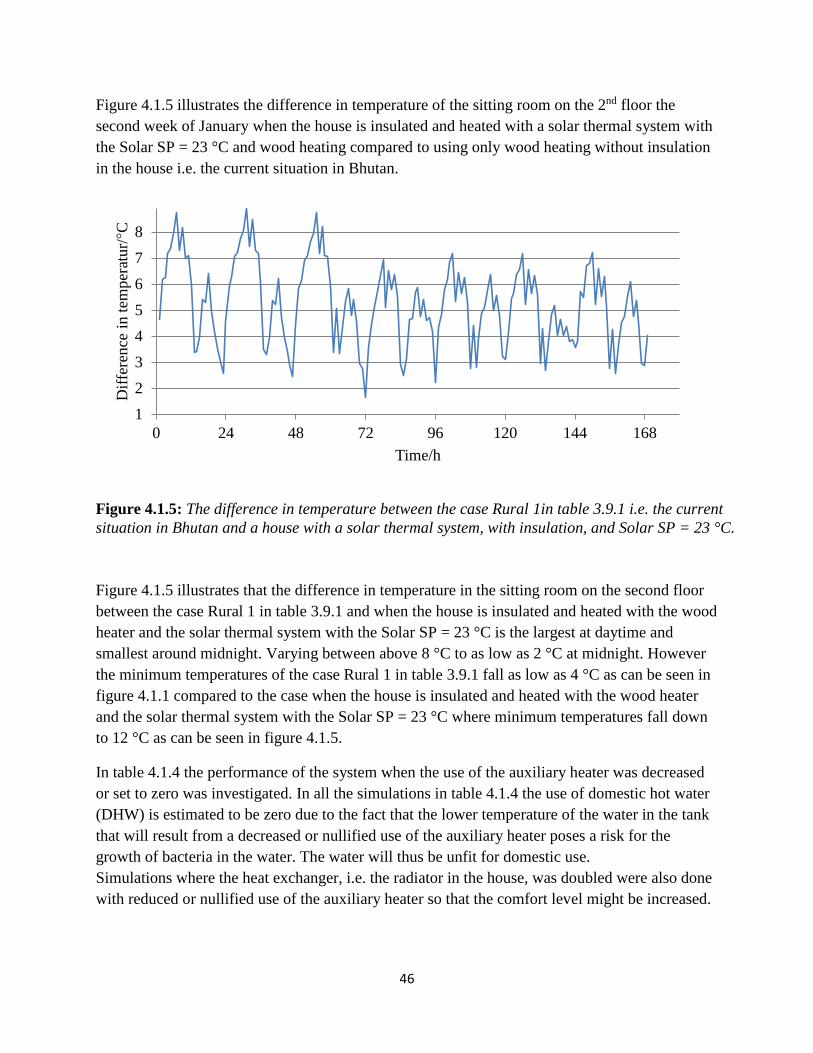
46
Figure 4.1.5 illustrates the difference in temperature of the sitting room on the 2nd floor the
second week of January when the house is insulated and heated with a solar thermal system with
the Solar SP = 23 °C and wood heating compared to using only wood heating without insulation
in the house i.e. the current situation in Bhutan.
Figure 4.1.5 illustrates that the difference in temperature in the sitting room on the second floor
between the case Rural 1 in table 3.9.1 and when the house is insulated and heated with the wood
heater and the solar thermal system with the Solar SP = 23 °C is the largest at daytime and
smallest around midnight. Varying between above 8 °C to as low as 2 °C at midnight. However
the minimum temperatures of the case Rural 1 in table 3.9.1 fall as low as 4 °C as can be seen in
figure 4.1.1 compared to the case when the house is insulated and heated with the wood heater
and the solar thermal system with the Solar SP = 23 °C where minimum temperatures fall down
to 12 °C as can be seen in figure 4.1.5.
In table 4.1.4 the performance of the system when the use of the auxiliary heater was decreased
or set to zero was investigated. In all the simulations in table 4.1.4 the use of domestic hot water
(DHW) is estimated to be zero due to the fact that the lower temperature of the water in the tank
that will result from a decreased or nullified use of the auxiliary heater poses a risk for the
growth of bacteria in the water. The water will thus be unfit for domestic use.
Simulations where the heat exchanger, i.e. the radiator in the house, was doubled were also done
with reduced or nullified use of the auxiliary heater so that the comfort level might be increased.
1
2
3
4
5
6
7
8
0 24 48 72 96 120 144 168
Dif
fere
nce
in t
emper
atur/
°C
Time/h
Figure 4.1.5: The difference in temperature between the case Rural 1in table 3.9.1 i.e. the current
situation in Bhutan and a house with a solar thermal system, with insulation, and Solar SP = 23 °C.

47
Table 4.1.5: Variations on the auxiliary heater and heat exchanger, without DHW use.
System
specifications
Auxiliary
heater/kWh
Energy from
solar thermal
system/kWh
Effective
solar
collector
gains/kWh
Wood
usage/kWh
Percentage of
original wood
use/%
SolarSP=23°C
AuxSP=35°C
600
11300
10700
26000
54
SolarSP=23°C
No Aux
0 10900 10900 28000 58
SolarSP=23°C
No Aux
Double radiator
0
12600
12600
27000
56
SolarSP=23°C
No Aux
Double radiator
Insulation
0
11600
11600
12000
25
In table 4.1.5 simulations where the Auxiliary heater energy use was decreased or removed were
made, furthermore simulations where the radiator was doubled from having a capacity of 1000
W to 2000 W were made. Lastly one case where there was no auxiliary heater, Solar SP = 23 °C,
double radiator and insulation in the house was simulated.
As can be seen in row 1 in table 4.1.5 the auxiliary heater energy use was decreased to 600 kWh
when Aux SP = 35 °C and Solar SP = 23 °C compared to the auxiliary heater energy use being
5600 kWh when Aux SP = 55 °C and Solar SP = 23 °C as can be seen in row 3 in table 4.1.2 or 0
kWh, as expected when the auxiliary heater is removed the Solar SP = 23°C.
When altering or removing the auxiliary heater as has been done in row 1 and 2 of table 4.1.5 the
effective solar collector gains increases somewhat to 10700 kWh and 10900 kWh respectively
which can be compared to 8600 kWh of effective solar collector gains with a Solar SP = 23 °C
and Aux SP = 55 °C as can be seen in row 3 in table 4.1.2. However, there is also an increase in
the wood use to 26 000 kWh and 28 000 kWh for the two systems in row 1 and 2 in table 4.1.5
respectively which can be compared to 19 000 kWh for the case in row 3 in table 4.1.2.
The reason why the Solar SP = 23 °C is used in all the cases in table 4.1.5 is that when the
auxiliary heater is decreased or removed the energy amount added to the house from the solar
thermal system, described in column 2 in the tables will decrease. To balance this as much as
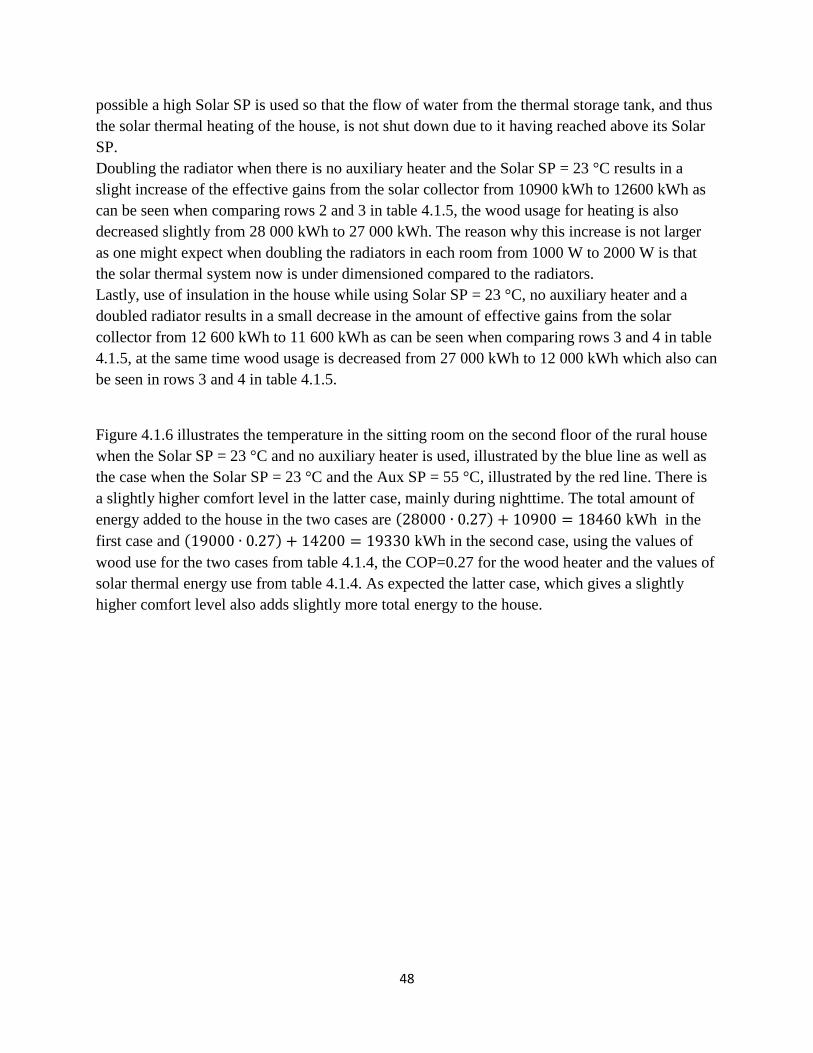
48
possible a high Solar SP is used so that the flow of water from the thermal storage tank, and thus
the solar thermal heating of the house, is not shut down due to it having reached above its Solar
SP.
Doubling the radiator when there is no auxiliary heater and the Solar SP = 23 °C results in a
slight increase of the effective gains from the solar collector from 10900 kWh to 12600 kWh as
can be seen when comparing rows 2 and 3 in table 4.1.5, the wood usage for heating is also
decreased slightly from 28 000 kWh to 27 000 kWh. The reason why this increase is not larger
as one might expect when doubling the radiators in each room from 1000 W to 2000 W is that
the solar thermal system now is under dimensioned compared to the radiators.
Lastly, use of insulation in the house while using Solar SP = 23 °C, no auxiliary heater and a
doubled radiator results in a small decrease in the amount of effective gains from the solar
collector from 12 600 kWh to 11 600 kWh as can be seen when comparing rows 3 and 4 in table
4.1.5, at the same time wood usage is decreased from 27 000 kWh to 12 000 kWh which also can
be seen in rows 3 and 4 in table 4.1.5.
Figure 4.1.6 illustrates the temperature in the sitting room on the second floor of the rural house
when the Solar SP = 23 °C and no auxiliary heater is used, illustrated by the blue line as well as
the case when the Solar SP = 23 °C and the Aux SP = 55 °C, illustrated by the red line. There is
a slightly higher comfort level in the latter case, mainly during nighttime. The total amount of
energy added to the house in the two cases are (28000 ∙ 0.27) + 10900 = 18460 kWh in the
first case and (19000 ∙ 0.27) + 14200 = 19330 kWh in the second case, using the values of
wood use for the two cases from table 4.1.4, the COP=0.27 for the wood heater and the values of
solar thermal energy use from table 4.1.4. As expected the latter case, which gives a slightly
higher comfort level also adds slightly more total energy to the house.
49
Figure 4.1.6: The difference in temperature between when the Solar SP = 23 °C with an
auxiliary heater with Aux SP = 55 °C and when there is no auxiliary heater.
As can be seen in figure 4.1.6 the comfort levels are basically the same in the sitting room, this is
due to the fact that the wood heater will compensate for the reduction in heating from the solar
thermal system that occurs when the auxiliary heater is removed. It is only during nighttime,
when there is no wood heating that there is a noticeable difference in temperatures between the
two cases. The same is true for all the different cases in table 4.1.4, therefore there will not be a
big difference in comfort level between these cases.
As a way to greatly increase the comfort level compared to the current situation, simulations with
heating of all the eight rooms in the rural house, four rooms in each household on each floor,
were carried out.
The use of domestic hot water (DHW) for these simulations is 44 kg/h of 55 °C water as before.
Therefor results of the simulations regarding DHW use when heating the whole house will not be
presented, see table 4.1.2 for results regarding DHW use. There is a use of DHW in tables 4.1.6-
4.1.8 just as before if nothing else is stated.
Tables 4.1.6, 4.1.7 and 4.1.8 containing results from simulations of heating the whole house
correspond to the tables 4.1.2, 4.1.4 and 4.1.5 for the simulations of heating the sitting rooms.
Table 4.1.6 illustrates how the performance of the system varies with and without the use of
firewood and with varied heating setpoints for the solar thermal system when heating the whole
house. These setpoints dictate how much solar thermal energy is to be added to the rooms in the
house. A higher setpoint means that the system tries to keep the temperature in the sitting room
at a higher temperature.
The solar thermal system is the same as in Rural 3 in table 3.9.1. The only parameters being
4
8
12
16
20
0 24 48 72 96 120 144 168
Tem
per
ature
/°C
Time/h
SP 23, no auxSP 23, aux SP 55
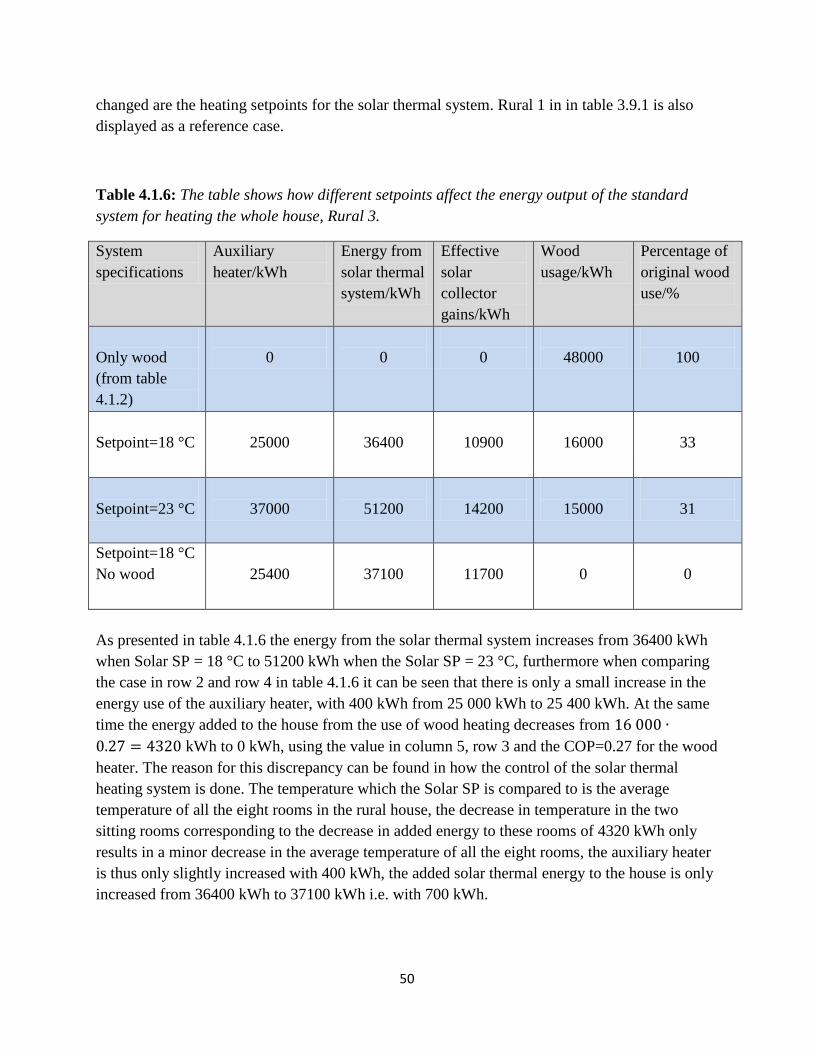
50
changed are the heating setpoints for the solar thermal system. Rural 1 in in table 3.9.1 is also
displayed as a reference case.
Table 4.1.6: The table shows how different setpoints affect the energy output of the standard
system for heating the whole house, Rural 3.
System
specifications
Auxiliary
heater/kWh
Energy from
solar thermal
system/kWh
Effective
solar
collector
gains/kWh
Wood
usage/kWh
Percentage of
original wood
use/%
Only wood
(from table
4.1.2)
0
0
0
48000
100
Setpoint=18 °C
25000
36400
10900
16000
33
Setpoint=23 °C
37000
51200
14200
15000
31
Setpoint=18 °C
No wood
25400
37100
11700
0
0
As presented in table 4.1.6 the energy from the solar thermal system increases from 36400 kWh
when Solar SP = 18 °C to 51200 kWh when the Solar SP = 23 °C, furthermore when comparing
the case in row 2 and row 4 in table 4.1.6 it can be seen that there is only a small increase in the
energy use of the auxiliary heater, with 400 kWh from 25 000 kWh to 25 400 kWh. At the same
time the energy added to the house from the use of wood heating decreases from 16 000 ∙
0.27 = 4320 kWh to 0 kWh, using the value in column 5, row 3 and the COP=0.27 for the wood
heater. The reason for this discrepancy can be found in how the control of the solar thermal
heating system is done. The temperature which the Solar SP is compared to is the average
temperature of all the eight rooms in the rural house, the decrease in temperature in the two
sitting rooms corresponding to the decrease in added energy to these rooms of 4320 kWh only
results in a minor decrease in the average temperature of all the eight rooms, the auxiliary heater
is thus only slightly increased with 400 kWh, the added solar thermal energy to the house is only
increased from 36400 kWh to 37100 kWh i.e. with 700 kWh.

51
Figure 4.1.7 illustrates the difference in temperature between the warmest, illustrated by the blue
line and coldest room on the 2nd floor, illustrated by the red line when only wood is used for
heating. As expected the temperatures are much higher in the sitting room than in the
northwestern room as there is no heating in the northwestern room at this point. At some
instances the temperatures in the northwestern room falls below freezing point.
Figure 4.1.7: The difference in temperature between the warmest and the coldest room on the
2nd floor when only wood is used for heating, i.e. the current situation in Bhutan.
As can be seen in figure 4.1.7 there is a large difference between the temperatures between the
sitting room and the coldest room in the northeastern corner on the second floor when the only
heating is wood heating in the sitting room. Furthermore there are great variations between
daytime and nighttime. The wood use is the same as the one presented in table 4.1.1, 48 000
kWh.
-4
0
4
8
12
16
0 24 48 72 96 120 144 168
Tem
per
ature
/°C
Time/h
Only wood, Sitting room
Only wood, NW room
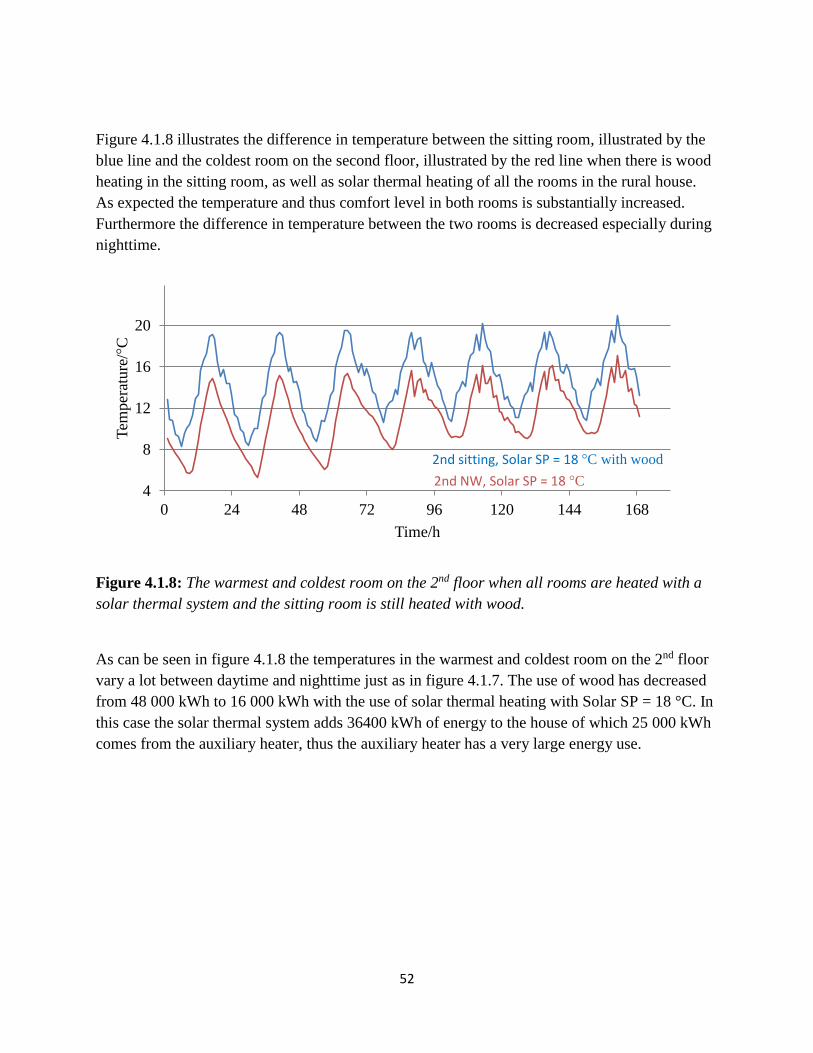
52
Figure 4.1.8 illustrates the difference in temperature between the sitting room, illustrated by the
blue line and the coldest room on the second floor, illustrated by the red line when there is wood
heating in the sitting room, as well as solar thermal heating of all the rooms in the rural house.
As expected the temperature and thus comfort level in both rooms is substantially increased.
Furthermore the difference in temperature between the two rooms is decreased especially during
nighttime.
Figure 4.1.8: The warmest and coldest room on the 2nd floor when all rooms are heated with a
solar thermal system and the sitting room is still heated with wood.
As can be seen in figure 4.1.8 the temperatures in the warmest and coldest room on the 2nd floor
vary a lot between daytime and nighttime just as in figure 4.1.7. The use of wood has decreased
from 48 000 kWh to 16 000 kWh with the use of solar thermal heating with Solar SP = 18 °C. In
this case the solar thermal system adds 36400 kWh of energy to the house of which 25 000 kWh
comes from the auxiliary heater, thus the auxiliary heater has a very large energy use.
4
8
12
16
20
0 24 48 72 96 120 144 168
Tem
per
ature
/°C
Time/h
2nd sitting, Solar SP = 18 °C with wood
2nd NW, Solar SP = 18 °C

53
Table 4.1.7 illustrates how the performance of the system when the whole rural house is heated
with Solar SP = 18 °C and 23 °C with and without insulation. The solar thermal system is the
same as in Rural 3 in table 3.9.1. The only parameters being changed are the heating setpoints for
the solar thermal system. Rural 1 in in table 3.9.1 is also displayed as a reference case.
Table 4.1.7: Amount of heating needed with, compared to without, insulation when heating all
rooms.
System
specifications
Auxiliary
heater/kWh
Energy from
solar thermal
system/kWh
Effective solar
collector
gains/kWh
Wood
usage/kWh
Percentage of
original wood
use/%
Only wood
(from table
4.1.2)
0
0
0
48000
100
Setpoint=18 °C
No insulation
25000
36400
10900
16000
33
Setpoint=18 °C
With insulation
15300
24500
9200
2600
5
Setpoint=23 °C
No insulation
37000
51200
14200
15000
31
Setpoint=23 °C
With insulation
27200
40200
13000
1500
3
As can be seen in table 4.1.7 both the auxiliary heater energy use and the wood usage drops
substantially insulation is inserted in the house using a solar thermal system with Solar SP = 18
°C. The auxiliary heater energy use drops from 25 000 kWh to 15 300 kWh and the wood use
drops from 16 000 kWh to 2600 kWh at the same time the effective gains from the solar
collector only from 10 900 kWh to 9200 kWh. The same is true when the solar thermal system
has Solar SP = 23 °C in that case the auxiliary heater energy use drops from 37 000 kWh to 27
200 kWh and the wood use drops from 15 000 kWh to 1500 kWh at the same time the effective
gains from the solar collector decreases from 14 200 kWh to 13 000 kWh.

54
Figure 4.1.9 illustrates the temperatures in the sitting room, illustrated by the blue line as well as
the coldest room, illustrated by the red line when there is wood heating in the sitting room as
well as solar thermal heating of the whole house and the rural house is insulated.
Figure 4.1.9: The temperature of the coldest and warmest room on the 2nd floor when the house
is insulated and when heated with a solar thermal system with Solar SP = 18 °C, with wood
heating. Compare the difference between this and figure 4.1.4.
As can be seen in figure 4.1.9 the temperatures in the rooms are increased when insulation is
used in the house, at the same time the energy use decreases compared to when there is no
insulation as can be seen in table 4.1.6. In the sitting room temperatures rarely go under 14°C
even during nighttime. The temperature in the coldest room falls down to 12 °C during the night.
10
14
18
22
0 24 48 72 96 120 144 168
Tem
per
atu
re/°
C
Time/h
Solar SP = 18 °C, insulation, NW room.
Solar SP = 18 °C, insulation, sitting room, wood heating.

55
In table 4.1.8 the performance of the system when the use of the auxiliary heater was decreased
or set to zero when heating the whole house was investigated. In all the simulations in table 4.1.8
the use of domestic hot water (DHW) is estimated to be zero due to the fact that the lower
temperature of the water in the tank that will result from a decreased or nullified use of the
auxiliary heater poses a risk for the growth of bacteria in the water. The water will thus be unfit
for domestic use.
Simulations where the heat exchanger, i.e. the radiator in the house, was doubled were also done
with reduced or nullified use of the auxiliary heater so that the comfort level might be increased.
Table 4.1.8: Variations on the auxiliary heater and heat exchanger, without DHW use, when
heating all rooms.
System
specifications
Auxiliary
heater/kWh
Energy from
solar thermal
system/kWh
Effective
solar
collector
gains/kWh
Wood
usage/kWh
Percentage of
original wood
use/%
Setpoint=23
Aux
Setpoint=35
13800
31500
17700
28000
58
Setpoint=23
No Aux
0
19500
19500
38000
79
Setpoint=23
No Aux
Dubble Heat
exchanger
0
20500
20500
40000
83
Setpoint=23
No Aux
Dubble Heat
exchanger
Insulation
0
19300
19300
19000
40
As can be seen in table 4.1.8 the auxiliary heater energy use is decreased to 13 800 kWh
compared to 37 000 kWh, the value in column 2, row 4 in table 4.1.5 when the Aux SP is
decreased from 55 °C to 35 °C. At the same time the energy from the solar thermal system is
decreased from 51 200 kWh to 31 500 kWh. Furthermore, when removing the auxiliary heater
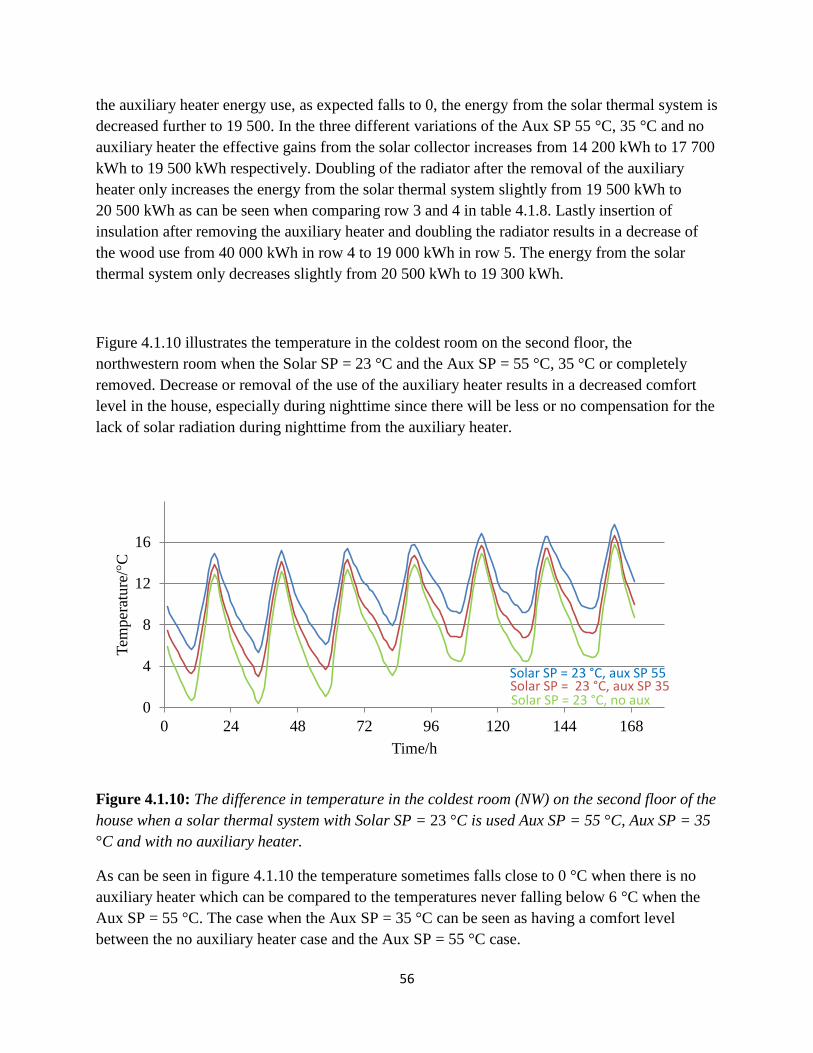
56
the auxiliary heater energy use, as expected falls to 0, the energy from the solar thermal system is
decreased further to 19 500. In the three different variations of the Aux SP 55 °C, 35 °C and no
auxiliary heater the effective gains from the solar collector increases from 14 200 kWh to 17 700
kWh to 19 500 kWh respectively. Doubling of the radiator after the removal of the auxiliary
heater only increases the energy from the solar thermal system slightly from 19 500 kWh to
20 500 kWh as can be seen when comparing row 3 and 4 in table 4.1.8. Lastly insertion of
insulation after removing the auxiliary heater and doubling the radiator results in a decrease of
the wood use from 40 000 kWh in row 4 to 19 000 kWh in row 5. The energy from the solar
thermal system only decreases slightly from 20 500 kWh to 19 300 kWh.
Figure 4.1.10 illustrates the temperature in the coldest room on the second floor, the
northwestern room when the Solar SP = 23 °C and the Aux SP = 55 °C, 35 °C or completely
removed. Decrease or removal of the use of the auxiliary heater results in a decreased comfort
level in the house, especially during nighttime since there will be less or no compensation for the
lack of solar radiation during nighttime from the auxiliary heater.
Figure 4.1.10: The difference in temperature in the coldest room (NW) on the second floor of the
house when a solar thermal system with Solar SP = 23 °C is used Aux SP = 55 °C, Aux SP = 35
°C and with no auxiliary heater.
As can be seen in figure 4.1.10 the temperature sometimes falls close to 0 °C when there is no
auxiliary heater which can be compared to the temperatures never falling below 6 °C when the
Aux SP = 55 °C. The case when the Aux SP = 35 °C can be seen as having a comfort level
between the no auxiliary heater case and the Aux SP = 55 °C case.
0
4
8
12
16
0 24 48 72 96 120 144 168
Tem
per
ature
/°C
Time/h
Solar SP = 23 °C, aux SP 55Solar SP = 23 °C, aux SP 35Solar SP = 23 °C, no aux
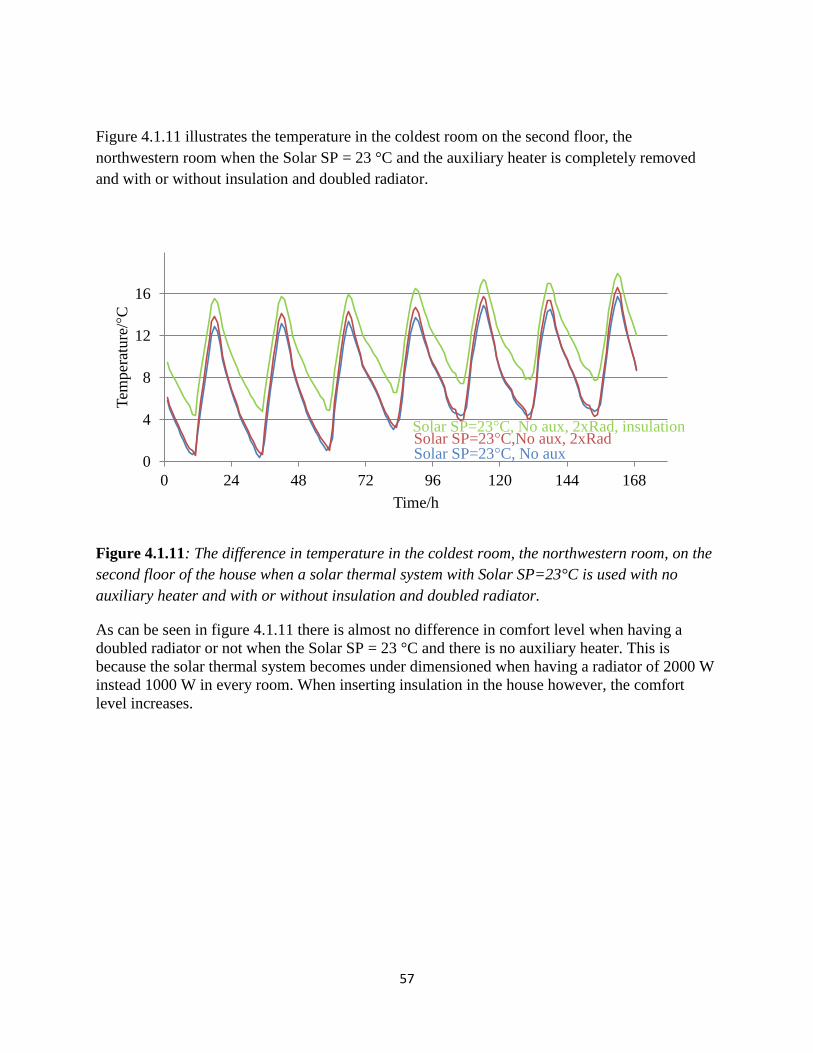
57
Figure 4.1.11 illustrates the temperature in the coldest room on the second floor, the
northwestern room when the Solar SP = 23 °C and the auxiliary heater is completely removed
and with or without insulation and doubled radiator.
Figure 4.1.11: The difference in temperature in the coldest room, the northwestern room, on the
second floor of the house when a solar thermal system with Solar SP=23°C is used with no
auxiliary heater and with or without insulation and doubled radiator.
As can be seen in figure 4.1.11 there is almost no difference in comfort level when having a
doubled radiator or not when the Solar SP = 23 °C and there is no auxiliary heater. This is
because the solar thermal system becomes under dimensioned when having a radiator of 2000 W
instead 1000 W in every room. When inserting insulation in the house however, the comfort
level increases.
0
4
8
12
16
0 24 48 72 96 120 144 168
Tem
per
ature
/°C
Time/h
Solar SP=23°C, No aux, 2xRad, insulationSolar SP=23°C,No aux, 2xRadSolar SP=23°C, No aux
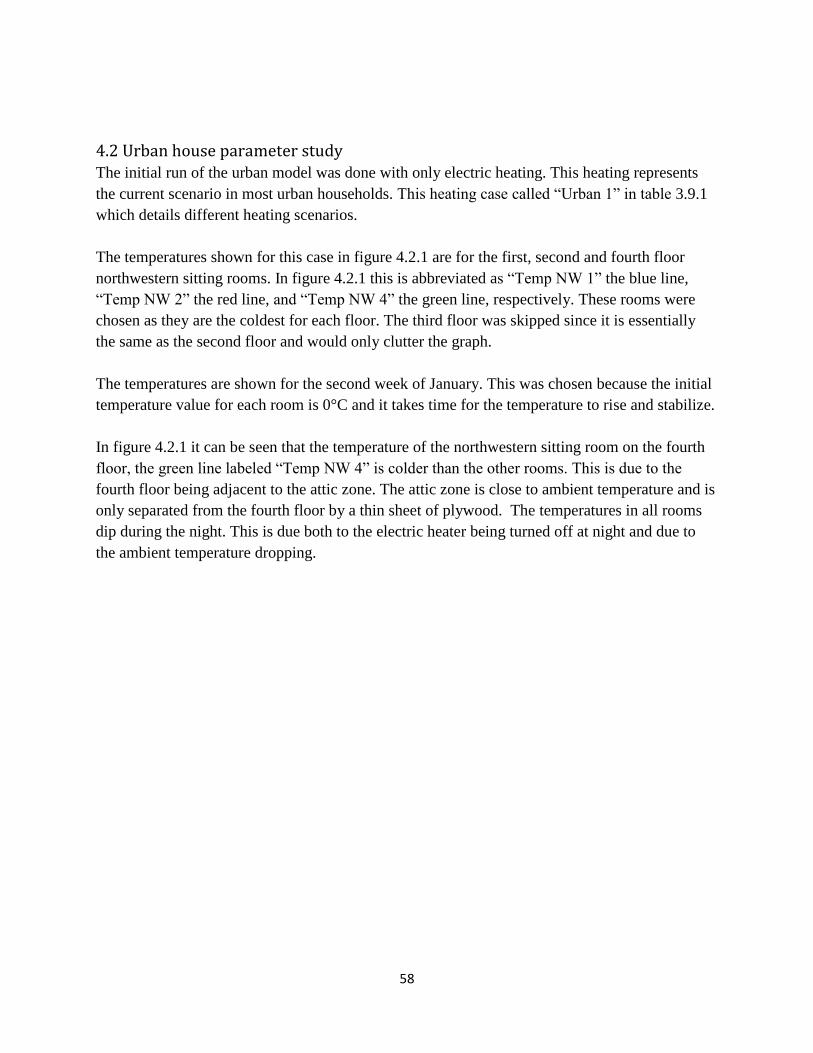
58
4.2 Urban house parameter study
The initial run of the urban model was done with only electric heating. This heating represents
the current scenario in most urban households. This heating case called “Urban 1” in table 3.9.1
which details different heating scenarios.
The temperatures shown for this case in figure 4.2.1 are for the first, second and fourth floor
northwestern sitting rooms. In figure 4.2.1 this is abbreviated as “Temp NW 1” the blue line,
“Temp NW 2” the red line, and “Temp NW 4” the green line, respectively. These rooms were
chosen as they are the coldest for each floor. The third floor was skipped since it is essentially
the same as the second floor and would only clutter the graph.
The temperatures are shown for the second week of January. This was chosen because the initial
temperature value for each room is 0°C and it takes time for the temperature to rise and stabilize.
In figure 4.2.1 it can be seen that the temperature of the northwestern sitting room on the fourth
floor, the green line labeled “Temp NW 4” is colder than the other rooms. This is due to the
fourth floor being adjacent to the attic zone. The attic zone is close to ambient temperature and is
only separated from the fourth floor by a thin sheet of plywood. The temperatures in all rooms
dip during the night. This is due both to the electric heater being turned off at night and due to
the ambient temperature dropping.
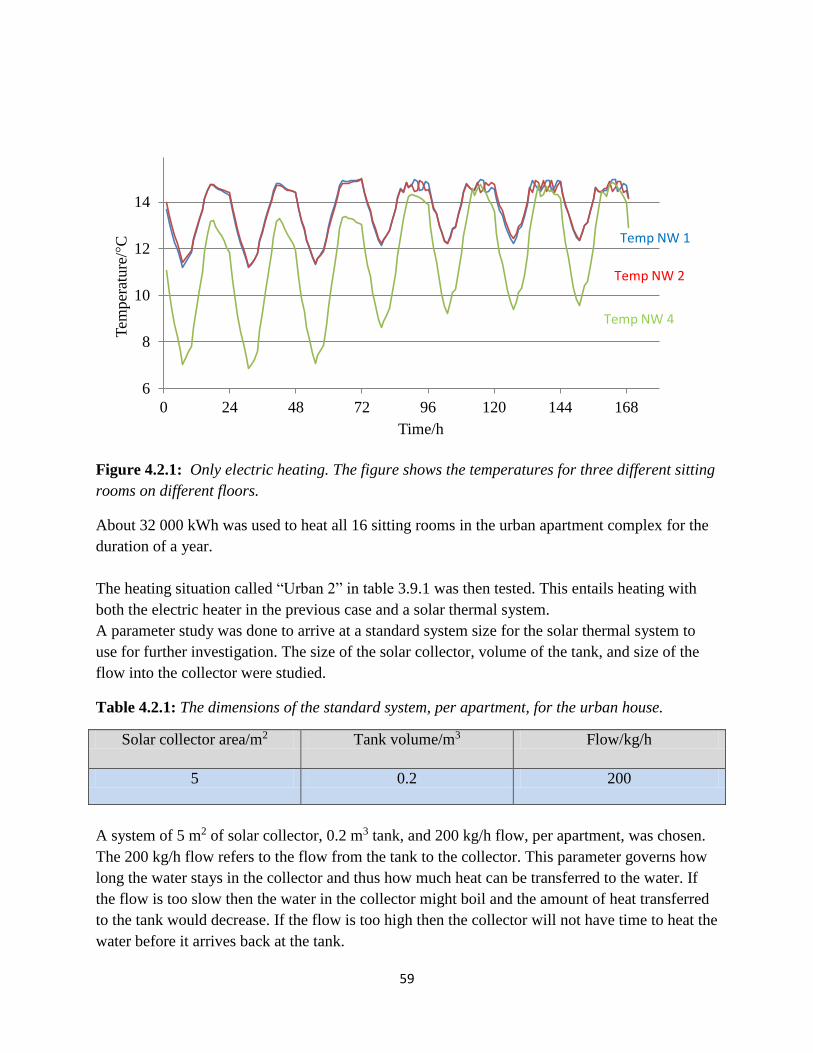
59
Figure 4.2.1: Only electric heating. The figure shows the temperatures for three different sitting
rooms on different floors.
About 32 000 kWh was used to heat all 16 sitting rooms in the urban apartment complex for the
duration of a year.
The heating situation called “Urban 2” in table 3.9.1 was then tested. This entails heating with
both the electric heater in the previous case and a solar thermal system.
A parameter study was done to arrive at a standard system size for the solar thermal system to
use for further investigation. The size of the solar collector, volume of the tank, and size of the
flow into the collector were studied.
Table 4.2.1: The dimensions of the standard system, per apartment, for the urban house.
Solar collector area/m2 Tank volume/m3 Flow/kg/h
5 0.2 200
A system of 5 m2 of solar collector, 0.2 m3 tank, and 200 kg/h flow, per apartment, was chosen.
The 200 kg/h flow refers to the flow from the tank to the collector. This parameter governs how
long the water stays in the collector and thus how much heat can be transferred to the water. If
the flow is too slow then the water in the collector might boil and the amount of heat transferred
to the tank would decrease. If the flow is too high then the collector will not have time to heat the
water before it arrives back at the tank.
6
8
10
12
14
0 24 48 72 96 120 144 168
Tem
per
ature
/°C
Time/h
Temp NW 1
Temp NW 4
Temp NW 2

60
The auxiliary heater in the storage tank has a maximum heating rate of 4 kW and is set to keep
the temperature of the water at 55 °C.
These choices were based on performance but also on economic viability and are discussed
further in the discussion segment below. This system will be referred to as the standard system
below.
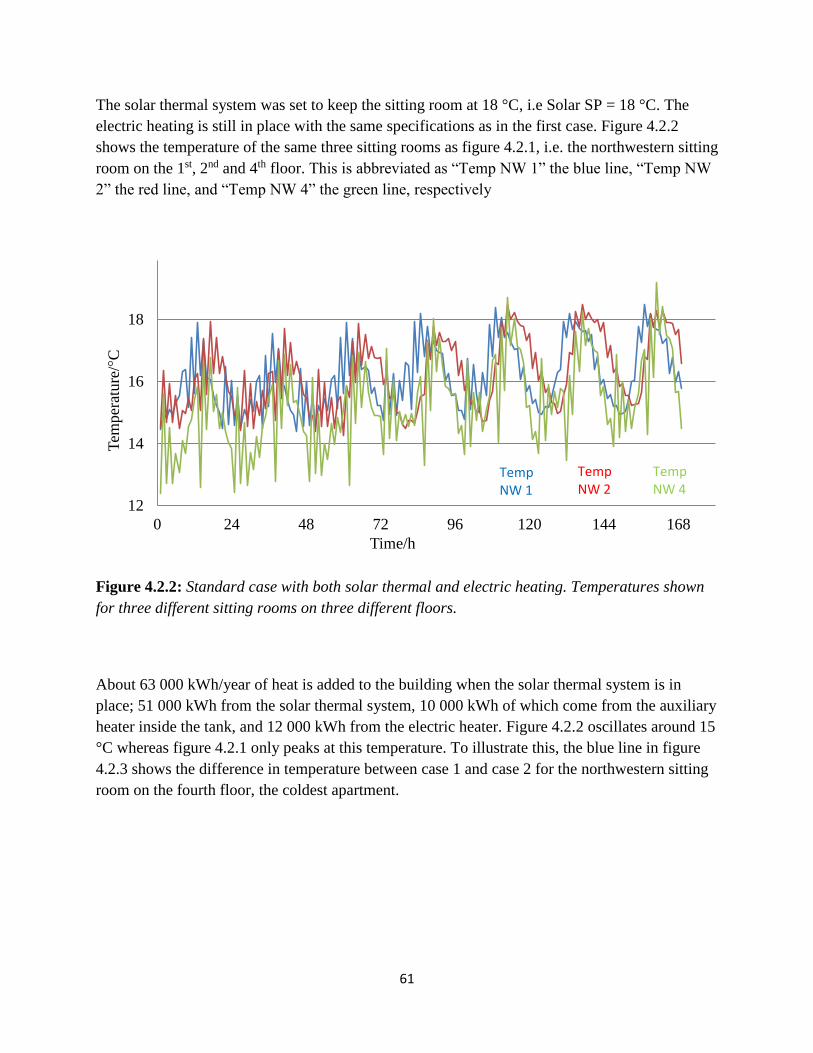
61
The solar thermal system was set to keep the sitting room at 18 °C, i.e Solar SP = 18 °C. The
electric heating is still in place with the same specifications as in the first case. Figure 4.2.2
shows the temperature of the same three sitting rooms as figure 4.2.1, i.e. the northwestern sitting
room on the 1st, 2nd and 4th floor. This is abbreviated as “Temp NW 1” the blue line, “Temp NW
2” the red line, and “Temp NW 4” the green line, respectively
Figure 4.2.2: Standard case with both solar thermal and electric heating. Temperatures shown
for three different sitting rooms on three different floors.
About 63 000 kWh/year of heat is added to the building when the solar thermal system is in
place; 51 000 kWh from the solar thermal system, 10 000 kWh of which come from the auxiliary
heater inside the tank, and 12 000 kWh from the electric heater. Figure 4.2.2 oscillates around 15
°C whereas figure 4.2.1 only peaks at this temperature. To illustrate this, the blue line in figure
4.2.3 shows the difference in temperature between case 1 and case 2 for the northwestern sitting
room on the fourth floor, the coldest apartment.
12
14
16
18
0 24 48 72 96 120 144 168
Tem
per
ature
/°C
Time/h
TempNW 1
Temp NW 2
Temp NW 4
62
Figure 4.2.3: The difference in temperature for each hour between case 1 and 2 for the
northwestern sitting room on the fourth floor.
As can be seen in figure 4.2.3, the difference in temperature between the two cases varies
between 0.5 to just above 7 °C. The difference is due to the standard case with the solar thermal
system provides more heat. The difference is less during the night since less heating is provided
at this time.
Since the houses in Bhutan were poorly insulated, a case was tested in which the U-values of the
external walls, the ceiling above the fourth floor, and the windows, were decreased. The values
went from:
External wall: 0.88, Ceiling: 4,23 Windows: 5,68 W/m2 ∙ K
To:
External wall: 0.26, Ceiling: 0.33 Windows: 2,83 W/m2 ∙ K.
The floor towards the outside on the first floor was not insulated, as it was in the rural case with
insulation, because the foundation the urban house stands on already has quite a low U-value of
0.91 𝑊/𝑚2 ∙ 𝐾.
The solar thermal system and the electric heater have the same specifications as in the standard
case. Again, the temperatures shown are for the northwestern sitting rooms on the 1sr, 2nd and 4th
floor. This is abbreviated as “Temp NW 1” the blue line, “Temp NW 2” the red line, and “Temp
NW 4” the green line, respectively.
0
2
4
6
0 24 48 72 96 120 144 168
Tem
per
ature
dif
fere
nce
/°C
Time/h
Temperature difference
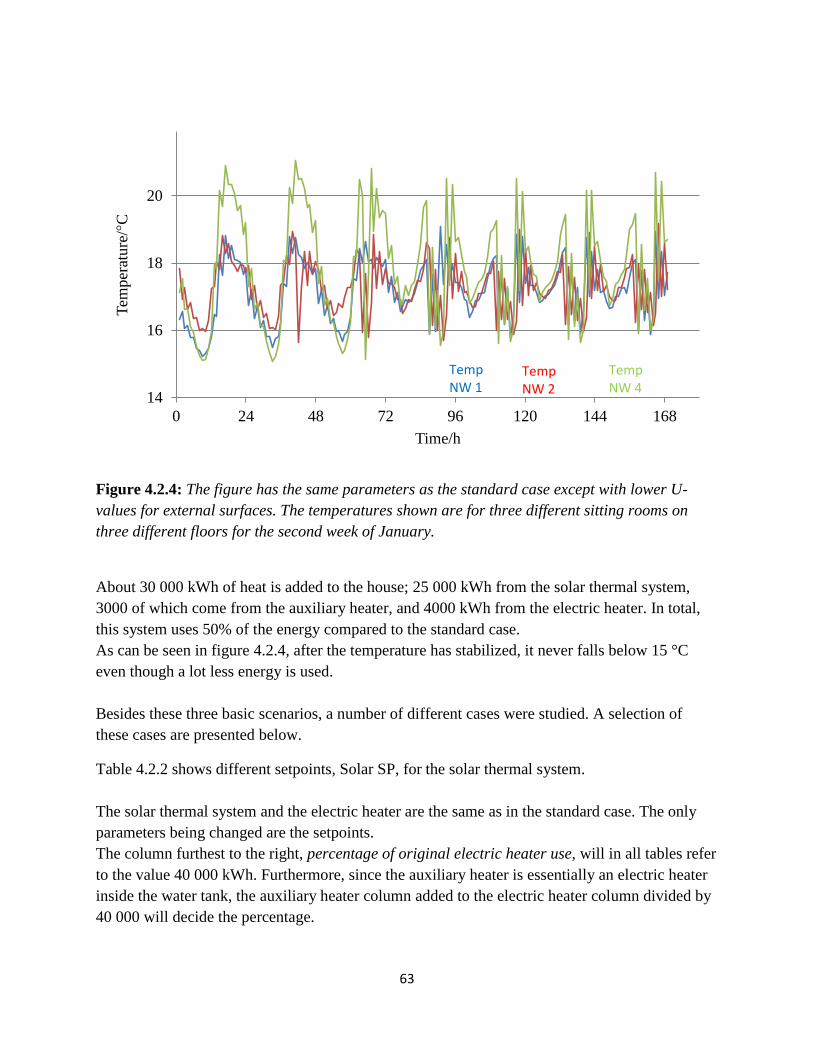
63
Figure 4.2.4: The figure has the same parameters as the standard case except with lower U-
values for external surfaces. The temperatures shown are for three different sitting rooms on
three different floors for the second week of January.
About 30 000 kWh of heat is added to the house; 25 000 kWh from the solar thermal system,
3000 of which come from the auxiliary heater, and 4000 kWh from the electric heater. In total,
this system uses 50% of the energy compared to the standard case.
As can be seen in figure 4.2.4, after the temperature has stabilized, it never falls below 15 °C
even though a lot less energy is used.
Besides these three basic scenarios, a number of different cases were studied. A selection of
these cases are presented below.
Table 4.2.2 shows different setpoints, Solar SP, for the solar thermal system.
The solar thermal system and the electric heater are the same as in the standard case. The only
parameters being changed are the setpoints.
The column furthest to the right, percentage of original electric heater use, will in all tables refer
to the value 40 000 kWh. Furthermore, since the auxiliary heater is essentially an electric heater
inside the water tank, the auxiliary heater column added to the electric heater column divided by
40 000 will decide the percentage.
14
16
18
20
0 24 48 72 96 120 144 168
Tem
per
ature
/°C
Time/h
TempNW 1
Temp NW 2
Temp NW 4
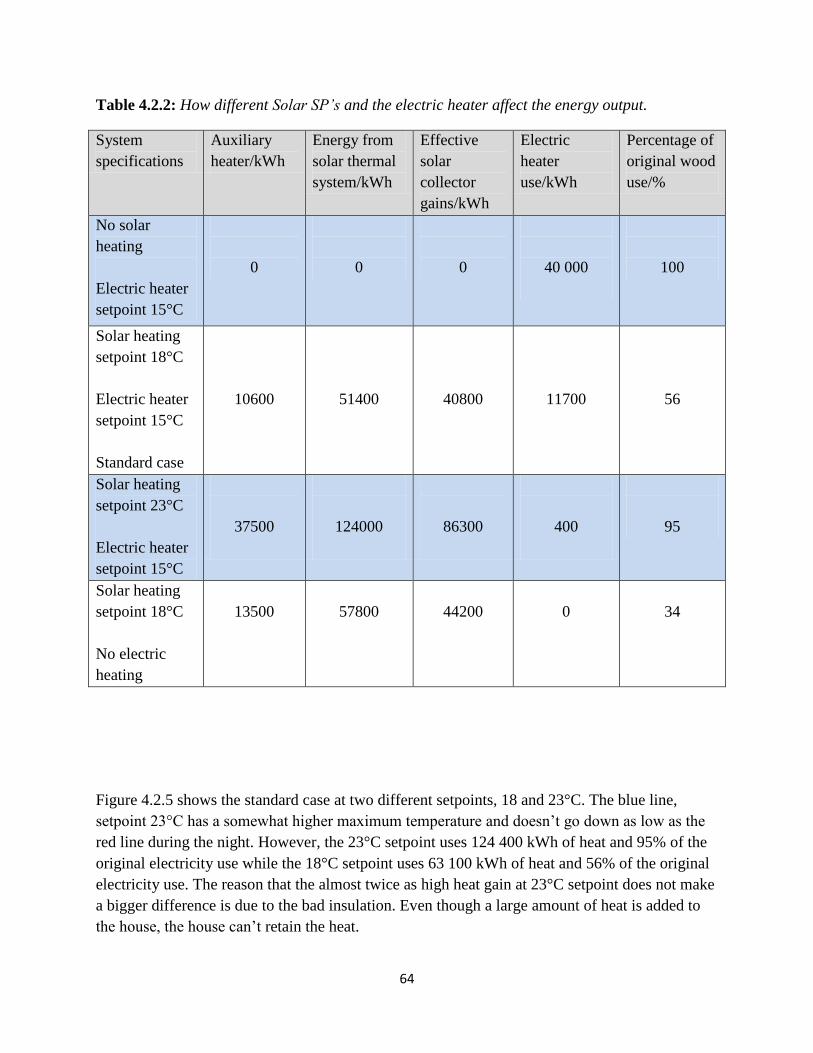
64
Table 4.2.2: How different Solar SP’s and the electric heater affect the energy output.
System
specifications
Auxiliary
heater/kWh
Energy from
solar thermal
system/kWh
Effective
solar
collector
gains/kWh
Electric
heater
use/kWh
Percentage of
original wood
use/%
No solar
heating
Electric heater
setpoint 15°C
0
0
0
40 000
100
Solar heating
setpoint 18°C
Electric heater
setpoint 15°C
Standard case
10600
51400
40800
11700
56
Solar heating
setpoint 23°C
Electric heater
setpoint 15°C
37500
124000
86300
400
95
Solar heating
setpoint 18°C
No electric
heating
13500
57800
44200
0
34
Figure 4.2.5 shows the standard case at two different setpoints, 18 and 23°C. The blue line,
setpoint 23°C has a somewhat higher maximum temperature and doesn’t go down as low as the
red line during the night. However, the 23°C setpoint uses 124 400 kWh of heat and 95% of the
original electricity use while the 18°C setpoint uses 63 100 kWh of heat and 56% of the original
electricity use. The reason that the almost twice as high heat gain at 23°C setpoint does not make
a bigger difference is due to the bad insulation. Even though a large amount of heat is added to
the house, the house can’t retain the heat.
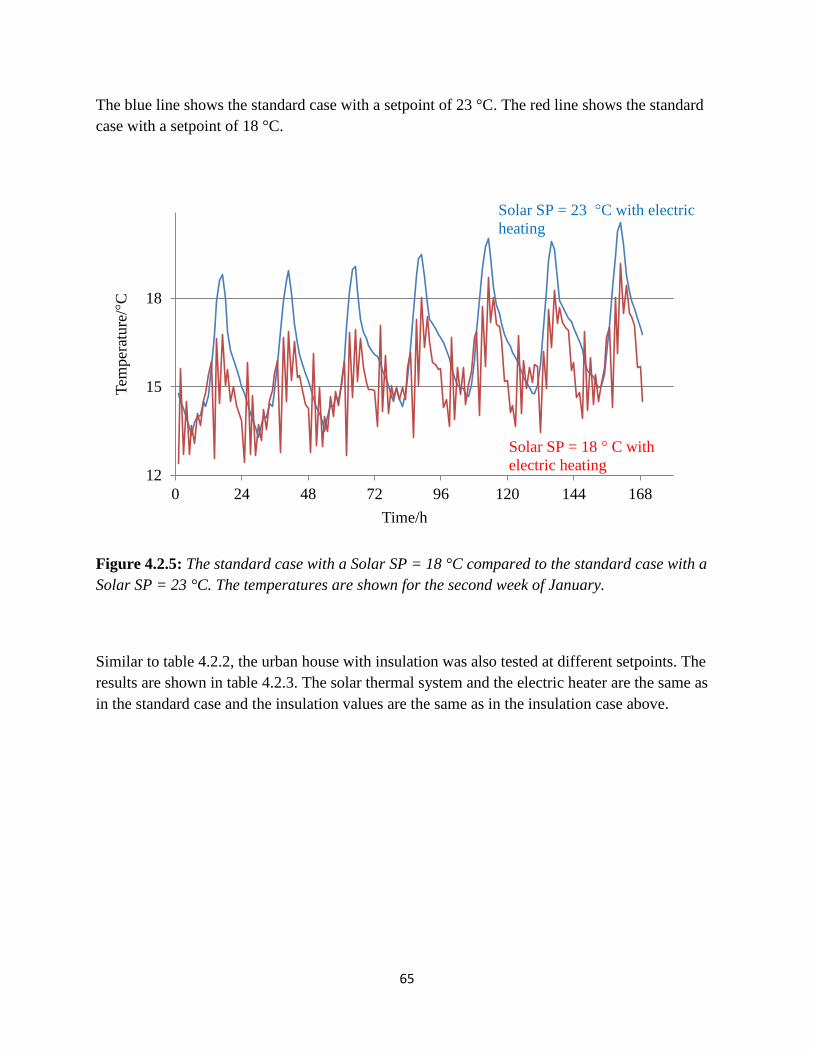
65
The blue line shows the standard case with a setpoint of 23 °C. The red line shows the standard
case with a setpoint of 18 °C.
Figure 4.2.5: The standard case with a Solar SP = 18 °C compared to the standard case with a
Solar SP = 23 °C. The temperatures are shown for the second week of January.
Similar to table 4.2.2, the urban house with insulation was also tested at different setpoints. The
results are shown in table 4.2.3. The solar thermal system and the electric heater are the same as
in the standard case and the insulation values are the same as in the insulation case above.
12
15
18
0 24 48 72 96 120 144 168
Tem
per
ature
/°C
Time/h
Solar SP = 23 °C with electric
heating
Solar SP = 18 ° C with
electric heating
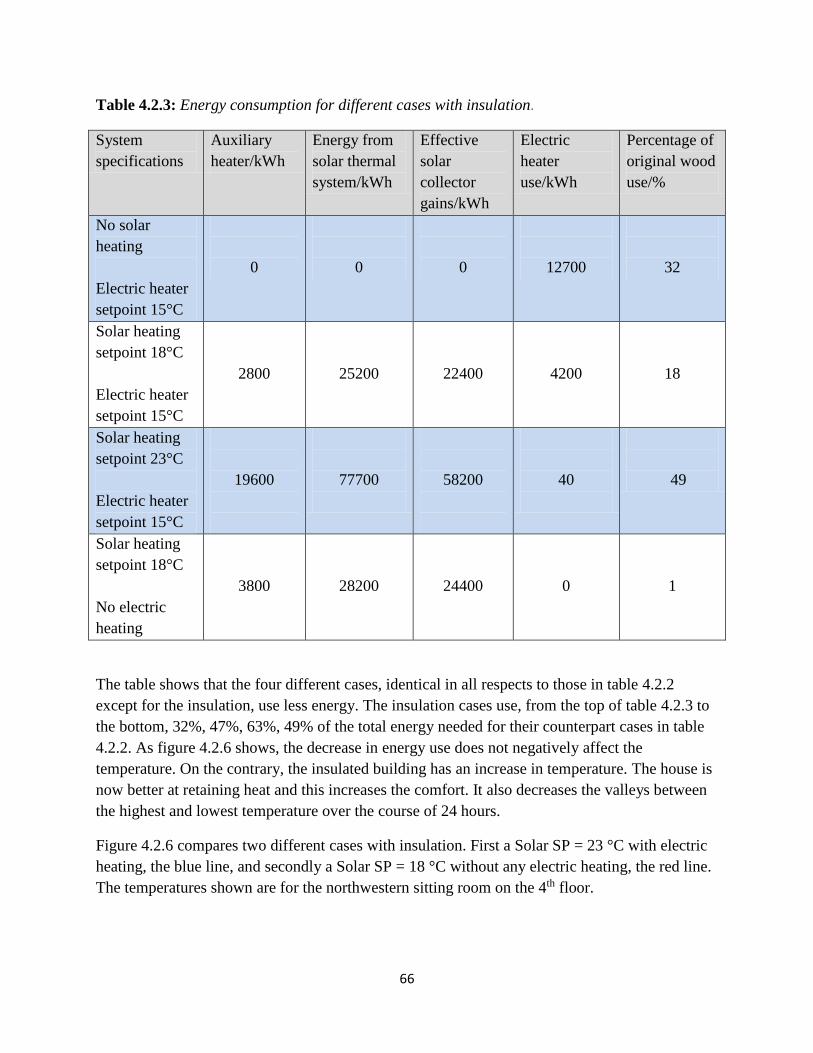
66
Table 4.2.3: Energy consumption for different cases with insulation.
System
specifications
Auxiliary
heater/kWh
Energy from
solar thermal
system/kWh
Effective
solar
collector
gains/kWh
Electric
heater
use/kWh
Percentage of
original wood
use/%
No solar
heating
Electric heater
setpoint 15°C
0
0
0
12700
32
Solar heating
setpoint 18°C
Electric heater
setpoint 15°C
2800
25200
22400
4200
18
Solar heating
setpoint 23°C
Electric heater
setpoint 15°C
19600
77700
58200
40
49
Solar heating
setpoint 18°C
No electric
heating
3800
28200
24400
0
1
The table shows that the four different cases, identical in all respects to those in table 4.2.2
except for the insulation, use less energy. The insulation cases use, from the top of table 4.2.3 to
the bottom, 32%, 47%, 63%, 49% of the total energy needed for their counterpart cases in table
4.2.2. As figure 4.2.6 shows, the decrease in energy use does not negatively affect the
temperature. On the contrary, the insulated building has an increase in temperature. The house is
now better at retaining heat and this increases the comfort. It also decreases the valleys between
the highest and lowest temperature over the course of 24 hours.
Figure 4.2.6 compares two different cases with insulation. First a Solar SP = 23 °C with electric
heating, the blue line, and secondly a Solar SP = 18 °C without any electric heating, the red line.
The temperatures shown are for the northwestern sitting room on the 4th floor.
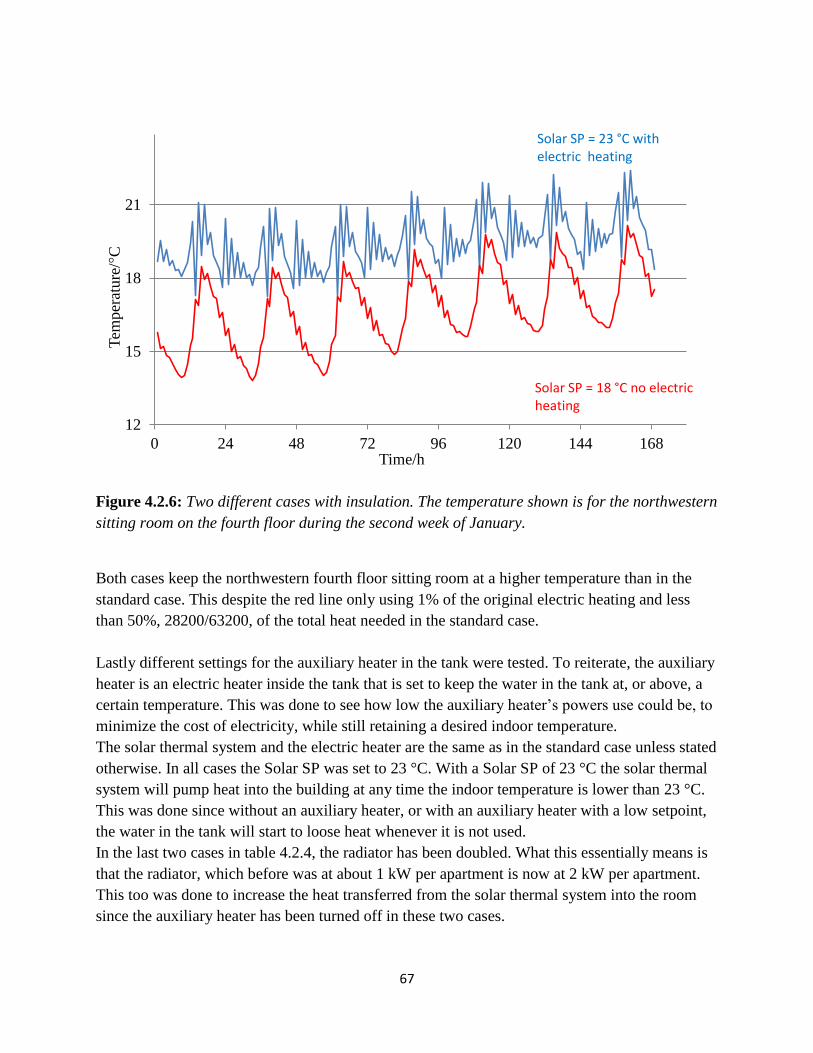
67
Figure 4.2.6: Two different cases with insulation. The temperature shown is for the northwestern
sitting room on the fourth floor during the second week of January.
Both cases keep the northwestern fourth floor sitting room at a higher temperature than in the
standard case. This despite the red line only using 1% of the original electric heating and less
than 50%, 28200/63200, of the total heat needed in the standard case.
Lastly different settings for the auxiliary heater in the tank were tested. To reiterate, the auxiliary
heater is an electric heater inside the tank that is set to keep the water in the tank at, or above, a
certain temperature. This was done to see how low the auxiliary heater’s powers use could be, to
minimize the cost of electricity, while still retaining a desired indoor temperature.
The solar thermal system and the electric heater are the same as in the standard case unless stated
otherwise. In all cases the Solar SP was set to 23 °C. With a Solar SP of 23 °C the solar thermal
system will pump heat into the building at any time the indoor temperature is lower than 23 °C.
This was done since without an auxiliary heater, or with an auxiliary heater with a low setpoint,
the water in the tank will start to loose heat whenever it is not used.
In the last two cases in table 4.2.4, the radiator has been doubled. What this essentially means is
that the radiator, which before was at about 1 kW per apartment is now at 2 kW per apartment.
This too was done to increase the heat transferred from the solar thermal system into the room
since the auxiliary heater has been turned off in these two cases.
12
15
18
21
0 24 48 72 96 120 144 168
Tem
per
ature
/°C
Time/h
Solar SP = 23 °C with electric heating
Solar SP = 18 °C no electric heating

68
Table 4.2.4: The energy output during different scenarios of the auxiliary heater. The last row is
with insulation, the others are without.
System
specifications
Auxiliary
heater/kWh
Energy
from solar
thermal
system/kWh
Effective
solar
collector
gains/kWh
Electric
heater
use/kWh
Percentage of
original
wood use/%
No auxiliary
heater.
Electric heater
setpoint 15°C.
0
58600
58600
6700
17
Auxiliary heater
set at 35 °C.
7600
72000
64300
4400
30
No auxiliary
heater.
Radiator
doubled.*
0
64300
64300
4000
10
No auxiliary
heater.
Radiator
doubled.*
Insulated house.
0
45800
45800
270
>1
* This refers to the radiator that transports the heat from the solar thermal system into each
sitting room. The flow (kg/h) into, and out from, the radiator as well as the heat transfer
coefficient (W/k) were all doubled.
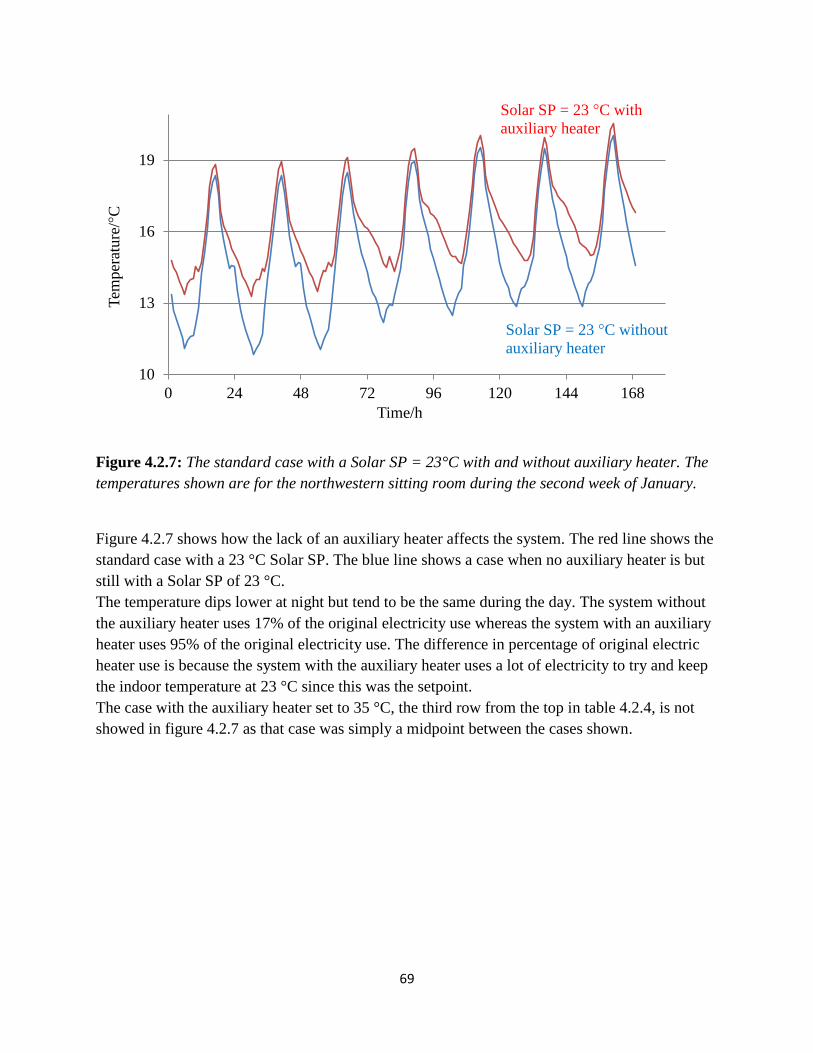
69
Figure 4.2.7: The standard case with a Solar SP = 23°C with and without auxiliary heater. The
temperatures shown are for the northwestern sitting room during the second week of January.
Figure 4.2.7 shows how the lack of an auxiliary heater affects the system. The red line shows the
standard case with a 23 °C Solar SP. The blue line shows a case when no auxiliary heater is but
still with a Solar SP of 23 °C.
The temperature dips lower at night but tend to be the same during the day. The system without
the auxiliary heater uses 17% of the original electricity use whereas the system with an auxiliary
heater uses 95% of the original electricity use. The difference in percentage of original electric
heater use is because the system with the auxiliary heater uses a lot of electricity to try and keep
the indoor temperature at 23 °C since this was the setpoint.
The case with the auxiliary heater set to 35 °C, the third row from the top in table 4.2.4, is not
showed in figure 4.2.7 as that case was simply a midpoint between the cases shown.
10
13
16
19
0 24 48 72 96 120 144 168
Tem
per
ature
/°C
Time/h
Solar SP = 23 °C without
auxiliary heater
Solar SP = 23 °C with
auxiliary heater
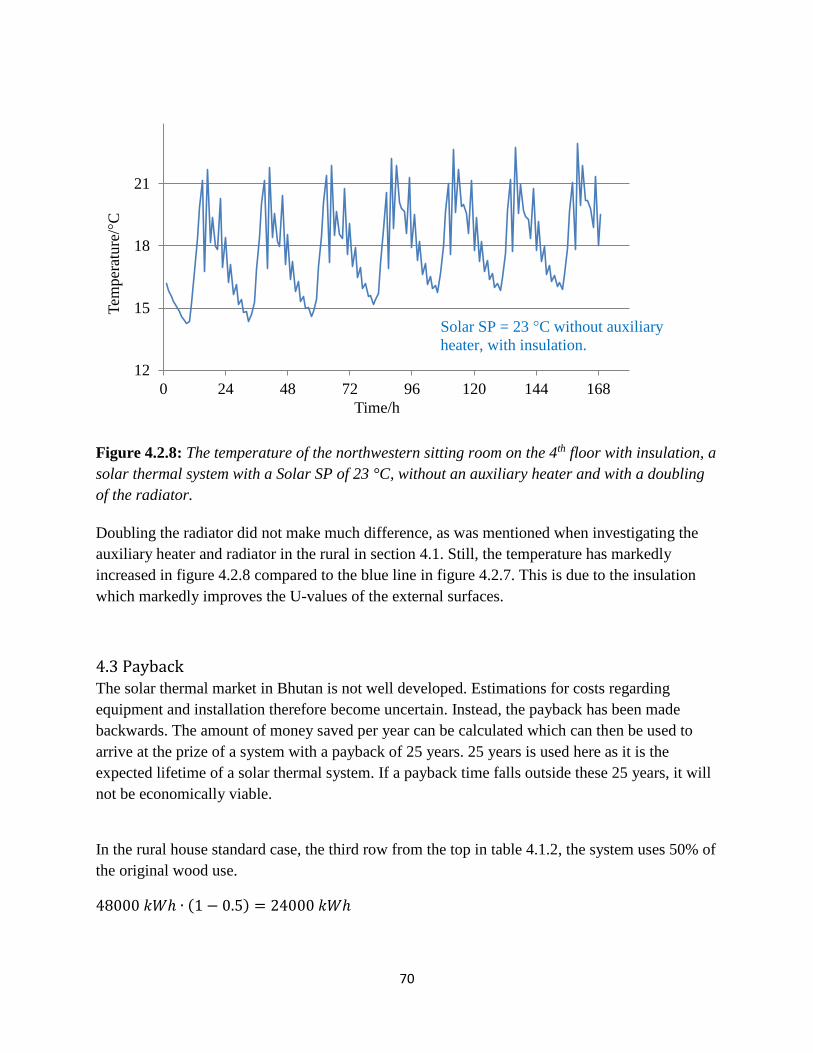
70
Figure 4.2.8: The temperature of the northwestern sitting room on the 4th floor with insulation, a
solar thermal system with a Solar SP of 23 °C, without an auxiliary heater and with a doubling
of the radiator.
Doubling the radiator did not make much difference, as was mentioned when investigating the
auxiliary heater and radiator in the rural in section 4.1. Still, the temperature has markedly
increased in figure 4.2.8 compared to the blue line in figure 4.2.7. This is due to the insulation
which markedly improves the U-values of the external surfaces.
4.3 Payback The solar thermal market in Bhutan is not well developed. Estimations for costs regarding
equipment and installation therefore become uncertain. Instead, the payback has been made
backwards. The amount of money saved per year can be calculated which can then be used to
arrive at the prize of a system with a payback of 25 years. 25 years is used here as it is the
expected lifetime of a solar thermal system. If a payback time falls outside these 25 years, it will
not be economically viable.
In the rural house standard case, the third row from the top in table 4.1.2, the system uses 50% of
the original wood use.
48000 𝑘𝑊ℎ ∙ (1 − 0.5) = 24000 𝑘𝑊ℎ
12
15
18
21
0 24 48 72 96 120 144 168
Tem
per
ature
/°C
Time/h
Solar SP = 23 °C without auxiliary
heater, with insulation.
71
24000 kWh are saved per year. Which is equal to 1 truckload of wood since the whole wood use
of 480000 kWh is estimated to being 2 truckloads. 1 truckload of hard wood costs 14 000
Nu(Interview 2015). Nu is the abbreviation of Nultrum which is the Bhutanese currency. At the
time of writing (2016 - 01 - 14) a Nultrum, which has its value tied to the Indian Rupee, is worth
0.0136 Euros or 0.0149 US Dollars or 0.126 Swedish Krona (XE, 2016).
At the same time the auxiliary heater uses 2800 kWh of electricity. The price electricity when
consuming 2800 kWh/year is 2.45 Nu (Bhutan Power Corporation Limited, 2016).
The savings each year comes to:
14000 𝑁𝑢/𝑦𝑒𝑎𝑟 − (2800 ∙ 2.45) 𝑁𝑢/𝑦𝑒𝑎𝑟 = 7140 𝑁𝑢/𝑦𝑒𝑎𝑟
7140 Nu/year is saved for both households. The standard system for the rural house supplying
both households with solar thermal energy is 15 m2 of solar collector area and 0.65 m3 of thermal
storage tank for both households or 7.5 m2 of solar collector area and 0.325 m3 thermal storage
tank for each household.
A system of that size would have to cost, to have a payback of exactly 25 years:
7140 𝑁𝑢/𝑦𝑒𝑎𝑟 ∙ 25 𝑦𝑒𝑎𝑟𝑠 = 178 500 𝑁𝑢
This is equivalent to 2428 Euros, 2660 US dollars or 22491 Swedish Krona. As mentioned
before it was difficult to find prices to compare these to. However these values must be seen as
low. The 15 m2 solar collector alone would cost 55 500 Swedish krona in Sweden (Sjöberg et al.
2012). This is more than twice of what the whole system would have to cost for it to have a
payback of 25 years.
In the urban standard case, the third row from the top in table 4.2.2, the system uses 56% of the
original electricity use.
40000 𝑘𝑊ℎ ∙ (1 − 0.56) = 17600 𝑘𝑊ℎ
17600 kWh are saved per year. The price of electricity when consuming 40000 kWh/year is
2.45 Nu/kWh (Bhutan Power Corporation Limited, 2016).
The savings each year comes to:
17600 𝑘𝑊ℎ/𝑦𝑒𝑎𝑟 ∙ 2.45𝑁𝑢/𝑘𝑊ℎ = 43120 𝑁𝑢/𝑦𝑒𝑎𝑟
72
The standard system for the urban house uses 5 m2 of solar collector area and 0.2 m3 of thermal
storage tank per apartment. With 16 apartments this comes to 80 m2 of collector and 3.2 m3 of
tank. A system of this size would have to cost, to have a payback of exactly 25 years:
43120 𝑁𝑢/𝑦𝑒𝑎𝑟 ∙ 25 𝑦𝑒𝑎𝑟𝑠 = 1078000 𝑁𝑢
This is the equivalent of 14660 Euros or 16062 US Dollars or 135 828 Swedish Krona. As was
mentioned above, it was difficult to find prices to compare these to, even so, these values can be
seen as low. The 80 m2 of solar collector alone would, in Sweden, cost 296 000 Swedish Krona
(Sjöberg et al. 2012) which is more than twice the value of what the whole system would have to
cost for it to have a payback of 25 years.
73
5. Discussion
There is no doubt that a solar thermal system could contribute greatly to the heating of residential
buildings in the Thimphu area. The cold but sunny winters are ideal for such a solution. The
question is how small such a system can be made and still be beneficial. The smaller the system,
the cheaper it will be, as the main obstacle for implementing a solar thermal system is its cost.
Solar thermal systems have a high initial cost and, generally, a long payback period. This is
especially true in Bhutan since not much heating is used in Thimphu over the period of a whole
year. Furthermore, the payback period depends on what fuel is being replaced.
In the case of the rural house, where wood heating is currently the dominant way of heating, the
payback period becomes very long since wood is heap in Bhutan. In the payback section it was
concluded that just the solar collectors for the standard rural case would in Sweden, cost more
than twice of what the price for the whole system would have to cost for the payback time to be
25 years. 25 is not an optimal payback period for an investment.
In the case of urban areas, where electricity is the dominant way of heating, the payback period
becomes unreasonable since electricity is so cheap.
In the Payback section above, it was shown that the just the solar collectors for the standard
urban case would, in Sweden, cost more than twice what the price for the whole system would
have to be for a payback of 25 years. 25 years is already a less than optimal payback period for
an investment.
In both cases the systems would have to be unreasonably cheap for them to be profitable. The
payback does not in itself warrant the large investment a solar thermal system requires. With
subsidies of some kind, either governmental or from an NGO, solar thermal system might be
economically viable. That being said, ways to fund solar thermal systems fall well outside the
scope of this report.
For a solar thermal system to make sense, other values besides those purely economic would
have to be taken into account, such as comfort, environmental and social benefits.
When interviewing residents, it was found that every single household thought that their house or
apartment did not get warm enough in winter. Not enough heating is used to produce a
comfortable indoor environment. While it’s difficult to measure comfort in monetary value, it is
the basis for the heating need. Every kWh of heating could be saved if the heating was simply
turned off but this is ludicrous as it would result in an uncomfortable indoor environment.
Comfort is important and a solar thermal system would increase comfort.
74
In Bhutan there is a will to diversify their energy production and to this end solar thermal energy
could play a part (Department of Energy, 2010). It could decrease electricity from hydropower
currently being used for heating. This electricity could instead be added to the export to India or
otherwise be used for a better purpose since electricity is a highly refined type of energy which is
wasted when converted to heat.
From 1995 to 2013 Bhutan increased its annual electricity consumption from 338 GWh to 1901
GWh, more than a fivefold increase. This is expected to keep rising. In 2013 the export of
electricity to India was 75% of the total domestic production (Lhendup & Lhamo, 2015). Using
electricity for heating will only be viable for a finite amount of time as electricity is a valuable
commodity for Bhutan, a country which has not got any other significant exports.
Electricity is mainly used for heating in urban areas. In rural areas solar thermal systems would
instead decrease the use of firewood as a fuel. Since Bhutan has in its constitution that the
country’s forest cover has to be above 60% and since the country is one of the highest per capita
users of firewood in the world, a decrease in firewood use would be desireable (Department of
Energy 2009).
Another benefit could be that the person that stays home minding the fire, in the households
interviewed this was the wife, would be free from this task. The households interviewed assured
us that the wife in the family would have stayed at home in any case but if no one has to mind
the fire at least it is one less reason for someone to have to stay at home.
Despite these benefits it is still seems that, barring a major subsidy of some sort, a solar thermal
system would not be viable for private people to install in their homes, be it in urban or rural
households. The overall positive effects do not help the private citizen to fund a system that,
when all is said and done, is currently too expensive.
5.1 Fault sources in models and simulations There are a number of fault sources in the simulations. Number one, the two different models of
a typical rural and urban Bhutanese house in and around Thimphu are simplifications based on
the fieldwork done on site in Bhutan. The urban houses in Bhutan are very homogeneous in how
they are constructed as they all follow strict rules that make them more or less identical. Since
the simplification of the urban house was based on a blueprint it can be considered to be very
good. In the simplification however as with all simplifications information is lost and the model
becomes less like the real house.
When it comes to the rural houses the fault in the simplified model should be considered to be
greater due to the fact that rural houses around Thimphu are more heterogeneous.
The information that the simplification was based on can thus be considered to be worse than
that which the urban model was based on.
75
The weather file is also a fault source. As mentioned before the weather data acquired was not
complete and around 35% of the temperature values as well as 5% of the solar radiation values
are interpolated between the measured values, this will of course result in the weather file being
a less accurate description of the actual weather than if all the values had been measured. The
month of May especially is made up from few data points. However, this should not affect the
results of the simulations to a great extent as little to no amount of heating is required in May in
Thimphu.
Lastly the TRNSYS simulation program makes a model of a real situation and as any model it is
full of simplifications.
5.2 Different systems
5.2.1 Limitations
As was seen in many of the figures in the result section, the temperature could not always be
kept at the setpoint. This is due to the limitations in the system. These limitations include the size
of the auxiliary heater in the thermal storage tank and the flow rate from the thermal storage tank
to the radiators. A larger flow rate from the tank demands a larger auxiliary heater for it to be
able to always hold the temperature of the water in the thermal storage tank at the auxiliary
heating setpoint, if the temperature of the water falls below this the heating from the radiators
will be less. Due to very large heat losses from the Bhutanese houses, both rural and urban, the
flow rate from the thermal storage tank as well as the size of the auxiliary heater in the tank
would have to be unreasonably large to make it certain that the solar thermal system will always
heat the houses to the heating setpoint for the solar thermal systems.
5.2.2 Rural
When studying table 4.1.2 one can see that heating the sitting rooms in the rural house with a
solar thermal system with the setpoint 18 °C one can reduce the wood use with 50%
corresponding to 24 000 kWh of wood. In this case 2800 kWh of electricity is used by the
auxiliary heater. Using this kind of system also increases the level of comfort especially during
nighttime in the sitting rooms, this can be seen in figure 4.1.2 representing the temperature in the
sitting room on the second floor, which is the colder sitting room of the two. Temperatures
during nighttime are increased from being typically just above 5 °C to being around 10 °C.
In figure 4.1.1 it can be seen that there is no substantial difference in the comfort level in the
sitting room on the 2nd floor of the house when using only wood heating or using only solar
heating. The same comfort level can be obtained with a solar thermal system while completely
mitigating the wood use.
The amount of energy added to the two sitting rooms during a whole year when using only the
76
wood heater is 48000 ∙ 0.27 = 12960 ≈ 13000 kWh, using the wood consumption in case 1
and the COP=0.27 of the wood heater. The amount of energy added to the two sitting rooms
during a whole year when using only the solar thermal system with the Solar SP = 18 °C is
10500 kWh using the value in column 3, row 5 in table 4.1.2. The amounts of energy added in
these two situations during a whole year are thus rather similar to one another resulting in
comparable comfort levels. However the comfort level will be somewhat higher at daytime on a
yearly basis when only using wood compared to when only using solar thermal with Solar SP =
18°C. Att nighttime however the comfort level will be slightly higher with the solar thermal
system due to the solar thermal system will heat the rooms 24 hours a day compared to the wood
heater that only heats the house between 6.00 am to 11 pm.
At some occasions during the year when the solar radiaton is exceptionally low the comfort level
will be noticably higher when only using wood compared to using only the solar thermal system
with Solar SP = 18 °C. However there happens to be no such cases in the second week of
January which is illustrated in figure 4.1.2.
Increasing the setpoint of the solar heating system to 23 °C decreases the use of wood further as
can be seen in table 4.1.2, but the amount of electricity used by the auxiliary heater is doubled
from 2800 kWh to 5600 kWh.
When heating the whole rural house the wood use decreases further as can be seen in table 4.1.6.
However, it is not possible to reach a good comfort level which can be seen in figure 4.1.8 where
the temperatures in the coldest room on the second level sometimes does not reach above 15 °C
during daytime and falls as low as 5 °C during nighttime.
5.2.3 Urban
If one looks at the standard case for the urban house, figure 4.2.3 shows the difference that a
solar thermal system can make. The graph shows the difference between the coldest sitting room,
the northwest one on the top floor, when being heated by only an electric heater and when heated
with an electric heater and a solar thermal system. The temperature is between 0.5 and 7 °C
warmer. A marked increase in comfort.
In the solar thermal case, 73 100 kWh of heat is provided to the building as opposed to only
40 000 kWh. This is done while using only 56% of the original electricity use.
When looking at the setpoint of 23 °C, figure 4.2.5, with all other parameters the same as the
standard case, one can see that it does not make a great difference comfort wise. The setpoint 23
°C system only seldom falls below 15 °C at night whereas the standard case always does.
However, the daytime temperatures differ no more than 2 °C at their peaks. This despite the
setpoint 23 °C system having to use 95 % of the original electricity use as the auxiliary heater
77
has to work hard to maintain the set temperature.
124 400 kWh of heat is added to the house in the setpoint 23 °C case but too much is lost
through the badly insulated walls for it to make much of a difference.
5.2.4 Domestic hot water use
As can be seen in table 4.1.3 the use of 44 kg/day 55 °C hot water increases the use of the
auxiliary heater with 400 kWh. If the same amount of hot water had been generated through a
geyser with an electric element with COP=1 it would use around 840 kWh as can be seen in the
calculation connected to table 4.1.3. This means that energy is saved by using the solar thermal
system for heating water. This is probably due to the fact that during the hot months of the year
when no heating of the house is needed the thermal storage tank gets hot enough with the help of
just solar radiation and thus the auxiliary heater would not have to be used. The geyser however
would have to heat the water the whole year regardless of the ambient temperature and solar
radiation.
The conclusion of this is that energy is saved by using the solar thermal system to heat water for
domestic use. If the amount of domestic hot water from the solar thermal system needs to be
increased the system could handle this as well.
5.2.5 Insulation
One of the main benefits that solar thermal systems in the residential sector in Bhutan might have
is an increase in the comfort level. One major obstacle to achieving maximum increase in
comfort level from a certain solar thermal system is the lack of insulation in Bhutanese houses.
From th field studies as well as studies of reports on Bhutanese houses(Fieldwork 2015)
(National Statistics Bureau, Bhutan, Asian Development Bank, 2013) it was concluded that
Bhutanese houses, rural as well as urban generally only have single pane windows and walls
with no insulation.
This results in very high heat losses from the houses and makes it difficult to reach a reasonable
comfort level even with large amounts of thermal energy flowing into the house. Using double
pane windows and inserting 10 cm of insulation material in the walls, floor and roof of the house
results in a substantial improvement of the comfort level in the house as well as allowing a
reduction in the amount of energy needed to reach this new better level of comfort.
When studying the heating of all the rooms in the rural house one should look at the coldest
room in the house. From figure 4.1.8 and figure 4.1.9 one can draw the conclusion that it is only
when insulation is used a somewhat reasonable comfort level can be reached in the coldest room
in the rural house when heated with solar thermal energy. Reasonable here meaning a level of
comfort comparable to the level of comfort that people currently have in their sitting rooms but
for the whole house.
78
For example when heating the whole rural house to 18 °C the energy, when the house is
insulated, use for the auxiliary heater in the tank decreased from 25 000 kWh to 15 300 kWh and
the wood usage in the stove decreased from 16 000 kWh to 2600 kWh, almost nullifying the
wood use. This can be seen in table 4.1.7. At the same time the comfort level increased. The
coldest temperatures during the night in the coldest room on the second floor dropped to around
12 °C. This can be compared to the coldest temperatures dropping down to 5 °C during the night
in the same room with the same kind of heating when insulation is not used. This can be seen
when comparing figure 4.1.8 with figure 4.1.9.
In the case of the urban house, only the sitting room was heated. When looking at the comfort of
the coldest sitting room, one can see that with insulation a slightly higher comfort can be
achieved while only using about half the total energy. The standard case, figure 4.2.2, uses 63100
kWh compared the standard case with insulation, figure 4.2.4, which uses 29400 kWh.
Insulation makes the swings in temperature between night and day less dramatic while keeping
the total temperature slightly warmer.
In both the rural and urban case it can be argued that trying to heat the house to a reasonable
comfort level is a losing battle if insulation is not installed. Increasing the setpoint to 23, to try
and pump a lot of heat into the house, uses large amounts of energy while still not providing a
truly desirable indoor comfort level.
In, for example, figure 4.1.3, setpoint 23 compared to only heating with firewood for heating the
sitting rooms in the rural house, it can be seen that the difference in comfort level is not that
great. The temperature with setpoint 23 drops to 10 °C at night although the total energy use is
33200 kWh compared to 48000 kWh.
After concluding this the valid question of how much it would cost to put insulation and double
window panes in a typical rural or urban Bhutanese household arises, however this falls outside
the scope of this report.
5.2.6 Variation of the auxiliary heater
Trying to cut back on the electricity use, it was tested what would happen if the auxiliary heater
was removed. Doing this does however make the system unusable for domestic hot water as it
risks bacterial growth in the tank.
Removing the auxiliary heater means that the solar thermal system is limited in the amount of
heat it can provide during the night. Since both the firewood and electric heating options for the
rural and urban house respectively are turned off during the night, the removal of the auxiliary
heater means that there is nothing that can regulate the indoor temperature at night. This makes
the temperature dip further during the night making the temperature high and lows more
noticeable. How it affect the rural and urban house specifically can be read below.
79
5.2.7 Rural variation of auxiliary heater
In the case when only the sitting rooms are heated in the rural house, variation of the auxiliary
heater, such as lowering its setpoint for heating or removing it completely has very little effect
on the comfort level in the sitting rooms.
However if one wants to remove the auxiliary heater and thus its electricity consumption this can
be done with the tradeoff that 9000 kWh more wood will be used for heating, as can be seen in
table 4.1.5.
When heating all the rooms in the rural house one should look at the coldest room in the house to
evaluate the comfort level. A reasonable comfort level can only be reached in the coldest room,
when heating it with solar thermal energy, if the house is insulated. When removing the auxiliary
heater the comfort level drops substantially with daytime temperatures sometimes not reaching
up to 15 °C and nighttime temperatures sometimes dropping as low as 5 °C, even if the
insulation is used which can be seen in figure 4.1.11. Furthermore one can conclude that
doubling of the radiator has virtually no effect on the comfort level in the rural house by looking
at figure 4.1.11.
5.2.8 Urban variation of auxiliary heater
Removing the auxiliary heater, while saving energy, decreases the comfort of the urban house. In
figure 4.2.7 it can be seen that without the auxiliary heater the temperature drops significantly
further during the night, although not below 10 °C
If however the auxiliary heater is removed and insulation is installed, a good level of comfort can
be achieved while at the same time using less than 1 % of the original electricity use, as can be
seen in figure 4.2.8.
With the current situation in urban Thimphu, that is the houses not being insulated, it seems
better to have an auxiliary heater in the tank as this increases the comfort. It also gives the future
option to use the tank for domestic hot water if desired.
Although if energy costs is a large concern, the auxiliary heater could be removed in the urban
house without the comfort in the sitting room being unreasonably low.
80
6. Conclusion
The overall research questions for this thesis were as follows:
How much of the supplied fuel used for residential heating could be replaced or mitigated
with a solar thermal system of varying sizes?
Anwser: When it comes to the rural house 48 000 kWh of firewood use in one year can be
mitigated with a solar thermal system that uses 3500 kWh electricity for the auxiliary heater.
That number includes the amount of electricity needed to produce 44kg/hr 55C water
corresponding to about 400 kWh. This does not however lead to an increase in the comfort level,
the comfort level will stay basically the same, some days it will be better some days it will be
worse than when only wood is used. Other cases where the comfort level is increased and some
wood is still used can occur but if the aim is just to decrease the amount of firewood this can be
done to 100% with basically the same comfort level.
When it comes to the urban house the energy used can be mitigated but since the auxiliary heater
in the tank also runs on electricity it cannot be reduced to 0. Not since it was concluded that the
auxiliary heater is needed for good comfort.
The electricity use can however be decreased. The standard case for the urban house decreases
the original electricity use with 54 %. If the electric heater is removed, and the heating solely
relied to the standard case solar thermal system, the electricity use can be lowered with 66 %, at
the cost of some comfort. With insulation, these two cases lowers the original electricity use with
82 - and 99 % respectively.
Which parameters make for an optimal solar thermal system in this specific case?
Optimal here meaning most heat for the lowest cost.
Anwser: The parameters decided for the different cases were as follows: 15m2 solar collector
area, 0.65 m3 thermal storage tank volume and 200 kg/hr water flow from the solar collector to
the thermal storage tank for the case when only the two sitting rooms in the rural house were
heated.
20m2 solar collector area, 0.85 m3 thermal storage tank volume and 400 kg/h water flow from the
solar collector to the thermal storage tank for the case when the whole rural house was heated.
And lastly 20m2 solar collector area, 0.8 m3 thermal storage tank volume and 200 kg/h water
flow from the solar collector to the thermal storage tank for each floor in the four stories urban
house in the case when the sitting rooms in the urban house were heated.
These dimensions were found to be reasonable in terms of amount of energy produced, increase
in comfort level, decrease in wood or electricity use and cost after conducting the parameter
studies in TRNSYS.
81
In and around Thimphu, how much heating would such a solar thermal system provide
for a residential building during a year?
In the case of the rural house standard case, at 18 °C, when only heating the sitting rooms, 6800
kWh of heating is supplied. When the whole rural house is heated, the standard case with the
solar thermal system heating setpoint is at 18 °C, 10900 kWh are extracted from the solar
thermal collector.
In the urban house standard case, which entails only heating the sitting rooms, with the
dimensions mentioned above, 40800 kWh are produced during a year.
If a solar thermal system was in place, how would it impact the comfort level of the
residents?
Anwser: It is clear that the use of solar thermal energy in the residential sector would increase
the comfort level for the residents in various degrees depending on how the system is
dimensioned. However although the use of solar thermal energy in the residential sector would
increase the comfort level it is hard to reach a comfort level comparable to, for example, northern
Europe without also using more insulation and double pane windows in the Bhutanese houses.
The increased use of insulation is also important to keep down the energy use which is large due
to the heat losses.
82
7 Suggestions for future work
There are a number of suggestions for future work based on this report. Firstly simulations where
a whole Bhutanese urban house is heated could be made. Furthermore more simulations and
experiments when using increased amount of insulation in the Bhutanese houses should be made
where the insulation is increased even further. Another aspect of insulation could be to test
insulating just the roof since this might give a raised comfort at a low price.
The models made and used for this report could be developed further. The U-values for the
house materials were chosen from the library in type 56 and are not measured values from the
sites. The amount of infiltration was also a rough estimate. Much could be done to make the
models more detailed and reliable.
Regarding the solar thermal system, a rough estimate was made as to the height of the inlet in the
tank from the solar thermal collector. It could be of interest to test different heights of the inlet,
different tanks and different flow rates.
The economic part of this report is very limited. Future work could be done to make a detailed
analysis of how high the price of the energy being mitigated would have to be for a solar thermal
system to be viable. Further economic investigations could be done on what type of subsidies
that would make a solar thermal system viable.
83
8. References
Bhutan travel bureau, 2015. Altitude in Bhutan.
Link: http://www.bhutantravelbureau.com/about-bhutan/township-altitudes/ [2016-01-06]
Bhutan Power Corporation Limited, 2016. Electricity Tariffs.
http://www.bpc.bt/utilities/electricity-tariffs/ [2016 - 01 - 14
Biomass Energy Centre, 2011. Typical calorific values of fuels.
http://www.biomassenergycentre.org.uk/portal/page?_pageid=75,20041&_dad=portal [2016-01-
07]
Department of Energy, Ministry of Economic Affairs, 2010. Integrated energy management plan
for Bhutan. The Energy and Resources Institute.
Department of Energy, Ministry of Economic Affairs, 2009. Overview of Energy Policies of
Bhutan. Department of Energy.
EN 832, 1998. Thermal performance of buildings - Calculation of energy use for heating –
Residential buildings. Page 9. European standard.
Fieldwork: Fieldwork on Bhutanese private houses, in and around the Thimphu area, 21-22
October 2015, Seven different Bhutanese households.
Government of Bhutan, 1997: 8th five year plan 1997-2002.
Link: http://www.gnhc.gov.bt/wp-content/uploads/2011/04/08fyp.pdf
Gson Engqvist, 2007. Håll värmen med braskamin. vi i villa.
http://www.viivilla.se/artiklar/2007/11/28/hall-varmen-med-braskamin/ [2016-01-07]
Interviews: Private Bhutanese residents, in and around the Thimphu area, 21-22 October 2015,
Seven different Bhutanese households.
Kvale, S., & Brinkmann, S; 2009. InterViews: Learning the craft of qualitative research
interviewing. Los Angeles: Sage Publications
Lhendup, T., Lhamo, P. 2015. System Design and Performance Analysis of a Grid-Tied Solar PV
Power System in Bhutan. College of Science and Technology, Bhutan.
84
Lhendup, T., Lhamo: Professor at the College of Science and Technology, Phuntsholing, Bhutan.
November 2015.
Mallet, Alexandra. 2007. Social acceptance of renewable energy innovations: The role of
technology cooperation in urban Mexico. Energy Policy, volume 35, issue 5.
Link: http://www.sciencedirect.com/science/article/pii/S0301421506004927
NASA. 2016. NASA Surface meteorology and Solar Energy: RETScreen Data .
https://eosweb.larc.nasa.gov/cgi-
bin/sse/retscreen.cgi?email=rets%40nrcan.gc.ca&step=1&lat=26.5&lon=89.2&submit=Submit
[2016-01-06].
National Statistics Bureau, Bhutan, Asian Development Bank, 2013: Bhutan
Living Standards Survey 2012 Report.
Palit, D. and Garud, S. 2010. Energy consumption in the residential sector
in the Himalayan kingdom of Bhutan. The Energy and Resources Institute.
Pokharel, Shaligram. 2003. Promotional issues on alternative energy technologies in Nepal.
Energy policy, volume 31, issue 4.
Link: http://www.sciencedirect.com/science/article/pii/S0301421502000435
Purohit, P. Michaelowa, A. 2008. CDM potential of solar water heating systems in India. Solar
Energy, volume 82, issue 9.
Link: http://www.sciencedirect.com/science/article/pii/S0038092X08000480
Seidman, I., 2013. Interviewing as Qualitative Research; A Guide for Researchers in Education
& the Social Sciences. New York, Teachers College Press.
Sjöberg P., Johansson P., Borgecrona Y., Carlsson A. 2012, Utvärdering av solvärmebidraget
och solvärmestödet. Boverket.
The World Bank, 2014. Population, total.
Link: http://data.worldbank.org/indicator/SP.POP.TOTL [2016-01-07]
85
Titman D.J., 2001. Applications of Thermography in Non-destructive Testing of Structures.
NDT&E international 34 (2001) 149 – 154.
TRNSYS, 2016. What is TRNSYS?.
Link: http://www.trnsys.com/ [2016-01-06]
XE, 2016. XE Currency Converter. http://www.xe.com/currencyconverter/# [2016 – 01 – 14]