Embed Size (px)
Citation preview

Solar Tracking Structure Design
By Hashem Bukhamsin, Angelo Edge,
Roger Guiel, Dan Verne
Team 18
Final Project Report
Document
Submitted towards partial fulfillment of the requirements for Mechanical Engineering Design I – Fall 2013
Department of Mechanical Engineering
Northern Arizona University Flagstaff, AZ 86011
Solar Power Tracking System
Task 3-Power Point Tracking for Solar Energy Northern Arizona University (NAU)
NAU College of Engineering, Forestry and Natural Science
Team SOLAREADY: Hashem Bukhamsin, Angelo Edge, Roger Guiel, Dan Verne, Majad Alharbi, Curt DuRocher,
M. Ian Farnsworth, Michael Helland, Dustin Sagg
Advisors: Dr. Tom Acker, Dr. David Scott and Professor Srinivas Kosaraju
March 21, 2014
Task 3 Northern Arizona University | 1

TABLE OF CONTENTS Executive Summery ........................................................................................................................ 3
Task Identification .......................................................................................................................... 3
Full-scale Design ............................................................................................................................ 4
Bench-scale ..................................................................................................................................... 5
Structural Analysis .......................................................................................................................... 7
Electrical hardware and Programming Design ............................................................................... 8
Program Flow Chart ...................................................................................................................... 11
Cost Analysis ................................................................................................................................ 11
Waste Generation .......................................................................................................................... 13
Technical Evaluation .................................................................................................................... 13
Legal, Health Issues and Economic Analysis ............................................................................... 15
Conclusion .................................................................................................................................... 15
References ..................................................................................................................................... 16
Task 3 Northern Arizona University | 2
Executive Summery Capturing and transforming the sun’s energy into electricity using photovoltaic collection technology has been an ongoing research topic since the early 1960’s. In more recent years, the demand has grown significantly for solar electric power generating systems thus causing the production to rise as well. With the demand for such technology higher efficiency and cost effectiveness has also become a requirement; simply put, higher output power generation is being required with a lower price tag. This demand has paved the way for research groups worldwide to invest time and energy into developing more advanced technologies to suit the needs of the ever growing clean energy industry. The challenge that is currently being posed within the Waste Management & Education Research Consortium (WERC) competition is to build off of current solar generation technologies in order to eliminate un-needed materials or tasks as well as designing the most efficient autonomous power generation system possible. Fortunately, most recently designed esolar panels have already increased in power output while the cost has diminished compared to their ten year old counterparts. What is now needed is a system that can utilize the maximum amount of sunlight hours in a day via a motorized tracking system while requiring as little power as possible to run that tracking system. A Northern Arizona University mechanical and electrical engineering group has developed a system that meets the criteria of efficiency and cost effectiveness. By utilizing a wide square support structure of lightweight stock steel tubing, lightweight brackets and joints, the physical structure provides mobility for storage or transportation as well as durability against rough weather. The structure design also provides a manually adjusted North to South axis to optimize the collection of sun light throughout the year based off of the suns changing latitude. This adjustable axis allows for more power generation throughout the year without needing to power a separate motor driven axis. Utilizing location as well as time of year based equations this axis can be manually adjusted every three months at a minimal cost of $400 per year to pay a private contractor to check the north to south angle assuming a pay of $20 per hour. The team of electrical engineers has designed a very simple tracking system for the east to west axis by using basic components. Storing the produced energy within a rechargeable 12 volt direct current (DC) deep cycle marine battery pack, the system allows for the powering of a small scale micro-controller. This micro-controller regulates sensor responses as well as chronological based data in order to apply voltage to a actuator control arm which will physically move the panel to the estimated location of the sun. These components come to an estimated cost of just over $300, not including the solar panel itself. By employing a low power micro-controller and a low power high torque actuator, the Northern Arizona University Engineering team has designed an effective model for future solar power generating systems. This model meets the desired capabilities of producing as much output power as possible all while being affordable to the average consumer for small scale applications or even being deployed in a large scale solar farm power plant setting.
Task Identification According to data collected by the Energy Information Administration, the United States
is the 2nd largest energy consumer in the world with the majority of this energy being obtained from fossil fuels. Because the world’s fossil fuels are limited, the use of renewable energy is being widely encouraged and explored.
Task 3 Northern Arizona University | 3
Solar energy is increasing in popularity throughout the world. Germany continues to lead the world in solar power production while breaking its own records year after year [1] despite the nation’s nearly perpetual cloud cover. Saudi Arabia has pledged to reach a solar energy capacity of 41 Giga-Watts within the next 20 years [2]. There is a large potential for solar power production in many locations throughout the United States and there are a number of means of application. If utilized, many new industries could prosper within the United States as well as globally all while decreasing the use of modern fossil fuels. Harnessing nearly infinite solar energy could significantly subsidize power production methods which produce large amounts of greenhouse gases.
Solar power production is usually accomplished using one of two methods. The first method utilizes Photovoltaic (PV) cells to convert sunlight into an electric current by the means of the photoelectric effect, in which a material absorbs electrons after receiving energy from a light source. A photovoltaic cell takes advantage of this effect by harnessing the electron flow in the form of direct current electricity. This method is what team Solaready has decided to proceed with for designing our tracking system. The second method of solar energy power production is the Concentrated Solar Power (CSP) method. CSP generation uses mirrors to concentrate sunlight into a specific spot. Unlike the PV method, the goal of the CSP method is to produce heat in order to drive a heat engine. Electricity is produced via a generator connected to the heat engine. This project will focus on the use of PV cells.
Nationally the interest in green and solar technology has significantly risen and the industry is demanding more efficient and cost effective systems. This project will improve current environmentally friendly solar power technologies in order to increase efficiency and decrease waste. The NAU engineering team was tasked to design a tracking system for a photovoltaic solar power system, which will track the sun’s movements in order to collect as much of the sun’s energy as possible.
The team must develop a solar tracking system that will demonstrate its cost effectiveness as compared to stationary PV system. A lifecycle analysis for the system must be completed that includes the manufacturing, installation, maintenance and disposal of the solar system being proposed. The design must quantify the differences in power generation with and without the solar tracking device. To accomplish this project, the team generated a list of engineering requirements to conduct research, and evaluate designs. Based on the engineering analysis, all the parts needed to build this design will cost a total of just under $700 not including the solar panel.
Full-scale Design As modern solar fields become larger to produce more energy, certain parts of the single
tracking system are eliminated to simplify the design and reduce the cost. The square base of the solar tracker has been removed since the tracker does not need to be portable. Critical components, such as the bearings, linear actuator, elbows, conduit, PVC tubing, U bar, and various nuts and bolts have been retained. As a result, the cost of a single full scale field unit is less than the cost of single tracking unit.
Implementing the tracker into a solar field can be done relatively easily. Each individual tracker is fixed into the ground using two vertical support poles. These poles are cemented in place in order to provide additional stability when the panels are subjected to a wind load. This simplifies the overall design while maintaining the same level of accuracy and efficiency. Seeing as the design is simple to construct and does not require welding, each unit can be assembled quickly, drastically reducing the amount of time needed for the entire field. The remainder of the
Task 3 Northern Arizona University | 4
labor required is comprised of digging the necessary holes for the support poles and pouring the concrete. A depth of six inches is sufficient to protect the panels from harsh winds.
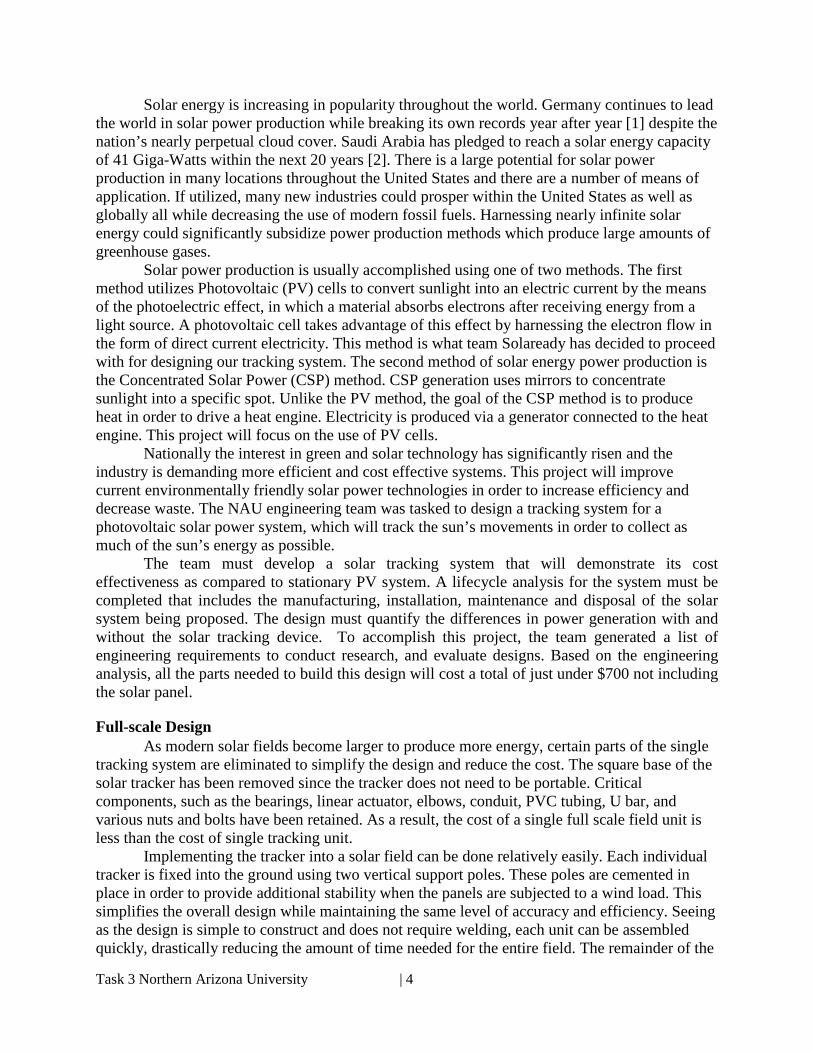
Panel array maintenance is comprised of three primary areas. The linear actuator used in each panel has a warranty of two years, but has an estimated lifetime of 15-20 years after the initial implementation into the solar field. It is suggested that all actuators are replaced at once in order to reduce maintenance time and costs. Although the primary shaft does not experience high rotational speed, the bearings should be oiled at least once a year. This will ensure that tracking accuracy and power consumption remains consistent across the entire array. Finally, the manual North-South axis of each tracker must be adjusted once a month in order to achieve the nearly maximum power generation. This is the bulk of the maintenance workload, but it can be accomplished relatively quickly by one person for smaller solar fields. Assuming that the solar array utilizes the same KC 130 panels as the competition, one person should be able to lift the frame and replace the PVC pipe without much difficulty. For larger, heavier panels, a minimum of two people will be required for each tracker.
Figure 9: Single system (left). Full scale solar field (right).
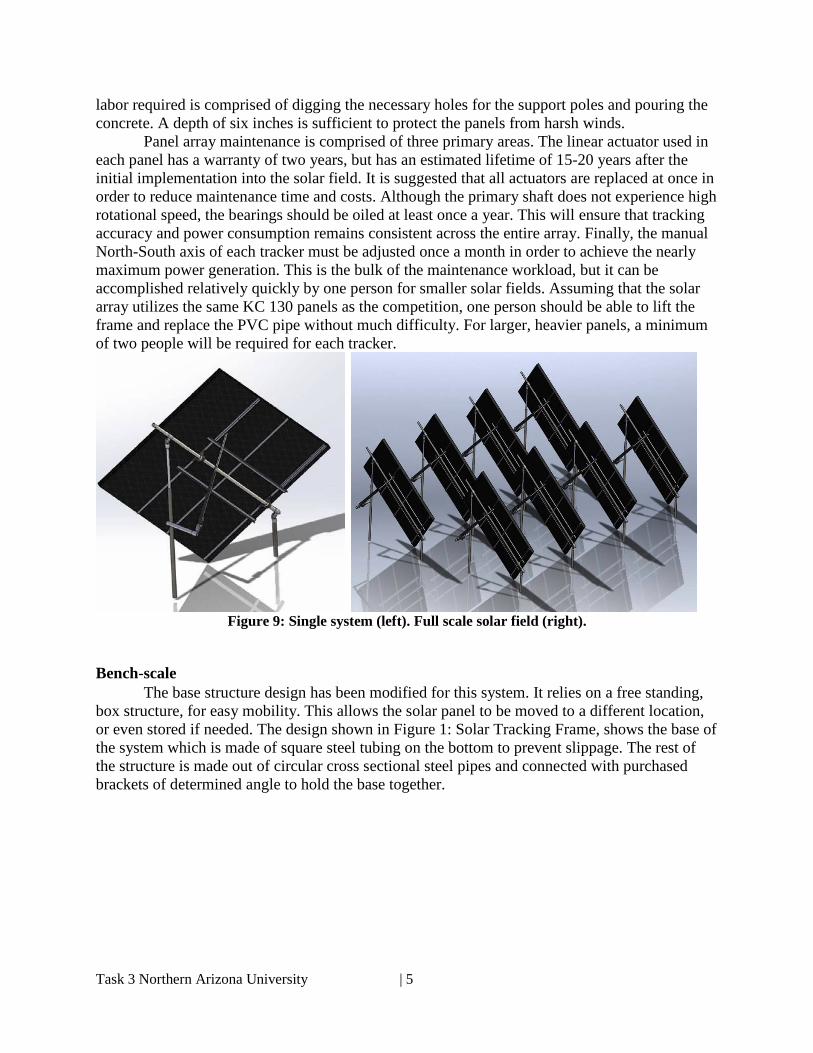
Bench-scale The base structure design has been modified for this system. It relies on a free standing,
box structure, for easy mobility. This allows the solar panel to be moved to a different location, or even stored if needed. The design shown in Figure 1: Solar Tracking Frame, shows the base of the system which is made of square steel tubing on the bottom to prevent slippage. The rest of the structure is made out of circular cross sectional steel pipes and connected with purchased brackets of determined angle to hold the base together.
Task 3 Northern Arizona University | 5
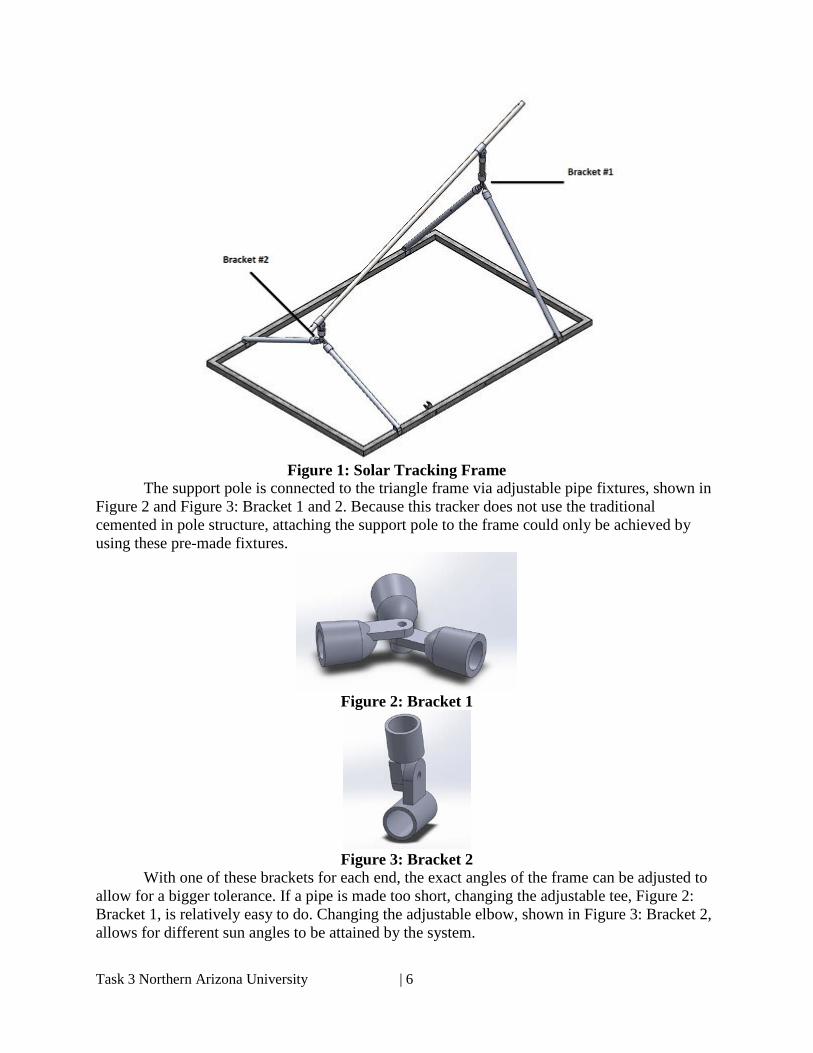
Figure 1: Solar Tracking Frame
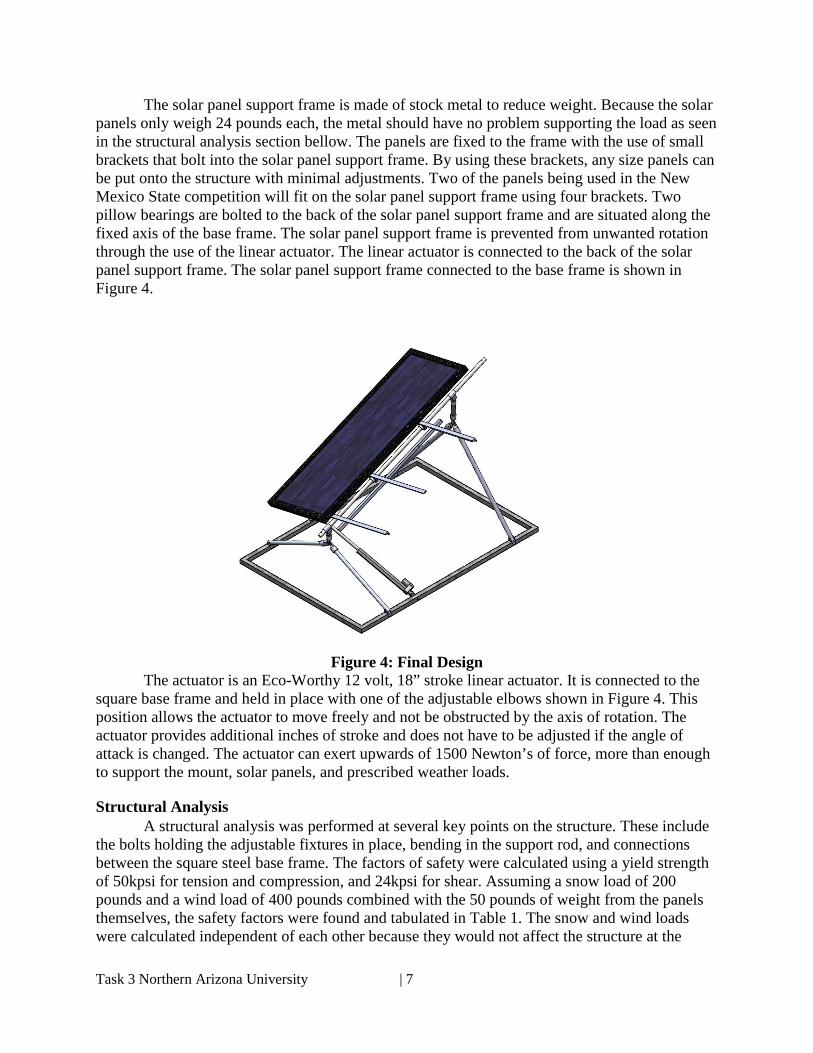
The support pole is connected to the triangle frame via adjustable pipe fixtures, shown in Figure 2 and Figure 3: Bracket 1 and 2. Because this tracker does not use the traditional cemented in pole structure, attaching the support pole to the frame could only be achieved by using these pre-made fixtures.
Figure 2: Bracket 1
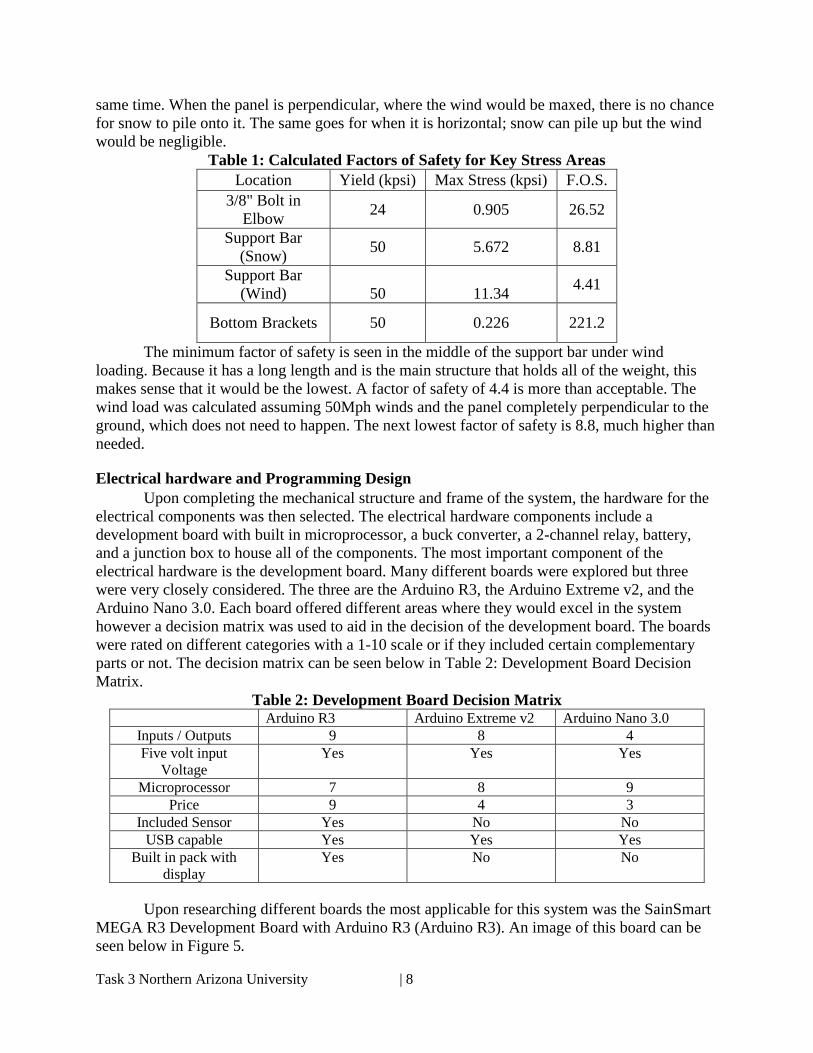
Figure 3: Bracket 2
With one of these brackets for each end, the exact angles of the frame can be adjusted to allow for a bigger tolerance. If a pipe is made too short, changing the adjustable tee, Figure 2: Bracket 1, is relatively easy to do. Changing the adjustable elbow, shown in Figure 3: Bracket 2, allows for different sun angles to be attained by the system.
Task 3 Northern Arizona University | 6
The solar panel support frame is made of stock metal to reduce weight. Because the solar panels only weigh 24 pounds each, the metal should have no problem supporting the load as seen in the structural analysis section bellow. The panels are fixed to the frame with the use of small brackets that bolt into the solar panel support frame. By using these brackets, any size panels can be put onto the structure with minimal adjustments. Two of the panels being used in the New Mexico State competition will fit on the solar panel support frame using four brackets. Two pillow bearings are bolted to the back of the solar panel support frame and are situated along the fixed axis of the base frame. The solar panel support frame is prevented from unwanted rotation through the use of the linear actuator. The linear actuator is connected to the back of the solar panel support frame. The solar panel support frame connected to the base frame is shown in Figure 4.
Figure 4: Final Design
The actuator is an Eco-Worthy 12 volt, 18” stroke linear actuator. It is connected to the square base frame and held in place with one of the adjustable elbows shown in Figure 4. This position allows the actuator to move freely and not be obstructed by the axis of rotation. The actuator provides additional inches of stroke and does not have to be adjusted if the angle of attack is changed. The actuator can exert upwards of 1500 Newton’s of force, more than enough to support the mount, solar panels, and prescribed weather loads.
Structural Analysis A structural analysis was performed at several key points on the structure. These include the bolts holding the adjustable fixtures in place, bending in the support rod, and connections between the square steel base frame. The factors of safety were calculated using a yield strength of 50kpsi for tension and compression, and 24kpsi for shear. Assuming a snow load of 200 pounds and a wind load of 400 pounds combined with the 50 pounds of weight from the panels themselves, the safety factors were found and tabulated in Table 1. The snow and wind loads were calculated independent of each other because they would not affect the structure at the
Task 3 Northern Arizona University | 7
same time. When the panel is perpendicular, where the wind would be maxed, there is no chance for snow to pile onto it. The same goes for when it is horizontal; snow can pile up but the wind would be negligible.
Table 1: Calculated Factors of Safety for Key Stress Areas Location Yield (kpsi) Max Stress (kpsi) F.O.S.
3/8" Bolt in Elbow 24 0.905 26.52
Support Bar (Snow) 50 5.672 8.81
Support Bar (Wind) 50 11.34 4.41
Bottom Brackets 50 0.226 221.2
The minimum factor of safety is seen in the middle of the support bar under wind loading. Because it has a long length and is the main structure that holds all of the weight, this makes sense that it would be the lowest. A factor of safety of 4.4 is more than acceptable. The wind load was calculated assuming 50Mph winds and the panel completely perpendicular to the ground, which does not need to happen. The next lowest factor of safety is 8.8, much higher than needed.
Electrical hardware and Programming Design Upon completing the mechanical structure and frame of the system, the hardware for the
electrical components was then selected. The electrical hardware components include a development board with built in microprocessor, a buck converter, a 2-channel relay, battery, and a junction box to house all of the components. The most important component of the electrical hardware is the development board. Many different boards were explored but three were very closely considered. The three are the Arduino R3, the Arduino Extreme v2, and the Arduino Nano 3.0. Each board offered different areas where they would excel in the system however a decision matrix was used to aid in the decision of the development board. The boards were rated on different categories with a 1-10 scale or if they included certain complementary parts or not. The decision matrix can be seen below in Table 2: Development Board Decision Matrix.
Table 2: Development Board Decision Matrix Arduino R3 Arduino Extreme v2 Arduino Nano 3.0
Inputs / Outputs 9 8 4 Five volt input
Voltage Yes Yes Yes
Microprocessor 7 8 9 Price 9 4 3
Included Sensor Yes No No USB capable Yes Yes Yes
Built in pack with display
Yes No No
Upon researching different boards the most applicable for this system was the SainSmart
MEGA R3 Development Board with Arduino R3 (Arduino R3). An image of this board can be seen below in Figure 5.
Task 3 Northern Arizona University | 8
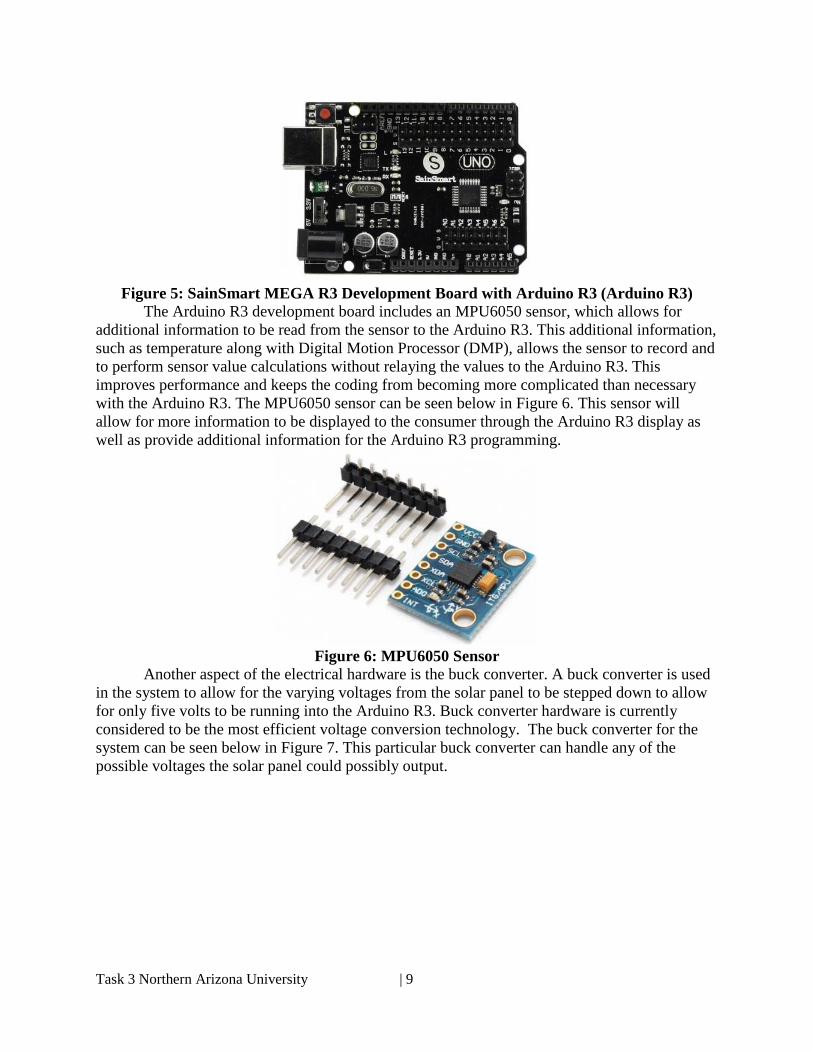
Figure 5: SainSmart MEGA R3 Development Board with Arduino R3 (Arduino R3)
The Arduino R3 development board includes an MPU6050 sensor, which allows for additional information to be read from the sensor to the Arduino R3. This additional information, such as temperature along with Digital Motion Processor (DMP), allows the sensor to record and to perform sensor value calculations without relaying the values to the Arduino R3. This improves performance and keeps the coding from becoming more complicated than necessary with the Arduino R3. The MPU6050 sensor can be seen below in Figure 6. This sensor will allow for more information to be displayed to the consumer through the Arduino R3 display as well as provide additional information for the Arduino R3 programming.
Figure 6: MPU6050 Sensor
Another aspect of the electrical hardware is the buck converter. A buck converter is used in the system to allow for the varying voltages from the solar panel to be stepped down to allow for only five volts to be running into the Arduino R3. Buck converter hardware is currently considered to be the most efficient voltage conversion technology. The buck converter for the system can be seen below in Figure 7. This particular buck converter can handle any of the possible voltages the solar panel could possibly output.
Task 3 Northern Arizona University | 9
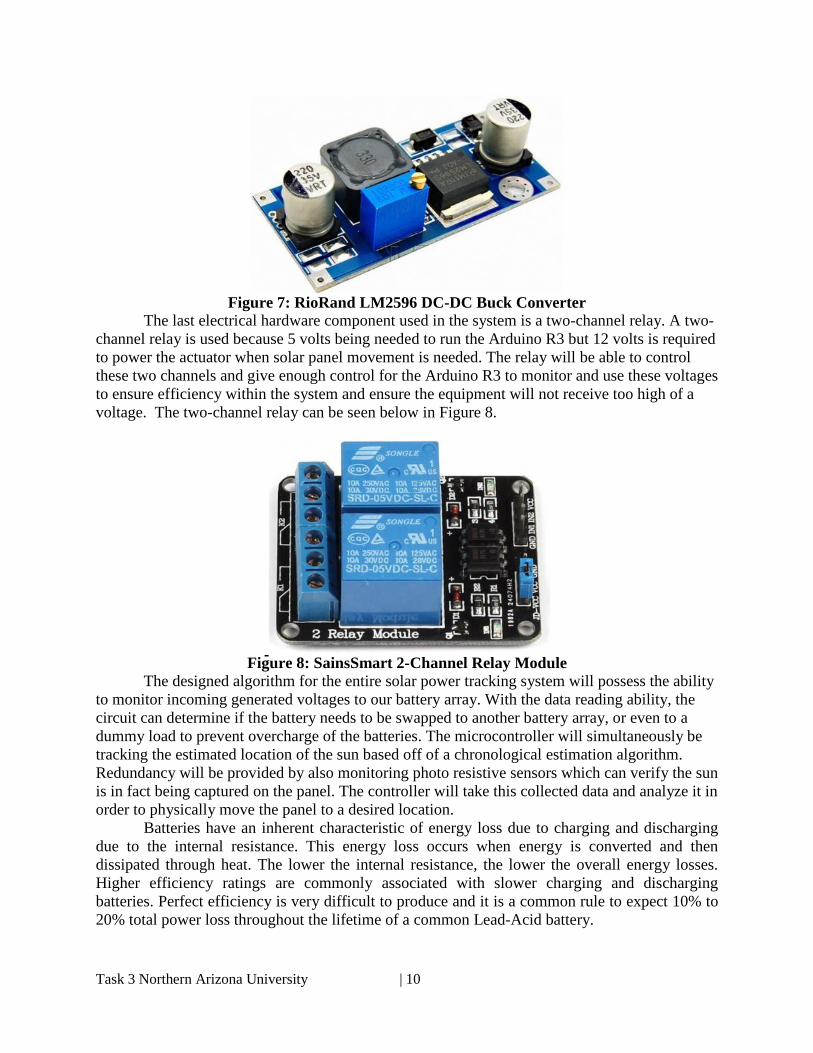
Figure 7: RioRand LM2596 DC-DC Buck Converter
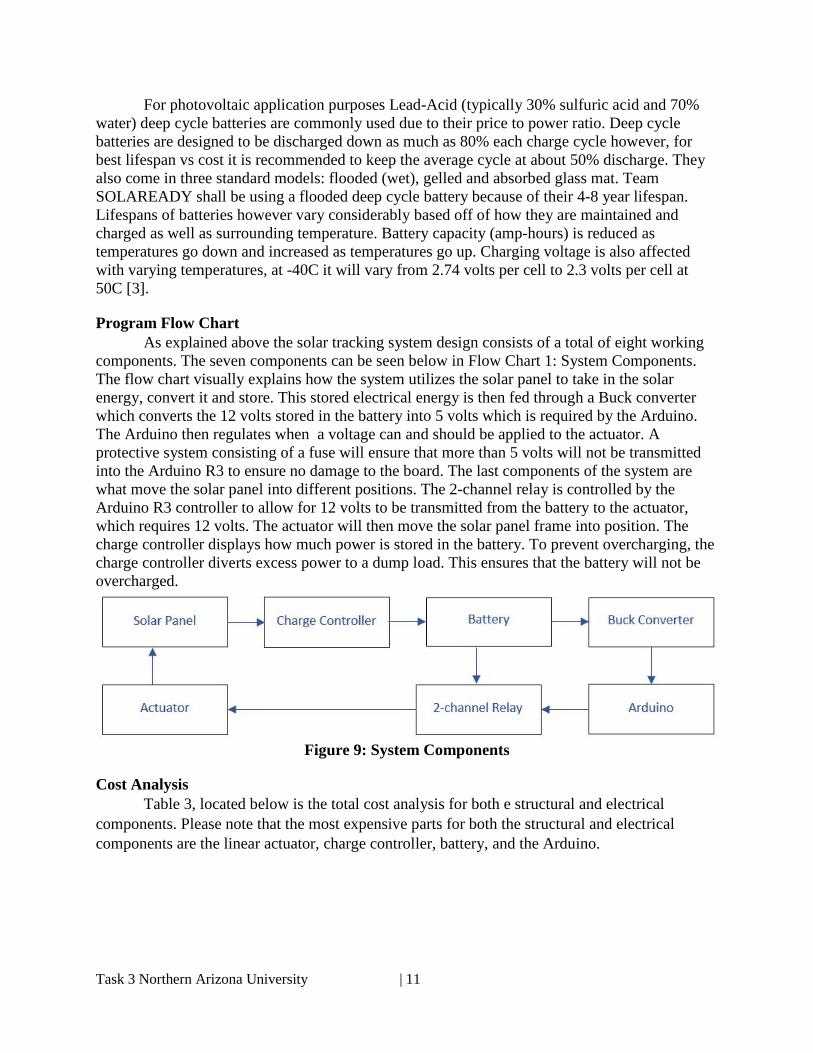
The last electrical hardware component used in the system is a two-channel relay. A two-channel relay is used because 5 volts being needed to run the Arduino R3 but 12 volts is required to power the actuator when solar panel movement is needed. The relay will be able to control these two channels and give enough control for the Arduino R3 to monitor and use these voltages to ensure efficiency within the system and ensure the equipment will not receive too high of a voltage. The two-channel relay can be seen below in Figure 8.
Figure 8: SainsSmart 2-Channel Relay Module
The designed algorithm for the entire solar power tracking system will possess the ability to monitor incoming generated voltages to our battery array. With the data reading ability, the circuit can determine if the battery needs to be swapped to another battery array, or even to a dummy load to prevent overcharge of the batteries. The microcontroller will simultaneously be tracking the estimated location of the sun based off of a chronological estimation algorithm. Redundancy will be provided by also monitoring photo resistive sensors which can verify the sun is in fact being captured on the panel. The controller will take this collected data and analyze it in order to physically move the panel to a desired location.
Batteries have an inherent characteristic of energy loss due to charging and discharging due to the internal resistance. This energy loss occurs when energy is converted and then dissipated through heat. The lower the internal resistance, the lower the overall energy losses. Higher efficiency ratings are commonly associated with slower charging and discharging batteries. Perfect efficiency is very difficult to produce and it is a common rule to expect 10% to 20% total power loss throughout the lifetime of a common Lead-Acid battery.
Task 3 Northern Arizona University | 10
For photovoltaic application purposes Lead-Acid (typically 30% sulfuric acid and 70% water) deep cycle batteries are commonly used due to their price to power ratio. Deep cycle batteries are designed to be discharged down as much as 80% each charge cycle however, for best lifespan vs cost it is recommended to keep the average cycle at about 50% discharge. They also come in three standard models: flooded (wet), gelled and absorbed glass mat. Team SOLAREADY shall be using a flooded deep cycle battery because of their 4-8 year lifespan. Lifespans of batteries however vary considerably based off of how they are maintained and charged as well as surrounding temperature. Battery capacity (amp-hours) is reduced as temperatures go down and increased as temperatures go up. Charging voltage is also affected with varying temperatures, at -40C it will vary from 2.74 volts per cell to 2.3 volts per cell at 50C [3].
Program Flow Chart As explained above the solar tracking system design consists of a total of eight working
components. The seven components can be seen below in Flow Chart 1: System Components. The flow chart visually explains how the system utilizes the solar panel to take in the solar energy, convert it and store. This stored electrical energy is then fed through a Buck converter which converts the 12 volts stored in the battery into 5 volts which is required by the Arduino. The Arduino then regulates when a voltage can and should be applied to the actuator. A protective system consisting of a fuse will ensure that more than 5 volts will not be transmitted into the Arduino R3 to ensure no damage to the board. The last components of the system are what move the solar panel into different positions. The 2-channel relay is controlled by the Arduino R3 controller to allow for 12 volts to be transmitted from the battery to the actuator, which requires 12 volts. The actuator will then move the solar panel frame into position. The charge controller displays how much power is stored in the battery. To prevent overcharging, the charge controller diverts excess power to a dump load. This ensures that the battery will not be overcharged.
Figure 9: System Components
Cost Analysis Table 3, located below is the total cost analysis for both e structural and electrical components. Please note that the most expensive parts for both the structural and electrical components are the linear actuator, charge controller, battery, and the Arduino.
Task 3 Northern Arizona University | 11
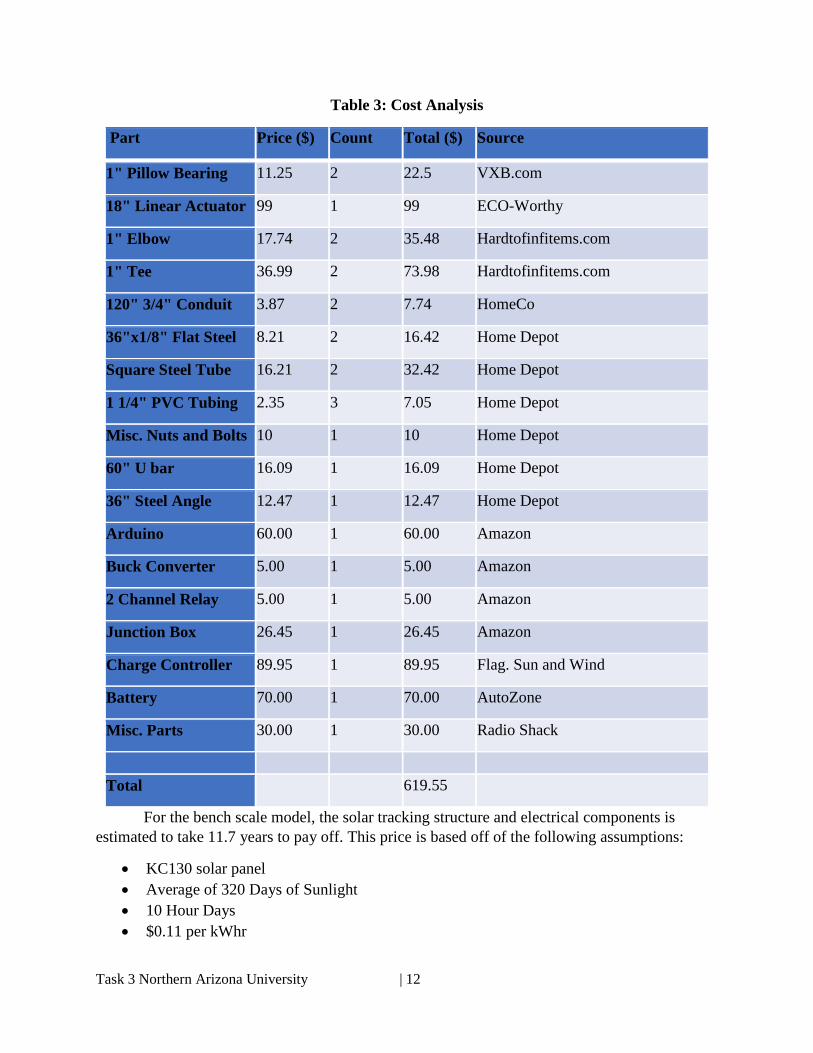
Table 3: Cost Analysis
Part Price ($) Count Total ($) Source
1" Pillow Bearing 11.25 2 22.5 VXB.com
18" Linear Actuator 99 1 99 ECO-Worthy
1" Elbow 17.74 2 35.48 Hardtofinfitems.com
1" Tee 36.99 2 73.98 Hardtofinfitems.com
120" 3/4" Conduit 3.87 2 7.74 HomeCo
36"x1/8" Flat Steel 8.21 2 16.42 Home Depot
Square Steel Tube 16.21 2 32.42 Home Depot
1 1/4" PVC Tubing 2.35 3 7.05 Home Depot
Misc. Nuts and Bolts 10 1 10 Home Depot
60" U bar 16.09 1 16.09 Home Depot
36" Steel Angle 12.47 1 12.47 Home Depot
Arduino 60.00 1 60.00 Amazon
Buck Converter 5.00 1 5.00 Amazon
2 Channel Relay 5.00 1 5.00 Amazon
Junction Box 26.45 1 26.45 Amazon
Charge Controller 89.95 1 89.95 Flag. Sun and Wind
Battery 70.00 1 70.00 AutoZone
Misc. Parts 30.00 1 30.00 Radio Shack
Total
619.55
For the bench scale model, the solar tracking structure and electrical components is estimated to take 11.7 years to pay off. This price is based off of the following assumptions:
• KC130 solar panel • Average of 320 Days of Sunlight • 10 Hour Days • $0.11 per kWhr
Task 3 Northern Arizona University | 12

The full scale model is estimated to take 4 years to pay off. After the 4 years, the solar farm should produce $7,495 per year. These figures were based off of the following assumptions:
• 20kW System – Phoenix, Arizona • Startup Cost
o 255W Average per Panel o $260 per Panel o 80 Panels at $20,800 o 40 Structures o 10 Structures per Microcontroller o $40 per Microcontroller o $9,400 for Structures and Instillation o Total Startup: $30,360
• Maintenance o 6 Actuators Die per Year o 20 hours per Year Changing North/South Axis o Total Maintenance: $1,000 per Year
• Power Generation o 3972 hours of Sunlight per Year (ncdc.noaa.gov) o Full Structure Generating Average of 20kW (77440kWhr) o $0.1097 per kWhr ($8495.168 per Year Generated)
Waste Generation This design will not generate any waste and is completely recyclable. The base frame is
made of aluminum and the entire system will contain electronics that is eco-friendly making it recyclable and low cost. Solar panels can contain toxins or potential toxins such as silicon tetrachloride, cadmium, selenium and sulfur hexafluoride, depending on the solar panel. Recycling solar panels is not as extensive in the United States compared to other electronic waste recycling, so transit for the panels may be needed. As the United States increases its resources for renewable energy, more recycling is near in the future. We assure that this design will have a solar panel that will have an average life span of 25 to 30 years [4], with the actuator life of about 15-20 years ensuring that this system will not have to be replaced in less than five years.
Technical Evaluation Figure 10 and Table 4 below depict the difference in power generation of a solar tracker to a static solar panel.
Task 3 Northern Arizona University | 13
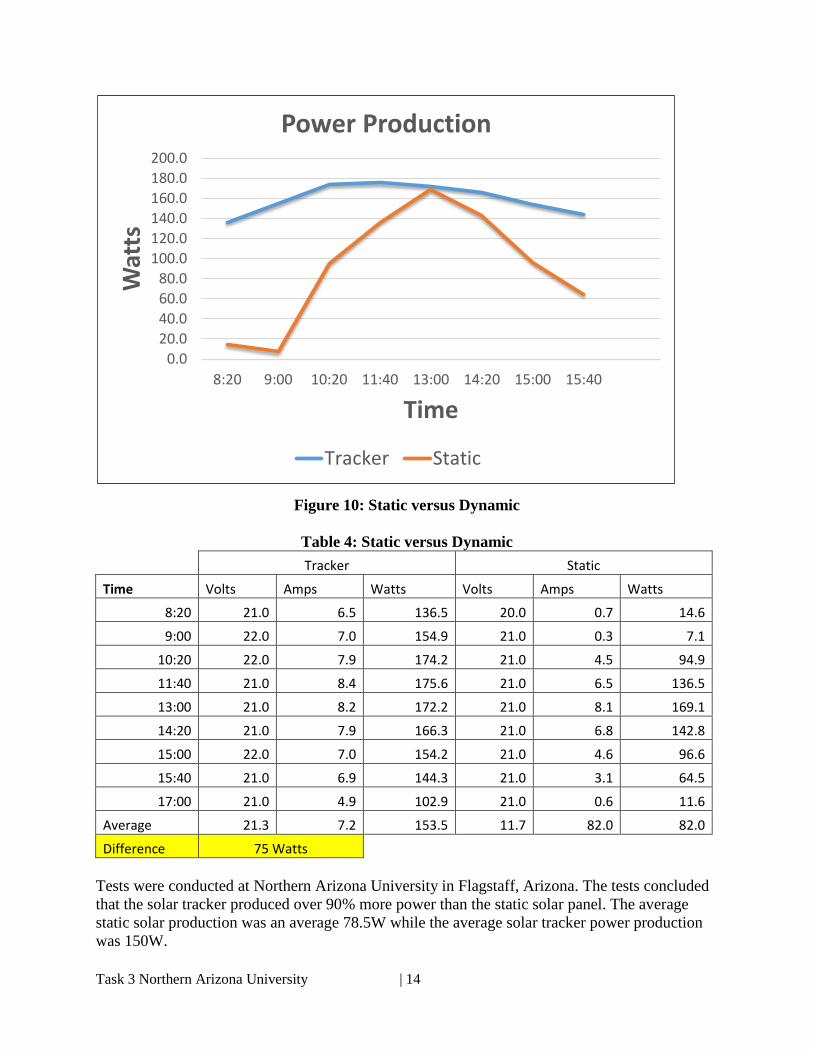
Figure 10: Static versus Dynamic
Table 4: Static versus Dynamic
Tracker Static
Time Volts Amps Watts Volts Amps Watts
8:20 21.0 6.5 136.5 20.0 0.7 14.6
9:00 22.0 7.0 154.9 21.0 0.3 7.1
10:20 22.0 7.9 174.2 21.0 4.5 94.9
11:40 21.0 8.4 175.6 21.0 6.5 136.5
13:00 21.0 8.2 172.2 21.0 8.1 169.1
14:20 21.0 7.9 166.3 21.0 6.8 142.8
15:00 22.0 7.0 154.2 21.0 4.6 96.6
15:40 21.0 6.9 144.3 21.0 3.1 64.5
17:00 21.0 4.9 102.9 21.0 0.6 11.6
Average 21.3 7.2 153.5 11.7 82.0 82.0
Difference 75 Watts
Tests were conducted at Northern Arizona University in Flagstaff, Arizona. The tests concluded that the solar tracker produced over 90% more power than the static solar panel. The average static solar production was an average 78.5W while the average solar tracker power production was 150W.
0.020.040.060.080.0
100.0120.0140.0160.0180.0200.0
8:20 9:00 10:20 11:40 13:00 14:20 15:00 15:40
Wat
ts
Time
Power Production
Tracker Static
Task 3 Northern Arizona University | 14

Legal, Health Issues and Economic Analysis Within the solar power industry many business related and legal issues must be
considered. The clean energy trade has quickly established rules and regulations to protect consumers’ rights, providers’ rights, and preventing mishaps when tying solar generation systems into established power grids. Consumer scale solar energy is broken into three different methods: a power purchase agreement (PPA) where solar generated power is purchased from a large scale provider, a solar system ownership where the consumer owns and maintains their own solar generation system, and solar energy leasing where a consumer leases the device from a provider.
Prior to implementation it is important to consider siting, zoning, permit related requirements, and ensure that the system is in compliance with them. It is also important that a proposed solar power system is in compliance with all environmental and land use requirements relating to local environmental agencies.
The health hazards in this system are the chemicals in the battery. Under normal conditions of battery use, internal components will not present a health hazard. Inhalation, skin contact, skin absorption, eye contact, ingestion are possible through battery production or under extreme heat temperatures (fire).
As to the economic analysis, this system uses approximately 39.5 watts. The output wattage for a single solar panel is 130W. That is 30% of all output voltage form the panel will be used to power the tracking system. If the system is outputting 70% of the 130W it will take just over 3 years to pay for a single solar tracker. This is assuming 8.77 cents per kilowatt hour [5], system is properly placed and no cloud covers to affect the output.
Conclusion A final design was developed by an NAU Mechanical and Electrical Engineering team
based on performance and cost. By employing a low power micro controller and a low power low torque actuator, the model meets the desired capabilities of producing as much output power as possible while still being affordable to consumers. This system is adaptable to meet the needs of small scale power production as well as the needs of a large scale solar farm.
Task 3 Northern Arizona University | 15
References [1] J. Parnell. (2013, August 16). “Power Generation”.[On-line]. Available: http://www.pv-tech.org/news/germany_breaks_monthly_solar_generation_record_in_july [November 10, 2013]. [2] J. Murray. (2012, November 26). “Saudi Arabia announces $109bl solar strategy”. [On-line]. Available: http://www.theguardian.com/environment/2012/nov/26/saudi-arabia-solar-strategy [November, 15 2013]. [3] Northern Arizona Wind & Sun. (2012). “Deep Cycle Battery FAQ”. [On-line]. Available: http://www.solar-electric.com/deep-cycle-battery-faq.html [March 2, 2014]. [4] KYOCERA. (August 15, 2013). “Limited Warrenty for Kyocera Photovoltaic Modules”. [On-line]. Available: http://www.kyocerasolar.com/assets/001/5151.pdf [March 4, 2014]. [5]U.S. Energy Information Administration. (2014, Feburary 21). “Electric Power Monthly”. [On-line].Available: http://www.eia.gov/electricity/monthly/epm_table_grapher.cfm?t=epmt_5_6_a
Task 3 Northern Arizona University | 16