Embed Size (px)
Citation preview

December 2016 • Oil and Gas Facilities 1
Solid-Particles Flow Regimes in Air/Water Stratified Flow in a Horizontal Pipeline
Ramin Dabirian, Ram S. Mohan, and Ovadia Shoham, The University of Tulsa, and Gene Kouba, Chevron (retired)
There are a few studies covering solid-particles transport in mul-tiphase pipelines. Solid-particles transport is complicated because it depends on several variables, including flow patterns, fluid prop-erties, phase velocities, and pipe-geometry features such as rough-ness, diameter, and inclination angle. Each of these variables can have significant effects on the solid-particles-transport process.
More attention has been paid recently to the importance of tracking solid-particles-transport management over reservoir life. There are three options available for managing solid-particles transport: ap-plying a cleaning operation, installing solid-particles exclusion facili-ties, and operating above the critical solid-particles-deposition velocity. Cleaning operations, such as pigging, are only applicable for small amounts of solid particles, and they often result in the pig becoming stuck if the pigging frequency is not high enough. Installing solid-par-ticles exclusion systems (e.g., gravel packs) can reduce production and create excessive pressure drops. The third option, operating above the critical solid-particles-deposition velocity, is preferred for solid-parti-cles-production management as a prevention technique under favorable operating conditions because it has practical applications and can be beneficial commercially.
To avoid solid-particles deposition, it is necessary to manage solid-particles transport above solid-particles-deposition velocities. On the other hand, operating under unnecessarily high flow rates is not only cost inefficient, but can also create facility damages; therefore, it is necessary to find the optimum velocity to maintain continuous particle movement. This velocity is called the critical solid-particles-deposition velocity.
Solid-Particles Flow Regimes Particle interactions and movement have a significant effect on trans-port of solid particles. Shamlou (1987) defined the most common classification for solid-particles transport in horizontal pipeline as homogeneous flow, heterogeneous flow, heterogeneous and sliding flow, saltation flow, and stationary bed. Doron and Barnea (1996) and Ibarra et al. (2016) defined three main solid-particles flow regimes as suspension, moving bed, and stationary bed. The suspension solid-particles flow regime was further divided into two subpatterns of pseudohomogeneous suspension and heterogeneous suspension.
Well-defined flow regimes will clarify under what conditions the particles are moving more or less independently (i.e., not locked together as in a sliding bed). Flow regimes in this paper are applied to multiphase flow, whereas Doron and Barnea (1996) and other flow-regime publications are applicable for single-phase flow only. According to this study, there are six main solid-particles flow regimes in stratified flow in a multiphase pipeline: fully dispersed solid flow, dilute solids at the wall, concentrated solids at the wall, moving dunes, stationary dunes, and stationary bed. Each one is de-scribed in the following subsections and shown in Fig. 1.
Fully Dispersed Solids Flow. At high flow rates, there is a suspen-sion of particles in which particles are completely dispersed in the liquid phase, with no particles touching the pipe bottom.
Dilute Solids at the Wall. At slightly lower flow rates, some parti-cles drag along the pipe bottom and start rolling on the pipe. In this solid-particles flow regime, no particle interactions are observed at the pipe bottom, hence particle shape is not important.
Copyright © 2016 Society of Petroleum Engineers
This paper (SPE 174960) was accepted for presentation at the SPE Annual Technical Conference and Exhibition, Houston, 28–30 September 2015, and revised for publication. Original manuscript received for review 29 October 2015. Revised manuscript received for review 19 July 2016. Paper peer approved 21 July 2016.
SummaryThe entrainment of solid particles in crude oil occurs during pro-duction from reservoirs with low formation strength. The stationary solid-particles bed at the horizontal pipe bottom can cause operational problems such as production decline, excessive pressure loss, equip-ment failure, erosion, and corrosion. Solid-particles deposition can be managed by operating above the critical solid-particles-deposition velocity, which is the velocity that maintains the continuous move-ment of particles at the pipe bottom. Here, a comprehensive analysis of solid-particle flow regimes in stratified flow in a horizontal pipe-line is presented, which is a novel contribution because it is applied to multiphase flow. The effect of concentration on the solid-particle flow regimes and identification of the critical solid-particles-deposition velocities for various particle concentrations are also investigated.
The understanding of solid-particle flow regimes in pipelines for any given set of operational conditions is important for identifying the nature of particle interaction and movement. Experimental studies are conducted in a 4-in. horizontal pipeline for a stratified flow regime that uses air, water, and glass beads at relatively low solid-particles concentrations (<10,000 ppm). The effects of different experimental conditions, such as gas velocity, solid-particles concentration, and par-ticle size, are investigated in this study. Six main solid-particles flow regimes in horizontal air/water flow are identified, and can be distin-guished visually: fully dispersed solid flow, dilute solids at wall, con-centrated solids at wall, moving dunes, stationary dunes, and stationary bed. Therefore, the critical solid-particles-deposition velocities are de-termined on the basis of the transition between moving (concentrated solids at wall/moving dunes, as appropriate) and stationary (stationary dunes/bed, as appropriate) solid particles. The experimental data show that with small particle size, the critical solid-particles-deposition ve-locity is almost independent of concentration, while with larger par-ticle sizes, the critical velocity increases with the concentration.
IntroductionMost oil and gas reservoirs have unconsolidated formations with low formation strength, and, hence, are prone to producing sand. New wells usually produce high fractions of sand in the cleanup stage. Over time the sand production stabilizes to a low level before reaching the end of reservoir life, which increases again because of pore-pressure reduction, which supports some of the weight of the overlying rock. Solid-particles deposition can decrese the production rate of a reser-voir as a result of accumulation in the wellbore or in the pipeline, and can also cause excessive costs for operation of upstream facilities.
In the oil and gas industry, sand production impacts the asset integrity of production systems. Erosion from high flow rates can cause severe damage to upstream facilities such as pipelines, fit-tings, chokes, separators, and other control equipment. Further-more, failure of the facilities because of erosion results in shutting down of the entire production over a period of time. Thus, solid-particles transport is inevitably a problem in the petroleum industry.
SPE_OGF_174960_160011.indd 1 27/09/16 8:15 PM
2 Oil and Gas Facilities • December 2016
Concentrated Solids at the Wall. With further decreasing flow rates, higher solid-particles concentrations are created on the wall, and there are high particle interactions. A particle is moved because it is pushed by other particles rather than by rolling itself. Hence, particle shape is important for this flow regime.
Moving Dunes. At slower flow rates, the turbulence created by waves at the gas/liquid interface scatters the top of the moving bed, and a discontinuously moving bed is generated at the pipe bottom. In this regime, the clusters of particles come together and start creeping dis-continuously at the pipe bottom. Moving dunes are observed at very low concentrations or at air/liquid/solid flow with small particle sizes.
Stationary Dunes. At low flow rates, the dunes stop moving, and sta-tionary dunes are observed. This solid-particles flow regime is seen near the 2D and 3D wave transition at the interface. For stationary dunes, we have lesser microbial interaction (compared with stationary bed) be-tween the solid particle and pipeline, leading to reduced corrosion.
Stationary Bed. At considerably low flow rates, solid particles start to deposit and remain at rest, and stationary particles are ob-served at the pipe bottom.
Critical Velocity The transition between solid-particles flow regimes is characterized by a critical velocity. Critical-velocity values depend on the type of solid-particles flow regime and are usually related to solid-particles deposition and solid-particles suspension. Critical solid-particles-deposition velocity is defined as the velocity required to deposit a solid particle that is initially moving in the liquid phase at the pipe bottom, while suspension critical velocity is the velocity required to pick up and suspend a solid particle that is initially at rest. The dif-ference between these two velocities can be caused by additional cohesive force, when the solid-particles bed is created at the pipe bottom. Salama (1999) defined critical suspending velocity as the transition between solid-particles suspension and solid-particles moving bed. According to Salama (1999), the critical suspending velocity is the minimum velocity to suspend solid particles in liquid phase and to prevent excessive pipe erosion. Many terms have been defined by authors for the upper limit of a stationary bed. Shook and Roco (1991) applied the term “deposition velocity,” while Wood (1979) used the term “deposit velocity.” Wilson (1976) and Doron and Barnea (1996) also used the term “limit deposit velocity.” According to Ibarra et al. (2016), the critical sand-deposition velocity is defined as the minimum velocity needed to keep all par-ticles moving along the pipe, which is determined as the transition between moving bed and stationary bed. Similarly, in the current study, the critical solid-particles-deposition velocity is defined as the minimum velocity that keeps the particles moving continuously. However, it is determined on the basis of the transition between moving (concentrated solids at wall/moving dunes, as appropriate) and stationary (stationary dunes/bed, as appropriate) sand particles.
Experimental ProgramA unique facility was designed and constructed with a horizontal 4-in. transparent polyvinyl chloride (PVC) pipe, which measures liquid velocity, liquid holdup, and pressure drop (Nguyen et al. 2014). The designed test loop uses water as its liquid phase and air as its gas phase, along with glass beads with spherical shape representing the solid par-ticles. The particle-diameter range is between 45 and 600 µm (in three different groups) with an average density of 2475 kg/m3, which was selected to ensure thorough mixing and separation performance.
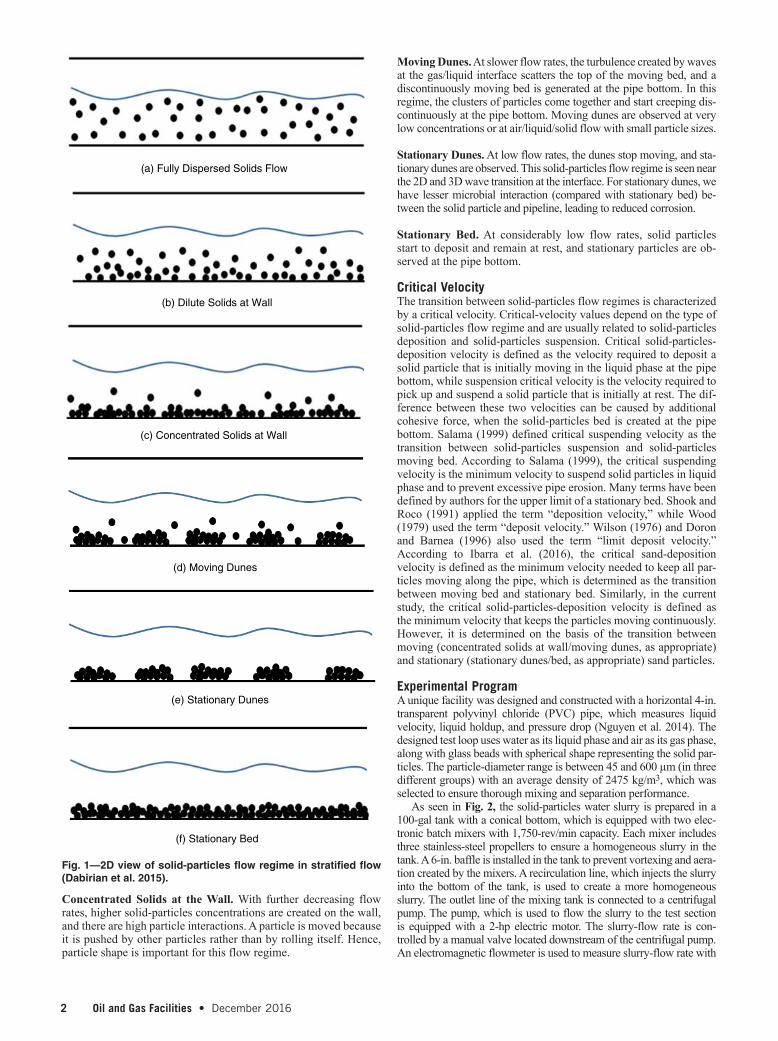
As seen in Fig. 2, the solid-particles water slurry is prepared in a 100-gal tank with a conical bottom, which is equipped with two elec-tronic batch mixers with 1,750-rev/min capacity. Each mixer includes three stainless-steel propellers to ensure a homogeneous slurry in the tank. A 6-in. baffle is installed in the tank to prevent vortexing and aera-tion created by the mixers. A recirculation line, which injects the slurry into the bottom of the tank, is used to create a more homogeneous slurry. The outlet line of the mixing tank is connected to a centrifugal pump. The pump, which is used to flow the slurry to the test section is equipped with a 2-hp electric motor. The slurry-flow rate is con-trolled by a manual valve located downstream of the centrifugal pump. An electromagnetic flowmeter is used to measure slurry-flow rate with
(a) Fully Dispersed Solids Flow
(b) Dilute Solids at Wall
(c) Concentrated Solids at Wall
(d) Moving Dunes
(e) Stationary Dunes
(f) Stationary Bed
Fig. 1—2D view of solid-particles flow regime in stratified flow (Dabirian et al. 2015).
SPE_OGF_174960_160011.indd 2 27/09/16 8:15 PM
December 2016 • Oil and Gas Facilities 3
high accuracy. The flowmeter was calibrated by flowing slurry with dif-ferent sand concentrations from the tank passing through the flowmeter. The initial and final slurry volume in the tank, as well as the flowing time, are recorded for calculating the volumetric flow rate, which is compared with the instrument reading. The tank outlet line is connected to a diaphragm pump—with a flow-rate capacity of 35 gal/min and par-ticle-size capacity of 3175 µm—which is powered by compressed air.
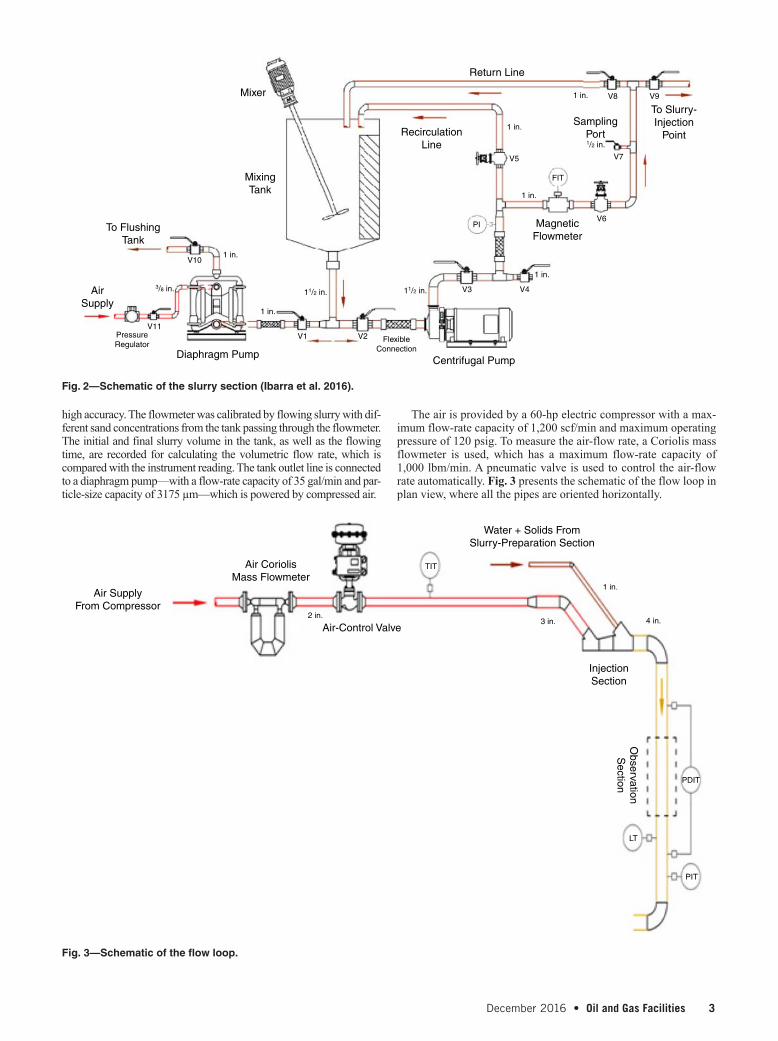
The air is provided by a 60-hp electric compressor with a max-imum flow-rate capacity of 1,200 scf/min and maximum operating pressure of 120 psig. To measure the air-flow rate, a Coriolis mass flowmeter is used, which has a maximum flow-rate capacity of 1,000 lbm/min. A pneumatic valve is used to control the air-flow rate automatically. Fig. 3 presents the schematic of the flow loop in plan view, where all the pipes are oriented horizontally.
Mixer
MixingTank
To FlushingTank
AirSupply
Diaphragm PumpCentrifugal Pump
MagneticFlowmeter
SamplingPort1/2 in.
RecirculationLine
Return Line
To Slurry-Injection
Point
PressureRegulator
FlexibleConnection
V11
V10
V1 V2
V3
PI
FIT
V4
V6
V5 V7
V9V8
3/8 in.
1 in.
1 in.
1 in.
1 in.
1 in.
1 in.
11/2 in. 11/2 in.
Fig. 2—Schematic of the slurry section (Ibarra et al. 2016).
Air SupplyFrom Compressor
Air CoriolisMass Flowmeter
Air-Control Valve
Water + Solids FromSlurry-Preparation Section
InjectionSection
ObservationS
ection
TIT
LT
PIT
PDIT
2 in.3 in.
1 in.
4 in.
Fig. 3—Schematic of the flow loop.
SPE_OGF_174960_160011.indd 3 27/09/16 8:15 PM
4 Oil and Gas Facilities • December 2016
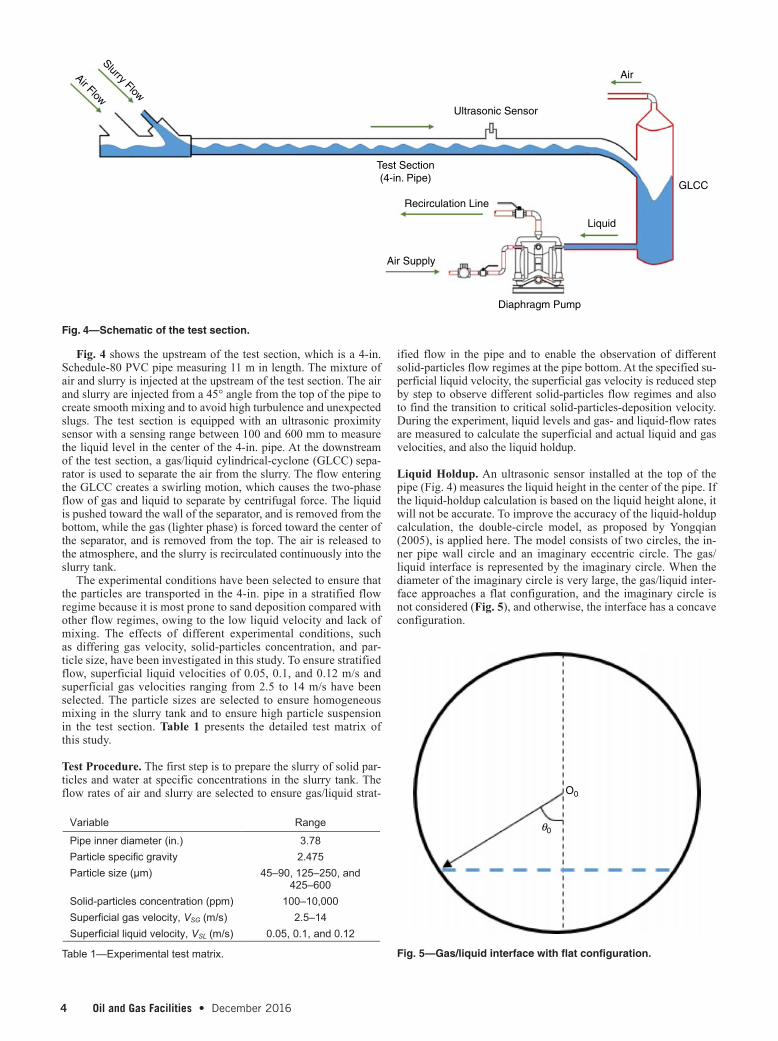
Fig. 4 shows the upstream of the test section, which is a 4-in. Schedule-80 PVC pipe measuring 11 m in length. The mixture of air and slurry is injected at the upstream of the test section. The air and slurry are injected from a 45° angle from the top of the pipe to create smooth mixing and to avoid high turbulence and unexpected slugs. The test section is equipped with an ultrasonic proximity sensor with a sensing range between 100 and 600 mm to measure the liquid level in the center of the 4-in. pipe. At the downstream of the test section, a gas/liquid cylindrical-cyclone (GLCC) sepa-rator is used to separate the air from the slurry. The flow entering the GLCC creates a swirling motion, which causes the two-phase flow of gas and liquid to separate by centrifugal force. The liquid is pushed toward the wall of the separator, and is removed from the bottom, while the gas (lighter phase) is forced toward the center of the separator, and is removed from the top. The air is released to the atmosphere, and the slurry is recirculated continuously into the slurry tank.
The experimental conditions have been selected to ensure that the particles are transported in the 4-in. pipe in a stratified flow regime because it is most prone to sand deposition compared with other flow regimes, owing to the low liquid velocity and lack of mixing. The effects of different experimental conditions, such as differing gas velocity, solid-particles concentration, and par-ticle size, have been investigated in this study. To ensure stratified flow, superficial liquid velocities of 0.05, 0.1, and 0.12 m/s and superficial gas velocities ranging from 2.5 to 14 m/s have been selected. The particle sizes are selected to ensure homogeneous mixing in the slurry tank and to ensure high particle suspension in the test section. Table 1 presents the detailed test matrix of this study.
Test Procedure. The first step is to prepare the slurry of solid par-ticles and water at specific concentrations in the slurry tank. The flow rates of air and slurry are selected to ensure gas/liquid strat-
ified flow in the pipe and to enable the observation of different solid-particles flow regimes at the pipe bottom. At the specified su-perficial liquid velocity, the superficial gas velocity is reduced step by step to observe different solid-particles flow regimes and also to find the transition to critical solid-particles-deposition velocity. During the experiment, liquid levels and gas- and liquid-flow rates are measured to calculate the superficial and actual liquid and gas velocities, and also the liquid holdup.
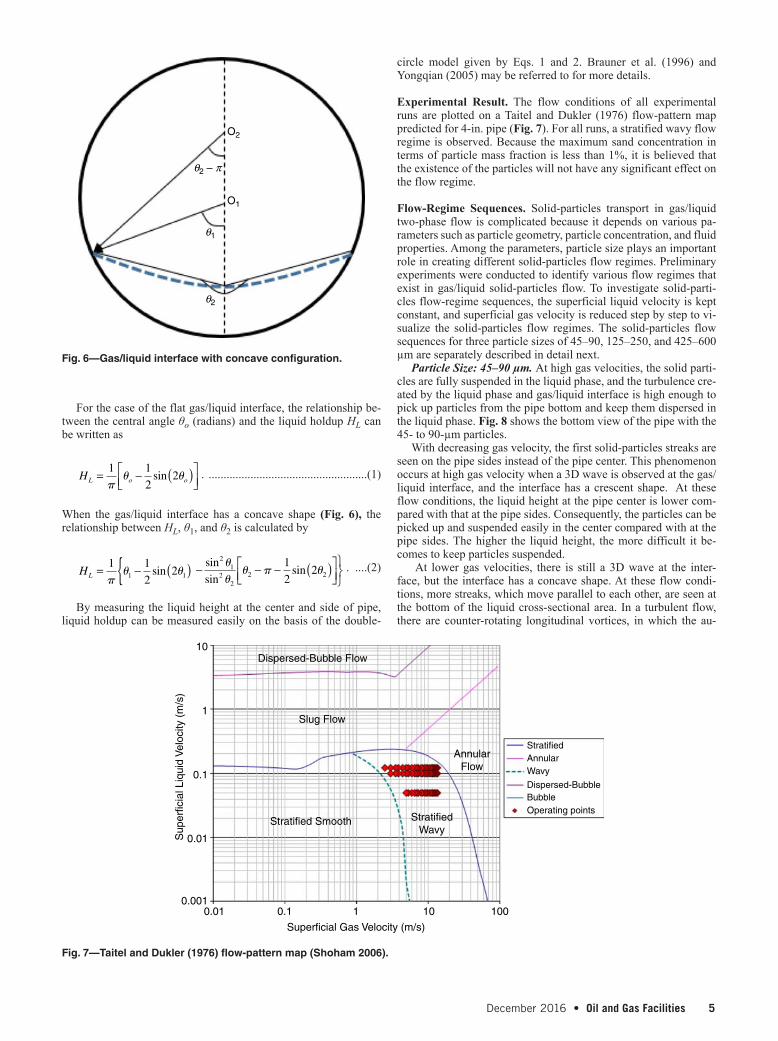
Liquid Holdup. An ultrasonic sensor installed at the top of the pipe (Fig. 4) measures the liquid height in the center of the pipe. If the liquid-holdup calculation is based on the liquid height alone, it will not be accurate. To improve the accuracy of the liquid-holdup calculation, the double-circle model, as proposed by Yongqian (2005), is applied here. The model consists of two circles, the in-ner pipe wall circle and an imaginary eccentric circle. The gas/liquid interface is represented by the imaginary circle. When the diameter of the imaginary circle is very large, the gas/liquid inter-face approaches a flat configuration, and the imaginary circle is not considered (Fig. 5), and otherwise, the interface has a concave configuration.
Variable Range
Pipe inner diameter (in.) 3.78Particle specific gravity 2.475Particle size (μm) 45–90, 125–250, and
425–600Solid-particles concentration (ppm) 100–10,000Superficial gas velocity, VSG (m/s) 2.5–14Superficial liquid velocity, VSL (m/s) 0.05, 0.1, and 0.12
Table 1—Experimental test matrix.
Slurry Flow
Ultrasonic Sensor
Test Section(4-in. Pipe)
Recirculation Line
Air Supply
Diaphragm Pump
Liquid
GLCC
AirAir Flow
Fig. 4—Schematic of the test section.
O0
θ0
Fig. 5—Gas/liquid interface with flat configuration.
SPE_OGF_174960_160011.indd 4 27/09/16 8:15 PM
December 2016 • Oil and Gas Facilities 5
For the case of the flat gas/liquid interface, the relationship be-tween the central angle θo (radians) and the liquid holdup HL can be written as
HL o o= − ( )
1 1
22
�� �sin . .....................................................(1)
When the gas/liquid interface has a concave shape (Fig. 6), the relationship between HL, θ1, and θ2 is calculated by
HL = − ( ){1 1
221 1
�� �sin − − − ( )
sin
sinsin
21
22
2 2
1
22
�
�� � � . ....(2)
By measuring the liquid height at the center and side of pipe, liquid holdup can be measured easily on the basis of the double-
circle model given by Eqs. 1 and 2. Brauner et al. (1996) and Yongqian (2005) may be referred to for more details.
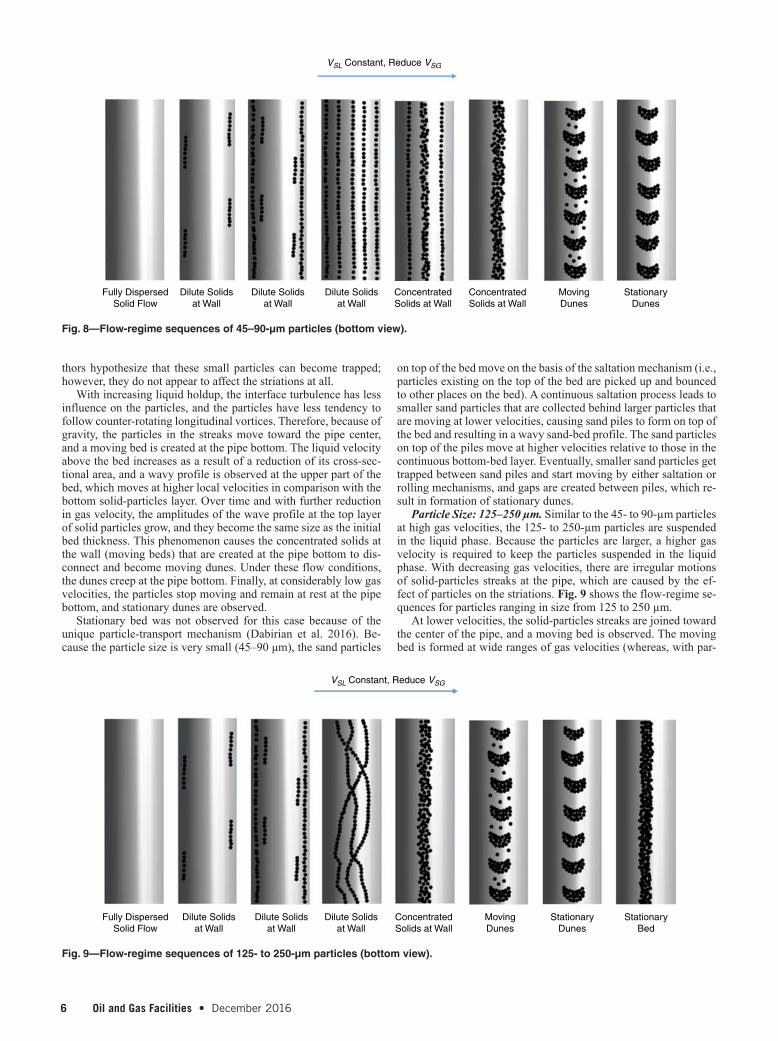
Experimental Result. The flow conditions of all experimental runs are plotted on a Taitel and Dukler (1976) flow-pattern map predicted for 4-in. pipe (Fig. 7). For all runs, a stratified wavy flow regime is observed. Because the maximum sand concentration in terms of particle mass fraction is less than 1%, it is believed that the existence of the particles will not have any significant effect on the flow regime.
Flow-Regime Sequences. Solid-particles transport in gas/liquid two-phase flow is complicated because it depends on various pa-rameters such as particle geometry, particle concentration, and fluid properties. Among the parameters, particle size plays an important role in creating different solid-particles flow regimes. Preliminary experiments were conducted to identify various flow regimes that exist in gas/liquid solid-particles flow. To investigate solid-parti-cles flow-regime sequences, the superficial liquid velocity is kept constant, and superficial gas velocity is reduced step by step to vi-sualize the solid-particles flow regimes. The solid-particles flow sequences for three particle sizes of 45–90, 125–250, and 425–600 µm are separately described in detail next.
Particle Size: 45–90 µm. At high gas velocities, the solid parti-cles are fully suspended in the liquid phase, and the turbulence cre-ated by the liquid phase and gas/liquid interface is high enough to pick up particles from the pipe bottom and keep them dispersed in the liquid phase. Fig. 8 shows the bottom view of the pipe with the 45- to 90-µm particles.
With decreasing gas velocity, the first solid-particles streaks are seen on the pipe sides instead of the pipe center. This phenomenon occurs at high gas velocity when a 3D wave is observed at the gas/liquid interface, and the interface has a crescent shape. At these flow conditions, the liquid height at the pipe center is lower com-pared with that at the pipe sides. Consequently, the particles can be picked up and suspended easily in the center compared with at the pipe sides. The higher the liquid height, the more difficult it be-comes to keep particles suspended.
At lower gas velocities, there is still a 3D wave at the inter-face, but the interface has a concave shape. At these flow condi-tions, more streaks, which move parallel to each other, are seen at the bottom of the liquid cross-sectional area. In a turbulent flow, there are counter-rotating longitudinal vortices, in which the au-
O2
O1
θ2 – π
θ1
θ2
Fig. 6—Gas/liquid interface with concave configuration.
10
1
Dispersed-Bubble Flow
Slug Flow
AnnularFlow
StratifiedWavy
StratifiedAnnularWavy
Dispersed-BubbleBubbleOperating points
Stratified Smooth
0.1
0.01
0.0010.01 0.1 1
Superficial Gas Velocity (m/s)
Sup
erfic
ial L
iqui
d V
eloc
ity (
m/s
)
10 100
Fig. 7—Taitel and Dukler (1976) flow-pattern map (Shoham 2006).
SPE_OGF_174960_160011.indd 5 27/09/16 8:15 PM
6 Oil and Gas Facilities • December 2016
thors hypothesize that these small particles can become trapped; however, they do not appear to affect the striations at all.
With increasing liquid holdup, the interface turbulence has less influence on the particles, and the particles have less tendency to follow counter-rotating longitudinal vortices. Therefore, because of gravity, the particles in the streaks move toward the pipe center, and a moving bed is created at the pipe bottom. The liquid velocity above the bed increases as a result of a reduction of its cross-sec-tional area, and a wavy profile is observed at the upper part of the bed, which moves at higher local velocities in comparison with the bottom solid-particles layer. Over time and with further reduction in gas velocity, the amplitudes of the wave profile at the top layer of solid particles grow, and they become the same size as the initial bed thickness. This phenomenon causes the concentrated solids at the wall (moving beds) that are created at the pipe bottom to dis-connect and become moving dunes. Under these flow conditions, the dunes creep at the pipe bottom. Finally, at considerably low gas velocities, the particles stop moving and remain at rest at the pipe bottom, and stationary dunes are observed.
Stationary bed was not observed for this case because of the unique particle-transport mechanism (Dabirian et al. 2016). Be-cause the particle size is very small (45–90 μm), the sand particles
on top of the bed move on the basis of the saltation mechanism (i.e., particles existing on the top of the bed are picked up and bounced to other places on the bed). A continuous saltation process leads to smaller sand particles that are collected behind larger particles that are moving at lower velocities, causing sand piles to form on top of the bed and resulting in a wavy sand-bed profile. The sand particles on top of the piles move at higher velocities relative to those in the continuous bottom-bed layer. Eventually, smaller sand particles get trapped between sand piles and start moving by either saltation or rolling mechanisms, and gaps are created between piles, which re-sult in formation of stationary dunes.
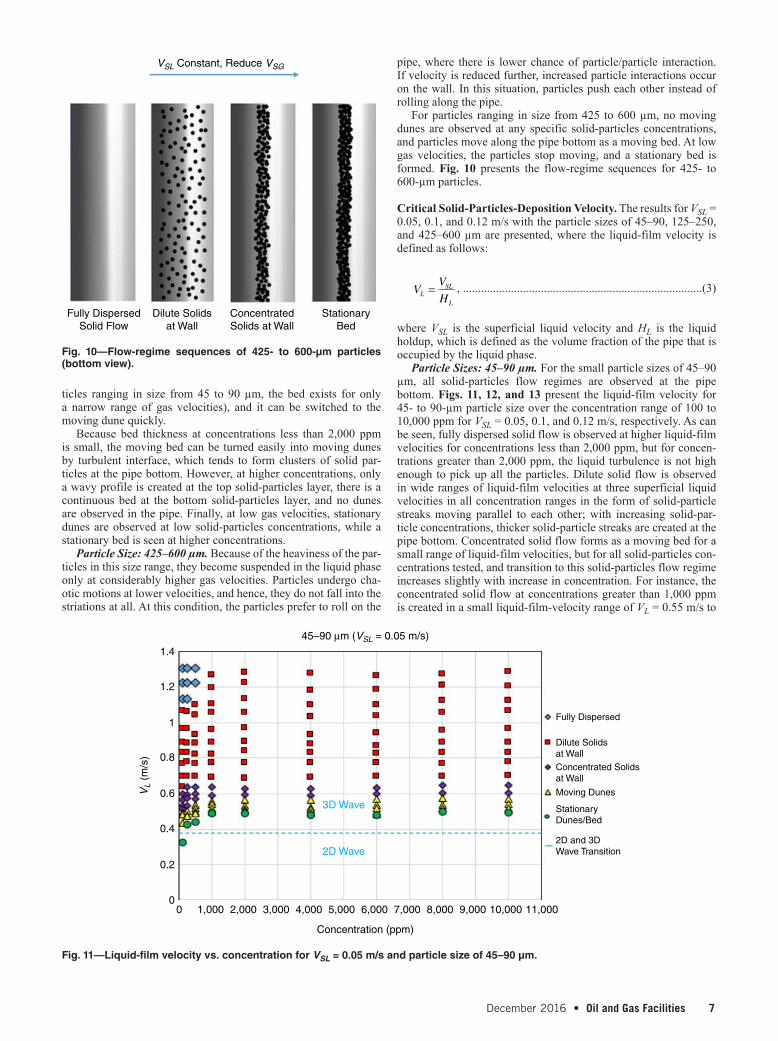
Particle Size: 125–250 µm. Similar to the 45- to 90-µm particles at high gas velocities, the 125- to 250-µm particles are suspended in the liquid phase. Because the particles are larger, a higher gas velocity is required to keep the particles suspended in the liquid phase. With decreasing gas velocities, there are irregular motions of solid-particles streaks at the pipe, which are caused by the ef-fect of particles on the striations. Fig. 9 shows the flow-regime se-quences for particles ranging in size from 125 to 250 µm.
At lower velocities, the solid-particles streaks are joined toward the center of the pipe, and a moving bed is observed. The moving bed is formed at wide ranges of gas velocities (whereas, with par-
VSL Constant, Reduce VSG
Fully DispersedSolid Flow
Dilute Solidsat Wall
Dilute Solidsat Wall
Dilute Solidsat Wall
ConcentratedSolids at Wall
ConcentratedSolids at Wall
MovingDunes
StationaryDunes
Fig. 8—Flow-regime sequences of 45–90-µm particles (bottom view).
VSL Constant, Reduce VSG
Fully DispersedSolid Flow
Dilute Solidsat Wall
Dilute Solidsat Wall
Dilute Solidsat Wall
ConcentratedSolids at Wall
StationaryDunes
MovingDunes
StationaryBed
Fig. 9—Flow-regime sequences of 125- to 250-µm particles (bottom view).
SPE_OGF_174960_160011.indd 6 27/09/16 8:15 PM
December 2016 • Oil and Gas Facilities 7
ticles ranging in size from 45 to 90 µm, the bed exists for only a narrow range of gas velocities), and it can be switched to the moving dune quickly.
Because bed thickness at concentrations less than 2,000 ppm is small, the moving bed can be turned easily into moving dunes by turbulent interface, which tends to form clusters of solid par-ticles at the pipe bottom. However, at higher concentrations, only a wavy profile is created at the top solid-particles layer, there is a continuous bed at the bottom solid-particles layer, and no dunes are observed in the pipe. Finally, at low gas velocities, stationary dunes are observed at low solid-particles concentrations, while a stationary bed is seen at higher concentrations.
Particle Size: 425–600 µm. Because of the heaviness of the par-ticles in this size range, they become suspended in the liquid phase only at considerably higher gas velocities. Particles undergo cha-otic motions at lower velocities, and hence, they do not fall into the striations at all. At this condition, the particles prefer to roll on the
pipe, where there is lower chance of particle/particle interaction. If velocity is reduced further, increased particle interactions occur on the wall. In this situation, particles push each other instead of rolling along the pipe.
For particles ranging in size from 425 to 600 µm, no moving dunes are observed at any specific solid-particles concentrations, and particles move along the pipe bottom as a moving bed. At low gas velocities, the particles stop moving, and a stationary bed is formed. Fig. 10 presents the flow-regime sequences for 425- to 600-µm particles.
Critical Solid-Particles-Deposition Velocity. The results for VSL = 0.05, 0.1, and 0.12 m/s with the particle sizes of 45–90, 125–250, and 425–600 µm are presented, where the liquid-film velocity is defined as follows:
VV
HLSL
L
= , ................................................................................(3)
where VSL is the superficial liquid velocity and HL is the liquid holdup, which is defined as the volume fraction of the pipe that is occupied by the liquid phase.
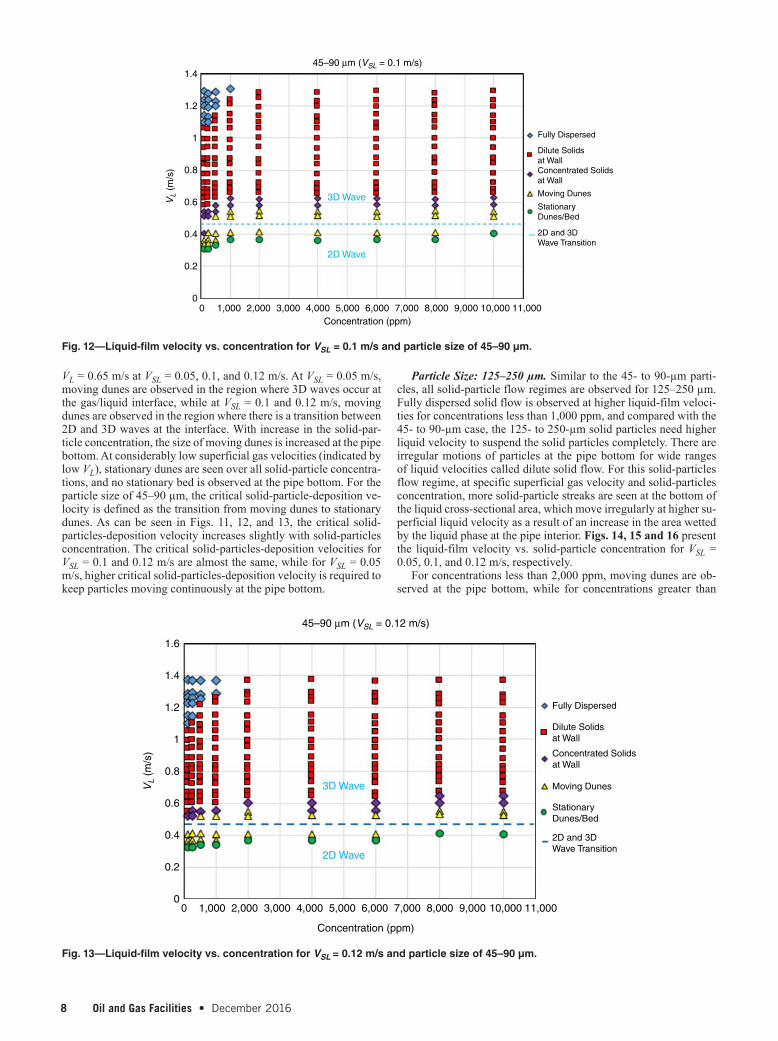
Particle Sizes: 45–90 µm. For the small particle sizes of 45–90 µm, all solid-particles flow regimes are observed at the pipe bottom. Figs. 11, 12, and 13 present the liquid-film velocity for 45- to 90-µm particle size over the concentration range of 100 to 10,000 ppm for VSL = 0.05, 0.1, and 0.12 m/s, respectively. As can be seen, fully dispersed solid flow is observed at higher liquid-film velocities for concentrations less than 2,000 ppm, but for concen-trations greater than 2,000 ppm, the liquid turbulence is not high enough to pick up all the particles. Dilute solid flow is observed in wide ranges of liquid-film velocities at three superficial liquid velocities in all concentration ranges in the form of solid-particle streaks moving parallel to each other; with increasing solid-par-ticle concentrations, thicker solid-particle streaks are created at the pipe bottom. Concentrated solid flow forms as a moving bed for a small range of liquid-film velocities, but for all solid-particles con-centrations tested, and transition to this solid-particles flow regime increases slightly with increase in concentration. For instance, the concentrated solid flow at concentrations greater than 1,000 ppm is created in a small liquid-film-velocity range of VL = 0.55 m/s to
1.4
1.2
1
0.8
0.6
0.4
0.2
00 1,000 2,000 3,000 4,000 5,000
2D Wave
3D Wave
6,000
Concentration (ppm)
45–90 µm (VSL = 0.05 m/s)
VL
(m/s
)
7,000 8,000 9,000 10,000 11,000
Fully Dispersed
Dilute Solidsat WallConcentrated Solidsat Wall
Moving Dunes
StationaryDunes/Bed
2D and 3DWave Transition
Fig. 11—Liquid-film velocity vs. concentration for VSL = 0.05 m/s and particle size of 45–90 µm.
VSL Constant, Reduce VSG
Fully DispersedSolid Flow
Dilute Solidsat Wall
ConcentratedSolids at Wall
StationaryBed
Fig. 10—Flow-regime sequences of 425- to 600-µm particles (bottom view).
SPE_OGF_174960_160011.indd 7 27/09/16 8:16 PM
8 Oil and Gas Facilities • December 2016
VL = 0.65 m/s at VSL = 0.05, 0.1, and 0.12 m/s. At VSL = 0.05 m/s, moving dunes are observed in the region where 3D waves occur at the gas/liquid interface, while at VSL = 0.1 and 0.12 m/s, moving dunes are observed in the region where there is a transition between 2D and 3D waves at the interface. With increase in the solid-par-ticle concentration, the size of moving dunes is increased at the pipe bottom. At considerably low superficial gas velocities (indicated by low VL), stationary dunes are seen over all solid-particle concentra-tions, and no stationary bed is observed at the pipe bottom. For the particle size of 45–90 µm, the critical solid-particle-deposition ve-locity is defined as the transition from moving dunes to stationary dunes. As can be seen in Figs. 11, 12, and 13, the critical solid-particles-deposition velocity increases slightly with solid-particles concentration. The critical solid-particles-deposition velocities for VSL = 0.1 and 0.12 m/s are almost the same, while for VSL = 0.05 m/s, higher critical solid-particles-deposition velocity is required to keep particles moving continuously at the pipe bottom.
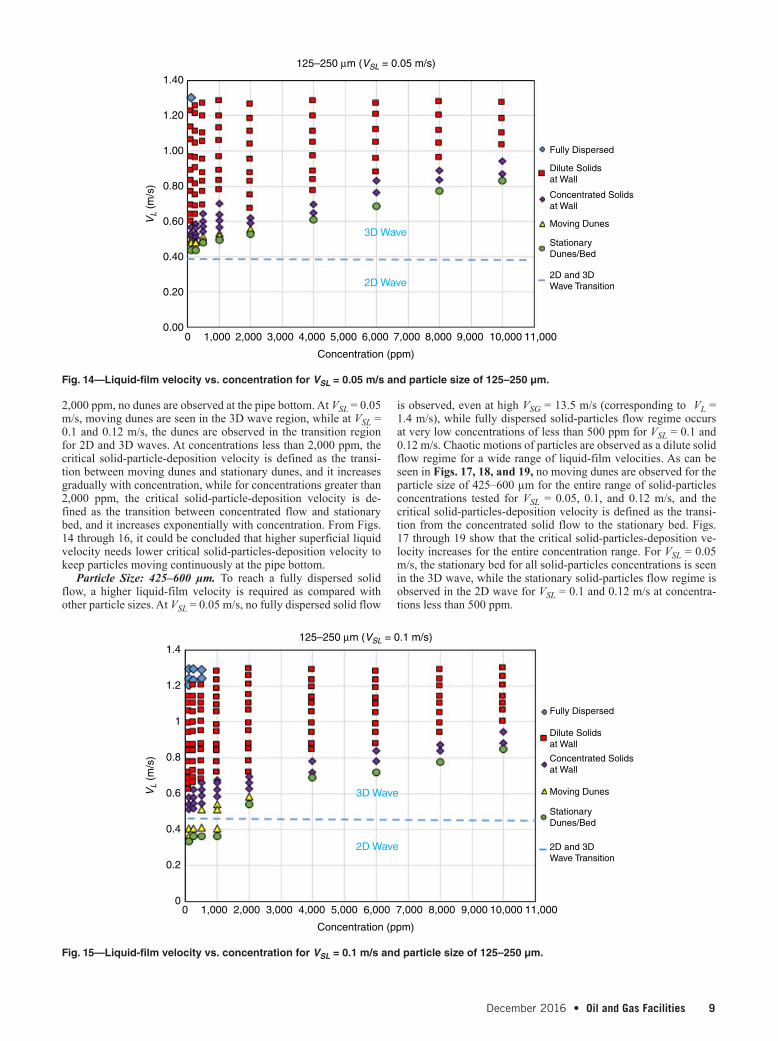
Particle Size: 125–250 µm. Similar to the 45- to 90-µm parti-cles, all solid-particle flow regimes are observed for 125–250 µm. Fully dispersed solid flow is observed at higher liquid-film veloci-ties for concentrations less than 1,000 ppm, and compared with the 45- to 90-µm case, the 125- to 250-µm solid particles need higher liquid velocity to suspend the solid particles completely. There are irregular motions of particles at the pipe bottom for wide ranges of liquid velocities called dilute solid flow. For this solid-particles flow regime, at specific superficial gas velocity and solid-particles concentration, more solid-particle streaks are seen at the bottom of the liquid cross-sectional area, which move irregularly at higher su-perficial liquid velocity as a result of an increase in the area wetted by the liquid phase at the pipe interior. Figs. 14, 15 and 16 present the liquid-film velocity vs. solid-particle concentration for VSL = 0.05, 0.1, and 0.12 m/s, respectively.
For concentrations less than 2,000 ppm, moving dunes are ob-served at the pipe bottom, while for concentrations greater than
2D Wave
3D Wave
45–90 µm (VSL = 0.1 m/s)1.4
1.2
1
0.8
0.6
0.4
0.2
0
VL
(m/s
)
0 1,000 2,000 3,000 4,000 5,000 6,000Concentration (ppm)
7,000 8,000 9,000 10,000 11,000
Fully Dispersed
Dilute Solidsat WallConcentrated Solidsat Wall
Moving Dunes
StationaryDunes/Bed
2D and 3DWave Transition
Fig. 12—Liquid-film velocity vs. concentration for VSL = 0.1 m/s and particle size of 45–90 µm.
2D Wave
3D Wave
45–90 µm (VSL = 0.12 m/s)
1.6
1.4
1.2
1
0.8
0.6
0.4
0.2
0
VL
(m/s
)
0 1,000 2,000 3,000 4,000 5,000 6,000
Concentration (ppm)
7,000 8,000 9,000 10,000 11,000
Fully Dispersed
Dilute Solidsat Wall
Concentrated Solidsat Wall
Moving Dunes
StationaryDunes/Bed
2D and 3DWave Transition
Fig. 13—Liquid-film velocity vs. concentration for VSL = 0.12 m/s and particle size of 45–90 µm.
SPE_OGF_174960_160011.indd 8 27/09/16 8:16 PM
December 2016 • Oil and Gas Facilities 9
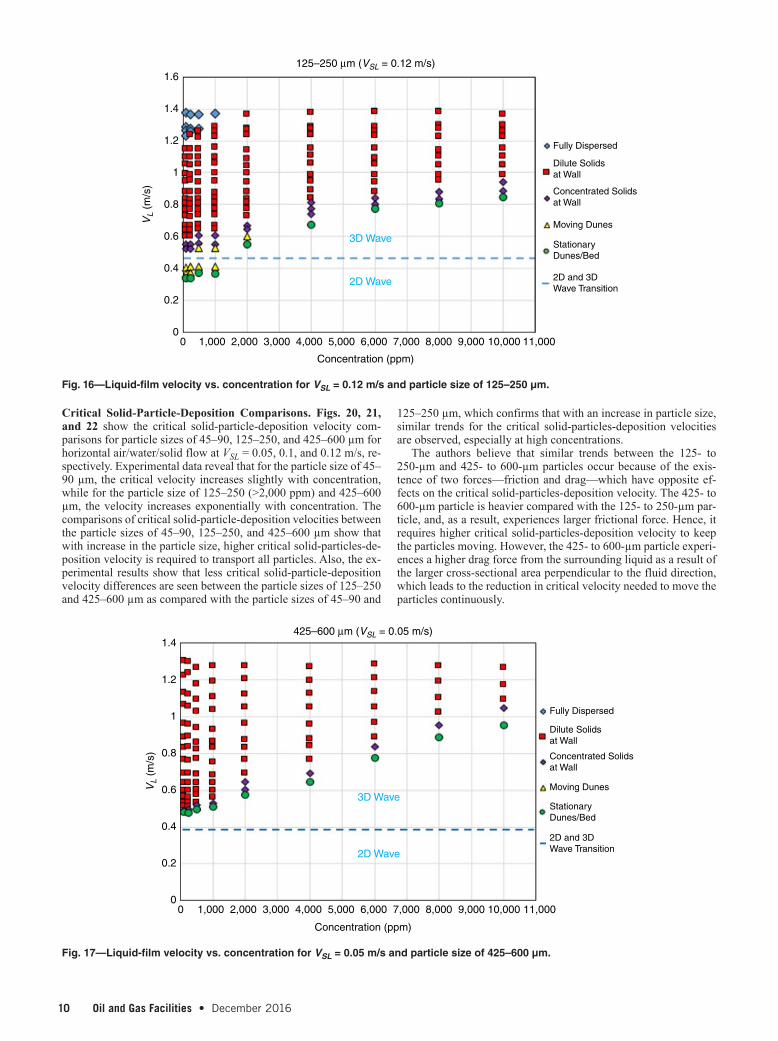
2,000 ppm, no dunes are observed at the pipe bottom. At VSL = 0.05 m/s, moving dunes are seen in the 3D wave region, while at VSL = 0.1 and 0.12 m/s, the dunes are observed in the transition region for 2D and 3D waves. At concentrations less than 2,000 ppm, the critical solid-particle-deposition velocity is defined as the transi-tion between moving dunes and stationary dunes, and it increases gradually with concentration, while for concentrations greater than 2,000 ppm, the critical solid-particle-deposition velocity is de-fined as the transition between concentrated flow and stationary bed, and it increases exponentially with concentration. From Figs. 14 through 16, it could be concluded that higher superficial liquid velocity needs lower critical solid-particles-deposition velocity to keep particles moving continuously at the pipe bottom.
Particle Size: 425–600 µm. To reach a fully dispersed solid flow, a higher liquid-film velocity is required as compared with other particle sizes. At VSL = 0.05 m/s, no fully dispersed solid flow
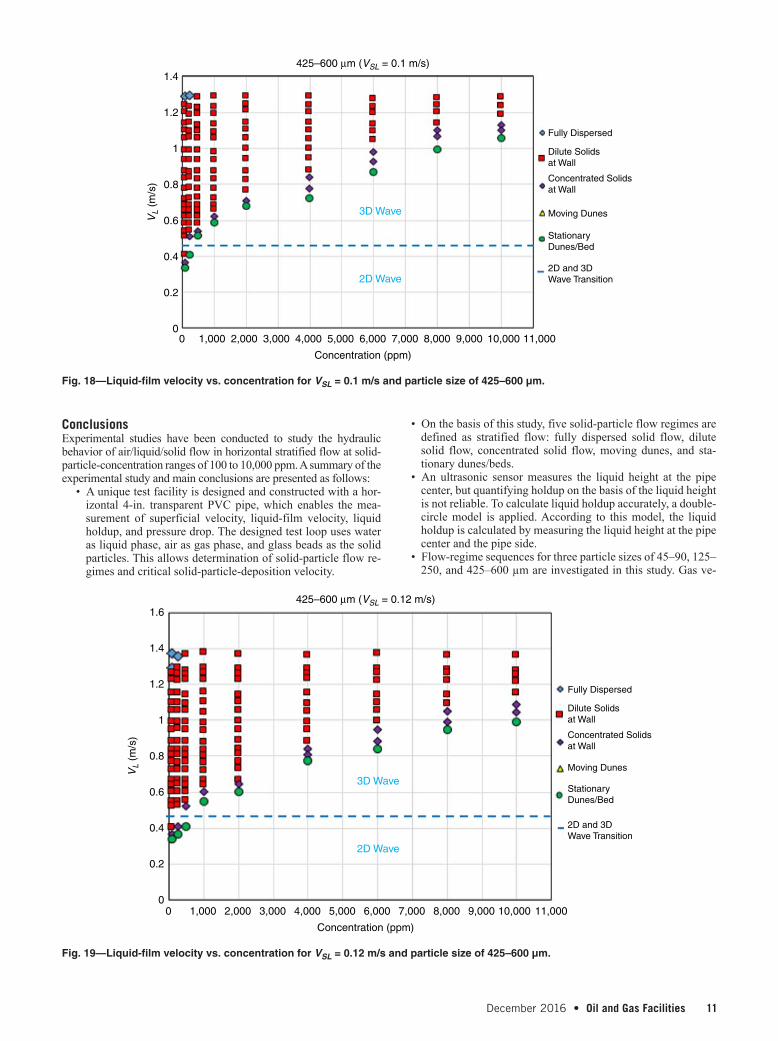
is observed, even at high VSG = 13.5 m/s (corresponding to VL = 1.4 m/s), while fully dispersed solid-particles flow regime occurs at very low concentrations of less than 500 ppm for VSL = 0.1 and 0.12 m/s. Chaotic motions of particles are observed as a dilute solid flow regime for a wide range of liquid-film velocities. As can be seen in Figs. 17, 18, and 19, no moving dunes are observed for the particle size of 425–600 µm for the entire range of solid-particles concentrations tested for VSL = 0.05, 0.1, and 0.12 m/s, and the critical solid-particles-deposition velocity is defined as the transi-tion from the concentrated solid flow to the stationary bed. Figs. 17 through 19 show that the critical solid-particles-deposition ve-locity increases for the entire concentration range. For VSL = 0.05 m/s, the stationary bed for all solid-particles concentrations is seen in the 3D wave, while the stationary solid-particles flow regime is observed in the 2D wave for VSL = 0.1 and 0.12 m/s at concentra-tions less than 500 ppm.
2D Wave
3D Wave
125–250 µm (VSL = 0.05 m/s)
0 1,000 2,000 3,000 4,000 5,000 6,000
Concentration (ppm)
7,000 8,000 9,000 10,000 11,000
Fully Dispersed
Dilute Solidsat Wall
Concentrated Solidsat Wall
Moving Dunes
StationaryDunes/Bed
2D and 3DWave Transition
1.40
1.20
1.00
0.80
0.60
0.40
0.20
0.00
VL
(m/s
)
Fig. 14—Liquid-film velocity vs. concentration for VSL = 0.05 m/s and particle size of 125–250 µm.
1.4
1.2
1
0.8
0.6
0.4
0.2
0
VL
(m/s
)
125–250 µm (VSL = 0.1 m/s)
0 1,000 2,000 3,000 4,000 5,000 6,000
Concentration (ppm)
7,000 8,000 9,000 10,000 11,000
2D Wave
3D Wave
Fully Dispersed
Dilute Solidsat Wall
Concentrated Solidsat Wall
Moving Dunes
StationaryDunes/Bed
2D and 3DWave Transition
Fig. 15—Liquid-film velocity vs. concentration for VSL = 0.1 m/s and particle size of 125–250 µm.
SPE_OGF_174960_160011.indd 9 27/09/16 8:16 PM
10 Oil and Gas Facilities • December 2016
125–250 µm, which confirms that with an increase in particle size, similar trends for the critical solid-particles-deposition velocities are observed, especially at high concentrations.
The authors believe that similar trends between the 125- to 250-µm and 425- to 600-µm particles occur because of the exis-tence of two forces—friction and drag—which have opposite ef-fects on the critical solid-particles-deposition velocity. The 425- to 600-µm particle is heavier compared with the 125- to 250-µm par-ticle, and, as a result, experiences larger frictional force. Hence, it requires higher critical solid-particles-deposition velocity to keep the particles moving. However, the 425- to 600-µm particle experi-ences a higher drag force from the surrounding liquid as a result of the larger cross-sectional area perpendicular to the fluid direction, which leads to the reduction in critical velocity needed to move the particles continuously.
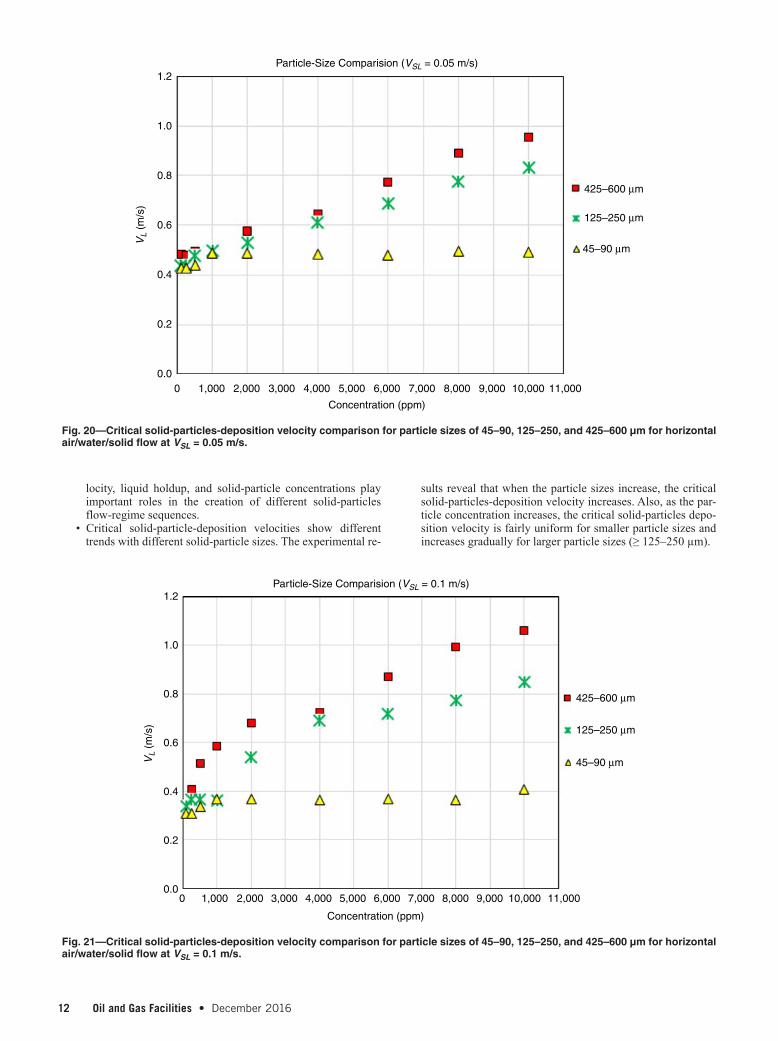
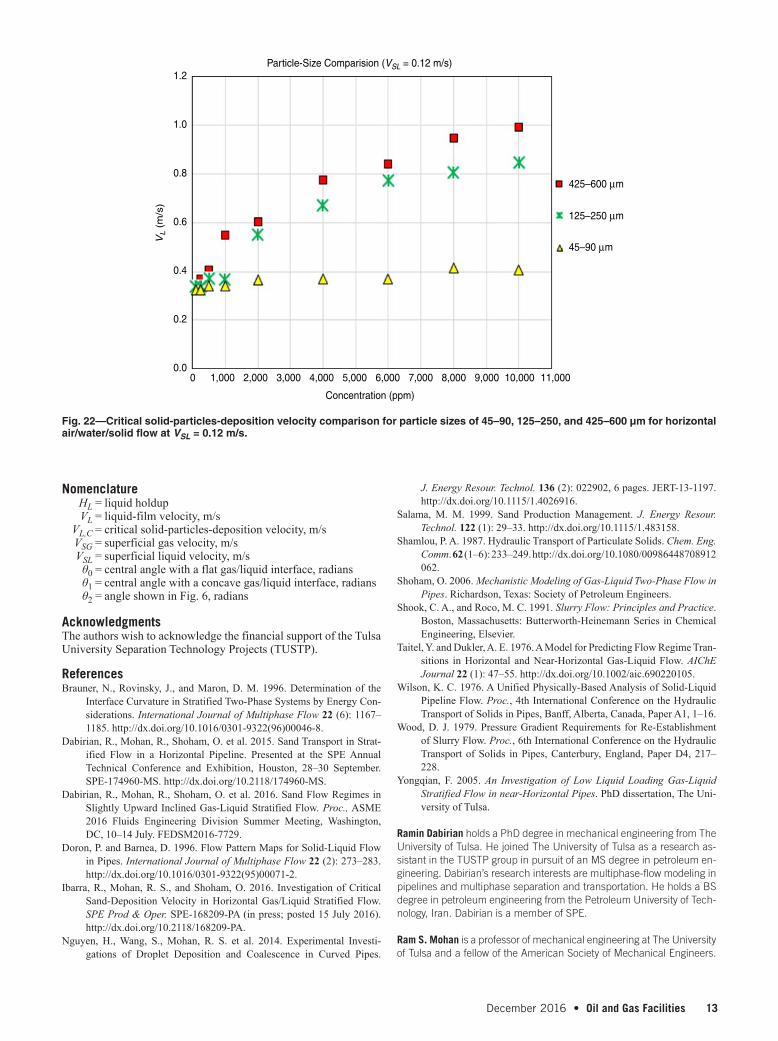
Critical Solid-Particle-Deposition Comparisons. Figs. 20, 21, and 22 show the critical solid-particle-deposition velocity com-parisons for particle sizes of 45–90, 125–250, and 425–600 µm for horizontal air/water/solid flow at VSL = 0.05, 0.1, and 0.12 m/s, re-spectively. Experimental data reveal that for the particle size of 45–90 µm, the critical velocity increases slightly with concentration, while for the particle size of 125–250 (>2,000 ppm) and 425–600 µm, the velocity increases exponentially with concentration. The comparisons of critical solid-particle-deposition velocities between the particle sizes of 45–90, 125–250, and 425–600 µm show that with increase in the particle size, higher critical solid-particles-de-position velocity is required to transport all particles. Also, the ex-perimental results show that less critical solid-particle-deposition velocity differences are seen between the particle sizes of 125–250 and 425–600 µm as compared with the particle sizes of 45–90 and
125–250 µm (VSL = 0.12 m/s)
0 1,000 2,000 3,000 4,000 5,000 6,000
Concentration (ppm)
7,000 8,000 9,000 10,000 11,000
2D Wave
3D Wave
Fully Dispersed
Dilute Solidsat Wall
Concentrated Solidsat Wall
Moving Dunes
StationaryDunes/Bed
2D and 3DWave Transition
1.6
1.4
1.2
1
0.8
0.6
0.4
0.2
0
VL
(m/s
)
Fig. 16—Liquid-film velocity vs. concentration for VSL = 0.12 m/s and particle size of 125–250 µm.
1.4
1.2
1
0.8
0.6
0.4
0.2
0
VL
(m/s
)
0 1,000 2,000 3,000 4,000 5,000 6,000
Concentration (ppm)
7,000 8,000 9,000 10,000 11,000
425–600 µm (VSL = 0.05 m/s)
Fully Dispersed
Dilute Solidsat Wall
Concentrated Solidsat Wall
Moving Dunes
StationaryDunes/Bed
2D and 3DWave Transition2D Wave
3D Wave
Fig. 17—Liquid-film velocity vs. concentration for VSL = 0.05 m/s and particle size of 425–600 µm.
SPE_OGF_174960_160011.indd 10 27/09/16 8:16 PM
December 2016 • Oil and Gas Facilities 11
• On the basis of this study, five solid-particle flow regimes are defined as stratified flow: fully dispersed solid flow, dilute solid flow, concentrated solid flow, moving dunes, and sta-tionary dunes/beds.
• An ultrasonic sensor measures the liquid height at the pipe center, but quantifying holdup on the basis of the liquid height is not reliable. To calculate liquid holdup accurately, a double-circle model is applied. According to this model, the liquid holdup is calculated by measuring the liquid height at the pipe center and the pipe side.
• Flow-regime sequences for three particle sizes of 45–90, 125–250, and 425–600 µm are investigated in this study. Gas ve-
ConclusionsExperimental studies have been conducted to study the hydraulic behavior of air/liquid/solid flow in horizontal stratified flow at solid-particle-concentration ranges of 100 to 10,000 ppm. A summary of the experimental study and main conclusions are presented as follows:
• A unique test facility is designed and constructed with a hor-izontal 4-in. transparent PVC pipe, which enables the mea-surement of superficial velocity, liquid-film velocity, liquid holdup, and pressure drop. The designed test loop uses water as liquid phase, air as gas phase, and glass beads as the solid particles. This allows determination of solid-particle flow re-gimes and critical solid-particle-deposition velocity.
1.4
1.2
1
0.8
0.6
0.4
0.2
0
VL
(m/s
)
0 1,000 2,000 3,000 4,000 5,000 6,000
Concentration (ppm)
7,000 8,000 9,000 10,000 11,000
425–600 µm (VSL = 0.1 m/s)
Fully Dispersed
Dilute Solidsat Wall
Concentrated Solidsat Wall
Moving Dunes
StationaryDunes/Bed
2D and 3DWave Transition2D Wave
3D Wave
Fig. 18—Liquid-film velocity vs. concentration for VSL = 0.1 m/s and particle size of 425–600 µm.
1.6
1.4
1.2
1
0.8
0.6
0.4
0.2
0
VL
(m/s
)
0 1,000 2,000 3,000 4,000 5,000 6,000
Concentration (ppm)
7,000 8,000 9,000 10,000 11,000
2D Wave
3D Wave
Fully Dispersed
Dilute Solidsat Wall
Concentrated Solidsat Wall
Moving Dunes
StationaryDunes/Bed
2D and 3DWave Transition
425–600 µm (VSL = 0.12 m/s)
Fig. 19—Liquid-film velocity vs. concentration for VSL = 0.12 m/s and particle size of 425–600 µm.
SPE_OGF_174960_160011.indd 11 27/09/16 8:16 PM
12 Oil and Gas Facilities • December 2016
sults reveal that when the particle sizes increase, the critical solid-particles-deposition velocity increases. Also, as the par-ticle concentration increases, the critical solid-particles depo-sition velocity is fairly uniform for smaller particle sizes and increases gradually for larger particle sizes (≥ 125–250 µm).
locity, liquid holdup, and solid-particle concentrations play important roles in the creation of different solid-particles flow-regime sequences.
• Critical solid-particle-deposition velocities show different trends with different solid-particle sizes. The experimental re-
0 1,000 2,000 3,000 4,000 5,000 6,000
Concentration (ppm)
7,000 8,000 9,000 10,000 11,000
Particle-Size Comparision (VSL = 0.05 m/s)1.2
1.0
0.8
0.6
0.4
0.2
0.0
VL
(m/s
)
425–600 µm
125–250 µm
45–90 µm
Fig. 20—Critical solid-particles-deposition velocity comparison for particle sizes of 45–90, 125–250, and 425–600 µm for horizontal air/water/solid flow at VSL = 0.05 m/s.
1.2
1.0
0.8
0.6
0.4
0.2
0.0
VL
(m/s
)
0 1,000 2,000 3,000 4,000 5,000 6,000
Concentration (ppm)
7,000 8,000 9,000 10,000 11,000
Particle-Size Comparision (VSL = 0.1 m/s)
425–600 µm
125–250 µm
45–90 µm
Fig. 21—Critical solid-particles-deposition velocity comparison for particle sizes of 45–90, 125–250, and 425–600 µm for horizontal air/water/solid flow at VSL = 0.1 m/s.
SPE_OGF_174960_160011.indd 12 27/09/16 8:16 PM
December 2016 • Oil and Gas Facilities 13
J. Energy Resour. Technol. 136 (2): 022902, 6 pages. JERT-13-1197. http://dx.doi.org/10.1115/1.4026916.
Salama, M. M. 1999. Sand Production Management. J. Energy Resour. Technol. 122 (1): 29–33. http://dx.doi.org/10.1115/1.483158.
Shamlou, P. A. 1987. Hydraulic Transport of Particulate Solids. Chem. Eng. Comm. 62 (1–6): 233–249. http://dx.doi.org/10.1080/00986448708912 062.
Shoham, O. 2006. Mechanistic Modeling of Gas-Liquid Two-Phase Flow in Pipes. Richardson, Texas: Society of Petroleum Engineers.
Shook, C. A., and Roco, M. C. 1991. Slurry Flow: Principles and Practice. Boston, Massachusetts: Butterworth-Heinemann Series in Chemical Engineering, Elsevier.
Taitel, Y. and Dukler, A. E. 1976. A Model for Predicting Flow Regime Tran-sitions in Horizontal and Near-Horizontal Gas-Liquid Flow. AIChE Journal 22 (1): 47–55. http://dx.doi.org/10.1002/aic.690220105.
Wilson, K. C. 1976. A Unified Physically-Based Analysis of Solid-Liquid Pipeline Flow. Proc., 4th International Conference on the Hydraulic Transport of Solids in Pipes, Banff, Alberta, Canada, Paper A1, 1–16.
Wood, D. J. 1979. Pressure Gradient Requirements for Re-Establishment of Slurry Flow. Proc., 6th International Conference on the Hydraulic Transport of Solids in Pipes, Canterbury, England, Paper D4, 217–228.
Yongqian, F. 2005. An Investigation of Low Liquid Loading Gas-Liquid Stratified Flow in near-Horizontal Pipes. PhD dissertation, The Uni-versity of Tulsa.
Ramin Dabirian holds a PhD degree in mechanical engineering from The University of Tulsa. He joined The University of Tulsa as a research as-sistant in the TUSTP group in pursuit of an MS degree in petroleum en-gineering. Dabirian’s research interests are multiphase-flow modeling in pipelines and multiphase separation and transportation. He holds a BS degree in petroleum engineering from the Petroleum University of Tech-nology, Iran. Dabirian is a member of SPE.
Ram S. Mohan is a professor of mechanical engineering at The University of Tulsa and a fellow of the American Society of Mechanical Engineers.
Nomenclature HL = liquid holdup VL = liquid-film velocity, m/s VL,C = critical solid-particles-deposition velocity, m/s VSG = superficial gas velocity, m/s VSL = superficial liquid velocity, m/s θ0 = central angle with a flat gas/liquid interface, radians θ1 = central angle with a concave gas/liquid interface, radians θ2 = angle shown in Fig. 6, radians
AcknowledgmentsThe authors wish to acknowledge the financial support of the Tulsa University Separation Technology Projects (TUSTP).
ReferencesBrauner, N., Rovinsky, J., and Maron, D. M. 1996. Determination of the
Interface Curvature in Stratified Two-Phase Systems by Energy Con-siderations. International Journal of Multiphase Flow 22 (6): 1167–1185. http://dx.doi.org/10.1016/0301-9322(96)00046-8.
Dabirian, R., Mohan, R., Shoham, O. et al. 2015. Sand Transport in Strat-ified Flow in a Horizontal Pipeline. Presented at the SPE Annual Technical Conference and Exhibition, Houston, 28–30 September. SPE-174960-MS. http://dx.doi.org/10.2118/174960-MS.
Dabirian, R., Mohan, R., Shoham, O. et al. 2016. Sand Flow Regimes in Slightly Upward Inclined Gas-Liquid Stratified Flow. Proc., ASME 2016 Fluids Engineering Division Summer Meeting, Washington, DC, 10–14 July. FEDSM2016-7729.
Doron, P. and Barnea, D. 1996. Flow Pattern Maps for Solid-Liquid Flow in Pipes. International Journal of Multiphase Flow 22 (2): 273–283. http://dx.doi.org/10.1016/0301-9322(95)00071-2.
Ibarra, R., Mohan, R. S., and Shoham, O. 2016. Investigation of Critical Sand-Deposition Velocity in Horizontal Gas/Liquid Stratified Flow. SPE Prod & Oper. SPE-168209-PA (in press; posted 15 July 2016). http://dx.doi.org/10.2118/168209-PA.
Nguyen, H., Wang, S., Mohan, R. S. et al. 2014. Experimental Investi-gations of Droplet Deposition and Coalescence in Curved Pipes.
1.2
1.0
0.8
0.6
0.4
0.2
0.0
VL (
m/s
)
0 1,000 2,000 3,000 4,000 5,000 6,000
Concentration (ppm)
7,000 8,000 9,000 10,000 11,000
Particle-Size Comparision (VSL = 0.12 m/s)
425–600 µm
125–250 µm
45–90 µm
Fig. 22—Critical solid-particles-deposition velocity comparison for particle sizes of 45–90, 125–250, and 425–600 µm for horizontal air/water/solid flow at VSL = 0.12 m/s.
SPE_OGF_174960_160011.indd 13 27/09/16 8:16 PM
14 Oil and Gas Facilities • December 2016
or coauthored more than 90 publications in the areas of multiphase flow, multiphase separation, and production operations and holds four patents/invention disclosures. He holds BS and MS degrees in chemical engineering from the Technion in Israel and the University of Houston, respectively, and a PhD degree in mechanical engineering from Tel Aviv University. Shoham has published a widely referenced SPE book, Mech-anistic Modeling of Gas-Liquid Flow. He is the recipient of the 2003 SPE International Production and Operations Award and has received sev-eral best-paper awards. Shoham is a member of SPE.
Gene Kouba is retired from Chevron, where he was a research consultant for their Energy Technology Company. His primary research interests include issues in multiphase-flow transport and separation. Kouba has authored or coauthored 88 technical papers and holds eight patents. He holds a PhD degree in petroleum engineering from The University of Tulsa. Kouba was the recipient of the 2014 SPE Projects, Facilities, and Construction Award.
He teaches and conducts research in the areas of multiphase flow, oil/water dispersion, instrumentation and measurements, control systems, compact separators, computer-aided design, and manufacturing pro-cesses. Mohan currently serves as the codirector of TUSTP, supported by several oil companies. He also directs several projects supported by the Chevron Tulsa University Center of Research Excellence. Mohan has authored or coauthored more than 75 refereed publications in the areas of his research, holds four patents/invention disclosures, and has received several best-paper awards. He holds a BSc degree in mechan-ical engineering from the University of Kerala, India, and MS and PhD degrees in mechanical engineering from the University of Kentucky. Mohan is a member of SPE.
Ovadia Shoham is the F. M. Stevenson Distinguished Presidential Chair Professor of Petroleum Engineering at The University of Tulsa. Since 1994, he has directed TUSTP, conducting research on compact sepa-rators and several projects supported by industry. Shoham has authored
SPE_OGF_174960_160011.indd 14 27/09/16 8:16 PM