Embed Size (px)
Citation preview

Journal of Experimental Botanydoi:10.1093/jxb/erv416
REVIEW PAPER
Solid-state NMR investigations of cellulose structure and interactions with matrix polysaccharides in plant primary cell walls
Tuo Wang and Mei Hong*
Department of Chemistry, Massachusetts Institute of Technology, 170 Albany Street, Cambridge, MA 02139, USA
* To whom correspondence should be addressed. E-mail: [email protected]
Received 15 May 2015; Revised 30 July 2015; Accepted 11 August 2015
Editor: Simon Turner
Abstract
Until recently, the 3D architecture of plant cell walls was poorly understood due to the lack of high-resolution tech-niques for characterizing the molecular structure, dynamics, and intermolecular interactions of the wall polysac-charides in these insoluble biomolecular mixtures. We introduced multidimensional solid-state NMR (SSNMR) spectroscopy, coupled with 13C labelling of whole plants, to determine the spatial arrangements of macromolecules in near-native plant cell walls. Here we review key evidence from 2D and 3D correlation NMR spectra that show relatively few cellulose–hemicellulose cross peaks but many cellulose–pectin cross peaks, indicating that cellulose microfibrils are not extensively coated by hemicellulose and all three major polysaccharides exist in a single network rather than two separate networks as previously proposed. The number of glucan chains in the primary-wall cellulose microfibrils has been under active debate recently. We show detailed analysis of quantitative 13C SSNMR spectra of cellulose in various wild-type (WT) and mutant Arabidopsis and Brachypodium primary cell walls, which consistently indicate that primary-wall cellulose microfibrils contain at least 24 glucan chains.
Key words: Arabidopsis, Brachypodium, cellulose microfibrils, dynamics, intermolecular contact, multidimensional correlation NMR.
Introduction
Plant primary cell walls contain many macromolecules, including cellulose, hemicelluloses, pectins, and glycopro-teins. Cellulose microfibrils consist of linear glucan chains that are held together by hydrogen bonds and other non-covalent interactions (Nishiyama et al., 2002, 2003b; Jarvis, 2003). In dicotyledonous plants, the main hemicellulose is xyloglucan (XyG), which are glucan chains substituted with Xyl, Gal, and Fuc sidechains (Fry, 1989; Park and Cosgrove, 2015). In grass primary walls, the main hemicelluloses are glucuronoarabinoxylan (GAX) and mixed-linkage glucan
(MLG). GAX has a β-(1,4)-linked xylose (Xyl) backbone and Ara and glucuronic acid (GlcA) sidechains, while MLGs are unbranched chains of ~30% β-(1,3) and ~70% β-(1,4)-linked glucopyranosyl residues (Woodward et al., 1988; Kiemle et al., 2014). Pectins are acidic polysaccharides rich in galacturonic acid (GalA) residues. In dicot primary cell walls, both linear homogalacturonan (HG) and branched rhamnogalacturonan (RG) with arabinose and galactose (Gal) sidechains are pre-sent (Caffall and Mohnen, 2009), while grass primary walls contain only low concentrations of pectins (Vogel, 2008).
© The Author 2015. Published by Oxford University Press on behalf of the Society for Experimental Biology. All rights reserved. For permissions, please email: [email protected]
Abbreviations: b, surface-bound interior cellulose; c, core interior cellulose; DQF, double-quantum-filtered; G, glucose in xyloglucan; GAX, glucuronoarabinoxylan; HG/HGA, homogalacturonan; i, interior crystalline cellulose; INADEQUATE, incredible natural-abundance double-quantum transfer experiment; MAS, magic-angle spinning; MLG, mixed-linkage glucan; PDSD, proton-driven spin diffusion; s, surface cellulose; SSNMR, solid-state NMR; WT, wild-type; XyG, xyloglucan.
Journal of Experimental Botany Advance Access published September 9, 2015 at Pennsylvania State U
niversity on Novem
ber 4, 2015http://jxb.oxfordjournals.org/
Dow
nloaded from

Page 2 of 12 | Wang and Hong
Although the chemical structures and compositions of plant cell wall polymers are relatively well known, how these wall polymers form a 3D network to provide mechanical strength to the wall while allowing the wall to expand and grow is still poorly understood (Cosgrove, 2001, 2014). Molecular-level 3D structural information is difficult to obtain because of the insoluble nature of the cell wall and the amorphous nature of most wall polysaccharides except cellulose (Jarvis, 1992; Cosgrove, 2005). Thus, decades of cell wall structure charac-terization mainly involved chemical extractions followed by sugar analysis and microscopic imaging, which are limited by significant perturbation of the wall structure and insufficient spatial resolution (Mccann et al., 1990, 1995; Talbott and Ray, 1992). In vitro binding assays have been used to measure the binding affinities between different wall polysaccharides, but they cannot reproduce the complex molecular interactions in the native wall after biosynthesis. VanderHart and Atalla pio-neered the use of 13C solid-state NMR (SSNMR) spectros-copy to characterize purified cellulose in higher plants (Atalla and VanderHart, 1984, 1999). From the 13C chemical shifts, they resolved two cellulose allomorphs, Iα and Iβ. Recently, advanced 2D correlation SSNMR techniques were used to definitively assign these 13C chemical shifts and obtain 1H chemical shifts in bacterial and tunicate cellulose (Kono et al., 2003; Kono and Numata, 2006). These data indicate that the anhydroglucose residues in the two cellulose allo-morphs have distinct conformations and are distributed dif-ferently in the glucan chains. SSNMR has also been used to investigate polysaccharide structures in secondary cell walls (Bardet et al., 1997; Dupree et al., 2015), protein cross link-ing in soybean cell walls (Cegelski et al., 2010), and effects of hydration on polysaccharide mobility in onion cell walls (Hediger et al., 1999, 2002). However, these SSNMR studies did not give information on cellulose interactions with matrix polysaccharides in primary cell walls.
Recently, we introduced 2D and 3D correlation SSNMR for investigating the intermolecular interactions of polysac-charides in near-native, hydrated plant primary cell walls (Dick-Perez et al., 2011). By labelling whole plants with 13C,
we obtained sufficient sensitivity to conduct multidimen-sional correlation SSNMR experiments, which are necessary for resolving the signals of multiple wall polysaccharides. In this way, we obtained site-specific information about the conformation, dynamics, water interaction, and intermolecu-lar contacts of the macromolecules in near-native plant cell walls. In this paper, we review key results from these multi-dimensional correlation SSNMR data. We show that there are relatively few cellulose–xyloglucan cross peaks but many cellulose–pectin cross peaks in Arabidopsis cell walls, which revise the conventional ‘tethered-network’ model of the cell wall and suggest instead a single cohesive network in which cellulose contacts both pectins and xyloglucan (Dick-Perez et al., 2011; Wang et al., 2012). Similarly, we observed cel-lulose-GAX cross peaks in the cell wall of the model grass Brachypodium, which provide new insight into polysaccharide interactions in grass cell walls. The major findings of these SSNMR studies are summarized in Table 1.
The C4 chemical shifts of most native celluloses exhibit two resolved bands centred at 89 ppm and 85 ppm, which have long been attributed to interior and surface chains of the microfibril, respectively (Earl and VanderHart, 1981). The relative intensities of these surface and interior cellulose peaks were recently used together with X-ray diffraction and computational modelling to constrain the cross-sectional area of cellulose microfibrils in plants, resulting in structural models with as few as 15 chains and as many as 25 chains (Newman et al., 1994, 1996, 2013; Kennedy et al., 2007; Fernandes et al., 2011; Thomas et al., 2013). These estimates are much smaller than the original 36-chain model proposed based on the hypothesized number of cellulose–synthase pro-teins in the plasma membrane (Scheible et al., 2001; Taylor, 2008; Guerriero et al., 2010), and the 18-chain model was particularly guided by emerging biochemical data indicating the stoichiometry of the different cellulose synthases in hexa-meric rosettes and computational modelling of the cellulose synthase structure (Sethaphong et al., 2013; Hill et al., 2014). In this paper, we provide the first quantitative analysis of the intensities of interior and surface cellulose C4 signals in
Table 1. SSNMR studies of primary cell walls by Hong research group
Major findings Key experiments References
There are limited XyG-cellulose contacts but extensive pectin-cellulose contacts in Arabidopsis cell walls.
DQF, INADEQUATE, DIPSHIFT, 3D CCC Dick-Perez et al. (2011)
Partial depectination rigidifies the remaining wall polymers. PDSD, 13C–T1, 1H–T1ρ Dick-Perez et al. (2012)
25–50% of the cellulose surface is surrounded by pectins. PDSD buildup analysis, RFDR Wang et al. (2012)Cellulose crystallinity is reduced in cesa1aegeus/cesa3ixr1–2 mutant. CP, DP, INADEQUATE Harris et al. (2012)Expansin binds XyG-enriched regions of cellulose microfibrils to loosen the cell wall.
Dynamic nuclear polarization, Protein-edited spin diffusion Wang et al. (2013)
GAX and cellulose have sub-nanometre spatial contacts in Brachypodium cell walls.
Short-CP PDSD, 13C–T1, 1H–T1ρ Wang et al. (2014)
Use water to probe the structure of intact and digested walls. Water-polysaccharide spin diffusion White et al. (2014)Intermolecular cross peaks can be selectively detected in a new 2D 13C correlation experiments.
T1-compensated PDSD Wang et al. (2015b)
Cellulose-pectin spatial contacts are inherent in the primary walls, independent of the hydration history. Never-dried and rehydrated walls show the same cellulose–pectin cross peaks.
13C–1H MELODI-HETCOR Wang et al. (2015a)
at Pennsylvania State University on N
ovember 4, 2015
http://jxb.oxfordjournals.org/D
ownloaded from

Structure and interactions of cell wall polymers | Page 3 of 12
several plant primary cell walls. The resulting, more accurate, intensity ratios indicate a minimum number of 24 chains in both dicot and grass primary cell wall cellulose microfibrils.
Plant cell wall 13C labelling for magic-angle-spinning SSNMR
The main requirement for 2D and 3D 13C magic-angle-spinning (MAS) SSNMR studies of plant cell walls is 13C enrichment of the cell wall. This 13C labelling gives the necessary sensitivity to correlate and resolve the signals of many polysaccharides and proteins. We labelled Arabidopsis and Brachypodium primary cell walls by growing the plants in liquid culture containing 13C-labelled glucose in the dark. By restricting the growth period to 2 weeks, we produced chiefly primary cell walls with negligi-ble amounts of secondary cell walls, as confirmed by the lack of lignin signals in the SSNMR spectra (Dick-Perez et al., 2011). Whole seedlings were harvested and intracellular molecules and starch were removed by SDS, sodium metabisulphate, and amylase. All cell wall samples for these SSNMR studies were well hydrated (40–80 weight% water): the first samples involved freeze–drying of the wall followed by rehydration (Dick-Perez et al., 2011; Wang et al., 2012), while subsequent samples were never dried (Wang et al., 2014; White et al., 2014). Our recent comparison of the rehydrated and never-dried cell walls found that polysaccharides 13C chemical shifts, nuclear-spin relaxa-tion times, and intermolecular cross peaks are indistinguishable (Wang et al., 2015a), indicating that the molecular-level struc-ture and dynamics of wall polysaccharides are reproducible and reversible upon rehydration. Comparison of the quantita-tive NMR spectra with sugar analysis results (Dick-Perez et al., 2011; White et al., 2014) also indicates that the 13C labelling is relatively uniform for all wall polysaccharides.
13C resonance assignment and the nature of cross peaks in multidimensional SSNMR spectra
The first step in extracting information from the 2D and 3D SSNMR spectra is to resolve and assign the 13C chemical shifts of the polysaccharides and proteins. We achieved this using a combination of four correlation NMR techniques: 1) 2D 13C-13C double-quantum to single-quantum correla-tion mediated by through-bond 13C-13C J-coupling. This experiment is called J-INADEQUATE (Bax et al., 1980; Lesage et al., 1997); 2) 2D 13C-13C 1H-driven spin diffu-sion experiments called PDSD or DARR (Takegoshi et al., 2001); 3) Double-quantum-filtered (DQF) 2D 13C-13C cor-relation experiment using homonuclear dipolar recoupling sequences (Hohwy et al., 1999); 4) 3D 13C-13C-13C correlation experiment mediated by 13C spin diffusion (Li et al., 2010). The J-INADEQUATE experiment exhibits cross peaks only between bonded 13C spins, because the polarization is trans-ferred via the electrons in the covalent bond, while the other three experiments exhibit cross peaks between carbons that are close in space, because polarization transfer is medi-ated by distance-dependent dipolar couplings. Thus, cross
peaks from experiments 2) to 4) can occur between directly bonded or non-bonded carbons. For carbons in a uniformly 13C-labelled sugar residue, relayed dipolar transfer through multiple bonds is highly efficient. Thus, a C1–C3 cross-peak, for example, is most likely mediated by relayed C1–C2 and C2–C3 dipolar transfer instead of direct C1–C3 dipolar transfer. The DQF correlation experiment differs from the spin diffusion experiments in that the former mostly exhib-its one-bond and two-bond cross peaks, so that the spectra are relatively simple, while the latter can exhibit cross peaks between more distant carbons. To detect long-range 13C-13C distances up to 1 nm, one can increase the spin diffusion mix-ing time. The intensity buildup of cross peaks with the mixing time contains semi-quantitative information about internu-clear distances. To better resolve long-range cross peaks with high structural content from short-range cross peaks that are mainly useful for resonance assignment, we introduced a relaxation-compensated PDSD technique, which produces a difference spectrum that shows only intermolecular cross peaks (Wang et al., 2015b). Further development of SSNMR methods will be desirable for resolving and detecting inter-molecular contacts between different wall polymers.
These 2D and 3D 13C correlation NMR spectra allowed us to type-assign most 13C signals of the common monosac-charides, namely Glc, Ara, GalA, GlcA, Xyl, Rha, and Gal, in the primary walls of Arabidopsis (Dick-Perez et al., 2011), Brachypodium (Wang et al., 2014), and maize (unpublished data). For the same type of monosaccharide, the 13C chemical shifts can vary due to different sugar conformations, linkages, and hydrogen bonding patterns. For example, nine types of arabinose signals were resolved in Brachypodium cell walls, which can be assigned to different arabinose linkages in GAX and arabinan (Wang et al., 2014). So far, the resolved poly-saccharide-specific signals include all six glucose carbons of interior and surface cellulose (Wang et al., 2012), all five 13C signals of Xyl in XyG, all Ara signals of arabinan (Dick-Perez et al., 2011), and all signals of Xyl, GlcA, and ferulic acid in GAX (Wang et al., 2014). The Glc backbone and Gal side-chain of XyG are incompletely resolved due to signal overlap from surface cellulose and galactan, respectively. In addition, GalA signals are often used to denote pectin backbones, but their originating polysaccharides, HG and RG, cannot yet be distinguished. Polysaccharide-specific isotopic labelling will be useful to further resolve these signals.
Higher magnetic fields significantly enhance the resolu-tion of the cell wall NMR spectra. To date, the highest field strength we have used for plant cell walls is 21.1 Tesla, corre-sponding to a 1H Larmor frequency of 900 MHz. At this field strength, at least two types of crystalline cellulose signals have been observed (Wang et al., 2012) and dramatic improvement of spectral resolution is seen for matrix polysaccharides. For example, Fig. 1 compares the 2D J-INADEQUATE spectra of the same Arabidopsis primary cell wall sample at 400, 600, and 900 MHz. The 13C linewidths of matrix polysaccharides are 0.7–1.4 ppm at 400 MHz, 0.5–1.1 ppm at 600 MHz, and only 0.2–0.5 ppm at 900 MHz. The cellulose spectral resolu-tion is also substantially improved: the linewidths are ~2 ppm at low fields but narrow to 0.7–1.0 ppm at 900 MHz. This
at Pennsylvania State University on N
ovember 4, 2015
http://jxb.oxfordjournals.org/D
ownloaded from

Page 4 of 12 | Wang and Hong
line narrowing indicates that the 13C linewidths of uniformly 13C-labelled cell walls have a substantial homogeneous con-tribution due to residual dipolar couplings to 1H and 13C-13C J-couplings, which becomes less important at higher magnetic fields. Using the C1 region of the 2D J-INADEQUATE spec-tra as an example, the 900 MHz spectrum resolves at least 14 peaks while the 400 MHz spectrum resolves only ~10 peaks (Fig. 1). In addition, the 900 MHz spectrum resolves three types of AC2 and four types of AC4, while the spectra meas-ured at lower fields only exhibit one broad AC2 peak and one or two AC4 peaks, partially overlapped with cellulose signals. With the enhanced resolution at high fields, we can unam-biguously resolve signals that are only 0.2–0.3 ppm apart. Further increase of the NMR field strengths to 1.0 GHz and beyond is expected to provide even more benefit for obtaining finer structural details of wall polysaccharides.
The challenge of resolving the polysaccharide signals of native cell walls is also met by exploiting the mobility dif-ference between cellulose and matrix polysaccharides: cellu-lose is largely immobilized except for the C6 hydroxymethyl group, whereas pectins and hemicellulose are highly mobile with C–H bond order parameters of ~0.5 (Dick-Perez et al., 2011; Wang et al., 2014). This mobility difference allows us to selectively detect the signals of rigid or mobile polysaccha-rides in separate spectra. For example, the mobile GAX in the Brachypodium primary wall were selectively detected in the 2D J-INADEQUATE spectra measured with direct polarization (DP), and the large number of narrow 13C signals has been assigned to five different Xyl and nine different Ara types, indicating the diverse linkages and substitution patterns of GAX in grass primary walls (Wang et al., 2014). 13C-1H dipo-lar dephasing has also been used to suppress the signals of rigid cellulose and detect only those of mobile matrix poly-saccharides (Komatsu and Kikuchi, 2013). Conversely, by using short 1H-13C cross polarization (CP) transfer, we have
obtained 13C spectra exhibiting only cellulose signals in the Brachypodium cell wall.
Intermolecular cross peaks of primary cell wall polysaccharides
The assignment of most polysaccharide 13C chemical shifts allowed us to determine 13C-13C cross peaks that reflect inter-molecular proximities. With mixing times of 1.5 s and shorter, a conservative estimate of the upper bound of 13C-13C dis-tances is 10 Å. For the Arabidopsis cell wall, 3D and 2D spec-tra have been measured with spin diffusion mixing times of up to 300 ms and 1.5 s, respectively (Dick-Perez et al., 2011; Wang et al., 2012). These spectra yielded a number of unam-biguous cross peaks between cellulose and pectins, for exam-ple, between the crystalline cellulose C4 chemical shifts of 89 ppm and the pectin chemical shifts of 101 ppm and 80 ppm (Fig. 2A). On the other hand, although hemicellulose was long thought to cover the surfaces of cellulose microfi-brils, cross peaks between the two are few and ambiguous. The 3D spectra of the Arabidopsis wall showed a few cellu-lose cross peaks with the XyG backbone Glc and with Gal sidechains (Dick-Perez et al., 2011), but no unambiguous signals between cellulose and xylose were detected. Further experiments that better resolve XyG signals will be useful for verifying the paucity of cellulose–hemicellulose cross peaks. However, the fact that even with partial resonance overlap, such cellulose–hemicellulose cross peaks are not abundant strongly suggests that XyG does not extensively coat the microfibril surface (Bootten et al., 2004). Since in vitro assem-bly data showed that XyG has a stronger affinity for cellu-lose than pectins, these SSNMR data imply that in vivo wall assembly is quite different from in vitro assembly, and pectins and hemicellulose may compete for cellulose binding sites in ways that are not replicated in vitro (Wang et al., 2015a).
Fig. 1. 2D 13C-13C J-INADEQUATE spectra of never-dried Arabidopsis cell walls at room temperature, correlating double-quantum (DQ) and single-quantum (SQ) 13C chemical shifts. The spectra were measured at 400, 600, and 900 MHz. Insets magnify the C1 region of the spectra to indicate the resolution enhancement by higher magnetic fields. The bottom row amplifies the C2–C4 region of arabinose, where high magnetic fields significantly improve the resolution of multiple forms of arabinose.
at Pennsylvania State University on N
ovember 4, 2015
http://jxb.oxfordjournals.org/D
ownloaded from

Structure and interactions of cell wall polymers | Page 5 of 12
It is noteworthy that most cellulose–pectin cross peaks observed in the intact cell wall are retained in a sample in which ~40% of HG had been extracted (Fig. 2A, B) (Wang et al., 2015a). This means that the cellulose–pectin spatial contacts are not due to molecular crowding; rather, RG-I and some of the HG are responsible for contacting cellulose. These findings are consistent with the observation that cel-lulose–pectin cross peaks are also independent of hydration and temperature, and together suggest that the interactions between pectins and cellulose are specific, and some pectins may be entrapped inside or between the microfibrils (Wang et al., 2015a). Therefore, pectins may play more important roles in wall biomechanics than depicted in the traditional tethered-network model. Indeed, recent biochemical data showed that arabinans and galactans interact strongly with cellulose (Zykwinska et al., 2007), and XyG-deficient cell walls exhibit almost normal development as wild-type (WT) cell wall (Cavalier et al., 2008).
The matrix polysaccharides of grass primary cell walls differ chemically from those of dicot primary walls (Carpita and Gibeaut, 1993; Carpita, 1996). In the 2-week-old Brachypodium primary walls, the main matrix polysaccha-ride is highly branched GAX (Wang et al., 2014), and no MLG signals were detected. For this two-component cell wall, 2D 13C correlation spectra exhibited many cellulose–GAX cross peaks, for example between Ara C1 (108.4 ppm) and interior cellulose C4 (88.3 ppm), and between Xyl C1 (102.0 ppm) and interior cellulose C4 (Fig. 2C). Although such GAX–cellulose spatial contact may not seem surpris-ing given the fact that few other matrix polysaccharides are present, the data counter the conventional model that highly branched GAX chains cannot bind cellulose. An implica-tion of this finding is that the cellulose microfibril has suf-ficient unevenness and surface disorder to accommodate the branched polysaccharides. Again, in vitro binding assays report only a small fraction (4–15%) of GAX binding to cellulose (Carpita, 1983), similar to the low-level of pectin–cellulose binding in vitro, but these results may systemati-cally underestimate the in vivo intermolecular interactions in the wall.
Percentages of sugar residues at intermolecular interfaces
Since the cross-peak intensities at long mixing times reflect the percentage of a polysaccharide in nanometre contact with each other, we can estimate the percentages of sugar residues at inter-molecular interfaces. Since each surface cellulose chain must be adjacent to one interior cellulose chain, the surface–interior cel-lulose cross-peak intensity in the 2D spectra serves as an inter-nal control of the extent of intermolecular contacts between matrix polysaccharides and cellulose. We found that 25–50% of surface cellulose contacts pectins (Wang et al., 2012). This is a very significant percentage not predicted by existing cell wall structural models. The extent of cellulose–XyG interaction cannot be accurately estimated because of insufficient resolu-tion of the XyG backbone signals in the spectra.
A second approach for estimating the percentages of pec-tins and XyG that interact with cellulose is by detecting heterogeneous mobilities of the matrix polysaccharides. In both Arabidopsis and Brachypodium primary walls, cellulose backbone exhibits single-exponential decays for both 13C spin-lattice (T1) relaxation and 1H rotating-frame spin-lattice relaxation (T1ρ) (Dick-Perez et al., 2011; Wang et al., 2014), indicating that cellulose is uniformly rigid. In comparison, XyG and pectins in Arabidopsis show double-exponential relaxation where 40–60% of a highly mobile component coex-ists with a rigid component. The most likely interpretation of this bimodal dynamics is that two domains exist in each matrix polysaccharide: the rigid domain interacts with cellu-lose through van der Waals interaction, hydrogen bonding, or entrapment, while the mobile domain occupies the inter-fibril-lar space. Interestingly, in both Arabidopsis and Brachypodium primary walls, the well resolved 65-ppm peak of interior cel-lulose C6 also exhibits bimodal relaxation, with the mobile component accounting for ~20% of the total intensity. This mobility could be explained by the freedom of C6 to rotate and change the C4–C5–C6–O6 torsion angle (Matthews et al., 2006; Fernandes et al., 2011) or by the flexibilities of the matrix polysaccharides that contact cellulose, which may influence the exposed C6 more than the embedded ring carbons.
Fig. 2. 2D 13C-13C PDSD spectra of plant cell walls measured with 1.5 s spin diffusion mixing. (A) Intact Arabidopsis cell wall at 20 °C. (B) HG-depleted Arabidopsis cell wall at −20 °C. (C) Brachypodium cell wall at −20 °C. Cellulose–pectin cross peaks are observed in both intact and HG-depleted Arabidopsis cell walls, and cellulose–GAX cross peaks are detected in the Brachypodium sample.
at Pennsylvania State University on N
ovember 4, 2015
http://jxb.oxfordjournals.org/D
ownloaded from

Page 6 of 12 | Wang and Hong
Single network model of plant primary walls
The intermolecular cross peaks in the 2D and 3D 13C cor-relation spectra support a single network model of primary cell walls, in which both pectins and hemicellulose interact with cellulose microfibrils. This conclusion is supported by a recent hydration study that found that removal of Ca2+ ions that crosslink HG slowed down water 1H spin diffusion to both pectins and cellulose (White et al., 2014), indicating that cellulose interacts intimately with pectins. This structural conclusion also found support from recent biomechanical assays showing that the majority of XyG does not have load-bearing function, since endoglucanases that hydrolyse only XyG or only cellulose do not cause wall creep. Instead, an endoglucanase that simultaneously cuts XyG and cellulose loosens the wall, thus only a small fraction of XyG binds cel-lulose as load-bearing tethers (Park and Cosgrove, 2012a, b). Intriguingly, these cellulose-XyG ‘biomechanical hotspots’ have been recently found to be the site of expansin binding using 13C spin diffusion NMR (Wang et al., 2013).
Lateral heterogeneity of cellulose conformations in the microfibril from 2D SSNMR spectra
Multidimensional 13C SSNMR not only provides information on the 3D architecture of the cell wall, but also constrains the cross-sectional area of cellulose microfibrils. The C1, C4, and C6 chemical shifts of cellulose have long been known to be diagnostic of cellulose crystallinity and allomorphs (Atalla and VanderHart, 1984, 1999; Horii et al., 1987). For our analysis below, we assign the C4 and C6 chemical shifts of 89 and 65 ppm to interior crystalline glucan chains, and the 85 and 62 ppm peaks to surface chains with partial disorder. The 89/65 ppm interior glucan signals are well resolved from all other polysaccharides’ signals, thus they are unambiguous
indicators of cellulose. The possibility that the 85/62 ppm chains may reside inside the microfibril instead of on the surface is considered low, because the 85/62 ppm peaks have strong cross peaks with matrix polysaccharides and water (Fernandes et al., 2011; Wang et al., 2012; White et al., 2014) and exhibit large-amplitude dynamics (Dick-Perez et al., 2011; Wang et al., 2014). Longitudinal disorder of interior glucan chains has been estimated at only 4–5 residues for every 300 residues (Nishiyama et al., 2003a), thus it should not significantly affect the extracted ratio of surface:interior chain numbers.
Fig. 3 shows the 2D 13C-13C PDSD spectrum of never-dried Brachypodium cell walls at 20 °C (Wang et al., 2014). The 13C magnetization was created using a short 1H-13C CP contact time of 35 μs, which suppressed the signals of mobile polysaccharides and gave a predominantly cellulose spectrum in the indirect dimension. A long 13C spin diffusion mixing time of 3.0 s was applied to transfer the 13C magnetization to polysaccharides within ~1 nm of the cellulose. Interestingly, despite the long mixing time, the 13C cross sections of inte-rior and surface cellulose are not identical (Fig. 3B), with the difference spectrum corresponding to that of pure crys-talline cellulose. Long mixing time PDSD spectra were also measured at low temperature (−20 °C) to freeze molecular motion and with regular CP contact times to detect all poly-saccharide signals. The resulting surface and interior cellulose cross sections still retain their different intensity distributions (Wang et al., 2014). These results indicate that some interior glucan chains are separated from the surface chains by more than the distance reach of 13C spin diffusion. Thus, there are two types of interior cellulose chains: a core (c) fraction that is not in direct contact with the surface, and a bound (b) fraction (Fig. 3C). This result dovetails an earlier structural model based on spectral deconvolution, which suggested the presence of a para-crystalline layer between the microfibril surface and the crystalline core (Larsson et al., 1999). The C6 of the two interior cellulose fractions resonates at slightly different chemical shifts, 65.5 ppm for the core cellulose and
Fig. 3. (A) 2D 13C-13C PDSD spectrum of Brachypodium cell wall with a 3.0 s mixing. The spectrum was measured at 20 °C with a short 1H-13C CP contact time of 35 μs to suppress the signals of mobile GAX. (B) Representative cross sections of interior cellulose (black) and surface cellulose (orange). The different intensity patterns indicate that 13C magnetization has not equilibrated between interior and surface cellulose. The difference spectra (purple), obtained after normalizing the two cross sections by the sC4 peak, correspond to core cellulose chains that are inaccessible to the surface. (C) Illustration of the cellulose microfibril structure, where interior cellulose consists of a surface-bound fraction and a core fraction. (D) The two types of interior cellulose chains have slightly different C6 chemical shifts.
at Pennsylvania State University on N
ovember 4, 2015
http://jxb.oxfordjournals.org/D
ownloaded from

Structure and interactions of cell wall polymers | Page 7 of 12
64.8 ppm for the surface-bound interior cellulose (Fig. 3D), suggesting that the hydroxymethyl conformation depends on the location of the interior chains, with the core cellulose C6 chemical shift corresponding to that of a trans-gauche (tg) conformer (Vietor et al., 2002). The Brachypodium result is reproduced in the Arabidopsis cell wall (Fig. 4), which also exhibits different surface and interior cellulose cross sec-tions at long mixing times, with the difference spectrum cor-responding to the signals of crystalline cellulose. Therefore, cellulose microfibrils in both grass and dicot primary walls are sufficiently large to contain three layers of glucan chains.
The core cellulose has two resolved cC1 peaks at 105.5 and 104.0 ppm (Table 2), which resemble the C1 chemical shifts of Iβ cellulose (Kono et al., 2003). The C3, C5, and C6 chemical shifts of core cellulose are also similar to those of Iβ cellulose. However, no doublet is observed for C6, as expected for Iβ cellulose. We attribute this absence to insufficient resolution since the two Iβ C6 chemical shifts differ by only 0.6 ppm based on tunicate cellulose data (Table 2) (Kono et al., 2003; Kono and Numata, 2006). The Iβ allomorph contains two types of magnetically inequivalent anhydroglucose residues, which are not directly linked in the same chain but are located in different chains (Kono and Numata, 2006) and perhaps
even in alternating sheets (Nishiyama et al., 2002; Jarvis, 2003). It is well known that the Iα allomorph dominates in bacterial and algae while the Iβ allomorph dominates in the secondary cell walls of higher plants (Atalla and VanderHart, 1984). The iC4 chemical shifts of Arabidopsis primary walls suggest that both Iα and Iβ allomorphs are present (Newman et al., 1996), with Iβ being slightly more abundant. More detailed structural information of the primary-wall cellulose will require more advanced experiments that resolve the 13C chemical shifts of surface cellulose and matrix polysaccha-rides and that relate 13C chemical shifts to direct conforma-tional parameters such as torsion angles and distances.
The number of glucan chains in cellulose microfibrils from quantitative 13C SSNMR spectra
The number of glucan chains in plant cellulose microfibrils has been estimated from the relative intensities of surface and interior cellulose C4 peaks in the SSNMR spectra (Newman et al., 1994, 1996; Kennedy et al., 2007). Since 13C spectra also contain matrix polysaccharide signals that partly overlap
Fig. 4. 2D 13C-13C PDSD spectrum of Arabidopsis cell walls with a 1.5 s mixing time. The spectrum was measured at −20 °C under 9 kHz MAS. (A) 2D spectrum. (B) Representative cellulose cross sections of interior and surface cellulose exhibit different intensity patterns. The difference spectra (purple) were obtained after normalizing the two spectra by the sC4 peak. The surface cellulose cross section has contribution from Ara and XyG backbone, but the difference spectra mainly show signals of interior cellulose. (C) C1 and C6 regions of the cellulose cross sections and the difference spectra. Core cellulose C1 shows two peaks at 105.5 ppm and 104.1 ppm, and core cellulose C6 (cC6) exhibits a 0.3 ppm downfield shift from the average interior cellulose C6 (iC6) and 0.6 ppm downfield shift from the surface-bound interior cellulose (bC6).
Table 2. Cellulose chemical shifts observed in 1D and 2D 13C SSNMR spectra here and in the literature by multidimensional correlation NMR
The chemical shifts of the core cellulose that are similar to those of the Iβ allomorph are underlined.
Organisms Form C1 (ppm) C2 (ppm) C3 (ppm) C4 (ppm) C5 (ppm) C6 (ppm) Sources
Arabidopsis Core 105.5/104.1 71.7 75.0 88.8 71.7 65.6 1.5 s PDSDBrachypodium Core 105.5/104.3 71.9 75.0 88.9 71.9 65.5 3.0 s PDSDCladophora Iα 105.0 71.6 74.7 90.0 70.1 65.2 Kono et al. (2003)
Kono et al. (2003)105.0 70.1 73.9 89.1 72.6 65.2Tunicate Iβ 106.1 71.3 74.9 88.0 70.6 65.6
104.0 71.0 74.2 88.9 72.2 65.0
at Pennsylvania State University on N
ovember 4, 2015
http://jxb.oxfordjournals.org/D
ownloaded from
Page 8 of 12 | Wang and Hong
with the surface cellulose peaks, Newman and coworkers used nuclear-spin relaxation to edit the 13C spectra: linear combinations of CP spectra with and without relaxation filters resulted in predominantly cellulose or predominantly matrix polysaccharide sub-spectra. The cellulose sub-spec-trum indicated a crystallinity of 0.37–0.44, which translates to a surface to interior chain number ratio (s:i) of 1.3–1.7. This range corresponds to an average number of 23 chains in the microfibril (Newman et al., 1994, 1996).
Two assumptions in this relaxation-filtered NMR approach are that surface cellulose has the same dynamic property as interior cellulose and that matrix polysaccharides are fully removed by the relaxation filters due to their fast dynamics. However, recent measurements of spin-diffusion-free 1H T1ρ relaxation times showed that in hydrated primary cell walls, the surface cellulose is more mobile than interior cellulose, while a non-negligible fraction of matrix polysaccharides is relatively rigid, presumably due to their contact with the
cellulose microfibril (Dick-Perez et al., 2011; Wang et al., 2012). Thus, the signals of the rigid fraction of matrix poly-saccharides may be difficult to suppress completely in the CP spectra. As a result, the relaxation-filtered 13C spectra may neither represent only the cellulose signals nor capture all cel-lulose intensities. In addition, 13C CP spectra are inherently non-quantitative unless specially designed pulse sequences are used (Johnson and Schmidt-Rohr, 2014), because the CP process is affected by motion and nuclear-spin relaxation, and generally favour the detection of rigid molecules while under-representing dynamic polysaccharides.
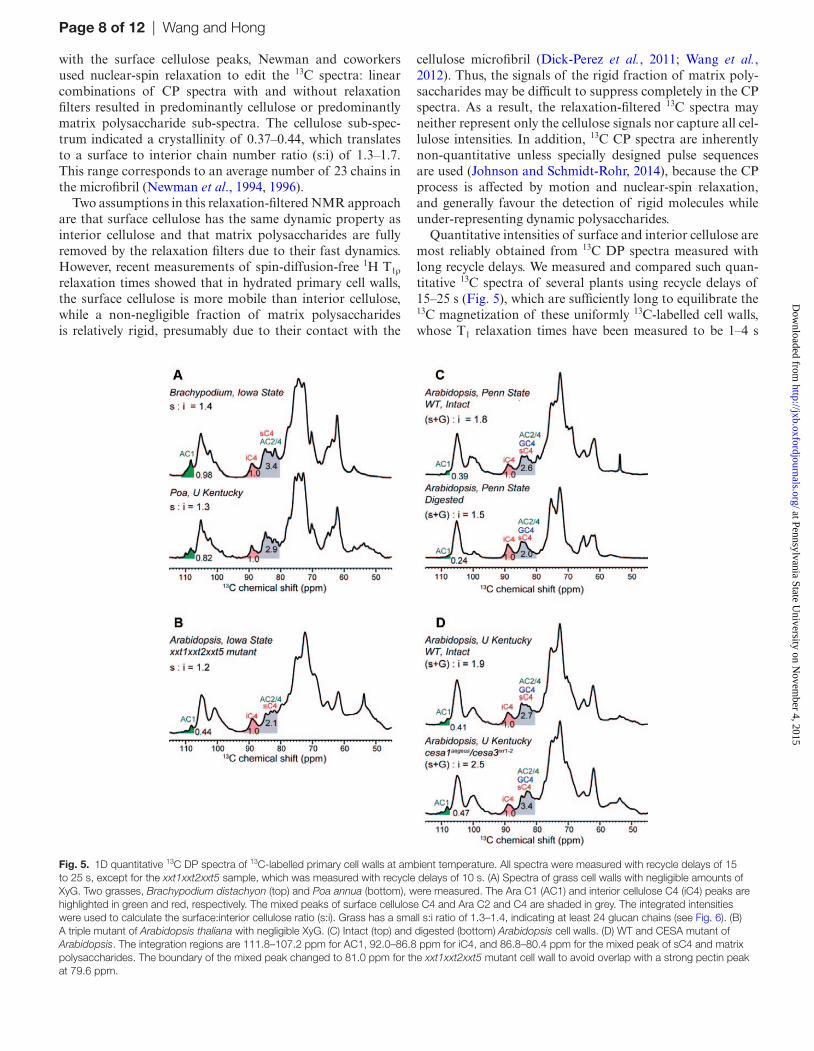
Quantitative intensities of surface and interior cellulose are most reliably obtained from 13C DP spectra measured with long recycle delays. We measured and compared such quan-titative 13C spectra of several plants using recycle delays of 15–25 s (Fig. 5), which are sufficiently long to equilibrate the 13C magnetization of these uniformly 13C-labelled cell walls, whose T1 relaxation times have been measured to be 1–4 s
Fig. 5. 1D quantitative 13C DP spectra of 13C-labelled primary cell walls at ambient temperature. All spectra were measured with recycle delays of 15 to 25 s, except for the xxt1xxt2xxt5 sample, which was measured with recycle delays of 10 s. (A) Spectra of grass cell walls with negligible amounts of XyG. Two grasses, Brachypodium distachyon (top) and Poa annua (bottom), were measured. The Ara C1 (AC1) and interior cellulose C4 (iC4) peaks are highlighted in green and red, respectively. The mixed peaks of surface cellulose C4 and Ara C2 and C4 are shaded in grey. The integrated intensities were used to calculate the surface:interior cellulose ratio (s:i). Grass has a small s:i ratio of 1.3–1.4, indicating at least 24 glucan chains (see Fig. 6). (B) A triple mutant of Arabidopsis thaliana with negligible XyG. (C) Intact (top) and digested (bottom) Arabidopsis cell walls. (D) WT and CESA mutant of Arabidopsis. The integration regions are 111.8–107.2 ppm for AC1, 92.0–86.8 ppm for iC4, and 86.8–80.4 ppm for the mixed peak of sC4 and matrix polysaccharides. The boundary of the mixed peak changed to 81.0 ppm for the xxt1xxt2xxt5 mutant cell wall to avoid overlap with a strong pectin peak at 79.6 ppm.
at Pennsylvania State University on N
ovember 4, 2015
http://jxb.oxfordjournals.org/D
ownloaded from

Structure and interactions of cell wall polymers | Page 9 of 12
(Dick-Perez et al., 2011; Wang et al., 2014). These 13C T1 values are much shorter than those of unlabelled cell walls because 13C spin diffusion in the labelled samples is much more efficient and equilibrates the short T1’s of dynamic func-tional groups with the long T1’s of rigid functional groups. In comparison, the majority of the plant cell wall SSNMR liter-ature involved unlabelled cell wall samples with much longer 13C T1 relaxation times, thus the quantitative 13C DP experi-ment was not conducted due to its prohibitively low sensitiv-ity, and most SSNMR analysis of the surface and interior glucan chain numbers relied on non-quantitative CP spectra.
In total, we examined the 13C DP spectra of two grass cell walls and five Arabidopsis cell walls. Most cell walls were never dried during preparation, except for the xxt1xxt2xxt3 mutant of Arabidopsis and samples prepared at the University of Kentucky, which were rehydrated samples (Table 3) (Dick-Perez et al., 2011; Harris et al., 2012; White et al., 2014). We use the 86.8–80.4 ppm range to represent the surface cellu-lose C4 and unresolved matrix polysaccharide 13C signals, the 92.0–86.8 ppm range to represent the interior cellulose C4 intensity, and the 111.8–107.2 ppm range to represent the Ara C1 intensity. The Brachypodium cell wall contains negli-gible amounts of XyG, thus the intensity analysis is straight-forward. We integrated the interior cellulose C4 (iC4) peak, the Ara C1 peak, and the mixed peak of surface cellulose C4 (sC4), Ara C2 and C4 (Fig. 5A). Since the resolved Ara C1 peak indicates the intensity of a single carbon in Ara, sub-traction of twice this intensity from the 86.8–80.4 ppm band yields the intensity of pure surface cellulose C4. In this way, we obtained an s:i ratio of 1.4 for Brachypodium cellulose. Similarly, an s:i ratio of 1.3 was found for the Poa annua cellu-lose (Brabham et al., 2014). Spectral deconvolution based on the chemical shifts resolved in 2D 13C-13C correlation spectra yielded very similar s:i ratios with an experimental uncer-tainty of ±0.1.
For WT Arabidopsis, the surface cellulose intensities require more care to quantify because of the significant amount of XyG in the wall. We first examined the spectrum of the XyG-depleted xxt1xxt2xxt5 mutant. The s:i ratio was found to be 1.2, in good agreement with the ratios of the grass cell walls. For WT Arabidopsis walls, the XyG back-bone glucose C4 and the surface cellulose C4 signals are unre-solved, thus we report the (s+G):i ratio. Intact walls prepared at Penn State University and the University of Kentucky gave (s+G):i ratios of 1.8–1.9 (Fig. 5C, D). When the major-ity of matrix polysaccharides were digested by sequential treatments with CDTA, Na2CO3, XEG, Cel12A, and 1 M NaOH (White et al., 2014), the intensity ratio decreased to 1.5. Since residual matrix polysaccharides are still present in this digested sample, this value is an upper bound to the s:i ratios in intact WT Arabidopsis walls. Taken together, the s:i ratios of both grass and dicot primary walls (Table 3) span a range of 1.2–1.5, with an estimated error bar of ±0.1. For the reverse-engineered Arabidopsis mutant cesa1aegeus/cesa3ixr1–2, a much larger (s+G):i value of 2.5 was found. This was attrib-uted to the significantly higher percentages of matrix poly-saccharides in this mutant plant in response to the reduced crystallinity of cellulose (Harris et al., 2012).
In modelling the number of glucan chains in the microfibril based on these quantitative s:i ratios, we assume that the num-ber of glucan chains in adjacent planes varies by one and the chain numbers are symmetric with respect to the centre of the microfibril (Fig. 6). Smaller microfibrils have larger s:i ratios (Supplementary Fig. S1, available at JXB online) but models with different numbers of chains sometimes have similar s:i ratios due to different packing geometries (Supplementary Fig. S2, available at JXB online). For s:i ratios of 1.2–1.5, we found chain numbers of 36–24. If we use an s:i ratio of 1.3 as the average value for primary-wall cellulose, then the average number of glucan chains is 28. If we impose the con-straint that the chain number is an integer multiple of 6 due to the hexameric structure of cellulose synthase (Herth, 1983; Endler and Persson, 2011), then the most likely chain num-bers are 24 and 30. However, irregular microfibril cross sec-tions with other chain numbers should be considered possible at this point. In comparison, small microfibril models with 18 or fewer chains correspond to s:i ratios of >2.0, which devi-ates from the measured data well beyond the experimental uncertainty, and thus can be excluded. Fig. 6B also shows that small microfibrils with 18 chains or fewer do not have a core domain, instead all interior chains contact the surface chains, which is inconsistent with the long mixing time 2D spectra shown in Figs 3 and 4. Thus, both the quantitative 13C spectra and the 2D PDSD spectra indicate that the cellulose microfibrils in plant primary walls must be sufficiently large to contain at least 24 chains.
TEM, atomic force microscopy, X-ray scattering, and SSNMR data of plant primary walls generally indicate that the lateral dimension of the cellulose microfibrils is 2–5 nm (Guerriero et al., 2010). In terms of the number of glucan chains, the earliest proposal of 36 chains based on the hypoth-esized number of cellulose synthase subunits in the rosette structure is now widely considered an over-estimate. Instead, recent proposals have shifted to the other extreme of very small microfibrils containing only 18 chains. The most influ-ential study was based on a joint analysis of wide-angle X-ray scattering (WAXS) and SSNMR data of mung bean cell walls (Newman et al., 2013), in which the WAXS data was decon-voluted using computer-simulated diffractograms of various cellulose models containing 18, 24, or 36 chains with differ-ent disorder. These models were simultaneously constrained by the NMR-derived crystallinity factor, X, which is directly related to the s:i ratio. The joint analysis suggested that a mix-ture of 18-chain microfibrils with irregular shapes and twin-ning best reproduced the WAXS and SSNMR data. It is of interest to assess the uncertainties in this analysis. First, the cross section shape factor, K, used in calculating the number of (200) planes in the microfibril is assumed to be 0.9 but can vary from 0.84 to 1.0. Using a higher K would increase the number of (200) planes and hence the number of chains. Second, the SSNMR constraint of X=0.37 corresponds to a large s:i ratio of 1.8, which is inconsistent with the quantita-tive s:i ratios found here. This large X most likely results from incomplete subtraction of the matrix polysaccharide intensi-ties from the 87–80 ppm band. If s:i ratios of 1.2–1.5 were used (X: 0.45–0.40), and the K value is allowed to vary from
at Pennsylvania State University on N
ovember 4, 2015
http://jxb.oxfordjournals.org/D
ownloaded from

Page 10 of 12 | Wang and Hong
0.9 to 1.0, then the number of chains increases to 20–25, in good agreement with the current analysis. Indeed, the 2013 study pointed out that both the WAXS and SSNMR data can be fit with a 24-chain model if twinning is absent. The 18-chain model fits the s:i ratio of 1.8 only if at least 40% of the cellulose microfibrils twinned and all the chains on the twinning interface are converted to highly crystalline struc-tures so that their C4 and C6 signals would resonate at 89 and 65 ppm. This crystallization process would require the establishment of many hydrogen bonds and likely conforma-tional changes of the hydroxymethyl group. To our knowl-edge, these two requirements—a high degree of twinning in primary walls and the crystallization of surface chains upon twinning—have not been observed experimentally, thus cau-tioning against the interpretation of the 18-chain model.
The quantitative s:i ratios obtained from these SSNMR spectra place important constraints on the cellulose structural model. Our findings that some interior chains are more than one chain away from the nearest surface chains, together with the reduced s:i ratios of 1.2–1.5, both indicate that cellulose
microfibrils in both dicot and grass primary walls should have sufficiently large dimensions to contain at least 24 chains.
Conclusions
Multidimensional 13C SSNMR of 13C-labelled plants is a powerful and versatile tool to elucidate the spatial proximities and structures of polysaccharides and proteins in near-native plant cell walls. Intermolecular cross peaks indicate that the primary wall of higher plants consists of a single cohesive network of polysaccharides, in which cellulose interacts with both hemicellulose and pectins on the nanometre scale. 2D 13C-13C correlation spectra and 1D quantitative 13C NMR spectra of dicot and grass primary walls indicate that cellu-lose microfibrils contain at least 24 glucan chains. This size is sufficiently large for some of the interior chains to avoid direct contact with the surface chains, thus explaining the lack of intensity equilibration between the interior and sur-face cellulose 13C signals at long spin diffusion mixing times. Future development of high-resolution SSNMR techniques
Fig. 6. Number of glucan chains in cellulose microfibrils as a function of the s:i ratio. The minimum number of glucan chains for s:i values of 1.1, 1.2, 1.3, 1.4, and 1.5 are 30, 29, 28, 24, and 30, respectively (filled circles). (B) Representative cellulose microfibril cross sections with different s:i ratios. For each model, glucan chains from core cellulose (magenta), surface-bound cellulose (red), and surface cellulose (orange) are depicted. Structural models with 18 or fewer chains correspond to s:i ratios of 2.0 or higher and lack core cellulose, which are inconsistent with the experimental data.
Table 3. Surface to interior cellulose number ratios of various primary cell walls from 13C quantitative DP spectra and short-CP spectra
Sample Preparation Experiment Peaks Ratio
Brachypodium Iowa state, never-dried Quantitative DP s:i 1.4Short CP s:i 1.2
Poa annua U Kentucky, rehydrated Quantitative DP s:i 1.3Arabidopsis, xxt1xxt2xxt5 Iowa state, rehydrated Quantitative DP s i 1.2Arabidopsis, WT, intact Penn state, never-dried Quantitative DP (s+G):i 1.8
Short CP (s+G):i 1.5Arabidopsis, digested wall Penn state, never-dried Quantitative DP (s+G):i 1.5Arabidopsis, WT intact U Kentucky, rehydrated Quantitative DP (s+G):i 1.9Arabidopsis, cesa1aegeus/cesa3ixr1-2 U Kentucky, rehydrated Quantitative DP (s+G):i 2.5
at Pennsylvania State University on N
ovember 4, 2015
http://jxb.oxfordjournals.org/D
ownloaded from

Structure and interactions of cell wall polymers | Page 11 of 12
and the synergistic use of multiple techniques should lead to higher resolution structure of the cellulose microfibrils and their assemblies.
Supplementary data
Supplementary data are available at JXB online.Fig. S1. Relationship of the chain number and s:i ratio of
cellulose microfibrils.Fig. S2. Cellulose microfibril models with various chain
numbers and s:i ratios.
AcknowledgementsThis work is supported by the Center for Lignocellulose Structure and Formation, an Energy Frontier Research Center funded by the US Department of Energy, Office of Science, Basic Energy Sciences under Award # DE-SC0001090. We thank Dr Paul White, Dr Yu Yang, and Jonathan Williams for helpful discussions.
ReferencesAtalla RH, VanderHart DL. 1984. Native cellulose: a composite of two distinct crystalline forms. Science 223, 283–285.
Atalla RH, VanderHart DL. 1999. The role of solid state 13C NMR spectroscopy in studies of the nature of native celluloses. Solid State Nuclear Magnetic Resonance 15, 1–19.
Bardet M, Emsley L, Vincendon M. 1997. Two-dimensional spin-exchange solid-state NMR studies of 13 C-enriched wood. Solid State Nuclear Magnetic Resonance 8, 25–32.
Bax A, Freeman R, Kempsell SP. 1980. Natural abundance 13C-13C coupling observed via double-quantum coherence. Journal of the Amercian Chemical Society 102, 4849–4851.
Bootten TJ, Harris PJ, Melton LD, Newman RH. 2004. Solid-state 13C-NMR spectroscopy shows that the xyloglucans in the primary cell walls of mung bean (Vigna radiata L.) occur in different domains: a new model for xyloglucan-cellulose interactions in the cell wall. Journal of Experimental Botany 55, 571–583.
Brabham C, Lei L, Gu Y, Stork J, Barrett M, DeBolt S. 2014. Indaziflam herbicidal action: a potent cellulose biosynthesis inhibitor. Plant Physiology 166, 1177–1185.
Caffall KH, Mohnen D. 2009. The structure, function, and biosynthesis of plant cell wall pectic polysaccharides. Carbohydrate Research 344, 1879–1900.
Carpita NC. 1983. Hemicellulosic polymers of cell walls of Zea coleoptiles. Plant Physiology 72, 515–521.
Carpita NC, Gibeaut DM. 1993. Structural models of primary cell walls in flowering plants: consistency of molecular structure with the physical properties of the walls during growth. Plant Journal 3, 1–30.
Carpita NC. 1996. Structure and biogenesis of the cell walls of grasses. Annual Review of Plant Physiology and Plant Molecular Biology 47, 445–476.
Cavalier DM, Lerouxel O, Neumetzler L,et al. 2008. Disrupting Two Arabidopsis thaliana Xylosyltransferase Genes Results in Plants Deficient in Xyloglucan, a Major Primary Cell Wall Component. Plant Cell 20, 1519–1537.
Cegelski L, O’Connor RD, Stueber D, Singh M, Poliks B, Schaefer J. 2010. Plant Cell-Wall Cross-Links by REDOR NMR Spectroscopy. Journal of the Amercian Chemical Society 132, 16052–16057.
Cosgrove DJ. 2001. Wall structure and wall loosening. A look backwards and forwards. Plant Physiology 125, 131–134.
Cosgrove DJ. 2005. Growth of the plant cell wall. Nature Reviews Molecular Cell Biology 6, 850–861.
Cosgrove DJ. 2014. Re-constructing our models of cellulose and primary cell wall assembly. Current Opinion in Plant Biology 22C, 122–131.
Dick-Perez M, Zhang YA, Hayes J, Salazar A, Zabotina OA, Hong M. 2011. Structure and interactions of plant cell wall polysaccharides by two- and three-dimensional magic-angle-spinning solid-state NMR. Biochemistry 50, 989–1000.
Dick-Perez M, Wang T, Salazar A, Zabotina OA, Hong M. 2012. Multidimensional solid-state NMR studies of the structure and dynamics of pectic polysaccharides in uniformly 13C-labeled Arabidopsis primary cell walls. Magnetic Resonance in Chemistry 50, 539–550.
Dupree R, Simmons TJ, Mortimer JC, Patel D, Iuga D, Brown SP, Dupree P. 2015. Probing the Molecular Architecture of Arabidopsis thaliana Secondary Cell Walls Using Two- and Three-Dimensional 13C Solid State Nuclear Magnetic Resonance Spectroscopy. Biochemistry 54, 2335–2345.
Earl WL, VanderHart DL. 1981. Observations by High-Resolution Carbon- 13 Nuclear Magnetic Resonance of Cellulose I Related to Morphology and Crystal Structure. Macromolecules 14, 570–574.
Endler A, Persson S. 2011. Cellulose Synthases and Synthesis in Arabidopsis. Mol. Plant 4, 199–211.
Fernandes AN, Thomas LH, Altaner CM, Callow P, Forsyth VT, Apperley DC, Kennedy CJ, Jarvis MC. 2011. Nanostructure of cellulose microfibrils in spruce wood. Proceedings of the National Academy of Sciences of the United States of America 108, E1195–E1203.
Fry SC. 1989. The structure and functions of xyloglucan. Journal of Experimental Botany 40, 1–11.
Guerriero G, Fugelstad J, Bulone V. 2010. What do we really know about cellulose biosynthesis in higher plants? Journal of Integrative Plant Biology 52, 161–175.
Harris DM, Corbin K, Wang T, et al. 2012. Cellulose microfibril crystallinity is reduced by mutating C-terminal transmembrane region residues CESA1A903V and CESA3T942I of cellulose synthase. Proceedings of the National Academy of Sciences of the United States of America 109, 4098–4103.
Hediger S, Emsley L, Fischer M. 1999. Solid-state NMR characterization of hydration effects on polymer mobility in onion cell-wall material. Carbohydrate Research 322, 102–112.
Hediger S, Lesage A, Emsley L. 2002. A new NMR method for the study of local mobility in solids and application to hydration of biopolymers in plant cell walls. Macromolecules 35, 5078–5084.
Herth W. 1983. Arrays of plasma-membrane “rosettes” involved in cellulose microfibril formation of Spirogyra. Planta 159, 347–356.
Hill JLJ, Hammudi MB, Tien M. 2014. The Arabidopsis cellulose synthase complex: a proposed hexamer of CESA trimers in an equimolar stoichiometry. Plant Cell 26, 4834–4842.
Hohwy M, Rienstra CM, Jaroniec CP, Griffin RG. 1999. Fivefold symmetric homonuclear dipolar recoupling in rotating solids: Application to double quantum spectroscopy. Journal of Chemical Physics 110, 7983–7992.
Horii F, Hirai A, Kitamaru R. 1987. CP/MAS C-13 NMR spectra of the crystalline components of native celluloses. Macromolecules 20, 2117–2120.
Jarvis M. 2003. Chemistry: cellulose stacks up. Nature 426, 611–612.
Jarvis MC. 1992. Self-assembly of plant cell walls. Plant Cell and Environment 15, 1–5.
Johnson RL, Schmidt-Rohr K. 2014. Quantitative solid-state 13C NMR with signal enhancement by multiple cross polarization. Journal of Magnetic Resonance 239, 44–49.
Kennedy CJ, Cameron GJ, Sturcova A, Apperley DC, Altaner C, Wess TJ, Jarvis MC. 2007. Microfibril diameter in celery collenchyma cellulose: X-ray scattering and NMR evidence. Cellulose 14, 235–246.
Kiemle SN, Zhang X, Esker AR, Toriz G, Gatenholm P, Cosgrove DJ. 2014. Role of (1,3)(1,4)-β-glucan in cell walls: interaction with cellulose. Biomacromolecules 15, 1727–1736.
Komatsu T, Kikuchi J. 2013. Selective Signal Detection in Solid-State NMR Using Rotor-Synchronized Dipolar Dephasing for the Analysis of Hemicellulose in Lignocellulosic Biomass. Journal of Physical Chemistry Letters 4, 2279–2283.
Kono H, Erata T, Takai M. 2003. Determination of the through-bond carbon-carbon and carbon-proton connectivities of the native celluloses in the solid state. Macromolecules 36, 5131–5138.
at Pennsylvania State University on N
ovember 4, 2015
http://jxb.oxfordjournals.org/D
ownloaded from

Page 12 of 12 | Wang and Hong
Kono H, Numata Y. 2006. Structural investigation of cellulose Iα and Iβ by 2D RFDR NMR spectroscopy: determination of sequence of magnetically inequivalent D-glucose units along cellulose chain. Cellulose 13, 317–326.
Larsson PT, Hult EL, Wickholm K, Pettersson E, Iversen T. 1999. CP/MAS 13C NMR spectroscopy applied to structure and interaction studies on cellulose I. Solid State Nuclear Magnetic Resonance 15, 31–40.
Lesage A, Auger C, Caldarelli S, Emsley L. 1997. Determination of through-bond carbon-carbon connectivities in solid-state NMR using the INADEQUATE experiment. Journal of the Amercian Chemical Society 119, 7867–7868.
Li S, Zhang Y, Hong M. 2010. 3D 13C-13C-13C correlation NMR for de novo distance determination of solid proteins and application to a human alpha-defensin. Journal of Magnetic Resonance 202, 203–210.
Matthews JF, Skopec CE, Mason PE, Zuccato P, Torget RW, Sugiyama J, Himmel ME, Brady JW. 2006. Computer simulation studies of microcrystalline cellulose Iβ. Carbohydrate Research 341, 138–152.
Mccann MC, Wells B, Roberts K. 1990. Direct visualization of cross-links in the primary plant cell wall. Journal of Cell Science 96, 323–334.
Mccann MC, Roberts K, Wilson RH, Gidley MJ, Gibeaut DM, Kim JB, Carpita NC. 1995. Old and new ways to probe plant cell wall architecture. Canadian Journal of Botany 73, S103–S113.
Newman RH, Ha MA, Melton LD. 1994. Solid-state 13C NMR investigation of molecular ordering in the cellulose of apple cell walls. Journal of Agricultural and Food Chemistry 42, 1402–1406.
Newman RH, Davies LM, Harris PJ. 1996. Solid-state 13C nuclear magnetic resonance characterization of cellulose in the cell walls of Arabidopsis thaliana leaves. Plant Physiology 111, 475–485
Newman RH, Hill SJ, Harris PJ. 2013. Wide-angle x-ray scattering and solid-state nuclear magnetic resonance data combined to test models for cellulose microfibrils in mung bean cell walls. Plant Physiology 163, 1558–1567.
Nishiyama Y, Langan P, Chanzy H. 2002. Crystal structure and hydrogen-bonding system in cellulose Iβ from synchrotron X-ray and neutron fiber diffraction. Journal of the Amercian Chemical Society 124, 9074–9082.
Nishiyama Y, Kim UJ, Kim DY, Katsumata KS, May RP, Langan P. 2003a. Periodic disorder along ramie cellulose microfibrils. Biomacromolecules 4, 1013–1017.
Nishiyama Y, Sugiyama J, Chanzy H, Langan P. 2003b. Crystal structure and hydrogen bonding system in cellulose Iα, from synchrotron X-ray and neutron fiber diffraction. Journal of the Amercian Chemical Society 125, 14300–14306.
Park YB, Cosgrove DJ. 2012a. Changes in cell wall biomechanical properties in the xyloglucan-deficient xxt1/xxt2 mutant of arabidopsis. Plant Physiology 158, 465–475.
Park YB, Cosgrove DJ. 2012b. A revised architecture of primary cell walls based on biomechanical changes induced by substrate-specific endoglucanases. Plant Physiology 158, 1933–1943.
Park YB, Cosgrove DJ. 2015. Xyloglucan and its interactions with other components of the growing cell wall. Plant and Cell Physiology. 56, 180–194.
Scheible WR, Eshed R, Richmond T, Delmer DP, Somerville C. 2001. Modifications of cellulose synthase confer resistance to isoxaben and thiazolidinone herbicides in Arabidopsis Ixr1 mutants. Proceedings
of the National Academy of Sciences of the United States of America 98, 10079–10084.
Sethaphong L, Haigler CH, Kubicki JD, Zimmer J, Bonetta D, DeBolt S, Yingling YG. 2013. Tertiary model of a plant cellulose synthase. Proceedings of the National Academy of Sciences of the United States of America 110, 7512–7517.
Takegoshi K, Nakamura S, Terao T. 2001. 13C-1H dipolar-assisted rotational resonance in magic-angle spinning NMR. Chemical. Physics Letters 344, 631–637.
Talbott LD, Ray PM. 1992. Molecular-size and separability features of Pea cell wall polysaccharides. Implications for models of primary wall structure. Plant Physiology 98, 357–368.
Taylor NG. 2008. Cellulose biosynthesis and deposition in higher plants. New Phytologist 178, 239–252.
Thomas LH, Forsyth VT, Sturcova A, Kennedy CJ, May RP, Altaner CM, Apperley DC, Wess TJ, Jarvis MC. 2013. Structure of cellulose microfibrils in primary cell walls from Collenchyma. Plant Physiology 161, 465–476.
Vietor RJ, Newman RH, Ha MA, Apperley DC, Jarvis MC. 2002. Conformational features of crystal-surface cellulose from higher plants. Plant Journal 30, 721–731.
Vogel J. 2008. Unique aspects of the grass cell wall. Current Opinion in Plant Biology 11, 301–307.
Wang T, Zabotina O, Hong M. 2012. Pectin-cellulose interactions in the Arabidopsis primary cell wall from two-dimensional magic-angle-spinning solid-state nuclear magnetic resonance. Biochemistry 51, 9846–9856.
Wang T, Park YB, Caporini MA, Rosay M, Zhong LH, Cosgrove DJ, Hong M. 2013. Sensitivity-enhanced solid-state NMR detection of expansin’s target in plant cell walls. Proceedings of the National Academy of Sciences of the United States of America 110, 16444–16449.
Wang T, Salazar A, Zabotina OA, Hong M. 2014. Structure and dynamics of Brachypodium primary cell wall polysaccharides from two-dimensional 13C solid-state nuclear magnetic resonance spectroscopy. Biochemistry 53, 2840–2854.
Wang T, Park YB, Cosgrove DJ, Hong M. 2015a. Cellulose-Pectin Spatial Contacts Are Inherent to Never-Dried Arabidopsis thaliana Primary Cell Walls: Evidence from Solid-State NMR. Plant Physiology 168, 871–884.
Wang T, Williams JK, Schmidt-Rohr K, Hong M. 2015b. Relaxation-compensated difference spin diffusion NMR for detecting 13C-13C long-range correlations in proteins and polysaccharides. Journal of Biomolecular NMR 61, 97–107.
White PB, Wang T, Park YB, Cosgrove DJ, Hong M. 2014. Water-polysaccharide interactions in the primary cell wall of Arabidopsis thaliana from polarization transfer solid-state NMR. Journal of the Amercian Chemical Society 136, 10399–10409.
Woodward JR, Phillips DR, Fincher GB. 1988. Water-soluble (1->3,1->4)-β-D-glucans from Barley (Hordeum-Vulgare) Endosperm.IV. Comparison of 40°C and 65°C Soluble Fractions. Carbohydrate Polymer 8, 85–97.
Zykwinska A, Thibault JF, Ralet MC. 2007. Organization of pectic arabinan and galactan side chains in association with cellulose microfibrils in primary cell walls and related models envisaged. Journal of Experimental Botany 58, 1795–1802.
at Pennsylvania State University on N
ovember 4, 2015
http://jxb.oxfordjournals.org/D
ownloaded from