Embed Size (px)
Citation preview

Solid State Storage (SSS) Performance Test Specification (PTS)
Client
Version 1.1
This document has been released and approved by the SNIA. The SNIA believes that the ideas, methodologies and technologies described in this document accurately represent the SNIA goals and are appropriate for widespread distribution. Suggestion for revision should be directed to http://www.snia.org/feedback/.
SNIA Technical Position
May 18, 2012
Copyright © 2012 SNIA. All rights reserved. All other trademarks or registered trademarks are the property of their respective owners.
SSS PTS Client Version 1.1 SNIA Technical Position 2
Revision History Revision Release
Date Originator Comments
V0.97 11JAN11 Dave Landsman
• Inserted Client test definitions previously approved by TWG in SSS PTS V0.9 into Enterprise PTS V1.0.
• Changed appropriate references from Enterprise to Client
V1.0 rev A 04APR11 Eden Kim • F2F Group Edits on active range changes and definitions • Easen Ho active range changes IOPS, TP, LAT • Eden Kim addition of Preamble section 1.1
V1.0 rev B 11APR11 Eden Kim • TWG Group Edits – agreement on changes • Chuck Paridon – ActiveRange definition
V1.1 rev a 21NOV11 Eden Kim • Integration of SEP11 F2F Comments & Changes • General update to PTS v 1.1 • Addition of Descriptive Notes for each Test
V 1.1 rev b2 28DEC11 Eden Kim
• Updated Normative Annex A PTS Sample Report Format • Updated reference to KiB Base 2 • Test Example Plots replaced with Annex Normative plots • Added Section 10: WSAT Optional Test • Harmonized PTS-C 1.1 with PTS-E 1.1
V 1.1rev c 25JAN12 Eden Kim TWG F2F
• Line edit by TWG during Jan F2F • Update pseudo code • Update language • Update Charts • Update Annex A Sample Report Headers • Update List of Plots • Update List of Figures
V 1.1 rev d 06FEB12 Eden Kim • TWG Concall line edit review

SSS PTS Client Version 1.1 SNIA Technical Position 3
Contributors The SNIA SSS Technical Work Group, which developed and reviewed this standard, would like to recognize the contributions made by the following members: Company Contributor AmerNet, Inc. Khaled Amer Calypso Eden Kim Calypso Easen Ho Calypso Mike Peeler Coughlin Assoc Tom Coughlin Dell Gary Kotzur EMC Don Deel Fusion-IO Jonathon Thatcher Hitachi Data Systems Mel Boksenbaum Hitachi Global Storage Technologies Dan Colegrove Hewlett-Packard Chuck Paridon hyperI/O Tom West IBM Phil Mills Intel Brady Foster Intel Terry Yoshii Intel Harry Pon LSI Harry Mason Marvell Semiconductor Paul Wassenberg Micron Technology Doug Rollins Objective Analysis Jim Handy Pliant Mike Chenery PMC-Sierra Martin Harris Samsung Steven Peng SandForce Jeremy Werner SanDisk Dave Landsman SanDisk Spencer Ng Seagate Marty Czekalski Seagate Alvin Cox Smart Modular Esther Spanjer SNIA Arnold Jones Toshiba TAIS Sumit Puri Western Digital Gary Drossel
SSS PTS Client Version 1.1 SNIA Technical Position 4
Usage The SNIA hereby grants permission for individuals to use this document for personal use only, and for corporations and other business entities to use this document for internal use only (including internal copying, distribution, and display) provided that:
1. Any text, diagram, chart, table or definition reproduced shall be reproduced in its entirety with no alteration.
2. Any document, printed or electronic, in which material from this document (or any
portion hereof) is reproduced shall acknowledge the SNIA copyright on that material, and shall credit the SNIA for granting permission for its reuse.
Other than as explicitly provided above, you may not make any commercial use of this document, sell any or this entire document, or distribute this document to third parties. All rights not explicitly granted are expressly reserved to SNIA. Permission to use this document for purposes other than those enumerated above may be requested by e-mailing [email protected]. Please include the identity of the requesting individual and/or company and a brief description of the purpose, nature, and scope of the requested use.
Disclaimer The information contained in this publication is subject to change without notice. The SNIA makes no warranty of any kind with regard to this specification, including, but not limited to, the implied warranties of merchantability and fitness for a particular purpose. The SNIA shall not be liable for errors contained herein or for incidental or consequential damages in connection with the furnishing, performance, or use of this specification.
Contacting SNIA SNIA Web Site Current SNIA practice is to make updates and other information available through their web site at http://www.snia.org SNIA Address Requests for interpretation, suggestions for improvement and addenda, or defect reports are welcome. They should be sent via the SNIA Feedback Portal at http://www.snia.org/feedback/ or by mail to the Storage Networking Industry Association, 425 Market Street, Suite 1020, San Francisco, CA 94105, U.S.A. Suggestions for revisions should be directed to http://www.snia.org/feedback/.
Intended Audience This document is intended for use by individuals and companies engaged in the development of this Specification and in validating the tests and procedures incorporated herein. After approvals and release to the public, this Specification is intended for use by individuals and companies engaged in the design, development, qualification, manufacture, test, acceptance and failure analysis of SSS devices and systems and sub systems incorporating SSS devices.
Changes to the Specification Each publication of this Specification is uniquely identified by a two-level identifier, comprised of a version number and a release number. Future publications of this specification are subject to specific constraints on the scope of change that is permissible from one publication to the next and the degree of interoperability and backward compatibility that should be assumed between products designed to different publications of this standard. The SNIA has defined three levels of change to a specification:
• Major Revision: A major revision of the specification represents a substantial change to the underlying scope or architecture of the specification. A major revision results in an increase in the version number of the version identifier (e.g., from version 1.x to version
SSS PTS Client Version 1.1 SNIA Technical Position 5
2.x). There is no assurance of interoperability or backward compatibility between releases with different version numbers.
• Minor Revision: A minor revision of the specification represents a technical change to
existing content or an adjustment to the scope of the specification. A minor revision results in an increase in the release number of the specification’s identifier (e.g., from x.1 to x.2). Minor revisions with the same version number preserve interoperability and backward compatibility.
SSS PTS Client Version 1.1 SNIA Technical Position 6
Table of Contents Revision History ........................................................................................................... 2 Contributors ................................................................................................................. 3 Usage ............................................................................................................................ 4
Disclaimer ............................................................................................................................................ 4 Contacting SNIA ................................................................................................................................ 4 Intended Audience ............................................................................................................................. 4 Changes to the Specification ........................................................................................................... 4
Table of Contents ........................................................................................................ 6 List of Figures ............................................................................................................... 8 List of Plots ................................................................................................................... 8 1 Introduction ........................................................................................................... 9
1.1 Preamble .................................................................................................................................... 9 1.2 Purpose ...................................................................................................................................... 9 1.3 Background ............................................................................................................................... 9 1.4 Scope ........................................................................................................................................ 10 1.5 Not in Scope .......................................................................................................................... 10 1.6 Disclaimer ............................................................................................................................... 11 1.7 Normative References ......................................................................................................... 11 1.7.1 Approved references ........................................................................................................ 11 1.7.2 References under development ...................................................................................... 11 1.7.3 Other references ............................................................................................................... 11
2 Definitions, symbols, abbreviations, and conventions ..................................... 12 2.1 Definitions ............................................................................................................................... 12 2.2 Acronyms and Abbreviations ............................................................................................. 13 2.3 Keywords ................................................................................................................................ 13 2.4 Conventions ........................................................................................................................... 14 2.4.1 Number Conventions ....................................................................................................... 14 2.4.2 Pseudo Code Conventions .............................................................................................. 14
3 Key Test Process Concepts ................................................................................ 16 3.1 Steady State ............................................................................................................................ 16 3.2 Purge ........................................................................................................................................ 16 3.3 Preconditioning ...................................................................................................................... 16 3.4 ActiveRange ............................................................................................................................ 17 3.5 ActiveRange Segmentation .................................................................................................. 17 3.6 Data Patterns ......................................................................................................................... 18 3.7 Multiple Thread Guideline ................................................................................................... 18 3.8 Caching .................................................................................................................................... 18
4 Overview of Common Test Flow ....................................................................... 19 5 Common Reporting Requirements ................................................................... 20
5.1 Test System Hardware ........................................................................................................ 20 5.2 Test System Software ........................................................................................................... 20 5.3 Device Under Test ............................................................................................................... 20
6 Test Tool Guidelines ........................................................................................... 21 7 IOPS Test ............................................................................................................. 22
7.1 IOPS Descriptive Note ........................................................................................................ 22 7.2 IOPS Pseudo Code ............................................................................................................... 22 7.3 Test Specific Reporting for IOPS Test ............................................................................. 24

SSS PTS Client Version 1.1 SNIA Technical Position 7
7.3.1 Purge Report ....................................................................................................................... 24 7.3.2 Preconditioning Report .................................................................................................... 24 7.3.3 Steady State Convergence Report ................................................................................. 25 7.3.4 Steady State Verification ................................................................................................... 25 7.3.5 Steady State Measurement Window ............................................................................. 26 7.3.6 Measurement Window Report ....................................................................................... 27
7.3.6.1 IOPS Measurement Window Tabular Data ................................................. 27 7.3.6.2 IOPS Measurement Plot – 2D ..................................................................... 28 7.3.6.3 IOPS Measurement Plot – 3D ..................................................................... 29
8 Throughput Test .................................................................................................. 30 8.1 Throughput Descriptive Note ........................................................................................... 30 8.2 Throughput Pseudo Code ................................................................................................... 30 8.3 Test Specific Reporting for Throughput Test ................................................................. 31 8.3.1 Purge Report ....................................................................................................................... 31 8.3.2 Preconditioning Report .................................................................................................... 31 8.3.3 Steady State Convergence Report Write .................................................................... 32 8.3.4 Steady State Convergence Report - Read .................................................................... 33 8.3.5 Steady State Verification Report .................................................................................... 33 8.3.6 Steady State Measurement Window ............................................................................. 34 8.3.7 Measurement Window Report ....................................................................................... 35
8.3.7.1 TP Measurement Window Tabular Data ..................................................... 35 8.3.7.2 TP Measurement Plot – 2D ......................................................................... 36
9 Latency Test ......................................................................................................... 37 9.1 Latency Descriptive Note ................................................................................................... 37 9.2 Latency Pseudo Code .......................................................................................................... 37 9.3 Test Specific Reporting for Latency Test ........................................................................ 39 9.3.1 Purge ..................................................................................................................................... 39 9.3.2 Preconditioning Report .................................................................................................... 39 9.3.3 Steady State Convergence Report ................................................................................. 39 9.3.4 Steady State Verification Report .................................................................................... 40 9.3.5 Steady State Measurement Window ............................................................................. 41 9.3.6 Measurement Window Report ....................................................................................... 42
9.3.6.1 LAT Measurement Window Tabular Data ................................................... 42 9.3.6.2 LAT Measurement Window Plots ................................................................ 43 9.3.6.3 Average Latency - 3D Plot .......................................................................... 43 9.3.6.4 Maximum Latency - 3D Plot ........................................................................ 44
10 Write Saturation Test - Optional .................................................................... 45 10.1 WSAT Descriptive Note .................................................................................................. 45 10.2 WSAT Pseudo Code .......................................................................................................... 45 10.3 Test Specific Reporting for Write Saturation Test ..................................................... 46 10.3.1 Purge Report .................................................................................................................... 46 10.3.2 Measurement Report ...................................................................................................... 46
10.3.2.1 WSAT IOPS v Time .................................................................................. 47 10.3.2.2 WSAT IOPS v TGBW ................................................................................ 48
11 Normative Annex A – Sample Test Report ................................................... 49 12 Informative Annex B – Performance Test Platform Example ..................... 76
12.1 RTP Configurations ............................................................................................................ 76 12.2 RTP Components ............................................................................................................... 76
SSS PTS Client Version 1.1 SNIA Technical Position 8
List of Figures Figure 1-1 – NAND-based SSS Performance States (RND 4KiB Writes) .................................. 10 Figure 3-1 – ActiveRange Diagram ............................................................................................ 17 Figure 3-2 – ActiveRange Segmentation Diagram ..................................................................... 18 Figure 4-1 – Basic Test Flow ...................................................................................................... 19
List of Plots Plot 7-1: IOPS SS Convergence Report ..................................................................................... 25 Plot 7-2: IOPS SS Measurement Window .................................................................................. 26 Plot 7-3: IOPS Measurement Window Tabular Data .................................................................. 28 Plot 7-4: IOPS Measurement Plot – 2D ...................................................................................... 28 Plot 7-5: IOPS Measurement Plot – 3D ...................................................................................... 29 Plot 8-1: TP SS Convergence Report WRITE ............................................................................ 32 Plot 8-2: TP SS Convergence Report READ .............................................................................. 33 Plot 8-3: TP SS Measurement Window ...................................................................................... 34 Plot 8-4: TP Measurement Window Tabular Data ...................................................................... 35 Plot 8-5: TP Measurement Plot – 2D .......................................................................................... 36 Plot 9-1: LAT SS Convergence Report ....................................................................................... 38 Plot 9-2: LAT SS Measurement Window .................................................................................... 41 Plot 9-3: LAT Measurement Window Tabular Data .................................................................... 42 Plot 9-4: AVE LAT – 3D Plot ....................................................................................................... 43 Plot 9-5: MAX LAT – 3D Plot ...................................................................................................... 44 Plot 10-1: WSAT IOPS v Time .................................................................................................... 47 Plot 10-2: WSAT IOPS v TGBW ................................................................................................. 48
SSS PTS Client Version 1.1 SNIA Technical Position 9
1 Introduction 1.1 Preamble This Client Performance Test Specification (PTS-C) 1.1 is a companion specification to the SNIA Solid State Storage Enterprise Performance Test Specification (PTS-E) 1.1. Both Performance Test Specifications (PTS) are intended to be used to obtain reliable and comparative measurement of NAND Flash based solid state storage devices. In both PTS in their present form, the tests and methodologies are designed to use a synthetic, or known and repeatable, test stimulus applied to a solid state storage product at the device level. In these PTS, "device level" refers to measurement of block IO at the physical device level as opposed to file system IO in the host Operating System. Both of these PTS are based on test and preparation methodologies developed by the SNIA SSS TWG for performance test of NAND based solid state storage. NAND Flash based solid state storage (SSS) performance tends to be highly dependent on the write history of the SSS device, the type of stimulus applied to the SSS device, as well as the test environment (both hardware and software) in which the test stimulus is applied and measurements taken. Much of the preconditioning, test condition set up and parameters take these SSS behaviors into consideration. These PTS do not require the use a specific test environment, but test tool requirements, capabilities and examples are set forth in the specifications. Care should be taken by the test operator to ensure that the test hardware does not bottleneck the SSS device performance, that the OS or test software tool has minimal contribution to test measurements, and that the same hardware and software test combination is used when comparing performance results of different SSS devices. This Client PTS-C 1.1 differs from its companion Enterprise PTS-E 1.1 in the preparation of the Device Under Test (DUT) for steady state performance measurement and in the amount and type of test stimulus applied to the DUT. For example, preconditioning LBA ranges may be limited in the Client PTS-C to less than 100% of the available LBAs while the test stimulus Active Range may be limited to a reduced number of uniquely touched LBAs (see Client PTS-C Specification Section 2 Definitions). The use of limited preconditioning and test active ranges are meant to provide a test stimulus that share more characteristics with a typical Client user workload. Readers and industry members are encouraged to participate in the further SNIA SSS TWG works and can contact the TWG at its website portal at http://www.snia.org/feedback/.
1.2 Purpose Manufacturers need to set, and customers need to compare, the performance of Solid State Storage (SSS) devices. This Specification defines a set of device level tests and methodologies intended to enable comparative testing of SSS devices in Client (see 2.1.6) systems.
Note: While the tests defined in this specification could be applied to SSS devices based on any technology (RAM, NAND, etc.), the emphasis in this specification, in particular regarding Preconditioning and Steady State, is oriented towards NAND.
1.3 Background A successful device level performance test isolates the device being tested from the underlying test platform (HW, OS, Tools, Applications) so the only limiting variable in the test environment is the device being tested. To achieve this goal with NAND-based SSS devices, in addition to typical system/device isolation issues, the test, and test methodologies, must address attributes unique to NAND-based flash media. NAND-based SSS device controllers map Logical Block Addresses (LBA) to Physical Block Addresses (PBA) on the NAND media in order to achieve the best NAND performance and endurance. The SSS device manages this LBA-to-PBA mapping with internal processes that operate independently of the host. The sum of this activity is referred to as “flash management”.
SSS PTS Client Version 1.1 SNIA Technical Position 10
The performance of the flash management during a test, and hence the overall performance of the SSS device during the test, depends critically on:
1) Write History and Preconditioning: The state of the device prior to the test 2) Workload Pattern: Pattern of the I/O (r/w mix, block size, etc.) written to device during test 3) Data Pattern: The actual bits in the data payload written to the device
The methodologies defined in the SSS Performance Test Specification (SSS PTS) attempt to create consistent conditions for items 1-3 so that the only variable is the device under test.
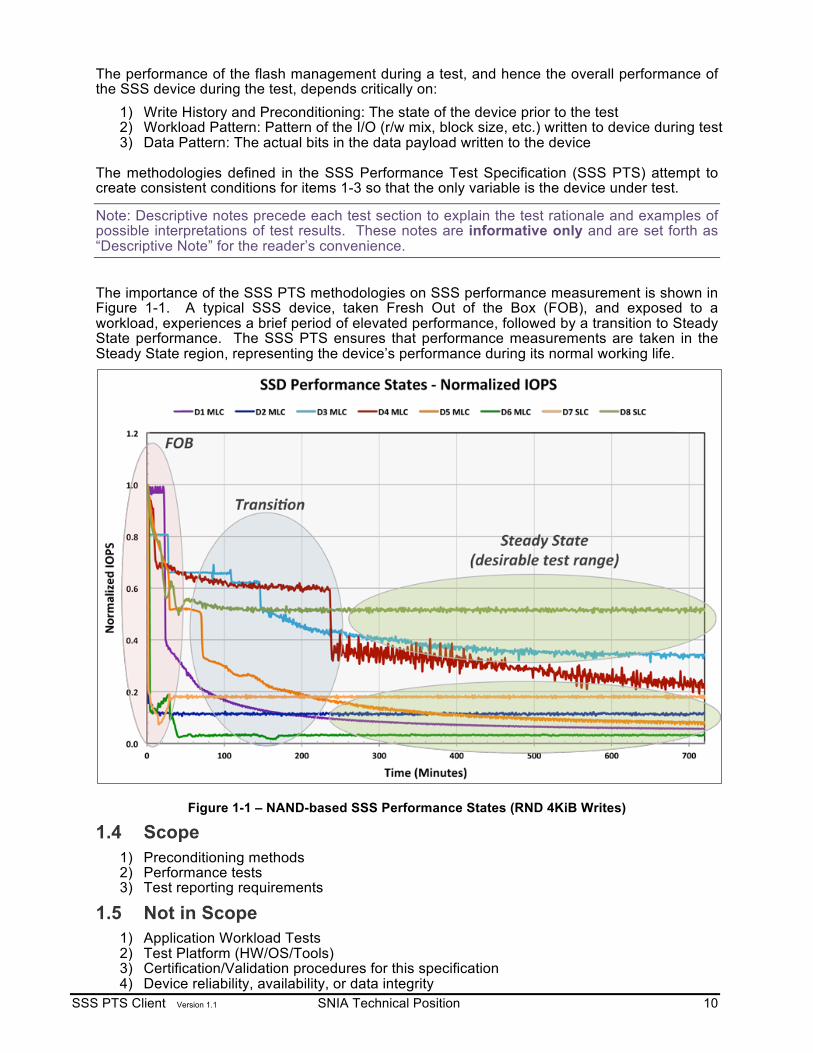
Note: Descriptive notes precede each test section to explain the test rationale and examples of possible interpretations of test results. These notes are informative only and are set forth as “Descriptive Note” for the reader’s convenience. The importance of the SSS PTS methodologies on SSS performance measurement is shown in Figure 1-1. A typical SSS device, taken Fresh Out of the Box (FOB), and exposed to a workload, experiences a brief period of elevated performance, followed by a transition to Steady State performance. The SSS PTS ensures that performance measurements are taken in the Steady State region, representing the device’s performance during its normal working life.
Figure 1-1 – NAND-based SSS Performance States (RND 4KiB Writes)
1.4 Scope 1) Preconditioning methods 2) Performance tests 3) Test reporting requirements
1.5 Not in Scope 1) Application Workload Tests 2) Test Platform (HW/OS/Tools) 3) Certification/Validation procedures for this specification 4) Device reliability, availability, or data integrity

SSS PTS Client Version 1.1 SNIA Technical Position 11
1.6 Disclaimer Use or recommended use of any public domain, third party or proprietary software does not imply nor infer SNIA or SSS TWG endorsement of the same. Reference to any such test or measurement software, stimulus tools, or software programs is strictly limited to the specific use and purpose as set forth in this Specification and does not imply any further endorsement or verification on the part of SNIA or the SSS TWG.
1.7 Normative References 1.7.1 Approved references These are the standards, specifications and other documents that have been finalized and are referenced in this specification.
• IDEMA Document LBA1-02 -- LBA Count for IDE Hard Disk Drives Standard • JEDEC JESD218 – Solid-State Drive (SSD) Requirements and Endurance Test Method • JEDEC JESD219 – Solid-State Drive (SSD) Endurance Workloads
1.7.2 References under development • ATA/ATAPI Command Set - 2 (ACS-2) – INCITS/T13 2015-D
1.7.3 Other references • TBD

SSS PTS Client Version 1.1 SNIA Technical Position 12
2 Definitions, symbols, abbreviations, and conventions 2.1 Definitions 2.1.1 ActiveRange: The range of LBA’s that can be used for a given Test Code or
Preconditioning Code (expressed as a percent of the total addressable LBAs as set forth in section 3.4)
2.1.2 ActiveRange Amount: The sum of the capacity referenced by the LBA’s that are accessed for a given Test or Preconditioning Code equal to, or less than the capacity referenced by the ActiveRange LBAs (such as 8GiB or 16GiB ActiveRange Amount set forth in Section 3.5).
2.1.3 ActiveRange Segments: A collection of contiguous and equal sized LBA ranges within the ActiveRange where the Test Code and Preconditioning Codes are allowed to access. The starting LBA of each ActiveRange Segment is randomly distributed across the entire ActiveRange. The set of ActiveRange segments spans the ActiveRange. Note that ActiveRange segments shall not touch to form a single segment.
2.1.4 ActiveRange Segment Size: The size of a single ActiveRange Segment is determined by taking the ActiveRange Amount and dividing by the number of ActiveRange Segments as prescribed in the Test Code or Preconditioning Code.
2.1.5 Cache: A volatile or non-volatile data storage area outside the User Capacity that may contain a subset of the data stored within the User Capacity.
2.1.6 Client: Single user desktop or laptop system used in home or office. 2.1.7 Enterprise: Servers in data centers, storage arrays, and enterprise wide / multiple user
environments that employ direct attached storage, storage attached networks and tiered storage architectures.
2.1.8 Fresh Out of the Box (FOB): State of SSS prior to being put into service. 2.1.9 IO Demand: Measured # of OIOs executing in the host. 2.1.10 Logical Block Address (LBA): The address of a logical block, i.e., the offset of the
block from the beginning of the logical device that contains it. 2.1.11 Latency: The time between when the workload generator makes an IO request and
when it receives notification of the request’s completion. 2.1.12 MaxUserLBA: The maximum LBA # addressable in the User Capacity. 2.1.13 Measurement Window: The interval, measured in Rounds, during which test data is
collected, bounded by the Round in which the device has been observed to have maintained Steady State for the specified number of Rounds (Round x), and five Rounds previous (Round x-4).
2.1.14 Nonvolatile Cache: A cache that retains data through power cycles. 2.1.15 Outstanding IO (OIO): The number of IO operations issued by a host, or hosts, awaiting
completion. 2.1.16 OIO/Thread: The number of OIO allowed per Thread (Worker, Process) 2.1.17 Over-Provisioned Capacity: LBA range provided by the manufacturer for performance
and endurance considerations, but not accessible by the host file system, operating system, applications, or user.
2.1.18 Preconditioning: The process of writing data to the device to prepare it for Steady State measurement consisting of two (2) Preconditioning steps as follows:
18.1. Workload Independent Preconditioning (WIPC): The first Preconditioning step comprised of a prescribed workload, unrelated to the test workload, as a means to facilitate convergence to Steady State.
18.2. Workload Dependent Preconditioning (WDPC): The second Preconditioning step comprised of running the test workload itself, after Workload Independent
SSS PTS Client Version 1.1 SNIA Technical Position 13
Preconditioning, as a means to put the device in a Steady State relative to the dependent variable being tested.
2.1.19 Preconditioning Code: Refers to the Preconditioning steps set forth in this Specification.
2.1.20 Purge: The process of returning an SSS device to a state in which subsequent writes execute, as closely as possible, as if the device had never been used and does not contain any valid data.
2.1.21 Round: A complete pass through all the prescribed test points for any given test. 2.1.22 Steady State: A device is said to be in Steady State when, for the dependent variable
(y) being tracked: a) Range(y) is less than 20% of Ave(y): Max(y)-Min(y) within the Measurement Window
is no more than 20% of the Ave(y) within the Measurement Window; and b) Slope(y) is less than 10%: Max(y)-Min(y), where Max(y) and Min(y) are the maximum
and minimum values on the best linear curve fit of the y-values within the Measurement Window, is within 10% of Ave(y) value within the Measurement Window.
2.1.23 Test Code: Refers to the measurement steps set forth in the test sections contained in this Specification.
2.1.24 Thread: Execution context defined by host OS/CPU (also: Process, Worker) 2.1.25 Thread Count (TC): Number of Threads (or Workers or Processes) specified by a test. 2.1.26 Transition Zone: A performance state where the device’s performance is changing as it
goes from one state to another (such as from FOB to Steady State). 2.1.27 Total OIO: Total outstanding IO Operations specified by a test = (OIO/Thread) * (TC) 2.1.28 User Capacity: LBA range directly accessible by the file system, operating system and
applications, not including Over-Provisioned Capacity. 2.1.29 WSAT Steady State: The state of performance during the WSAT test that follows the
Transition Zone when measurements of the dependent variable (RND 4KiB Writes) are relatively time invariant. WSAT Steady State is determined by test operator inspection and is different from the Steady State determination as defined in 2.1.22.
2.1.30 coincidence, to the test workload, as a means to facilitate convergence to Steady State. 2.1.31 Volatile Cache: A cache that does not retain data through power cycles.
2.2 Acronyms and Abbreviations 2.2.1 IOPS: I/O Operations per Second 2.2.2 DUT: Device Under Test 2.2.3 FOB: Fresh Out of Box 2.2.4 OIO: Outstanding IO 2.2.5 R/W: Read/Write 2.2.6 SSSI: Solid State Storage Initiative 2.2.7 SSS TWG: Solid State Storage Technical Working Group 2.2.8 TC: Thread Count 2.2.9 QD: Queue Depth
2.3 Keywords The key words “shall”, “required”, “shall not”, “should”, “recommended”, “should not”, “may”, and “optional” in this document are to be interpreted as:
SSS PTS Client Version 1.1 SNIA Technical Position 14
2.3.1 Shall: This word, or the term "required", means that the definition is an absolute requirement of the specification.
2.3.2 Shall Not: This phrase means that the definition is an absolute prohibition of the specification.
2.3.3 Should: This word, or the adjective "recommended", means that there may be valid reasons in particular circumstances to ignore a particular item, but the full implications must be understood and weighed before choosing a different course.
2.3.4 Should Not: This phrase, or the phrase "not recommended", means that there may exist valid reasons in particular circumstances when the particular behavior is acceptable or even useful, but the full implications should be understood and the case carefully weighed before implementing any behavior described with this label.
2.3.5 May: This word, or term “optional”, indicates flexibility, with no implied preference.
2.4 Conventions 2.4.1 Number Conventions Numbers that are not immediately followed by lower-case b or h are decimal values. Numbers immediately followed by lower-case b (xxb) are binary values. Numbers immediately followed by lower-case h (xxh) are hexadecimal values. Hexadecimal digits that are alphabetic characters are upper case (i.e., ABCDEF, not abcdef). Hexadecimal numbers may be separated into groups of four digits by spaces. If the number is not a multiple of four digits, the first group may have fewer than four digits (e.g., AB CDEF 1234 5678h). Storage capacities and data transfer rates and amounts shall be reported in Base-10. IO transfer sizes and offsets shall be reported in Base-2. The associated units and abbreviations used in this specification are:
• A kilobyte (KB) is equal to 1,000 (103) bytes. • A megabyte (MB) is equal to 1,000,000 (106) bytes. • A gigabyte (GB) is equal to 1,000,000,000 (109) bytes. • A terabyte (TB) is equal to 1,000,000,000,000 (1012) bytes. • A petabyte (PB) is equal to 1,000,000,000,000,000 (1015) bytes • A kibibyte (KiB) is equal to 210 bytes. • A mebibyte (MiB) is equal to 220 bytes. • A gibibyte (GiB) is equal to 230 bytes. • A tebibyte (TiB) is equal to 240 bytes. • A pebibyte (PiB) is equal to 250 bytes
2.4.2 Pseudo Code Conventions The specification uses an informal pseudo code to express the test loops. It is important to follow the precedence and ordering information implied by the syntax. In addition to nesting/indentation, the main syntactic construct used is the “For” statement. A “For” statement typically uses the syntax: For (variable = x, y, z). The interpretation of this construct is that the Test Operator sets the variable to x, then performs all actions specified in the indented section under the “For” statement, then sets the variable to y, and again performs the actions specified, and so on. Sometimes a “For” statement will have an explicit “End For” clause, but not always; in these cases, the end of the For statement’s scope is contextual. Take the following loop as an example:
For (R/W Mix % = 100/0, 95/5, 65/35, 50/50, 35/65, 5/95, 0/100) For (Block Size = 1024KiB, 128KiB, 64KiB, 32KiB, 16KiB, 8KiB, 4KiB, 0.5KiB)
- Execute random IO, per (R/W Mix %, Block Size), for 1 minute - Record Ave IOPS(R/W Mix%, Block Size)

SSS PTS Client Version 1.1 SNIA Technical Position 15
This loop is executed as follows: Ø Set R/W Mix% to 100/0 >>>>> Beginning of Loop 1 Ø Set Block Size to 1024KiB Ø Execute random IO… Ø Record Ave IOPS… Ø Set Block Size to 128KiB Ø Execute… Ø Record… Ø … Ø Set Block Size to 0.5KiB Ø Execute… Ø Record… >>>>> End of Loop 1 Ø Set R/W Mix% to 95/5 >>>>> Beginning of Round Loop 2 Ø Set Block Size to 1024 KiB Ø Execute… Ø Record… Ø …
SSS PTS Client Version 1.1 SNIA Technical Position 16
3 Key Test Process Concepts The performance of an SSS device is highly dependent on its prior usage, the pre-test state of the device and test parameters. This section describes key SSS test methodology concepts.
3.1 Steady State SSS devices that are Fresh Out of the Box (FOB), or in an equivalent state, typically exhibit a transient period of elevated performance, which evolves to a stable performance state relative to the workload being applied. This state is referred to as a Steady State (Definition 2.1.22). It is important that the test data be gathered during a time window when the device is in Steady State, for two primary reasons:
1) To ensure that a device’s initial performance (FOB or Purged) will not be reported as “typical”, since this is transient behavior and not a meaningful indicator of the drive’s performance during the bulk of its operating life.
2) To enable Test Operators and reviewers to observe and understand trends. For
example, oscillations around an average are “steady” in a sense, but might be a cause for concern.
Steady State may be verified:
• by inspection, after running a number of Rounds and examining the data; • programmatically, during execution; or • by any other method, as long as the attainment of Steady State, per Definition 2.1.22 is
demonstrated and documented.
Steady State as defined in Section 2.1.19 shall meet the Steady State Verification criteria as set forth in each test section except for the Optional Write Saturation (WSAT) test – see Definition 2.1.29). For WSAT, the test sponsor shall determine WSAT Steady State by inspection and shall be defined as the area following the Transition Zone (2.1.26) wherein the IOPS measurements remain relatively time invariant.
3.2 Purge The purpose of the Purge process (Definition 2.1.20) is to put the device in a consistent state prior to preconditioning and testing, and to facilitate a clear demonstration of Steady State convergence behavior. Purge shall be run prior to each preconditioning and testing cycle. If the device under test does not support any kind of Purge method, and the Test Operator chooses to run the PTS, the fact that Purge was not supported/run must be documented in the test report. The Test Operator may select any valid method of implementing the Purge process, including, but not limited to, the following:
a) ATA: SECURITY ERASE, SANITIZE DEVICE (BLOCK ERASE EXT) b) SCSI: FORMAT UNIT c) Vendor specific methods
The Test Operator shall report what method of Purge was used.
3.3 Preconditioning The goal of preconditioning is to facilitate convergence to Steady State during the test itself. The SSS PTS defines two (2) Preconditioning steps:
• Workload Independent Preconditioning (WIPC Definition 2.1.18.1); and • Workload Dependent Preconditioning (WDPC Definition 2.1.18.2)

SSS PTS Client Version 1.1 SNIA Technical Position 17
3.4 ActiveRange It is desirable to be able to test the performance characteristics of workloads which issue IO across a wide range of the LBA space vs. those which issue IO across only a narrow range. To enable this, the SSS Performance Specification defines ActiveRange. (Definition 2.1.1) The test scripts define required and optional settings for ActiveRange. The figures below show two examples of ActiveRange.
ActiveRange (0:100) ActiveRange (0:75)
Figure 3-1 – ActiveRange Diagram
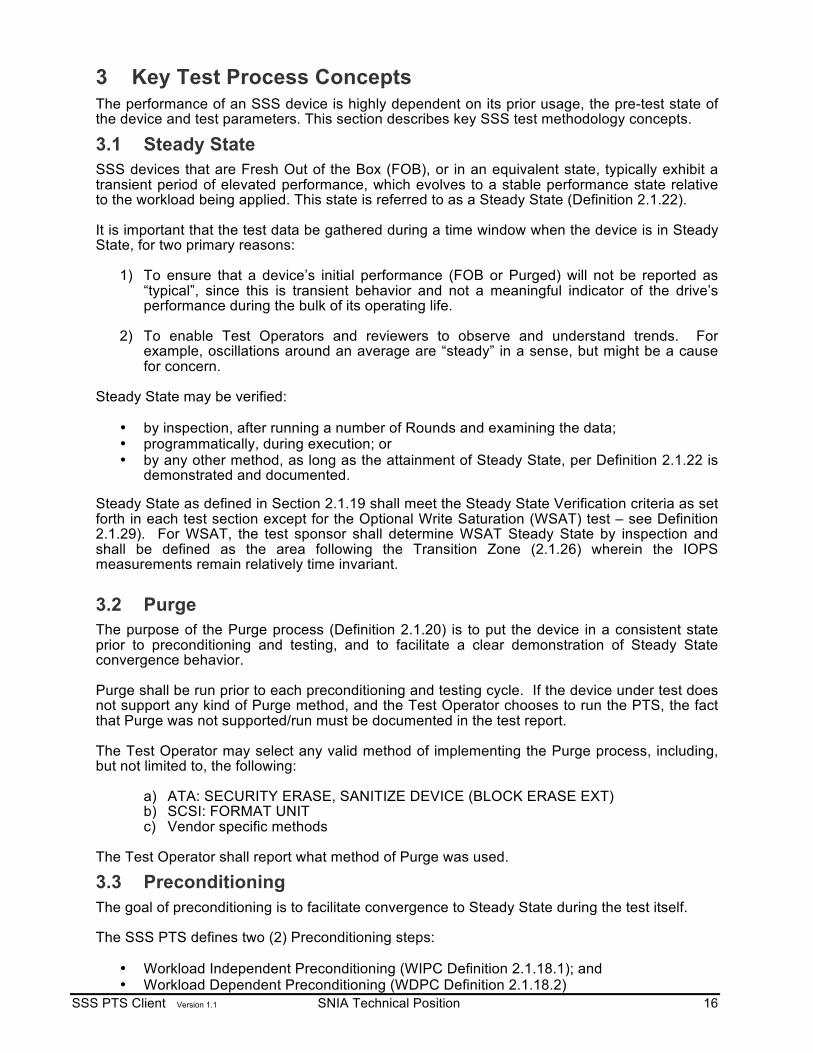
3.5 ActiveRange Segmentation The Limited ActiveRange as set forth in this specification shall be segmented into segments as defined and prescribed. The following illustration shows the alignment of Random Contiguous Segments.
SSS PTS Client Version 1.1 SNIA Technical Position 18
Figure 3-2 – ActiveRange Segmentation Diagram
3.6 Data Patterns All tests shall be run with a random data pattern. The Test Operator may execute additional runs with non-random data patterns. If non-random data patterns are used, the Test Operator must report the data pattern. Note: Some SSS devices look for and optimize certain data patterns in the data written to the device. It is not feasible to test for all possible kinds of optimizations, which are vendor specific and often market segment specific. The SSS TWG is still trying to characterize “how random is random enough” with respect to data patterns.
3.7 Multiple Thread Guideline If the Test Operator wishes to run a test using multiple Threads, it is recommended that OIO/Thread for all Threads be equal, so Total OIO is equal to (OIO/Thread) * (Thread Count). This will enable more direct comparisons. While the Test Operator may select a given OIO for a test, the Test Operator shall use the same Thread Count and OIO/Thread for all steps of a given test.
3.8 Caching All tests shall be run with all volatile write caches disabled. The cache state shall be reported for drives that cannot have write cache disabled. The test operator may optionally run tests with Write Caches enabled provided that the Cache Flush command is also enabled and that the method and frequency by which the flush buffer commands are issued are disclosed.
SSS PTS Client Version 1.1 SNIA Technical Position 19
4 Overview of Common Test Flow The Steady State tests in the SSS PTS (IOPS, Throughput and Latency) use the same general steps and flow, described below. Test-specific parameter settings, reports, and other requirements are documented in the test sections themselves.
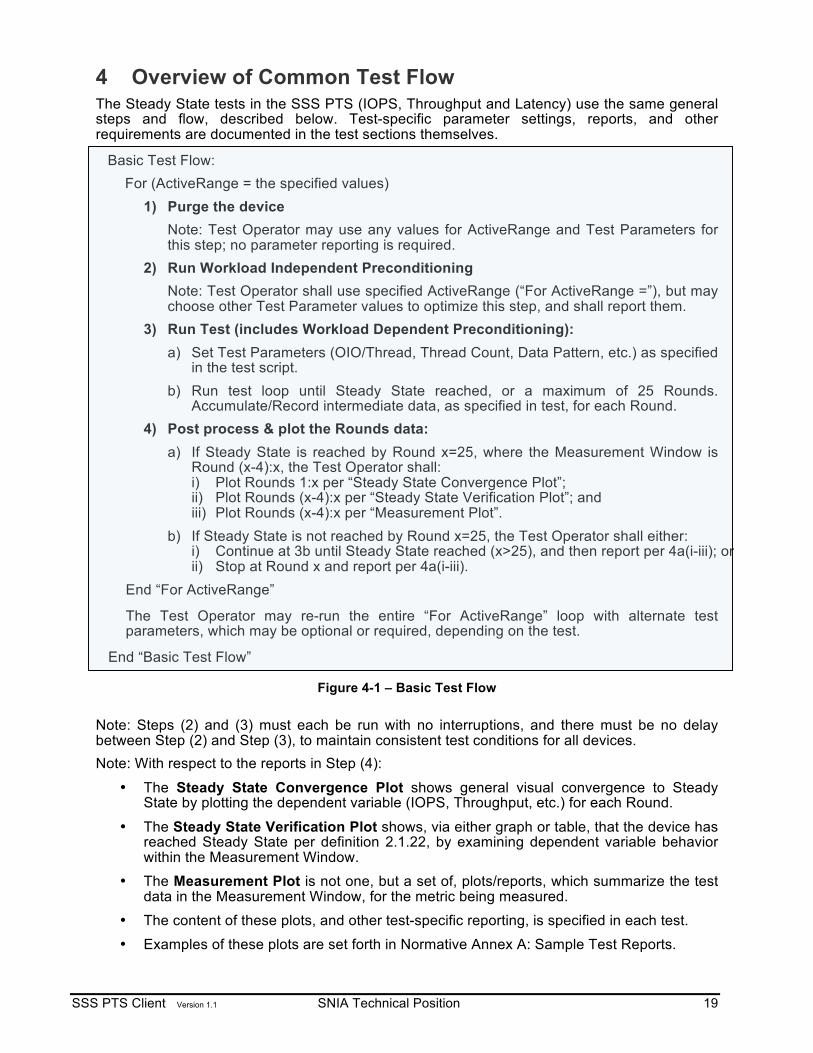
Basic Test Flow:
For (ActiveRange = the specified values) 1) Purge the device
Note: Test Operator may use any values for ActiveRange and Test Parameters for this step; no parameter reporting is required.
2) Run Workload Independent Preconditioning Note: Test Operator shall use specified ActiveRange (“For ActiveRange =”), but may choose other Test Parameter values to optimize this step, and shall report them.
3) Run Test (includes Workload Dependent Preconditioning): a) Set Test Parameters (OIO/Thread, Thread Count, Data Pattern, etc.) as specified
in the test script. b) Run test loop until Steady State reached, or a maximum of 25 Rounds.
Accumulate/Record intermediate data, as specified in test, for each Round. 4) Post process & plot the Rounds data:
a) If Steady State is reached by Round x=25, where the Measurement Window is Round (x-4):x, the Test Operator shall: i) Plot Rounds 1:x per “Steady State Convergence Plot”; ii) Plot Rounds (x-4):x per “Steady State Verification Plot”; and iii) Plot Rounds (x-4):x per “Measurement Plot”.
b) If Steady State is not reached by Round x=25, the Test Operator shall either: i) Continue at 3b until Steady State reached (x>25), and then report per 4a(i-iii); or ii) Stop at Round x and report per 4a(i-iii).
End “For ActiveRange”
The Test Operator may re-run the entire “For ActiveRange” loop with alternate test parameters, which may be optional or required, depending on the test.
End “Basic Test Flow”
Figure 4-1 – Basic Test Flow Note: Steps (2) and (3) must each be run with no interruptions, and there must be no delay between Step (2) and Step (3), to maintain consistent test conditions for all devices. Note: With respect to the reports in Step (4):
• The Steady State Convergence Plot shows general visual convergence to Steady State by plotting the dependent variable (IOPS, Throughput, etc.) for each Round.
• The Steady State Verification Plot shows, via either graph or table, that the device has reached Steady State per definition 2.1.22, by examining dependent variable behavior within the Measurement Window.
• The Measurement Plot is not one, but a set of, plots/reports, which summarize the test data in the Measurement Window, for the metric being measured.
• The content of these plots, and other test-specific reporting, is specified in each test.
• Examples of these plots are set forth in Normative Annex A: Sample Test Reports.
SSS PTS Client Version 1.1 SNIA Technical Position 20
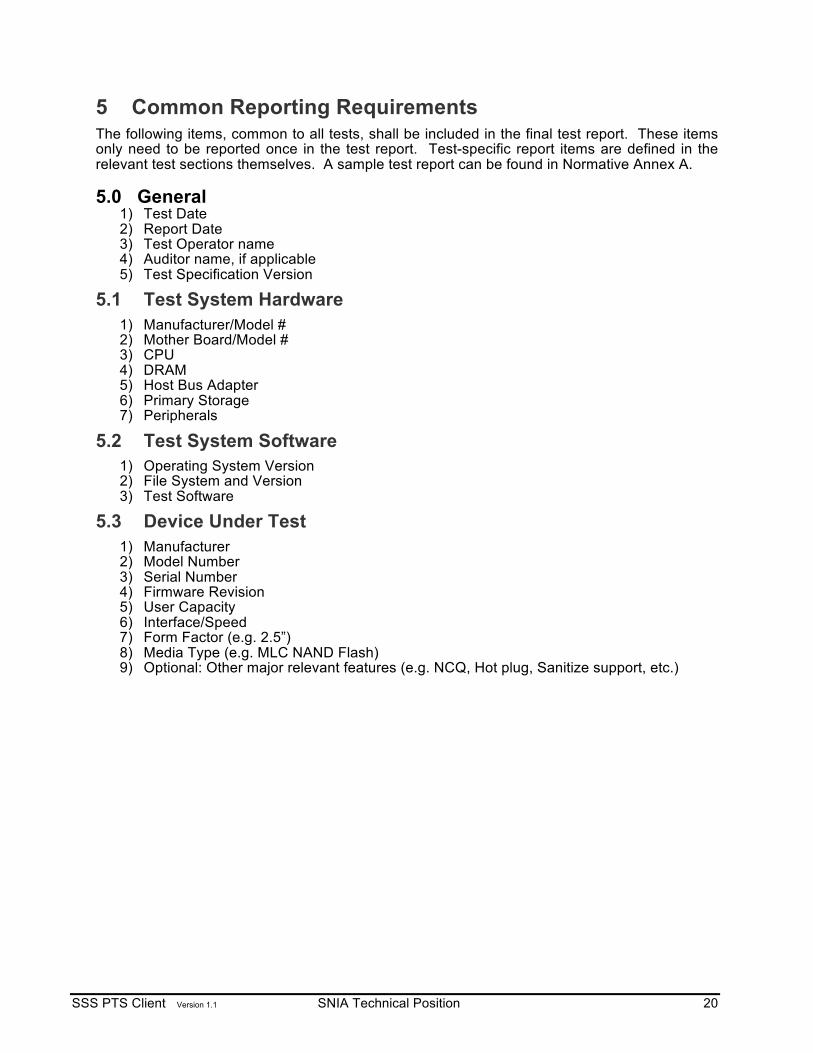
5 Common Reporting Requirements The following items, common to all tests, shall be included in the final test report. These items only need to be reported once in the test report. Test-specific report items are defined in the relevant test sections themselves. A sample test report can be found in Normative Annex A. 5.0 General
1) Test Date 2) Report Date 3) Test Operator name 4) Auditor name, if applicable 5) Test Specification Version
5.1 Test System Hardware 1) Manufacturer/Model # 2) Mother Board/Model # 3) CPU 4) DRAM 5) Host Bus Adapter 6) Primary Storage 7) Peripherals
5.2 Test System Software 1) Operating System Version 2) File System and Version 3) Test Software
5.3 Device Under Test 1) Manufacturer 2) Model Number 3) Serial Number 4) Firmware Revision 5) User Capacity 6) Interface/Speed 7) Form Factor (e.g. 2.5”) 8) Media Type (e.g. MLC NAND Flash) 9) Optional: Other major relevant features (e.g. NCQ, Hot plug, Sanitize support, etc.)
SSS PTS Client Version 1.1 SNIA Technical Position 21
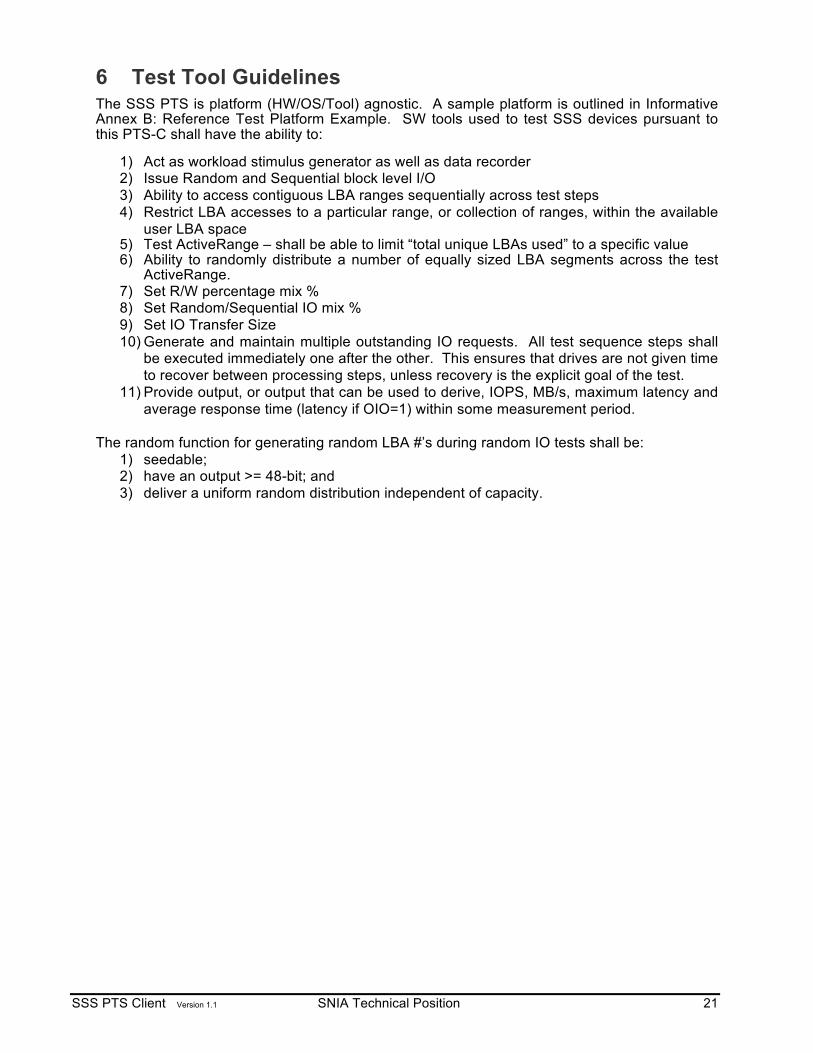
6 Test Tool Guidelines The SSS PTS is platform (HW/OS/Tool) agnostic. A sample platform is outlined in Informative Annex B: Reference Test Platform Example. SW tools used to test SSS devices pursuant to this PTS-C shall have the ability to:
1) Act as workload stimulus generator as well as data recorder 2) Issue Random and Sequential block level I/O 3) Ability to access contiguous LBA ranges sequentially across test steps 4) Restrict LBA accesses to a particular range, or collection of ranges, within the available
user LBA space 5) Test ActiveRange – shall be able to limit “total unique LBAs used” to a specific value 6) Ability to randomly distribute a number of equally sized LBA segments across the test
ActiveRange. 7) Set R/W percentage mix % 8) Set Random/Sequential IO mix % 9) Set IO Transfer Size 10) Generate and maintain multiple outstanding IO requests. All test sequence steps shall
be executed immediately one after the other. This ensures that drives are not given time to recover between processing steps, unless recovery is the explicit goal of the test.
11) Provide output, or output that can be used to derive, IOPS, MB/s, maximum latency and average response time (latency if OIO=1) within some measurement period.
The random function for generating random LBA #’s during random IO tests shall be:
1) seedable; 2) have an output >= 48-bit; and 3) deliver a uniform random distribution independent of capacity.

SSS PTS Client Version 1.1 SNIA Technical Position 22
7 IOPS Test 7.1 IOPS Descriptive Note
General Purpose: Client IOPS test is intended to measure the test SSD IOPS at a range of Random Block Sizes and Read/Write mixes using a limited preconditioning and limited Test ActiveRange. This Client IOPS test is intended to emulate characteristics of Client workloads that are limited in the ways in which the LBAs are accessed compared to Enterprise workloads. PTS-E Enterprise workload tests use 100% LBAs and have no restrictions on Test ActiveRange (see conditions set forth in the PTS-E specification). Test Flow: The Client IOPS test makes use of: 1) a limited preconditioning LBA range (section 2.1); 2) a two step Workload Independent PC (section 2.1.18.1) consisting of a) 128KiB SEQ W for 2X (twice) the user capacity; and b) application of the IOPS loop over the PC LBA range (100% or 75%) until steady state,
as defined, is achieved; 3) a one step Workload Dependent PC (WDPC) (section 2.1.18.2) consisting of the IOPS
loop using the ActiveRange Amount (8GiB or 16GiB) within the ActiveRange until Steady State, as defined, is achieved.
Test Results: The test results captured during steady state measurement window shall be tabulated and plotted as specified in section 7 and are intended to present the IOPS performance over the 56 element matrix of (7) Read/Write Mixes (aka the "outer loop") and (8) Block Sizes (aka the "inner loop"). Test Interpretation: A higher value (more IOPS) is better.
7.2 IOPS Pseudo Code For (ActiveRange=(0:100) and ActiveRange= (0:75)
For (ActiveRange Amount=8GiB and ActiveRange Amount=16GiB)
1 Purge the device. (Note: Active Range and other Test Parameters are not applicable to Purge step; any values can be used and none need to be reported.)
2 Workload Independent Preconditioning
2.1 Run SEQ Workload Independent Preconditioning 2.1.1 Set and record test conditions:
2.1.1.1 Device volatile write cache = disabled 2.1.1.2 OIO/Thread: Test Operator Choice 2.1.1.3 Thread Count: Test Operator Choice 2.1.1.4 Data Pattern: Required = Random, Optional = Test
Operator 2.1.2 Run SEQ Workload Independent Preconditioning - Write 2X User
Capacity with 128KiB SEQ writes, writing to the entire ActiveRange without LBA restrictions.
2.2 Run RND Workload Independent Preconditioning 2.2.1 Set and record test conditions:
2.2.1.1 Device volatile write cache = disabled 2.2.1.2 OIO/Thread: Same as in step 2.1 above. 2.2.1.3 Thread Count: Same as in step 2.1 above.
SSS PTS Client Version 1.1 SNIA Technical Position 23
2.2.1.4 Data Pattern: Required = Random, Optional = Test Operator Choice
2.2.2 For (R/W Mix % = 100/0, 95/5, 65/35, 50/50, 35/65, 5/95, 0/100) 2.2.2.1 For (Block Size = 1024KiB, 128KiB, 64KiB, 32KiB, 16KiB,
8KiB, 4KiB, 0.5KiB) 2.2.2.1.1 Execute random IO, per (R/W Mix %, Block
Size), for 1 minute 2.2.2.1.2 Record Ave IOPS (R/W Mix%, Block Size) 2.2.2.1.3 Use IOPS(R/W Mix% = 0/100, Block Size = 4KiB)
to detect Steady State. 2.2.2.1.4 If Steady State is not reached by Round x=25,
then the Test Operator shall either continue running the test until Steady State is reached, or may stop the test at Round x. The Measurement Window to determine WIPC termination is defined as Round x-4 to Round x.
2.2.2.2 End (For Block Size) Loop 2.2.3 End (For R/W Mix %) Loop
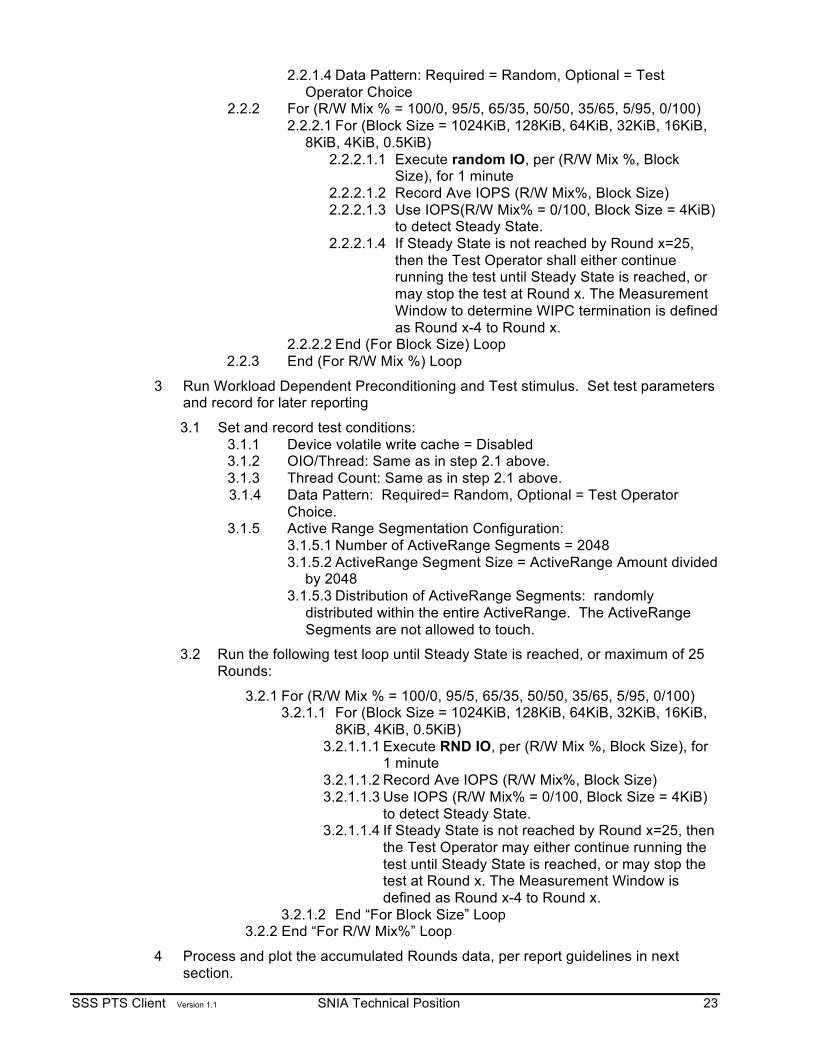
3 Run Workload Dependent Preconditioning and Test stimulus. Set test parameters and record for later reporting
3.1 Set and record test conditions: 3.1.1 Device volatile write cache = Disabled 3.1.2 OIO/Thread: Same as in step 2.1 above. 3.1.3 Thread Count: Same as in step 2.1 above. 3.1.4 Data Pattern: Required= Random, Optional = Test Operator
Choice. 3.1.5 Active Range Segmentation Configuration:
3.1.5.1 Number of ActiveRange Segments = 2048 3.1.5.2 ActiveRange Segment Size = ActiveRange Amount divided
by 2048 3.1.5.3 Distribution of ActiveRange Segments: randomly
distributed within the entire ActiveRange. The ActiveRange Segments are not allowed to touch.
3.2 Run the following test loop until Steady State is reached, or maximum of 25 Rounds:
3.2.1 For (R/W Mix % = 100/0, 95/5, 65/35, 50/50, 35/65, 5/95, 0/100) 3.2.1.1 For (Block Size = 1024KiB, 128KiB, 64KiB, 32KiB, 16KiB,
8KiB, 4KiB, 0.5KiB) 3.2.1.1.1 Execute RND IO, per (R/W Mix %, Block Size), for
1 minute 3.2.1.1.2 Record Ave IOPS (R/W Mix%, Block Size) 3.2.1.1.3 Use IOPS (R/W Mix% = 0/100, Block Size = 4KiB)
to detect Steady State. 3.2.1.1.4 If Steady State is not reached by Round x=25, then
the Test Operator may either continue running the test until Steady State is reached, or may stop the test at Round x. The Measurement Window is defined as Round x-4 to Round x.
3.2.1.2 End “For Block Size” Loop 3.2.2 End “For R/W Mix%” Loop
4 Process and plot the accumulated Rounds data, per report guidelines in next section.
SSS PTS Client Version 1.1 SNIA Technical Position 24
End (For ActiveRange Amount) loop End (For ActiveRange) loop Note: It is important to adhere to the nesting of the loops as well as the sequence of R/W Mixes and Block Sizes.
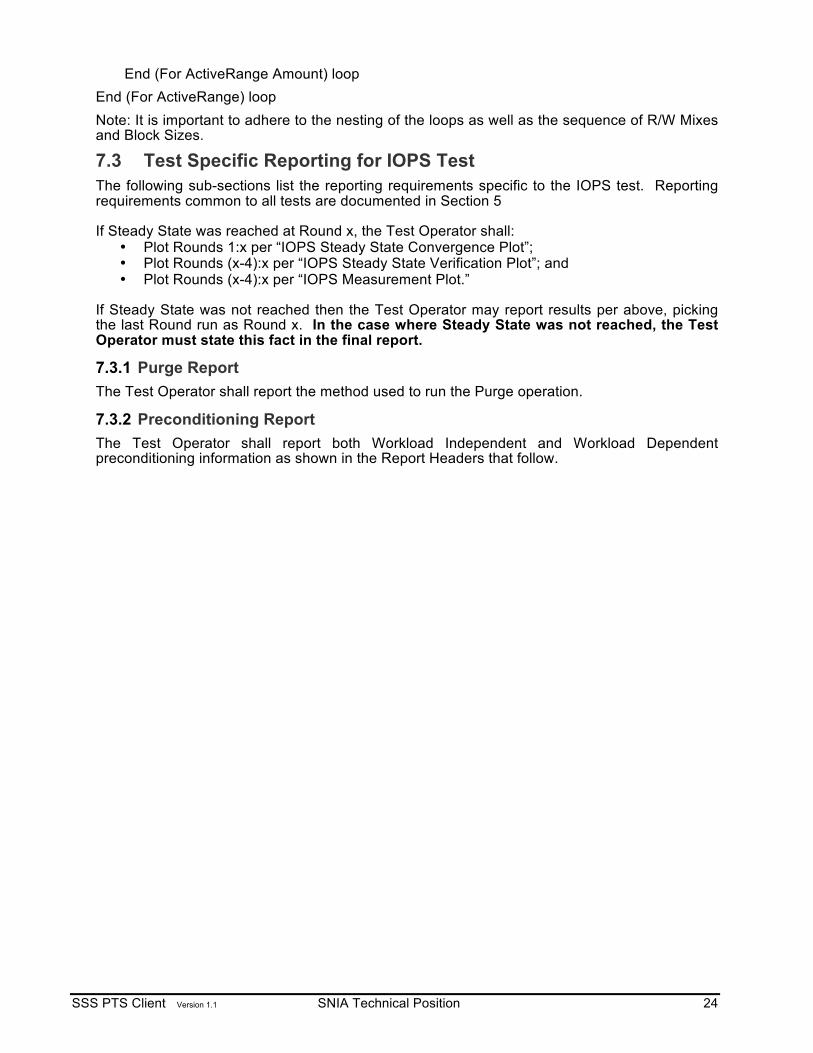
7.3 Test Specific Reporting for IOPS Test The following sub-sections list the reporting requirements specific to the IOPS test. Reporting requirements common to all tests are documented in Section 5 If Steady State was reached at Round x, the Test Operator shall:
• Plot Rounds 1:x per “IOPS Steady State Convergence Plot”; • Plot Rounds (x-4):x per “IOPS Steady State Verification Plot”; and • Plot Rounds (x-4):x per “IOPS Measurement Plot.”
If Steady State was not reached then the Test Operator may report results per above, picking the last Round run as Round x. In the case where Steady State was not reached, the Test Operator must state this fact in the final report.
7.3.1 Purge Report The Test Operator shall report the method used to run the Purge operation.
7.3.2 Preconditioning Report The Test Operator shall report both Workload Independent and Workload Dependent preconditioning information as shown in the Report Headers that follow.
SSS PTS Client Version 1.1 SNIA Technical Position 25
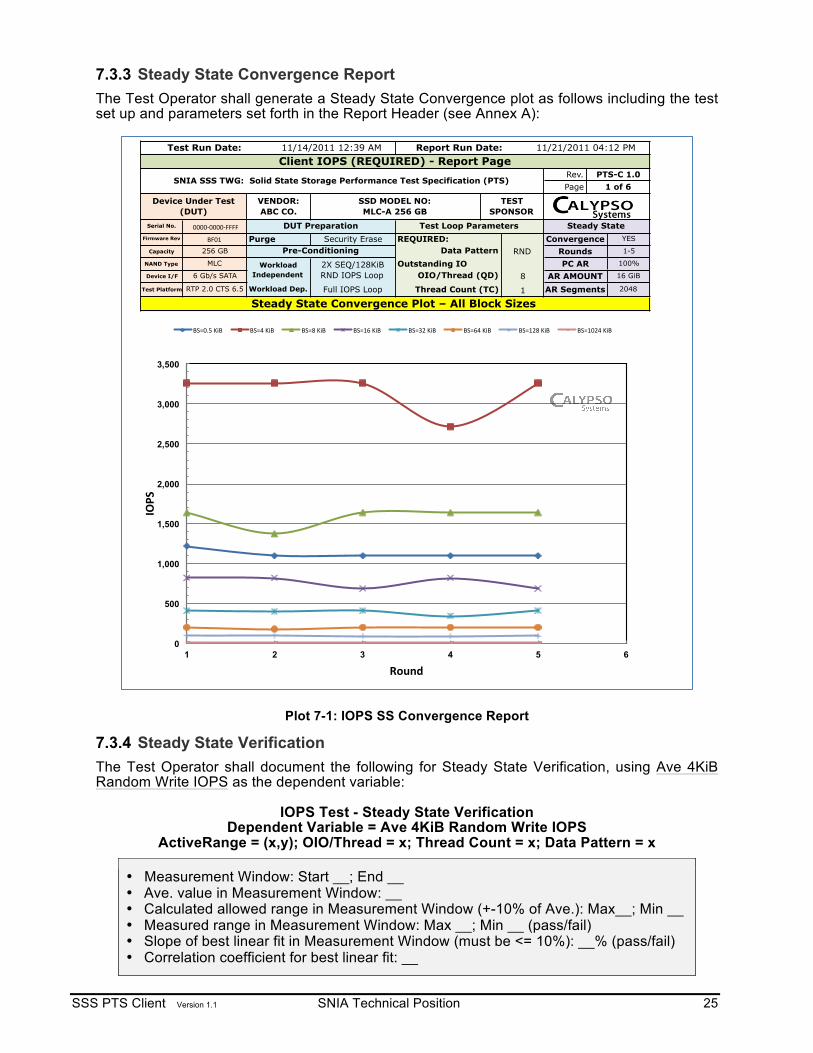
7.3.3 Steady State Convergence Report The Test Operator shall generate a Steady State Convergence plot as follows including the test set up and parameters set forth in the Report Header (see Annex A):
Plot 7-1: IOPS SS Convergence Report
7.3.4 Steady State Verification The Test Operator shall document the following for Steady State Verification, using Ave 4KiB Random Write IOPS as the dependent variable:
IOPS Test - Steady State Verification Dependent Variable = Ave 4KiB Random Write IOPS
ActiveRange = (x,y); OIO/Thread = x; Thread Count = x; Data Pattern = x
• Measurement Window: Start __; End __ • Ave. value in Measurement Window: __ • Calculated allowed range in Measurement Window (+-10% of Ave.): Max__; Min __ • Measured range in Measurement Window: Max __; Min __ (pass/fail) • Slope of best linear fit in Measurement Window (must be <= 10%): __% (pass/fail) • Correlation coefficient for best linear fit: __
12345
Test Run Date: 11/14/2011 12:39 AM Report Run Date: 11/21/2011 04:12 PM
Steady State Convergence Plot – All Block Sizes
8 AR AMOUNT 16 GiB
Test Platform RTP 2.0 CTS 6.5 Workload Dep. Full IOPS Loop Thread Count (TC) 1
Serial No.
Firmware Rev
!""""#""""#$$$$
%$"&
NAND Type MLC
AR Segments
1-5
Device I/F 6 Gb/s SATAWorkload
Independent2X SEQ/128KiB RND IOPS Loop
Outstanding IO
2048
OIO/Thread (QD)
Rounds100%PC AR
Client IOPS (REQUIRED) - Report Page
SNIA SSS TWG: Solid State Storage Performance Test Specification (PTS)Rev.Page 1 of 6
Device Under Test (DUT)
YES
VENDOR: ABC CO.
SSD MODEL NO: MLC-A 256 GB
TEST SPONSOR
DUT Preparation Test Loop ParametersPurge Security Erase REQUIRED: Convergence
Capacity 256 GB Pre-Conditioning Data Pattern
1220.981097.141097.971097.971097.41
3253.88 1371.77
3254.83 1636.59
817.42 395.00 176.20 95.98 15.863257.50 1640.21 819.63 410.45 203.45 98.33
687.90 407.65 202.72 15.94
3253.88 1637.12 687.92 407.24 199.12 86.3217.172715.14 1638.55 816.18 343.34
95.43200.55 86.34
PTS-C 1.0
15.20
17.62
Steady State
RND
0
500
1,000
1,500
2,000
2,500
3,000
3,500
1 2 3 4 5 6
!"#$%
&'()*%
%'(")*!+,%! %'(-!+,%! %'(.!+,%! %'(&/!+,%! %'(01!+,%! %'(/-!+,%! %'(&1.!+,%! %'(&"1-!+,%!
SSS PTS Client Version 1.1 SNIA Technical Position 26
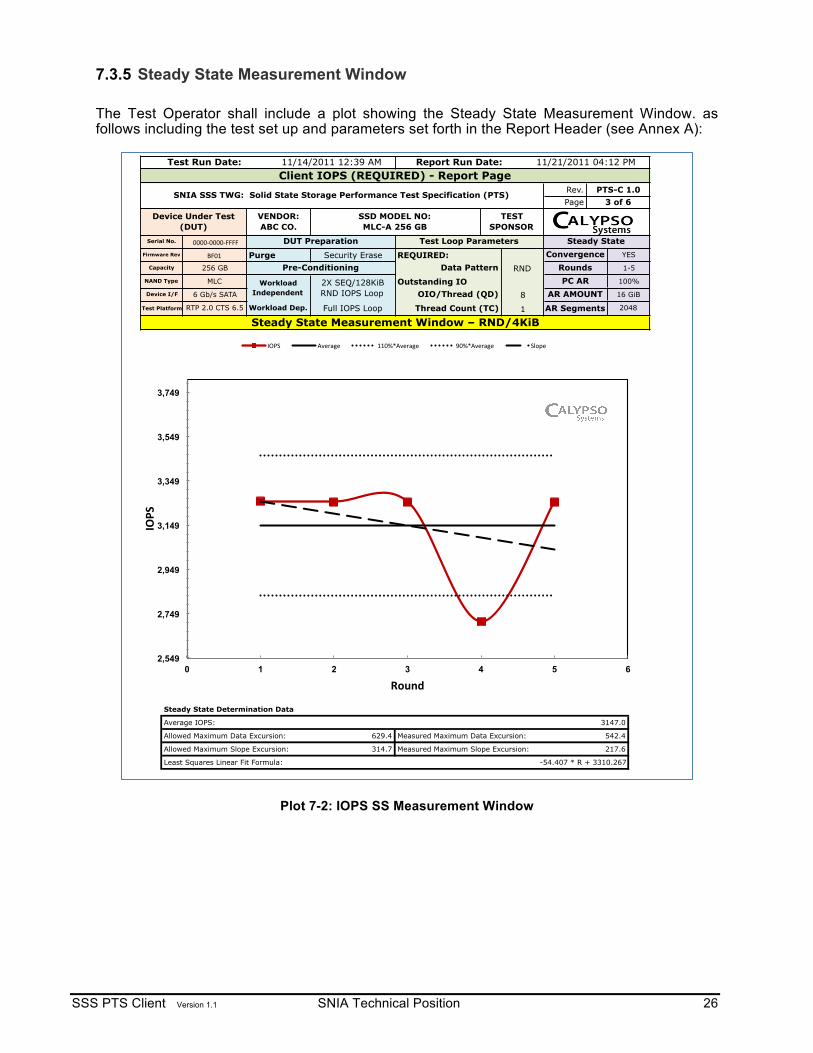
7.3.5 Steady State Measurement Window The Test Operator shall include a plot showing the Steady State Measurement Window. as follows including the test set up and parameters set forth in the Report Header (see Annex A):
Plot 7-2: IOPS SS Measurement Window
12345
11/21/2011 04:12 PM
542.4
217.6
-54.407 * R + 3310.267
Allowed Maximum Data Excursion:
Steady State Determination Data
Average IOPS: 3147.0
Allowed Maximum Slope Excursion:
Least Squares Linear Fit Formula:
Measured Maximum Data Excursion:
Measured Maximum Slope Excursion:
629.4
314.7
3257.503253.883253.882715.143254.83
2048
Steady State Measurement Window – RND/4KiBTest Platform RTP 2.0 CTS 6.5 Workload Dep. Full IOPS Loop Thread Count (TC) 1 AR Segments
Capacity 256 GB Pre-Conditioning Data Pattern RND RoundsPC AR
1-5
NAND Type MLC Workload Independent
2X SEQ/128KiB RND IOPS Loop
Outstanding IODevice I/F 6 Gb/s SATA OIO/Thread (QD) 8 AR AMOUNT 16 GiB
100%
Device Under Test (DUT)
VENDOR: ABC CO.
SSD MODEL NO: MLC-A 256 GB
TEST SPONSOR
DUT Preparation Test Loop Parameters Steady State
Purge Security Erase REQUIRED: Convergence YES
Serial No. !""""#""""#$$$$
Firmware Rev %$"&
Client IOPS (REQUIRED) - Report Page
SNIA SSS TWG: Solid State Storage Performance Test Specification (PTS) Rev. PTS-C 1.0Page 3 of 6
Test Run Date: 11/14/2011 12:39 AM Report Run Date:
2,549
2,749
2,949
3,149
3,349
3,549
3,749
0 1 2 3 4 5 6
!"#$%
&'()*%
'()*! +,-./0-! &&"12+,-./0-! 3"12+,-./0-! *456-!

SSS PTS Client Version 1.1 SNIA Technical Position 27
7.3.6 Measurement Window Report The results for the test shall be reported in the following series of tables and graphs which record and report the data from the Steady State Measurement Window. 7.3.6.1 IOPS Measurement Window Tabular Data The Test Operator shall include a plot showing an IOPS Tabular Data as follows including the test set up and parameters set forth in the Report Header (see Annex A).
Plot 7-3: IOPS Measurement Window Tabular Data Each entry in the table is the average of the values in the five Rounds comprising the Steady State Measurement Window, for the selected (R/W Mix%, Block Size) element.
!"#$
PC AR 100%
Client IOPS - ALL RW Mix & BS – Tabular Data RTP 2.0 CTS 6.5
Security Erase
2048
NAND Type
Device I/F
Test Platform Workload Dep. Full IOPS Loop
0/100
196.492.516.4
Block Size (KiB)
0.5
Test Run Date: 11/14/2011 12:39 AM Report Run Date: 11/21/2011 04:12 PM
16 GiB
DUT Preparation
TEST SPONSOR
AR Segments1
Outstanding IO
Thread Count (TC)
SNIA SSS TWG: Solid State Storage Performance Test Specification (PTS)
AR AMOUNT
Client IOPS (REQUIRED) - Report PagePTS-C 1.0
4 of 6
Serial No. %####&####&""""
Capacity
Device Under Test (DUT)
256 GB
MLC
6 Gb/s SATA
Firmware Rev
Rev.Page
Workload Independent
2X SEQ/128KiB RND IOPS Loop
Pre-ConditioningREQUIRED:
Data Pattern
OIO/Thread (QD) 8
VENDOR: ABC CO.
ConvergenceRounds
Purge
SSD MODEL NO: MLC-A 256 GB
Steady StateTest Loop ParametersYES
1-5RND
1,654.63,044.42,055.01,028.1
525.8291.3
48
Read / Write Mix %
1,122.33,147.01,584.9
765.8392.7
1,162.22,896.6
5/95 35/65 50/50 100/0
401.0
2,898.11,604.9
3,454.4
65/35 95/5
13,005.82,717.73,779.3
11,970.01,965.6
3,791.5
6,208.34,129.62,372.7
11,568.2 21,723.112,482.57,011.6
2,238.91,272.6
652.7 963.8
29,860.129,876.3
1,589.7786.3
352.3 565.4205.997.116.5
163264
1281024
377.990.8
1,410.2191.423.3
185.427.3
139.9 2,015.3266.7
SSS PTS Client Version 1.1 SNIA Technical Position 28
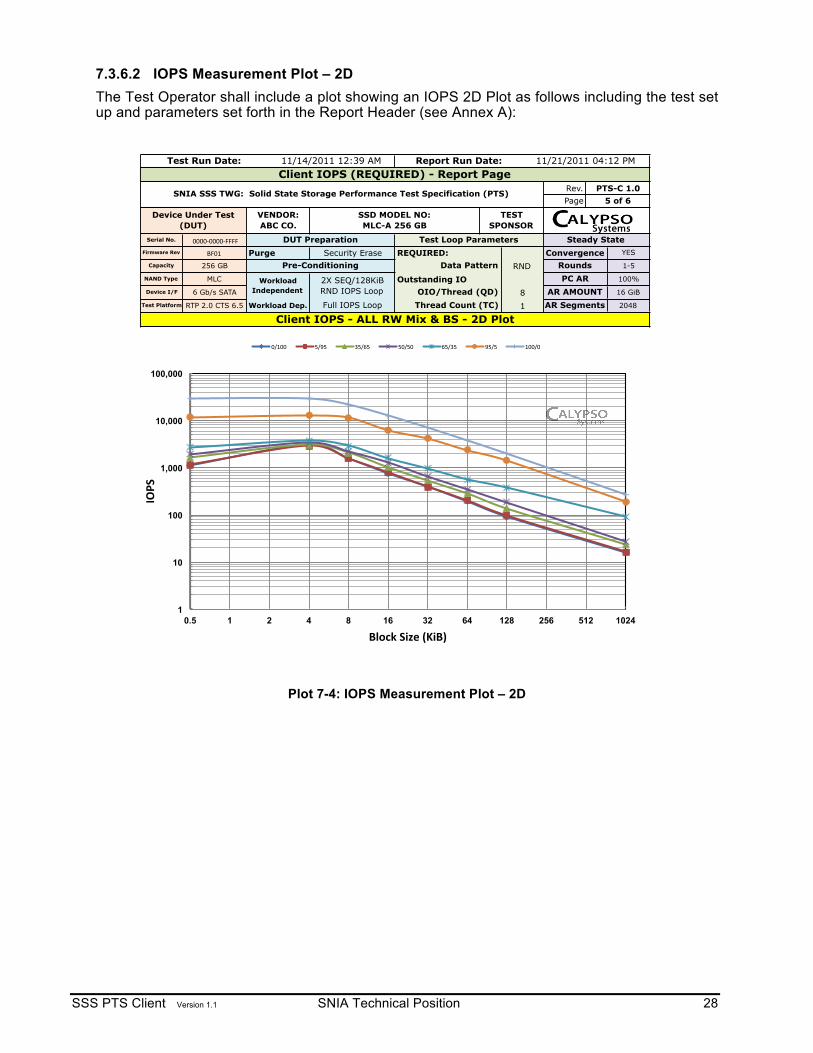
7.3.6.2 IOPS Measurement Plot – 2D The Test Operator shall include a plot showing an IOPS 2D Plot as follows including the test set up and parameters set forth in the Report Header (see Annex A):
Plot 7-4: IOPS Measurement Plot – 2D
Serial No. !""""#""""#$$$$Firmware Rev %$"&
PC AR 100%
Test Run Date: 11/14/2011 12:39 AM
Page 5 of 6
Report Run Date: 11/21/2011 04:12 PM
Rev. PTS-C 1.0SNIA SSS TWG: Solid State Storage Performance Test Specification (PTS)
Client IOPS (REQUIRED) - Report Page
Device Under Test (DUT)
VENDOR: ABC CO.
SSD MODEL NO: MLC-A 256 GB
TEST SPONSOR
OIO/Thread (QD)Test Platform RTP 2.0 CTS 6.5 Thread Count (TC)
Test Loop ParametersPurge Security Erase REQUIRED:
1
1-5
NAND Type MLC Outstanding IO
Capacity 256 GB Data Pattern
Steady StateDUT PreparationConvergence
Client IOPS - ALL RW Mix & BS - 2D Plot
16 GiBDevice I/F
YES
AR Segments 2048
6 Gb/s SATA
Pre-Conditioning RND
Workload Independent
2X SEQ/128KiB RND IOPS Loop 8 AR AMOUNT
Workload Dep. Full IOPS Loop
Rounds
1
10
100
1,000
10,000
100,000
0.5 1 2 4 8 16 32 64 128 256 512 1024
!"#$%
&'()*%$+,-%./+&0%
"'&""! (')(! *('+(! ("'("! +('*(! )('(! &""'"!
SSS PTS Client Version 1.1 SNIA Technical Position 29
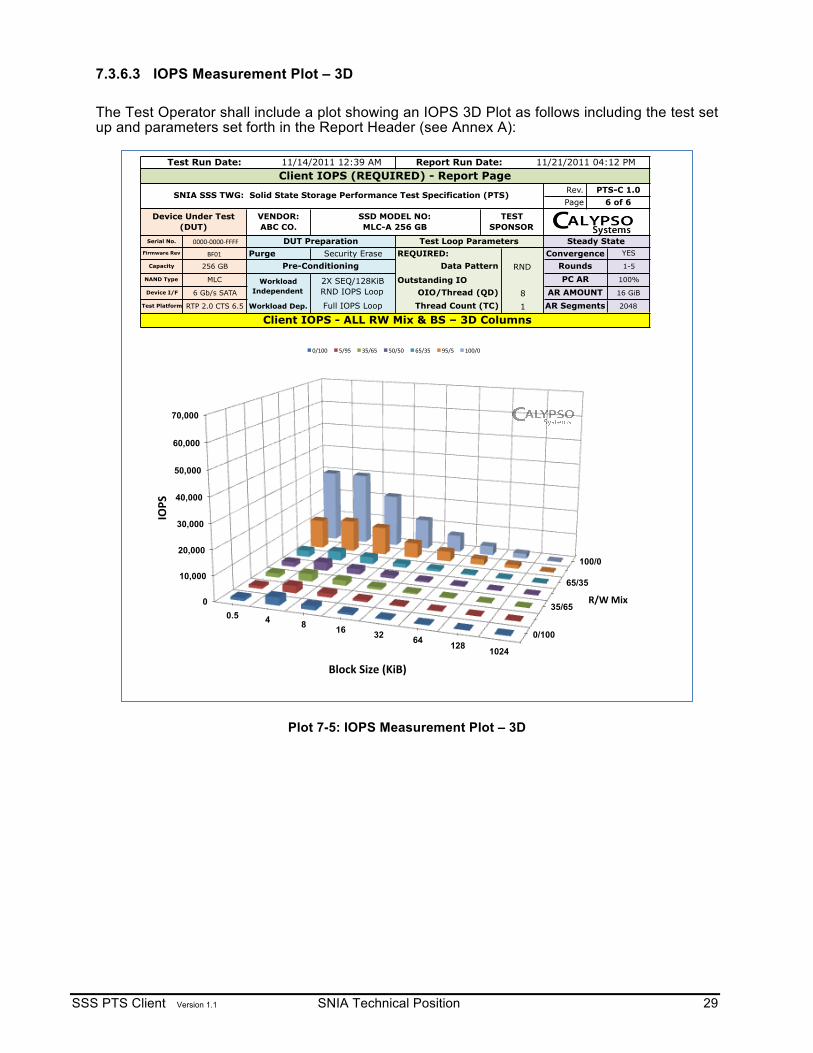
7.3.6.3 IOPS Measurement Plot – 3D The Test Operator shall include a plot showing an IOPS 3D Plot as follows including the test set up and parameters set forth in the Report Header (see Annex A):
Plot 7-5: IOPS Measurement Plot – 3D
11/14/2011 12:39 AM Report Run Date: 11/21/2011 04:12 PMClient IOPS (REQUIRED) - Report Page
SNIA SSS TWG: Solid State Storage Performance Test Specification (PTS) Rev.
Test Run Date:
PTS-C 1.0Page 6 of 6
Device Under Test (DUT)
VENDOR: ABC CO.
SSD MODEL NO: MLC-A 256 GB
TEST SPONSOR
DUT Preparation Test Loop Parameters Steady StateSerial No. !""""#""""#$$$$
256 GB Pre-Conditioning Data Pattern RND Rounds 1-5
Purge Security Erase REQUIRED: Convergence YES
Capacity
Firmware Rev %$"&
Client IOPS - ALL RW Mix & BS – 3D Columns
AR AMOUNT 16 GiB
Test Platform RTP 2.0 CTS 6.5 Workload Dep. Full IOPS Loop Thread Count (TC) 1 AR Segments 2048
NAND Type MLC Workload Independent
2X SEQ/128KiB RND IOPS Loop
Outstanding IODevice I/F 6 Gb/s SATA OIO/Thread (QD) 8
PC AR 100%
0/100
35/65
65/35
100/0
0
10,000
20,000
30,000
40,000
50,000
60,000
70,000
0.5 4 8 16 32 64 128 1024
!"#$%&'$
()*+$
,-./0$+&12$34&,5$
"'&""! (')(! *('+(! ("'("! +('*(! )('(! &""'"!
SSS PTS Client Version 1.1 SNIA Technical Position 30
8 Throughput Test 8.1 Throughput Descriptive Note
General Purpose: Client Throughput test is intended to measure the test SSD Throughput (TP) in large block (1024KiB) Sequential Read/Write (100/0, 0/100) during Steady State. This Client TP test is intended to present the test SSD data transfer rate in MB/s at 100% R and 100% W in 1024KiB blocks. The intent of the TP test is to determine how fast the test SSD can transfer Sequential data without limitation from the IO Bus. Test Flow: The Client TP test makes use of: 1) a limited preconditioning LBA range (section 2.1); 2) a two step Workload Independent PC (section 2.1.18.1) consisting of a) 128KiB SEQ W for 2X (twice) the user capacity; and b) application of the TP stimulus (1024KiB) over the PC LBA ActiveRange (100% or 75%) until Steady State, as defined, is achieved; 3) a one step Workload Dependent PC (WDPC) (section 2.1.18.2) consisting of the TP stimulus using the ActiveRange Amount (8GiB or 16GiB) within the ActiveRange until Steady State, as defined, is achieved. Test Results: The test results captured during steady state measurement window shall be tabulated and plotted as specified in section 8. Test Interpretation: A higher value (greater MB/s) is better.
8.2 Throughput Pseudo Code For (ActiveRange=(0:100) and ActiveRange= (0:75)
For (ActiveRange Amount=8GiB and ActiveRange Amount=16GiB) 1. Purge the device. (Note: ActiveRange Amount and other Test Parameters are not
applicable to Purge step; any values can be used and none need to be reported.) 2. Workload Independent Preconditioning
2.1. Set and record parameters for later reporting. 2.1.1. Volatile Write cache: disabled 2.1.2. Thread Count: Test Operator Choice 2.1.3. OIO/Thread: Test Operator Choice 2.1.4. Data Pattern: Required = Random, Optional = Test Operator
Choice 2.2. Run SEQ Workload Independent Preconditioning - Write 2X User Capacity w/
1024KiB SEQ writes to the entire ActiveRange without any LBA restrictions
3. Run Workload Dependent Preconditioning and Test Stimulus
3.1. Set parameters and record for later reporting 3.1.1. Volatile Write cache: disabled 3.1.2. Thread Count: Same as in step 2.1 above. 3.1.3. OIO/Thread: Same as in step 2.1 above. 3.1.4. Data Pattern: Required = Random, Optional = Test Operator
Choice 3.1.5. ActiveRange Segmentation Configuration:
3.1.5.1. Number of ActiveRange Segments = 2048 3.1.5.2. ActiveRange Segment Size = ActiveRange Amount divided
by 2048
SSS PTS Client Version 1.1 SNIA Technical Position 31
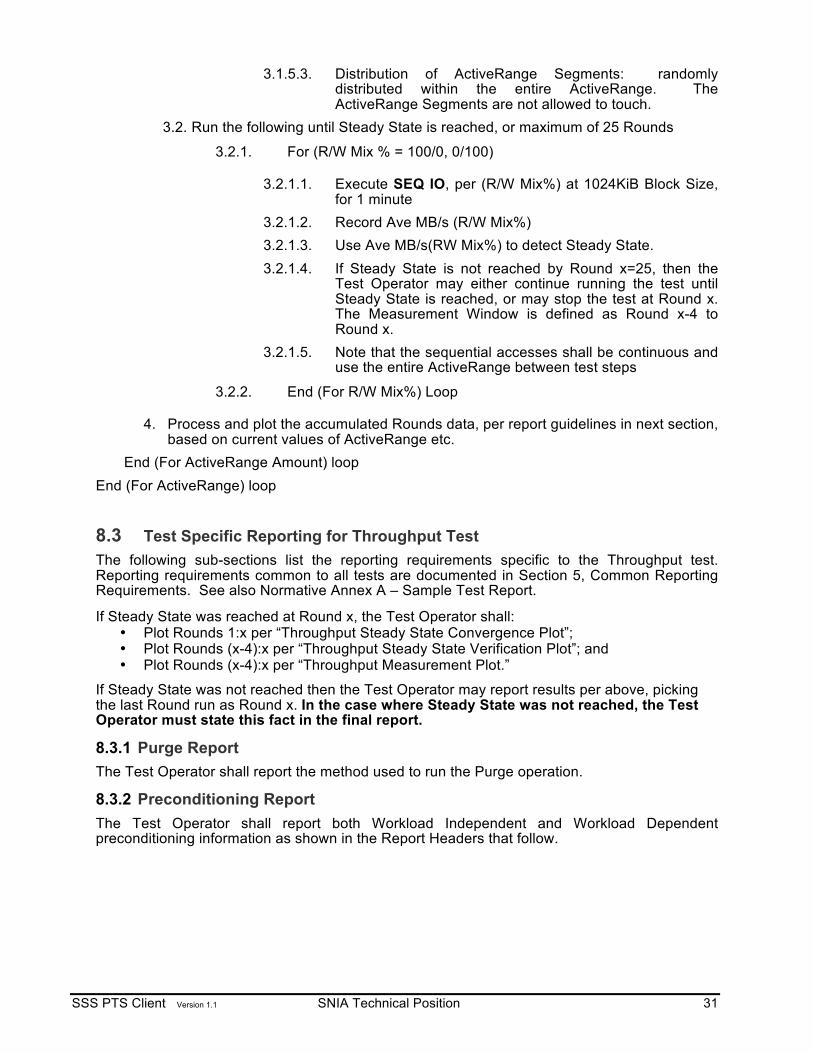
3.1.5.3. Distribution of ActiveRange Segments: randomly distributed within the entire ActiveRange. The ActiveRange Segments are not allowed to touch.
3.2. Run the following until Steady State is reached, or maximum of 25 Rounds
3.2.1. For (R/W Mix % = 100/0, 0/100)
3.2.1.1. Execute SEQ IO, per (R/W Mix%) at 1024KiB Block Size, for 1 minute
3.2.1.2. Record Ave MB/s (R/W Mix%) 3.2.1.3. Use Ave MB/s(RW Mix%) to detect Steady State. 3.2.1.4. If Steady State is not reached by Round x=25, then the
Test Operator may either continue running the test until Steady State is reached, or may stop the test at Round x. The Measurement Window is defined as Round x-4 to Round x.
3.2.1.5. Note that the sequential accesses shall be continuous and use the entire ActiveRange between test steps
3.2.2. End (For R/W Mix%) Loop
4. Process and plot the accumulated Rounds data, per report guidelines in next section, based on current values of ActiveRange etc.
End (For ActiveRange Amount) loop End (For ActiveRange) loop
8.3 Test Specific Reporting for Throughput Test The following sub-sections list the reporting requirements specific to the Throughput test. Reporting requirements common to all tests are documented in Section 5, Common Reporting Requirements. See also Normative Annex A – Sample Test Report. If Steady State was reached at Round x, the Test Operator shall:
• Plot Rounds 1:x per “Throughput Steady State Convergence Plot”; • Plot Rounds (x-4):x per “Throughput Steady State Verification Plot”; and • Plot Rounds (x-4):x per “Throughput Measurement Plot.”
If Steady State was not reached then the Test Operator may report results per above, picking the last Round run as Round x. In the case where Steady State was not reached, the Test Operator must state this fact in the final report.
8.3.1 Purge Report The Test Operator shall report the method used to run the Purge operation.
8.3.2 Preconditioning Report The Test Operator shall report both Workload Independent and Workload Dependent preconditioning information as shown in the Report Headers that follow.
SSS PTS Client Version 1.1 SNIA Technical Position 32
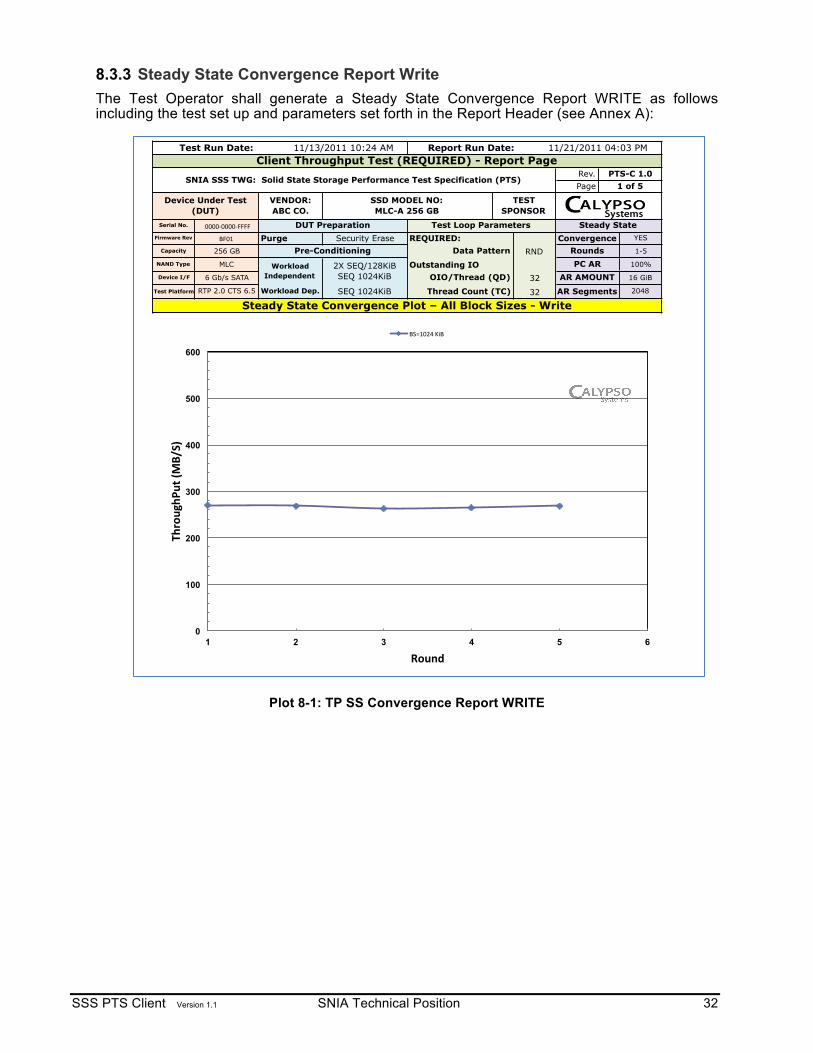
8.3.3 Steady State Convergence Report Write The Test Operator shall generate a Steady State Convergence Report WRITE as follows including the test set up and parameters set forth in the Report Header (see Annex A):
Plot 8-1: TP SS Convergence Report WRITE
1 270.81
2 269.18
3 262.91
4 264.39
5 268.58
Thread Count (TC)
Steady State Convergence Plot – All Block Sizes - Write
AR AMOUNT 16 GiB
Test Platform
11/21/2011 04:03 PMTest Run Date: 11/13/2011 10:24 AM Report Run Date:
NAND Type 2X SEQ/128KiB SEQ 1024KiB
RND
AR Segments
1-5
Device I/F 6 Gb/s SATA
Outstanding IO
2048
OIO/Thread (QD)
Data Pattern
32
256 GB
MLC
RTP 2.0 CTS 6.5 32
Workload Independent
Client Throughput Test (REQUIRED) - Report Page
SNIA SSS TWG: Solid State Storage Performance Test Specification (PTS)Rev.
Firmware Rev !"#$
PTS-C 1.0
Test Loop Parameters Steady State
VENDOR: ABC CO.
Page 1 of 5
Device Under Test (DUT)
YESPurge Security ErasePre-Conditioning
SSD MODEL NO: MLC-A 256 GB
TEST SPONSOR
Serial No. %####&####&"""" DUT Preparation
PC ARRounds
REQUIRED: ConvergenceCapacity
100%
Workload Dep. SEQ 1024KiB
0
100
200
300
400
500
600
1 2 3 4 5 6
!"#$%&"'
%()*+
,-./)
0$%12)
!'($#)*%+,!%
SSS PTS Client Version 1.1 SNIA Technical Position 33
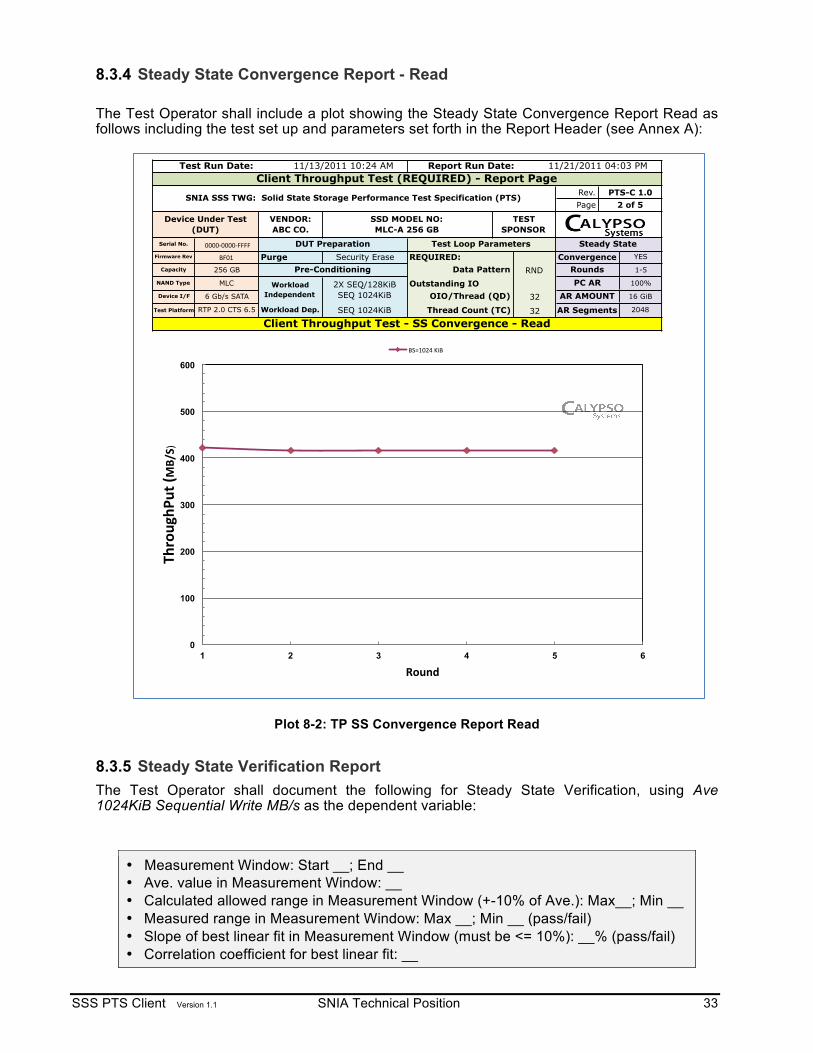
8.3.4 Steady State Convergence Report - Read The Test Operator shall include a plot showing the Steady State Convergence Report Read as follows including the test set up and parameters set forth in the Report Header (see Annex A):
Plot 8-2: TP SS Convergence Report Read
8.3.5 Steady State Verification Report The Test Operator shall document the following for Steady State Verification, using Ave 1024KiB Sequential Write MB/s as the dependent variable:
• Measurement Window: Start __; End __ • Ave. value in Measurement Window: __ • Calculated allowed range in Measurement Window (+-10% of Ave.): Max__; Min __ • Measured range in Measurement Window: Max __; Min __ (pass/fail) • Slope of best linear fit in Measurement Window (must be <= 10%): __% (pass/fail) • Correlation coefficient for best linear fit: __
1 420.81
2 416.09
3 415.38
4 416.13
5 416.26
Test Run Date: 11/13/2011 10:24 AM Report Run Date: 11/21/2011 04:03 PM
Data Pattern
Test Platform RTP 2.0 CTS 6.5
AR AMOUNT 16 GiB
2 of 5
32
PTS-C 1.0Client Throughput Test (REQUIRED) - Report Page
SNIA SSS TWG: Solid State Storage Performance Test Specification (PTS) Rev.Page
Client Throughput Test - SS Convergence - Read
Steady State
RND Rounds
Thread Count (TC) 32 AR Segments 2048
Outstanding IO
Device Under Test (DUT)
REQUIRED: Convergence YES
1-5
OIO/Thread (QD)MLC
Capacity 256 GB
Test Loop ParametersSecurity Erase
Pre-Conditioning
Firmware Rev !"#$
Serial No. %####&####&"""" DUT PreparationPurge
Device I/F 6 Gb/s SATA
NAND Type
VENDOR: ABC CO.
SSD MODEL NO: MLC-A 256 GB
TEST SPONSOR
PC AR 100%
Workload Dep. SEQ 1024KiB
Workload Independent
2X SEQ/128KiB SEQ 1024KiB
0
100
200
300
400
500
600
1 2 3 4 5 6
!"#$%&"'
%()*+
,-.'%
/$%01)
!()$#*+%,-!%
SSS PTS Client Version 1.1 SNIA Technical Position 34
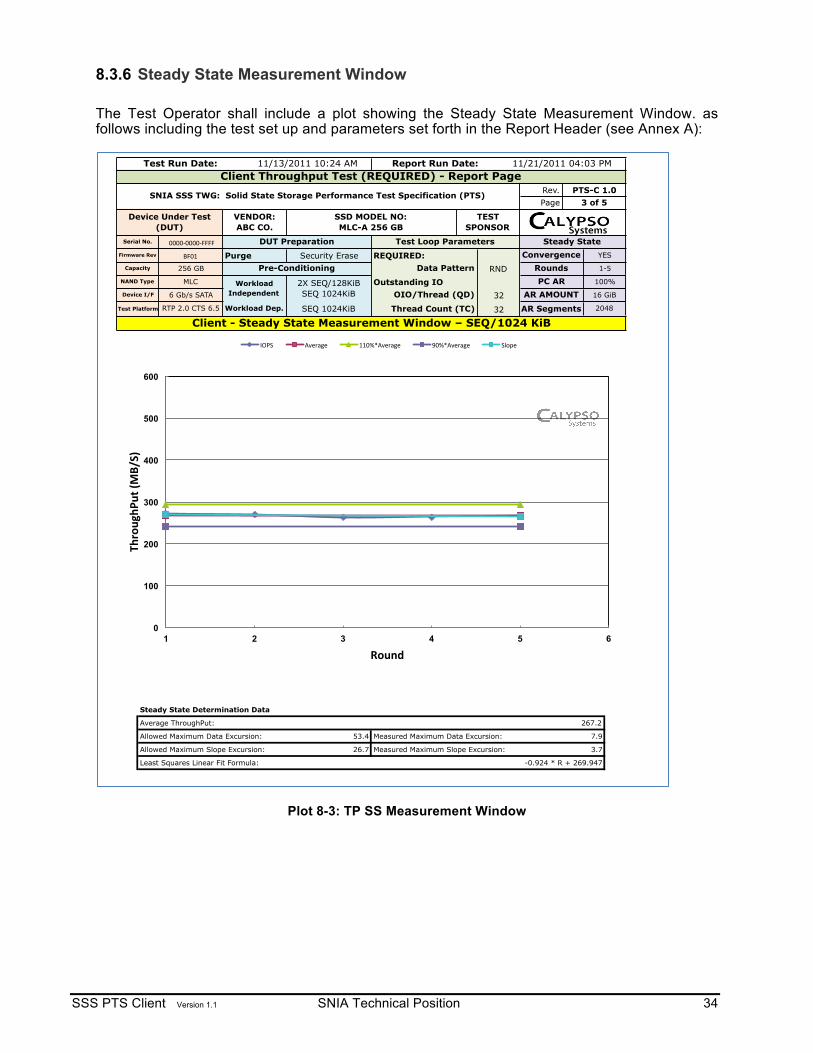
8.3.6 Steady State Measurement Window The Test Operator shall include a plot showing the Steady State Measurement Window. as follows including the test set up and parameters set forth in the Report Header (see Annex A):
Plot 8-3: TP SS Measurement Window
1 12 5345
265.326233
267.2
269.022451267.174342 293.8917762 240.4569078
270.81
Capacity 256 GB
-0.924 * R + 269.947
Allowed Maximum Data Excursion:
Steady State Determination Data
Allowed Maximum Slope Excursion:
Least Squares Linear Fit Formula:
Measured Maximum Slope Excursion:
7.9
Average ThroughPut:
3.7
269.18
26.7
Measured Maximum Data Excursion:
264.39
Client - Steady State Measurement Window – SEQ/1024 KiB293.8917762
204832
53.4
267.174342
268.58
Test Platform RTP 2.0 CTS 6.5 Thread Count (TC)
262.91
240.4569078
AR SegmentsWorkload Dep. SEQ 1024KiB
RND Rounds
16 GiBWorkload
Independent2X SEQ/128KiB SEQ 1024KiB
PC ARDevice I/F 6 Gb/s SATA OIO/Thread (QD) 32 AR AMOUNT
MLCNAND Type Outstanding IO
1-5
Convergence!""""#""""#$$$$ DUT Preparation
Purge Security ErasePre-Conditioning Data Pattern
Page 3 of 5
11/21/2011 04:03 PM
Device Under Test (DUT)
Test Loop Parameters Steady StateYES
Test Run Date: 11/13/2011 10:24 AM Report Run Date:
SNIA SSS TWG: Solid State Storage Performance Test Specification (PTS) Rev. PTS-C 1.0Client Throughput Test (REQUIRED) - Report Page
REQUIRED:Firmware Rev %$"&
Serial No.
VENDOR: ABC CO.
SSD MODEL NO: MLC-A 256 GB
TEST SPONSOR
100%
0
100
200
300
400
500
600
1 2 3 4 5 6
!"#$%&"'
%()*+
,-./)
0$%12)
'()*! +,-./0-! &&"12+,-./0-! 3"12+,-./0-! *456-!
SSS PTS Client Version 1.1 SNIA Technical Position 35
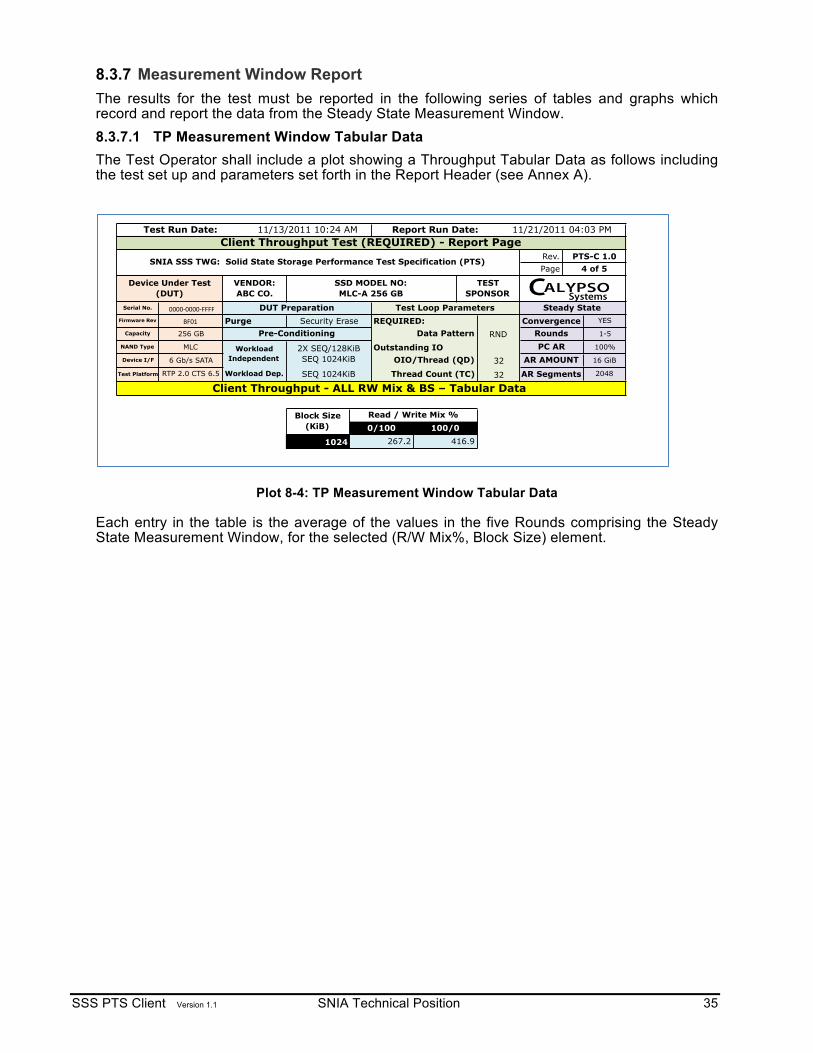
8.3.7 Measurement Window Report The results for the test must be reported in the following series of tables and graphs which record and report the data from the Steady State Measurement Window. 8.3.7.1 TP Measurement Window Tabular Data The Test Operator shall include a plot showing a Throughput Tabular Data as follows including the test set up and parameters set forth in the Report Header (see Annex A).
Plot 8-4: TP Measurement Window Tabular Data Each entry in the table is the average of the values in the five Rounds comprising the Steady State Measurement Window, for the selected (R/W Mix%, Block Size) element.
!"# $%#&'%&&%&&'&
Report Run Date:Test Run Date: 11/13/2011 10:24 AM 11/21/2011 04:03 PM
Serial No.
SNIA SSS TWG: Solid State Storage Performance Test Specification (PTS)
1-5
YES
Data PatternPurge
Client Throughput - ALL RW Mix & BS – Tabular Data RTP 2.0 CTS 6.5
OIO/Thread (QD) AR AMOUNT 16 GiB
ConvergenceRoundsRNDPC AR
Thread Count (TC)
Outstanding IO
Rev.Page
REQUIRED:
Device Under Test (DUT)
256 GB
MLC
Firmware Rev ()&%
*&&&&+&&&&+)))) DUT Preparation
2X SEQ/128KiB SEQ 1024KiB
Capacity
6 Gb/s SATA 32AR Segments
NAND Type
Security Erase
Read / Write Mix %
416.9
4 of 5
VENDOR: ABC CO.
0/100
100%
SSD MODEL NO: MLC-A 256 GB
TEST SPONSOR
Steady StateTest Loop Parameters
Pre-Conditioning
Workload Independent
Client Throughput Test (REQUIRED) - Report PagePTS-C 1.0
Device I/F
Test Platform 204832
Block Size (KiB)
1024 267.2100/0
Workload Dep. SEQ 1024KiB
SSS PTS Client Version 1.1 SNIA Technical Position 36
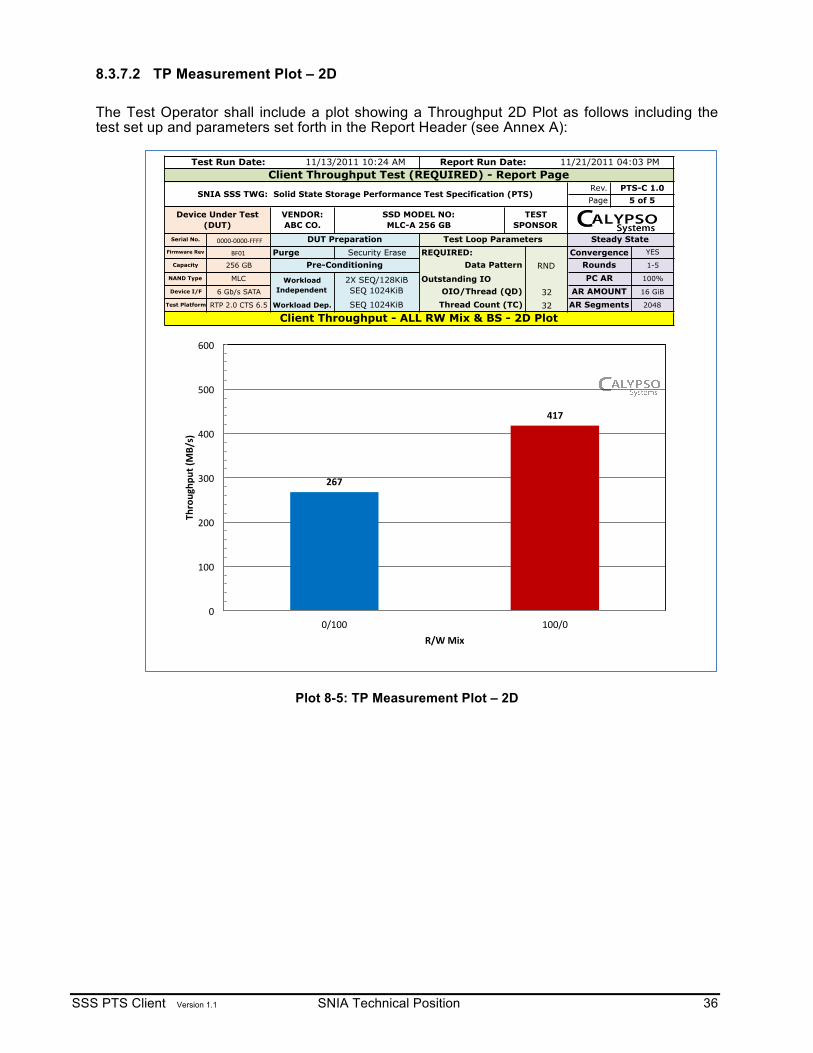
8.3.7.2 TP Measurement Plot – 2D The Test Operator shall include a plot showing a Throughput 2D Plot as follows including the test set up and parameters set forth in the Report Header (see Annex A):
Plot 8-5: TP Measurement Plot – 2D
Test Run Date: 11/13/2011 10:24 AM Report Run Date: 11/21/2011 04:03 PM
!""""#""""#$$$$ DUT Preparation
Client Throughput Test (REQUIRED) - Report Page
Rounds
Steady State
Rev.
REQUIRED:Test Loop Parameters
Device Under Test (DUT)
Thread Count (TC)
SNIA SSS TWG: Solid State Storage Performance Test Specification (PTS)
Data PatternCapacity
AR AMOUNT
32
NAND Type
PTS-C 1.0
Workload Independent
Client Throughput - ALL RW Mix & BS - 2D Plot
16 GiB
Convergence YES
AR Segments 2048
6 Gb/s SATA
RNDSecurity Erase
Pre-Conditioning
32Outstanding IO
OIO/Thread (QD)Device I/F
256 GB
Serial No.
1-5
Test Platform RTP 2.0 CTS 6.5
Firmware Rev %$"& Purge
MLC
Page 5 of 5
2X SEQ/128KiB SEQ 1024KiB
PC AR 100%
Workload Dep. SEQ 1024KiB
VENDOR: ABC CO.
SSD MODEL NO: MLC-A 256 GB
TEST SPONSOR
!"#$
%&#$
"!
&""!
'""!
(""!
)""!
*""!
+""!
",&""! &"","!
'()*+,(-
+.$/0
1234$
526$078$
SSS PTS Client Version 1.1 SNIA Technical Position 37
9 Latency Test 9.1 Latency Descriptive Note
General Purpose: Client Latency test is intended to measure the test SSD response time at 3 Block Sizes (8KiB, 4KiB and 0.5KiB) and 3 Read/Write mixes (100/0, 65/35, 0/100) using a limited preconditioning and limited Test ActiveRange Amount. This Latency test is intended to observe how well the test SSD handles a single OIO without the benefit of queueing. This Client Latency test is intended to present Average and Maximum Response Times (Latency) at a total outstanding IO of 1 (one Thread at a single OIO/Thread (Queue Depth)). The Latency measurement is inherently dependent on the treatment of the outstanding IOs by the host hardware and software test platform. An OIO of 1 is set to normalize the impact of the test system (as OIO >1 may be treated differently by different test hardware). Test Flow: The Client Latency test makes use of: 1) a limited preconditioning LBA range (section 2.1); 2) a two step Workload Independent PC (section 2.1.18.1) consisting of a) 128KiB SEQ W for 2X (twice) user capacity; and b) application of the Latency loop over ActiveRange (100% or 75%) until steady state, as defined, is achieved; 3) a one step Workload Dependent PC (WDPC) (section 2.1.18.2) consisting of the Latency loop using the ActiveRange Amount (8GiB or 16GiB) within the ActiveRange until Steady State, as defined, is achieved. Test Results: The test results captured during steady state measurement window shall be tabulated and plotted as specified in section 9.1. Test Interpretation: A lower value (lower msec) is better.
9.2 Latency Pseudo Code For (ActiveRange=100% and ActiveRange= 75%)
For (ActiveRange Amount=8GiB and ActiveRange Amount=16GiB) 1. Purge the device. (Note: ActiveRange and other Test Parameters are not
applicable to Purge step; any values can be used and none need to be reported.) 2. Workload Independent Preconditioning
2.1. Run SEQ Workload Independent Preconditioning 2.1.1. Set and record test conditions:
2.1.1.1. Device volatile write cache = disabled 2.1.1.2. OIO/Thread: 1 2.1.1.3. Thread Count: 1 2.1.1.4. Data Pattern: Required = Random, Optional = Test
Operator Choice 2.1.2. Run SEQ Workload Independent Preconditioning - Write 2X User
Capacity w/ 128KiB sequential writes, writing to the entire ActiveRange without other LBA restrictions.
2.2. Run RND WIPC – 2.2.1. Set and record test parameters:
2.2.1.1. Device volatile write cache = disabled 2.2.1.2. Thread Count: 1 2.2.1.3. OIO/Thread: 1

SSS PTS Client Version 1.1 SNIA Technical Position 38
2.2.1.4. Data Pattern: Required = Random, Optional = Test Operator Choice
2.2.2. For (R/W% = 100/0, 65/35, 0/100) 2.2.2.1. For (Block Size = 8KiB, 4KiB, 0.5KiB)
2.2.2.1.1. Execute random IO per (R/W%, Block Size), for 1 minute
2.2.2.1.2. Record Max and Ave Latency (R/W%, Block Size)
2.2.2.1.3. Use Ave Latency (R/W Mix%=0/100, Block Size=4KiB) to detect Steady State.
2.2.2.1.4. If Steady State is not reached by Round x=25, then the Test Operator may either continue running the test until Steady State is reached, or may stop the test at Round x. The Measurement Window to determine WIPC termination is defined as Round x-4 to Round x
2.2.2.2. End (For Block Size) Loop 2.2.3. End (For R/W%) Loop
3. Run Workload Dependent Preconditioning and Test stimulus 3.1. Set test parameters and record for later reporting.
3.1.1. Device volatile write cache = disabled 3.1.2. OIO/Thread: 1 3.1.3. Thread Count: 1. 3.1.4. Data Pattern: Required = Random, Optional = Test Operator
Choice 3.1.5. Active Range Segmentation Configuration:
3.1.5.1. Number of ActiveRange Segments = 2048 3.1.5.2. ActiveRange Segment Size = ActiveRange Amount divided
by 2048 3.1.5.3. Distribution of ActiveRange Segments: randomly
distributed within the entire ActiveRange. The ActiveRange Segments are not allowed to touch.
3.2. Run the following test loop until Steady State is reached, or maximum of 25 Rounds:
3.2.1. For (R/W Mix % = 100/0, 65/35, 0/100) 3.2.1.1. For (Block Size = 0.5 KiB, 4KiB, 8KiB)
3.2.1.1.1. Execute RND IO, per (R/W Mix %, Block Size), for 1 minute
3.2.1.1.2. Record Max and Ave Latency (R/W Mix%, Block Size)
3.2.1.1.3. Use AVE Latency(R//W Mix% = 0/100, Block Size = 4KiB) to detect Steady State.
3.2.1.1.4. If Steady State is not reached by Round x=25, then the Test Operator may either continue running the test until Steady State is reached, or may stop the test at Round x. The Measurement Window is defined as Round x-4 to Round x.
3.2.1.2. End (For Block Size) Loop 3.2.2. End (For R/W Mix %) Loop
End (For ActiveRange Amount) Loop
End (For ActiveRange) Loop 4. Process and plot the accumulated Rounds data, per report guidelines in next section, based
on current values of ActiveRange etc.

SSS PTS Client Version 1.1 SNIA Technical Position 39
9.3 Test Specific Reporting for Latency Test The following sub-sections list the reporting requirements specific to the Latency test. Reporting requirements common to all tests are documented in Section 5, General Reporting Requirements.
9.3.1 Purge The Test Operator shall report the method used to run the Purge operation.
9.3.2 Preconditioning Report The Test Operator shall report both Workload Independent and Workload Dependent preconditioning information as shown in the Report Headers that follow.
9.3.3 Steady State Convergence Report The Test Operator shall generate a Steady State Convergence plot as follows including the test set up and parameters set forth in the Report Header (see Annex A):
Plot 9-1: LAT SS Convergence Report
12345678
Workload Independent
2X SEQ/128KiB RND LAT Loop
PC AR 100%
6 Gb/s SATA
RTP 2.0 CTS 6.5 Workload Dep. Full Latency Loop 2048
OIO/Thread (QD)
Device Under Test (DUT)
VENDOR: ABC CO.
SSD MODEL NO: MLC-A 256 GB
TEST SPONSOR
Serial No. !""""#""""#$$$$ DUT Preparation%$"& Purge Security Erase
Test Loop ParametersFirmware Rev
Capacity 256 GB Pre-ConditioningMLC
0.51
0.37 0.520.37 0.52
0.31 0.520.31 0.57
0.37 0.500.34 0.58
0.91
Steady State
RoundsREQUIRED: Convergence
Data Pattern 4-8
YES
RNDOutstanding IO
0.31 0.520.31
0.91
1.02
PTS-C 1.0
0.920.910.910.91
Client - Steady State Convergence Plot – AVE Latency - 100% Writes
1
Test Run Date: 11/11/2011 09:53 AM Report Run Date: 11/15/2011 03:34 PM
Thread Count (TC) 1
"'(&
0.91
AR AMOUNT 16 GiB
Test Platform
NAND Type
AR Segments
Device I/F
Client Latency (REQUIRED) - Report Page
SNIA SSS TWG: Solid State Storage Performance Test Specification (PTS)Rev.Page 1 of 6
"'""!
"')"!
"'*"!
"'+"!
"',"!
&'""!
&')"!
&! )! (! *! -! +! .! ,! /!
!"#$%&#
'(%
)*+,-%
012"3&""4!%52"'-6! 012"3&""4!%52*6! 012"3&""4!%52,6!

SSS PTS Client Version 1.1 SNIA Technical Position 40
9.3.4 Steady State Verification Report The Test Operator shall document the following for Steady State Verification, using Ave 4KiB Random Write Latency (ms) as the dependent variable:
• Measurement Window: Start __; End __ • Ave. value in Measurement Window: __ • Calculated allowed range in Measurement Window (+-10% of Ave.): Max__; Min __ • Measured range in Measurement Window: Max __; Min __ (pass/fail) • Slope of best linear fit in Measurement Window (must be <= 10%): __% (pass/fail) • Correlation coefficient for best linear fit: __
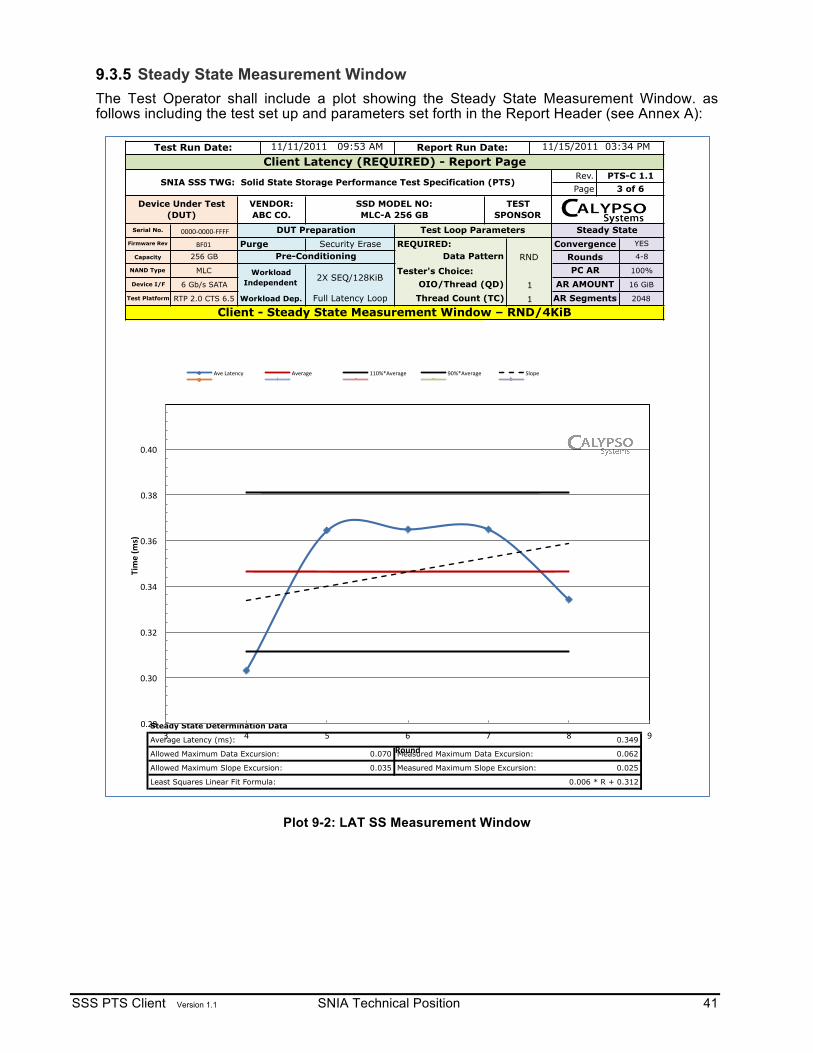
SSS PTS Client Version 1.1 SNIA Technical Position 41
9.3.5 Steady State Measurement Window The Test Operator shall include a plot showing the Steady State Measurement Window. as follows including the test set up and parameters set forth in the Report Header (see Annex A):
Plot 9-2: LAT SS Measurement Window
4 4
5 8
678
0.348646 0.3835106 0.3137814
Test Platform
Device I/F
Firmware Rev
Capacity
0.348646 0.3835106 0.3137814
Least Squares Linear Fit Formula: 0.006 * R + 0.312
Allowed Maximum Data Excursion:
Steady State Determination Data
Allowed Maximum Slope Excursion: Measured Maximum Slope Excursion:
0.070
0.035
0.349
0.062
0.025
Measured Maximum Data Excursion:
Average Latency (ms):
2048
Client - Steady State Measurement Window – RND/4KiB0.31
0.37
0.370.370.34
6 Gb/s SATA
RTP 2.0 CTS 6.5 Workload Dep. Full Latency Loop
!"#$ Purge
Device Under Test (DUT)
VENDOR: ABC CO.
SSD MODEL NO: MLC-A 256 GB
TEST SPONSOR
Serial No. %####&####&"""" DUT Preparation
Page 3 of 6
11/15/2011 03:34 PMTest Run Date: 11/11/2011 09:53 AM Report Run Date:
Steady State
Client Latency (REQUIRED) - Report Page
SNIA SSS TWG: Solid State Storage Performance Test Specification (PTS)Rev. PTS-C 1.1
1 AR Segments
REQUIRED: Convergence
NAND Type PC AR 100%
0.361024
Pre-ConditioningMLC Workload
Independent 2X SEQ/128KiB
256 GB 4-8
AR AMOUNT 16 GiB1
Data Pattern RND Rounds
OIO/Thread (QD)
YESSecurity EraseTest Loop Parameters
0.336269
Thread Count (TC)
Tester's Choice:
#'()%
#'*#%
#'*(%
#'*+%
#'*,%
#'*)%
#'+#%
*% +% -% ,% .% )% /%
!"#$%&#
'(%
)*+,-%
012%3452678% 01294:2% $$#;<01294:2% /#;<01294:2% =>?@2%
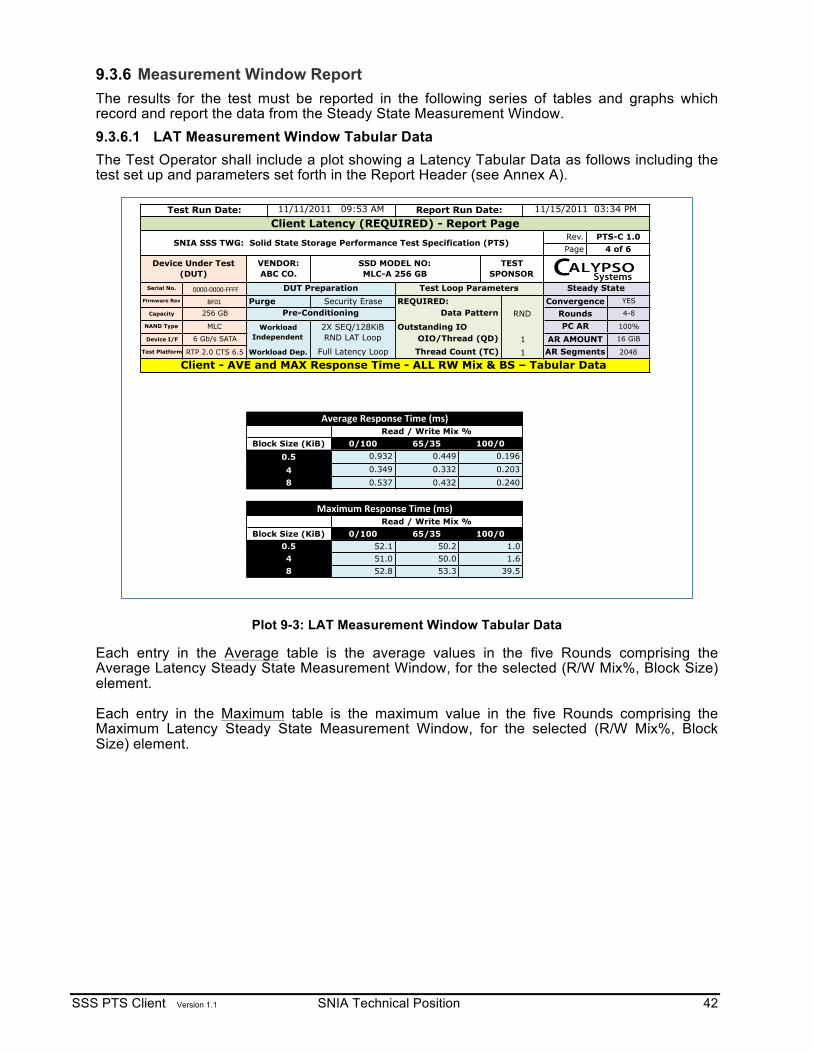
SSS PTS Client Version 1.1 SNIA Technical Position 42
9.3.6 Measurement Window Report The results for the test must be reported in the following series of tables and graphs which record and report the data from the Steady State Measurement Window. 9.3.6.1 LAT Measurement Window Tabular Data The Test Operator shall include a plot showing a Latency Tabular Data as follows including the test set up and parameters set forth in the Report Header (see Annex A).
Plot 9-3: LAT Measurement Window Tabular Data
Each entry in the Average table is the average values in the five Rounds comprising the Average Latency Steady State Measurement Window, for the selected (R/W Mix%, Block Size) element.
Each entry in the Maximum table is the maximum value in the five Rounds comprising the Maximum Latency Steady State Measurement Window, for the selected (R/W Mix%, Block Size) element.
Read / Write Mix %0/100
51.0 50.048
1.653.3 39.5
50.2 1.0
0.5
0.4320.537
65/35 100/0
0.3320.240
0.449
52.8
52.1
Client - AVE and MAX Response Time - ALL RW Mix & BS – Tabular Data
Convergence
OIO/Thread (QD)
Read / Write Mix %
48
!"#$%&%'()*+,-*)'.$%)'/%*0
Block Size (KiB)0.5
AR AMOUNTAR Segments
0.2030.196
100/00/1000.932
Client Latency (REQUIRED) - Report PagePTS-C 1.0
4 of 6Rev.Page
SNIA SSS TWG: Solid State Storage Performance Test Specification (PTS)
Capacity Rounds
Device I/F
Device Under Test (DUT)
VENDOR: ABC CO.
SSD MODEL NO: MLC-A 256 GB
TEST SPONSOR
Serial No. !""""#""""#$$$$ DUT Preparation%$"& Purge Security EraseFirmware Rev
256 GB
MLC Workload Independent
Test Platform
REQUIRED:Steady StateTest Loop Parameters
YES
Data Pattern
Outstanding IO
Thread Count (TC) 1
16 GiB
2048
4-8RND
12X SEQ/128KiB RND LAT Loop
PC AR 100%
6 Gb/s SATA
RTP 2.0 CTS 6.5 Workload Dep. Full Latency Loop
Pre-ConditioningNAND Type
0.349
65/35Block Size (KiB)
12)3"4)'()*+,-*)'.$%)'/%*0
Test Run Date: 11/11/2011 09:53 AM Report Run Date: 11/15/2011 03:34 PM
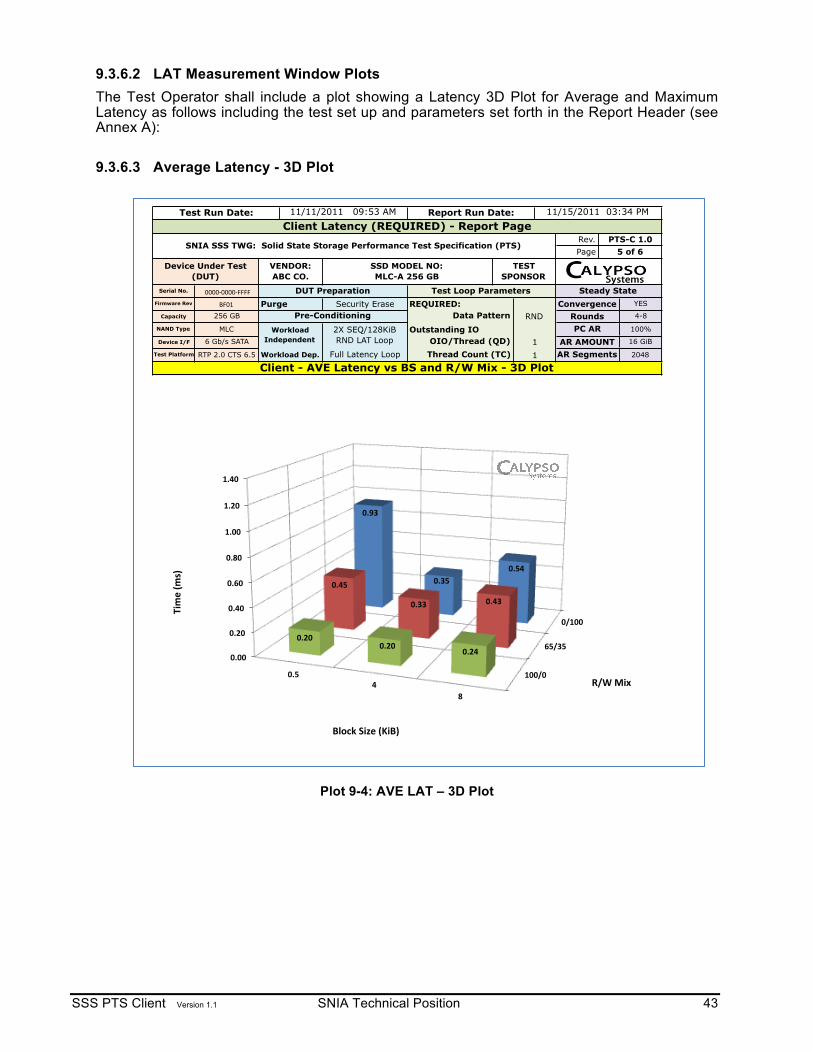
SSS PTS Client Version 1.1 SNIA Technical Position 43
9.3.6.2 LAT Measurement Window Plots The Test Operator shall include a plot showing a Latency 3D Plot for Average and Maximum Latency as follows including the test set up and parameters set forth in the Report Header (see Annex A): 9.3.6.3 Average Latency - 3D Plot
Plot 9-4: AVE LAT – 3D Plot
Device Under Test (DUT)
VENDOR: ABC CO.
SSD MODEL NO: MLC-A 256 GB
TEST SPONSOR
Outstanding IORounds
Convergence
Page
MLC Workload Independent
2X SEQ/128KiB RND LAT Loop
PC AR
Client Latency (REQUIRED) - Report PageRev. PTS-C 1.0
NAND Type
11/11/2011 09:53 AM
4-8
Serial No. !""""#""""#$$$$ DUT Preparation%$"& Purge Security Erase
256 GB Pre-Conditioning RNDYES
Data PatternCapacity
Firmware Rev
Steady StateREQUIRED:
Test Run Date: Report Run Date: 11/15/2011 03:34 PM
1
Test Loop Parameters
SNIA SSS TWG: Solid State Storage Performance Test Specification (PTS)5 of 6
100%
6 Gb/s SATA
AR Segments 2048RTP 2.0 CTS 6.5 Workload Dep. Full Latency Loop
Client - AVE Latency vs BS and R/W Mix - 3D PlotThread Count (TC)
AR AMOUNT 16 GiB
Test Platform
Device I/F 1OIO/Thread (QD)
!"#!!$
%&"'&$
#!!"!$
!(!!$
!()!$
!(*!$
!(%!$
!(+!$
#(!!$
#()!$
#(*!$
!(&$*$
+$
!(,'$
!('&$!(&*$
!(*&$
!(''$ !(*'$
!()!$!()!$
!()*$
-".$/01$
2034$53
67$
89:;<$=0>4$5?087$
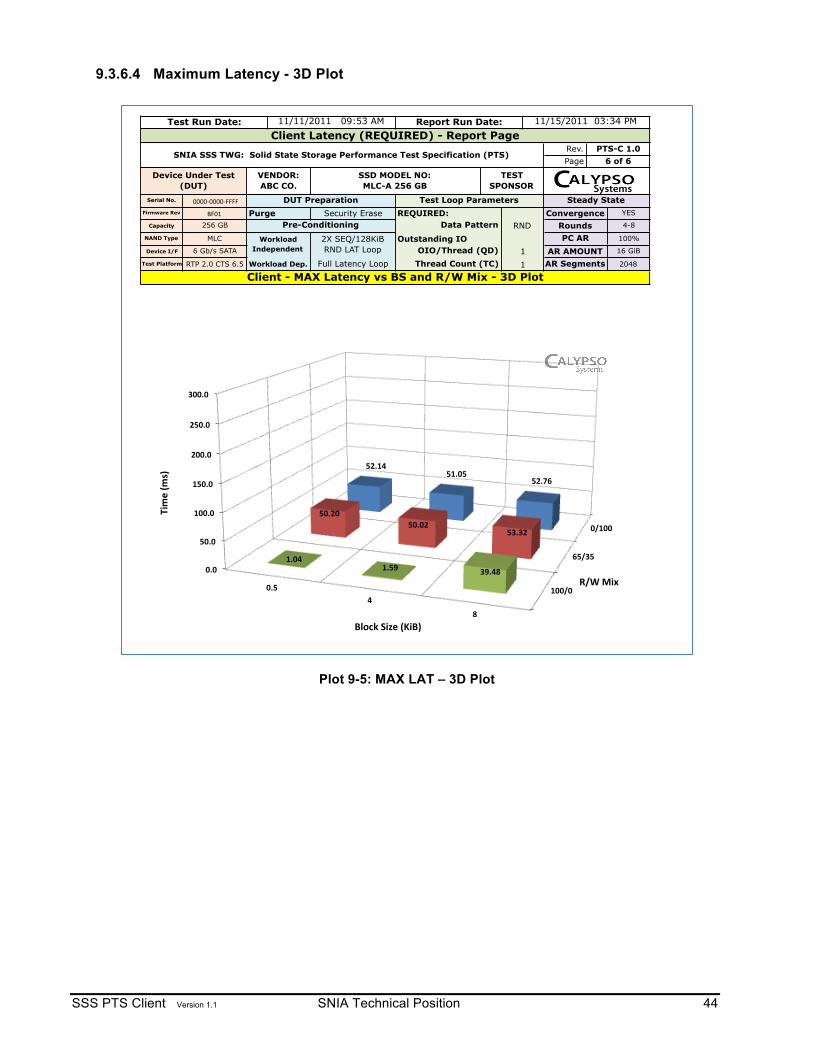
SSS PTS Client Version 1.1 SNIA Technical Position 44
9.3.6.4 Maximum Latency - 3D Plot
Plot 9-5: MAX LAT – 3D Plot
RND!"#$ Purge Security Erase
256 GB Pre-ConditioningMLC Workload
Independent 1
REQUIRED:
Outstanding IO
YES
Capacity Data Pattern
Client - MAX Latency vs BS and R/W Mix - 3D Plot
AR AMOUNT 16 GiBDevice I/F OIO/Thread (QD)
Rounds 4-8
1 AR Segments 2048
Convergence
Rev.
Test Platform Thread Count (TC)
NAND Type 2X SEQ/128KiB RND LAT Loop
PC AR 100%
6 Gb/s SATA
RTP 2.0 CTS 6.5
Page 6 of 6
11/15/2011 03:34 PM
Workload Dep. Full Latency Loop
Device Under Test (DUT)
VENDOR: ABC CO.
SSD MODEL NO: MLC-A 256 GB
TEST SPONSOR
Serial No. %####&####&"""" DUT Preparation Test Loop Parameters
Report Run Date:
Firmware Rev
Steady State
Test Run Date: 11/11/2011 09:53 AM
PTS-C 1.0Client Latency (REQUIRED) - Report Page
SNIA SSS TWG: Solid State Storage Performance Test Specification (PTS)
!"#!!$
%&"'&$
#!!"!$
!(!$
&!(!$
#!!(!$
#&!(!$
)!!(!$
)&!(!$
'!!(!$
!(&$*$
+$
&)(#*$&#(!&$
&)(,%$
&!()!$&!(!)$
&'(')$
#(!*$#(&-$ '-(*+$
."/$012$
3145$64
78$
9:;<=$>1?5$6@198$
SSS PTS Client Version 1.1 SNIA Technical Position 45
10 Write Saturation Test - Optional 10.1 WSAT Descriptive Note
General Description: Client WSAT test is intended to measure the test SSD IOPS at a 4KiB Block Size at 100% Write Read/Write mix using a limited preconditioning and limited Test ActiveRange Amount. This Client WSAT test is intended to emulate characteristics of Client workloads that are limited in the ways in which the LBAs are accessed compared to Enterprise workloads. Test Flow: The Client WSAT test makes use of: 1) a limited preconditioning LBA range (section 2.1); 2) a one step Workload Dependent PC (WDPC) (section 2.1.18.2) consisting of RND 4KiB 100% Writes using the ActiveRange Amount (8GiB or 16GiB) within the ActiveRange until specified termination conditions are met (4X, or four times, the user capacity or 24 hours, whichever occurs first). Test Results: The test results captured during the WSAT test shall be tabulated and plotted as specified in section 10 and are intended to present the IOPS performance over Time and Total Gigabytes Written. Test Interpretation: The test operator is encouraged to observe the initial peak IOPS values, the shape and length of the Transition Zones, and the level of IOPS at the “WSAT Steady State.” Less drop off from peak FOB IOPS and a more level WSAT Steady State (see definitions) with a smaller amplitude variation is better.
10.2 WSAT Pseudo Code For (ActiveRange(0:75), optional ActiveRange(Test Operator Choice))
For (ActiveRange Amount=8GiB and ActiveRange Amount=16GiB)
1 Purge the device. (Note: Active Range and other Test Parameters are not applicable to Purge step; any values can be used and none need to be reported.)
2 Run Test stimulus. Set test parameters and record for later reporting
2.1 Set and record test conditions: 2.1.1 Device volatile write cache = Disabled 2.1.2 OIO/Thread: Test Operator Choice. 2.1.3 Thread Count: Test Operator Choice. 2.1.4 Data Pattern: Required= Random, Optional = Test Operator Choice. 2.1.5 Active Range Segmentation Configuration:
2.1.5.1 Number of ActiveRange Segments = 2048 2.1.5.2 ActiveRange Segment Size = ActiveRange Amount divided by 2048 2.1.5.3 Distribution of ActiveRange Segments: randomly distributed within the
entire ActiveRange. The ActiveRange Segments are not allowed to touch.
2.2 Run the following test stimulus until 4X User Capacity is written, or 24 hours, whichever occurs first.
2.2.1 Execute RND IO (R/W Mix 100% W, Block Size 4KiB), for 1 minute 2.2.2 Record Ave IOPS, Max and Ave Latency
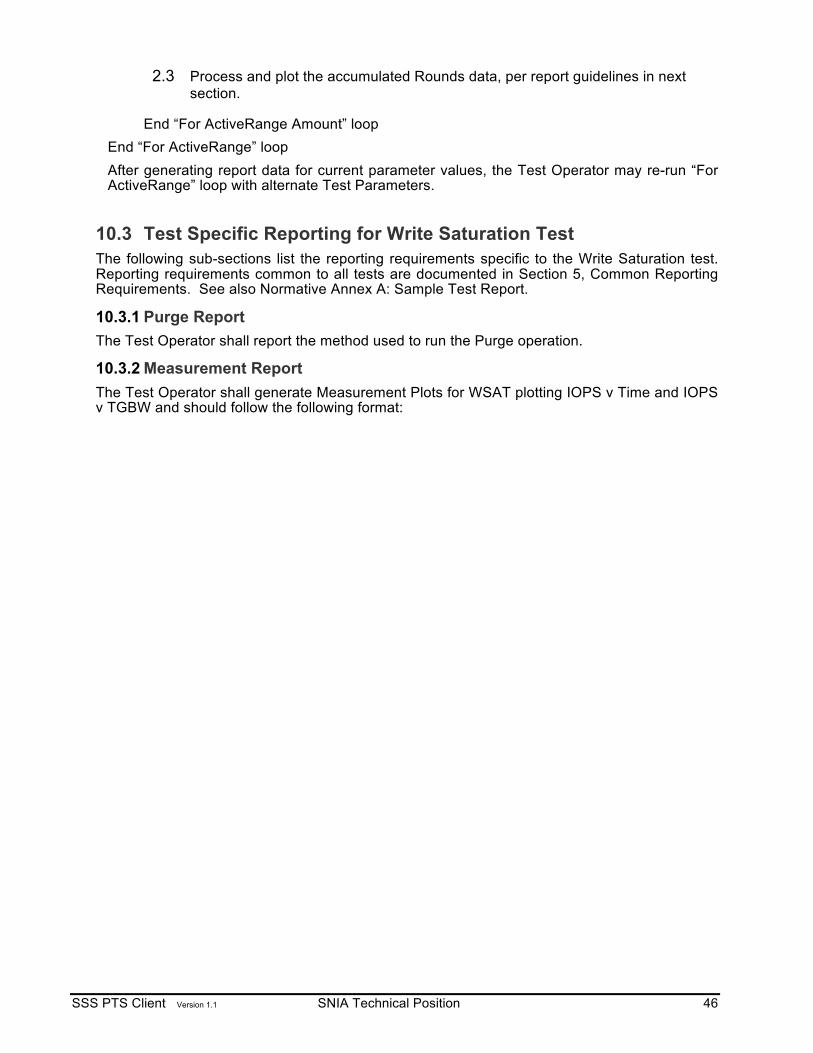
SSS PTS Client Version 1.1 SNIA Technical Position 46
2.3 Process and plot the accumulated Rounds data, per report guidelines in next section.
End “For ActiveRange Amount” loop
End “For ActiveRange” loop After generating report data for current parameter values, the Test Operator may re-run “For ActiveRange” loop with alternate Test Parameters.
10.3 Test Specific Reporting for Write Saturation Test The following sub-sections list the reporting requirements specific to the Write Saturation test. Reporting requirements common to all tests are documented in Section 5, Common Reporting Requirements. See also Normative Annex A: Sample Test Report.
10.3.1 Purge Report The Test Operator shall report the method used to run the Purge operation.
10.3.2 Measurement Report The Test Operator shall generate Measurement Plots for WSAT plotting IOPS v Time and IOPS v TGBW and should follow the following format:
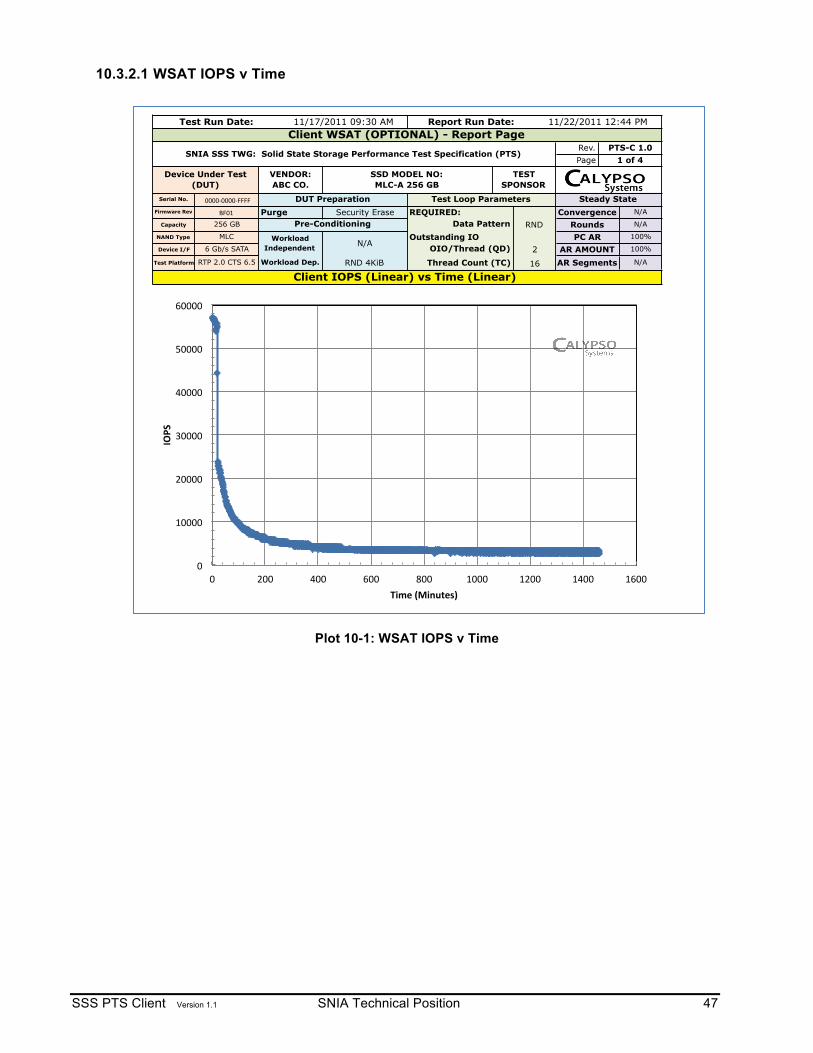
SSS PTS Client Version 1.1 SNIA Technical Position 47
10.3.2.1 WSAT IOPS v Time
Plot 10-1: WSAT IOPS v Time
PTS-C 1.0
Workload Dep. Thread Count (TC)
Purge Security Erase
NAND Type
Capacity
Device I/F
Workload Independent N/A
MLC Outstanding IOOIO/Thread (QD)6 Gb/s SATA
REQUIRED:
Report Run Date:Test Run Date:
Device Under Test (DUT)
VENDOR: ABC CO.
Client WSAT (OPTIONAL) - Report Page
SNIA SSS TWG: Solid State Storage Performance Test Specification (PTS)Rev.
SSD MODEL NO: MLC-A 256 GB
TEST SPONSOR
Page 1 of 4
RND Rounds
AR AMOUNT
11/22/2011 12:44 PM
N/A
2
11/17/2011 09:30 AM
DUT Preparation
Pre-Conditioning
Steady State
RND 4KiB
Client IOPS (Linear) vs Time (Linear) Test Platform
Serial No. !""""#""""#$$$$Firmware Rev %$"&
PC AR 100%
N/AData Pattern
16
256 GB
RTP 2.0 CTS 6.5 AR Segments
N/A
100%
ConvergenceTest Loop Parameters
"!
&""""!
'""""!
(""""!
)""""!
*""""!
+""""!
"! '""! )""! +""! ,""! &"""! &'""! &)""! &+""!
!"#$%
&'()%*+',-.)/0%
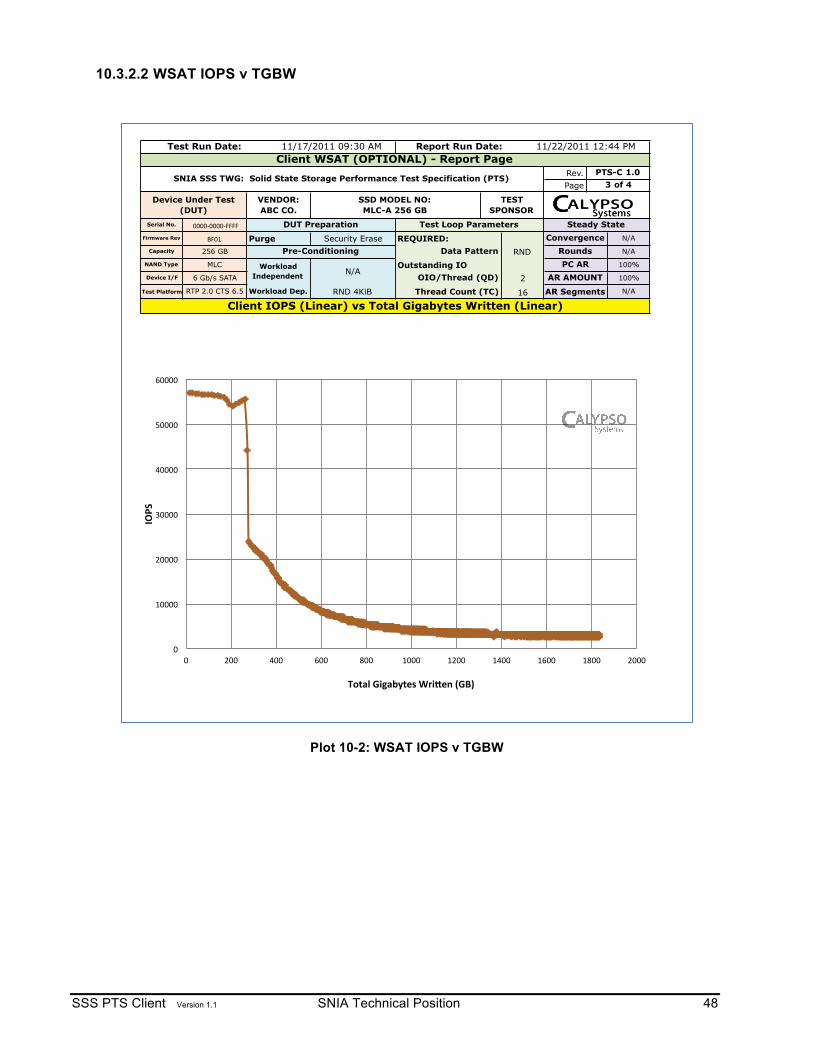
SSS PTS Client Version 1.1 SNIA Technical Position 48
10.3.2.2 WSAT IOPS v TGBW
Plot 10-2: WSAT IOPS v TGBW
Page
Convergence
11/22/2011 12:44 PM
256 GB
Serial No. !""""#""""#$$$$ DUT Preparation Test Loop Parameters
SSD MODEL NO: MLC-A 256 GB
TEST SPONSOR
Client WSAT (OPTIONAL) - Report Page
N/A
Device Under Test (DUT)
VENDOR: ABC CO.
Test Run Date: Report Run Date:
2 AR AMOUNT 100%
Outstanding IO
Data Pattern
3 of 4
Steady State
Rev. PTS-C 1.0SNIA SSS TWG: Solid State Storage Performance Test Specification (PTS)
PC AR 100%
11/17/2011 09:30 AM
Purge
NAND Type MLC Workload Independent N/A
Pre-ConditioningREQUIRED:
RND 4KiB
Security EraseFirmware Rev %$"&
N/ARND Rounds
16 N/A
OIO/Thread (QD)
Client IOPS (Linear) vs Total Gigabytes Written (Linear)Test Platform
Device I/F
AR SegmentsThread Count (TC)
6 Gb/s SATA
RTP 2.0 CTS 6.5 Workload Dep.
Capacity
"!
&""""!
'""""!
(""""!
)""""!
*""""!
+""""!
"! '""! )""! +""! ,""! &"""! &'""! &)""! &+""! &,""! '"""!
!"#$%
&'()*%+,-)./(01%23,405%6+78%
SSS PTS Client Version 1.1 SNIA Technical Position 49
11 Normative Annex A – Sample Test Report The following is a sample PTS-C SNIA Test Report which includes Informative Summary Pages (Summary Page – All Tests and Summary Page – Individual Report (WSAT, IOPS, Throughput, Latency)) and Normative Individual Reports (Optional WSAT test and Required IOPS, Throughput and Latency test reports). Informative Summary Pages contain information compiled for the convenience of the test sponsor. Normative Individual Report Pages contain mandatory Report Headers on each page that set forth required reporting information pertinent to the tests presented on the particular page(s).
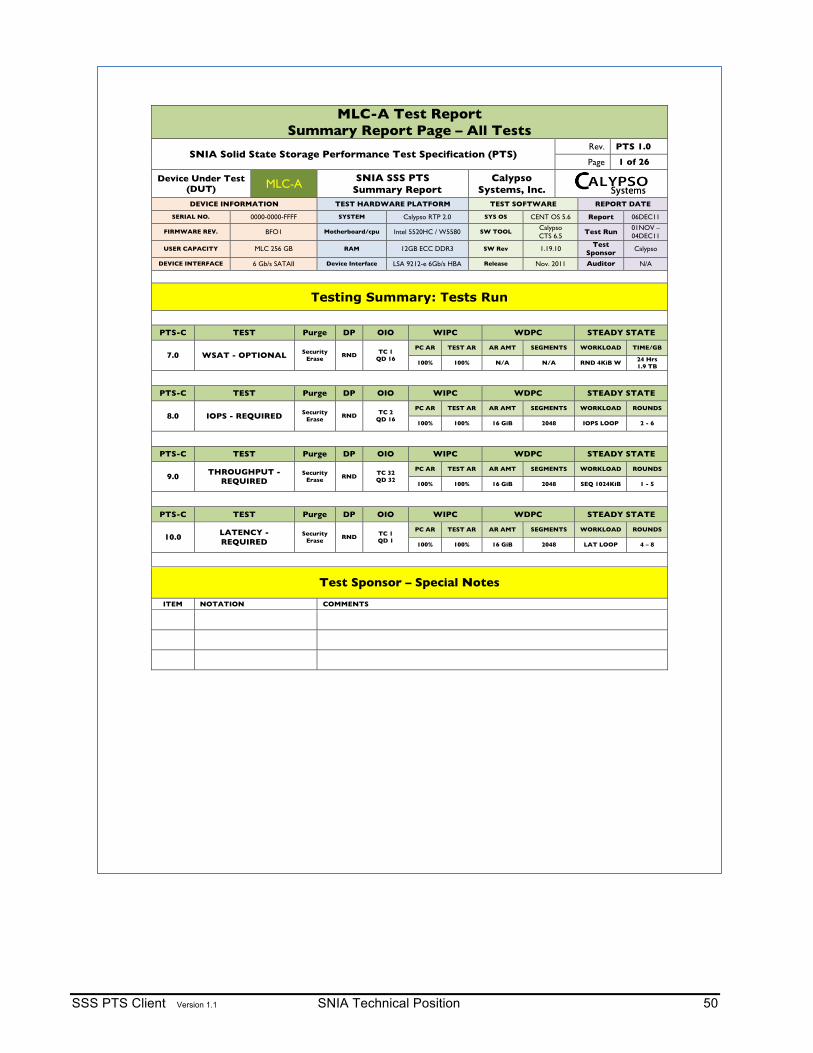
SSS PTS Client Version 1.1 SNIA Technical Position 50
MLC-A Test Report Summary Report Page – All Tests
SNIA Solid State Storage Performance Test Specification (PTS) Rev. PTS 1.0
Page 1 of 26
Device Under Test (DUT) MLC-A SNIA SSS PTS
Summary Report Calypso
Systems, Inc. DEVICE INFORMATION TEST HARDWARE PLATFORM TEST SOFTWARE REPORT DATE
SERIAL NO. 0000-0000-FFFF SYSTEM Calypso RTP 2.0 SYS OS CENT OS 5.6 Report 06DEC11
FIRMWARE REV. BFO1 Motherboard/cpu Intel 5520HC / W5580 SW TOOL Calypso CTS 6.5
Test Run 01NOV – 04DEC11
USER CAPACITY MLC 256 GB RAM 12GB ECC DDR3 SW Rev 1.19.10 Test
Sponsor Calypso
DEVICE INTERFACE 6 Gb/s SATAII Device Interface LSA 9212-e 6Gb/s HBA Release Nov. 2011 Auditor N/A
Testing Summary: Tests Run
PTS-C TEST Purge DP OIO WIPC WDPC STEADY STATE
7.0 WSAT - OPTIONAL Security Erase
RND TC 1 QD 16
PC AR TEST AR AR AMT SEGMENTS WORKLOAD TIME/GB
100% 100% N/A N/A RND 4KiB W 24 Hrs 1.9 TB
PTS-C TEST Purge DP OIO WIPC WDPC STEADY STATE
8.0 IOPS - REQUIRED Security Erase
RND TC 2 QD 16
PC AR TEST AR AR AMT SEGMENTS WORKLOAD ROUNDS
100% 100% 16 GiB 2048 IOPS LOOP 2 - 6
PTS-C TEST Purge DP OIO WIPC WDPC STEADY STATE
9.0 THROUGHPUT - REQUIRED
Security Erase RND
TC 32 QD 32
PC AR TEST AR AR AMT SEGMENTS WORKLOAD ROUNDS
100% 100% 16 GiB 2048 SEQ 1024KiB 1 - 5
PTS-C TEST Purge DP OIO WIPC WDPC STEADY STATE
10.0 LATENCY - REQUIRED
Security Erase
RND TC 1 QD 1
PC AR TEST AR AR AMT SEGMENTS WORKLOAD ROUNDS
100% 100% 16 GiB 2048 LAT LOOP 4 – 8
Test Sponsor – Special Notes
ITEM NOTATION COMMENTS
!!!!!!!!!!!!
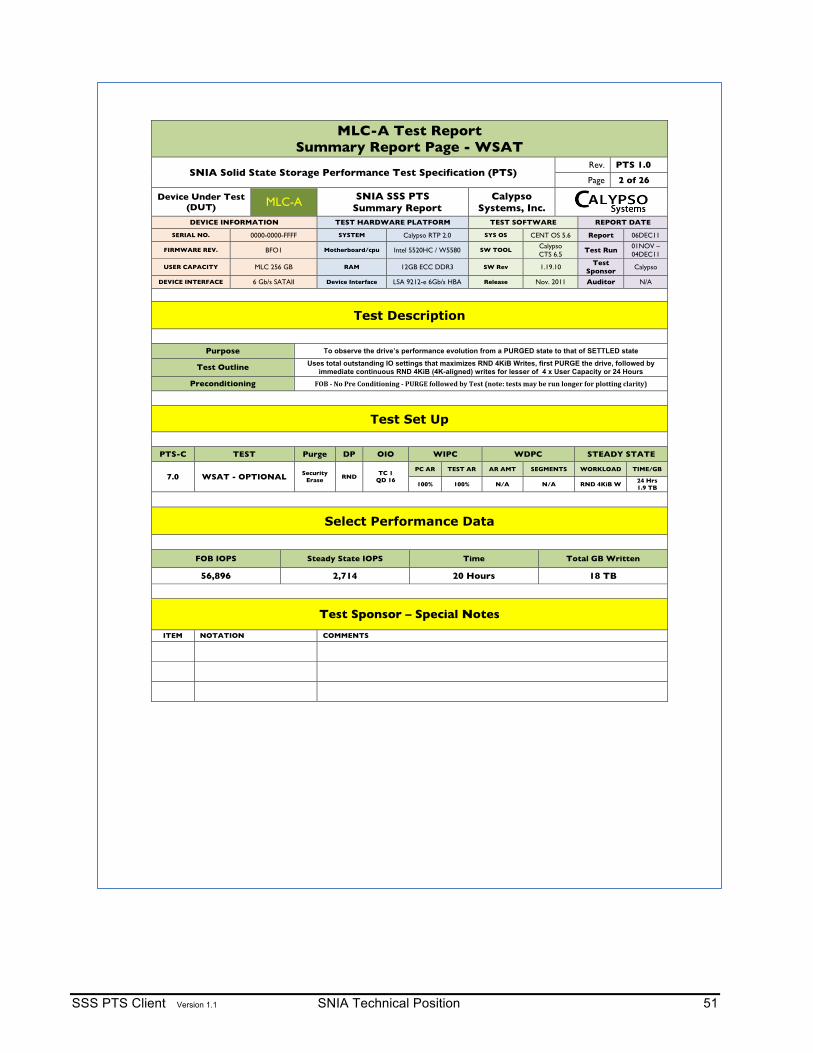
SSS PTS Client Version 1.1 SNIA Technical Position 51
MLC-A Test Report Summary Report Page - WSAT
SNIA Solid State Storage Performance Test Specification (PTS) Rev. PTS 1.0
Page 2 of 26
Device Under Test (DUT) MLC-A SNIA SSS PTS
Summary Report Calypso
Systems, Inc. DEVICE INFORMATION TEST HARDWARE PLATFORM TEST SOFTWARE REPORT DATE
SERIAL NO. 0000-0000-FFFF SYSTEM Calypso RTP 2.0 SYS OS CENT OS 5.6 Report 06DEC11
FIRMWARE REV. BFO1 Motherboard/cpu Intel 5520HC / W5580 SW TOOL Calypso CTS 6.5
Test Run 01NOV – 04DEC11
USER CAPACITY MLC 256 GB RAM 12GB ECC DDR3 SW Rev 1.19.10 Test
Sponsor Calypso
DEVICE INTERFACE 6 Gb/s SATAII Device Interface LSA 9212-e 6Gb/s HBA Release Nov. 2011 Auditor N/A
Test Description
Purpose To observe the drive’s performance evolution from a PURGED state to that of SETTLED state Test Outline Uses total outstanding IO settings that maximizes RND 4KiB Writes, first PURGE the drive, followed by
immediate continuous RND 4KiB (4K-aligned) writes for lesser of 4 x User Capacity or 24 Hours Preconditioning !"#$%$&'$()*$+',-./.',.,0$%$(1234$5'66'7*-$89$:*;/$<,'/*=$/*;/;$>?9$8*$)@,$6',0*)$5')$A6'//.,0$B6?)./9C
Test Set Up
PTS-C TEST Purge DP OIO WIPC WDPC STEADY STATE
7.0 WSAT - OPTIONAL Security Erase RND
TC 1 QD 16
PC AR TEST AR AR AMT SEGMENTS WORKLOAD TIME/GB
100% 100% N/A N/A RND 4KiB W 24 Hrs 1.9 TB
Select Performance Data
FOB IOPS Steady State IOPS Time Total GB Written
56,896 2,714 20 Hours 18 TB
Test Sponsor – Special Notes
ITEM NOTATION COMMENTS
!! !
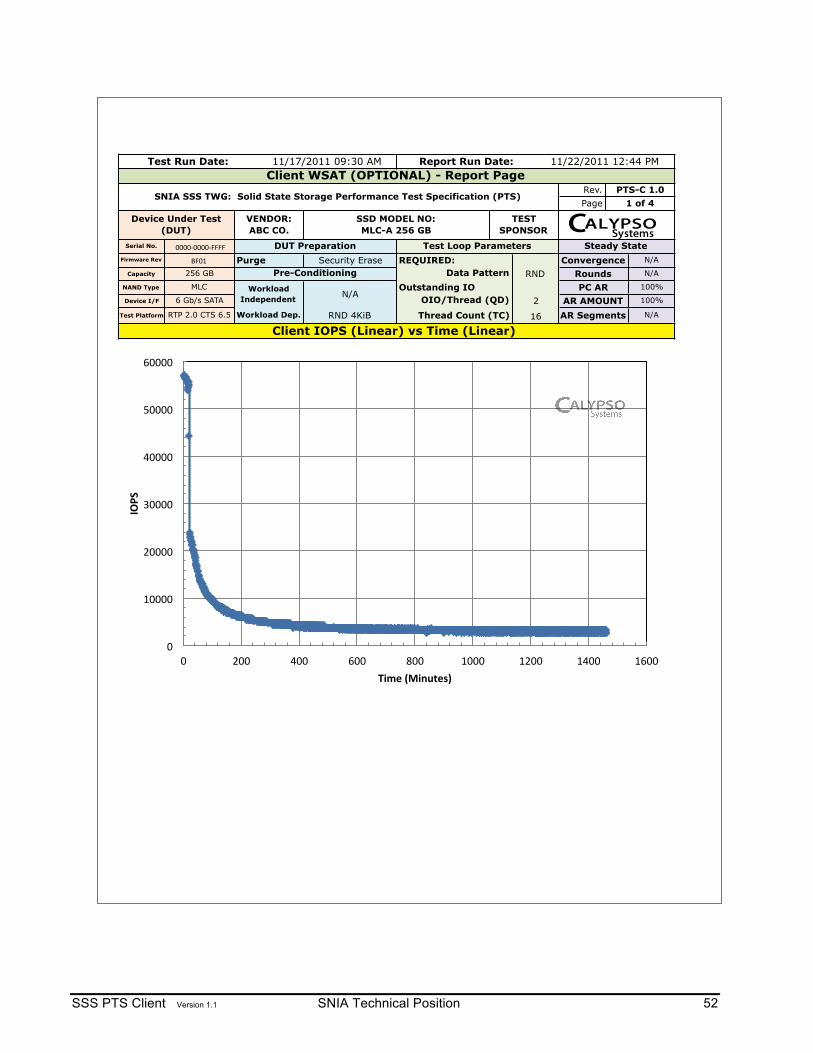
SSS PTS Client Version 1.1 SNIA Technical Position 52
PTS-C 1.0
Workload Dep. Thread Count (TC)
Purge Security Erase
NAND Type
Capacity
Device I/F
Workload Independent N/A
MLC Outstanding IOOIO/Thread (QD)6 Gb/s SATA
REQUIRED:
Report Run Date:Test Run Date:
Device Under Test (DUT)
VENDOR: ABC CO.
Client WSAT (OPTIONAL) - Report Page
SNIA SSS TWG: Solid State Storage Performance Test Specification (PTS)Rev.
SSD MODEL NO: MLC-A 256 GB
TEST SPONSOR
Page 1 of 4
RND Rounds
AR AMOUNT
11/22/2011 12:44 PM
N/A
2
11/17/2011 09:30 AM
DUT Preparation
Pre-Conditioning
Steady State
RND 4KiB
Client IOPS (Linear) vs Time (Linear) Test Platform
Serial No. !""""#""""#$$$$Firmware Rev %$"&
PC AR 100%
N/AData Pattern
16
256 GB
RTP 2.0 CTS 6.5 AR Segments
N/A
100%
ConvergenceTest Loop Parameters
"!
&""""!
'""""!
(""""!
)""""!
*""""!
+""""!
"! '""! )""! +""! ,""! &"""! &'""! &)""! &+""!
!"#$%
&'()%*+',-.)/0%
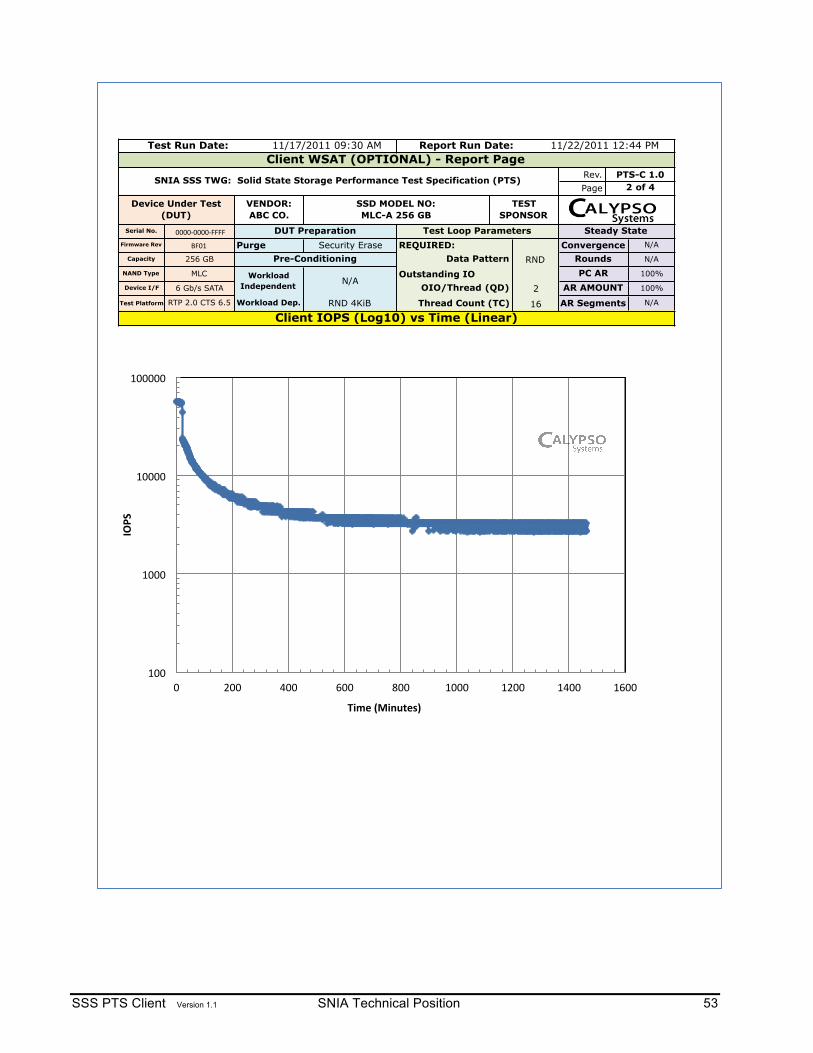
SSS PTS Client Version 1.1 SNIA Technical Position 53
SSD MODEL NO: MLC-A 256 GB
TEST SPONSOR
N/A
Client IOPS (Log10) vs Time (Linear)RND 4KiB 16
AR AMOUNT 100%2
ConvergenceRounds
N/A
N/ARND
Client WSAT (OPTIONAL) - Report Page
SNIA SSS TWG: Solid State Storage Performance Test Specification (PTS) Rev.Page 2 of 4
Device I/F 6 Gb/s SATA OIO/Thread (QD)
NAND Type MLC Workload Independent N/A
100%PC AR
DUT Preparation
Test Platform RTP 2.0 CTS 6.5 Workload Dep. Thread Count (TC)
Outstanding IO
Test Loop Parameters
Capacity 256 GB Pre-Conditioning Data Pattern
AR Segments
Report Run Date:
PTS-C 1.0
REQUIRED:Purge
Test Run Date: 11/17/2011 09:30 AM
Security Erase
Serial No. !""""#""""#$$$$Firmware Rev %$"&
11/22/2011 12:44 PM
Steady State
Device Under Test (DUT)
VENDOR: ABC CO.
&""!
&"""!
&""""!
&"""""!
"! '""! (""! )""! *""! &"""! &'""! &(""! &)""!
!"#$%
&'()%*+',-.)/0%
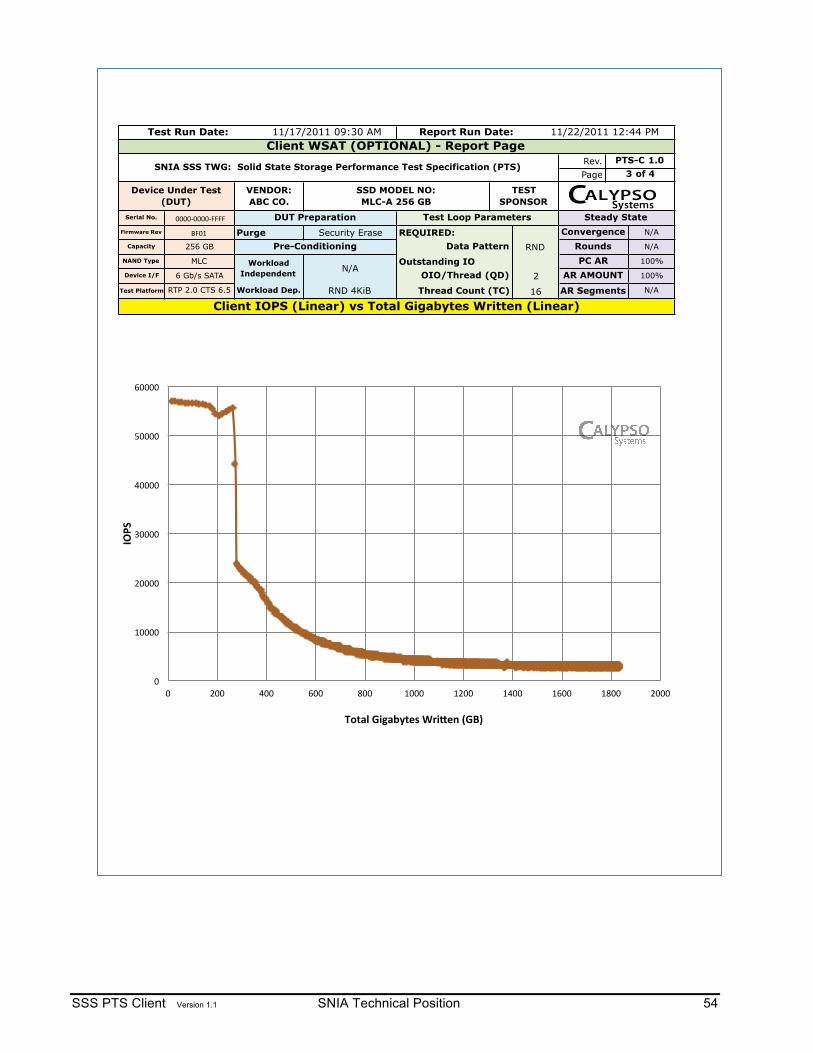
SSS PTS Client Version 1.1 SNIA Technical Position 54
Page
Convergence
11/22/2011 12:44 PM
256 GB
Serial No. !""""#""""#$$$$ DUT Preparation Test Loop Parameters
SSD MODEL NO: MLC-A 256 GB
TEST SPONSOR
Client WSAT (OPTIONAL) - Report Page
N/A
Device Under Test (DUT)
VENDOR: ABC CO.
Test Run Date: Report Run Date:
2 AR AMOUNT 100%
Outstanding IO
Data Pattern
3 of 4
Steady State
Rev. PTS-C 1.0SNIA SSS TWG: Solid State Storage Performance Test Specification (PTS)
PC AR 100%
11/17/2011 09:30 AM
Purge
NAND Type MLC Workload Independent N/A
Pre-ConditioningREQUIRED:
RND 4KiB
Security EraseFirmware Rev %$"&
N/ARND Rounds
16 N/A
OIO/Thread (QD)
Client IOPS (Linear) vs Total Gigabytes Written (Linear)Test Platform
Device I/F
AR SegmentsThread Count (TC)
6 Gb/s SATA
RTP 2.0 CTS 6.5 Workload Dep.
Capacity
"!
&""""!
'""""!
(""""!
)""""!
*""""!
+""""!
"! '""! )""! +""! ,""! &"""! &'""! &)""! &+""! &,""! '"""!
!"#$%
&'()*%+,-)./(01%23,405%6+78%

SSS PTS Client Version 1.1 SNIA Technical Position 55
4 of 4
RTP 2.0 CTS 6.5
N/A
SNIA SSS TWG: Solid State Storage Performance Test Specification (PTS)
RoundsCapacity
Test Loop ParametersConvergence
Device I/F
TEST SPONSOR
SSD MODEL NO: MLC-A 256 GB
DUT Preparation
VENDOR: ABC CO.
Steady StateSerial No.
N/A
Device Under Test (DUT)
Client IOPS (Log10) vs Total Gigabytes Written (Lin)
AR AMOUNT
AR Segments
100%
N/A
26 Gb/s SATA
NAND Type
16
Outstanding IO
Thread Count (TC)
Data Pattern
OIO/Thread (QD)
Page
Client WSAT (OPTIONAL) - Report PageRev. PTS-C 1.0
RND
Workload Dep. RND 4KiB
REQUIRED:
Workload Independent
Pre-ConditioningPurge
256 GB
MLC
Test Platform
N/A
Security Erase!""""#""""#$$$$
Firmware Rev %$"&
PC AR 100%
11/22/2011 12:44 PMTest Run Date: 11/17/2011 09:30 AM Report Run Date:
&!
&"!
&""!
&"""!
&""""!
&"""""!
"! '""! (""! )""! *""! &"""! &'""! &(""! &)""! &*""! '"""!
!"#$%
&'()*%+,-)./(01%23,405%6+78%

SSS PTS Client Version 1.1 SNIA Technical Position 56
MLC-A Test Report Summary Report Page - IOPS
SNIA Solid State Storage Performance Test Specification (PTS) Rev. PTS 1.0
Page 7 of 26
Device Under Test (DUT) MLC-A SNIA SSS PTS
Summary Report Calypso
Systems, Inc. DEVICE INFORMATION TEST HARDWARE PLATFORM TEST SOFTWARE REPORT DATE
SERIAL NO. 0000-0000-FFFF SYSTEM Calypso RTP 2.0 SYS OS CENT OS 5.6 Report 06DEC11
FIRMWARE REV. BFO1 Motherboard/cpu Intel 5520HC / W5580 SW TOOL Calypso CTS 6.5
Test Run 01NOV – 04DEC11
USER CAPACITY MLC 256 GB RAM 12GB ECC DDR3 SW Rev 1.19.10 Test
Sponsor Calypso
DEVICE INTERFACE 6 Gb/s SATAII Device Interface LSA 9212-e 6Gb/s HBA Release Nov. 2011 Auditor N/A
Test Description
Purpose To measure RND IOPS matrix using different BS and R/W Mixes Test Outline PURGE, then apply preconditioning until Steady State is achieved according to the SNIA PTS
Preconditioning PURGE followed by SNIA PTS prescribed WIPC & WDPC
Test Set Up
PTS-C TEST Purge DP OIO WIPC WDPC STEADY STATE
8.0 IOPS - REQUIRED Security Erase RND
TC 2 QD 16
PC AR TEST AR AR AMT SEGMENTS WORKLOAD ROUNDS
100% 100% 16 GiB 2048 IOPS LOOP 2 - 6
Select Performance Data
RND 4KiB W RND 4KiB R RND 8KiB W RND 8KiB R
3,147 29,876 1,584 21,723
Test Sponsor – Special Notes
ITEM NOTATION COMMENTS
!!!!!!!!!!!
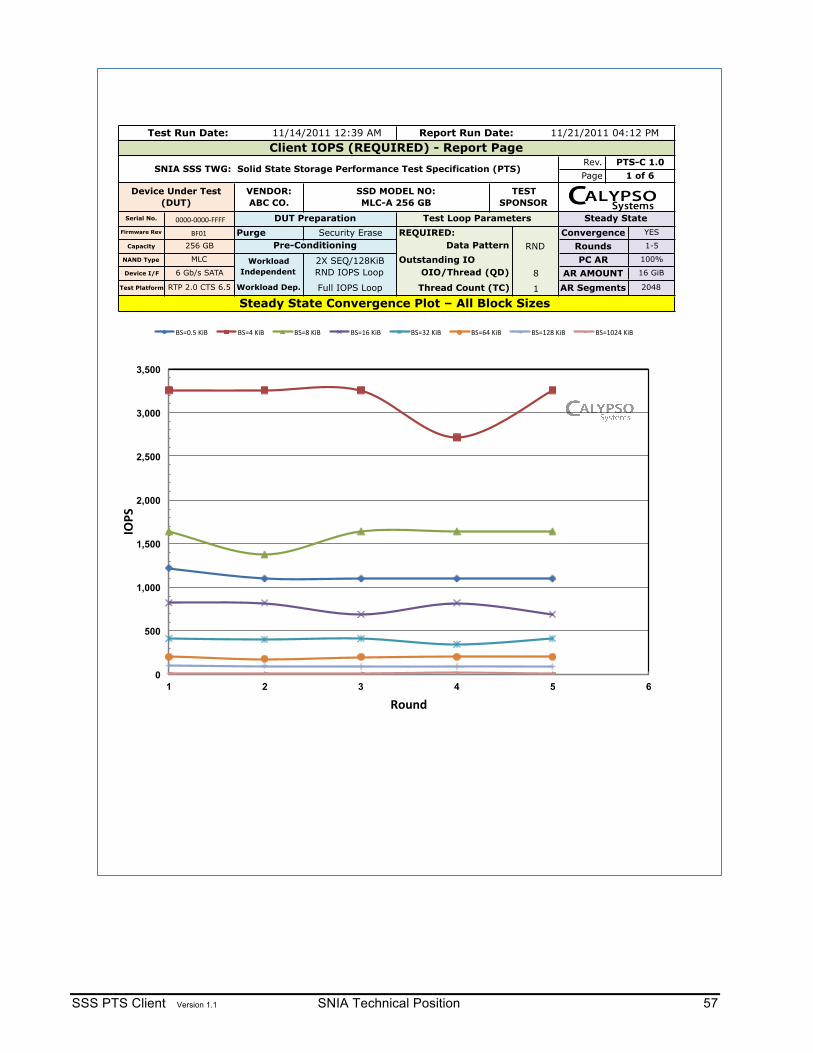
SSS PTS Client Version 1.1 SNIA Technical Position 57
12345
Test Run Date: 11/14/2011 12:39 AM Report Run Date: 11/21/2011 04:12 PM
Steady State Convergence Plot – All Block Sizes
8 AR AMOUNT 16 GiB
Test Platform RTP 2.0 CTS 6.5 Workload Dep. Full IOPS Loop Thread Count (TC) 1
Serial No.
Firmware Rev
!""""#""""#$$$$
%$"&
NAND Type MLC
AR Segments
1-5
Device I/F 6 Gb/s SATAWorkload
Independent2X SEQ/128KiB RND IOPS Loop
Outstanding IO
2048
OIO/Thread (QD)
Rounds100%PC AR
Client IOPS (REQUIRED) - Report Page
SNIA SSS TWG: Solid State Storage Performance Test Specification (PTS)Rev.Page 1 of 6
Device Under Test (DUT)
YES
VENDOR: ABC CO.
SSD MODEL NO: MLC-A 256 GB
TEST SPONSOR
DUT Preparation Test Loop ParametersPurge Security Erase REQUIRED: Convergence
Capacity 256 GB Pre-Conditioning Data Pattern
1220.981097.141097.971097.971097.41
3253.88 1371.77
3254.83 1636.59
817.42 395.00 176.20 95.98 15.863257.50 1640.21 819.63 410.45 203.45 98.33
687.90 407.65 202.72 15.94
3253.88 1637.12 687.92 407.24 199.12 86.3217.172715.14 1638.55 816.18 343.34
95.43200.55 86.34
PTS-C 1.0
15.20
17.62
Steady State
RND
0
500
1,000
1,500
2,000
2,500
3,000
3,500
1 2 3 4 5 6
!"#$%
&'()*%
%'(")*!+,%! %'(-!+,%! %'(.!+,%! %'(&/!+,%! %'(01!+,%! %'(/-!+,%! %'(&1.!+,%! %'(&"1-!+,%!
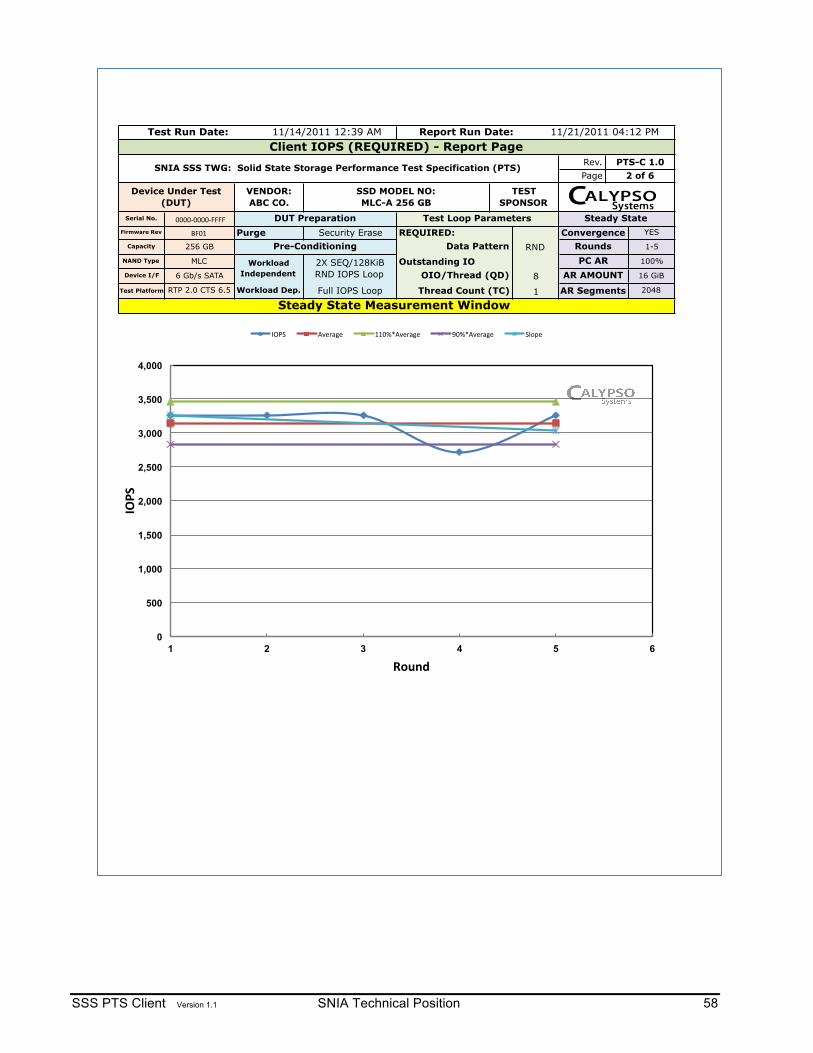
SSS PTS Client Version 1.1 SNIA Technical Position 58
15
Test Run Date: 11/14/2011 12:39 AM Report Run Date: 11/21/2011 04:12 PM
Test Platform RTP 2.0 CTS 6.5 Workload Dep. Full IOPS Loop Thread Count (TC) 1 AR Segments
PTS-C 1.0Client IOPS (REQUIRED) - Report Page
SNIA SSS TWG: Solid State Storage Performance Test Specification (PTS) Rev.Page 2 of 6
Serial No. !""""#""""#$$$$Firmware Rev %$"&
PC AR 100%
Security Erase REQUIRED: Convergence1-5
NAND Type MLC Workload Independent
Capacity 256 GB Pre-Conditioning Data Pattern
82X SEQ/128KiB RND IOPS Loop
Outstanding IODevice I/F 6 Gb/s SATA OIO/Thread (QD) AR AMOUNT 16 GiB
2048
3147.046087Steady State Measurement Window
3147.0460873461.750696 2832.341478 3255.8600853461.750696 2832.341478 3038.23209
YES
Device Under Test (DUT)
VENDOR: ABC CO.
SSD MODEL NO: MLC-A 256 GB
TEST SPONSOR
DUT Preparation Test Loop Parameters Steady State
RND RoundsPurge
0
500
1,000
1,500
2,000
2,500
3,000
3,500
4,000
1 2 3 4 5 6
!"#$%
&'()*%
'()*! +,-./0-! &&"12+,-./0-! 3"12+,-./0-! *456-!
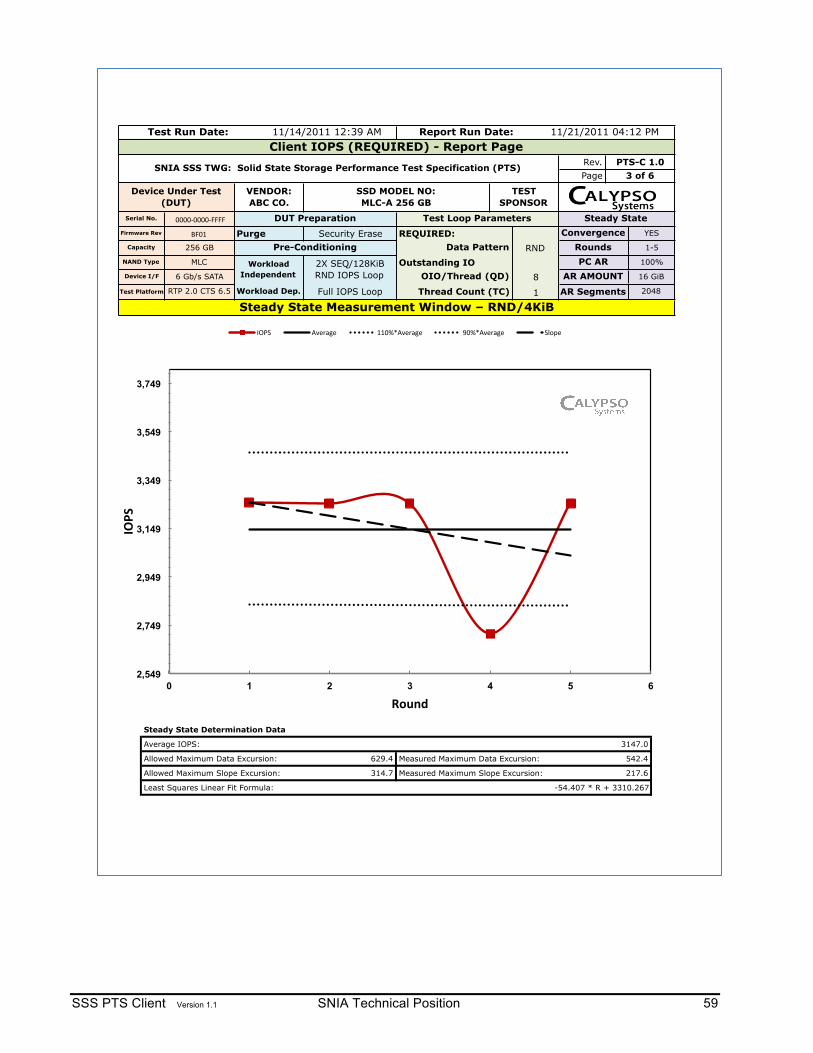
SSS PTS Client Version 1.1 SNIA Technical Position 59
12345
11/21/2011 04:12 PM
542.4
217.6
-54.407 * R + 3310.267
Allowed Maximum Data Excursion:
Steady State Determination Data
Average IOPS: 3147.0
Allowed Maximum Slope Excursion:
Least Squares Linear Fit Formula:
Measured Maximum Data Excursion:
Measured Maximum Slope Excursion:
629.4
314.7
3257.503253.883253.882715.143254.83
2048
Steady State Measurement Window – RND/4KiBTest Platform RTP 2.0 CTS 6.5 Workload Dep. Full IOPS Loop Thread Count (TC) 1 AR Segments
Capacity 256 GB Pre-Conditioning Data Pattern RND RoundsPC AR
1-5
NAND Type MLC Workload Independent
2X SEQ/128KiB RND IOPS Loop
Outstanding IODevice I/F 6 Gb/s SATA OIO/Thread (QD) 8 AR AMOUNT 16 GiB
100%
Device Under Test (DUT)
VENDOR: ABC CO.
SSD MODEL NO: MLC-A 256 GB
TEST SPONSOR
DUT Preparation Test Loop Parameters Steady State
Purge Security Erase REQUIRED: Convergence YES
Serial No. !""""#""""#$$$$
Firmware Rev %$"&
Client IOPS (REQUIRED) - Report Page
SNIA SSS TWG: Solid State Storage Performance Test Specification (PTS) Rev. PTS-C 1.0Page 3 of 6
Test Run Date: 11/14/2011 12:39 AM Report Run Date:
2,549
2,749
2,949
3,149
3,349
3,549
3,749
0 1 2 3 4 5 6
!"#$%
&'()*%
'()*! +,-./0-! &&"12+,-./0-! 3"12+,-./0-! *456-!
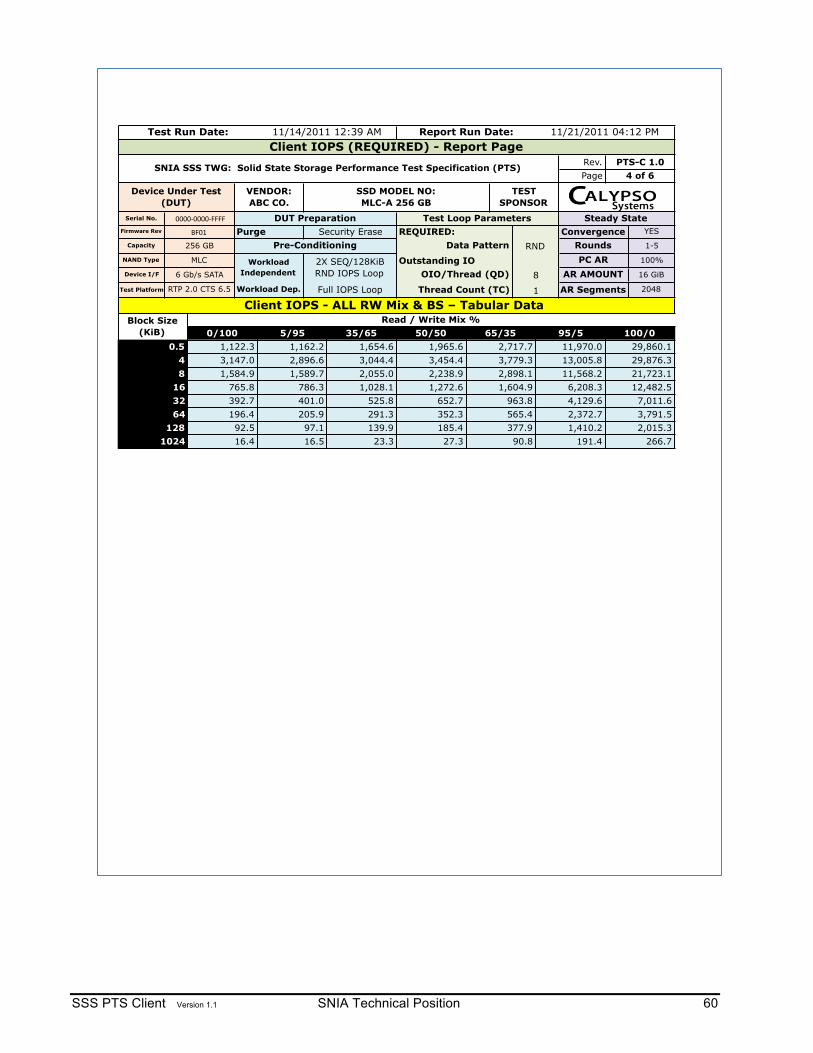
SSS PTS Client Version 1.1 SNIA Technical Position 60
!"#$
PC AR 100%
Client IOPS - ALL RW Mix & BS – Tabular Data RTP 2.0 CTS 6.5
Security Erase
2048
NAND Type
Device I/F
Test Platform Workload Dep. Full IOPS Loop
0/100
196.492.516.4
Block Size (KiB)
0.5
Test Run Date: 11/14/2011 12:39 AM Report Run Date: 11/21/2011 04:12 PM
16 GiB
DUT Preparation
TEST SPONSOR
AR Segments1
Outstanding IO
Thread Count (TC)
SNIA SSS TWG: Solid State Storage Performance Test Specification (PTS)
AR AMOUNT
Client IOPS (REQUIRED) - Report PagePTS-C 1.0
4 of 6
Serial No. %####&####&""""
Capacity
Device Under Test (DUT)
256 GB
MLC
6 Gb/s SATA
Firmware Rev
Rev.Page
Workload Independent
2X SEQ/128KiB RND IOPS Loop
Pre-ConditioningREQUIRED:
Data Pattern
OIO/Thread (QD) 8
VENDOR: ABC CO.
ConvergenceRounds
Purge
SSD MODEL NO: MLC-A 256 GB
Steady StateTest Loop ParametersYES
1-5RND
1,654.63,044.42,055.01,028.1
525.8291.3
48
Read / Write Mix %
1,122.33,147.01,584.9
765.8392.7
1,162.22,896.6
5/95 35/65 50/50 100/0
401.0
2,898.11,604.9
3,454.4
65/35 95/5
13,005.82,717.73,779.3
11,970.01,965.6
3,791.5
6,208.34,129.62,372.7
11,568.2 21,723.112,482.57,011.6
2,238.91,272.6
652.7 963.8
29,860.129,876.3
1,589.7786.3
352.3 565.4205.997.116.5
163264
1281024
377.990.8
1,410.2191.423.3
185.427.3
139.9 2,015.3266.7
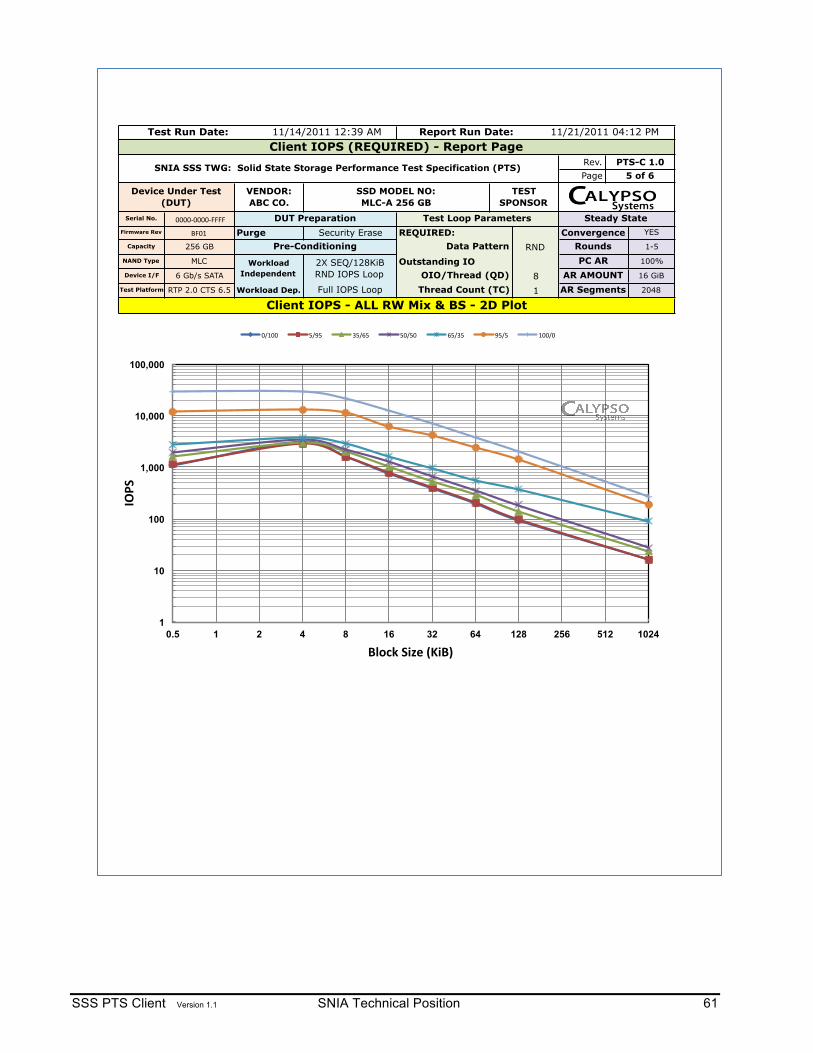
SSS PTS Client Version 1.1 SNIA Technical Position 61
Serial No. !""""#""""#$$$$Firmware Rev %$"&
PC AR 100%
Test Run Date: 11/14/2011 12:39 AM
Page 5 of 6
Report Run Date: 11/21/2011 04:12 PM
Rev. PTS-C 1.0SNIA SSS TWG: Solid State Storage Performance Test Specification (PTS)
Client IOPS (REQUIRED) - Report Page
Device Under Test (DUT)
VENDOR: ABC CO.
SSD MODEL NO: MLC-A 256 GB
TEST SPONSOR
OIO/Thread (QD)Test Platform RTP 2.0 CTS 6.5 Thread Count (TC)
Test Loop ParametersPurge Security Erase REQUIRED:
1
1-5
NAND Type MLC Outstanding IO
Capacity 256 GB Data Pattern
Steady StateDUT PreparationConvergence
Client IOPS - ALL RW Mix & BS - 2D Plot
16 GiBDevice I/F
YES
AR Segments 2048
6 Gb/s SATA
Pre-Conditioning RND
Workload Independent
2X SEQ/128KiB RND IOPS Loop 8 AR AMOUNT
Workload Dep. Full IOPS Loop
Rounds
1
10
100
1,000
10,000
100,000
0.5 1 2 4 8 16 32 64 128 256 512 1024
!"#$%
&'()*%$+,-%./+&0%
"'&""! (')(! *('+(! ("'("! +('*(! )('(! &""'"!
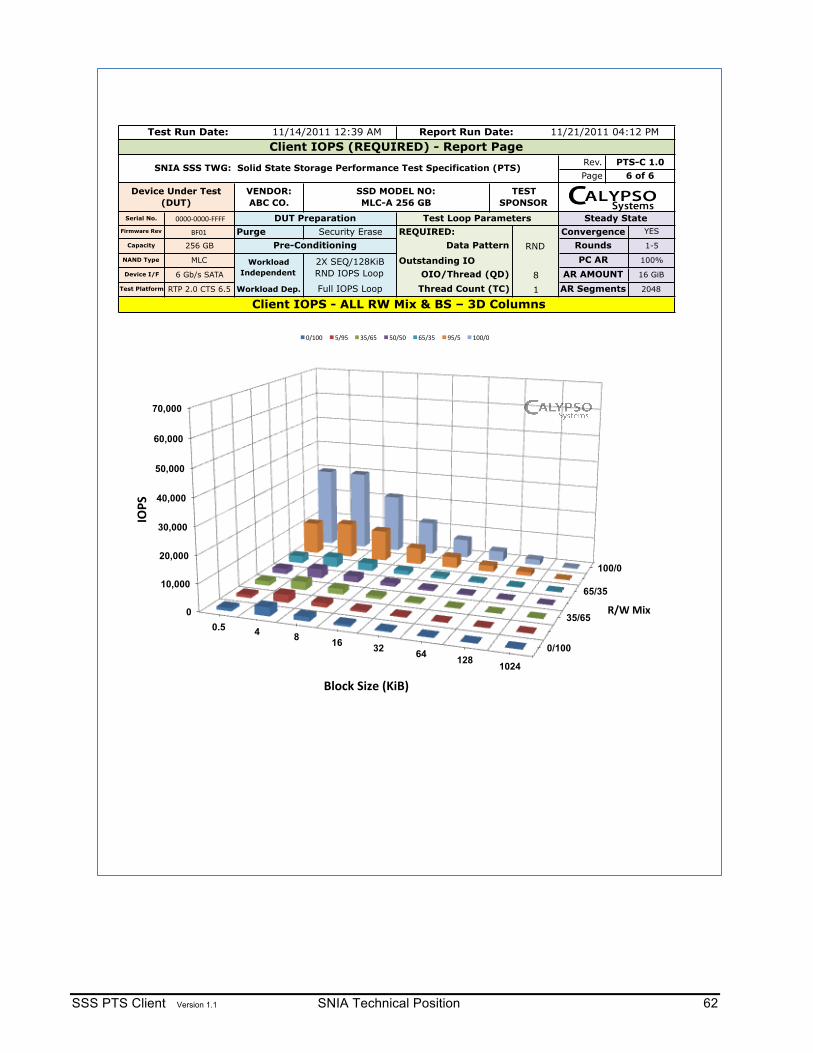
SSS PTS Client Version 1.1 SNIA Technical Position 62
11/14/2011 12:39 AM Report Run Date: 11/21/2011 04:12 PMClient IOPS (REQUIRED) - Report Page
SNIA SSS TWG: Solid State Storage Performance Test Specification (PTS) Rev.
Test Run Date:
PTS-C 1.0Page 6 of 6
Device Under Test (DUT)
VENDOR: ABC CO.
SSD MODEL NO: MLC-A 256 GB
TEST SPONSOR
DUT Preparation Test Loop Parameters Steady StateSerial No. !""""#""""#$$$$
256 GB Pre-Conditioning Data Pattern RND Rounds 1-5
Purge Security Erase REQUIRED: Convergence YES
Capacity
Firmware Rev %$"&
Client IOPS - ALL RW Mix & BS – 3D Columns
AR AMOUNT 16 GiB
Test Platform RTP 2.0 CTS 6.5 Workload Dep. Full IOPS Loop Thread Count (TC) 1 AR Segments 2048
NAND Type MLC Workload Independent
2X SEQ/128KiB RND IOPS Loop
Outstanding IODevice I/F 6 Gb/s SATA OIO/Thread (QD) 8
PC AR 100%
0/100
35/65
65/35
100/0
0
10,000
20,000
30,000
40,000
50,000
60,000
70,000
0.5 4 8 16 32 64 128 1024
!"#$%&'$
()*+$
,-./0$+&12$34&,5$
"'&""! (')(! *('+(! ("'("! +('*(! )('(! &""'"!

SSS PTS Client Version 1.1 SNIA Technical Position 63
MLC-A Test Report Summary Report Page - THROUGHPUT
SNIA Solid State Storage Performance Test Specification (PTS) Rev. PTS 1.0
Page 14 of 26
Device Under Test (DUT) MLC-A SNIA SSS PTS
Summary Report Calypso
Systems, Inc. DEVICE INFORMATION TEST HARDWARE PLATFORM TEST SOFTWARE REPORT DATE
SERIAL NO. 0000-0000-FFFF SYSTEM Calypso RTP 2.0 SYS OS CENT OS 5.6 Report 06DEC11
FIRMWARE REV. BFO1 Motherboard/cpu Intel 5520HC / W5580 SW TOOL Calypso CTS 6.5
Test Run 01NOV – 04DEC11
USER CAPACITY MLC 256 GB RAM 12GB ECC DDR3 SW Rev 1.19.10 Test
Sponsor Calypso
DEVICE INTERFACE 6 Gb/s SATAII Device Interface LSA 9212-e 6Gb/s HBA Release Nov. 2011 Auditor N/A
Test Description
Purpose To measure Large Block SEQ TP using different BS and R/W Mixes Test Outline PURGE, then apply preconditioning until Steady State is achieved according to the SNIA PTS
Preconditioning PURGE followed by SNIA PTS prescribed WIPC & WDPC
Test Set Up
PTS-C TEST Purge DP OIO WIPC WDPC STEADY STATE
9.0 THROUGHPUT - REQUIRED
Security Erase RND
TC 32 QD 32
PC AR TEST AR AR AMT SEGMENTS WORKLOAD ROUNDS
100% 100% 16 GiB 2048 SEQ 1024KiB 1 - 5
Select Performance Data
SEQ 1024KiB R SEQ 1024KiB W
417 MiB/S 267 MiB/S
Test Sponsor – Special Notes
ITEM NOTATION COMMENTS
!!!!!!!!!!!
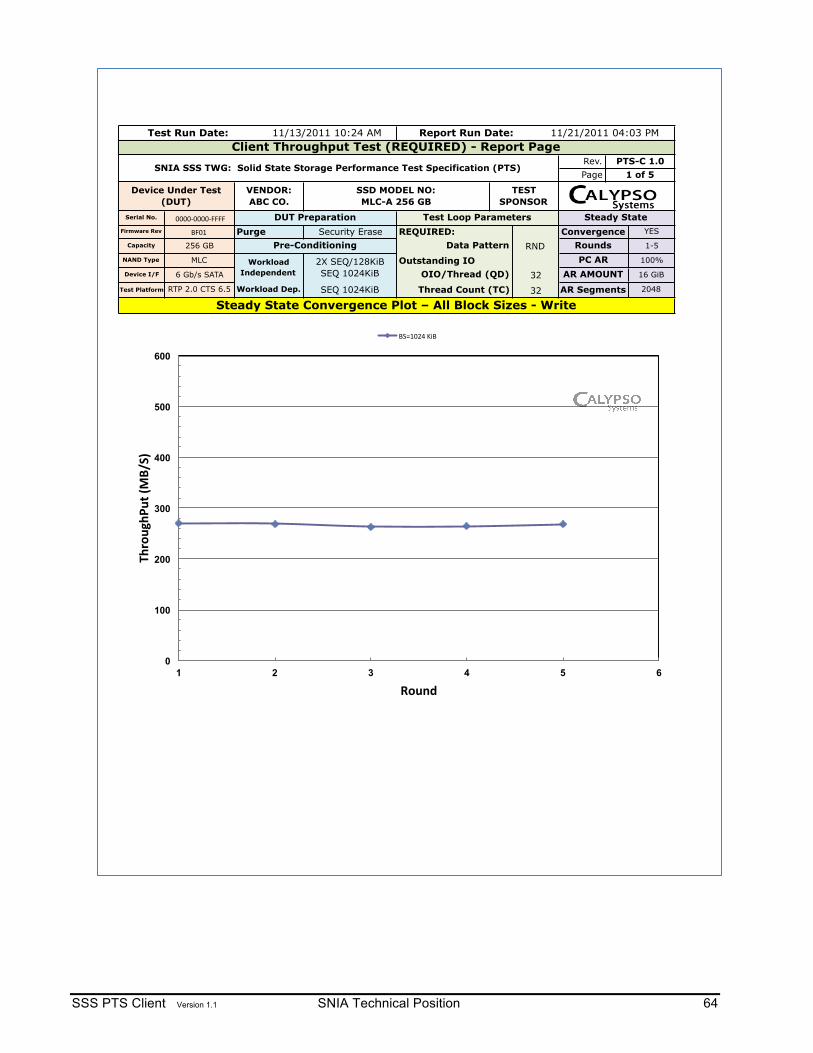
SSS PTS Client Version 1.1 SNIA Technical Position 64
1 270.81
2 269.18
3 262.91
4 264.39
5 268.58
Thread Count (TC)
Steady State Convergence Plot – All Block Sizes - Write
AR AMOUNT 16 GiB
Test Platform
11/21/2011 04:03 PMTest Run Date: 11/13/2011 10:24 AM Report Run Date:
NAND Type 2X SEQ/128KiB SEQ 1024KiB
RND
AR Segments
1-5
Device I/F 6 Gb/s SATA
Outstanding IO
2048
OIO/Thread (QD)
Data Pattern
32
256 GB
MLC
RTP 2.0 CTS 6.5 32
Workload Independent
Client Throughput Test (REQUIRED) - Report Page
SNIA SSS TWG: Solid State Storage Performance Test Specification (PTS)Rev.
Firmware Rev !"#$
PTS-C 1.0
Test Loop Parameters Steady State
VENDOR: ABC CO.
Page 1 of 5
Device Under Test (DUT)
YESPurge Security ErasePre-Conditioning
SSD MODEL NO: MLC-A 256 GB
TEST SPONSOR
Serial No. %####&####&"""" DUT Preparation
PC ARRounds
REQUIRED: ConvergenceCapacity
100%
Workload Dep. SEQ 1024KiB
0
100
200
300
400
500
600
1 2 3 4 5 6
!"#$%&"'
%()*+
,-./)
0$%12)
!'($#)*%+,!%

SSS PTS Client Version 1.1 SNIA Technical Position 65
1 420.81
2 416.09
3 415.38
4 416.13
5 416.26
Test Run Date: 11/13/2011 10:24 AM Report Run Date: 11/21/2011 04:03 PM
Data Pattern
Test Platform RTP 2.0 CTS 6.5
AR AMOUNT 16 GiB
2 of 5
32
PTS-C 1.0Client Throughput Test (REQUIRED) - Report Page
SNIA SSS TWG: Solid State Storage Performance Test Specification (PTS) Rev.Page
Client Throughput Test - SS Convergence - Read
Steady State
RND Rounds
Thread Count (TC) 32 AR Segments 2048
Outstanding IO
Device Under Test (DUT)
REQUIRED: Convergence YES
1-5
OIO/Thread (QD)MLC
Capacity 256 GB
Test Loop ParametersSecurity Erase
Pre-Conditioning
Firmware Rev !"#$
Serial No. %####&####&"""" DUT PreparationPurge
Device I/F 6 Gb/s SATA
NAND Type
VENDOR: ABC CO.
SSD MODEL NO: MLC-A 256 GB
TEST SPONSOR
PC AR 100%
Workload Dep. SEQ 1024KiB
Workload Independent
2X SEQ/128KiB SEQ 1024KiB
0
100
200
300
400
500
600
1 2 3 4 5 6
!"#$%&"'
%()*+
,-.'%
/$%01)
!()$#*+%,-!%
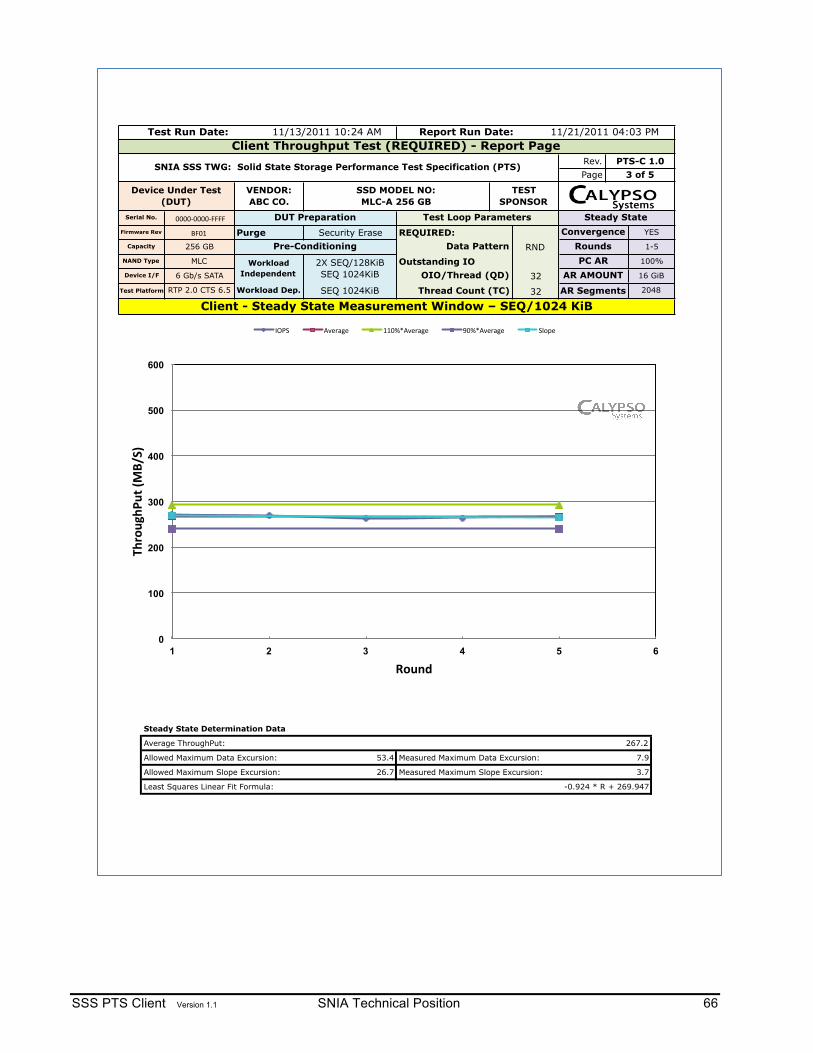
SSS PTS Client Version 1.1 SNIA Technical Position 66
1 12 5345
265.326233
267.2
269.022451267.174342 293.8917762 240.4569078
270.81
Capacity 256 GB
-0.924 * R + 269.947
Allowed Maximum Data Excursion:
Steady State Determination Data
Allowed Maximum Slope Excursion:
Least Squares Linear Fit Formula:
Measured Maximum Slope Excursion:
7.9
Average ThroughPut:
3.7
269.18
26.7
Measured Maximum Data Excursion:
264.39
Client - Steady State Measurement Window – SEQ/1024 KiB293.8917762
204832
53.4
267.174342
268.58
Test Platform RTP 2.0 CTS 6.5 Thread Count (TC)
262.91
240.4569078
AR SegmentsWorkload Dep. SEQ 1024KiB
RND Rounds
16 GiBWorkload
Independent2X SEQ/128KiB SEQ 1024KiB
PC ARDevice I/F 6 Gb/s SATA OIO/Thread (QD) 32 AR AMOUNT
MLCNAND Type Outstanding IO
1-5
Convergence!""""#""""#$$$$ DUT Preparation
Purge Security ErasePre-Conditioning Data Pattern
Page 3 of 5
11/21/2011 04:03 PM
Device Under Test (DUT)
Test Loop Parameters Steady StateYES
Test Run Date: 11/13/2011 10:24 AM Report Run Date:
SNIA SSS TWG: Solid State Storage Performance Test Specification (PTS) Rev. PTS-C 1.0Client Throughput Test (REQUIRED) - Report Page
REQUIRED:Firmware Rev %$"&
Serial No.
VENDOR: ABC CO.
SSD MODEL NO: MLC-A 256 GB
TEST SPONSOR
100%
0
100
200
300
400
500
600
1 2 3 4 5 6
!"#$%&"'
%()*+
,-./)
0$%12)
'()*! +,-./0-! &&"12+,-./0-! 3"12+,-./0-! *456-!
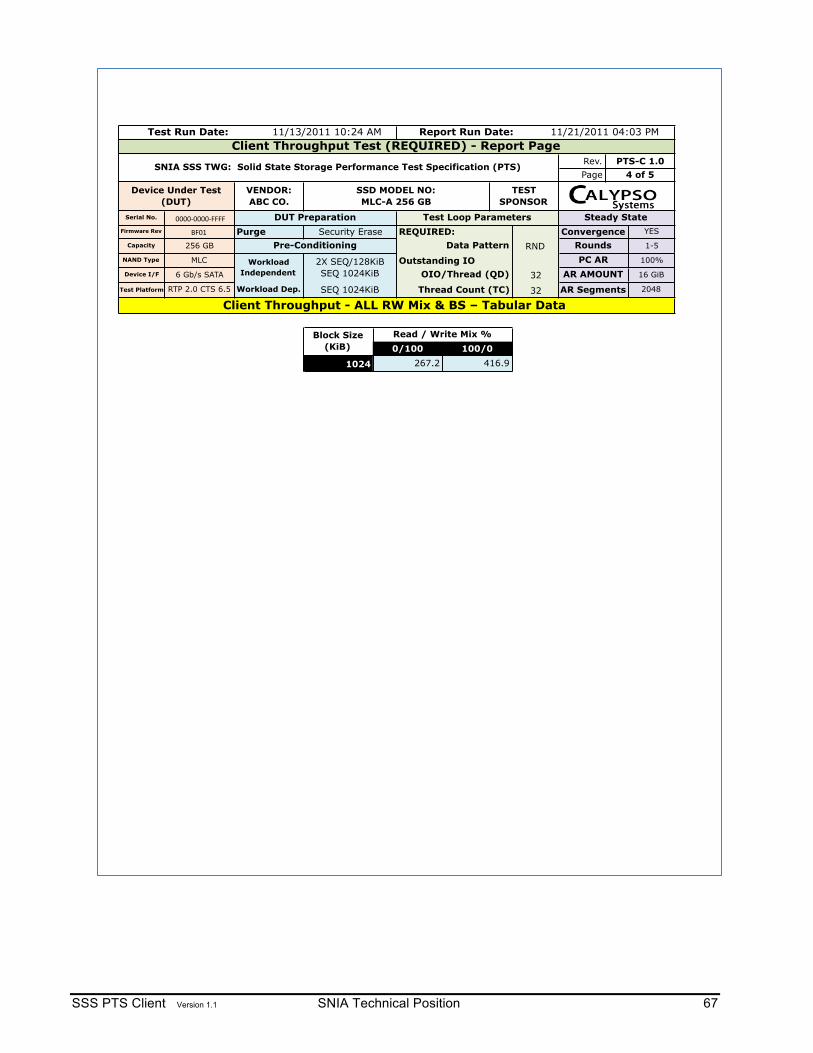
SSS PTS Client Version 1.1 SNIA Technical Position 67
!"# $%#&'%&&%&&'&
Report Run Date:Test Run Date: 11/13/2011 10:24 AM 11/21/2011 04:03 PM
Serial No.
SNIA SSS TWG: Solid State Storage Performance Test Specification (PTS)
1-5
YES
Data PatternPurge
Client Throughput - ALL RW Mix & BS – Tabular Data RTP 2.0 CTS 6.5
OIO/Thread (QD) AR AMOUNT 16 GiB
ConvergenceRoundsRNDPC AR
Thread Count (TC)
Outstanding IO
Rev.Page
REQUIRED:
Device Under Test (DUT)
256 GB
MLC
Firmware Rev ()&%
*&&&&+&&&&+)))) DUT Preparation
2X SEQ/128KiB SEQ 1024KiB
Capacity
6 Gb/s SATA 32AR Segments
NAND Type
Security Erase
Read / Write Mix %
416.9
4 of 5
VENDOR: ABC CO.
0/100
100%
SSD MODEL NO: MLC-A 256 GB
TEST SPONSOR
Steady StateTest Loop Parameters
Pre-Conditioning
Workload Independent
Client Throughput Test (REQUIRED) - Report PagePTS-C 1.0
Device I/F
Test Platform 204832
Block Size (KiB)
1024 267.2100/0
Workload Dep. SEQ 1024KiB
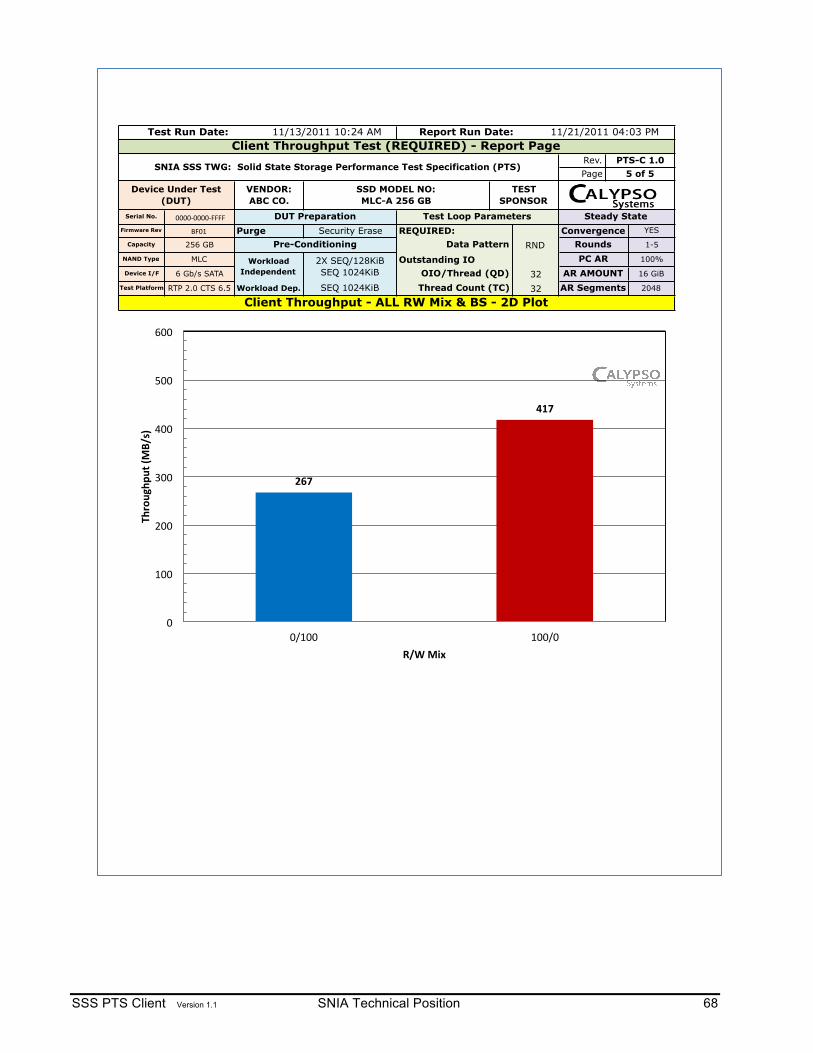
SSS PTS Client Version 1.1 SNIA Technical Position 68
Test Run Date: 11/13/2011 10:24 AM Report Run Date: 11/21/2011 04:03 PM
!""""#""""#$$$$ DUT Preparation
Client Throughput Test (REQUIRED) - Report Page
Rounds
Steady State
Rev.
REQUIRED:Test Loop Parameters
Device Under Test (DUT)
Thread Count (TC)
SNIA SSS TWG: Solid State Storage Performance Test Specification (PTS)
Data PatternCapacity
AR AMOUNT
32
NAND Type
PTS-C 1.0
Workload Independent
Client Throughput - ALL RW Mix & BS - 2D Plot
16 GiB
Convergence YES
AR Segments 2048
6 Gb/s SATA
RNDSecurity Erase
Pre-Conditioning
32Outstanding IO
OIO/Thread (QD)Device I/F
256 GB
Serial No.
1-5
Test Platform RTP 2.0 CTS 6.5
Firmware Rev %$"& Purge
MLC
Page 5 of 5
2X SEQ/128KiB SEQ 1024KiB
PC AR 100%
Workload Dep. SEQ 1024KiB
VENDOR: ABC CO.
SSD MODEL NO: MLC-A 256 GB
TEST SPONSOR
!"#$
%&#$
"!
&""!
'""!
(""!
)""!
*""!
+""!
",&""! &"","!
'()*+,(-
+.$/0
1234$
526$078$
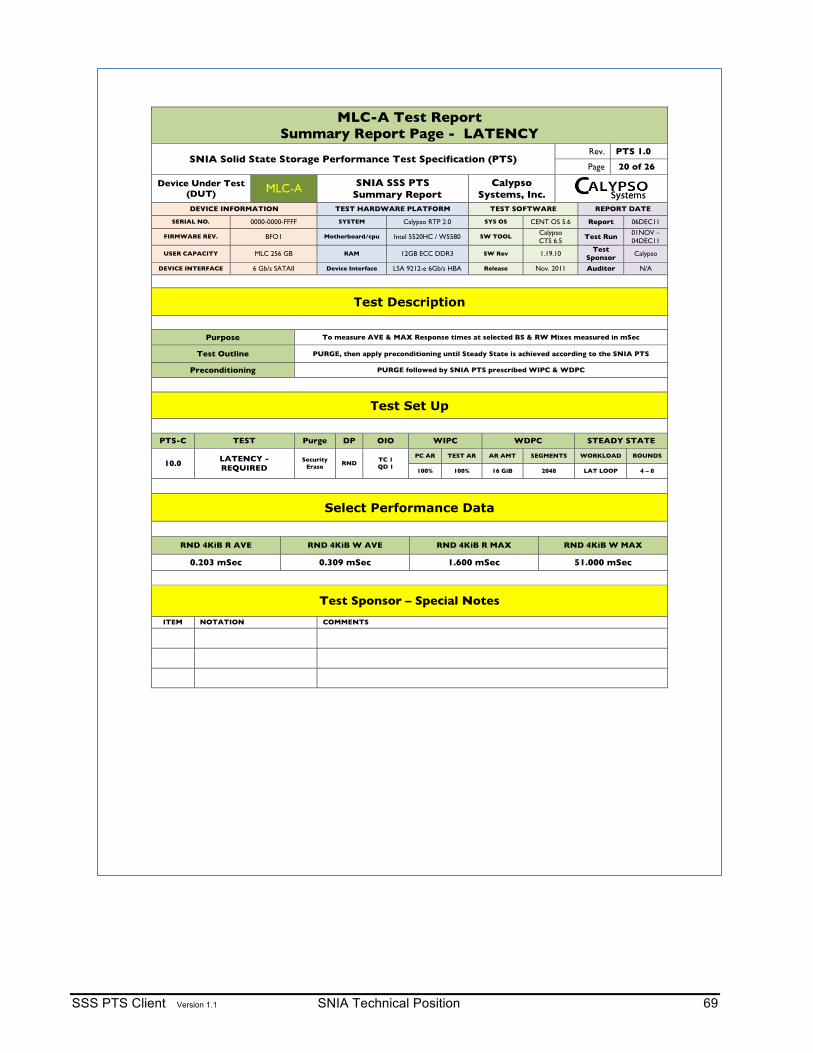
SSS PTS Client Version 1.1 SNIA Technical Position 69
MLC-A Test Report Summary Report Page - LATENCY
SNIA Solid State Storage Performance Test Specification (PTS) Rev. PTS 1.0
Page 20 of 26
Device Under Test (DUT) MLC-A SNIA SSS PTS
Summary Report Calypso
Systems, Inc. DEVICE INFORMATION TEST HARDWARE PLATFORM TEST SOFTWARE REPORT DATE
SERIAL NO. 0000-0000-FFFF SYSTEM Calypso RTP 2.0 SYS OS CENT OS 5.6 Report 06DEC11
FIRMWARE REV. BFO1 Motherboard/cpu Intel 5520HC / W5580 SW TOOL Calypso CTS 6.5
Test Run 01NOV – 04DEC11
USER CAPACITY MLC 256 GB RAM 12GB ECC DDR3 SW Rev 1.19.10 Test
Sponsor Calypso
DEVICE INTERFACE 6 Gb/s SATAII Device Interface LSA 9212-e 6Gb/s HBA Release Nov. 2011 Auditor N/A
Test Description
Purpose To measure AVE & MAX Response times at selected BS & RW Mixes measured in mSec
Test Outline PURGE, then apply preconditioning until Steady State is achieved according to the SNIA PTS Preconditioning PURGE followed by SNIA PTS prescribed WIPC & WDPC
Test Set Up
PTS-C TEST Purge DP OIO WIPC WDPC STEADY STATE
10.0 LATENCY - REQUIRED
Security Erase RND
TC 1 QD 1
PC AR TEST AR AR AMT SEGMENTS WORKLOAD ROUNDS
100% 100% 16 GiB 2048 LAT LOOP 4 – 8
Select Performance Data
RND 4KiB R AVE RND 4KiB W AVE RND 4KiB R MAX RND 4KiB W MAX
0.203 mSec 0.309 mSec 1.600 mSec 51.000 mSec
Test Sponsor – Special Notes
ITEM NOTATION COMMENTS
!!!!!!!!!

SSS PTS Client Version 1.1 SNIA Technical Position 70
12345678
Workload Independent
2X SEQ/128KiB RND LAT Loop
PC AR 100%
6 Gb/s SATA
RTP 2.0 CTS 6.5 Workload Dep. Full Latency Loop 2048
OIO/Thread (QD)
Device Under Test (DUT)
VENDOR: ABC CO.
SSD MODEL NO: MLC-A 256 GB
TEST SPONSOR
Serial No. !""""#""""#$$$$ DUT Preparation%$"& Purge Security Erase
Test Loop ParametersFirmware Rev
Capacity 256 GB Pre-ConditioningMLC
0.51
0.37 0.520.37 0.52
0.31 0.520.31 0.57
0.37 0.500.34 0.58
0.91
Steady State
RoundsREQUIRED: Convergence
Data Pattern 4-8
YES
RNDOutstanding IO
0.31 0.520.31
0.91
1.02
PTS-C 1.0
0.920.910.910.91
Client - Steady State Convergence Plot – AVE Latency - 100% Writes
1
Test Run Date: 11/11/2011 09:53 AM Report Run Date: 11/15/2011 03:34 PM
Thread Count (TC) 1
"'(&
0.91
AR AMOUNT 16 GiB
Test Platform
NAND Type
AR Segments
Device I/F
Client Latency (REQUIRED) - Report Page
SNIA SSS TWG: Solid State Storage Performance Test Specification (PTS)Rev.Page 1 of 6
"'""!
"')"!
"'*"!
"'+"!
"',"!
&'""!
&')"!
&! )! (! *! -! +! .! ,! /!
!"#$%&#
'(%
)*+,-%
012"3&""4!%52"'-6! 012"3&""4!%52*6! 012"3&""4!%52,6!
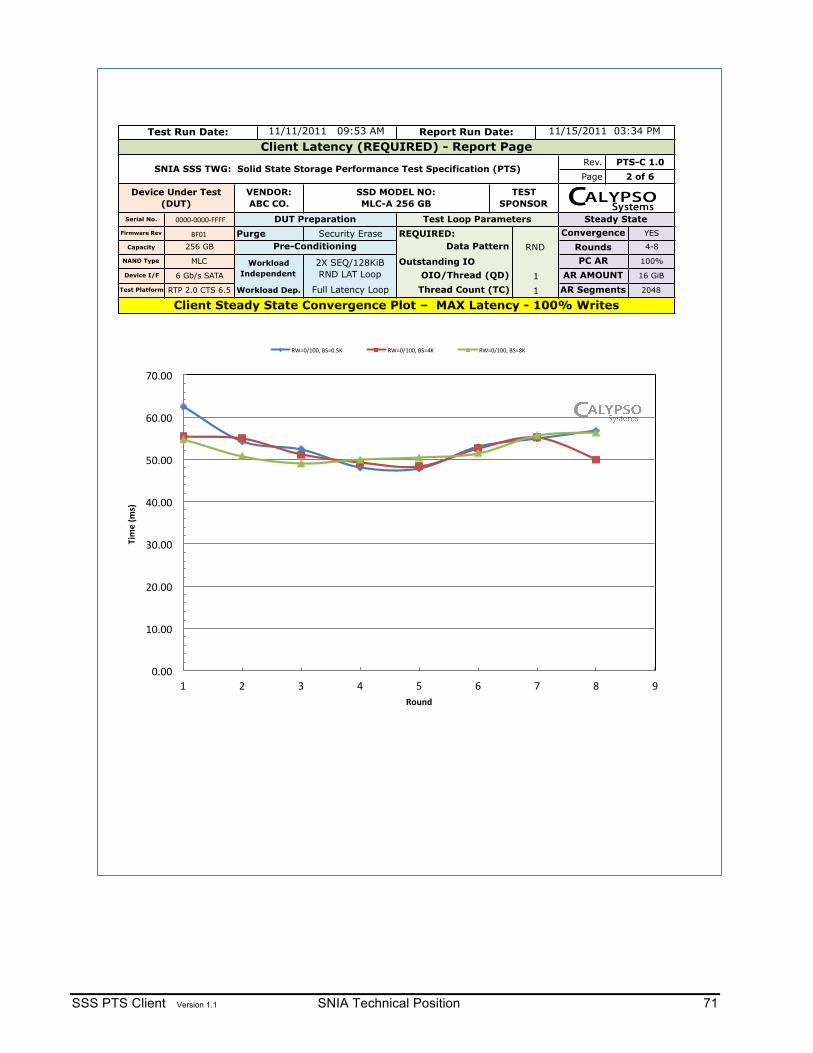
SSS PTS Client Version 1.1 SNIA Technical Position 71
12345678
!""""#""""#$$$$ DUT Preparation%$"& Purge Security Erase
256 GB Pre-ConditioningMLC Workload
Independent2X SEQ/128KiB RND LAT Loop6 Gb/s SATA
Steady State
OIO/Thread (QD)
RND RoundsREQUIRED:
Page 2 of 6
YES
SSD MODEL NO: MLC-A 256 GB
TEST SPONSOR
PC AR 100%
PTS-C 1.0
Test Loop ParametersFirmware Rev
Client Latency (REQUIRED) - Report Page
SNIA SSS TWG: Solid State Storage Performance Test Specification (PTS)Rev.
4-8
Thread Count (TC) 1 AR Segments
Client Steady State Convergence Plot – MAX Latency - 100% Writes
1 AR AMOUNT 16 GiB
2048
54.22
ConvergenceCapacity Data Pattern
Device Under Test (DUT)
VENDOR: ABC CO.
Serial No.
62.53 55.34 54.84
47.94
51.14 49.03
NAND Type Outstanding IO
Test Platform Full Latency Loop
48.17 49.9349.3452.37
Device I/F
RTP 2.0 CTS 6.5 Workload Dep.
Test Run Date: 11/11/2011 09:53 AM Report Run Date: 11/15/2011 03:34 PM
48.28
54.92 50.80
54.86 55.13 55.66
50.3652.98 52.58 51.50
56.74 49.89 56.38
'()*'+,)-.
")""!
&")""!
,")""!
.")""!
'")""!
-")""!
+")""!
(")""!
&! ,! .! '! -! +! (! /! *!
!"#$%&#
'(%
)*+,-%
012"3&""4!%52")-6! 012"3&""4!%52'6! 012"3&""4!%52/6!
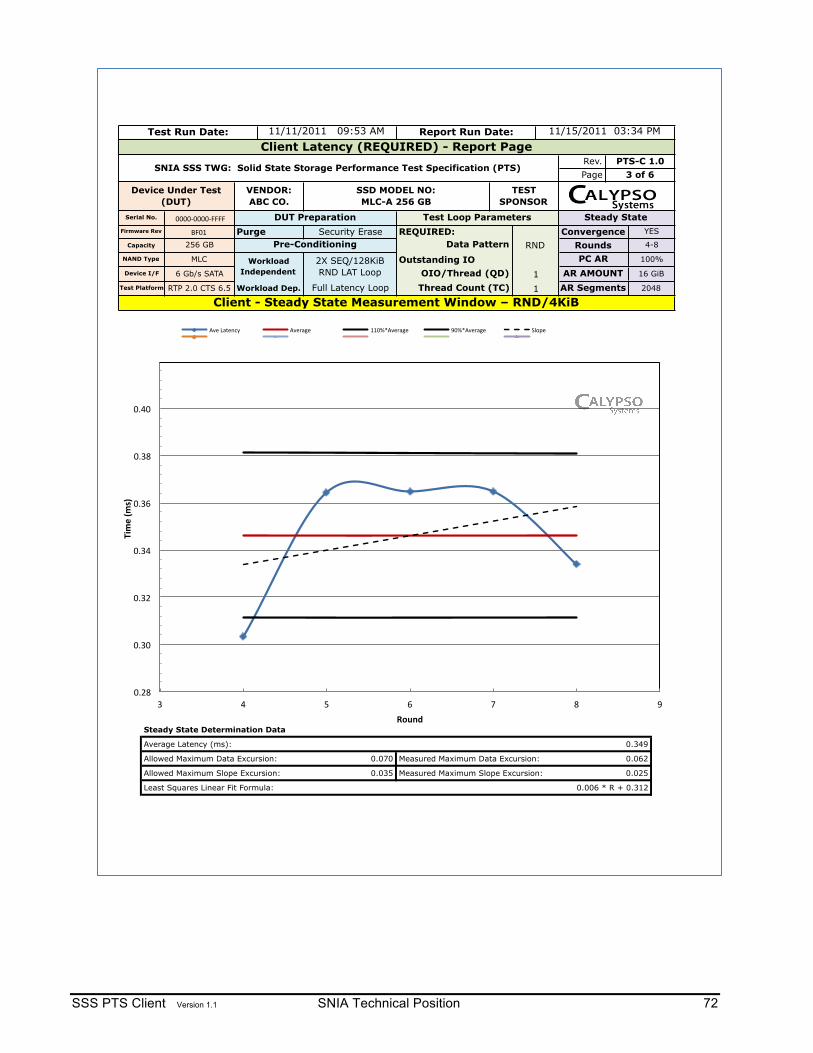
SSS PTS Client Version 1.1 SNIA Technical Position 72
4 4
5 8
678
YESSecurity EraseTest Loop Parameters
0.336269
Thread Count (TC)
Outstanding IO
256 GB 4-8
AR AMOUNT 16 GiB1
Data Pattern RND Rounds
OIO/Thread (QD)
Pre-ConditioningMLC Workload
Independent2X SEQ/128KiB RND LAT Loop
1 AR Segments
REQUIRED: Convergence
NAND Type PC AR 100%
0.361024
Page 3 of 6
11/15/2011 03:34 PMTest Run Date: 11/11/2011 09:53 AM Report Run Date:
Steady State
Client Latency (REQUIRED) - Report Page
SNIA SSS TWG: Solid State Storage Performance Test Specification (PTS)Rev. PTS-C 1.0
!"#$ Purge
Device Under Test (DUT)
VENDOR: ABC CO.
SSD MODEL NO: MLC-A 256 GB
TEST SPONSOR
Serial No. %####&####&"""" DUT Preparation
2048
Client - Steady State Measurement Window – RND/4KiB0.31
0.37
0.370.370.34
Least Squares Linear Fit Formula: 0.006 * R + 0.312
Allowed Maximum Data Excursion:
Steady State Determination Data
Allowed Maximum Slope Excursion: Measured Maximum Slope Excursion:
0.070
0.035
0.349
0.062
0.025
Measured Maximum Data Excursion:
Average Latency (ms):
0.348646 0.3835106 0.3137814
Test Platform
Device I/F
Firmware Rev
Capacity
0.348646 0.3835106 0.3137814
6 Gb/s SATA
RTP 2.0 CTS 6.5 Workload Dep. Full Latency Loop
#'()%
#'*#%
#'*(%
#'*+%
#'*,%
#'*)%
#'+#%
*% +% -% ,% .% )% /%
!"#$%&#
'(%
)*+,-%
012%3452678% 01294:2% $$#;<01294:2% /#;<01294:2% =>?@2%

SSS PTS Client Version 1.1 SNIA Technical Position 73
Read / Write Mix %0/100
51.0 50.048
1.653.3 39.5
50.2 1.0
0.5
0.4320.537
65/35 100/0
0.3320.240
0.449
52.8
52.1
Client - AVE and MAX Response Time - ALL RW Mix & BS – Tabular Data
Convergence
OIO/Thread (QD)
Read / Write Mix %
48
!"#$%&%'()*+,-*)'.$%)'/%*0
Block Size (KiB)0.5
AR AMOUNTAR Segments
0.2030.196
100/00/1000.932
Client Latency (REQUIRED) - Report PagePTS-C 1.0
4 of 6Rev.Page
SNIA SSS TWG: Solid State Storage Performance Test Specification (PTS)
Capacity Rounds
Device I/F
Device Under Test (DUT)
VENDOR: ABC CO.
SSD MODEL NO: MLC-A 256 GB
TEST SPONSOR
Serial No. !""""#""""#$$$$ DUT Preparation%$"& Purge Security EraseFirmware Rev
256 GB
MLC Workload Independent
Test Platform
REQUIRED:Steady StateTest Loop Parameters
YES
Data Pattern
Outstanding IO
Thread Count (TC) 1
16 GiB
2048
4-8RND
12X SEQ/128KiB RND LAT Loop
PC AR 100%
6 Gb/s SATA
RTP 2.0 CTS 6.5 Workload Dep. Full Latency Loop
Pre-ConditioningNAND Type
0.349
65/35Block Size (KiB)
12)3"4)'()*+,-*)'.$%)'/%*0
Test Run Date: 11/11/2011 09:53 AM Report Run Date: 11/15/2011 03:34 PM
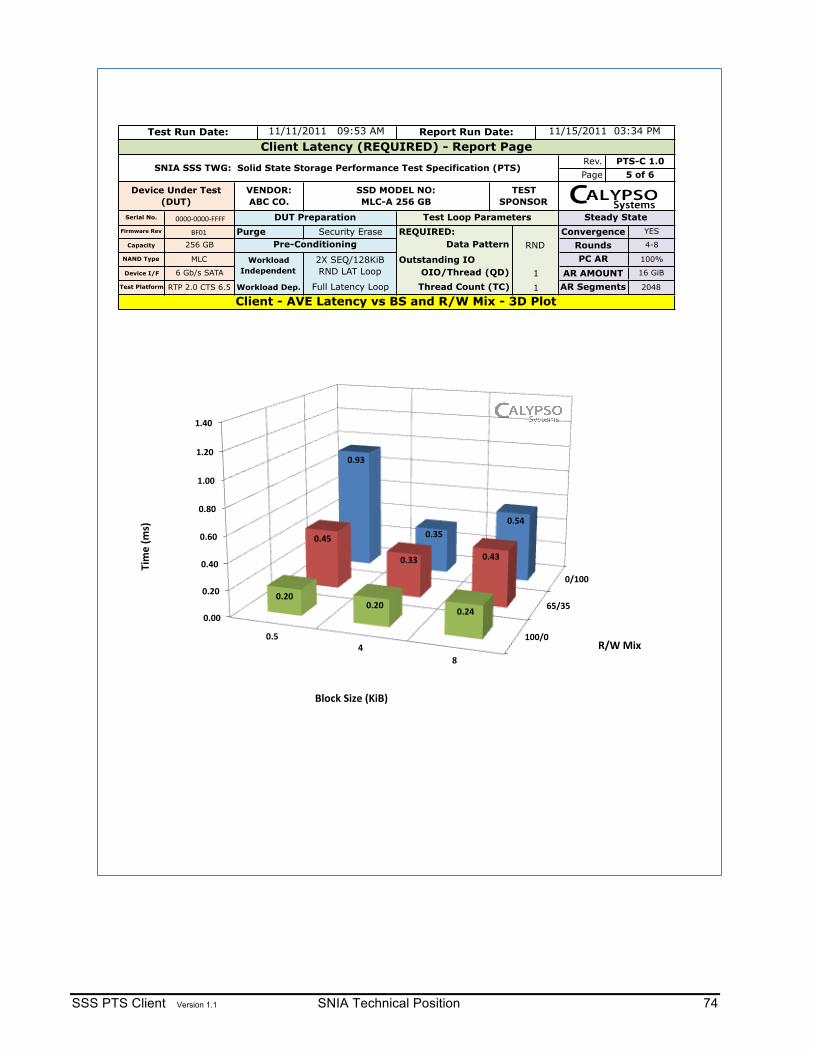
SSS PTS Client Version 1.1 SNIA Technical Position 74
Device Under Test (DUT)
VENDOR: ABC CO.
SSD MODEL NO: MLC-A 256 GB
TEST SPONSOR
Outstanding IORounds
Convergence
Page
MLC Workload Independent
2X SEQ/128KiB RND LAT Loop
PC AR
Client Latency (REQUIRED) - Report PageRev. PTS-C 1.0
NAND Type
11/11/2011 09:53 AM
4-8
Serial No. !""""#""""#$$$$ DUT Preparation%$"& Purge Security Erase
256 GB Pre-Conditioning RNDYES
Data PatternCapacity
Firmware Rev
Steady StateREQUIRED:
Test Run Date: Report Run Date: 11/15/2011 03:34 PM
1
Test Loop Parameters
SNIA SSS TWG: Solid State Storage Performance Test Specification (PTS)5 of 6
100%
6 Gb/s SATA
AR Segments 2048RTP 2.0 CTS 6.5 Workload Dep. Full Latency Loop
Client - AVE Latency vs BS and R/W Mix - 3D PlotThread Count (TC)
AR AMOUNT 16 GiB
Test Platform
Device I/F 1OIO/Thread (QD)
!"#!!$
%&"'&$
#!!"!$
!(!!$
!()!$
!(*!$
!(%!$
!(+!$
#(!!$
#()!$
#(*!$
!(&$*$
+$
!(,'$
!('&$!(&*$
!(*&$
!(''$ !(*'$
!()!$!()!$
!()*$
-".$/01$
2034$53
67$
89:;<$=0>4$5?087$
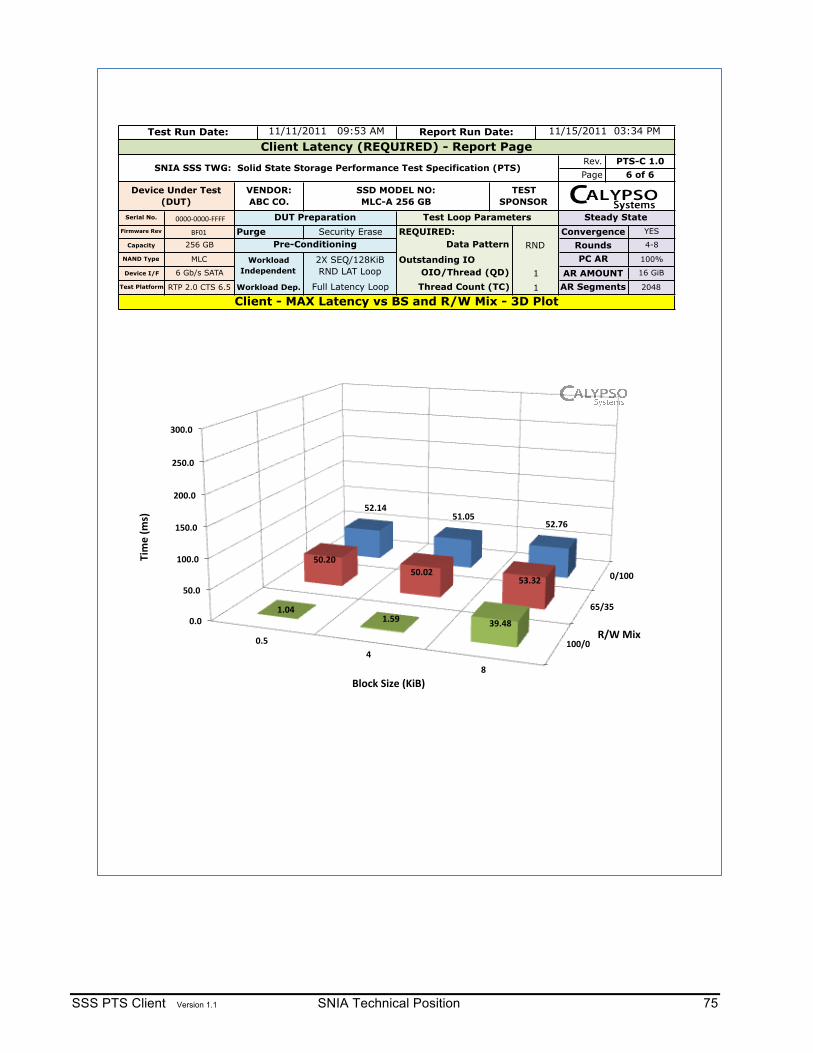
SSS PTS Client Version 1.1 SNIA Technical Position 75
RND!"#$ Purge Security Erase
256 GB Pre-ConditioningMLC Workload
Independent 1
REQUIRED:
Outstanding IO
YES
Capacity Data Pattern
Client - MAX Latency vs BS and R/W Mix - 3D Plot
AR AMOUNT 16 GiBDevice I/F OIO/Thread (QD)
Rounds 4-8
1 AR Segments 2048
Convergence
Rev.
Test Platform Thread Count (TC)
NAND Type 2X SEQ/128KiB RND LAT Loop
PC AR 100%
6 Gb/s SATA
RTP 2.0 CTS 6.5
Page 6 of 6
11/15/2011 03:34 PM
Workload Dep. Full Latency Loop
Device Under Test (DUT)
VENDOR: ABC CO.
SSD MODEL NO: MLC-A 256 GB
TEST SPONSOR
Serial No. %####&####&"""" DUT Preparation Test Loop Parameters
Report Run Date:
Firmware Rev
Steady State
Test Run Date: 11/11/2011 09:53 AM
PTS-C 1.0Client Latency (REQUIRED) - Report Page
SNIA SSS TWG: Solid State Storage Performance Test Specification (PTS)
!"#!!$
%&"'&$
#!!"!$
!(!$
&!(!$
#!!(!$
#&!(!$
)!!(!$
)&!(!$
'!!(!$
!(&$*$
+$
&)(#*$&#(!&$
&)(,%$
&!()!$&!(!)$
&'(')$
#(!*$#(&-$ '-(*+$
."/$012$
3145$64
78$
9:;<=$>1?5$6@198$
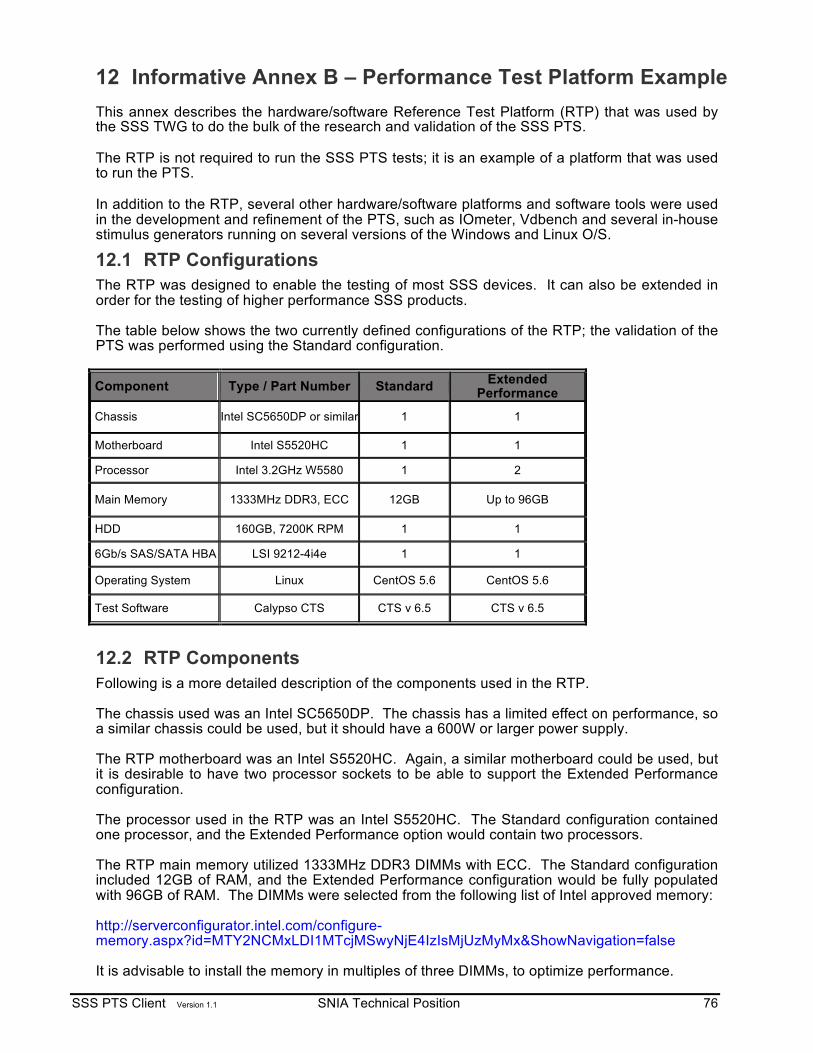
SSS PTS Client Version 1.1 SNIA Technical Position 76
12 Informative Annex B – Performance Test Platform Example This annex describes the hardware/software Reference Test Platform (RTP) that was used by the SSS TWG to do the bulk of the research and validation of the SSS PTS.
The RTP is not required to run the SSS PTS tests; it is an example of a platform that was used to run the PTS.
In addition to the RTP, several other hardware/software platforms and software tools were used in the development and refinement of the PTS, such as IOmeter, Vdbench and several in-house stimulus generators running on several versions of the Windows and Linux O/S.
12.1 RTP Configurations The RTP was designed to enable the testing of most SSS devices. It can also be extended in order for the testing of higher performance SSS products. The table below shows the two currently defined configurations of the RTP; the validation of the PTS was performed using the Standard configuration.
Component Type / Part Number Standard Extended Performance
Chassis Intel SC5650DP or similar 1 1
Motherboard Intel S5520HC 1 1
Processor Intel 3.2GHz W5580 1 2
Main Memory 1333MHz DDR3, ECC 12GB Up to 96GB
HDD 160GB, 7200K RPM 1 1
6Gb/s SAS/SATA HBA LSI 9212-4i4e 1 1
Operating System Linux CentOS 5.6 CentOS 5.6
Test Software Calypso CTS CTS v 6.5 CTS v 6.5
12.2 RTP Components Following is a more detailed description of the components used in the RTP. The chassis used was an Intel SC5650DP. The chassis has a limited effect on performance, so a similar chassis could be used, but it should have a 600W or larger power supply. The RTP motherboard was an Intel S5520HC. Again, a similar motherboard could be used, but it is desirable to have two processor sockets to be able to support the Extended Performance configuration. The processor used in the RTP was an Intel S5520HC. The Standard configuration contained one processor, and the Extended Performance option would contain two processors. The RTP main memory utilized 1333MHz DDR3 DIMMs with ECC. The Standard configuration included 12GB of RAM, and the Extended Performance configuration would be fully populated with 96GB of RAM. The DIMMs were selected from the following list of Intel approved memory: http://serverconfigurator.intel.com/configure-memory.aspx?id=MTY2NCMxLDI1MTcjMSwyNjE4IzIsMjUzMyMx&ShowNavigation=false It is advisable to install the memory in multiples of three DIMMs, to optimize performance.
SSS PTS Client Version 1.1 SNIA Technical Position 77
The HDD used in the RTP was 160 GB, 7200K RPM, with a SATA interface. It is not clear what impact the HDD has on performance testing, so the highest performance SATA drive that is widely available was selected. The RTP used a LSI 9212-4i4e Host Bus Adaptor containing the IT firmware set. Other sufficiently high performance HBAs are available, but were not tested. The RTP hardware platform had a dedicated power supply for all test DUT bays separate from the main power supply. RTP utilized CTS test software made by Calypso Systems, Inc. http://www.calypsotesters.com
• CTSv6.5 is the Standard version.
The Calypso software requires the CentOS 5.6 Linux OS.